Article

Selective Leaching of Vanadium from Calcification-Roasted Pellets of Vanadium–Titanium–Iron Concentrate by a Cyclic Two-Stage Sulfuric Acid Process

1
Faculty of Metallurgical and Energy Engineering, Kunming University of Science and Technology, Kunming 650093, China
2
Sichuan Lomon Mining and Metallurgy Co., Ltd., Panzhihua 617100, China
*
Authors to whom correspondence should be addressed.
Minerals 2022, 12(12), 1613; https://doi.org/10.3390/min12121613
Submission received: 4 November 2022 / Revised: 27 November 2022 / Accepted: 9 December 2022 / Published: 15 December 2022

Abstract

:
Here, a process for leaching vanadium from calcified roasting pellets (CPVC) of vanadium–titanium-iron concentrate by a two-stage sulfuric acid cycle was proposed. The first stage of leaching was mainly for the removal of silicon from the pellet and leaching solution. After the second stage, the total leaching rates of vanadium and iron were 75.52% and 0.71%, respectively. The concentration of vanadium in the leaching solution reached 6.80 g/L, which can subsequently direct a vanadium precipitation process without extraction and enrichment. After the second roasting, the crushing strength of the pellets reached 2250 N, which met the requirement for blast furnace iron making. The Eh-pH diagrams of the V-Fe-H2O system at different temperatures were plotted. Thermodynamically, it was difficult to selectively leach vanadium and iron by changing the conventional acid leaching conditions. In addition, the pellets before and after leaching were analyzed. The grade of iron in the pellets increased slightly after leaching, and the main phases in the pellets remained as Fe2O3 and Fe9TiO15. The S in the sulfuric acid solution entered the leached pellets during the acid leaching reaction and was removed by the second roasting of the leached pellets.

1. Introduction

Vanadium (V) is an important transition metal that accounts for 0.02% of the total mass of the earth’s crust and is a prevalent element in the natural environment [1,2]. Due to its physical properties, it is widely used in steel alloys, chemicals, batteries, and pharmaceuticals [3,4]. China has the world’s largest vanadium reserves, among which vanadium–titanium magnetite resources are the most abundant and are mainly distributed in the Panzhihua–Xichang area of Sichuan [5]. Approximately 88% of global V production comes from vanadium and titanium magnetite [6]. Vanadium–titanium–iron concentrate is obtained from the beneficiation of vanadium–titanium magnetite, in which vanadium is homogeneously present in titanium magnetite and displaces high-valent iron ions. Titanium magnetite is a composite of host crystals (Fe3O4), chadacrysts (ferro-ortho-titanate 2FeO·TiO2, titanic iron ore FeO·TiO2, pseudobrookite (FeO·2TiO2), and alumina-magnesia spinel (Mg, Fe)(Al, Fe)2O4) [6,7].
The process for extracting vanadium from vanadium titanomagnetite in China is to obtain vanadium slag from vanadium titanomagnetite smelted by blast furnaces with ferro-vanadium blown in a converter. This is then subjected to sodium or calcium roasting in a rotary kiln, followed by water or acid leaching, purification, and vanadium precipitation [8]. Although this process is compatible with the steel smelting process, it results in a low total vanadium yield and several toxic substances in vanadium slag [9]. For example, Gr6+, As5+, V5+ and other high-valent ions, are extremely toxic or carcinogenic, and easily dissolved in water and into the groundwater, which has a great impact on the local environment. Direct vanadium extraction methods from vanadium titanium magnetite have been heavily researched in recent years and include sodium roasting, salt-free roasting, direct acid leaching, sub-molten salt technology, and calcification roasting with acid or alkaline leaching [10]. Sodium roasting is a more mature technology, but when the vanadium phase conversion is low, the introduction of sodium salts adversely affects the subsequent ironmaking, corrodes equipment, and pollutes the air [11]. Calcification roasting-alkali leaching is seldom used, the strong alkali leaching effect is not ideal, and the costs are too high [12]. Salt-free roasting–leaching uses a high roasting temperature that results in the serious loss of vanadium due to evaporation [13]. Sulfuric acid direct leaching uses simple equipment and is environmentally friendly, but its leaching efficiency is low and requires the addition of a leaching aid to help destroy the vanadium-containing phases [14]. Sub-molten salt technology is used to leach vanadium, but this process consumes large amounts of alkali agents and energy [15]. Many new processes have also been used to leach vanadium, such as manganese salt roasting–acid leaching, microwave roasting, electrooxidation acid leaching, and liquid oxidation. However, for various reasons, these methods have hardly been used industrially [16,17]. Calcification roasting acid leaching does not discharge corrosive gases, has less wastewater discharge, and produces easily-treatable extraction tailings [18]. Wen et al. [19]. studied the calcification roasting acid leaching of vanadium. The introduction of a calcium salt formed calcium sulfate during leaching that wrapped the unreacted vanadium-containing phase, reduced the recovery of vanadium, and also contained a by-product that was difficult to reuse. Zhang et al. [20] studied the calcification roasting–acid leaching of vanadium and showed that vanadium and iron were simultaneously leached. In summary, calcification roasting–sulfuric-acid leaching mainly has two defects. The calcium salt added during roasting precipitates as CaSO4 during acid leaching, which coats on the surface of the raw material to hinder leaching [21]. The leaching process is also non-selective and, although V is leached, large quantities of valuable metals such as Fe and Ti are also leached, which complicates the selective extraction and precipitation of vanadium [22,23]. In order to increase the vanadium concentration in the leaching solution to skip extraction and enrichment, the leaching experiment should be carried out with a larger solid-liquid ratio. The concentration of silicic acid in the leaching solution increases as the liquid-solid ratio decreases. Therefore, when the solid-liquid ratio is large, the concentration of silicic acid in the leaching solution is larger and silica gel is easily formed, which on the one hand tends to wrap the pellets and affects the leaching, and on the other hand makes the leaching solution viscous and difficult to be filtered, so it is necessary to remove silicon during the leaching process.
Due to the above situation, this study proposed a two-stage cyclic leaching method for CPVC with sulfuric acid. Vanadium–titanium-iron became CPVC after concentrate calcification-roasted. A calcium hydroxide addition of 2%, a bentonite addition of 0.8%, a roasting temperature of 1200 °C, and a roasting time of 2 h occurred. The process involves two stages. The first stage of leaching includes the removal of silicon from the pellet and leaching solution. In the second stage of leaching, sulfuric acid solution was used for the cyclic leaching of silicon-removal pellets. The influence of CaSO4 on leaching was investigated by pelletizing and circulating leaching. Selective vanadium leaching was achieved, and the final leaching rates of vanadium and iron were 75.52% and 0.71%, respectively. After the second roasting, the crushing strength of the pellets reached 2250 N. The advantage of this process is that the iron is retained in pellets, while vanadium is extracted. The leached pellets met the requirements for blast furnace ironmaking and the crushing strength of pellets after the second roasting. In addition, due to the large solid–liquid ratio, the vanadium concentration in the leaching solution reached 6.80 g/L. Subsequent vanadium extraction did not require a separate extraction step because vanadium directly precipitated, which significantly improved the production efficiency.

2. Materials and Methods

2.1. Materials

The raw material used in this study was CPVC, which was provided by Sichuan Longmang Mining and Metallurgy Co., Ltd., Panzhihua, Sichuan, China. The phase analysis of the raw material was carried out by X-ray fluorescence spectroscopy (XRF), and the results are shown in Table 1. The main elements in CPVC were Fe and Ti. There were also small amounts of impurities such as Si, Ca, Mg, Al, Cr. The content of vanadium detected by ICP was 0.3%. Analytically pure sulfuric acid was provided by Chengdu Kelong Chemical Reagent Factory, and industrial flocculant was provided by Dezhou Ruixing Water Purification Raw Materials Co., Ltd., Dezhou, Shandong, China.

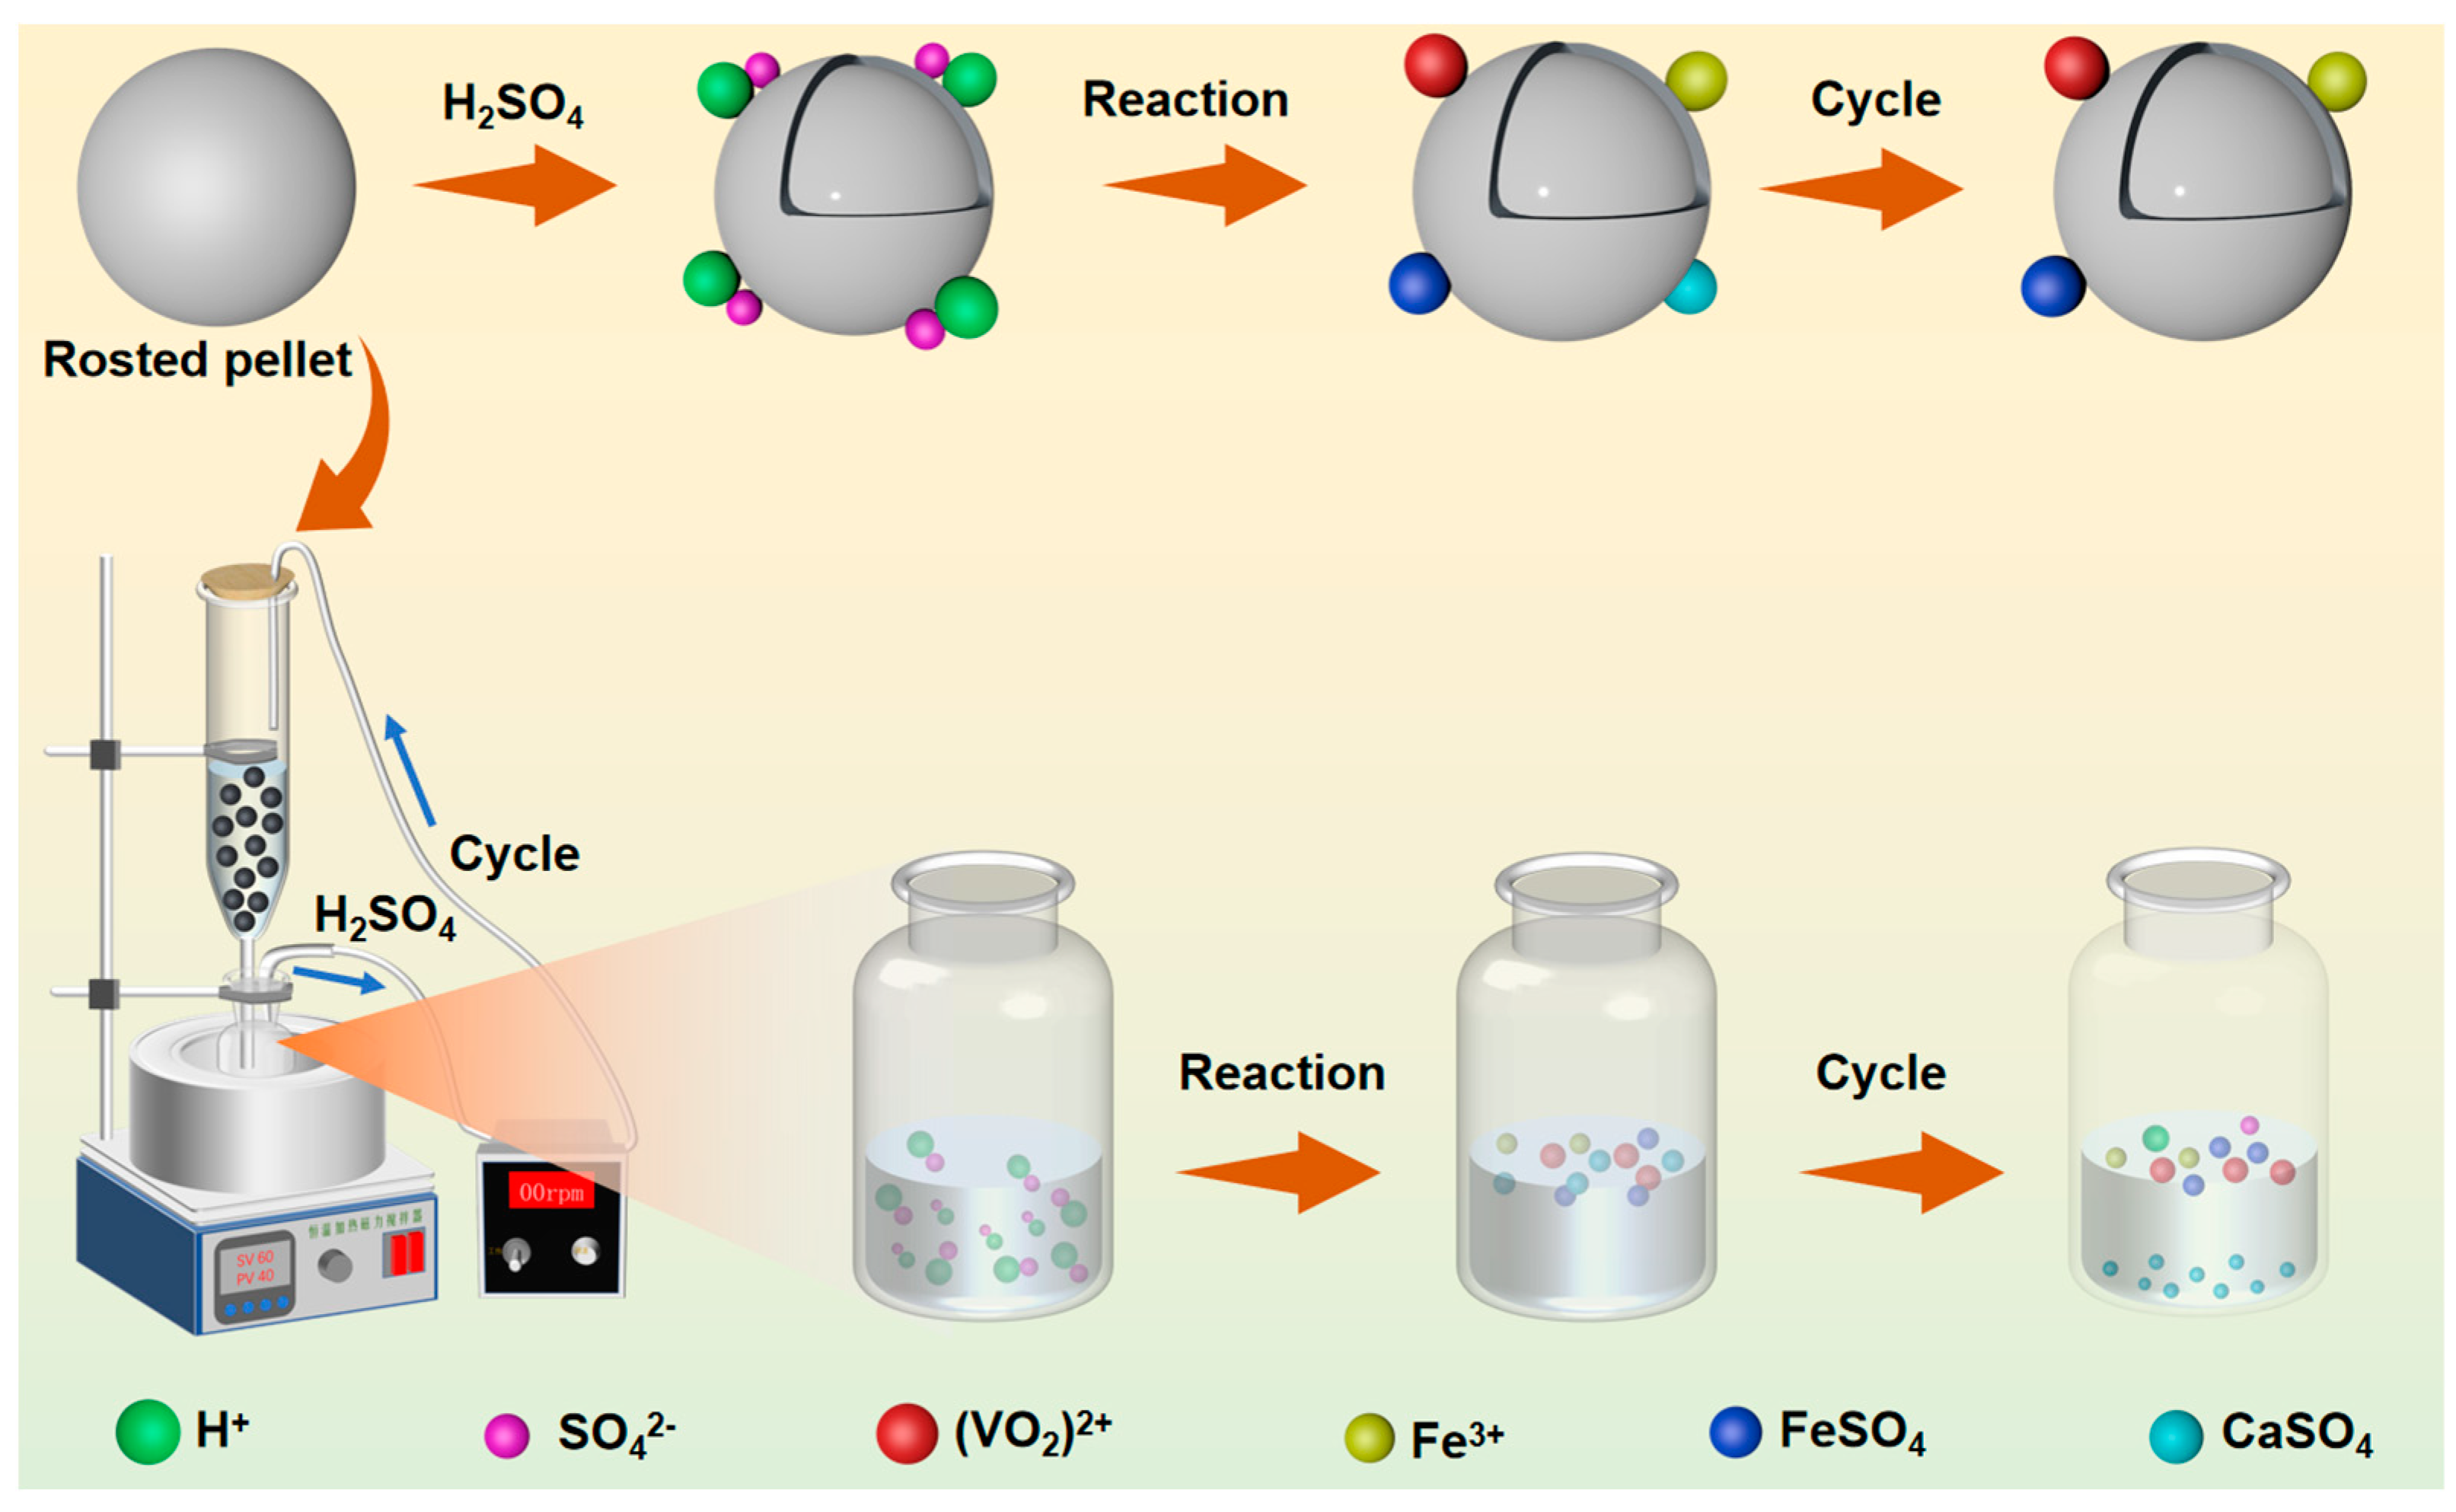
2.2. Experimental Procedure

The leaching experiment was conducted under atmospheric pressure. The particle size of pellets was in the range of 1.3~2.0 cm. On the one hand, most of the pellets provided were in the range, on the other hand, the difference of particle size in the range was extremely small for the leaching rate of vanadium and iron through the single factor experiment of particle size. As shown in Figure 1, CPVC was stored in a custom container and heated in a large-mouth jar with dilute sulfuric acid solution through a thermostatic water bath. The customized reaction container was fixed directly above the jar with clips. The circulation of dilute sulfuric acid solution between the custom container and large-mouth jar was realized by a peristaltic pump. The first stage of leaching involved optimizing the silicon removal of acid leaching pellets under four different acid concentrations (0.4 mol/L, 0.8 mol/L, 1.0 mol/L, 1.5 mol/L) and four different solid-liquid ratios (6:1, 5:1, 4:1, 3:1). The pellets were washed to obtain the pellets after silicon removal. The silicon removal using the acid leaching solution was optimized under four different acid concentrations (1.5 mol/L, 2.0 mol/L, 2.5 mol/L, 3.0 mol/L) and four different standing times (36 h, 48 h, 60 h, 72 h). The leaching solution was filtered to obtain the leaching solution after silicon removal. The pellets and leachate after their silicon removed during the first leaching stage were mixed. Then a certain amount of fresh sulfuric acid was added to adjust the acid concentration of the solution, and the second stage of cyclic leaching was started. To optimize the leaching rate of V and Fe, the second stage of leaching involved the use of four different acid concentrations (1.0 mol/L, 1.5 mol/L, 2.0 mol/L, 2.5 mol/L), four different leaching times (6 d, 8 d, 10 d, 12 d), four different solid–liquid ratios (6:1, 5:1, 4:1, 3:1), and four different leaching temperatures (room temperature, 40 °C, 50 °C, 60 °C). At the end of the second stage leaching, the pellets were washed and then roasted for a second time (1200 °C, 20 min), and the leaching solution was filtered.

2.3. Characterization and Analysis
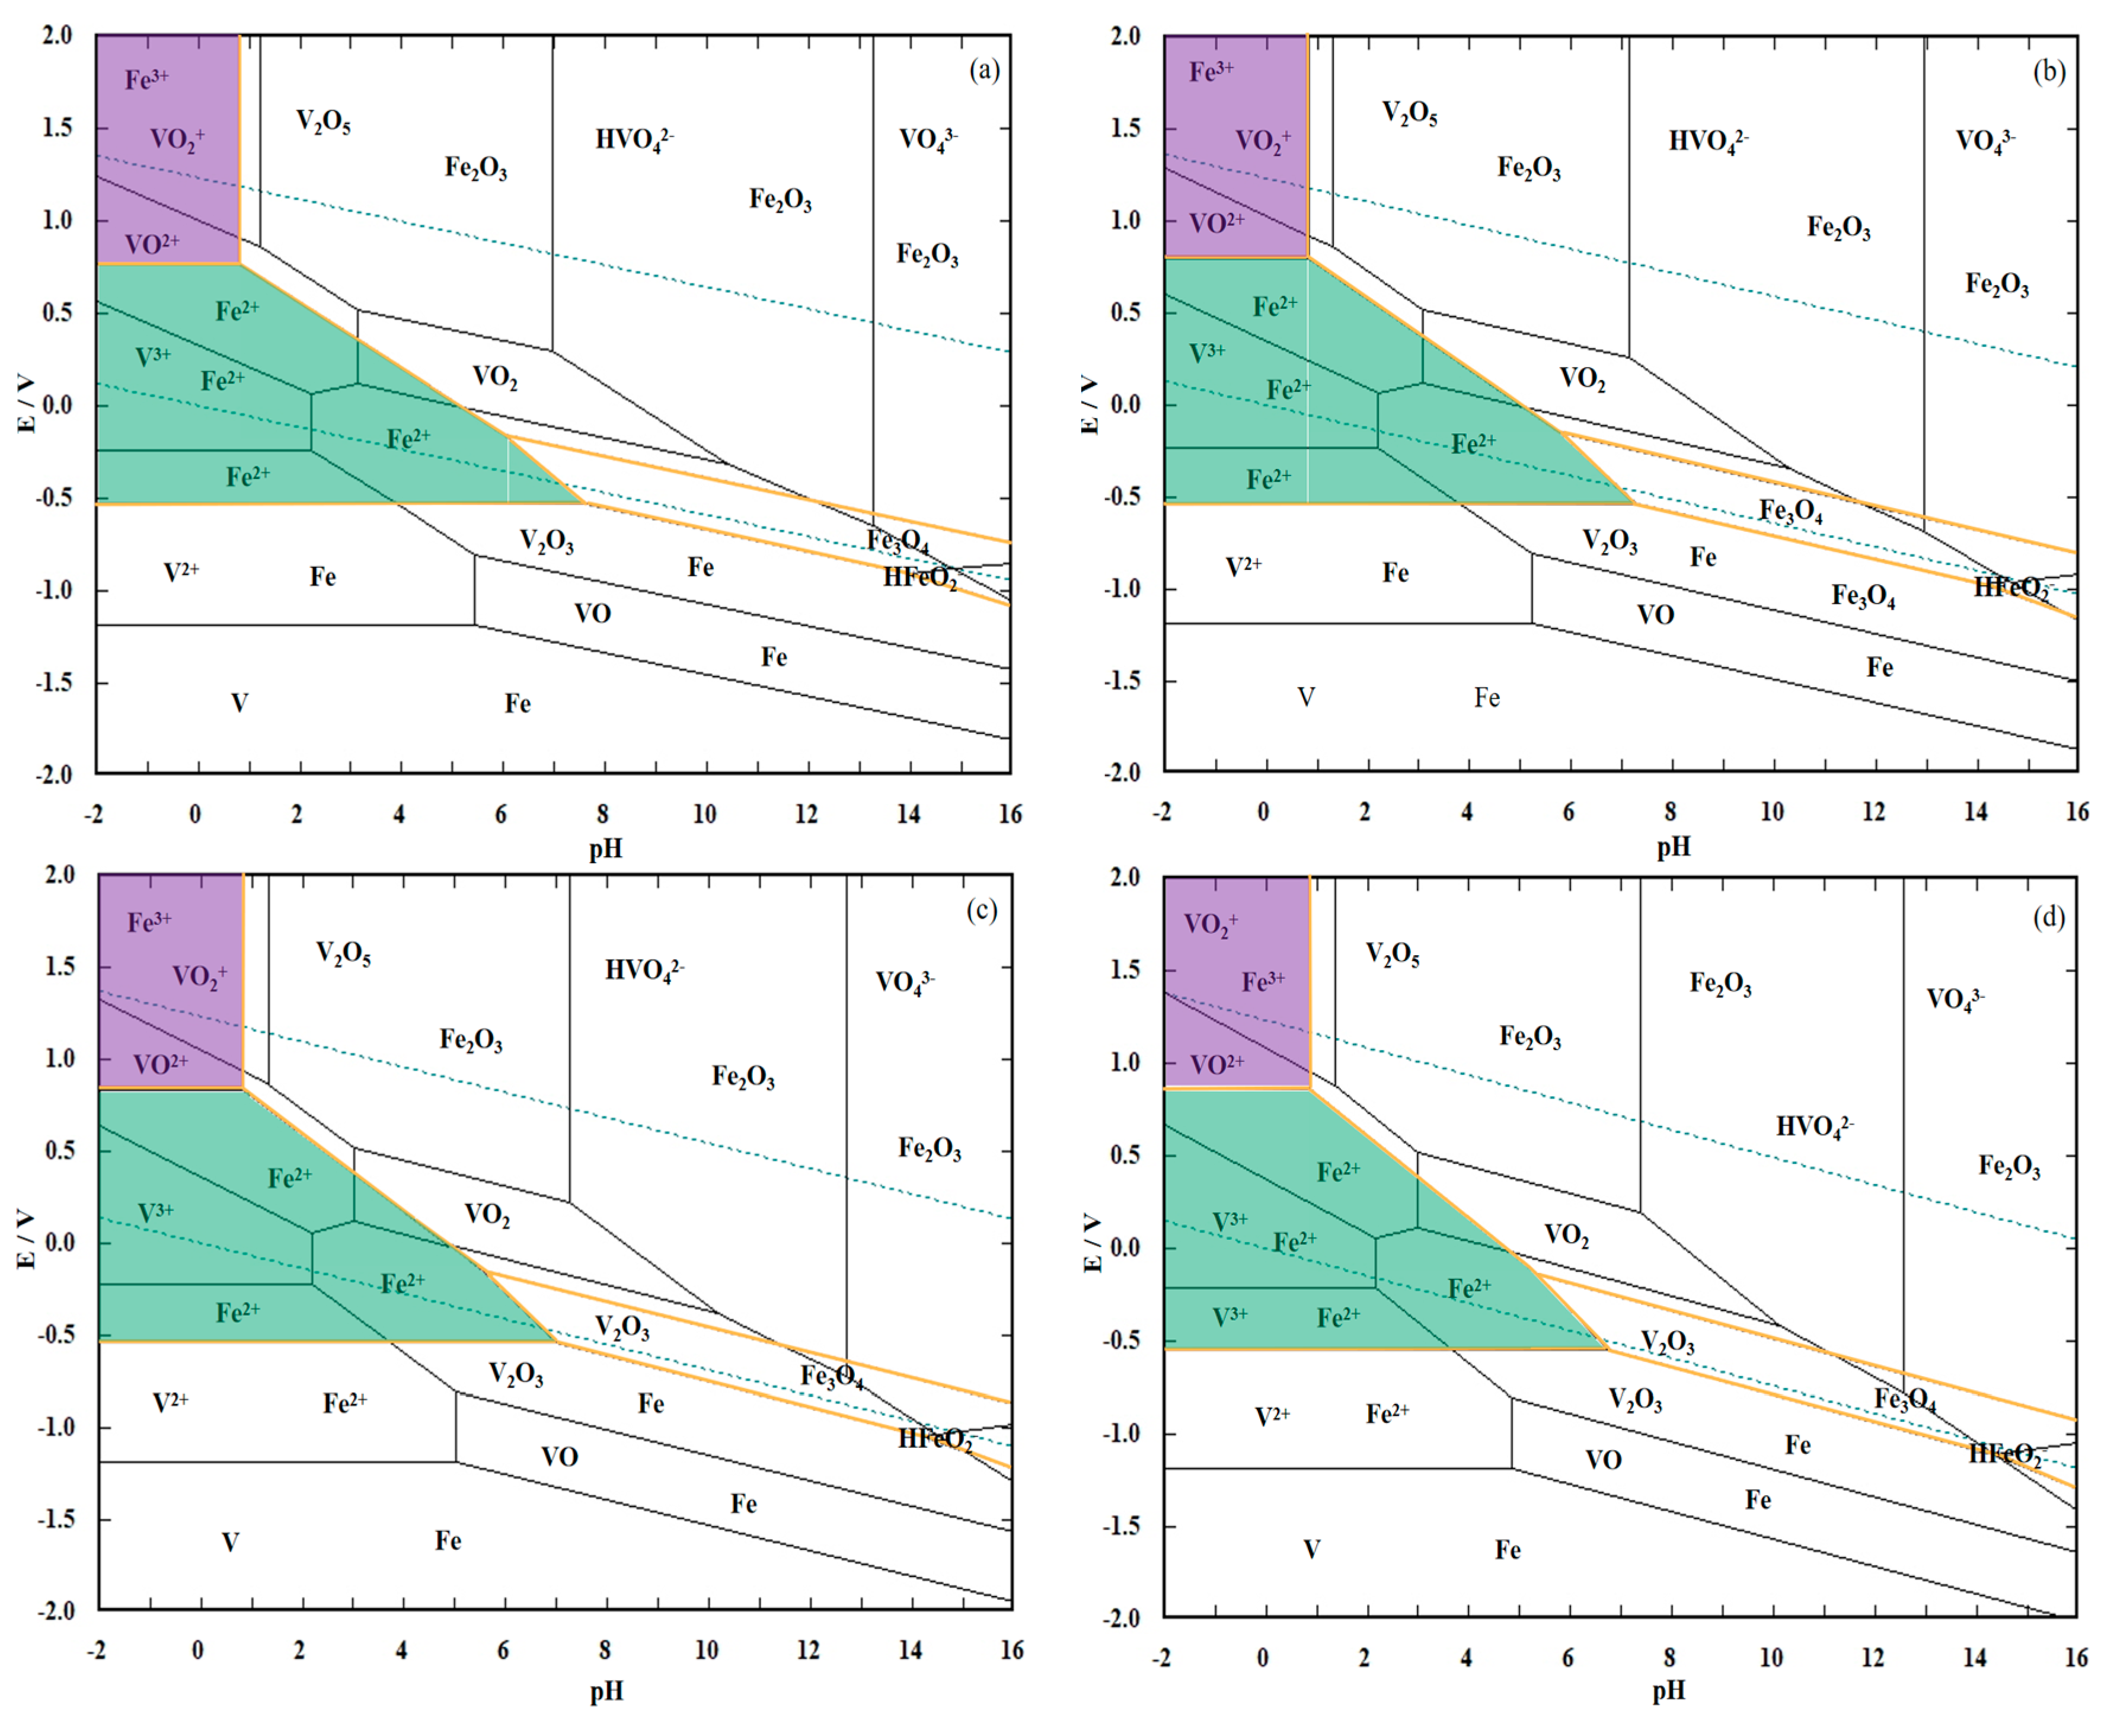
X-ray diffraction (XRD, Panalytical Empyrean. Marvin Panaco, Netherlands.) was used to analyze the phase composition of the roasted and leached pellets. X-ray fluorescence spectroscopy (XRF) was used to analyze the chemical composition of roasted pellets and leached pellets. X-ray photoelectron spectroscopy (XPS) was used to analyze the valence states and relative proportions of V and Fe. Scanning electron microscopy (SEM, Quanta Q 400, FEI Company, Hillsboro, OR, USA) was used for observations and for the elemental analysis of roasted and leached pellets. The strength of pellets after two-stage leaching and the second roasting was measured by a universal testing machine (WE-100). The concentration of vanadium in the solution was determined by ferrous ammonium sulfate titration. The concentrations of other elements were determined by inductively coupled plasma-atomic emission spectrometry (ICP-AES, Optima8000. Perkin Elmer, Waltham, MA, USA).

3. Eh-pH Diagrams

Eh-pH diagrams are applicable to aqueous solution systems and reflect the relationship between potential, pH, and ion activity of different reactions under different conditions [24]. The potential-pH diagram shows the equilibrium conditions and stable regions of different components. It can also be used to judge the directions and limits of different chemical reactions under different conditions [25]. To understand the thermodynamics of vanadium–titanium–iron ore concentrate during acid leaching, we performed a thermodynamic analysis of the atmospheric leaching process of vanadium–titanium–iron ore concentrate by plotting the Eh-pH diagram of the V-Fe-H2O system at different temperatures (25 °C, 50 °C, 75 °C, and 100 °C) in the standard state.
According to the thermodynamic reaction equations and data from each element and leaching agent under the corresponding acid leaching conditions. The ion concentration of V-Fe-H2O aqueous solution was 0.1 mol/kg. As shown in Figure 2, the stable regions of soluble V3+, VO2+, and VO2+ were all located within the stable regions of Fe3+ and Fe2+ under acidic conditions. As can be seen from Figure 2, the redox potential corresponding to the stable zone of soluble vanadium and iron ions gradually increased, and the pH gradually decreased as the temperature increased. Thermodynamic analysis showed that increasing the temperature decreased the leaching of the valuable element vanadium and impurity iron. We also analyzed the effect of temperature on kinetic factors such as the reaction rate. An acid leaching experiment is needed to verify the accuracy of the thermodynamic calculations.

4. Results

4.1. First Stage Leaching

The lower the solid-to-liquid ratio, the larger the amount of leachate to be processed and the lower the vanadium concentration in the leachate. This situation necessitates the use of multi-stage extraction to precipitate vanadium, which is not suitable for industrial production [26]. At higher solid–liquid ratios, the calcium silicate in the pellet reacts with sulfuric acid to form silicic acid during the leaching process. This causes the pellets to be wrapped by silica gel due to the aggregation of silicic acid. This makes the leaching solution difficult to filter. Therefore, the main purpose of the first stage of leaching was to remove silicon. This stage was further divided into pellet silicon removal and leaching solution silicon removal. The effects of acid concentration and solid–liquid ratio on the formation time of silica gel and the leaching rates of vanadium and iron were investigated during the removal of silicon from the pellet. The effect of acid concentration and standing time on the filtration time of the leaching solution was investigated for removing silicon from the leaching solution. As both the pellets and leachate after silicon removal were filtered, some ferrovanadium was lost. Therefore, a lower leaching rate of V and Fe in the first stage is better.
Silicic acid tends to undergo self-polymerization in the solution. In the presence of an acid or salt, silicic acid first self-polymerizes and then forms a three-dimensional reticular gel [27]. The condensation tendency of SiO2 in acidic ferric salt solution depends on the property and composition of the solution, including the acidity of the solution, the concentration of silicic acid, and the presence of other metal salts.

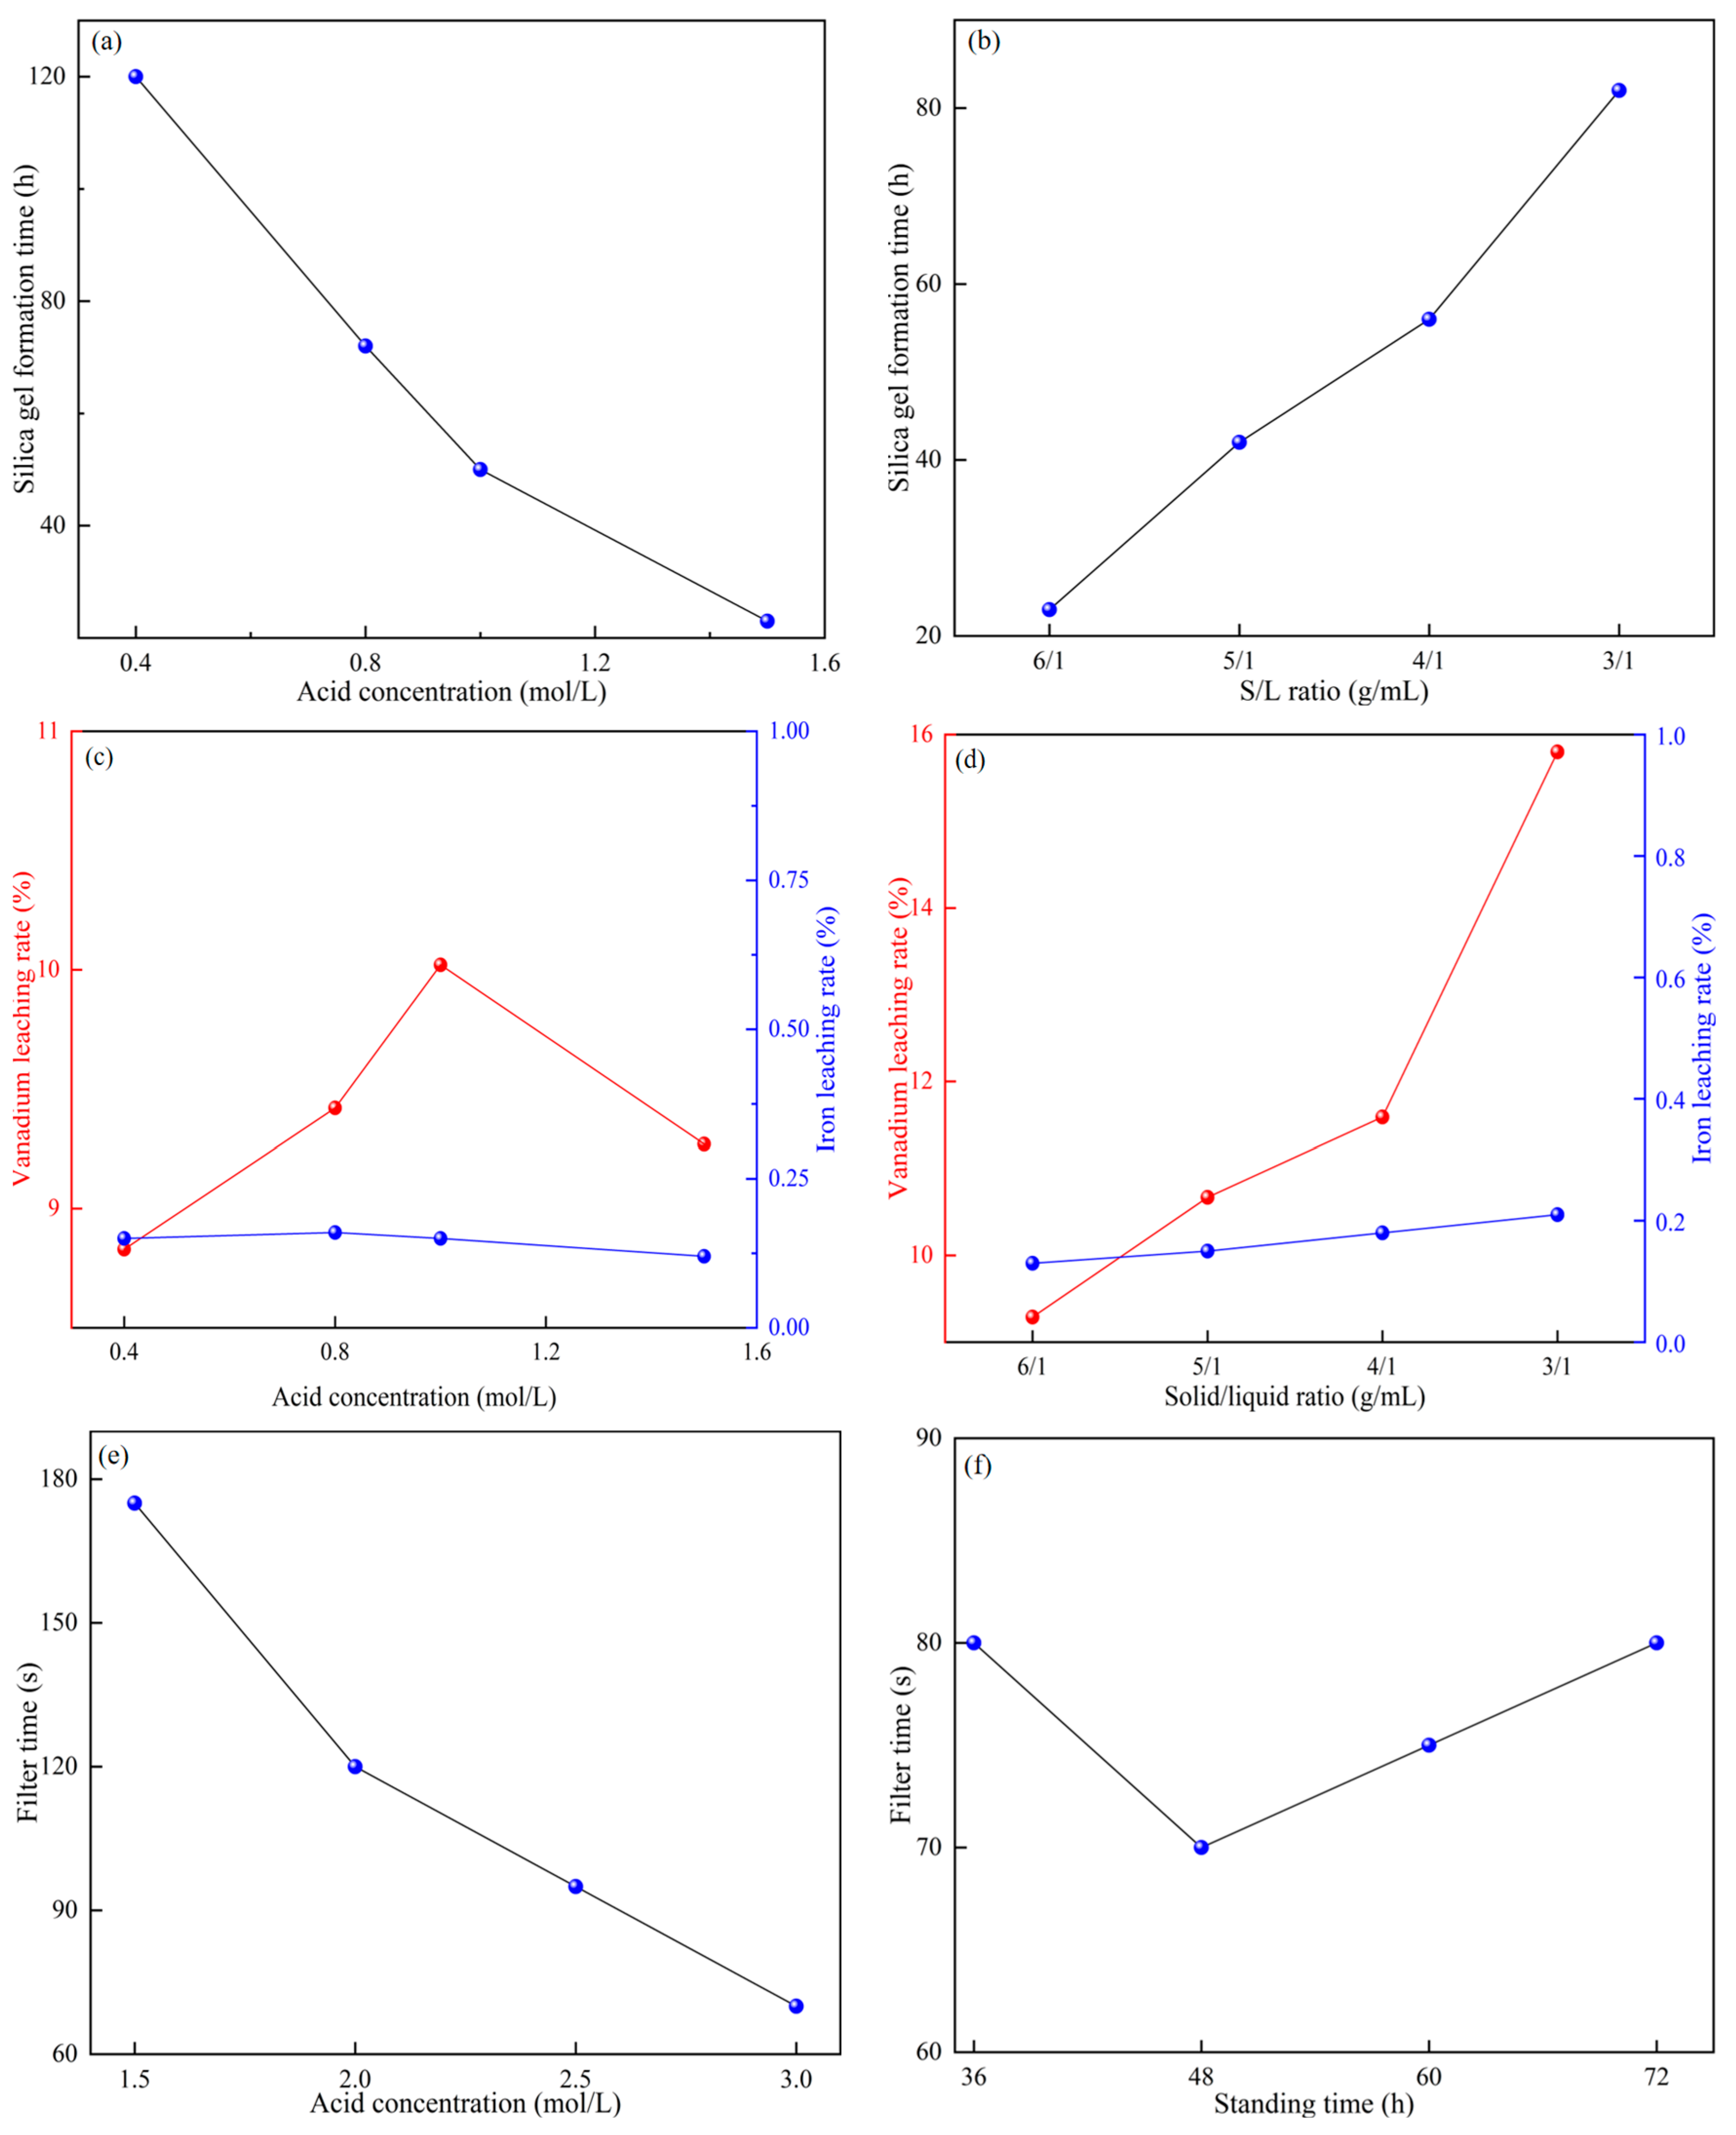
4.1.1. Effect of Acid Concentration on Pellet Silicon Removal

The experiment was carried out under a solid–liquid ratio of 6:1 and room temperature. The influence of acid concentration on the formation time of silica gel and the leaching rate of vanadium and iron is shown in Figure 3a,c. The silica gel formation time was significantly reduced upon increasing the acid concentration, and the leaching rate of both vanadium and iron increased and then decreased. This was because increasing the acid concentration directly increased the concentration of H+ in the solution, which increased the number of collisions between H+ and silicate phase per unit time, thus accelerating the reaction rate. This ultimately increased the silicon removal efficiency per unit time. When the acid concentration reached 1.5 mol/L, there was a significant decrease in the leaching rate of both vanadium and iron. This was because, as the acid concentration increased, the silica gel formation time decreased significantly, resulting in a shorter reaction time between the H+ and vanadium-containing phases in the leachate. This decreased the leaching rate of vanadium and iron. Therefore, the optimal acid concentration during the pellet silicon removal process was 1.5 mol/L.

4.1.2. Effect of Solid–Liquid Ratio on Silicon Removal from Pellets

The experiments were carried out at room temperature and an acid concentration of 1.5 mol/L. The effect of the solid–liquid ratio on the formation time of the silica gel and the leaching rate of vanadium and iron is shown in Figure 3b,d. As the solid–liquid ratio decreased, the silica gel formation time increased significantly because, at a lower solid–liquid ratio, there was a lower silicic acid concentration in the leachate, making it less likely to flocculate into a silica gel. The leaching rates of vanadium and iron increased because, as the solid–liquid ratio decreased, the concentration difference of the reactants on both sides of the diffusion layer increased, thus improving the better kinetics. Therefore, the optimal solid–liquid ratio in the pellet during silicon removal was 6:1.

4.1.3. Effect of Acid Concentration on Silicon Removal from the Leachate

The influence of the acid concentration on the removal of silicon from the leachate is mainly affected by the filtration time. Experiments were conducted at room temperature with a standing time of 48 h. As shown in Figure 3e, the filtration time decreased upon increasing the acid concentration. This was because the degree of polymerization of silicic acid increased upon increasing the overall acid concentration of the solution. The higher the degree of polymerization of silicic acid, the easier it was to interact with the flocculant during flocculation to form a mesh structure. Thus, a short silicon removal time was achieved, so the acid concentration chosen for the leach solution silicon removal was 3.0 mol/L.

4.1.4. Effect of Standing Time on Silicon Removal from the Leachate

The effect of standing time on silicon removal from the leachate is mainly affected by the filtration time. Experiments were carried out at room temperature and an acid concentration of 3.0 mol/L. The results are shown in Figure 3f. When the resting time was extended from 36 h to 48 h, the required filtration time was shortened from 80 s to 70 s. When the resting time was extended, the filtration time increased. This was because adding a flocculant caused the macromolecular polyelectrolytes to cross-link the colloidal particles into a net-like structure that formed flocculation clusters, thus facilitating filtration. However, upon further extending the resting time, the macromolecular pellets originally formed by flocculation began to decompose, extending the filtration time. Therefore, the resting time of 48 h was optimal.

4.2. Second-Stage Leaching

The pellets and leachate obtained after the first stage of leaching and silicon removal filtration were subjected to the second stage of leaching.

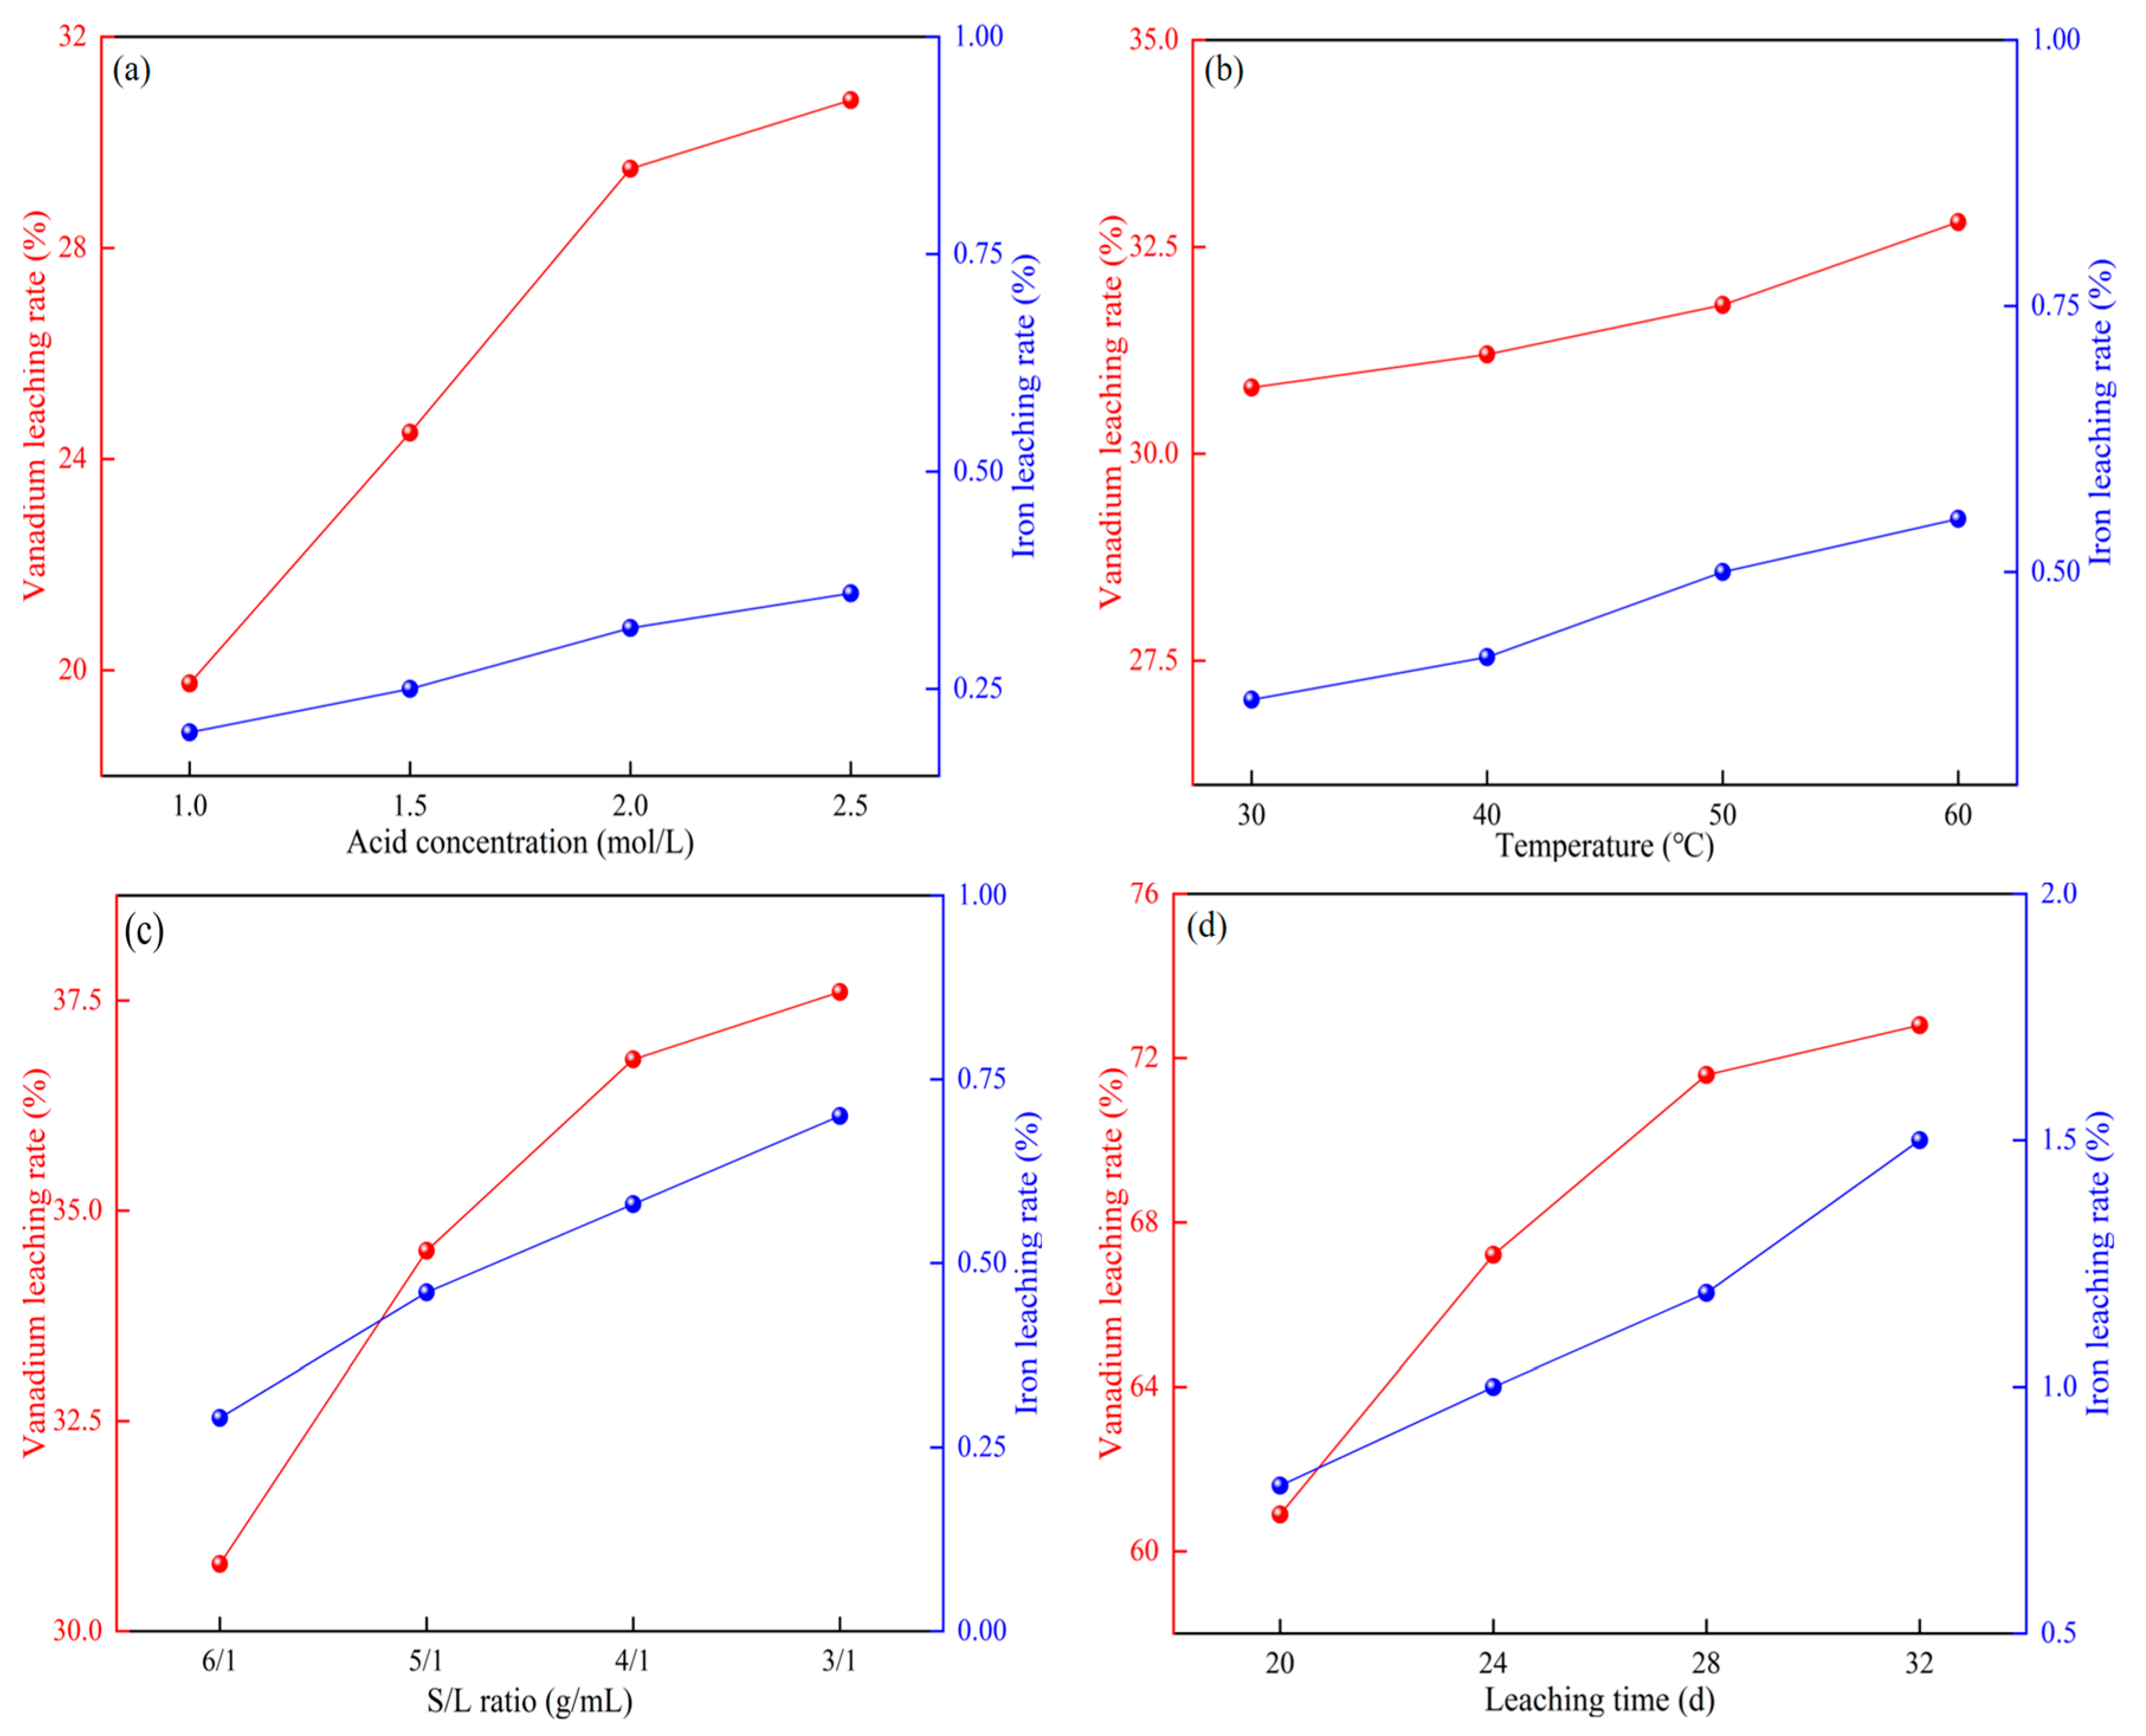
4.2.1. Effect of Acid Concentration on the Leaching Rate of Vanadium and Iron

The effect of acid concentration on the leaching rate of vanadium and iron was investigated by changing the acid concentration at room temperature, a solid–liquid ratio of 6:1, and a leaching time of 8 d. As shown in Figure 4a, the leaching rate of vanadium and iron increased upon increasing the acid concentration. When the concentration increased from 1.0 mol/L to 2.0 mol/L, the leaching rate of vanadium increased rapidly. From 2.0 mol/L to 2.5 mol/L, the leaching rate of vanadium started to increase slowly. Although the iron leaching rate increased, it only increased an additional 0.5%, showing that the acid concentration had little effect on the iron leaching rate. To save costs, the optimal acid concentration was 2.0 mol/L.

4.2.2. Effect of Temperature on the Leaching Rate of Vanadium and Iron

The effect of temperature on the leaching rate of vanadium and iron was investigated by changing the temperature at acid concentration of 2.0 mol/L, solid–liquid ratio of 6:1, and leaching time of 8 d. Figure 4b shows that upon continuously increasing the leaching temperature, the leaching rate of vanadium and iron both slowly increased. The above Eh-pH diagram shows that a higher temperature was detrimental to the leaching of both vanadium and iron. Increasing the temperature significantly increased the energy consumption, so room temperature was finally chosen as the subsequent leaching temperature.

4.2.3. Effect of Solid–Liquid Ratio on the Leaching Rate of Vanadium and Iron

The effect of solid–liquid ratio on the leaching rate of vanadium and iron was investigated by changing the solid–liquid ratio at acid concentration of 2.0 mol/L, room temperature, and leaching time of 8 d. As shown in Figure 4c, when the solid–liquid ratio was decreased from 6:1 to 5:1, the leaching rate of vanadium was significantly improved. The leaching rate of vanadium continued to slowly increase upon increasing the ratio 5:1 to 3:1. Throughout the leaching process, the leaching rate of iron continued to increase, although the increase was limited to within 0.5%. At a solid–liquid ratio of 3:1, the vanadium concentration of the final leach solution reached 5 g/L, and the maximum vanadium leaching rate was achieved. Therefore, 3:1 was chosen as the optimal solid–liquid ratio.

4.2.4. Effect of Leaching Time on the Leaching Rate of Vanadium and Iron

The effect of leaching time on the leaching rate of vanadium and iron was investigated by changing the leaching time at acid concentration of 2.0 mol/L, room temperature, and a solid–liquid ratio of 3:1. As shown in Figure 4d, the leaching rate of vanadium increased significantly when the leaching time was extended from 20 d to 28 d. The leaching rate of vanadium increased much more slowly upon extending the time from 28 d to 32 d. The iron leaching rate increased steadily throughout the process upon increasing the leaching time. Since a longer leaching time will increase production costs, the optimal leaching time was chosen to be 28 d.

5. Discussion

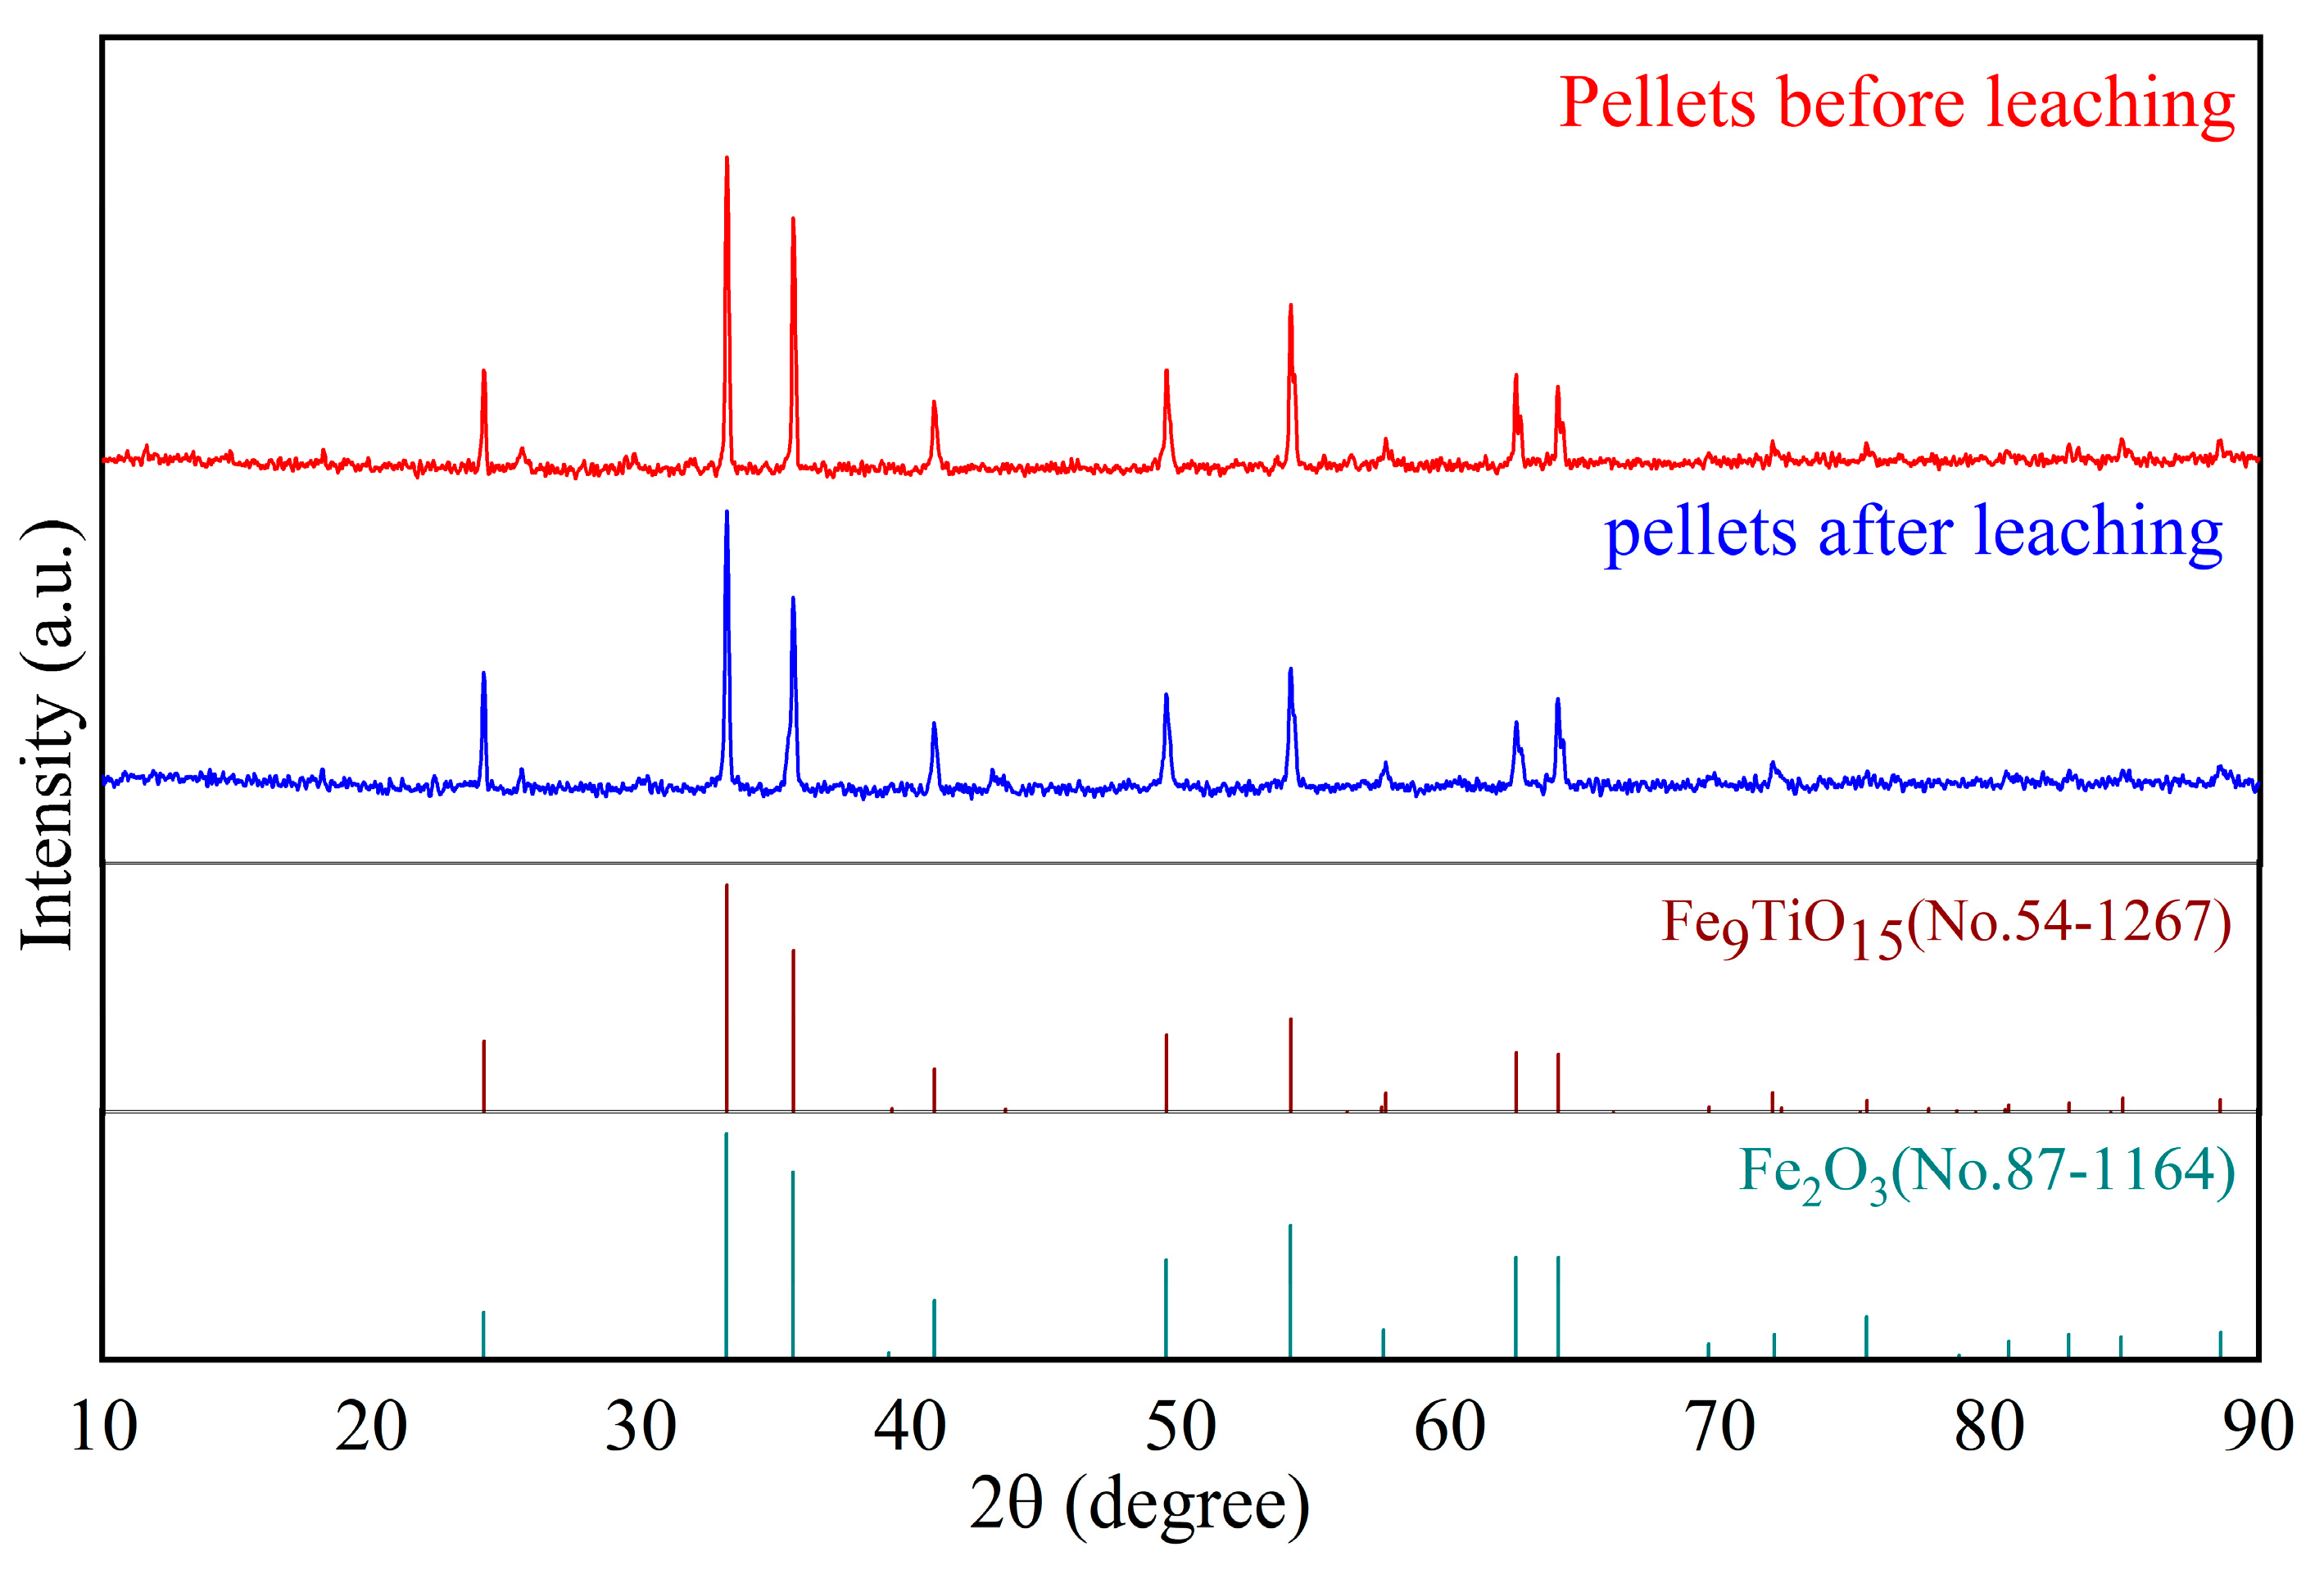
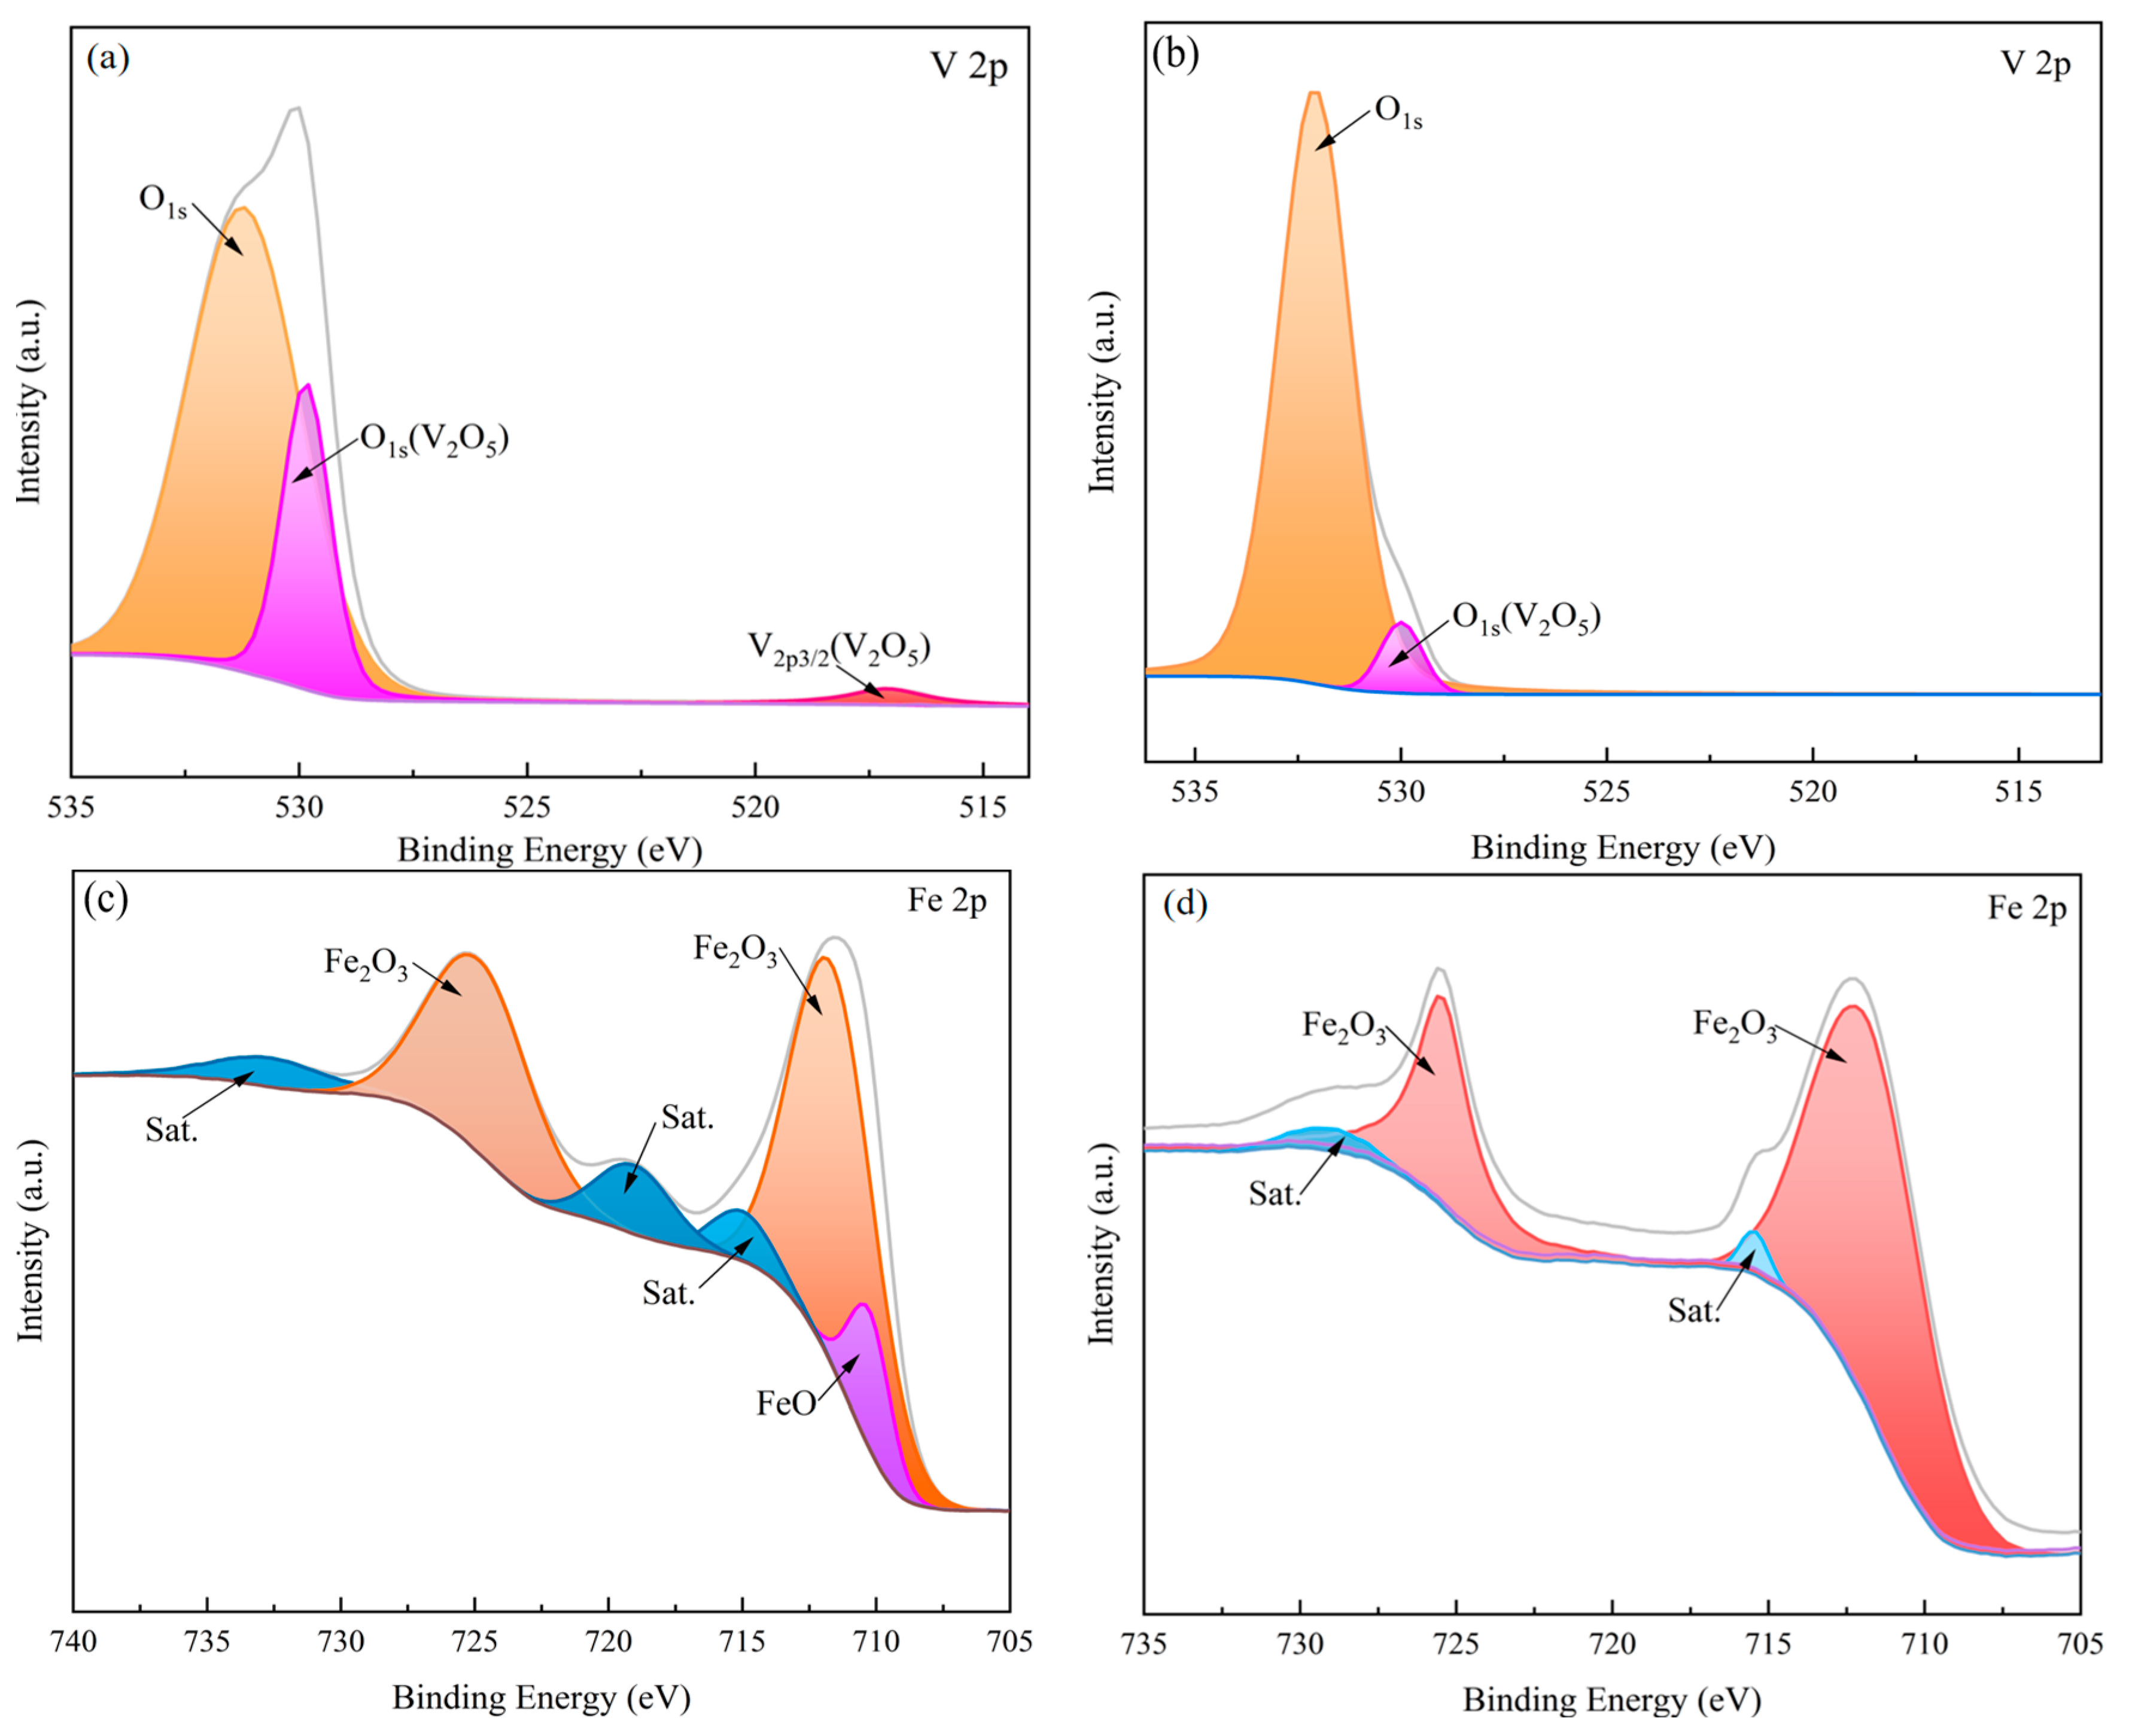
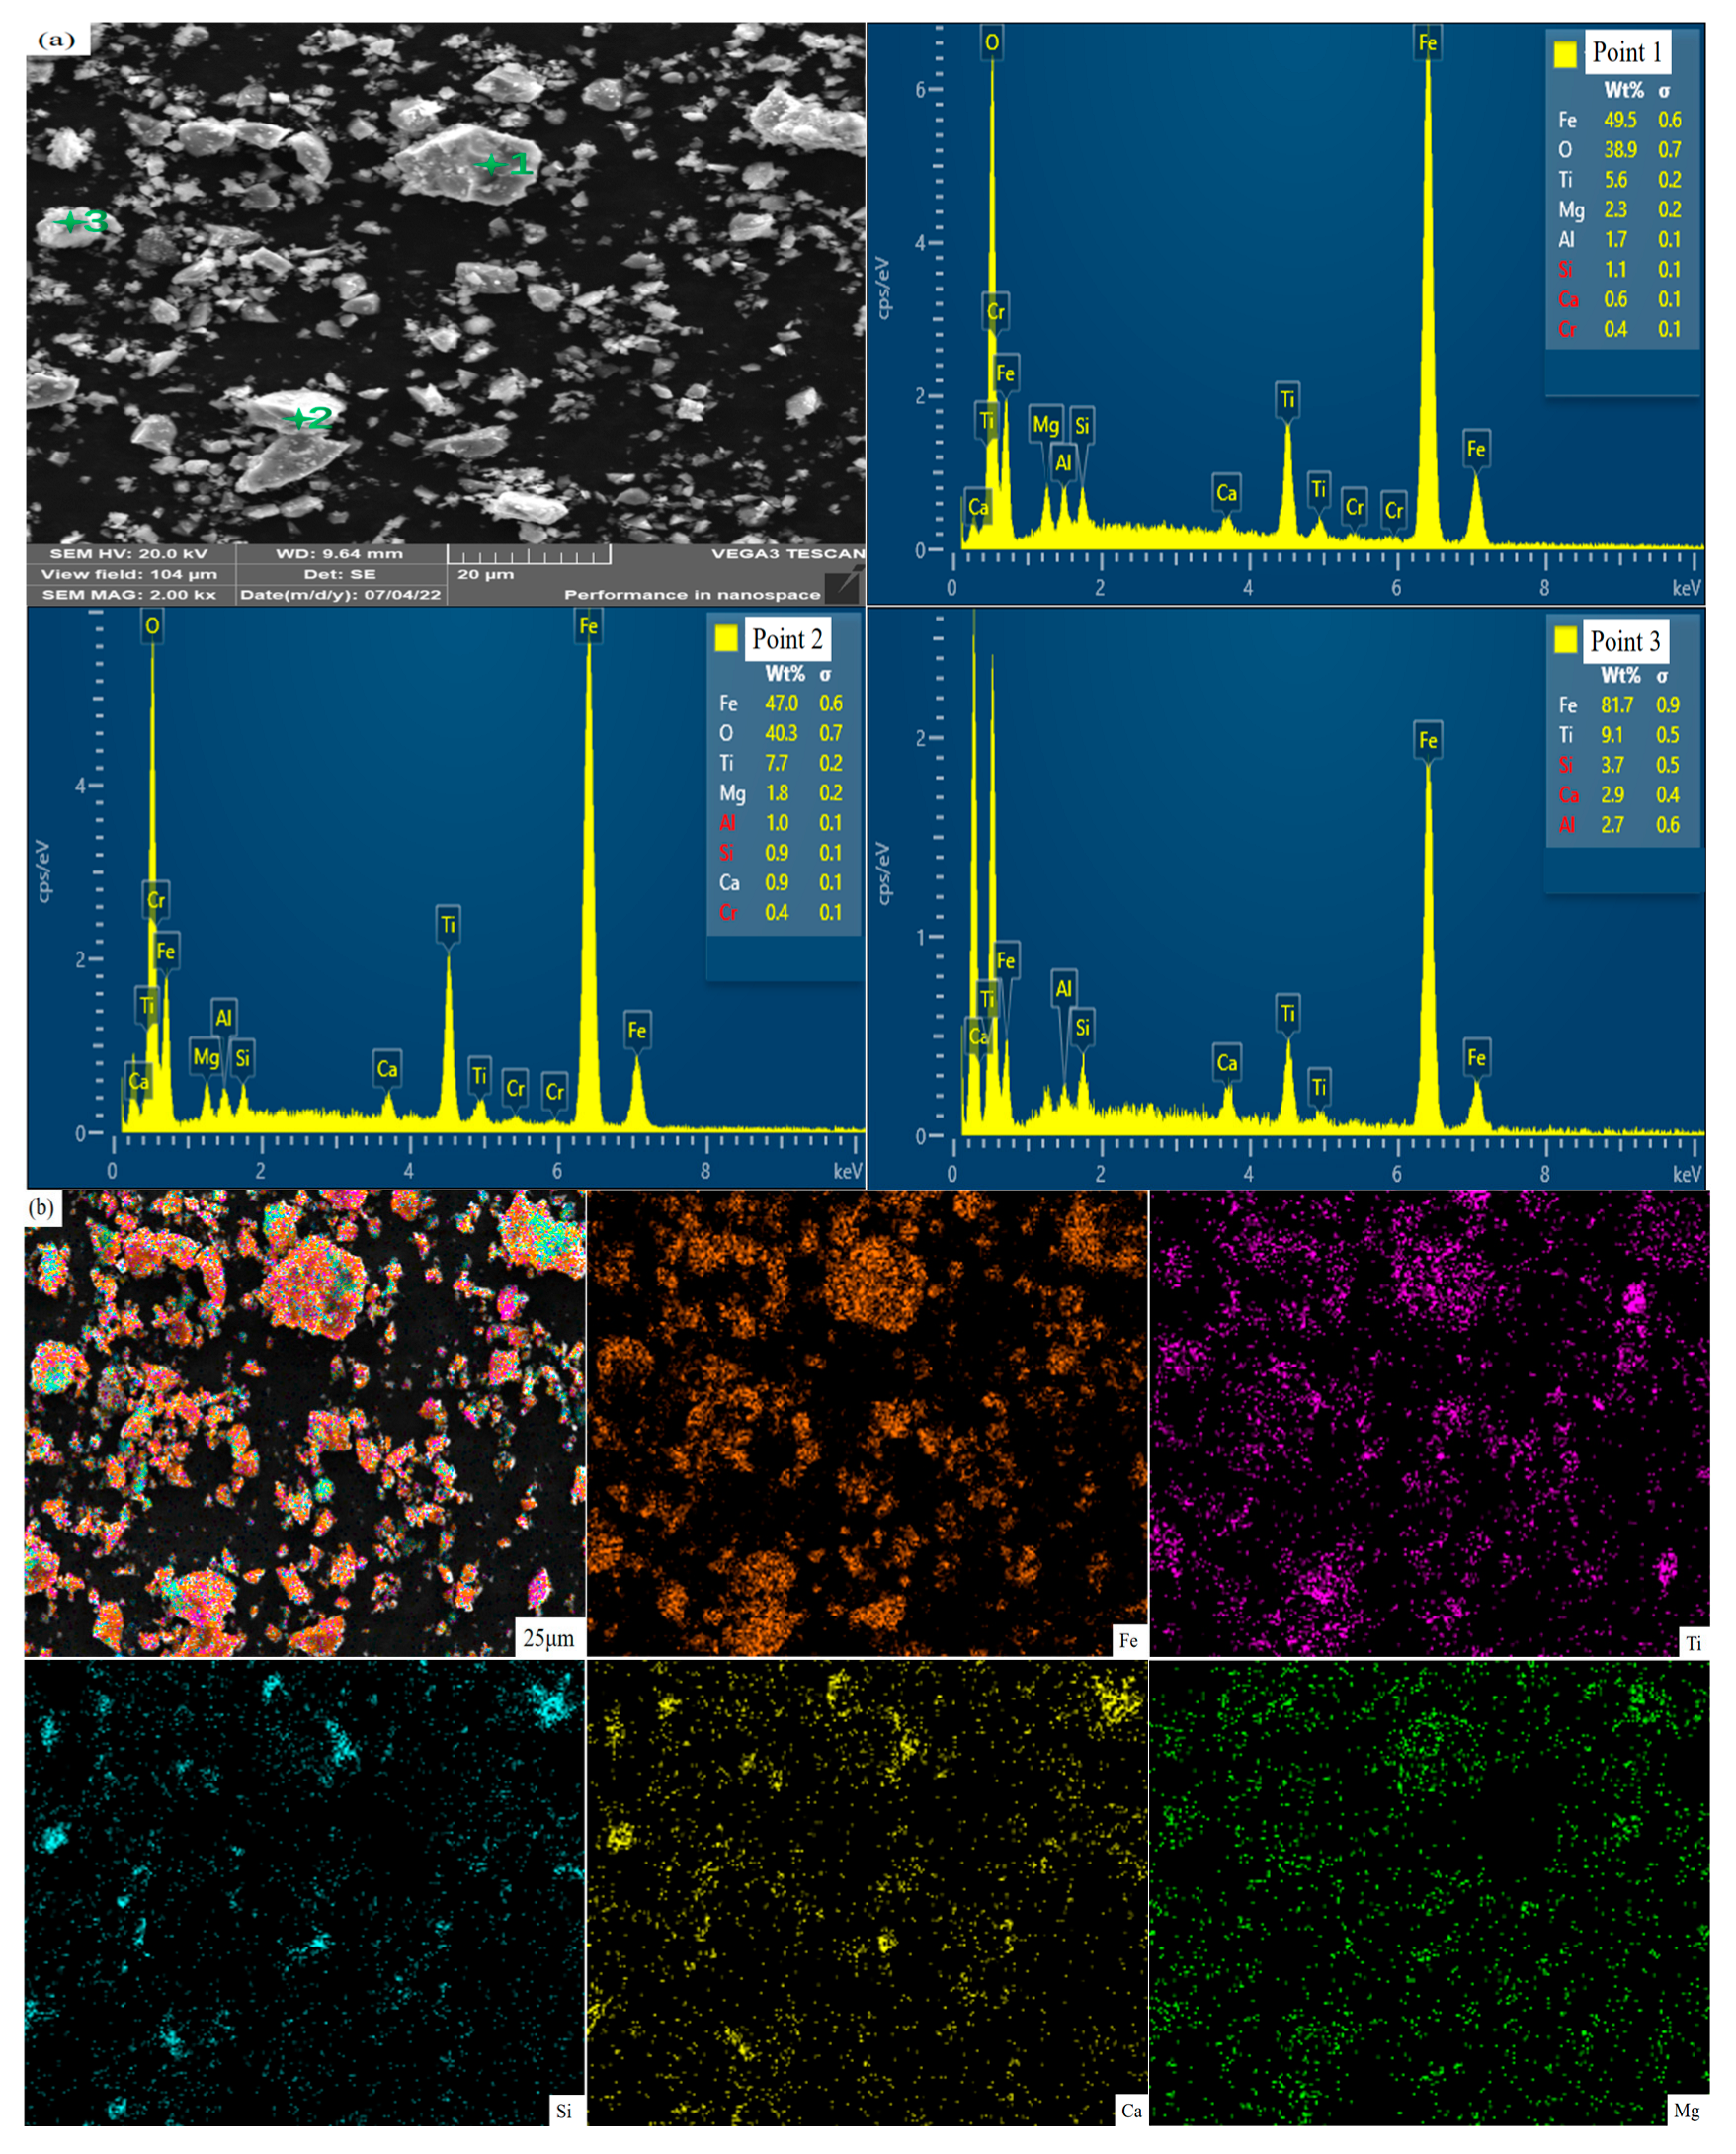
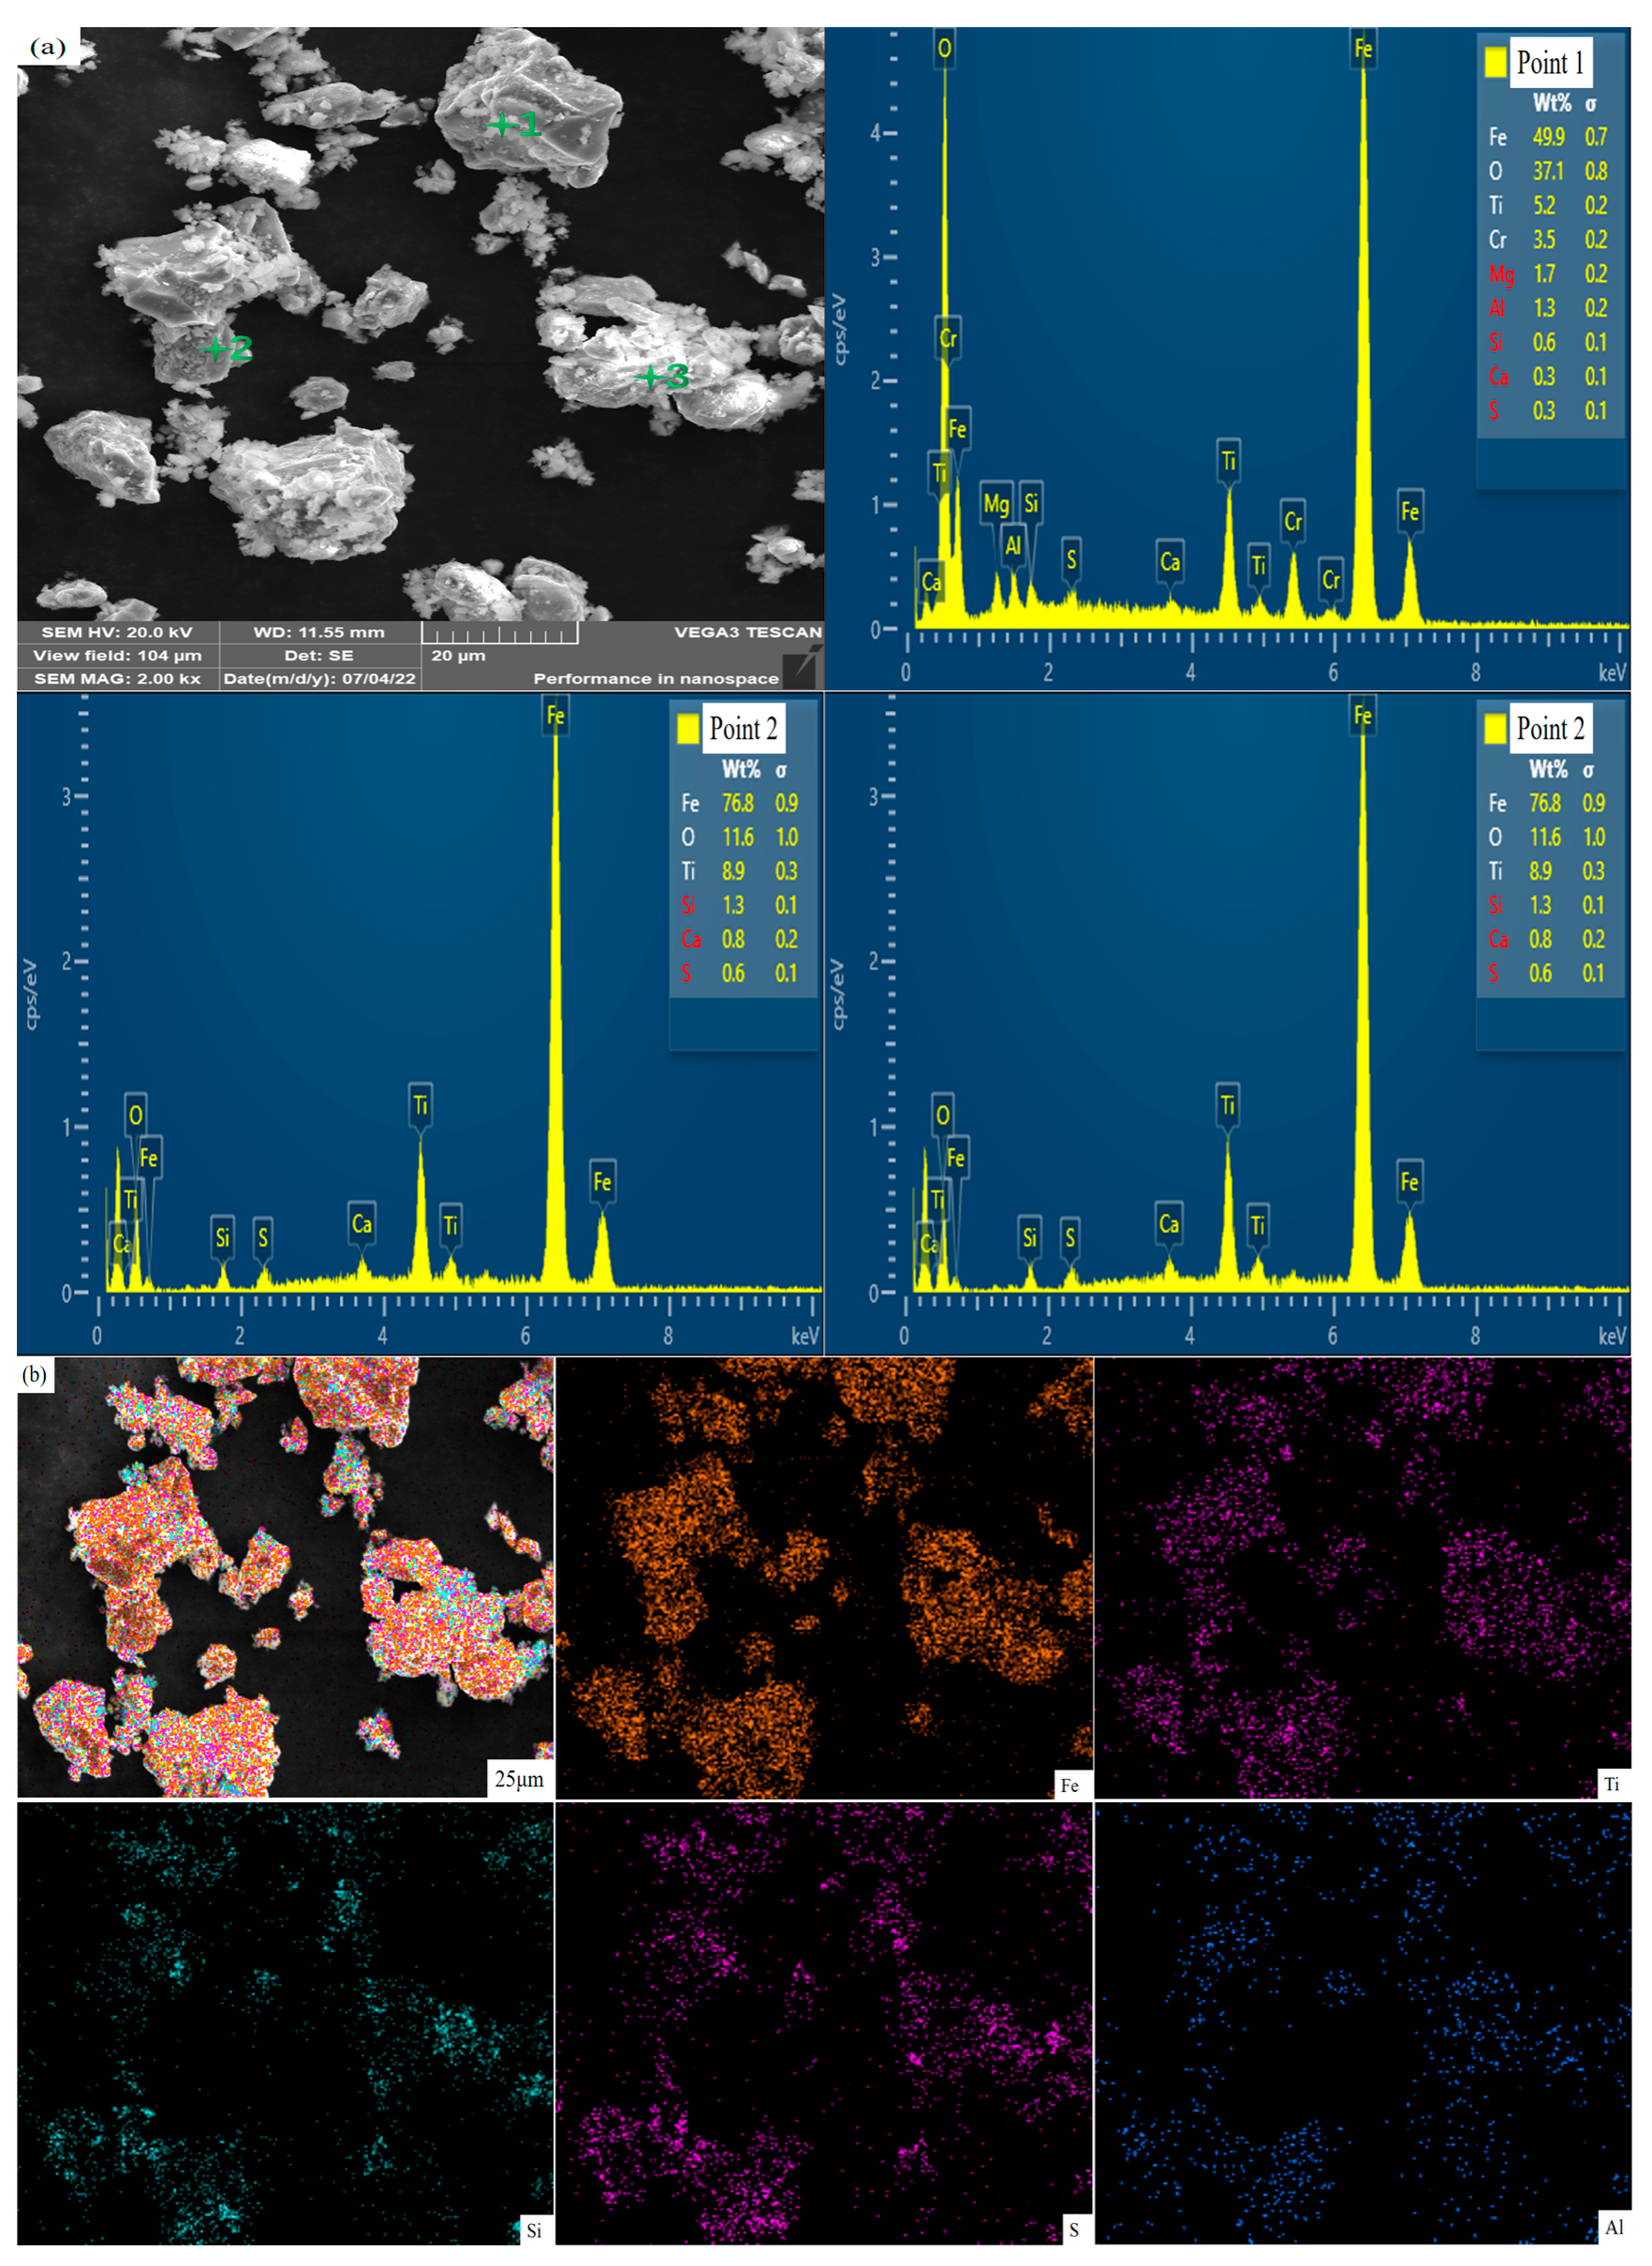
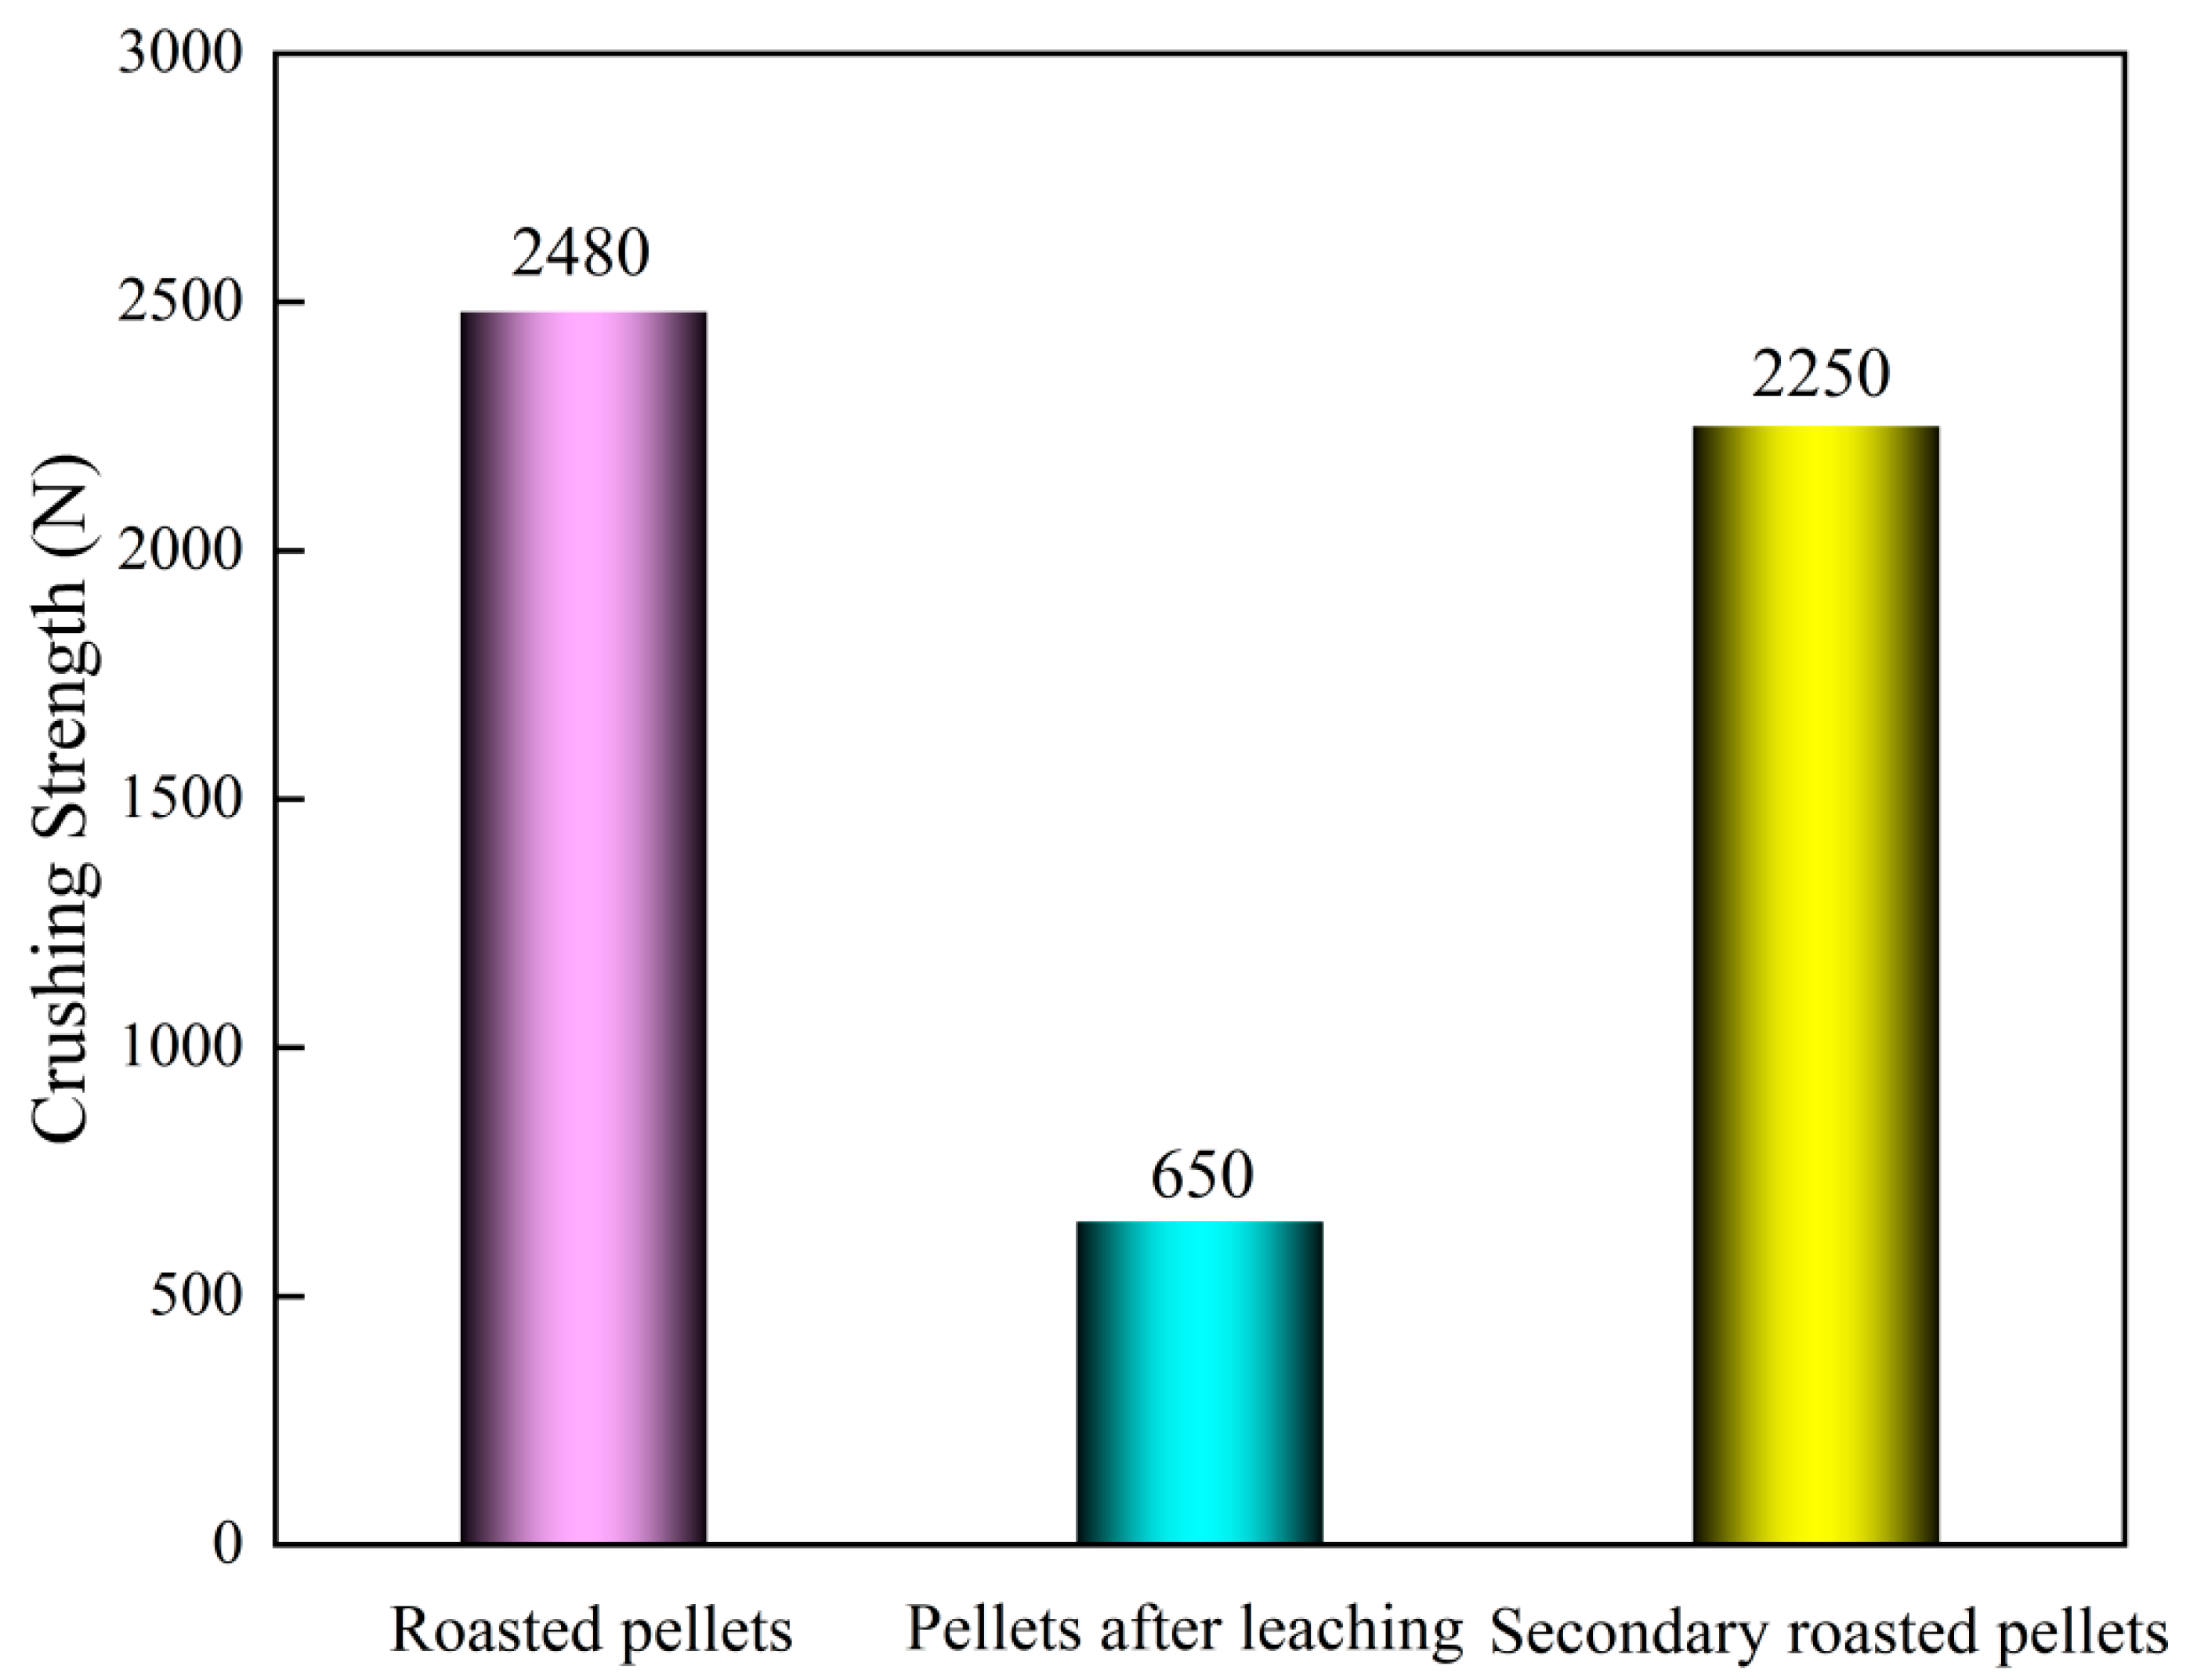
Characterization of Pellets before and after Leaching

Figure 5 shows the XRD patterns of the pellets before and after leaching. Diffraction peaks of the pellets before and after leaching were attributed to Fe2O3 and Fe9TiO15, which are a result of the combination of vanadium and titanium–iron ore concentrates during roasting. This indicates that the leaching process did not change the overall phase composition of the pellets. The faint impurity peaks before and after leaching did not change significantly, indicating that Si, Ca, Mg, Al, Cr, and other impurity metals had limited leaching rates. No diffraction peaks of elemental vanadium were observed in the XRD patterns of the pellets before and after leaching because the vanadium content in CPVC was only 0.3%. The vanadium content of the pellets was further decreased after leaching, so there were no diffraction peaks due to elemental vanadium.
Figure 6a shows that almost all vanadium in the pellet before leaching existed as V2O5. In the XPS spectrum of V 2p in Figure 6c, the V2O5 peak at a binding energy of 517.1 eV disappeared, and only the faint V2O5 peak at 529.6 eV remained. This indicates that most vanadium dissolved in the leachate during sulfuric acid leaching. Figure 6c shows that the vast majority of Fe in the pellets before leaching existed as Fe2O3, accompanied by a small amount of FeO. Figure 6d shows that the FeO peak at 709.6 eV disappeared, which indicates that divalent iron was almost completely leached. The Fe2O3 peaks at 710.8 eV and 724.4 eV were consistent with the peak intensity in Figure 6c, which indicates that almost no trivalent Fe was leached by sulfuric acid.
The morphology and composition of the pellets before and after leaching are shown in Figure 7a and Figure 8a. It can be seen that the main components of the pellets before and after leaching were Fe, O, Ti, and other elements. V was not detected in any of the samples. Compared with the pellets before leaching, the elemental S content in the pellets after leaching was higher. A highly correlated distribution of Fe, O, and Ti can be seen in the face scan plots of the pellets before and after leaching. This shows that the main phases of the roasted pellets were Fe2O3 and Fe9TiO15, which was consistent with the XRD analysis of the pellets before and after leaching. The very high correlation between the distribution of Si and Ca in Figure 7b indicates that the roasting temperature of the roasted pellets was too high, and a silicate compound was generated. The high correlation between the distribution of S element and Al in Figure 8b indicates that S element in the leaching pellet entered the pellet through the metal sulfate compounds formed by the reaction of metal oxides in the pellet with sulfuric acid. The leaching pellets were desulfurized by the second roasting.
As shown in Figure 9, the crushing strength of the pellets significantly decreased after leaching. After the second roasting stage, the pellet crushing strength exceeded 2000 N again, which meets the requirements of iron making.

6. Conclusions

A two-stage selective cycle leaching process of vanadium with sulfuric acid was developed. The results showed that under these optimal conditions, the leaching rates of vanadium and iron were 75.52% and 0.71%, respectively, demonstrating the selective leaching of vanadium and iron. The concentration of vanadium in the leachate reached 6.80 g/L. Vanadium was directly precipitated. After the second roasting, the crushing strength of the pellets reached 2250 N, which meets the requirements of blast furnace ironmaking. The Eh-pH diagrams of the V-Fe-H2O system at different temperatures were plotted by thermodynamic calculations. It was demonstrated that the selective leaching of vanadium and iron was thermodynamically difficult to achieve by simply changing the conventional acid leaching conditions. It also shows that compared with the conventional heap leaching of vanadium slag, cyclic leaching of pellets can achieve selective leaching. The main phases in the spheres remained unchanged but the iron grade in the pellets after leaching was slightly increased. S in the sulfuric acid solution entered the leaching pellets through an acid leaching reaction and could be removed by the second roasting of the leaching pellets.

Author Contributions

Conceptualization, Z.P.; methodology, Z.P.; software, Z.W.; validation, Z.W.; formal analysis, Z.W; investigation, Z.W.; resources, Z.P.; data curation, Z.W.; writing—original draft preparation, Z.W.; writing—review and editing, Z.W.; visualization, Y.L., Y.Z. and K.X.; supervision, K.X.; project administration, K.X. and Z.W.; funding acquisition, Z.P. All authors have read and agreed to the published version of the manuscript.

Funding

This study did not receive external funding.

Data Availability Statement

The authors confirm that the data supporting the findings of this study are available within the article.

Conflicts of Interest

The authors declare no conflict of interest.

References

  1. Langeslay, R.; Kaphan, D.; Marshall, C.; Stair, P.; Sattelberger, A.; Delferro, M. Catalytic applications of vanadium: A mechanistic perspective. Chem. Rev. 2019, 119, 2128–2191. [Google Scholar] [CrossRef] [PubMed]
  2. Kurtz, R.; Abe, K.; Chernov, V.; Hoelzer, D.; Matsui, H.; Muroga, T.; Odette, G. Recent progress on development of vanadium alloys for fusion. J. Nucl. Mater. 2005, 329, 47–55. [Google Scholar] [CrossRef]
  3. Parasuraman, A.; Lim, T.; Menictas, C. Review of material research and development for vanadium redox flow battery applications. Electrochim. Acta. 2013, 101, 27–40. [Google Scholar] [CrossRef]
  4. Moskalyk, R.; Alfantazi, A. Processing of vanadium: A review. Miner. Eng. 2003, 16, 793–805. [Google Scholar] [CrossRef]
  5. Guo, Y.; Li, H.; Huang, J.; Shen, S.; Wang, C.; Wu, Z.; Xie, B. Efficient separation of V (V) and Cr (VI) in aqua by microemulsion extraction. Sep. Purif. Technol. 2020, 238, 116409. [Google Scholar] [CrossRef]
  6. Wang, G.; Lin, M.M.; Diao, J.; Li, H.Y.; Xie, B.; Li, G. Novel strategy for green comprehensive utilization of vanadium slag with high-content chromium. Acs. Sustain. Chem. Eng. 2019, 7, 18133–18141. [Google Scholar] [CrossRef]
  7. Bian, Z.; Feng, Y.; Li, H. Efficient separation of vanadium, titanium, and iron from vanadium-bearing titanomagnetite by pressurized pyrolysis of ammonium chloride-acid leaching-solvent extraction process. Sep. Purif. Technol. 2021, 255, 117169. [Google Scholar] [CrossRef]
  8. Gao, H.; Jiang, T.; Xu, Y.; Wen, J.; Xue, X. Leaching kinetics of vanadium and chromium during sulfuric acid leaching with microwave and conventional calcification-roasted high chromium vanadium slag. Miner. Process. Extr. Metall. 2020, 41, 22–31. [Google Scholar] [CrossRef]
  9. Li, R.; Liu, T.; Zhang, Y.; Huang, J.; Xu, C. Efficient Extraction of Vanadium from Vanadium-Titanium Magnetite Concentrate by Potassium Salt Roasting Additives. Minerals 2018, 8, 25. [Google Scholar] [CrossRef] [Green Version]
  10. Zou, K.; Xiao, J.; Liang, G.; Huang, W.; Xiong, W. Effective extraction of vanadium from bauxite-type vanadium ore using roasting and leaching. Metals 2021, 11, 1342. [Google Scholar] [CrossRef]
  11. Xiang, J.; Huang, Q.; Lv, X.; Bai, C. Extraction of vanadium from converter slag by two-step sulfuric acid leaching process. J. Clean. Prod. 2018, 170, 1089–1101. [Google Scholar] [CrossRef]
  12. Peng, H. A literature review on leaching and recovery of vanadium (Review). J. Environ. Chem. Eng. 2019, 7, 103313. [Google Scholar] [CrossRef]
  13. Li, M.; Liu, B.; Zheng, S.; Wang, S.; Du, H.; Dreisinger, D.; Zhang, Y. A cleaner vanadium extraction method featuring non-salt roasting and ammonium bicarbonate leaching. J. Clean. Prod. 2017, 149, 206–217. [Google Scholar] [CrossRef]
  14. Liu, S.; Ding, E.; Ning, P.; Xie, G.; Yang, N. Vanadium extraction from roasted vanadium-bearing steel slag via pressure acid leaching. J. Environ. Chem. Eng. 2021, 9, 105195. [Google Scholar] [CrossRef]
  15. Peng, H.; Guo, J.; Zhang, X. Leaching Kinetics of Vanadium from Calcium-Roasting High-Chromium Vanadium Slag Enhanced by Electric Field. Minerals 2020, 5, 17664–17671. [Google Scholar] [CrossRef]
  16. Vaschetti, V.; Eimer, G.; Cánepa, A.; Casuscelli, S. Catalytic performance of V-MCM-41 nanocomposites in liquid phase limonene oxidation: Vanadium leaching mitigation. Microporous Mesoporous Mater. 2021, 311, 110678. [Google Scholar] [CrossRef]
  17. Xiang, J.; Wang, X.; Pei, G. Recovery of vanadium from vanadium slag by composite roasting with CaO/MgO and leaching. Trans. Nonferrous Met. Soc. China 2020, 30, 11. [Google Scholar] [CrossRef]
  18. Zhang, J.; Zhang, W.; Xue, Z. An Environment-Friendly Process Featuring Calcified Roasting and Precipitation Purification to Prepare Vanadium Pentoxide from the Converter Vanadium Slag. Metals 2019, 9, 21. [Google Scholar] [CrossRef] [Green Version]
  19. Wen, J.; Jiang, T.; Wang, J.; Lu, L.; Sun, H. Cleaner extraction of vanadium from vanadium-chromium slag based on MnO2 roasting and manganese recycle. J. Clean. Prod. 2020, 261, 121205. [Google Scholar] [CrossRef]
  20. Zhang, Y.; Zhang, T.; Dreisinger, D.; Lv, C.; Lv, G.; Zhang, W. Recovery of vanadium from calcification roasted-acid leaching tailing by enhanced acid leaching. J. Hazard. Mater. 2019, 369, 632–641. [Google Scholar] [CrossRef]
  21. Wen, J.; Jiang, T.; Zhou, W.; Gao, H.; Xue, X. A cleaner and efficient process for extraction of vanadium from high chromium vanadium slag: Leaching in (NH4)(2)SO4-H2SO4 synergistic system and NH4+ recycle. Sep. Purif. Technol. 2019, 216, 126–135. [Google Scholar] [CrossRef]
  22. Hu, P.; Zhang, Y.; Huang, J.; Liu, T.; Yuan, Y.; Xue, N. Eco-Friendly Leaching and Separation of Vanadium over Iron Impurity from Vanadium-Bearing Shale Using Oxalic Acid as a Leachant. Acs. Sustain. Chem. Eng. 2018, 6, 1900–1908. [Google Scholar] [CrossRef]
  23. Luo, Y.; Che, X.; Cui, X.; Zheng, Q.; Wang, L. Selective leaching of vanadium from V-Ti magnetite concentrates by pellet calcification roasting-H2SO4 leaching process. Int. J. Min. Sci. Technol. 2021, 31, 2095–2686. [Google Scholar] [CrossRef]
  24. Cao, Z.; Ma, B.; Wang, C.; Chen, Y.; Liu, B.; Xing, P.; Zhang, W. E-pH diagrams for the metal-water system at 150 °C: Thermodynamic analysis and application for extraction and separation of target metals from saprolitic laterite(Article). Miner. Eng. 2020, 152, 106365. [Google Scholar] [CrossRef]
  25. Pesterfield, L.; Maddox, J.; Crocker, M.; Schweitzer, G. Pourbaix (E–pH-M) Diagrams in Three Dimensions. J. Chem. Educ. 2012, 89, 891–899. [Google Scholar] [CrossRef]
  26. Chen, D.; Zhao, H.; Hu, G.; Qi, T.; Yu, H.; Zhang, G.; Wang, L.; Wang, W. An extraction process to recover vanadium from low-grade vanadium-bearing titanomagnetite. J. Hazard. Mater. 2015, 294, 35–40. [Google Scholar] [CrossRef]
  27. Deng, S.; Zheng, W. Effect of polymeric flocculants in secondary removal of silicon for high-purity zirconium oxychloride preparation. Chin. J. Appl. Chem. 1999, 16, 85–87. [Google Scholar]
Figure 1. Experimental reaction mechanism diagram.
Minerals 12 01613 g001
Figure 2. E-pH diagram of the V-Fe-H2O system at different temperatures (a) 25 °C, (b) 50 °C, (c) 75 °C and (d) 100 °C in the standard state.
Minerals 12 01613 g002
Figure 3. Effects of (a,c) acid concentration, (b,d) solid–liquid ratio on the formation time of silica gel and leaching rate of vanadium and iron. Effects of (e) acid concentration and (f) standing time on filter time of leaching solution.
Minerals 12 01613 g003
Figure 4. Effects of (a) acid concentration, (b) temperature, (c) solid–liquid ratio and (d) leaching time on the leaching rate of vanadium and iron.
Minerals 12 01613 g004
Figure 5. XRD patterns of before and after leaching pellets.
Minerals 12 01613 g005
Figure 6. XPS patterns of (a) V 2p (roasted pellets), (b) Fe 2p o(roasted pellets), (c) V 2p (leaching pellets), (d) Fe 2p o(leaching pellets).
Minerals 12 01613 g006
Figure 7. SEM (a) Spot scan, (b) Face scan images of pellets before leaching.
Minerals 12 01613 g007
Figure 8. SEM (a) Spot scan, (b) Face scan images of pellets after leaching.
Minerals 12 01613 g008
Figure 9. Pellet crushing strength of roasted pellets, pellets after leaching and secondary roasted pellets.
Minerals 12 01613 g009
Table 1. The main components of CPVC.
ElementFeTiSiCaMgAlCrVNiMn
Content/wt%45.08.02.02.01.01.00.50.30.20.2
Publisher’s Note: MDPI stays neutral with regard to jurisdictional claims in published maps and institutional affiliations.

