Article

Source Apportionment and Probabilistic Ecological Risk of Heavy Metal(loid)s in Sediments in the Mianyang Section of the Fujiang River, China

1
School of Resource and Environment Engineering, Mianyang Normal University, Mianyang 621000, China
2
Department of Environmental Science, School of Geography and Tourism, Shaanxi Normal University, Xi’an 710119, China
*
Author to whom correspondence should be addressed.
Minerals 2022, 12(12), 1513; https://doi.org/10.3390/min12121513
Submission received: 2 November 2022 / Revised: 24 November 2022 / Accepted: 24 November 2022 / Published: 26 November 2022
(This article belongs to the Special Issue Mobility of Potentially Toxic Elements: Environmental Hazards)

Abstract

:
The Mianyang section of the Fujiang River is Mianyang City’s main source of drinking water; therefore, we must ascertain this aquatic ecosystem’s heavy metal(loid)s (HMs) pollution status to protect the health of local residents. We examined 27 surface sediment samples using X-ray fluorescence spectrometry for 10 widely concerned HMs. We applied spatial interpolation, the positive matrix factorization, and a potential ecological risk index to determine the spatial distribution, source, and potential ecological risk of HMs in the sediment, respectively. Our results showed that Mn, Co, Cr, As, Zn, and Pb were disturbed by human activities. The levels of HM content at different sites were different due to the influence of urban human activities. Our source apportionment results showed that As, Cu, Pb, and Mn principally originated from mixed sources of industry and traffic; Ba and Co were chiefly derived from architectural sources; Ni, Zn, and V were mainly from natural sources; and Cr originated from industrial sources. Mixed, architectural, natural, and industrial sources account for 25.62%, 25.93%, 24.52%, and 23.93% of the total HM content, respectively. The HMs were of low ecological risk, which were mainly caused by As and Co. In our study, the mixed source was the priority anthropogenic source, and As and Co were the priority elements for further risk control in the Mianyang section of the Fujiang River.

1. Introduction

Heavy metal(loid)s (HMs) are multi-source in nature, and characterized by toxicity, persistence, non-degradability, and bioaccumulation [1,2]. HM pollution in aquatic ecosystems is a worldwide concern [3,4,5], which mainly results from the natural environment and from anthropogenic activities [1]. The development of industrialization, urbanization, and agricultural modernization has rapidly increased the discharge of various pollutants, which either directly or indirectly enter the aquatic ecosystem. Most HMs are stored in sediment, and when the water environment changes they are released into the water [6]. In addition to causing harm to water bodies and organisms, they also transfer to the human body through the food chain, thereby threatening human health [7,8]. Rivers play an important role in purifying water bodies, providing water resources, regulating the climate, providing flood control, assisting in irrigation, and protecting biodiversity. Pollutants from natural processes and human activities affect rivers around the world, contributing varying levels of HMs [3,4,9,10,11,12]. These pollutants are widely present in river sediments; therefore, we must study the HM content of river sediments, determine their sources, and evaluate their contributions to pollution to assist in protecting the environment and preventing HM contamination.
Many studies have been carried out to determine the levels of HM pollution in river surface sediments [13,14,15,16,17,18]. The receptor model, which takes the polluted area as the research object and determines the contributions of pollutant sources through analyzing sediment samples, is the method most commonly used to analyze the source of HMs in river sediments. The most commonly used receptor models are the multivariate statistical analysis and positive matrix factorization (PMF) methods. Multivariate statistical analysis is commonly used to qualitatively analyze pollutant sources [13,14]. PMF is a quantitative source apportionment model that is commonly used for HMs. For example, Zhu et al. [15] used PMF to identify the pollution sources of HMs in the sediments of the Ziya River and found that the main sources of HMs were related to human activities. Bhuiyan et al. [16] successfully demarcated the major sources of HMs in the sediments of the Buriganga River using PMF. Li et al. [17] quantitatively analyzed the sources of HMs in the sediments of the Le’an River using PMF. In terms of pollution assessment, there are many indexes used to assess HMs pollution in sediments, such as the geoaccumulation index (Igeo), the improved Nemerow index (INI), and potential ecological risk indexes (RI), in addition to the contamination (CF) and enrichment factors (EF), etc. [1,9,18]. Igeo, CF, and EF are mainly used to evaluate individual HM pollution, while RI and INI are used to assess the overall HM contamination levels. In China, studies of HMs pollution in urban river sediment are mainly concentrated on large cities, such as Harbin [14], Lanzhou [19], Anhui [20], and Ningbo [21]. However, little research has been performed on medium-sized emerging industrial cities.
As a typical medium-sized emerging industrial city, Mianyang City has six basic industries, namely medicine, electronics, chemicals, machinery, new energy, and automobile manufacturing [22]. Mianyang’s industry and economy have developed rapidly in recent years, resulting in increasingly serious water pollution, especially HMs pollution [23,24]. Researchers have studied HMs pollution in agricultural soil [23,25], in addition to soil around the businesses [26] in the Fujiang River watershed; however, HMs pollution in the sediments of the Mianyang section of Fujiang River has not been reported. The purposes of this study are: (1) to determine the content levels of 10 HMs (As, Ba, Cr, Co, Cu, Ni, Pb, Mn, Zn, and V) in the sediments of the Mianyang section of the Fujiang River, and to analyze their spatial variation characteristics; (2) to quantitatively ascertain the sources of the HM pollution and their contribution rates by PMF; and (3) to evaluate the pollution and ecological risks of HMs using Igeo, INI, and RI, combined with the Monte Carlo simulation (MCS). Our study aims to provide theoretical guidance to control HM contamination in the sediments of the Fujiang River basin, thereby protecting the aquatic ecological environment.

2. Materials and Methods

2.1. Study Area

Fujiang River (103.30°–106.30° E and 29.10°–33.04° N), the primary tributary of the Jialingjiang River, originates from Xuebaoding between Songpan County and Pingwu County, Sichuan Province; it then flows through Sichuan and Chongqing, and joins the Jialingjiang River in the Hechuan District of Chongqing [27]. The Fujiang River is characterized by abundant precipitation, large runoff, crisscrossing rivers, and well-developed river systems. Mianyang is an important city along the Fujiang River. The urban population of Mianyang in 2020 was about 1.75 million with a density of 1.07 × 10⁴ persons/km2 [28]. The gross domestic product (GDP) of Mianyang City in 2020 was CNY 2.86 × 10¹¹, accounting for 6.47% of Sichuan’s GDP (CNY 4.42 × 10¹² yuan) [28]. We conducted our study along the Fujiang River and its tributary (the Anchang River) in Mianyang’s urban area (Figure 1), referred to as the Mianyang section of the Fujiang River, which is situated in a plain area characterized by flat terrain and small elevation differences. The Fujiang River traverses the study area from the north to the southeast. The Anchang River flows northwest to east and runs into the Fujiang River in the eastern region. The local climate is a humid monsoon climate of the northern subtropical type [27]; the annual mean temperature ranges from 15.40 to 18.13 °C, and the annual precipitation ranges from 545.50 to 1699.70 mm [29]. The study area’s transportation network is well developed, with two railway lines running from north to southwest through the central urban area; furthermore, three expressways pass through the city, and its urban roads constitute a complex and dense urban traffic network. The Mianyang urban area has many emerging industries, namely medicine, electronics, chemicals, machinery, new energy, and automobile manufacturing. East Mianyang is an industrial zone, the zone close to the river’s confluence is a mixed region of residence and commerce, the northwest is an industrial technology zone, the west is a high-tech industrial zone, and the center zone is an integrated area for science and education. We selected a total of 27 sampling points in the Mianyang section of the Fujiang River (Figure 1). A total of 16 sites were located in the Fujiang River, and 11 sites were located in the Anchang River.

2.2. Sampling and Experimental Analysis

We selected 27 sampling stations according to a water function zoning of the Mianyang section of the Fujiang River that considered the location of the urban waterworks’ water intake, the distribution of industrial areas along the river, the inflow of tributaries, and the accessibility of the sampling sites. We collected the sediment samples using a grab sampler in January 2022. The samples included 16 Fujiang River and 11 Anchang River samples, numbered F1–F16 and A1–A11, respectively, which were located by GPS. We removed stones, small sticks, and plant residue from the sediments during the sampling [10]. At each station, we collected about 1 kg of composite sediment (0–10 cm) using a five-point sampling method [30], placed it in a plastic bag, and marked both sides of the bags with numbers.
We poured all of the collected sediment samples into plates and air-dried them [30]. We ground the air-dried sediment samples with ceramic rods and passed them through a 1 mm nylon sieve. We divided the sieved sample into three parts. We used the first part for an analysis of its physical and chemical properties. We used the second part for a speciation analysis of the HMs. We ground the third part and let the samples pass through a 0.075 mm sieve; then, we placed 5 g of the sieved samples and a plastic ring with a 34 mm inner diameter into the mold, pressed the tablet using a tablet presser under 30 t pressure, and finally determined the contents of the 10 HMs using an X-ray fluorescence spectrometer (XRF, Bruker, S8 Tiger, Berlin, Germany) [30]. We used the standard samples (GSS3) and 10% repeated samples for quality control. The error rate of the examined HMs was <5%.

2.3. Spearman Correlation Analysis

The Spearman correlation coefficient is a non-parametric statistical method that uses the rank of two variables for linear correlation analysis; it does not require the distribution of the original variables, and is applicable over a wide range. The formula of the Spearman correlation coefficient is as follows [31]:
r s = 1 6 i = 1 n j i 2 n ( n 2 1 ) ,
where rs is the Spearman rank correlation coefficient between two different HMs, ji = (c1ic2i)2 is the square of the rank difference between two different HMs, and n is the number of samples (n = 27).

2.4. PMF Model

PMF, which is widely used in environmental pollution source analysis [17,32], is calculated using Equation (2) [33,34]:
X i j = k = 1 p G i k F k j + E i j ,
where Xij is the concentration of j element in sample i, p is the number of pollution sources, Gik is the contribution of pollution source k to i sample, Fkj is the j element content in pollution source k, and Eij is the residual matrix.
The ultimate aim is to minimize Q. Q is calculated using Equation (3) [34]:
Q = i = 1 n j = 1 m e i j u i j 2 ,
where uij is the uncertainty of element j in sample i.
The PMF model needs both the input concentration and uncertainty files. When the HM content is below or equal to the corresponding method detection limit (MDL), the formula of uncertainty is Equation (4) [32,34]:
U n c = 5 6 M D L ,
and when each element’s content exceeds the MDL, the uncertainty is calculated by Equation (5) [32,34]:
U n c = ( σ × c ) 2 + ( 0.5 × M D L ) 2 .

2.5. Contamination and Ecological Risk Assessment Methods

2.5.1. Geoaccumulation Index and the Improved Nemerow Index

We used the Geoaccumulation Index (Igeo) proposed by Müller [35] to identify the pollution levels of a single HM. Liu et al. [36,37] proposed the improved Nemerow index (INI), which can be used to evaluate the overall contamination caused by all HMs. We calculated the Igeo and INI using the following Equations (6) and (7), respectively [35,37].
I g e o = log 2 C i K B i ,
I N I = I g e o max 2 + I g e o a v g 2 2 ,
where Ci is the HM i content in the sediment and Bi is the reference value of the HM i; furthermore, in our study, we used Sichuan topsoil as a reference content [38], where K is a constant (K = 1.5). Supplementary Materials Table S1 shows the HM pollution levels based on the Igeo and INI values.

2.5.2. Potential Ecological Risk Index (RI)

RI was proposed by Swedish scholar Håkanson [39], and it is one of the most widely used methods in HM ecological risk assessments [3,4]. In this method, the calculation formulas of the potential ecological risks of individual factors (Ei) and RI were calculated by Equations (8)–(10):
C f i = C i B i ,
E i = T i · C f i ,
R I = i = 1 n E i = i = 1 n T i × C i B i ,
where Cif is the single HM pollution index of HM i and Ti is the toxicity coefficient of HM i. The toxicity coefficients of the HMs are As (10), Ba (1), Cu (5), Co (5), Mn (1), Ni (5), Pb (5), Cr (2), V (2), and Zn (1). Table S2 shows the evaluation criteria of Ei and RI [36,40].

3. Results and Discussion

3.1. HM Content in Sediment

Table 1 shows the contents and reference values of 10 HMs in the Mianyang section of the Fujiang River. The average contents of Ba, Cr, Co, Cu, Ni, Mn, Zn, and V in the sediments were higher than their corresponding reference values, particularly Ba, Co, Mn, and Cr, which were 1.94, 1.52, 1.35, and 1.53 times their corresponding background values, respectively. This demonstrates that the concentrations of Ba, Co, Mn, and Cr were considerably influenced by anthropogenic activities. The coefficient of variation (CV) is a statistic to measure the discrete degree of the observed value, which can reflect the influence of anthropogenic activities on the HM content in sediments. The larger the CV, the greater the disturbance caused by human activities. According to the literature [30,41], CV ≤ 20% means low variability, 21% < CV ≤ 50% exhibites moderate variability, 51% < CV ≤ 100% indicates high variability, and CV > 100% indicates very high variability. The CV order of the 10 HMs was Mn > Co > Cr > As > Zn > Pb > Ni > Cu > V > Ba. The CV values of Mn and Co were 85.91% and 53.55%, respectively, indicating moderate variability, and the spatial distributions of Mn and Co were considerably different and strongly disturbed by human activities. The CV values of V and Ba showed low variability; they were 14.80% and 14.41%, respectively, indicating that the spatial distributions of Ba and V were more uniform, with sources different from those of other elements, and that they were less disturbed by human activities. We found that the mean concentrations of As, Co, Ni, Pb, Zn, and V in the sediments of the Fujiang River were higher than those in the Anchang River, while the opposite was true for the contents of Ba, Cr, Cu, and Mn.
By comparing the average contents of HMs in the sediments of the Mianyang section of the Fujiang River with that of other Chinese rivers, we found that the Fujiang River’s As content was lower than that of other rivers, excluding the Huai River [14,19,20,21,30,42,43,44,45,46,47] (Table 1). However, the concentrations of Ba, Mn, and V were lower than that of the Danjiang River. The Cr content was higher than that of the Danjiang, Pearl, Xiangjiang, Fuchunjiang, Huai, and Hai rivers, and lower than that of the Songhua, Nanfei, Maozhou, and Taizihe rivers. The Co content was higher than that of the Danjiang and Xiangjiang rivers. The Cu content was higher than that of the Songhua, Yellow, Xiangjiang, and Huai rivers, and lower than that of the Danjiang, Nanfei, Pearl, Fuchunjiang, Maozhou, Hai, and Taizihe rivers. The Ni content was lower than that of other reported rivers except for the Songhua, Xiangjiang, and Huai rivers. The Pb content was lower than that of other rivers except for the Songhua River. The Zn content was lower than that of other rivers except for the Songhua, Xiangjiang, Huai, and Hai rivers. We compared the HM content in sediments from the Mianyang section of the Fujiang River with those of reported rivers in other Chinese cities, and discovered that the Mianyang section’s sediment samples had relatively low levels of As, Pb, Ba, Mn, and V; however, the Ni, Zn, Cu, Cr, and Co levels were relatively high, and there were considerable differences in the HM content in the sediments of different rivers, which may be related to the varying natural environments and human activities in different areas.

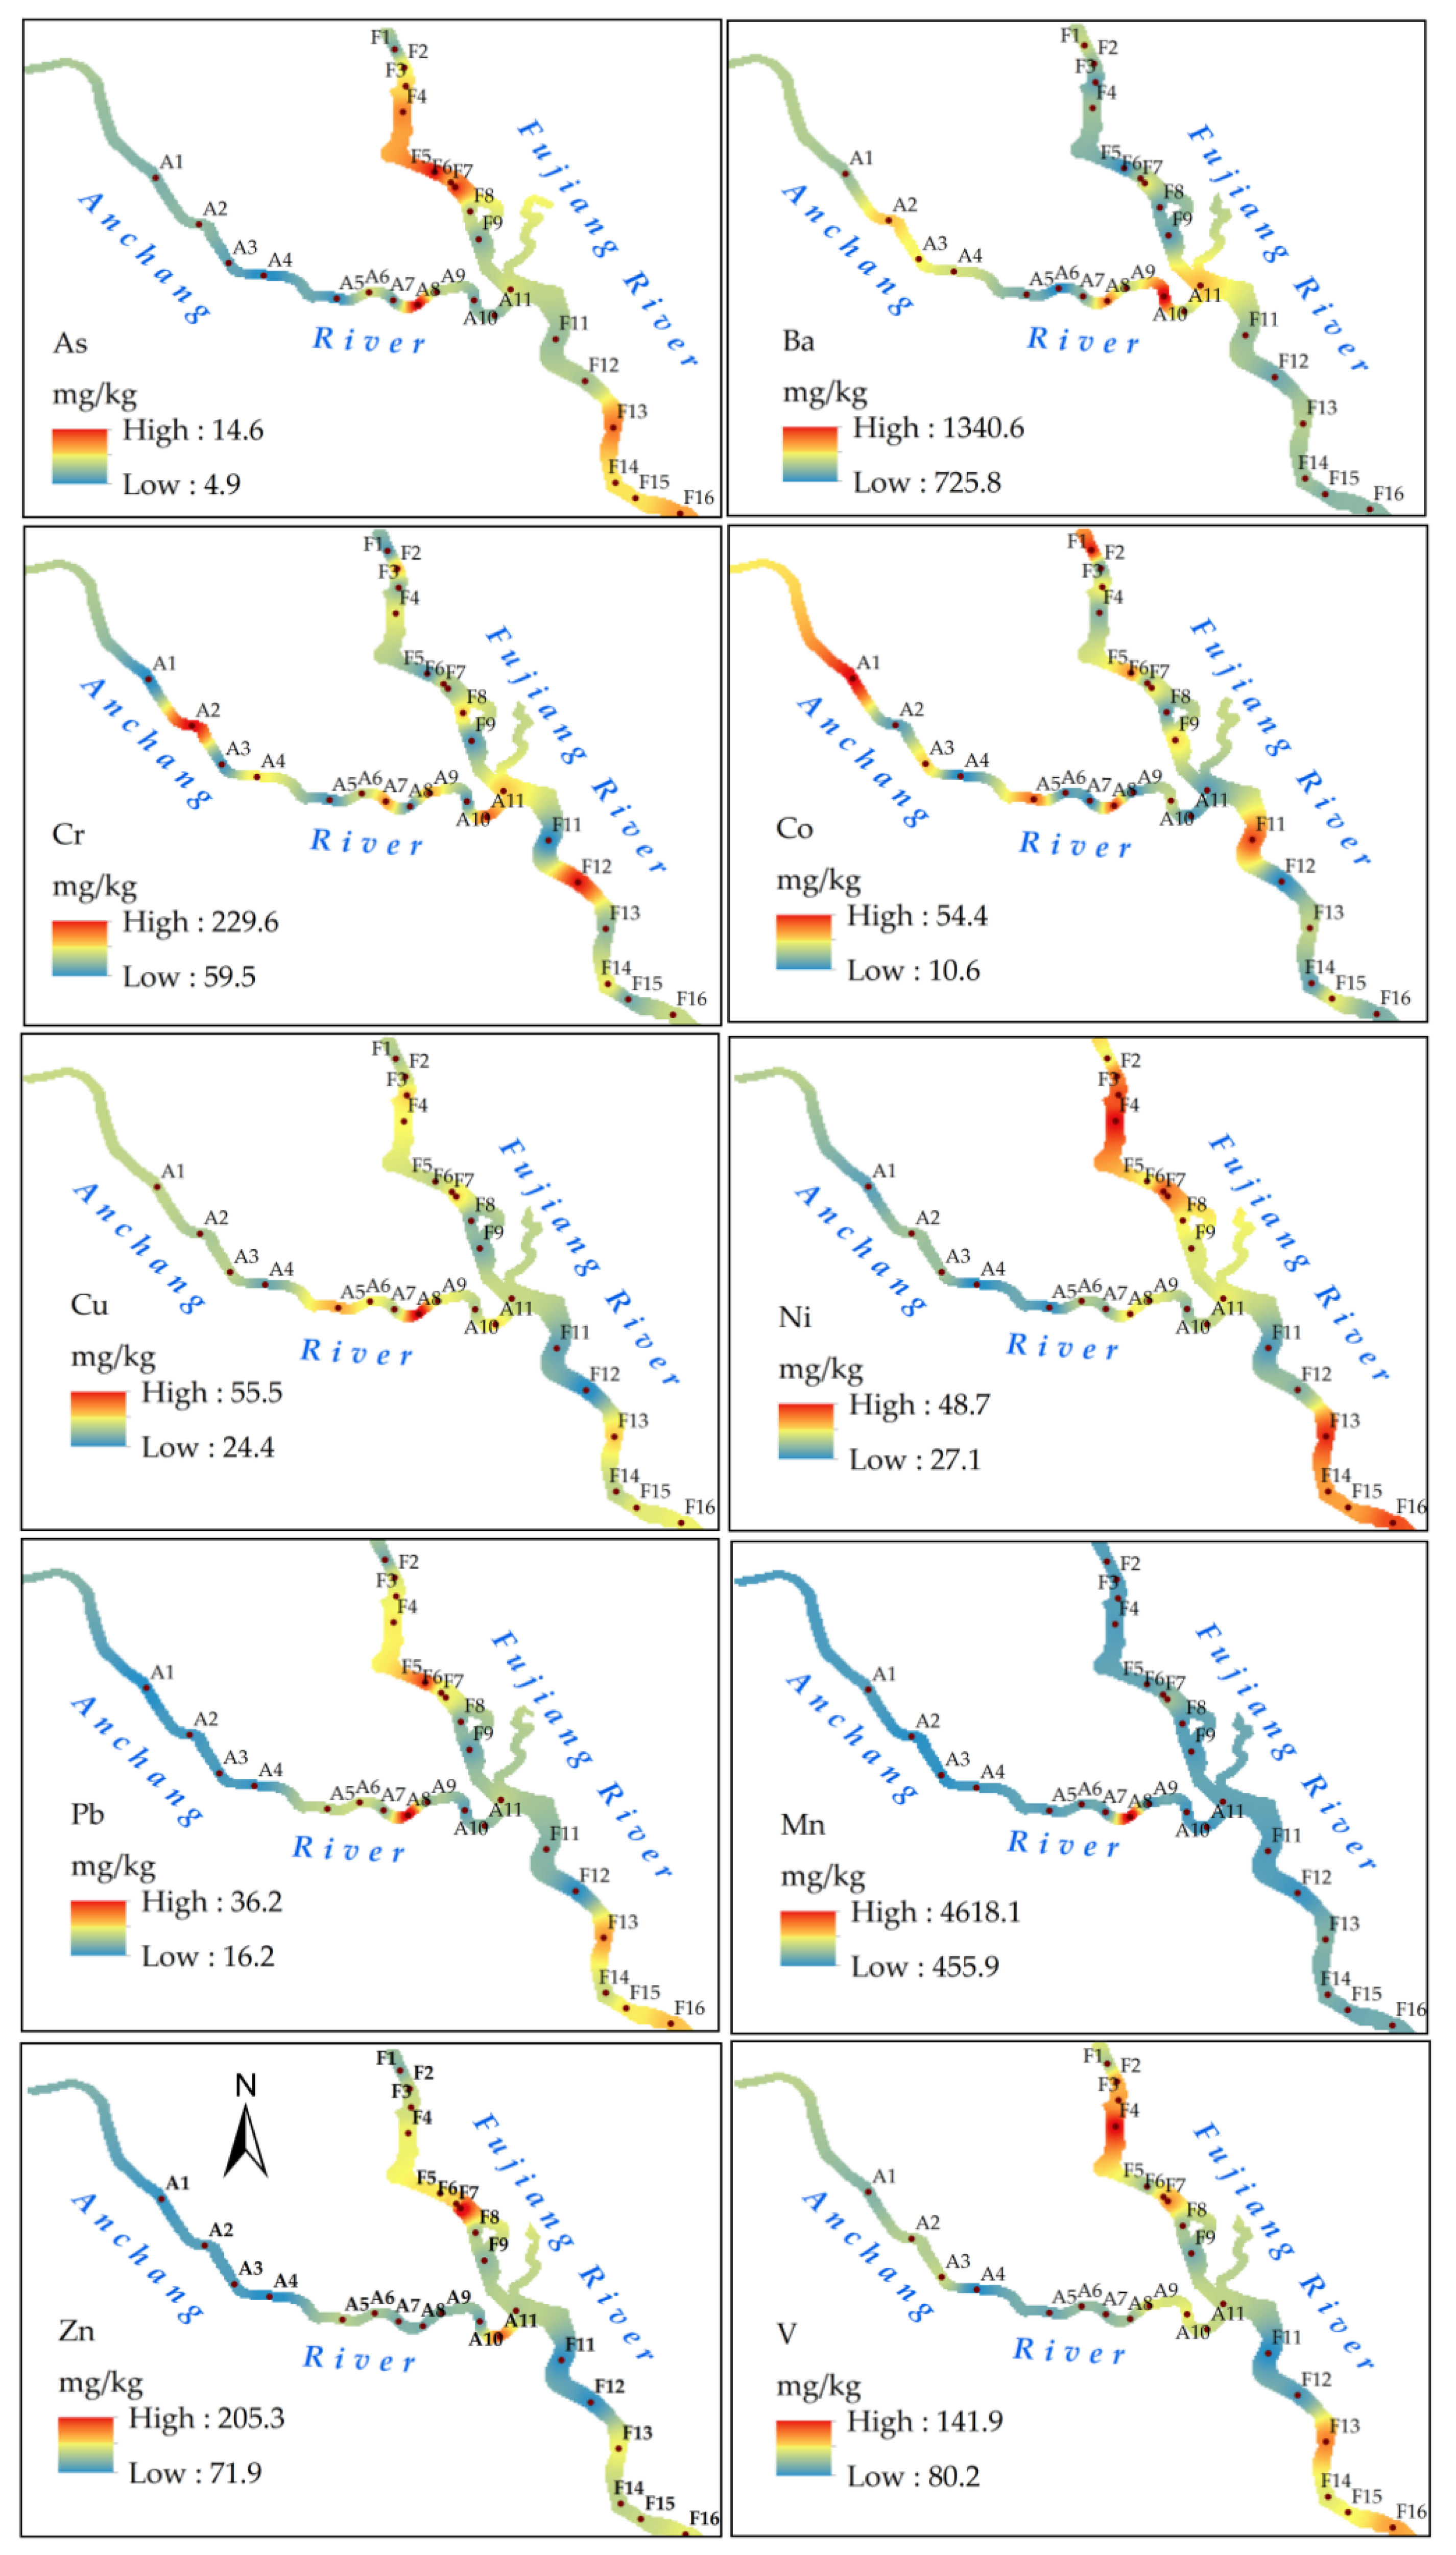
3.2. Spatial Distribution Characteristics

ArcGIS provides a wide range of spatial interpolation methods [48], and we applied ordinary kriging interpolation (OK) to analyze the spatial characteristics of the 10 HMs in the sediments of the Mianyang section of the Fujiang River (Figure 2). We found that the spatial characteristics of As, Cu, Pb, and Mn in the sediments were similar. The concentrations of Mn, As, Pb, and Cu in the sediments of the Fujiang River’s northern and southern sections and the Anchang River’s eastern section were higher than those in other sampling sites. This is mainly related to machinery plants, electronics factories, door and window factories, pharmaceutical companies, stone and steel markets, and other enterprises.
At site A8, the contents of As, Cu, Pb, and Mn were at their highest among all the sampling points, meaning that A8 was the most seriously polluted and influenced by human activities. The As content of samples F4, F5, F6, F7, F13, F16, and A8 were all higher than the background values. A total of 81.48% of the sampling sites had higher Cu content levels than the background values. We found the higher Cu values (40.1–55.5 mg/kg) at sites F3, F7, F13, A5, A8, and A11. Only two sampling sites, namely F5 (32.8 mg/kg) and A8 (36.2 mg/kg), had higher Pb contents than the background value. A total of 70.37% of samples had higher Mn content levels than the background value. We detected high Mn values (853.6–4618.1 mg/kg) at sites F6, F7, F13, F14, F15, F16, and A8. The CV values of Mn, As, Pb, Cu were relatively large, indicating that the contents of these HMs vary greatly among the different sampling sites, possibly because the river sediments in the Mianyang section of the Fujiang River are more strongly affected by human activities.
Ni, Zn, and V have strong consistencies in spatial distribution. Their high values are mainly distributed in the northern (at sites F2, F3, F4, F5, F6, F7, F8, and F9) and southern (at sites F13, F14, F15, and F16) areas of the Fujiang River, in addition to the junction of the Anchang and Fujiang rivers (at sites A9, A10, A11, and F10). A total of 74.07% of Ni and Zn samples, and 59.26% of V samples, had slightly higher content levels than the background values. We found high Ni values (45.7–48.7 mg/kg) at sites F3, F4, F6, F13, and F16; high Zn values (205.3–158.0 mg/kg) at sites F3, F4, F5, F6, F7, F13, F15, F16, and A11; and high V values (110.0–141.9 mg/kg) at sites F2, F3, F4, F6, F7, F13, F15, and F16. The CV values (Table 1) of Ni, Zn, and V were relatively small, showing that their spatial distributions had no considerable differences because their sources may be different from those of the other HMs; therefore, they are less disturbed by human activities.
Ba and Co had higher concentrations than in their reference values in all and 59.26% of samples, respectively. We found high Ba values (960.0–1340.6 mg/kg) at sites A2, A3, A4, A8, A10, F7, and F10, and high Co values of Co (42.8–54.4 mg/kg) at sites A1, A5, A8, F1, F5, and F11. We also found that the Cr contents in 66.67% of the samples exceeded the background value, and that high Cr values (161.3–229.6 mg/kg) were mainly concentrated in the western (at site A2) and eastern sections (at sites A7, A9, and A11) of the Anchang River, and the southern section of Fujiang River (at sites F10 and F12). The high Cr value sites are distributed along the river where there are many businesses and industrial sites, such as power engineering; electronics, automobile, building materials, and machinery factories, and steel door and window processing enterprises.
The spatial distributions of HMs in the sediments of the Mianyang section of the Fujiang River show that the HM content varies greatly in different river sections, indicating that the river sediments are largely affected by human activities.

3.3. Spearman Correlation Analysis

High correlation coefficients between different HMs shows that they may have the same source [9]. We calculated the Spearman correlation coefficients of 10 HMs in the sediments of the Mianyang section of the Fujiang River using SPSS 25.0 software. Our results are shown in Table 2. Significant positive correlations exist between the following HM pairs at a p < 0.01 level: As–Cu (0.524), As–Ni (0.830), As–Pb (0.843), As–Mn (0.752), As–Zn (0.653), As–V (0.595), Cu–Ni (0.521), Cu–Pb (0.711), Cu–Mn (0.545), Cu–Zn (0.658), Cu–V (0.557), Ni–Pb (0.780), Ni–Mn (0.659), Ni–Zn (0.758), Ni–V (0.842), Pb–Mn (0.787), Pb–Zn (0.755), Pb–V (0.577), Mn–Zn (0.571), and Zn–V(0.685). The Co–Cr (-0.891) pair displayed a remarkably significant negative correlation at p < 0.01. The Mn–V (0.414) pair was positively correlated at p < 0.05.

3.4. Source Apportionment

3.4.1. Source Apportionment Based on PMF

The EPA PMF 5.0 model was applied to analyze the sources of the 10 HMs in sediments from the Mianyang section of the Fujiang River. The number of factors was determined to be 4 and the running time to be 20, and stable results were obtained. Table 3 and Figure 3 show the composition spectra and contribution rates of 10 HMs in four sources.
Factor 1’s source composition spectrum showed that As, Cu, Pb, and Mn had higher concentration values than the other factors: the contribution rates of factor 1 to these four HMs were 45.04%, 40.68%, 48.94%, and 52.16%, respectively. Moreover, Pb, As, Cu, and Mn have significant positive correlations (Table 2), which were divided into the same factor in the PMF analysis, indicating that As, Cu, Mn, and Pb may have the same source. The CV values of As, Cu, Mn, and Pb indicate that they are strongly influenced by human activities. The illegal discharge of wastewater from metallurgical and chemical enterprises, as well as the abuse of pesticides and fertilizers, have resulted in a rapid increase in As content in the environment [30,47]. The anthropogenic sources of Cu are primarily mechanical manufacturing, light industry, battery production, and the defense industry [49,50]. Pb is commonly used in machinery, light industry, automotive lubricants, and brass car radiators; therefore, the wear of vehicle parts leads to an increase in the levels of environmental Pb [13,51]. Mn is mainly used in the production of alloys, pesticides, preservatives, and pharmaceuticals, and anthropogenic sources of Mn include the iron and steel, chemical, and electronic industries, in addition to non-ferrous smelting [51]. The levels of As, Cu, Mn, and Pb have a strong consistency in terms of their spatial distribution, and their high-value points are primarily located in the northern and southern sections of the Fujiang River and the eastern section of the Anchang River, which indicates that As, Cu, Mn, and Pb have considerable foreign input at these loci. Along the Fujiang River’s north bank, there is a traditional industrial zone with factories for electronics, machinery, and windows and doors, as well as pharmaceutical companies. Along the Fujiang River’s southern reaches, there is an economic and technological development zone with chemical and photovoltaic plants. The Anchang River’s eastern section is located in a high-tech industrial zone, and along the river there are steel and stone markets, power plants company, and electronics, machinery, and metal processing factories; furthermore, these areas also have large quantities of roads and are heavily affected by traffic. According to previous research regarding the concentrations and distributions of As, Cu, Pb, and Mn, we concluded that As, Cu, Pb, and Mn were primarily influenced by the mixed sources (Factor 1) of industry and traffic.
Table 3 shows that the Ba and Co concentrations for Factor 2 were higher than for other factors, and that the contribution rates of factor 2 to Ba and Co were 50.10% and 51.48%, respectively. Table 1 shows that Co and Ba had higher concentration values than their reference values in all and 59.26% of the samples, respectively. The CV values of Ba and Co suggest that they were considerably affected by anthropogenic activities. Ba and Co are components of alloys, ceramics, coatings, glass, and cement [52,53], which are widely applied in the electronic, mechanical, chemical, and ceramic industries. We found that large amounts of Ba and Co was released when alloys, ceramics, coatings, glass, and cement were corroded or peeled off in the process of production or use [52,53], causing environmental pollution. The high-value points for Ba and Co were primarily located in the river sampling sites near towns or densely populated residential areas, which were greatly affected by human activity and urban construction. Ba and Co are released as a consequence of building construction and decoration processes, in addition to the weathering and corrosion of building materials. Ba and Co are deposited in rivers through atmospheric deposition and rainwater, and therefore accumulate in river sediments. Based on our PMF analysis results, together with content, spatial distribution, and correlation analyses, we deduced that Ba and Co in the sediments of the Mianyang section of the Fujiang River mainly derived from architectural sources (Factor 2).
The high-contribution HMs for Factor 3 were Ni, Zn, and V, with values of 50.73%, 43.61%, and 53.65%, respectively. Factor 3’s source composition spectrum also showed that Ni, Zn, and V had higher concentration values than for the other factors. The Ni, Zn, and V contents of the sediments were close to or slightly higher than their reference values, and their CV values indicated that Ni, Zn, and V were evenly distributed in space, with relatively small external influences. According to our concentration, CV, spatial distribution, and PMF analyses, we inferred that the concentrations of Ni, Zn, and V were mainly controlled by the soil formation process; therefore, and Ni, Zn, and V contents are mostly from natural sources (Factor 3).
The contribution of Factor 4 to Cr was as high as 43.08%. A total of 66.67% of Cr samples had higher contents than their background values, and the CV value was 41.86%, indicating that Cr in the sediments of the Mianyang section of the Fujiang River mainly came from anthropogenic sources. We found high contribution rates of Cr at sites A7, A9, A11, F10, and F12, where there are high-tech industrial areas and economic and technological development zones along the river, further confirming that Cr is mainly affected by anthropogenic sources. Cr is mainly used in stainless steel, alloys, tanning, pickling, electroplating, and automobile parts production [12,50]. Our investigation found that there are steel and stone markets, power engineering and electronic plants, machinery and automobile factories, and plastic and steel door and window processing plants along the river in high-value areas, indicating that the main source of Cr pollution is industrial activities (Factor 4).
In the sediments of the Mianyang section of the Fujiang River, mixed, building, natural, and industrial sources account for 25.62%, 25.93%, 24.52%, and 23.93% of the total pollution sources, respectively.

3.4.2. Spatial Distribution of the Source Contribution Rate

We obtained the contribution rates of each sediment sample’s source using the PMF method to understand the main impact areas of different contamination sources. We plotted the spatial characteristics of each source contribution using ArcGIS software (Figure 4). Factor 1 is a mixed source representing industry and traffic. Most of the Fujiang River and part of the Anchang River are affected by the mixed source. Factor 2 is a construction source that affects most sites of the Anchang River and some sites of the Fujiang River. The construction source’s high-value zones are mainly located along the Anchang River, which is a new area of Mianyang’s urban development (urban expansion direction). The river’s sediment was considerably affected by the city’s intensive construction along the river. The riverbank of sampling site F1 is under construction, and the banks of sampling points F9, F10, and F11 are newly built commercial and residential areas with high concentrations of buildings; therefore, we determined that urban construction has a considerable impact on river sediment pollution.
Factor 3 represents natural sources. Except for sampling sites A1, A3, A5, A8, A10, and F11, the other sampling sites’ source contributions are similar. The whole of the Fujiang River and most of the Anchang River are greatly affected by natural sources. Factor 4 represents industrial sources. The high-value contribution zones of industrial sources are mainly located in the middle and eastern sections of the Anchang River and the southern section of the Fujiang River. The middle and eastern sections of the Anchang River feature high-tech industrial zones, and along the southern reaches of the Fujiang River is an economic and technological development zone that contains many steel and stone factories, electric power projects, electronics and machinery factories, and plastic, steel door, and window processing enterprises.

3.5. Results of Contamination and Potential Ecological Risk Assessments

3.5.1. Results of Contamination Assessment

The spatial characteristics of each HM’s contamination levels based on the Igeo value are shown in Figure S1. The Igeo of As, Ni, Pb, and V at 27 sampling points is less than 0, which belongs to the “uncontaminated” level. In all sampling sites, Ba is present at the “uncontaminated to moderately contaminated” level. Cr, Cu, and Zn exhibited “uncontaminated to moderately contaminated” states in 52%, 4%, and 7% of the samples, respectively. In 37% and 7% of the samples, Co presented “uncontaminated to moderately contaminated” and “moderately contaminated” states, respectively. In 11% and 4% of the samples, Mn presented “uncontaminated to moderately contaminated” and “moderately to heavily contaminated” levels, respectively.
Figure 5 shows the spatial distributions of the overall pollution of 10 HMs based on INI. A total of 11 sampling sites presented an “uncontaminated” state, 15 sampling sites were at a “uncontaminated to moderately contaminated” level, and 1 sample site (A8) was at a “moderately contaminated” level.

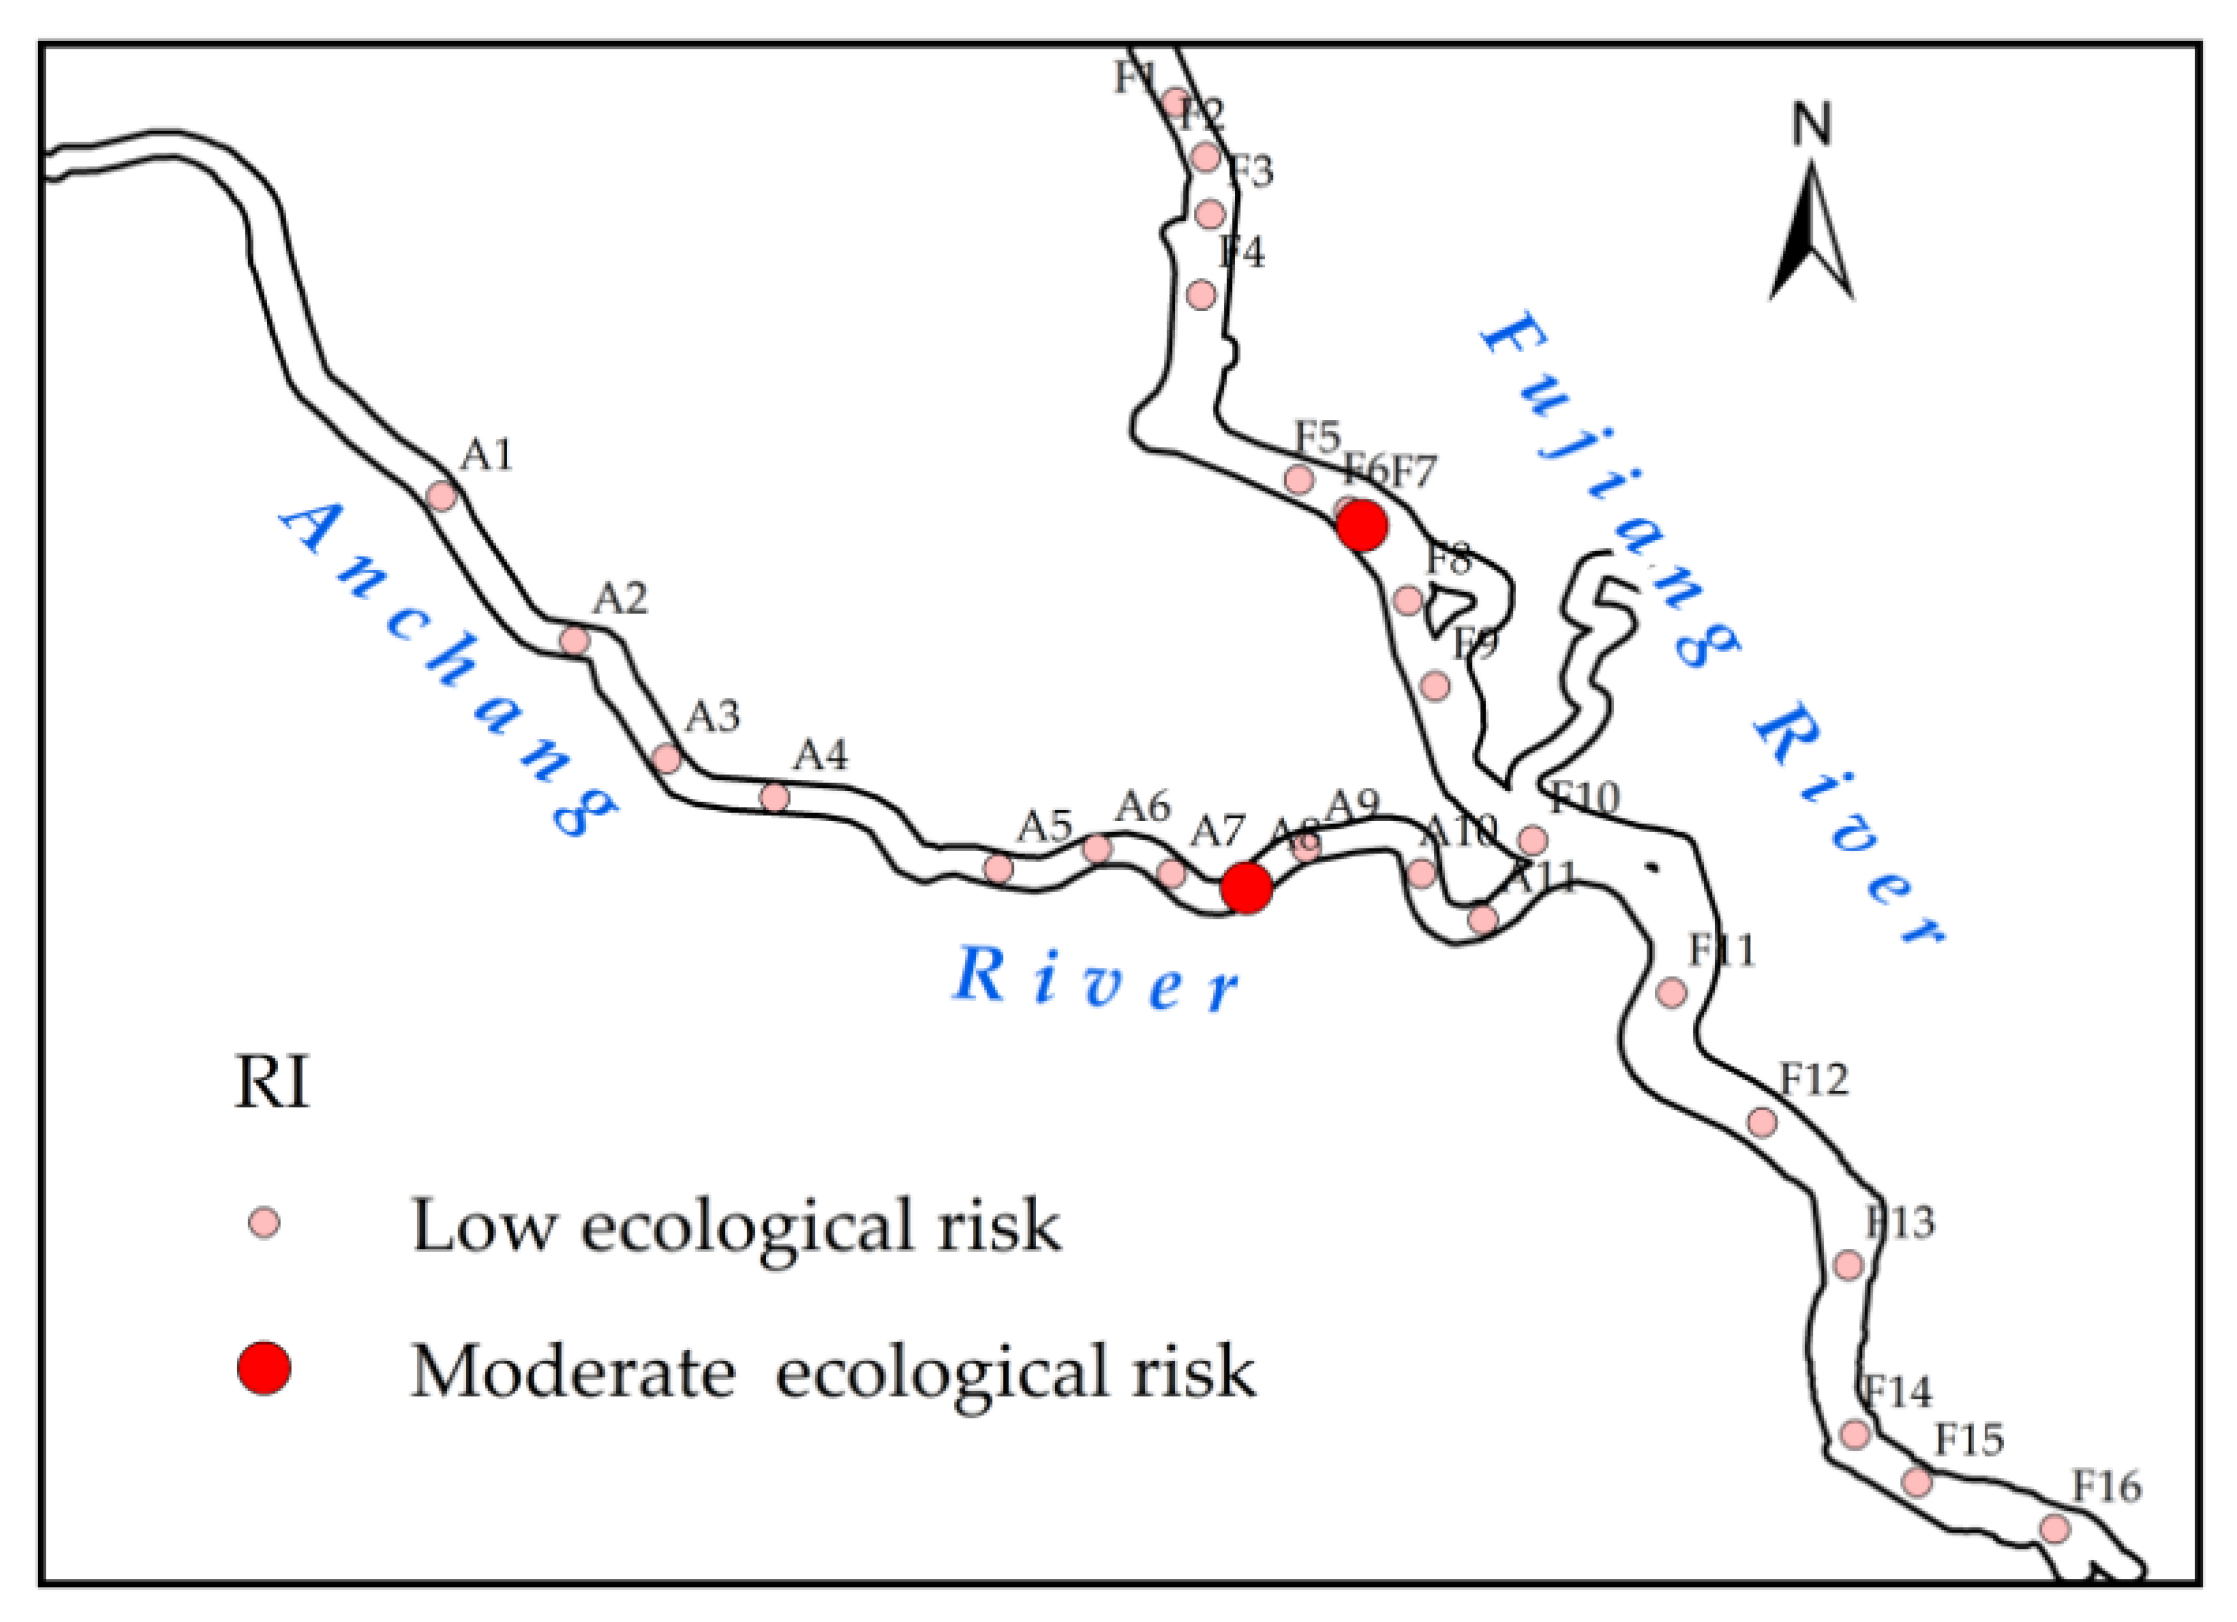
3.5.2. Ecological Risk Assessment Results

Figure S2 shows that the Ei values of As, Ba, Cr, Cu, Ni, Pb, Mn, Zn, and V in all sampling points were lower than 15, indicating low ecological risk. However, the 7% Ei and 93% Ei values of Co showed moderate and low ecological risks, respectively. The average Ei value of the 10 HMs were in the following order: As > Co > Cu > Ni > Pb > Cr > V > Ba > Mn > Zn, indicating that the As risk was the highest and Zn was the lowest.
Figure 6 shows the spatial characteristics of RI. Two sampling sites (F7 and A8) were in a state of moderate ecological risk, while the rest of the sampling sites were in a state of low ecological risk. The RI results were consistent with those of INI; however, there were some differences between them. For example, F7 was at an “uncontaminated to moderately contaminated” level in the INI evaluation; however, it presented moderate ecological risk in our RI analysis. The INI value is mainly related to HM content and their corresponding background values, while the RI value is related to HMs biotoxicity coefficients as well as content, which may result in some differences between our two evaluation results.

3.5.3. Assessment of Potential Ecological Risk Based on MCS

We analyzed the distribution characteristics of 10 HMs using Crystal Ball software, and the fitting results are displayed in Table S3. We selected the contents of 10 HMs in sediments as the uncertainty parameters, defined them, set RI as the target variable, and then calculated according to Equation (6). We performed a probability range and sensitivity analysis of the potential ecological risks of HMs by Monte Carlo simulation using Crystal Ball software (Figure S3), and the confidence space at a 95% RI level was (39.12, 45.73). Our RI simulation results (42.07) were basically consistent with our deterministic calculation results (40.77), indicating that the simulation results showing low ecological risk were reliable. Our sensitivity analysis chart (Figure S3) shows that As plays a dominant role in the potential ecological risk index (RI), followed by Co, with sensitivity coefficients of 46.1% and 42.7%, respectively.

3.5.4. Source-Oriented Potential Ecological Risk Assessment

Quantifying the contributions of HMs from different sources to potential ecological risks means that policy makers can prioritize controlling the pollution sources with greater influence, minimizing potential ecological risks. We evaluated potential ecological risks using the contribution rates of different sources according to the PMF model’s source appointment results. Figure 7 shows that the mixed source, namely industry and traffic, was the main potential ecological risk source, followed by the natural, architectural, and industrial sources. The contribution of individual HMs to potential ecological risks were in the following order: As (20.57%) > Co (18.71%) > Cu (14.03%) > Ni (14.02%) > Pb (8.84%) > Cr (7.52%) > V (5.28%) > Ba (4.75%) > Mn (3.31%) > Zn (2.97%), indicating that As and Co contributed considerably to potential ecological risks, which was consistent with our sensitivity analysis results (Figure S3). Therefore, we identified the mixed source as the priority pollution source, with As and Co considered the priority pollutants for further risk control.

4. Conclusions

Our analysis revealed that the sediments of the Mianyang section of the Fujiang River were highly contaminated with HMs, especially with Ba, Co, Mn, and Cr. Our spatial distribution analysis showed that the HM contents in different areas of the river differed considerably, and were strongly affected by local human activities. Our investigation revealed that the HM content in sediments was high in the areas with high levels of human activities along the river, namely industry, construction, and traffic. The results of our source appointment showed that As, Cu, Pb, and Mn in sediments were mainly from a mixed source, namely industrial and traffic activities; Ba and Co in sediments were mainly influenced by an architectural source; Ni, Zn, and V were mainly produced by a natural source; and Cr primarily originated from an industrial source. Mixed, architectural, natural, and industrial sources account for 25.62%, 25.93%, 24.52%, and 23.93% of the total HM contents, respectively. The potential ecological risks of the exhibited HMs were at a low level, and were mainly caused by As and Co. In our study, we identified the mixed source of industry and traffic as the priority anthropogenic source, and we identified As and Co as the priority elements for further risk control. Our findings are helpful for a further understanding of the water environment characteristics of the Mianyang section of the Fujiang River, and contribute to improving the management of urban aquatic ecosystems.
Due to the limitations of XRF, we did not study Hg and Cd in our research; however, we will analyze these HMs in future work, along with the mineralogy of the sediment samples and the speciation of HMs. In addition, the biological accumulation of HMs in the aquatic ecosystem will be further studied in future work.

Supplementary Materials

The following supporting information can be downloaded at: https://www.mdpi.com/article/10.3390/min12121513/s1, Figure S1: The Igeo level of HMs in sediments in the Mianyang section of the Fujiang River; Figure S2: The Ei degree of HMs in sediments in the Mianyang section of the Fujiang River; Figure S3: Probability distribution and sensitivity analysis of the potential ecological risk index; Table S1: Pollution level of the geo-accumulation index (Igeo) value and improved Nemerow index (INI); Table S2: Grade of potential ecological risk index; Table S3: Distribution test and fitting results of HM contents.

Author Contributions

Conceptualization, H.D. and X.L.; methodology, H.D. and X.L.; software, H.D.; validation, H.D. and X.L.; formal analysis, H.D. and X.L.; investigation, H.D.; resources, H.D.; data curation, H.D.; writing—original draft preparation, H.D.; writing—review and editing, X.L.; visualization, X.L.; supervision, X.L.; project administration, X.L.; funding acquisition, X.L. All authors have read and agreed to the published version of the manuscript.

Funding

This research was funded by the National Natural Science Foundation of China, grant number 42277487; the Research and Development Key Project of Shaanxi Province, grant number 2020SF-433, and the Foundation of Mianyang Normal University, grant number QD2016A001.

Data Availability Statement

The datasets used and/or analyzed during the current study are available from the corresponding author on reasonable request.

Acknowledgments

All the experiments were conducted in the Environmental Science Lab of Shaanxi Normal University. We thank Jiang Yun for his help with the experiments, and thank Bo Yu for providing the SPSS software.

Conflicts of Interest

The authors declare no conflict of interest.

References

  1. Gkaragkouni, A.; Sergiou, S.; Geraga, M.; Papaefthymiou, H.; Christodoulou, D.; Papatheodorou, G. Heavy metal distribution, sources and contamination assessment in polluted marine sediments: Keratsini Outfall Sewer Area, Saronikos Gulf, Greece. Water Air Soil Pollut. 2021, 232, 477. [Google Scholar] [CrossRef]
  2. Varol, M. Assessment of heavy metal contamination in sediments of the Tigris River (Turkey) using pollution indices and multivariate statistical techniques. J. Hazard. Mater. 2011, 195, 355–364. [Google Scholar] [CrossRef]
  3. Jaskuła, J.; Sojka, M.; Fiedler, M.; Wróżyński, R. Analysis of spatial variability of river bottom sediment pollution with heavy metals and assessment of potential ecological hazard for the Warta River, Poland. Minerals 2021, 11, 327. [Google Scholar] [CrossRef]
  4. Zhao, D.; Chen, Y.; Zhang, W.; Chen, X.; Chen, X.; Zhang, F. Concentration, spatial distribution and potential ecological risk of heavy metals in stream sediments of the Misiones Province, Argentina. Minerals 2021, 11, 1112. [Google Scholar] [CrossRef]
  5. Varol, M. Spatio-temporal changes in surface water quality and sediment phosphorus content of a large reservoir in turkey. Environ. Pollut. 2020, 259, 113860. [Google Scholar] [CrossRef]
  6. Zhu, D.; Wu, S.; Han, J.; Wang, L.; Qi, M. Evaluation of nutrients and heavy metals in the sediments of the Heer River, Shenzhen, China. Environ. Monit. Assess. 2018, 190, 380. [Google Scholar] [CrossRef]
  7. Goswami, A.P.; Kalamdhad, A.S. Mobility and risk assessment of heavy metals in benthic sediments using contamination factors, positive matrix factorisation (PMF) receptor model, and human health risk assessment. Environ. Sci. Pollut. Res. 2022. [Google Scholar] [CrossRef]
  8. Proshad, R.; Kormoker, T.; Al, M.A.; Islam, M.; Khadka, S.; Idris, A. Receptor model-based source apportionment and ecological risk of metals in sediments of an urban river in bangladesh. J. Hazard. Mater. 2022, 423, 127030. [Google Scholar] [CrossRef]
  9. Ren, H.R.; Tao, L.; Guo, Y.C.; Ren, J. Spatial distribution and ecotoxicological assessment of heavy metals in bottom sediments of Yellow River from inner Mongolia, China. Geochem. Int. 2021, 59, 1354–1362. [Google Scholar] [CrossRef]
  10. Jiménez-Oyola, S.; García-Martínez, M.J.; Ortega, M.F.; Chavez, E.; Romero, P.; García-Garizabal, I.; Bolonio, D. Ecological and probabilistic human health risk assessment of heavy metal(loid)s in river sediments affected by mining activities in Ecuador. Environ. Geochem. Health 2021, 43, 4459–4474. [Google Scholar] [CrossRef]
  11. Yang, C.; Wang, L.; Liu, Y.; Shan, B.; Sun, D. Spatial distribution, potential risks and source identification of heavy metals in the coastal sediments of the northern Beibu Gulf, south China sea. Int. J. Environ. Res. Public Health 2022, 19, 10205. [Google Scholar] [CrossRef] [PubMed]
  12. Kumar, D.; Malik, D.S.; Kumar, N.; Gupta, N.; Gupta, V. Spatial changes in water and heavy metal contamination in water and sediment of river Ganga in the river belt Haridwar to Kanpur. Environ. Geochem. Health 2020, 42, 2059–2079. [Google Scholar] [CrossRef] [PubMed]
  13. Liu, Y.; Huang, H.; Sun, T.; Yuan, Y.; Pan, Y.; Xie, Y.; Fan, Z.; Wang, X. Comprehensive risk assessment and source apportionment of heavy metal contamination in the surface sediment of the Yangtze River Anqing section, China. Environ. Earth Sci. 2018, 77, 493. [Google Scholar] [CrossRef]
  14. Li, N.; Tian, Y.; Zhang, J.; Zuo, W.; Zhan, W.; Zhang, J. Heavy metal contamination status and source apportionment in sediments of Songhua River Harbin region, Northeast China. Environ. Sci. Pollut. Res. 2017, 24, 3214–3225. [Google Scholar] [CrossRef] [PubMed]
  15. Zhu, X.; Shan, B.; Tang, W. Heavy metal in sediments of Ziya River in northern China: Distribution, potential risks, and source apportionment. Environ. Sci. Pollut. Res. 2016, 23, 23511–23521. [Google Scholar] [CrossRef]
  16. Bhuiyan, M.A.H.; Dampare, S.B.; Islam, M.A.; Suzuki, S. Source apportionment and pollution evaluation of heavy metals in water and sediments of Buriganga River, Bangladesh, using multivariate analysis and pollution evaluation indices. Environ. Monit. Assess. 2015, 187, 4075. [Google Scholar] [CrossRef]
  17. Li, J.; Song, L.; Chen, H.; Wu, J.; Teng, Y. Source apportionment of potential ecological risk posed by trace metals in the sediment of the Le’an River, China. J. Soils Sediments 2020, 20, 2460–2470. [Google Scholar] [CrossRef]
  18. Huang, J.; Wu, Y.; Sun, J.; Li, X.; Geng, X.; Zhao, M.; Sun, T.; Fan, Z. Health risk assessment of heavy metal(loid)s in park soils of the largest megacity in China by using Monte Carlo simulation coupled with Positive matrix factorization model. J. Hazard. Mater. 2021, 415, 125629. [Google Scholar] [CrossRef]
  19. Wang, Y.; Chen, P.; Cui, R.; Si, W.; Zhang, Y.; Ji, W. Heavy metal concentrations in water, sediment, and tissues of two fish species (Triplohysa pappenheimi, Gobio hwanghensis) from the Lanzhou section of the Yellow River, China. Environ. Monit. Assess. 2010, 165, 97–102. [Google Scholar] [CrossRef]
  20. Shao, S.; Xue, L.; Liu, C.; Shang, J.; Wang, Z.; He, X.; Fan, C. Assessment of heavy metals in sediment in a heavily polluted urban river in the Chaohu Basin, China. Chin. J. Ocean. Limnol. 2016, 34, 526–538. [Google Scholar]
  21. Liu, M.; Wang, Z.; Wang, J.; Hu, Z.; Wu, L. Heavy metal(loid) risk assessment and nutrient characteristics of sediments from an urban river in Ningbo, China. Arab. J. Geosci. 2021, 14, 864. [Google Scholar] [CrossRef]
  22. Jun, R.; Wei, H. Research on Mianyang positioning and economic development strategy in Chengdu-Chongqing double city economic circle. Can. Soc. Sci. 2021, 17, 1–5. [Google Scholar]
  23. Sheng, J.; Yu, P.; Zhang, H.; Wang, Z. Spatial variability of soil Cd content based on IDW and RBF in Fujiang River, Mianyang, China. J. Soils Sediments 2021, 21, 419–429. [Google Scholar] [CrossRef]
  24. Zhang, Y.; He, Z.; Tian, H.; Huang, X.; Zhang, Z.; Liu, Y.; Xiao, Y.; Li, R. Hydrochemistry appraisal, quality assessment and health risk evaluation of shallow groundwater in the Mianyang area of Sichuan Basin, southwestern China. Environ. Earth Sci. 2021, 80, 576. [Google Scholar] [CrossRef]
  25. Ouyang, C.L.; He, Y.; He, D. A case study of Cd, Hg and Pb spatial distributions by RS and GIS in agriculture soil. Adv. Mat. Res. 2013, 641–642, 152–155. [Google Scholar] [CrossRef]
  26. Ren, J.; Fan, K.; Shi, C.; Zhang, Y.; Wu, Q.; Wang, B. Analysis of correlation and variation of cadmium in soil around enterprises in Fujiang River Basin. Environ. Earth Sci. 2022, 81, 199. [Google Scholar]
  27. Zhang, X.; Du, H.; Wang, Y.; Chen, Y.; Ma, L.; Dong, T. Watershed landscape ecological risk assessment and landscape pattern optimization: Take Fujiang River Basin as an example. Hum. Ecol. Risk Assess. 2021, 27, 2254–2276. [Google Scholar] [CrossRef]
  28. NBSPRC (National Bureau of Statistics of the People’s Republic of China). China City Statistical Yearbook; China Statistics Press: Beijing, China, 2020; pp. 18–74.
  29. CMDSC (China Meteorological Data Service Center). Hourly Observation Data of China Ground Weather Station. 1961–2020. Available online: http://data.cma.cn (accessed on 2 August 2022).
  30. Zhuang, S.; Lu, X.; Yu, B.; Fan, X.; Yang, Y. Ascertaining the pollution, ecological risk and source of metal(loid)s in the upstream sediment of danjiang river, china. Ecol. Indic. 2021, 125, 107502. [Google Scholar] [CrossRef]
  31. Kumar, J.A.; Abirami, S. Aspect-based opinion ranking framework for product reviews using a spearman's rank correlation coefficient method. Inform. Sci. 2018, 460–461, 23–41. [Google Scholar]
  32. Li, W.; Wu, J.; Zhou, C.; Nsabimana, A. Groundwater pollution source identification and apportionment using PMF and PCA-APCS-MLR receptor models in Tongchuan City, China. Arch. Environ. Contam. Toxicol. 2021, 81, 397–413. [Google Scholar] [CrossRef]
  33. Paatero, P.; Tapper, U. Positive matrix factorization: A non-negative factor model with optimal utilization of error estimates of data values. Environmetrics 1994, 5, 111–126. [Google Scholar] [CrossRef]
  34. Chen, X.; Lu, X. Contamination characteristics and source apportionment of heavy metals in topsoil from an area in Xi’an city, China. Ecotoxicol. Environ. Saf. 2018, 151, 153–160. [Google Scholar] [CrossRef]
  35. Müller, G. Index of geoaccumulation in sediments of the Rhine River. GeoJournal 1969, 2, 109–118. [Google Scholar]
  36. Yan, Y.; Wan, R.; Yu, R.; Hu, G.; Lin, C.; Huang, H. A comprehensive analysis on source-specific ecological risk of metal(loid)s in surface sediments of mangrove wetlands in Jiulong River Estuary, China. Catena 2022, 209, 105817. [Google Scholar] [CrossRef]
  37. Liu, L.; Liu, Q.; Ma, J.; Wu, H.; Qu, Y.; Gong, Y.; Yang, S.; An, Y. Heavy metal(loid)s in the topsoil of urban parks in Beijing, China: Concentrations, potential sources, and risk assessment. Environ. Pollut. 2020, 260, 114083. [Google Scholar] [CrossRef] [PubMed]
  38. CNEMC (China National Environmental Monitoring Centre). The Background Values of Elements in Chinese Soils; Environmental Science Press of China: Beijing, China, 1990; pp. 331–403.
  39. Håkanson, L. An ecological risk index for aquatic pollution control a sedimentological approach. Water Res. 1980, 14, 975–1001. [Google Scholar] [CrossRef]
  40. Lu, X.; Wu, X.; Wang, Y.; Chen, H.; Gao, P.; Fu, Y. Risk assessment of toxic metals in street dust from a medium-sized industrial city of China. Ecotoxicol. Environ. Saf. 2014, 106, 154–163. [Google Scholar] [CrossRef]
  41. Pan, H.; Lu, X.; Lei, K. A comprehensive analysis of heavy metals in urban road dust of xi'an, china: Contamination, source apportionment and spatial distribution. Sci. Total Environ. 2017, 609, 1361–1369. [Google Scholar] [CrossRef]
  42. Huang, Z.; Liu, C.; Zhao, X.; Dong, J.; Zheng, B. Risk assessment of heavy metals in the surface sediment at the drinking water source of the Xiangjiang River in South China. Environ. Sci. Eur. 2020, 32, 23. [Google Scholar] [CrossRef] [Green Version]
  43. Zhao, G.; Ye, S.; Yuan, H.; Ding, X.; Wang, J. Surface sediment properties and heavy metal pollution assessment in the Pearl River Estuary, China. Environ. Sci. Pollut. Res. 2017, 24, 2966–2979. [Google Scholar] [CrossRef] [Green Version]
  44. Yang, Y.; Jin, Q.; Fang, J.; Liu, F.; Li, A.; Tandon, P.; Shan, A. Spatial distribution, ecological risk assessment, and potential sources of heavy metal(loid)s in surface sediments from the Huai River within the Bengbu section, China. Environ. Sci. Pollut. Res. 2017, 24, 11360–11370. [Google Scholar] [CrossRef] [PubMed]
  45. Wang, G.; Zhang, Y.; Wang, J.; Zhu, L.; Wang, J. Spatial distribution and ecological risk assessment of heavy metals in sediments of a heavily polluted Maozhou River, Southern China. Bull. Environ. Contam. Toxicol. 2021, 106, 844–851. [Google Scholar] [CrossRef]
  46. Kang, M.; Tian, Y.; Zhang, H.; Lan, Q. Distribution, ecological risk assessment, and source identification of heavy metals in river sediments from Hai River and its tributaries, Tianjin, China. Water Air Soil Pollut. 2020, 231, 38. [Google Scholar] [CrossRef]
  47. Wang, Q.; Chen, Q.; Yan, D.; Xin, S. Distribution, ecological risk, and source analysis of heavy metals in sediments of Taizihe River, China. Environ. Earth Sci. 2018, 77, 569. [Google Scholar] [CrossRef]
  48. Tang, G.; Yang, X. Experimental Course on Spatial Analysis of GIS, 3rd ed.; Science Press: Beijing, China, 2021; p. 428. [Google Scholar]
  49. Guo, G.; Zhang, D.; Wang, Y. Source apportionment and source-specific health risk assessment of heavy metals in size-fractionated road dust from a typical mining and smelting area, Gejiu, China. Environ. Sci. Pollut. Res. 2021, 28, 9313–9326. [Google Scholar] [CrossRef] [PubMed]
  50. Chen, H.; Lu, X.; Li, L.Y.; Gao, T.; Chang, Y. Metal contamination in campus dust of Xi’an, China: A study based on multivariate statistics and spatial distribution. Sci. Total Environ. 2014, 484, 27–35. [Google Scholar] [CrossRef] [PubMed]
  51. Pavlović, D.; Pavlović, M.; Čakmak, D.; Kostić, O.; Jarić, S.; Sakan, S.; Đorđević, D.; Mitrović, M.; Gržetić, I.; Pavlović, P. Fractionation, mobility, and contamination assessment of potentially toxic metals in urban soils in four industrial Serbian Cities. Arch. Environ. Contam. Toxicol. 2018, 75, 335–350. [Google Scholar] [CrossRef]
  52. Wang, Q.; Lu, X.; Pan, H. Analysis of heavy metals in the re-suspended road dusts from different functional areas in Xi’an, China. Environ. Sci. Pollut. Res. 2016, 23, 19838–19846. [Google Scholar] [CrossRef]
  53. Yu, B.; Lu, X.; Fan, X.; Fan, P.; Zuo, L.; Yang, Y.; Wang, L. Analyzing environmental risk, source and spatial distribution of potentially toxic elements in dust of residential area in Xi’an urban area, China. Ecotox. Environ. Saf. 2020, 208, 111679. [Google Scholar] [CrossRef]
Figure 1. Sediment sampling sites in the Mianyang section of the Fujiang River.
Minerals 12 01513 g001
Figure 2. Spatial characteristics of HM concentrations in sediments of the Mianyang section of the Fujiang River.
Minerals 12 01513 g002
Figure 3. Source contribution rates of HMs in sediments of the Mianyang section of the Fujiang River.
Minerals 12 01513 g003
Figure 4. Spatial characteristics of source contributions.
Minerals 12 01513 g004
Figure 5. INI degree for HMs in the Mianyang section of the Fujiang River.
Minerals 12 01513 g005
Figure 6. RI degree for HMs in the Mianyang section of the Fujiang River.
Minerals 12 01513 g006
Figure 7. Proportion of potential ecological risk from different sources of HMs.
Minerals 12 01513 g007
Table 1. Contents (mg/kg) of HMs in sediments of the Mianyang section of the Fujiang River and other reported rivers in China, as well as the background values of the Sichuan topsoil.
HMsAsBaCrCoCuNiPbMnZnV
Mean8.73917.56121.0626.8135.5437.2722.26886.07104.84103.29
Minimum4.90725.8059.5010.624.4027.1016.20455.9071.9080.20
Maximum14.601340.60229.6054.455.4548.7036.204618.10205.30141.90
SD2.68132.1850.6714.366.016.344.86761.2027.2515.29
CV (%)30.7314.4141.8653.5516.9117.0021.8385.9125.9914.80
Reference value [38]10.40474.0079.0017.631.1032.6030.90657.0086.5096.00
Danjiang River [30]10.101034.2081.6025.946.7037.5038.90925.10139.00114.70
Songhua River [14]10.13NA121.40NA13.3312.8918.80NA92.54NA
Yellow River [19]NANANANA34.00NA46.70NA150.00NA
Nanfei River [20]12.20NA143.20NA145.4045.7070.80NA869.30NA
Fuchunjiang River [21]18.80NA86.70NA106.1044.6049.40NA1122.90NA
Xiangjiang River [42]34.74NA23.115.2620.5416.5838.19NA58.24NA
Pearl River [43]21.99NA78.37NA46.76NA49.66NA143.10NA
Huai River [44]0.024NA89.60NA21.6026.4088.20NA64.40NA
Maozhou River [45]NANA265.00NA726.00220.0058.40NA353.00NA
Hai River [46]NANA92.09NA74.2344.6336.08NA89.41NA
Taizihe River [47]977.30NA146.60NA98.90NA1662.10NA1181.50NA
SD means standard deviation, CV (%) means coefficient of variation, NA means not available.
Table 2. Spearman correlation of 10 HMs in sediments of the Mianyang section of the Fujiang River.
HMsAsBaCrCoCuNiPbMnZnV
As1
Ba−0.0691
Cr0.0510.0651
Co0.1430.021−0.891 **1
Cu0.524 **0.080−0.1050.1981
Ni0.830 **−0.0390.1530.0510.521 **1
Pb0.843 **−0.144−0.0680.180.711 **0.780 **1
Mn0.752 **−0.044−0.2390.3350.545 **0.659 **0.787 **1
Zn0.653 **−0.1910.1150.0480.658 **0.758 **0.755 **0.571 **1
V0.595 **0.2710.1430.0130.557 **0.842 **0.577 **0.414 *0.685 **1
* Correlation is significant at p < 0.05 (2-tailed). ** Correlation is significant at p < 0.01 (2-tailed).
Table 3. Factor profiles and contribution of the factors by PMF.
HMsFactor Profiles (mg/kg)Factor Contributions (%)
Factor 1Factor 2Factor 3Factor 4Factor 1Factor 2Factor 3Factor 4
As3.780.083.660.8845.040.9843.5510.43
Ba72.32458.47342.4941.797.9050.1037.434.57
Cr1.2127.7437.9150.611.0323.6132.2743.08
Co11.9712.700.000.0048.5251.480.000.00
Cu14.388.260.4212.2940.6823.371.1934.75
Ni11.405.2618.871.6730.6414.1450.734.49
Pb10.792.281.817.1648.9510.378.2032.49
Mn374.6972.5152.93218.1952.1610.097.3730.38
Zn33.8612.6043.9310.3433.6112.5043.6110.27
V23.1924.5255.22022.5223.8353.650
Publisher’s Note: MDPI stays neutral with regard to jurisdictional claims in published maps and institutional affiliations.

