1. Introduction
With the booming development of China’s steel industry in recent years, the proportion of imported iron ore powder has been climbing, and it has been an inevitable trend to improve the utilization rate of imported iron ore powder. The main raw material of blast furnace iron making is sinter, and the quality of the sinter has an important impact on blast furnace iron making. A good sintering raw material structure also requires a reasonable mix of iron ore, flux, and fuel [
1]. The research on the optimization of sinter ore blending is mainly reflected in two aspects: normal-temperature characteristics and high-temperature characteristics. The quality of the sinter depends more on the basic sintering characteristics of iron ore at high temperatures, so it is necessary to study the high-temperature characteristics of iron ore powder [
2]. The basic sintering characteristics of iron ore powder are the precondition for optimizing ore blending [
3]. Xiang J F et al. [
4] studied the sintering base properties of three imported iron ore powders and concluded that the appropriate amount of SiO
2 and crystalline water in iron ore powders could improve their assimilation properties and the strength of the cohesive phase; Tian T L [
5] studied the sintering base properties of six imported iron ore powders and concluded that the assimilation ability and the strength of the cohesive phase of Australian ore were better than those of Brazilian ore. Wang Y F et al. [
6] studied the effects of alkalinity, calcium fusion type, and other factors on the quality of sintered ore under the condition of a high limonite ratio. They concluded that under the condition of a high limonite ratio, the quality of sintered ore needs to be improved by increasing the proportion of quicklime used and the measures of increasing the negative pressure of sintering extraction and the thickness of the material layer. Since PB ore and Newman ore fines are both semi-brown iron ore with a medium iron grade, low SiO
2 and Al
2O
3 content, and very low harmful elements P and S, the price difference is large. The sintering base characteristics of PB fines are poor, and a large amount of PB fines added to the mixed fines will affect the quality of sintered ore. And Newman ore powder has better sintering base characteristics, but the price is higher, and adding a large amount will make the cost increase, which is not conducive to the requirement of cost reduction. The sintering base characteristics of the two iron ore powders were studied and finally analyzed to arrive at the best mixing ratio. The best-performing mixed ore powder was used as a new ore powder, which in turn reduced the allocation scheme for optimized ore blending. The infrared sintering furnace is used to conduct the sintering test on iron ore powder, reveal the basic sintering characteristics of iron ore powder, and find out the best ratio of imported iron ore powder [
7]. Combined with the actual batching cost on-site, the reasonable collocation ratio of commonly used imported ore powder is proposed, which has important guiding significance to realize the complementary sintering basic characteristics of iron ore powder, optimize ore mixing [
8], and improve the performance of sinter.
FactSage 7.1 jointly developed by Thermfact/CRCT (Quebec, Canada) and GTT-Technologies (Herzogenrath, Germany) is used to simulate the equilibrium state of iron ore at a certain temperature and analyze its phase composition can effectively improve the ore blending efficiency, reduce the actual ore blending scheme, and reduce the ore blending cost. At the same time, it can also provide a reference method for subsequent research.
2. Materials and Methods
In order to simulate the different temperature zones of the sintering process, the TSJ-2 infrared micro sintering furnace (Shimadzu Corporation, Kyoto, Japan) was used to simulate the actual sintering temperature and atmosphere. The temperature of the infrared sintering furnace is in the range of room temperature (25 °C)~1000 °C, simulating the preheating drying zone of sintering. In this area, evaporation of water vapor and decomposition of carbonates with crystalline water occur mainly [
9].
The TSJ-2 infrared sintering furnace is shown in
Figure 1, and other experimental equipment is shown in
Table 1.
The test raw materials are two kinds of imported iron ore powders commonly used in China’s steel mills, namely PB iron ore powder (OA) and Newman iron ore powder (OB), which have the commonality of lower CaO and MgO content and higher Al
2O
3 content. The main difference is that the content of total iron (TFe) in OA is low, while the content of SiO
2 is high. The chemical composition and burning loss of iron ore powder are shown in
Table 2.
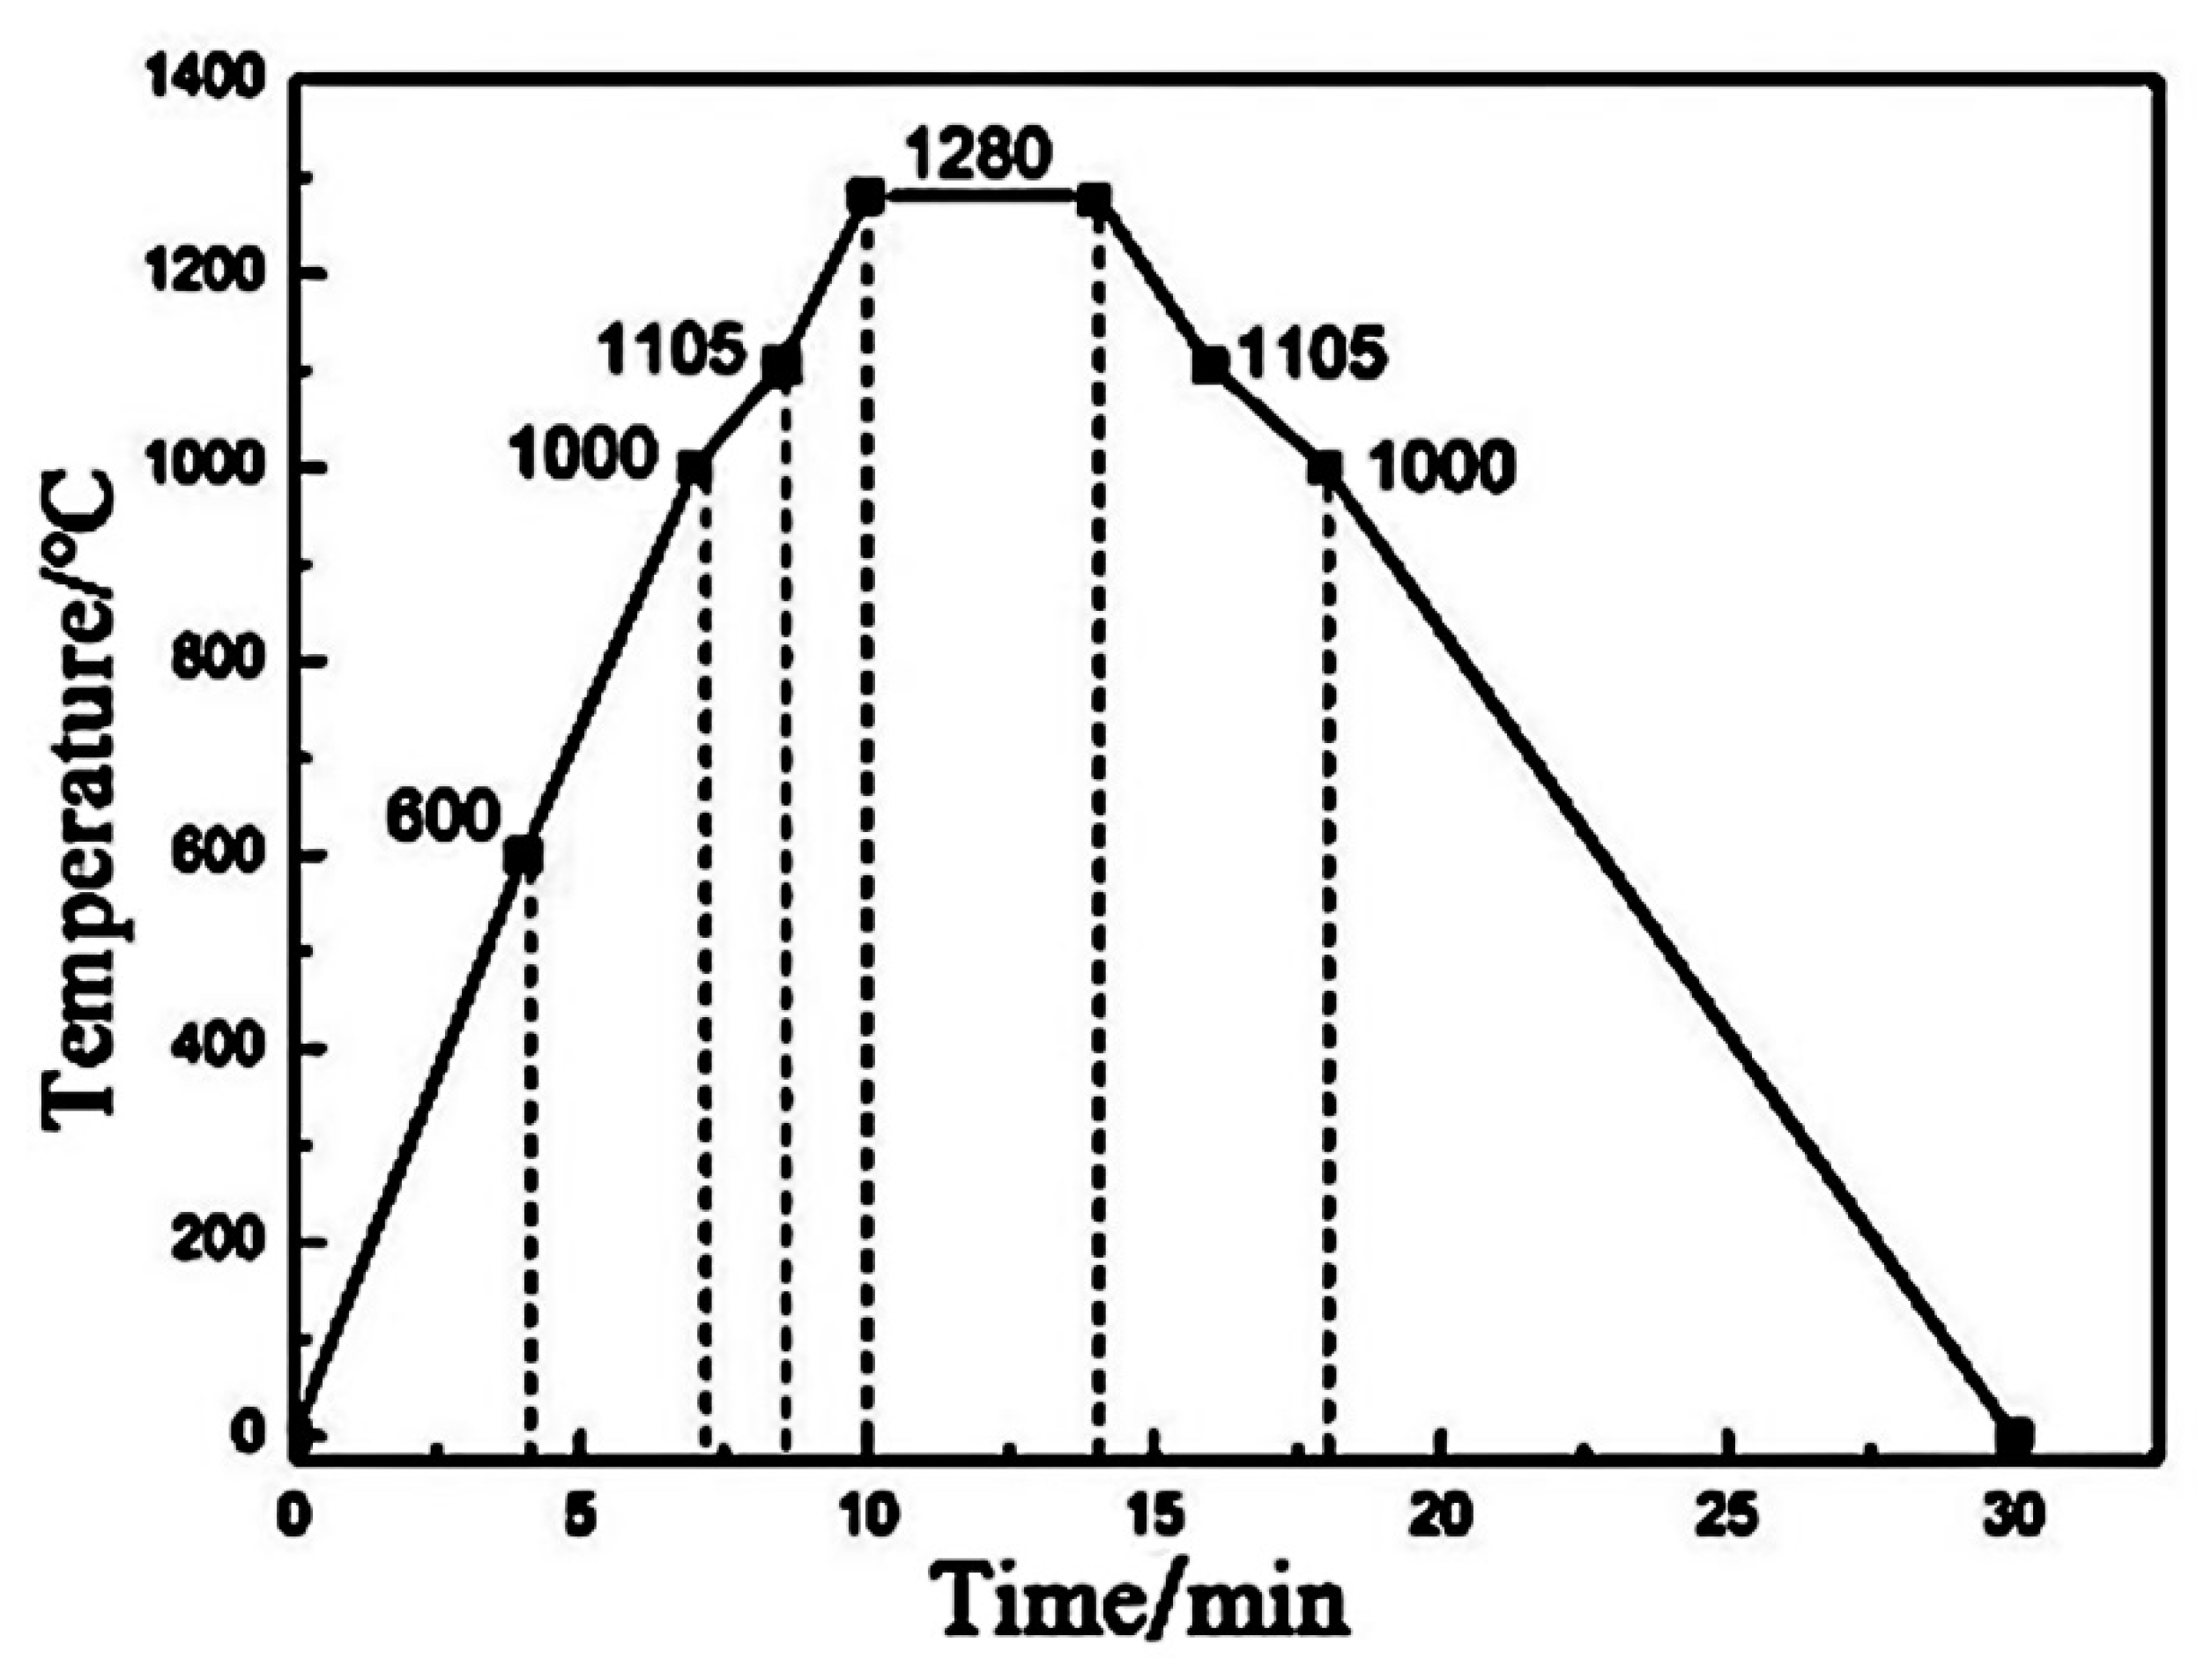
The temperature and atmosphere conditions in the test process are shown in
Figure 2. The air atmosphere is room temperature (25 °C)~600 °C, the high purity nitrogen atmosphere is 600 °C~1280 °C, and the air atmosphere is 1280 °C~ room temperature. The heating time and speed were tested to simulate the actual sinter layer thickness and corresponding sintering position. The length of heating time corresponds to different material layer thicknesses. The longer the time, the thicker the material layer is, and the closer it is to the lower sinter. The shorter the time, the thinner the material layer, and the closer it is to the upper sinter [
10,
11,
12,
13,
14,
15]. In addition, the outer layer of the test cake is closer to the heat source, the temperature is higher, and the outer layer of the cake specimen is closer to the lower sinter. In the center of the cake, the temperature is relatively low, which is closer to the upper sinter. The heating section (1000 °C~1280 °C) and the constant temperature section (1280 °C, 4 min) of the infrared sintering furnace simulate the burning zone of sintering, mainly including the reduction of hematite and the formation of silicate and calcium ferrite. The thickness of the combustion zone and the amount of carbon distribution are simulated by the length of time in the constant temperature section. At the same time, the nitrogen atmosphere was converted to an air atmosphere at the end of the constant temperature section to simulate the high-temperature oxidation stage at the sintering endpoint. The oxidation of Fe
3O
4 and the recrystallization growth of Fe
2O
3 and Fe
3O
4 are dominant in this temperature range. The temperature of the infrared sintering furnace is controlled by a cooling process from 1280 °C to room temperature (25 °C), simulating the actual sintered cooling zone. In this zone, the re-oxidation of Fe
3O
4 and crystallization growth of complex calcium ferrite are the main factors [
16,
17]. The slower the temperature drops, the higher the actual sintering temperature and the weaker the relative oxidation atmosphere. The faster the temperature drops, the lower the actual sintering temperature and the stronger the relative oxidation atmosphere.
The basic sintering characteristics of OA, OB, OC, OD, and OE iron ore fines are measured. The experimental procedure is shown in
Figure 3, and the test conditions for various properties are as follows.
After the iron ore powder (−74 μm) and CaO reagent of 98% purity were fully dried, Iron ore powder (total mass 1 g) and calcium oxide (total mass 2 g) were weighed separately. Specimens were made in an automatic tablet press (pressure 10 MPa, time 2 min) using a mold. The infrared sintering furnace was adjusted to the preset temperature, and the pressed mineral powder cakes were placed directly above the calcium oxide cakes to keep the mineral powder cakes in full contact with the surface of the calcium oxide cakes and then put into the infrared sintering furnace for roasting, and then removed after the specimens were cooled. Observe the contact surface of the specimen and CaO, and take the beginning of the contact surface as the characteristic of judging assimilation. Repeat the above experiments and determine the minimum temperature required to achieve this characteristic. At this time, the roasting temperature was taken as the lowest assimilation temperature of iron ore fines.
- 2.
Liquid phase flow characteristics measurement experimental method
Fully dried calcium oxide (98% purity) and iron ore powder (particle size −74 μm) were made into a mixed mineral powder with alkalinity R
2 = 3.0. Mix it in a mixing tank on a ball mill (time 2 h). The mixed raw material was weighed (total mass 1 g) and put into a mold in an automatic tablet press (pressure 10 MPa, time 2 min) to make specimens. The iron ore powder cake was placed on the carrier sheet and put into the infrared sintering furnace to bake at 1280 °C (time 4 min). Then the specimen was slowly removed after cooling. Measure the flow area of the specimen on the carrier sheet and calculate the liquid phase fluidity index (FI) of iron ore powder with the following equation.
where:
a—the liquid phase mobility index;
b—the area of the specimen flowing on the carrier table;
c—the area of the original specimen.
- 3.
Experimental method for measuring bonded phase strength
Iron ore powder (−74 μm) and CaO reagent of 98% purity were dried sufficiently, and CaO reagent was added to the iron ore powder to prepare a binary alkalinity R2 = 2.0. The iron ore powder with an alkalinity of 2.0 was put into a mixing tank and mixed on a ball mill (time 2 h). The mixed raw material was weighed (total mass 1 g) into a mold in an automatic tablet press (pressure 10 MPa, time 2 min) to make specimens. The infrared sintering furnace was adjusted to the preset temperature, and the pressed mineral powder cake was placed on the carrier sheet and sintered in the infrared sintering furnace to bake at 1280 °C (time 4 min) and then slowly removed after the specimen cooled. After the specimen cooled down, the compressive strength of the roasted specimen was measured by the compressive strength measuring machine, and the average value was taken as the bonding phase strength of the specimen by repeating the test three times.
- 4.
Experimental method for determination of calcium ferrite generation characteristics
Iron ore powder (−74 μm) and CaO reagent of 98% purity were fully dried, and CaO reagent was added to the iron ore powder to formulate binary alkalinity R2 = 2.0 iron ore powder, and the iron ore powder with 2.0 alkalinity was put into a mixing tank and mixed on a ball mill (time 2 h). The mixed raw material was weighed (total mass 1 g) and put into a mold on an automatic tablet press (pressure 10 MPa, time 2 min) to make specimens. The infrared sintering furnace was adjusted to the preset temperature (the roasting time was 4 min in the high-temperature section, and the temperature was set at 1280 °C). The pressed mineral powder cakes were placed on the carrier sheet and roasted in (1) the infrared sintering furnace together, and the specimens were slowly removed after cooling. Determination of calcium ferrite: The sintered ore was molded on an SPM-300 mill and polished in a metallographic specimen pregrinder. Then the composition structure of the mineral phase was observed under the AxioImager mineral phase microscope (Carl Zeiss, Oberkochen, Germany), and the area occupied by the components in the mineral phase photos was calculated by using the binary method software to determine the area occupied by the complex calcium ferrite.
3. Experimental Results and Analysis
3.1. Assimilation
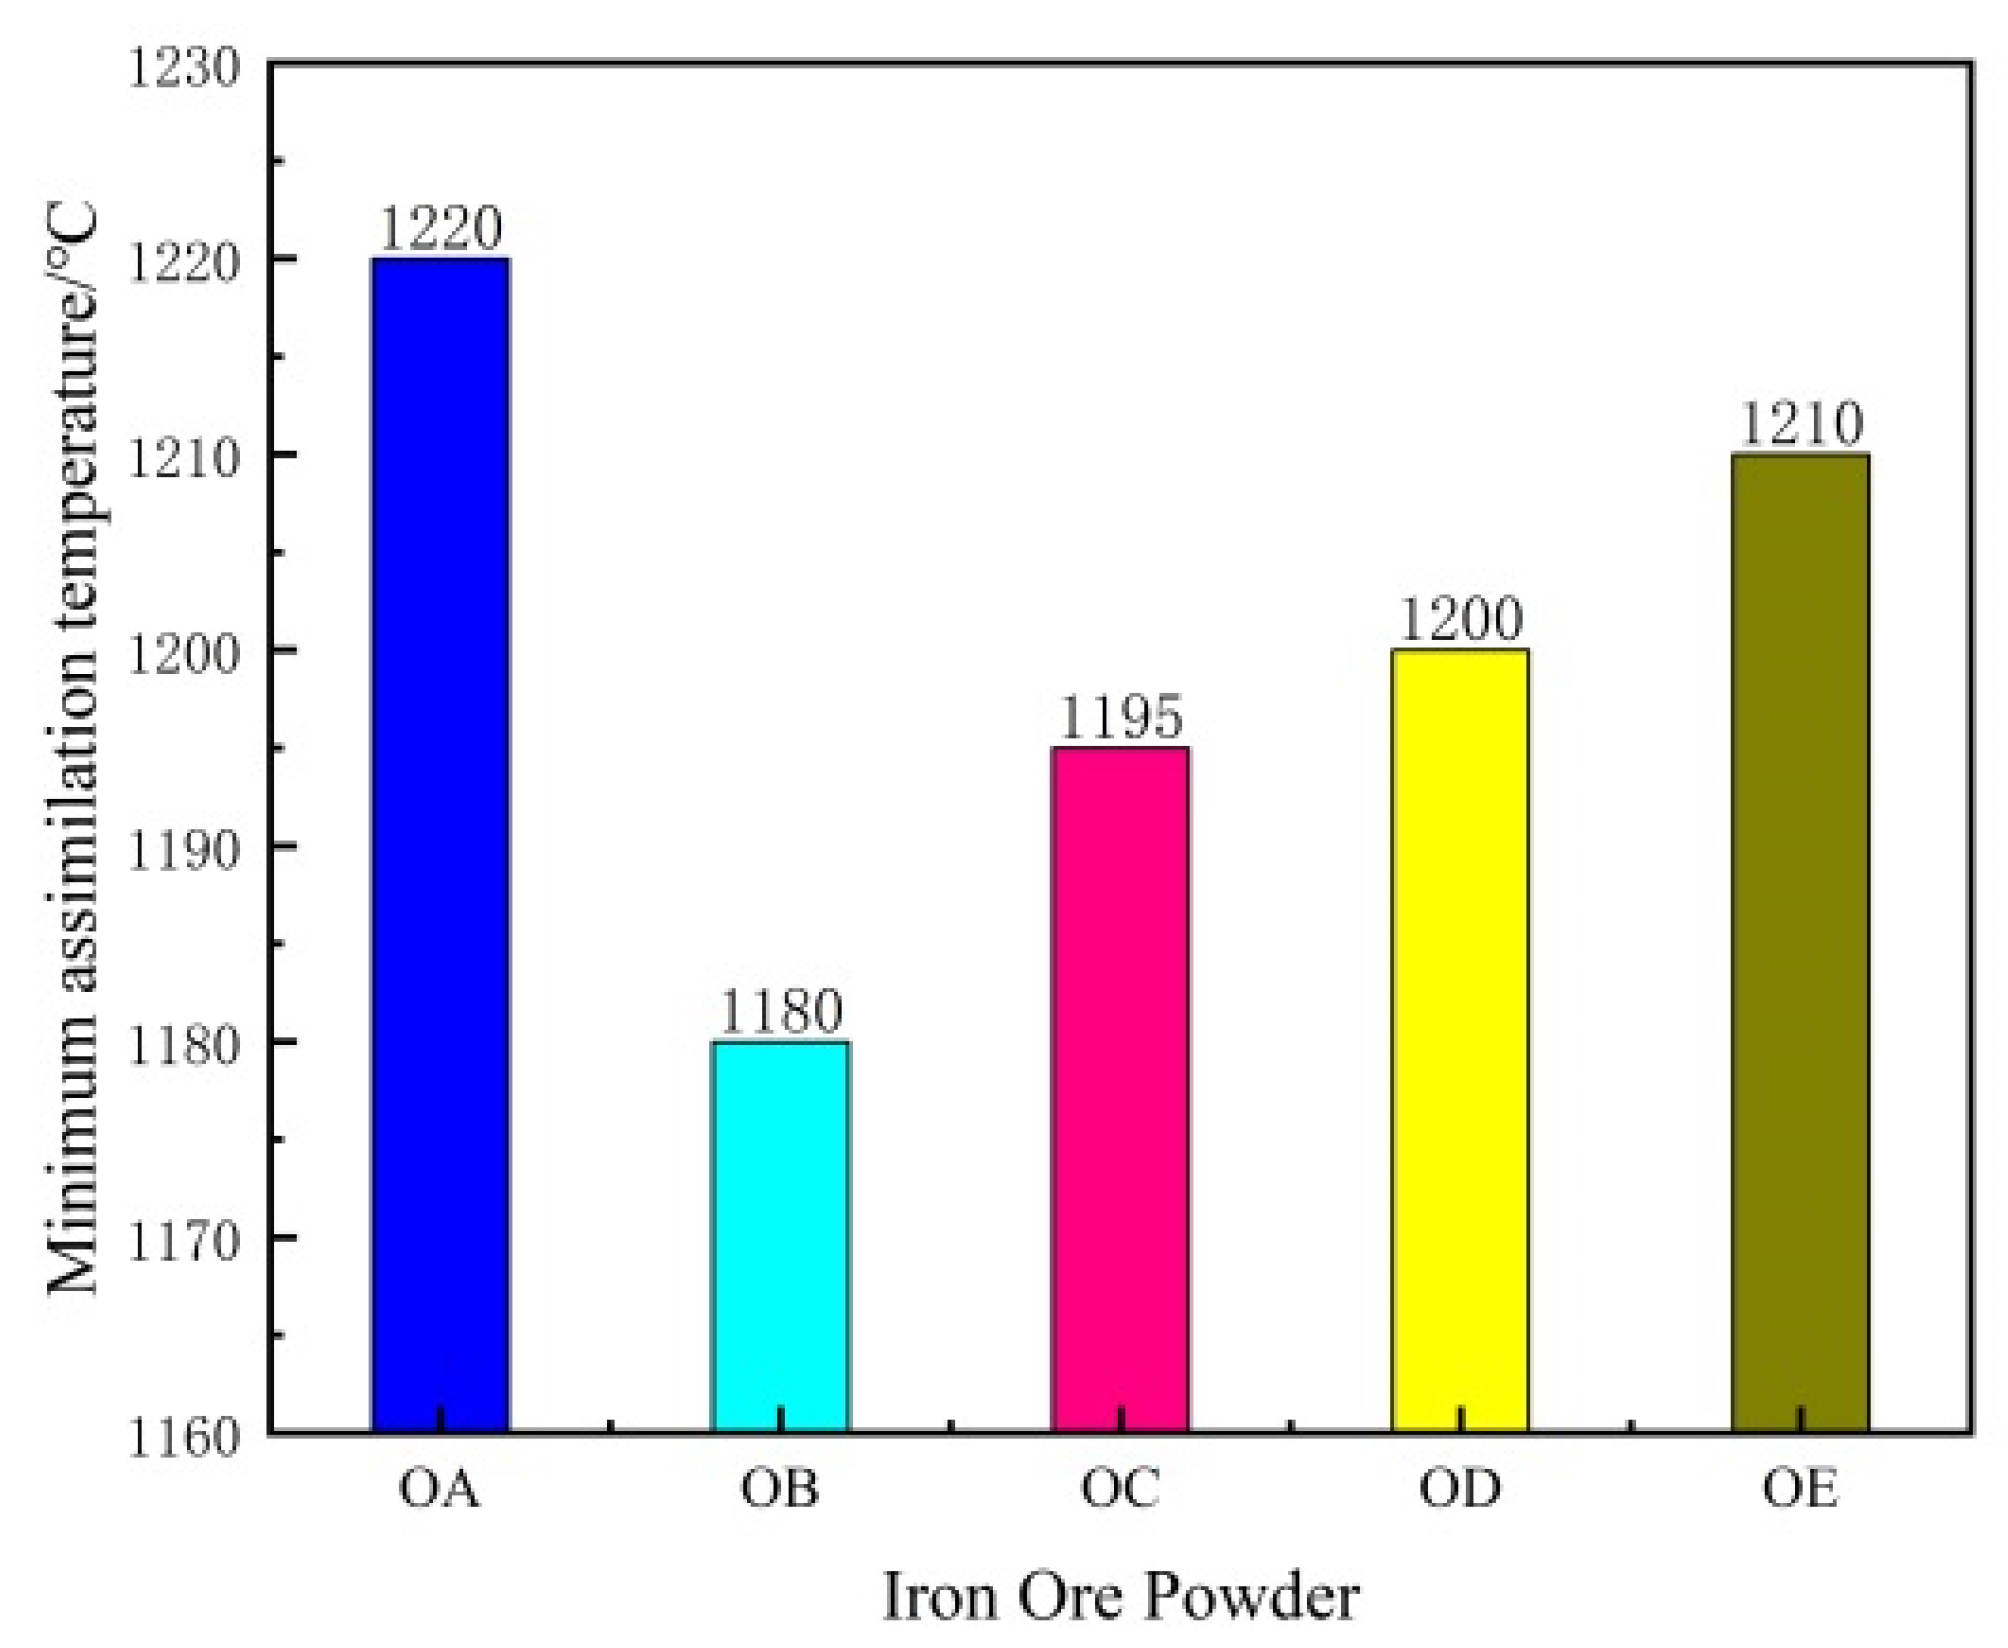
The minimum assimilation temperature is used to measure the mineralization ability of iron ore powder with CaO, and it is generally considered that the minimum assimilation temperature is more reasonable at 1200 °C~1280 °C [
18]; the lower the assimilation temperature, the better the assimilation performance of iron ore powder. The minimum assimilative temperature of the test mineral powder is shown in
Figure 4.
As can be seen from
Figure 4, the assimilation performance of OA, OB iron ore powder and its mixed iron ore powder OC, OD and OE were compared, and OB iron ore powder had the lowest assimilation temperature and the best assimilation performance, which was easy to react with CaO to form calcium ferrite bonded phase; OA iron ore powder had a higher assimilation temperature and weaker assimilation ability, which was not easy to assimilate to form calcium ferrite bonded phase; OC, OD and OE iron ore powder had the lowest assimilation temperature between the lowest assimilation temperatures of OC, OD and OE iron ore powders are between OA and OB iron ore powders, and the assimilation performance tends to weaken with the increase of OA iron ore powder content, which shows that OA and OB iron ore powders have good complementarity in terms of assimilation, and the mixed iron ore powders with different assimilation performance can be obtained by adding different proportions of OB iron ore powders to OA iron ore powders. According to the existing studies, it was found that the SiO
2 and TFe content in iron ore fines have a strong influence on the minimum assimilation temperature.
- (1)
Effect of SiO2 content on the assimilation properties of iron ore powder
The main difference between OA and OB iron ore powders is the low TFe content of OA and the high SiO
2 content. According to the analysis of
Figure 4, the assimilation temperature of iron ore powder increases with the increase of SiO
2 content; SiO
2 has the effect of inhibiting the reaction of iron ore powder with CaO to form a low melting point calcium ferrite. The acidity of SiO
2 in iron ore powder is stronger than that of Fe
2O
3, which is easy to react with CaO to form calcium silicate series minerals (3CaO-SiO
2, 2CaO-SiO
2, 3CaO-2SiO
2, CaO-SiO
2, etc.). The minerals of the calcium silicate series have higher melting points and do not show signs of melting at the assimilative properties test temperature of iron ore powder, i.e., assimilative signs. On the contrary, because the generation of high melting point minerals of calcium silicate series inhibits the reaction of Fe
2O
3 with CaO and the generation of low melting point calcium ferrite in iron ore powder, it shows that with the increase of SiO
2 content, the assimilability temperature of iron ore powder increases and the assimilability performance becomes poor.
- (2)
TFe content
OA and OB two kinds of iron ore powder are hematite, high TFe content that is Fe2O3 content, easy to react with CaO to generate a low melting point calcium ferrite, so OB powder TFe content is high, the assimilative temperature is low, assimilative performance is better than OA powder, and with the increase of OA powder ratio in the mixed ore, the assimilative performance of iron ore powder becomes worse.
3.2. Liquid Phase Mobility
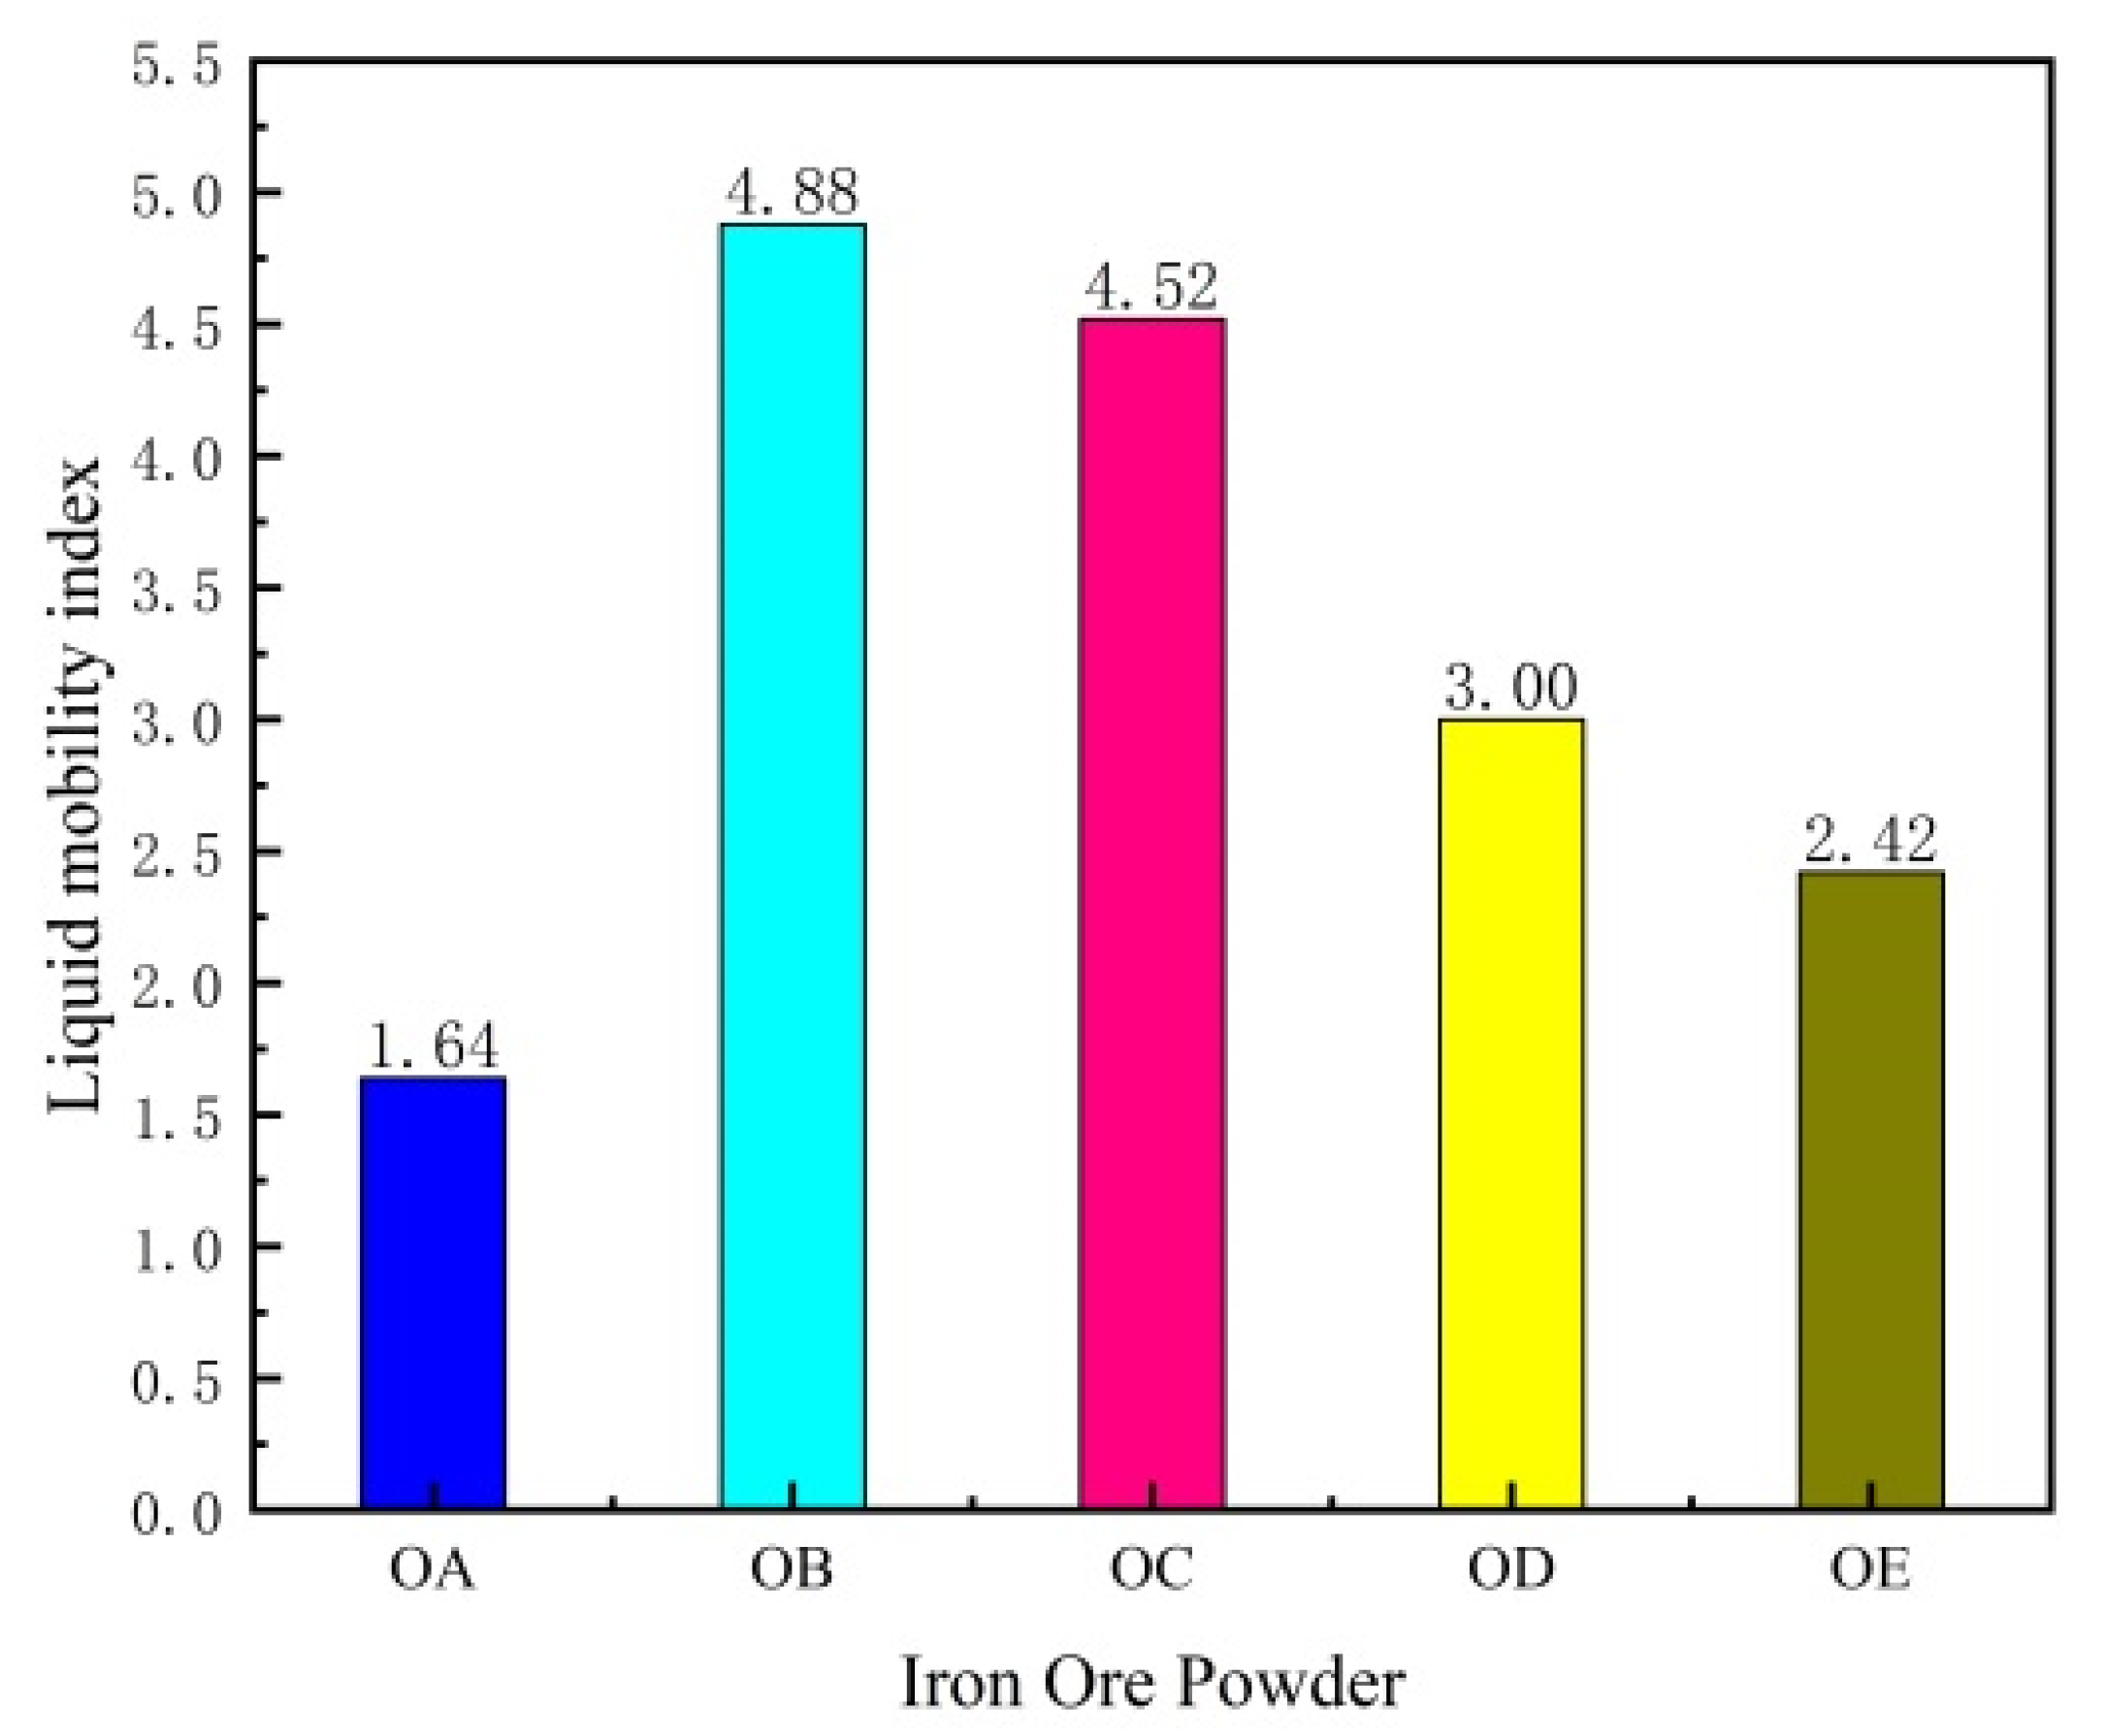
Liquid phase fluidity characterizes the flow ability of the sintered liquid phase. It is generally believed that the more the amount of liquid phase and the smaller the viscosity, the better the liquid phase fluidity; in sintering, the amount of liquid phase should be controlled within a suitable range. The amount of liquid phase is too large, and the iron ore with small viscosity is easy to form a thin-walled large pore structure, which leads to lower strength of sintered ore; the amount of liquid phase is too little, and the iron ore powder with high viscosity cannot play an effective bonding role, which leads to lower strength of sintered ore. The liquid phase fluidity index of iron ore powder measured by the test is shown in
Figure 5.
SiO
2 content and assimilation performance as the main factors affecting the liquid phase fluidity; it is usually considered that iron ore powder with good assimilation performance and low SiO
2 content has better liquid phase fluidity performance. From the analysis of
Figure 5, it can be seen that the liquid phase fluidity of OB iron ore powder is significantly stronger than that of OA iron ore powder, and the liquid phase fluidity of mixed ore powder becomes worse as the content of OB ore powder decreases, showing a complementary phenomenon, and the liquid phase fluidity of mixed ore OC > OD > OE.
- (1)
Relationship between liquid phase mobility and SiO2 content
Since the experiment found a correlation between SiO
2 content in iron ore powder and fluidity index, the composition and viscosity of OA, OB, and their three mixed ore powders in the equilibrium liquid phase at 1280 °C were calculated using Factsage7.1 thermodynamic calculation software, and the results are shown in
Table 3.
The SiO
2 content in the equilibrium liquid phase obtained from the Factsage7.1 thermodynamic calculations for OA, OB, and their three mixed mineral powders at 1280 °C with the experimentally measured liquid phase mobility index were shown in
Table 4.
In order to explore the relationship between liquid phase fluidity index and SiO
2 content in the equilibrium phase of iron ore powder, the correlation coefficient method was used to determine its correlation. Then the fluidity index and SiO
2 content were processed by regression analysis using the regression idea. The equation of correlation coefficient
r(
x,
y) is shown in (2)
where:
r(
x,
y) is the correlation coefficient;
is the OA-OE mineral powder number;
represents the SiO
2 content in OA-OE;
stands for OA-OE mobility index;
,
are the average of
x and
y.
Substituting the data in
Table 4 into Equation (2), the calculation shows that the correlation coefficient
= −0.9585, which is generally considered that |
r| ≧ 0.75, indicating a strong linear correlation; therefore, it is concluded that the liquidity index has an extremely strong correlation with the SiO
2 content and satisfies the linear regression linear equation, and the linear regression linear equation is next used to perform a linear fit between the liquidity index and the SiO
2 content. The regression equation is shown in Equation (3).
where:
.
.
is the slope
is the intercept.
Substituting the data in
Table 4 into Equation (3), the calculation gives
and
; therefore, the linear regression equation is
.
From the linear regression equation, it can be seen that the fluidity index is negatively correlated with the SiO2 content. With the increase in SiO2 content, the fluidity index decreases, and the fluidity energy weakens. The fluidity index of iron ore powder after mixing OA with OB iron ore powder can be calculated by using thermodynamic calculation software to calculate the SiO2 content (mass fraction) in the liquid phase of the equilibrium phase of iron ore powder at 1280 °C and according to the above regression equation, the fluidity index of mixed iron ore powder.
- (2)
The relationship between assimilation and viscosity and liquid phase mobility
Iron ore powder with good assimilation performance is easy to generate a low melting point calcium ferrite liquid phase. The viscosity of the liquid phase is reduced, and the flow performance is improved, which is consistent with the viscosity relationship in the equilibrium phase calculated by thermodynamics. The liquid-phase fluidity of iron ore powder is negatively correlated with viscosity. The higher the viscosity is, the worse the fluidity is. The lower the viscosity is, the better the fluidity is.
3.3. Bonded Phase Strength
Bonded phase strength is the solidification strength of the sintered liquid phase on the surrounding nucleated ore [
19]; the amount of liquid phase and liquid phase fluidity of the sintered specimen is an important factor affecting the bonded phase strength, more liquid phase amount, suitable liquid phase fluidity is to ensure the basis of the sintered bonded phase strength, it is generally considered that the bonded phase strength greater than 1 KN·P
−1 is more appropriate. The test mineral powder bonded phase strength is shown in
Figure 6.
From
Figure 6, it can be seen that OB mineral powder has better bond phase strength, and the bond phase strength of mixed iron ore powder is between OA mineral powder and OB mineral powder, and it decreases with the increase of OA mineral powder ratio, and the bond phase strength of two iron ore powders has some complementarity. The main factors affecting the bonded phase strength are SiO
2 content, liquid phase fluidity and burn loss, etc.
- (1)
Relationship between bonded phase strength and liquid phase mobility index
Since liquid phase fluidity is the main reference factor for bonded phase strength, the relationship between liquid phase fluidity index and bonded phase strength was analyzed by using linear fitting, and the experimental data are shown in
Table 5.
Substituting the data in
Table 5 into Equation (3), we can get the correlation coefficient
r = 0.975, so it is considered that the bonding phase strength and mobility index have a strong linear correlation. Substituting the data in
Table 5 into Equation (4), we get
and
; therefore, the linear regression equation is
According to the linear regression equation, the liquid phase fluidity index is positively correlated with the bonding phase strength, and the bonding phase strength is enhanced with the increase of the liquid phase fluidity index. The assimilation and liquid phase fluidity of OB iron ore powder is better than OA iron ore powder, and it is easy to form a low melting point liquid phase during the sintering process. The liquid phase effectively bonds to the surrounding nucleated ore and enhances the bonding phase strength of iron ore powder.
- (2)
Effect of SiO2 content on the strength of the bonded phase
With the increase of SiO2 content, the generation of high melting point calcium silicate series of minerals increased, low melting point calcium ferrite decreased, the sintered liquid phase viscosity increased, the liquidity became poor, and 2CaO-SiO2 (referred to as C2S) in the cooling process from β-C2S crystalline type to γ-C2S crystalline type, the volume of about produce will occur 11% expansion, resulting in the reduction of the bonding phase strength.
- (3)
Effect of burnout on the strength of the bonded phase
The evaporation of crystallization water makes the sintered ore form more pores during the sintering process, improves the kinetic conditions of sintering, and promotes the mineralization reaction of iron ore.
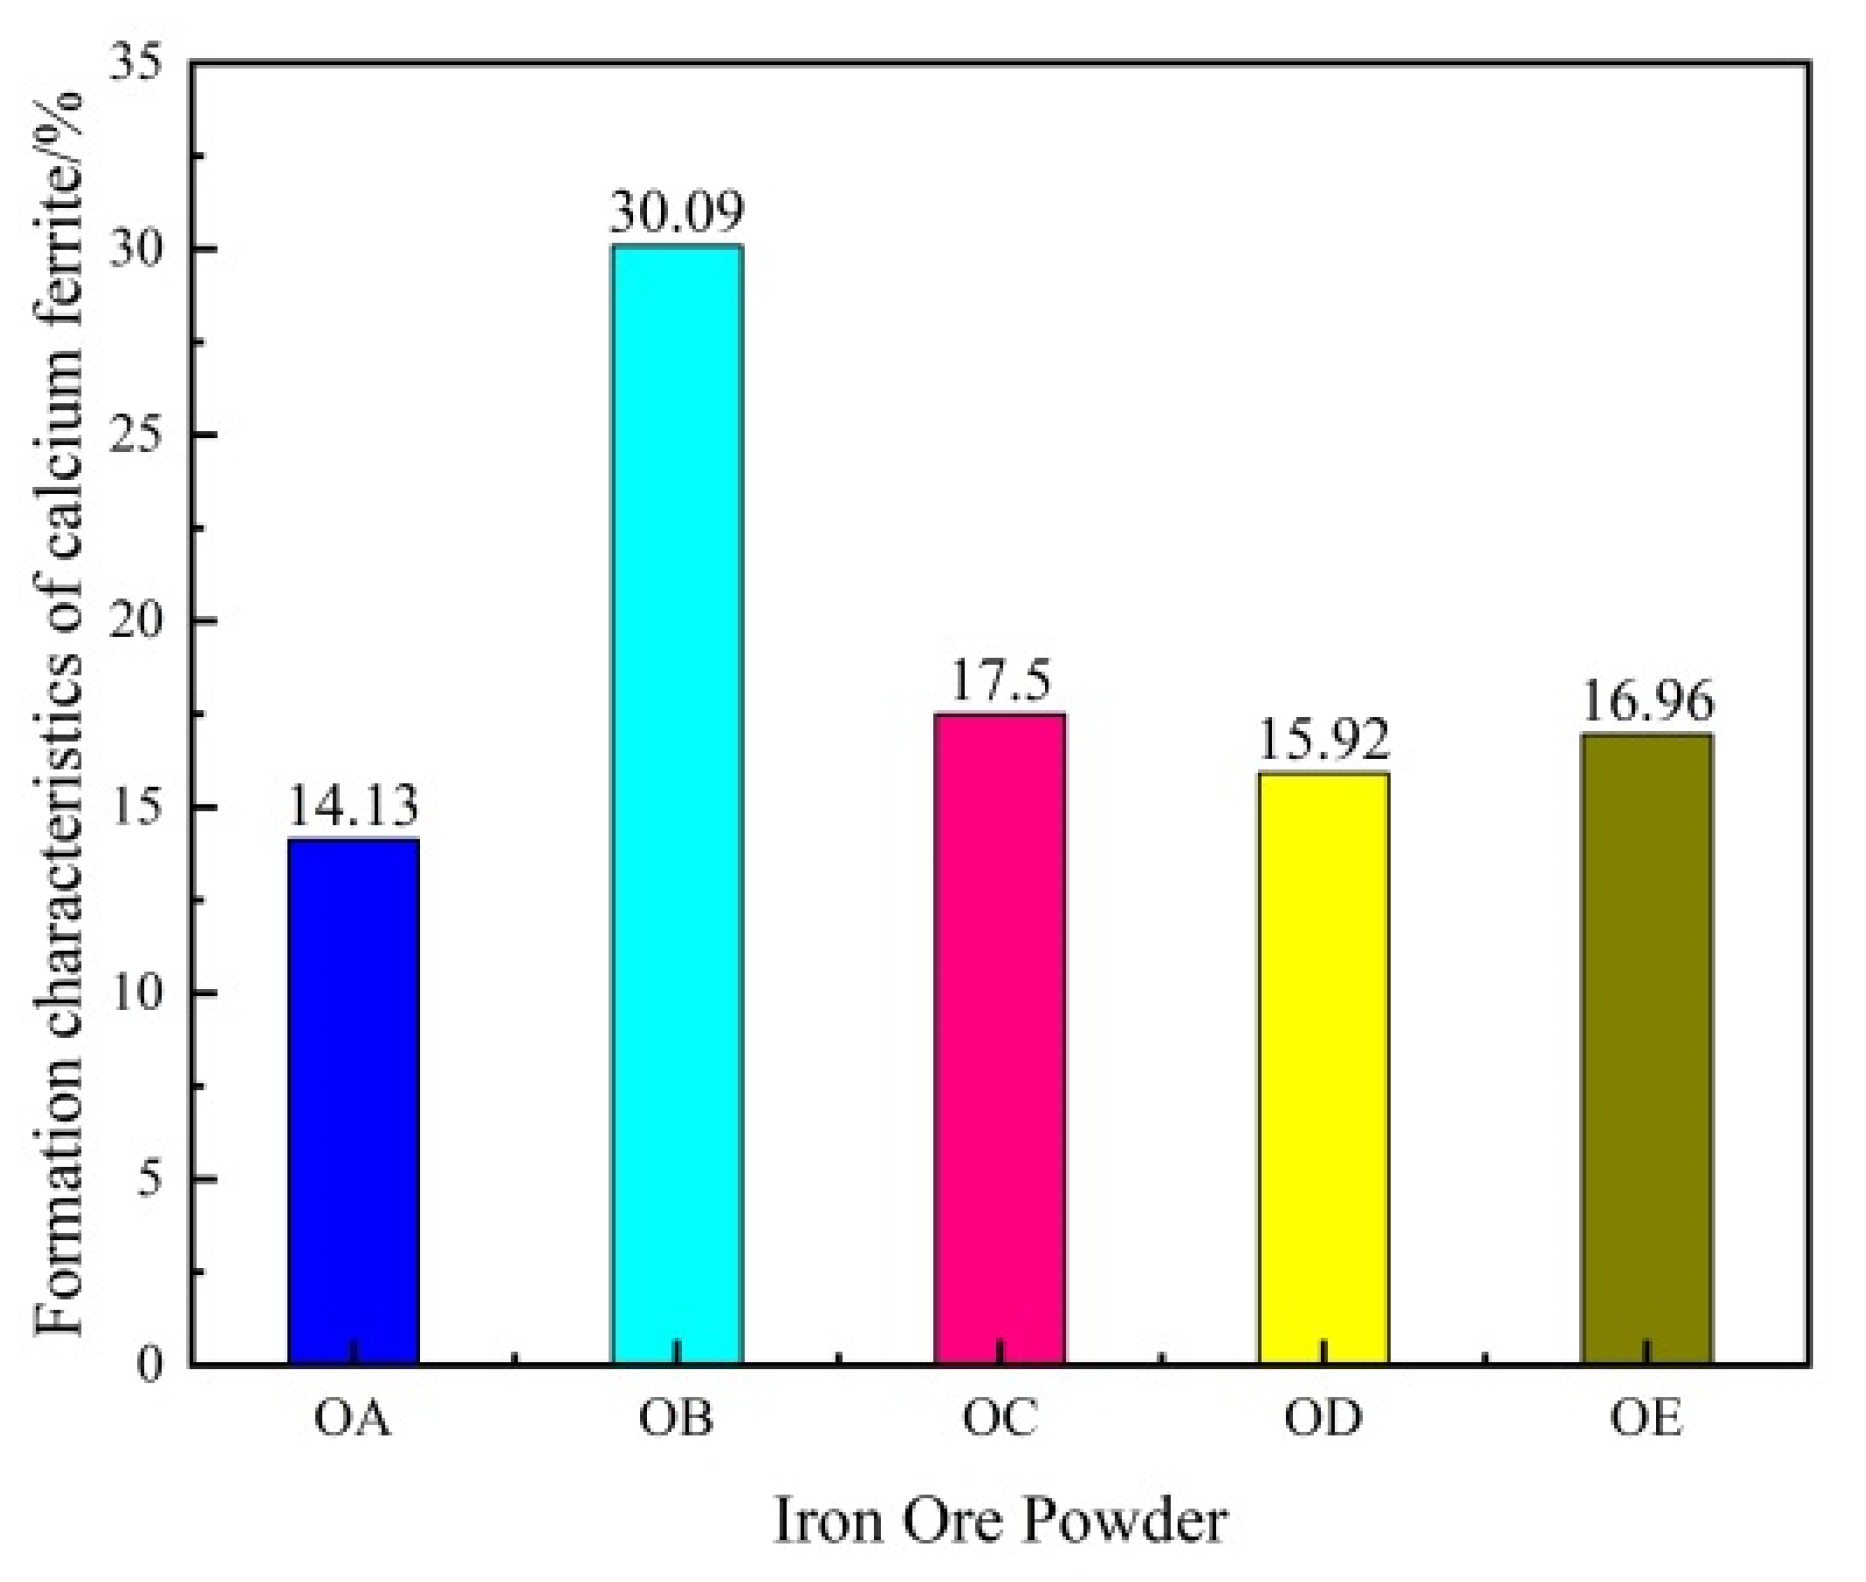
3.4. Properties of Calcium Ferrite Production
Calcium ferrite generation characteristics refer to the ability of iron ore fines to react with CaO in mineralization to generate complex calcium ferrites, and a large number of researchers [
20,
21,
22,
23] believe that the calcium ferrite generation ability is proportional to the strength and reduction of iron ore. The percentage of calcium ferrite in the tested iron ore fines is shown in
Figure 7.
From
Figure 7, it can be seen that the calcium ferrite generation capacity of OA and OB iron ore powder has an obvious difference, OB iron ore powder has a stronger calcium ferrite generation capacity, OC, OD, and OE ore powder has calcium ferrite generation capacity between OA and OB ore powder, although the addition of OB ore powder to OA ore powder has the effect of improving the calcium ferrite generation characteristics of mixed ore, its effect is limited, and the complementary characteristics are not significant. The main factors affecting calcium ferrite production are Fe
2O
3 content and SiO
2 content.
The high-grade iron ore provides favorable conditions for the mineralization of Fe2O3 with CaO, which promotes the formation of calcium ferrite. SiO2 has a good affinity with CaO and reacts to produce Ca2SiO4 and other substances, which prevents Fe2O3 and CaO from fully reacting, which is not conducive to forming calcium ferrite.
In summary, iron ore powder with high Fe2O3 and low SiO2 is more easily CaO mineralized to generate complex calcium ferrite; meanwhile, the generation of calcium ferrite is also influenced by the iron ore powder particle size, sintered ore porosity, and sintering temperature. The main reason for the poor complementarity of calcium ironate generation characteristics in mixed iron ore fines is due to the weakened permeability of the mixed iron ore fines after mixing OA iron ore fines with OB iron ore fines and the reduced kinetic conditions, which makes the generation of complex calcium ironate in the ore phase decrease.


