Article

Numerical Study on the Vibratory Compaction Mechanism of the Sand-Gabion Backfills in Underground Coal Mines

1
School of Geology and Mining Engineering, Xinjiang University, Urumchi 830046, China
2
Collaborative Innovation Center of Green Mining and Ecological Restoration for Xinjiang Mineral Resources, Urumchi 830046, China
3
Key Laboratory of Autonomous Universities for Environmentally Friendly exploitation of Mineral Resources, Urumchi 830046, China
*
Author to whom correspondence should be addressed.
Minerals 2022, 12(11), 1428; https://doi.org/10.3390/min12111428
Submission received: 14 October 2022 / Revised: 6 November 2022 / Accepted: 8 November 2022 / Published: 10 November 2022
(This article belongs to the Special Issue Backfilling Materials for Underground Mining, Volume III)

Abstract

:
Coal mine backfilling can effectively prevent large-scale movement of rock formations, not only improving the overall production capacity of the mine but also protecting the surface from destruction and maintaining the original ecological environment. Backfilling extent and backfills compactness are two factors determining the supporting effect on the overburdens in underground coal mines. To make full use of the aeolian sand as the backfill materials in underground coal mines in the desertification areas, Northwest China. Then, vibratory compaction was proposed to enlarge the compactness of these sand-gabion backfills by considering the limited working space. After that, the movement law of the sand particles during vibratory compaction, the influencing law of the vibratory parameters, and the gabion constraint on the ultimate compactness of the sand-gabion backfills were studied using the discrete element software PFC3D from the microscopic point of view. It was found that the aeolian sand particles are more likely to inter-squeeze under vibration than under static load. Furthermore, there are a series of optimal vibratory compaction parameters to the inner aeolian sand for each external gabion constraint strength. The optimal vibration parameters were frequency 50 HZ, excitation force 0.3 MPa, amplitude 40 KPa, and vibration time 4 s. Conclusions of this study can provide references for enlarging the compactness of the sand-gabion backfills in the underground goaf in the desertification area of Northwest China.

1. Introduction

There are a lot of coal resources in northwest China, but the ecological environment in the above areas is severely fragile, and the contradiction between coal mining and ecological, environmental protection is considerably prominent (Figure 1). Xinjiang is the 14th large coal base of the original batch approved by China, and it is estimated that the resource share of Xinjiang is about 40 percent of the whole country [1,2]. Moreover, the coal resources in Xinjiang are mainly shallow and thick coal seams. The damage and movement of the overburden are more violent when the cave-in method is used to treat the gorges than under ordinary conditions of depth and mining height [3,4,5,6,7,8]. Large-scale mining activities are bound to cause serious impact and damage to surface vegetation and groundwater resources and endanger the fragile ecological balance of this region (Figure 2a) [9,10,11,12]. Consequently, fill-in mining has emerged as a key to resolving this contradiction [13,14,15]. Aeolian sand, the most common raw material in Xinjiang’s desertified mining areas, has a wide range of sources and a low price. It is an ideal solid-filling material for targets in this region. However, the approximately zero cohesion of the aeolian sand results in the inability to effectively join the roof during the dry filling of the aeolian sand, which considerably weakens the control effect of the filling on the roof formation [16,17]. In order to solve the problem of difficulty in connecting the top of aeolian sand in the dry filling, the closed outer constraints composed of metal cage and geotextile are used to overcome the fluidity of aeolian sand, reduce the amount of interconnecting the top of aeolian sand in dry filling, and ensure the effect of connecting the top of filling body (Figure 2b) [18].
The compactness of this kind of loose backfill material is a critical parameter affecting its bearing performance. The bearing properties of the sand-gabion backfill will be divided into three phases. In the early stage of filling, aeolian sand has low compactness and a large number of internal pores, which has a weak supporting effect on the roof and a severe overburden movement [19,20]. In the intermediate stage of backfilling, the internal pores of the aeolian sand are further compressed, and the mesh gabion supports the aeolian sand, resulting in an additional increase in density. The density of the aeolian sand is at its highest during the later stages of backfilling, which gives the roof the best support. Therefore, it is considerably valuable to study the compactness of sand cage material in the early stage of filling, to improve the deformation modulus of the filling body, increase the bearing capacity of the filling body and reduce the compression deformation of the filling body in the later stage (Figure 3) [21]. Scholars have done a lot of research on this, and the main conclusions are as follows: Zhang et al. revealed the developmental rule of the hysteresis curves of waste tire rubber-mixed-sand samples under cyclic loading [22]. Chang et al. found the load-response mechanism of a surface raft foundation model in clay and in sand subjected to vertically uniform loads using the 3D FE analysis [23]. Liu et al. used the filling coefficient, different structural types of mixture composition were verified, and the California Bearing Ratio was used to test and analyze the specimens with different mixtures, grading, and structural classification. The results show that the porosity of the main skeleton calculated with the model established using the discrete element software Particle Flow Code and the porosity obtained with the tamping test fit well [24]. In Wang et al., a number of large-scale cyclic triaxial tests were performed on saturated gravelly soil reinforced. The test results reveal that the cumulative axial strain decreases as the number of reinforcement layers increases with loading frequency [25]. Zhang et al. conducted surface vibration and shaking table compaction tests on aeolian sand in the Tengger Desert and believed that the maximum dry density obtained by the surface vibration method was close to the field test results and proposed vibration compaction parameters and construction technology of eolian sand [26].
Loose filling materials are affected not only by internal physics and mechanics but also by external constraints. Although there has been a lot of valuable research on the compaction of loose filling materials (coal gangue, etc.), they have not been conducted under the condition of lateral restraint, and there is still little research on loose filling materials under the constraint of fixed force. In this paper, the influence law of vibration parameters and gabion constraint on the compactness of the aeolian sand are researched using the PFC3D numerical simulation method. In addition, it is of great significance to study the confined compression deformation characteristics of sand-gabion backfill with different initial densities in mined-out areas of desertification mining areas for the prediction and evaluation of the overburden control effect of sand-gabion backfill mining.

2. Materials and Methods

The experiments in this paper consist of three parts (Figure 4). The first part is a physical consolidation test to obtain the consolidation curve. The second part is the numerical simulation of the physical consolidation test, which leads to the matching of the consolidation curve with the corresponding microscopic parameters. In the third section, the microscopic parameters obtained from the consolidation numerical simulation experiments are applied to the sand-gabion packing body, which is tested for vibration and static load.

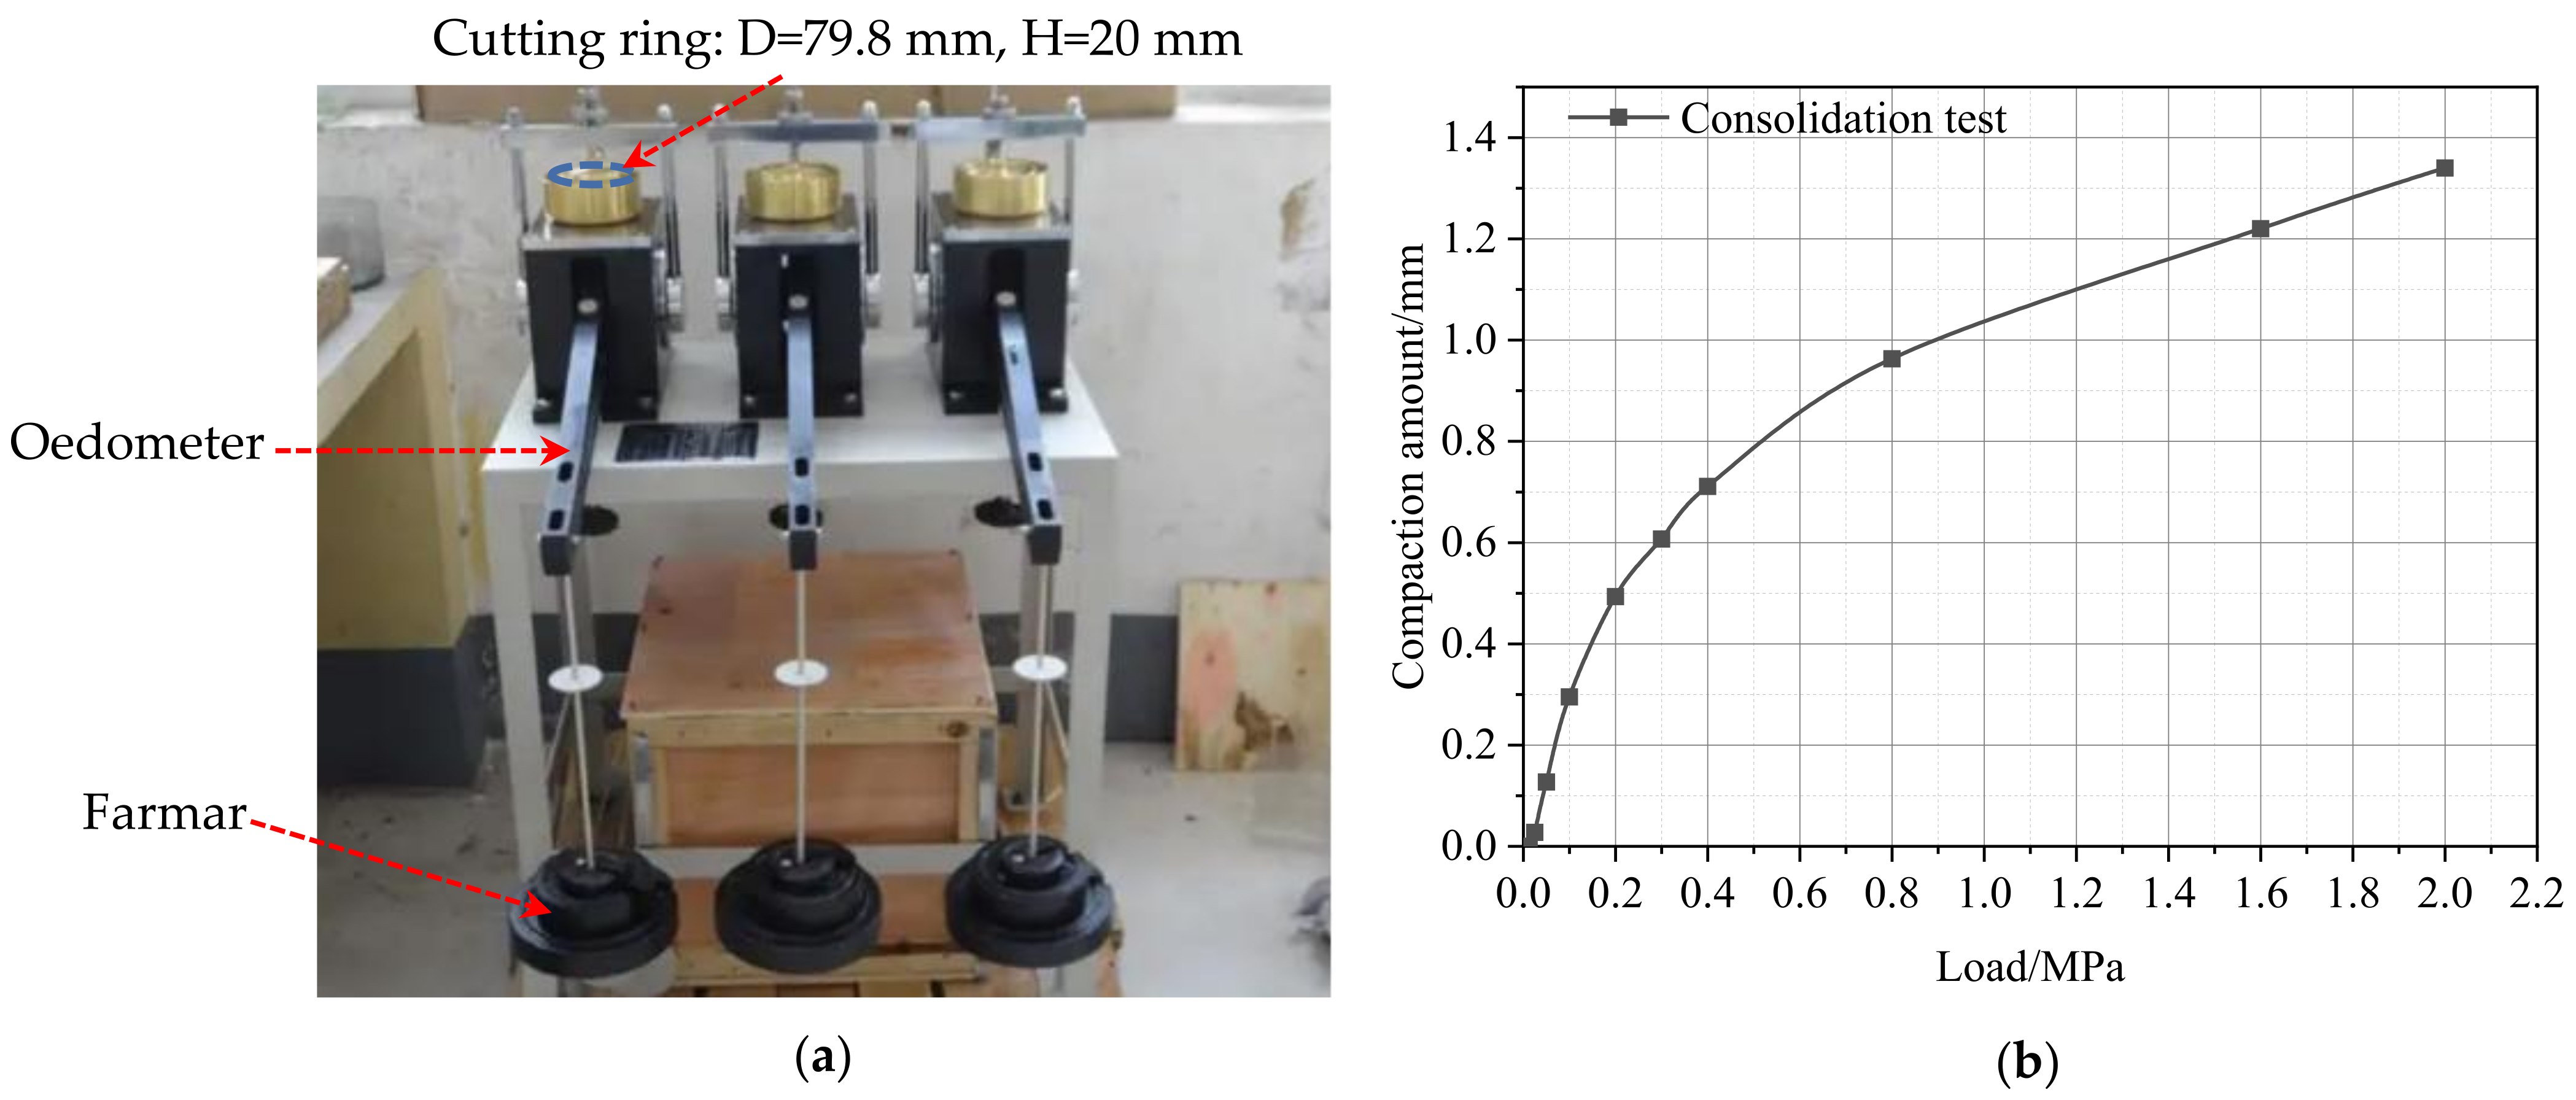
2.1. Consolidation Test of Aeolian Sand

A ring cutter with a standard size of D = 79.8 mm × H = 20 mm was selected for the aeolian sand consolidation experiment [27]. The pressure levels applied in the experiment were 12.5 KPa, 25 KPa, 50 KPa, 100 KPa, 200 KPa, 300 KPa, 400 KPa, 800 KPa, 1600 KPa, and 2000 KPa, respectively. The standard experimental process is as follows (Figure 5):
  • The aeolian sand is put into the consolidated container, and the protective ring, filter paper, permeable plate, and pressurized cover are placed on the sample successively;
  • Place the consolidation container in the pressure frame of the consolidation instrument, install the dial indicator, and apply 1 KPa pre-pressure to set the dial indicator to zero;
  • Apply the primary load of 12.5 KPa, record the reading, and then load step by step;

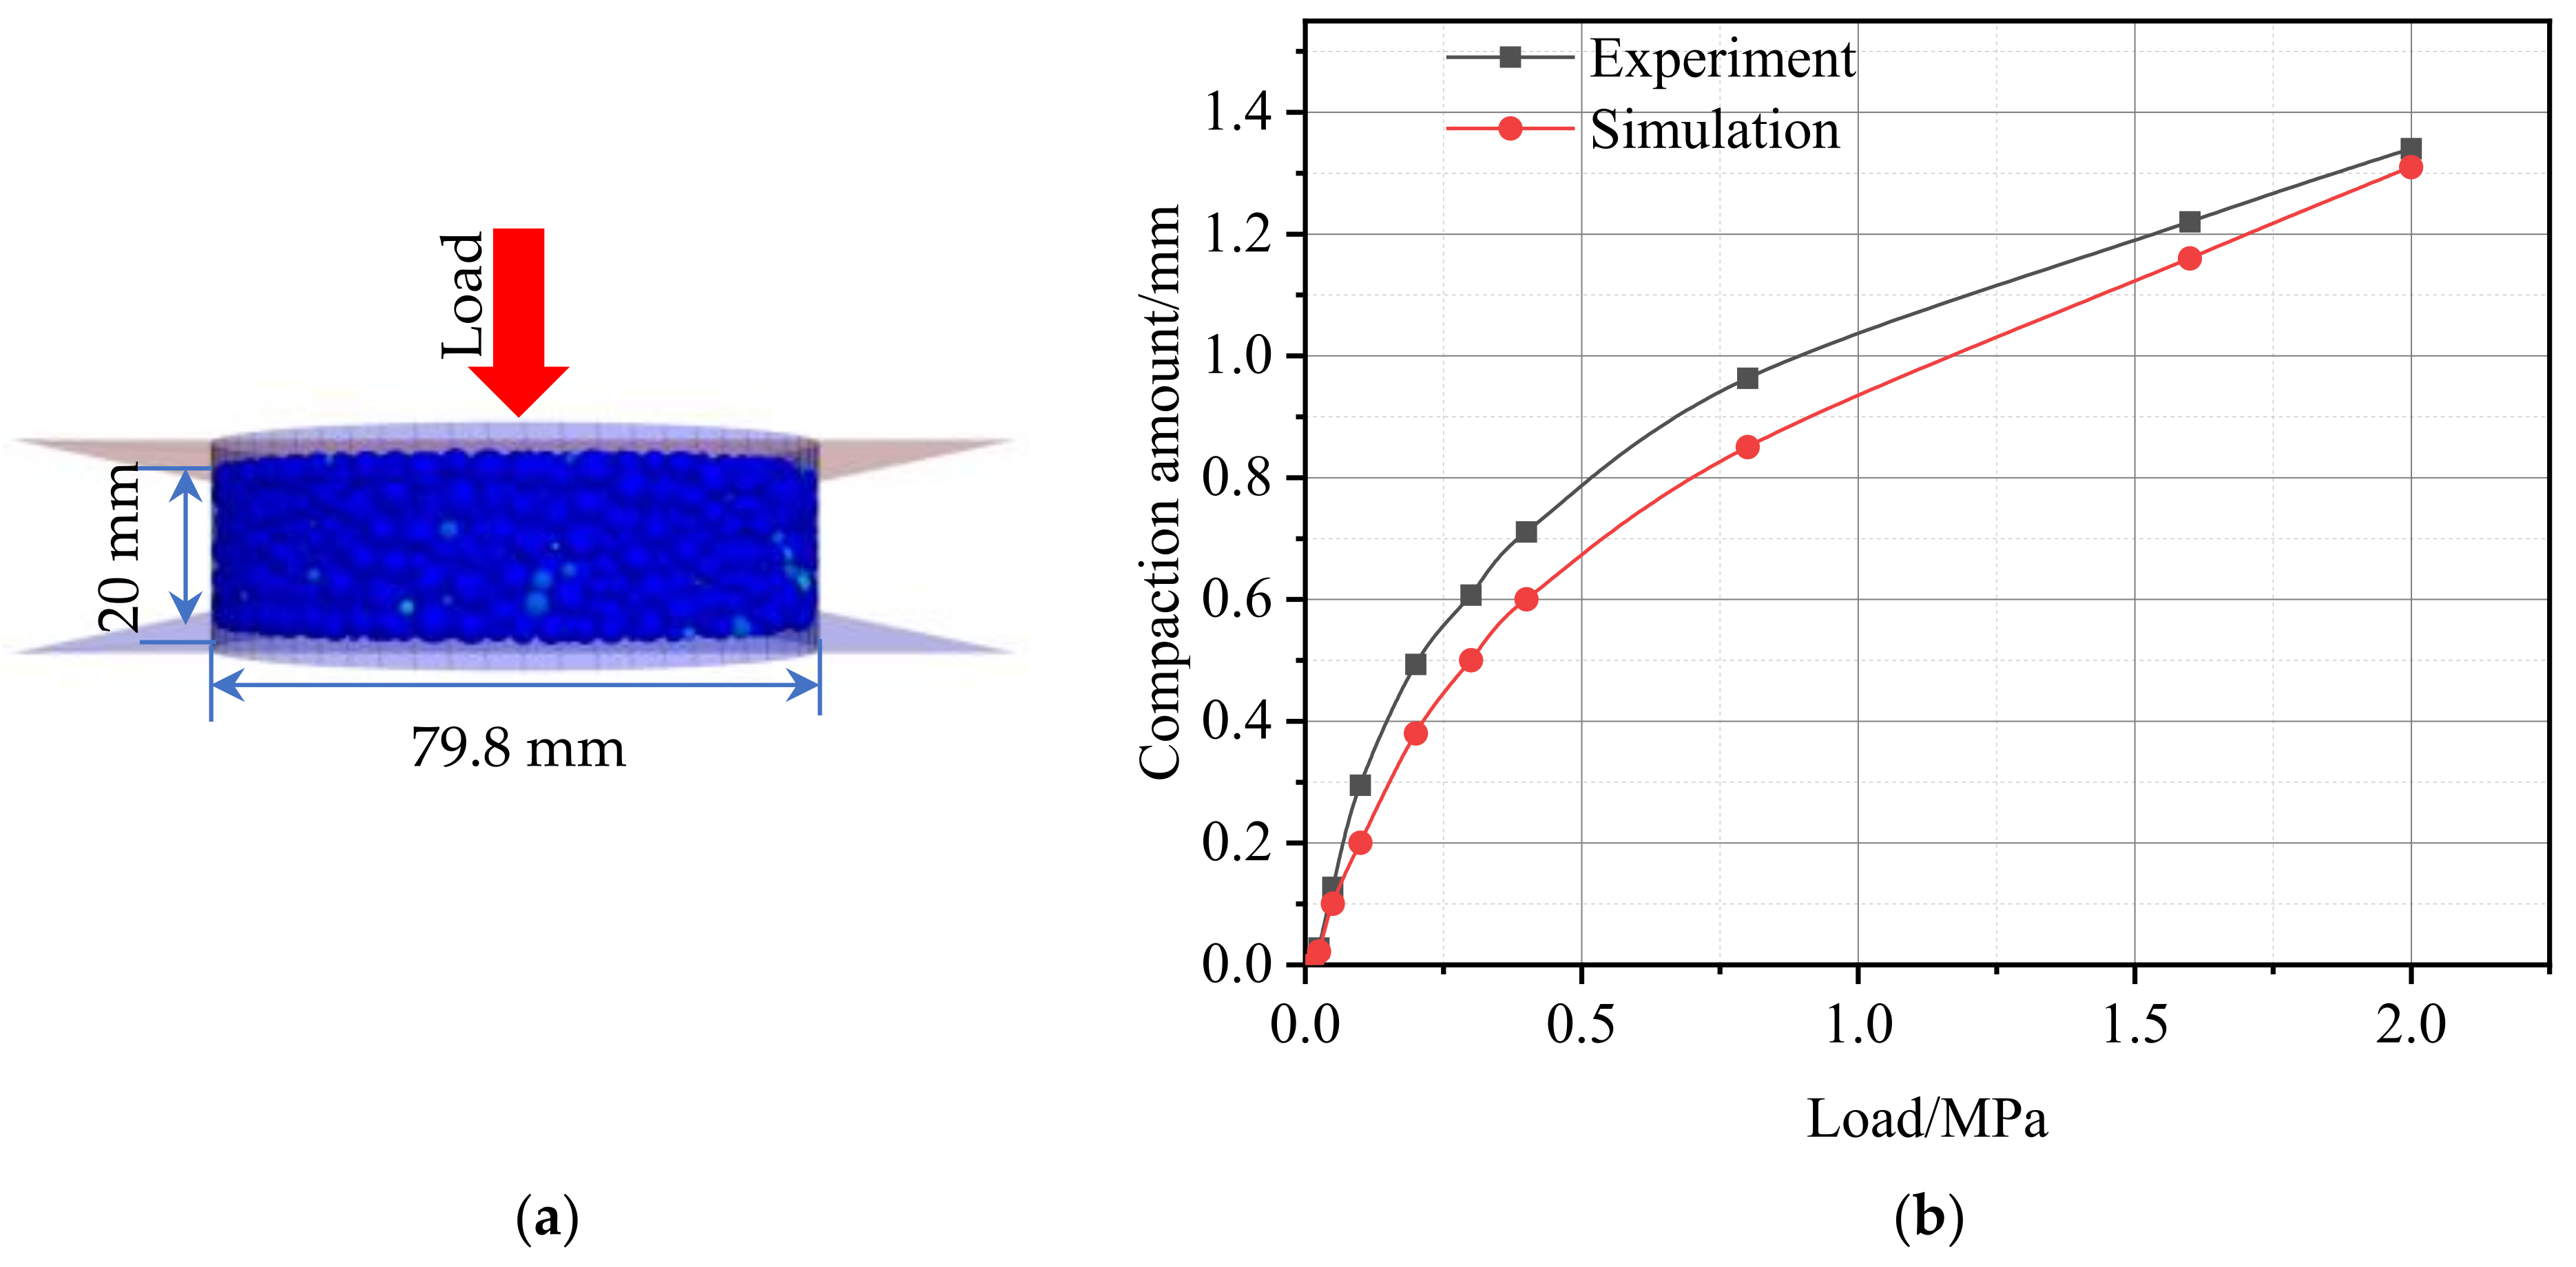
2.2. Numerical Simulation of Consolidation Experiment

In the range of D = 79.8 mm × H = 20 mm, 4358 particles were rapidly generated using PFC3D software [28,29]. Second, after the particle unbalances force tends to be stable, the aeolian sand sample is compressed under a natural environment of 0.1 MPa. Ultimately, a primary load of 12.5 KPa was applied to the upper wall of the model, followed by pressure to 2000 KPa. The microscopic parameters of aeolian sand selected by the trial-and-error method are shown in Figure 6 and Table 1.

2.3. PFC3D Numerical Simulation of Sand-Gabion Backfill Unit

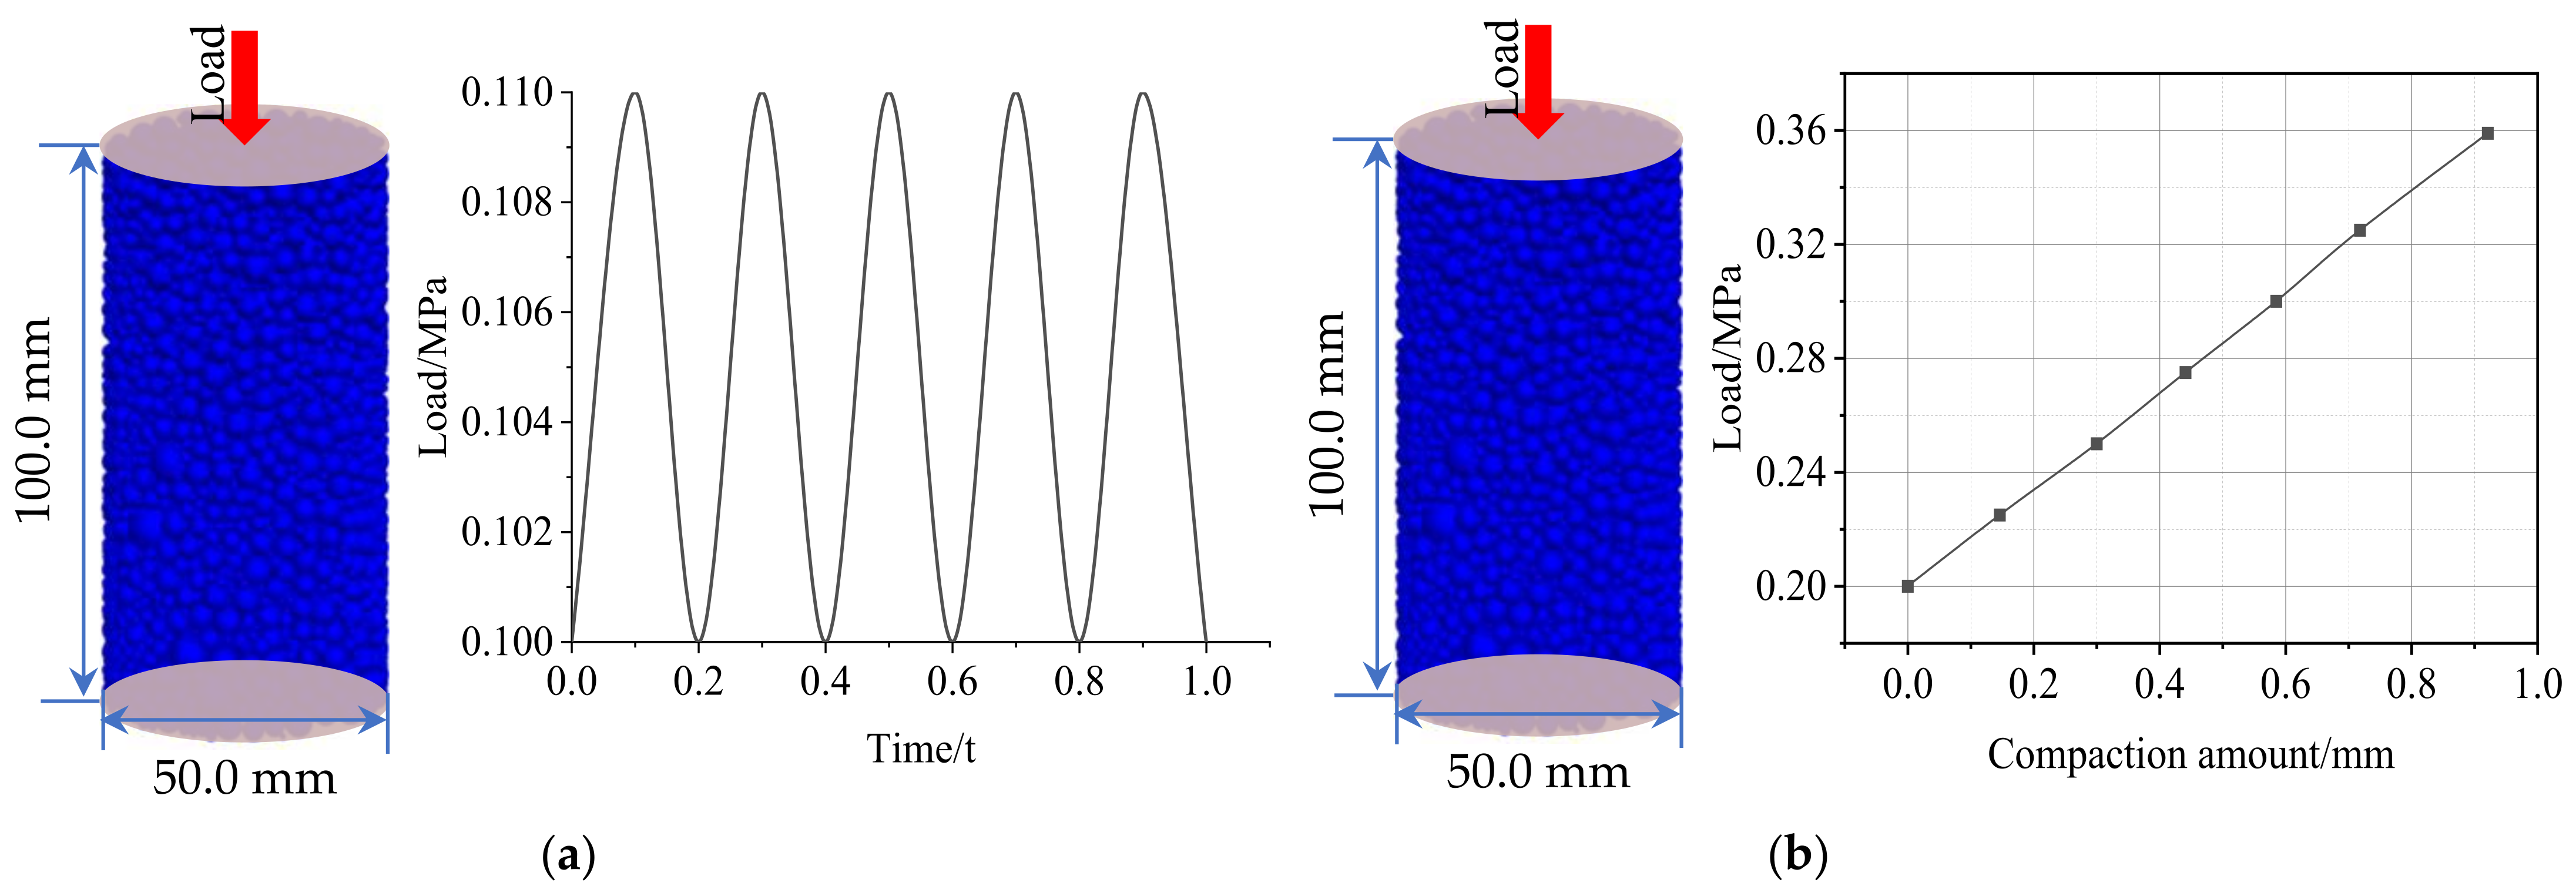
2.3.1. Vibration and Static Load Test

The PFC3D software was used to generate 8704 particles in the range of D = 50 mm × H = 100 mm, and the model was subjected to bidirectional vibration loading under different sand-gabion constraints [31,32,33]. The experimental vibration scheme is shown in Figure 7 and Table 2. Five factors, including frequency, amplitude, excitation force, vibration time, and sand-gabion binding force selected, and four levels are set for each factor (Frequency f: 20 HZ, 30 HZ, 40 HZ, 50 HZ [34]; Excitation force F: 0.1 MPa, 0.2 MPa, 0.3 MPa, 0.4 MPa; Amplitude A: 10 KPa, 20 KPa, 30 KPa, 40 KPa; Vibration time t: 1 s, 2 s, 3 s, 4 s; sand-gabion G:10 KPa, 20 KPa, 30 KPa, 40 KPa), and a single experiment was conducted for each factor. The static load experiment, however, is a modification of the vibrational test model to a bidirectional static load. Four groups of static load tests with different loads (0.229 mm, 0.233 mm, 0.24 mm, 0.25 mm) were carried out on the samples.

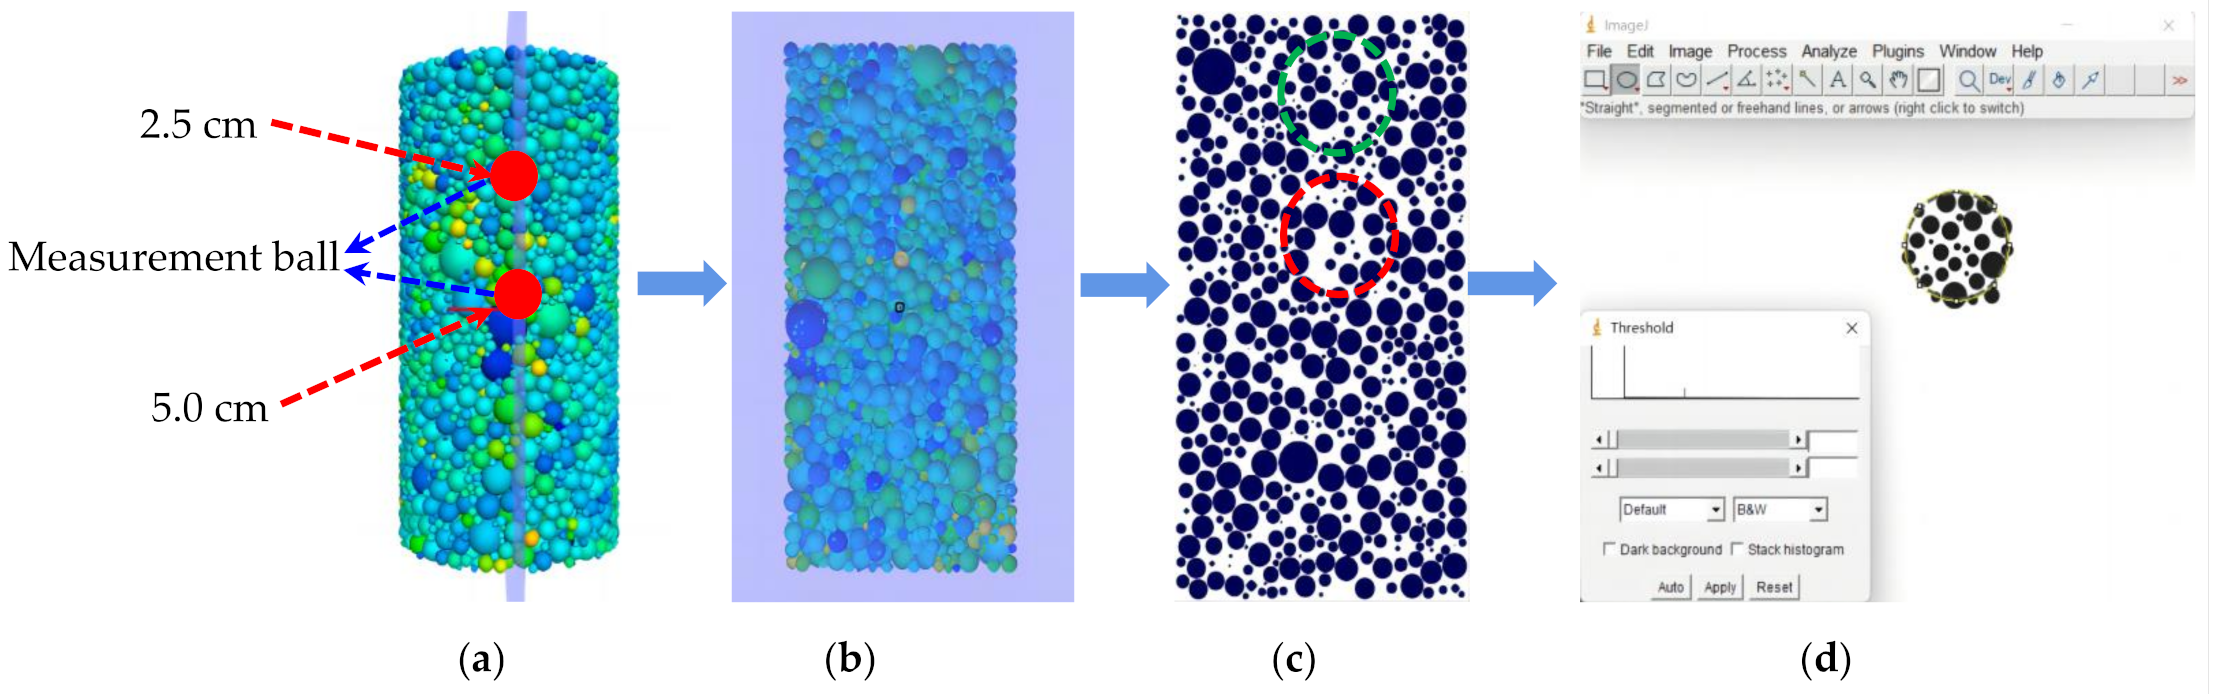
2.3.2. Monitoring Methods and Indicators

  • Compaction degree
The pressure propagates in the longitudinal direction inside the aeolian sand. It produces different velocities of particles at various locations under its action. In the presence of static or dynamic loading, minute internal particles fill the pores of the aeolian sand. The net velocity V due to loading will lead to a corresponding cumulative plastic deformation of the aeolian sand, reducing the compactness of the aeolian sand to varying degrees.
2.
Porosity and particle transport
To study the effect of parameters on porosity during compaction, measurement balls were set at the upper and middle positions of the model to measure the variation law of porosity under different parameters. The location of the measuring ball is shown in Figure 8a.
To have a more intuitive understanding of the movement of particles in aeolian sand, the samples of aeolian sand were first sectioned. Two circular regions with different depths were selected. Finally, the area occupied by particles was identified by using ImageJ fractal software. The slicing process is shown in Figure 8b below.
3.
Contact force chain
Aeolian sand is an aggregate of particles with different particle size gradations composition, which transmits force through contact between particles and forms a force chain network. Consequently, the force chain network between particles can not only represent the meso-structural characteristics of aeolian sand but also have a significant influence on the macroscopic mechanical properties of aeolian sand [35,36]. Both the particle size and color of the force chain are proportional to the magnitude of the contact force. Researching the variation of the force chain of aeolian sand can disclose the interaction of vibration parameters on the force between aeolian sand particles from the microscopic level.

3. Results and Discussions

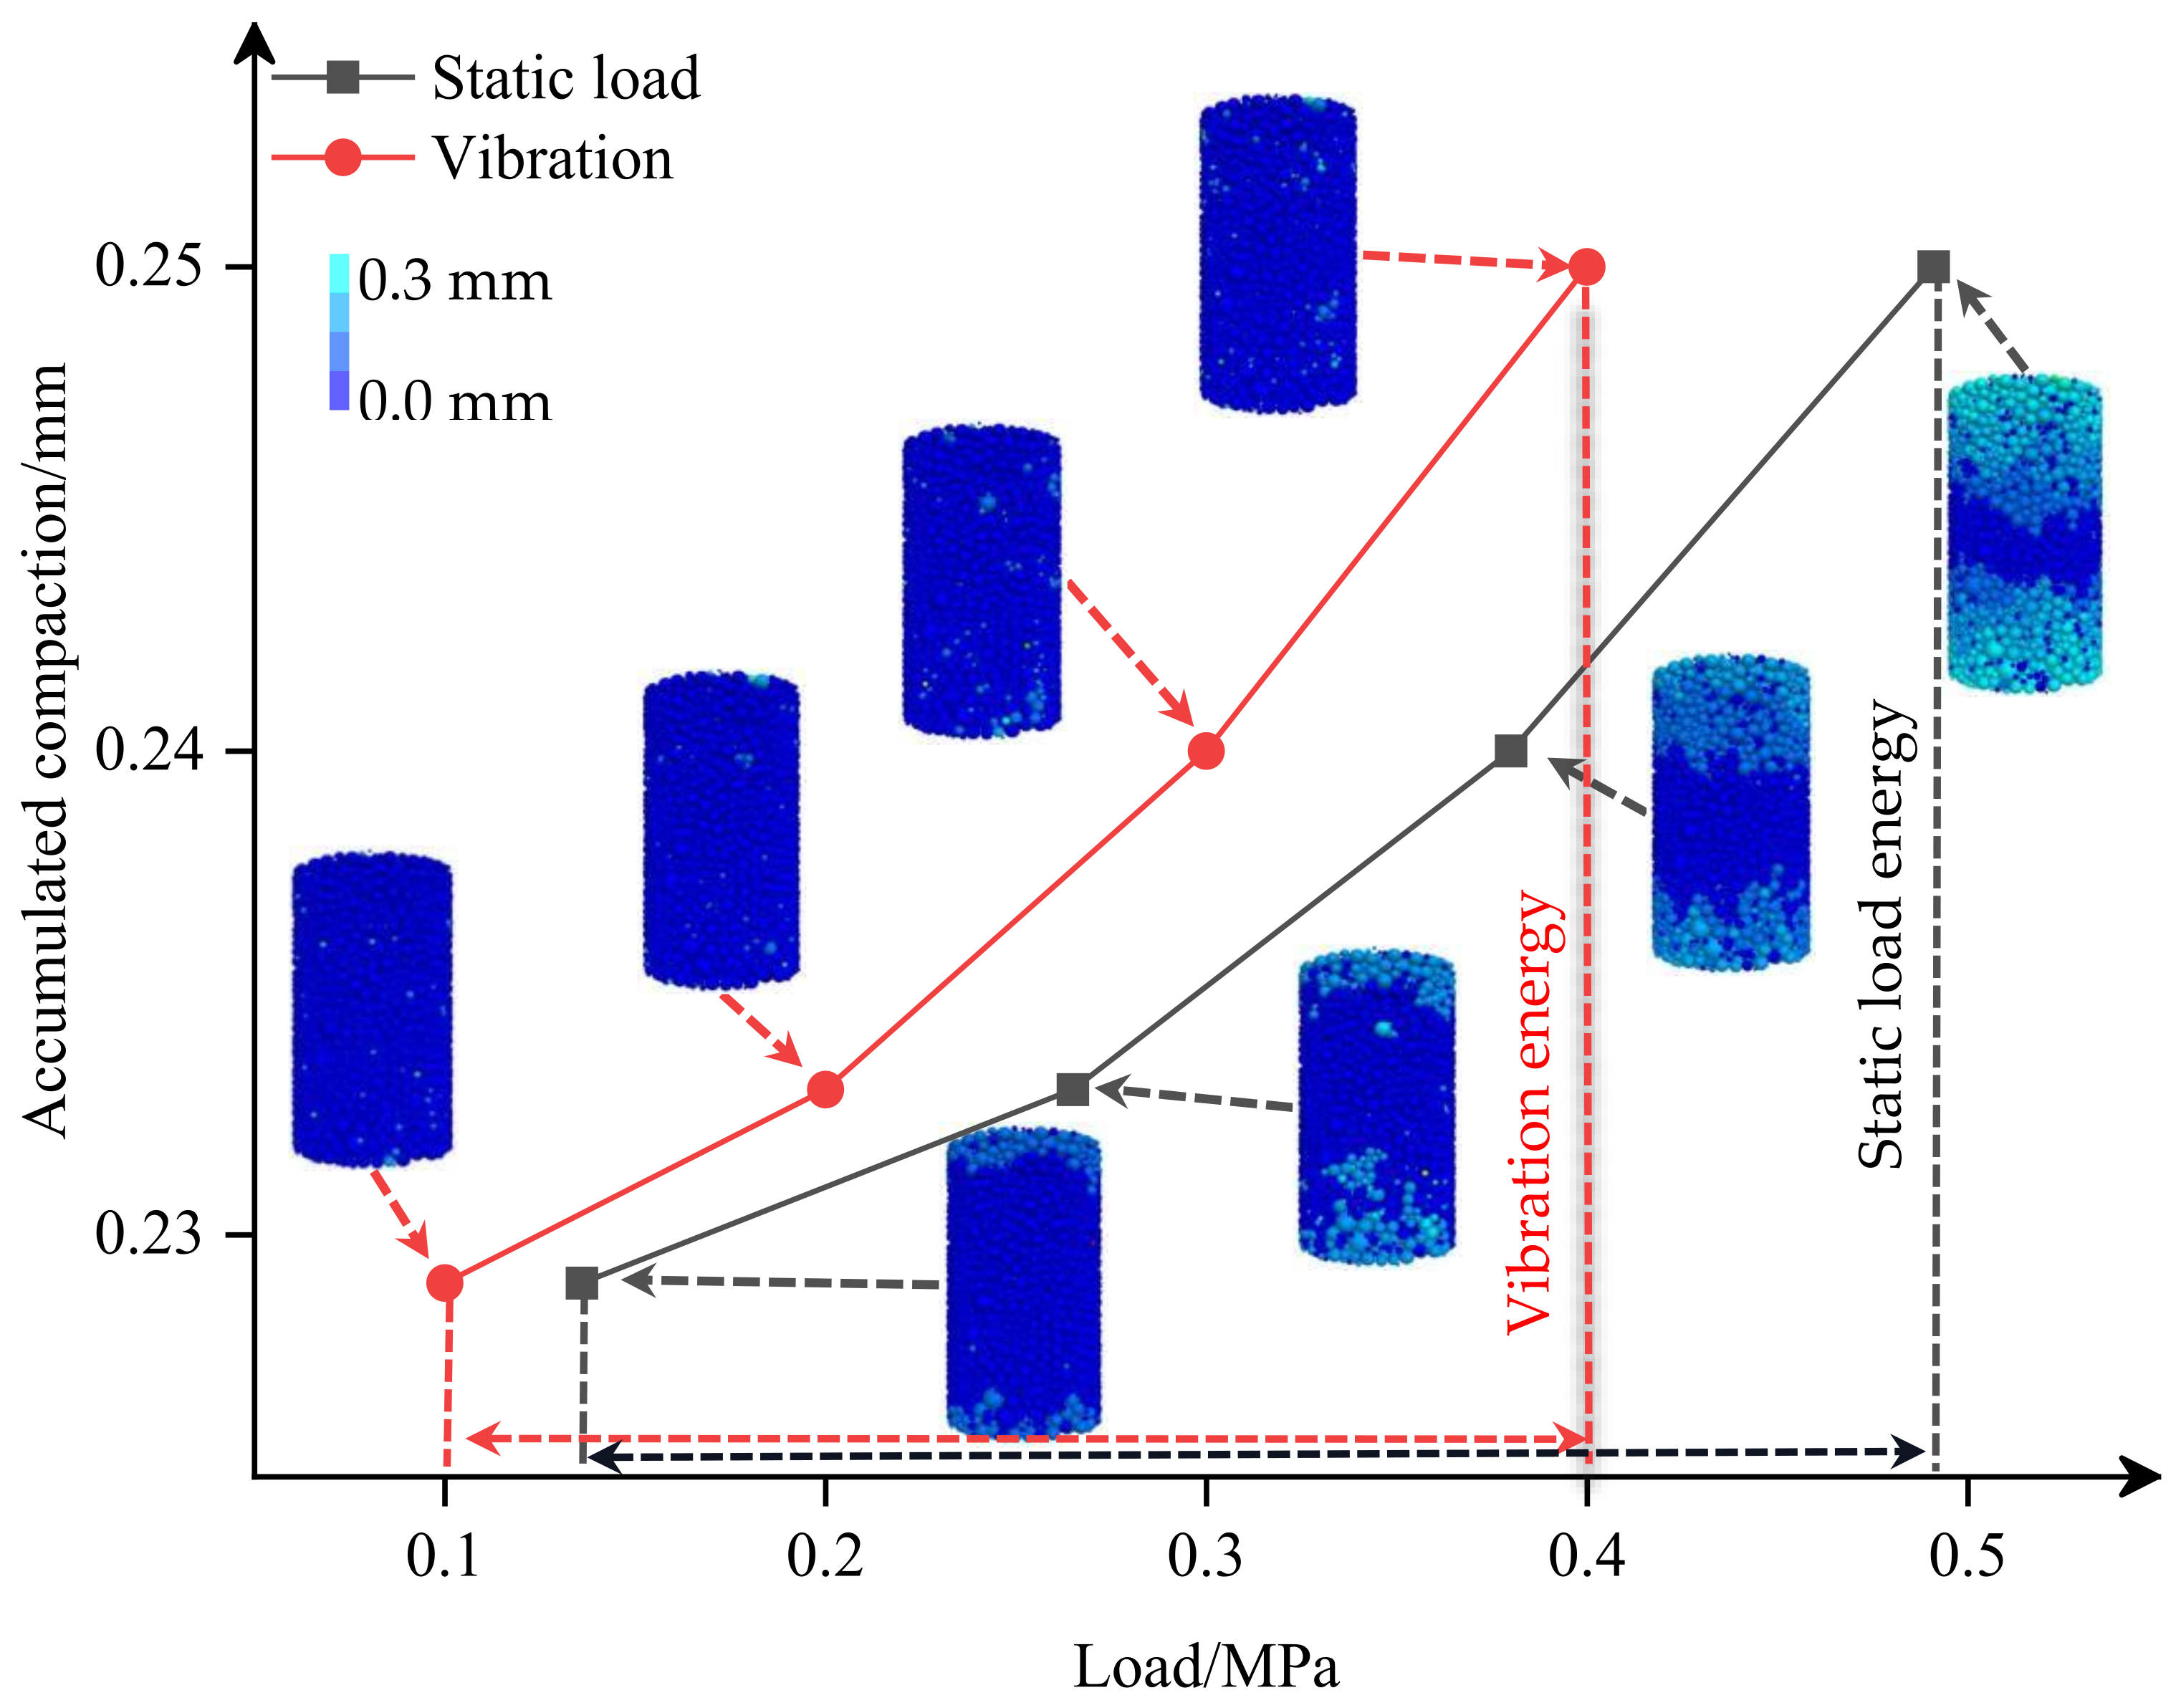
3.1. Comparison between Static and Vibratory Compaction

As can be seen from Table 3, the required load for vibration is 0.1 MPa for cumulative compaction of 0.229 mm, and the required load for static force is 1.36 times the vibration load. The load required for vibration is 0.4 MPa for cumulative compaction of 0.25 mm, and the load required for static force is 1.22 times the load required for vibration. As seen in Figure 9, the particle displacement in the static load mode is mainly concentrated in the upper and lower parts of the sample under the same accumulated compaction amount, and there is no sign of particle movement in the middle position. Although particle displacement by vibration is mainly concentrated in the upper and lower parts, the particles also show apparent movement in the middle position. In addition, the static load energy is larger than the vibration energy when the accumulated compaction increases from 0.229 mm to 0.25 mm.
This phenomenon is because the static mode forces aeolian sand to generate permanent deformation and achieve the purpose of compaction. Under the action of static pressure, the aeolian sand overcomes the friction between the particles and causes damage to the original structure. When the amount of compaction is comparatively tiny, the particles overcome a limited amount of friction and do not require much load. As the compacting gradually increases, the friction between particles increases, making it more difficult for particles to move, requiring larger loads to overcome friction [37]. In this process, the required static load energy increases with the increase of particle friction. The vibration method makes the aeolian sand particles transition from the initial static state to the motion state. It passes through a series of pressure waves to the aeolian sand particles. This pressure wave spreads and propagates downward inside the particle, producing cumulative plastic deformation. Under the action of the vibrating pressure wave, the friction between the wind-accumulated sand particles also transitions from the initial static friction state to the dynamic friction state. Nevertheless, there are many gaps of different sizes between the particles in these non-dense states [38]. The decrease of internal friction force between the particles makes the aeolian sand particles rearrange, squeeze, and embed, resulting in a corresponding increase in the amount and density of the particles in the unit volume.
Figure 10 shows that the porosity of the upper position decreases more than that of the middle position due to the same amount of accumulated compaction. The porosity reduction in vibration mode is more significant than that in static mode in the same position. When the accumulated compaction is 0.25 mm, the reduction of porosity in the upper position of the vibration method is 0.147%, which is 4.36 times that of the static method, and the reduction of porosity in the middle position of the vibration method is 0.14%, which is 9.1 times of static method.
This phenomenon occurs because compaction in a static way mainly acts on the plane and presents a suspended structure. The static pressure method cannot make the particles move effectively and fill the gap, and the improvement of compactness is at the cost of the mutual extrusion of sand particles [39]. The compaction depth of the static load is restricted for aeolian sand. Moreover, under the action of vibration, the aeolian sand presents a skeleton-dense state, and the transfer of stress waves makes the particles at each place of aeolian sand can fill the internal voids. The particle skeleton has a more robust embedding and squeezing effect between them, and the depth of compaction is considerable.
It is clear from the above that the compaction mechanisms of different compaction methods differ. Static compaction relies on the squeezing and destruction of particles to make permanent deformation of aeolian sand, but there is a limit to the compaction effect and the depth influence [40]. Improving the static load infinitely cannot get the corresponding compaction effect but will damage the surface structure of aeolian sand. Vibratory compaction relies on stress waves to change the friction between the particles, and the friction between the particle changes from initial static friction to dynamic friction under the transmission of stress waves. The internal particles are rearranged, extruded, and embedded, resulting in an increase in the number of particles per unit volume and an improvement in compactness.
The compaction process is particularly emphasized in aeolian sand. The results show that the vibrational method is better than the conventional static method and is the ideal method for the compaction of aeolian sand. The vibrational compaction approach addresses the problem of finite space and small mechanical forces in subsurface goaves, which is of particular interest for the filling of goaves in desert regions.

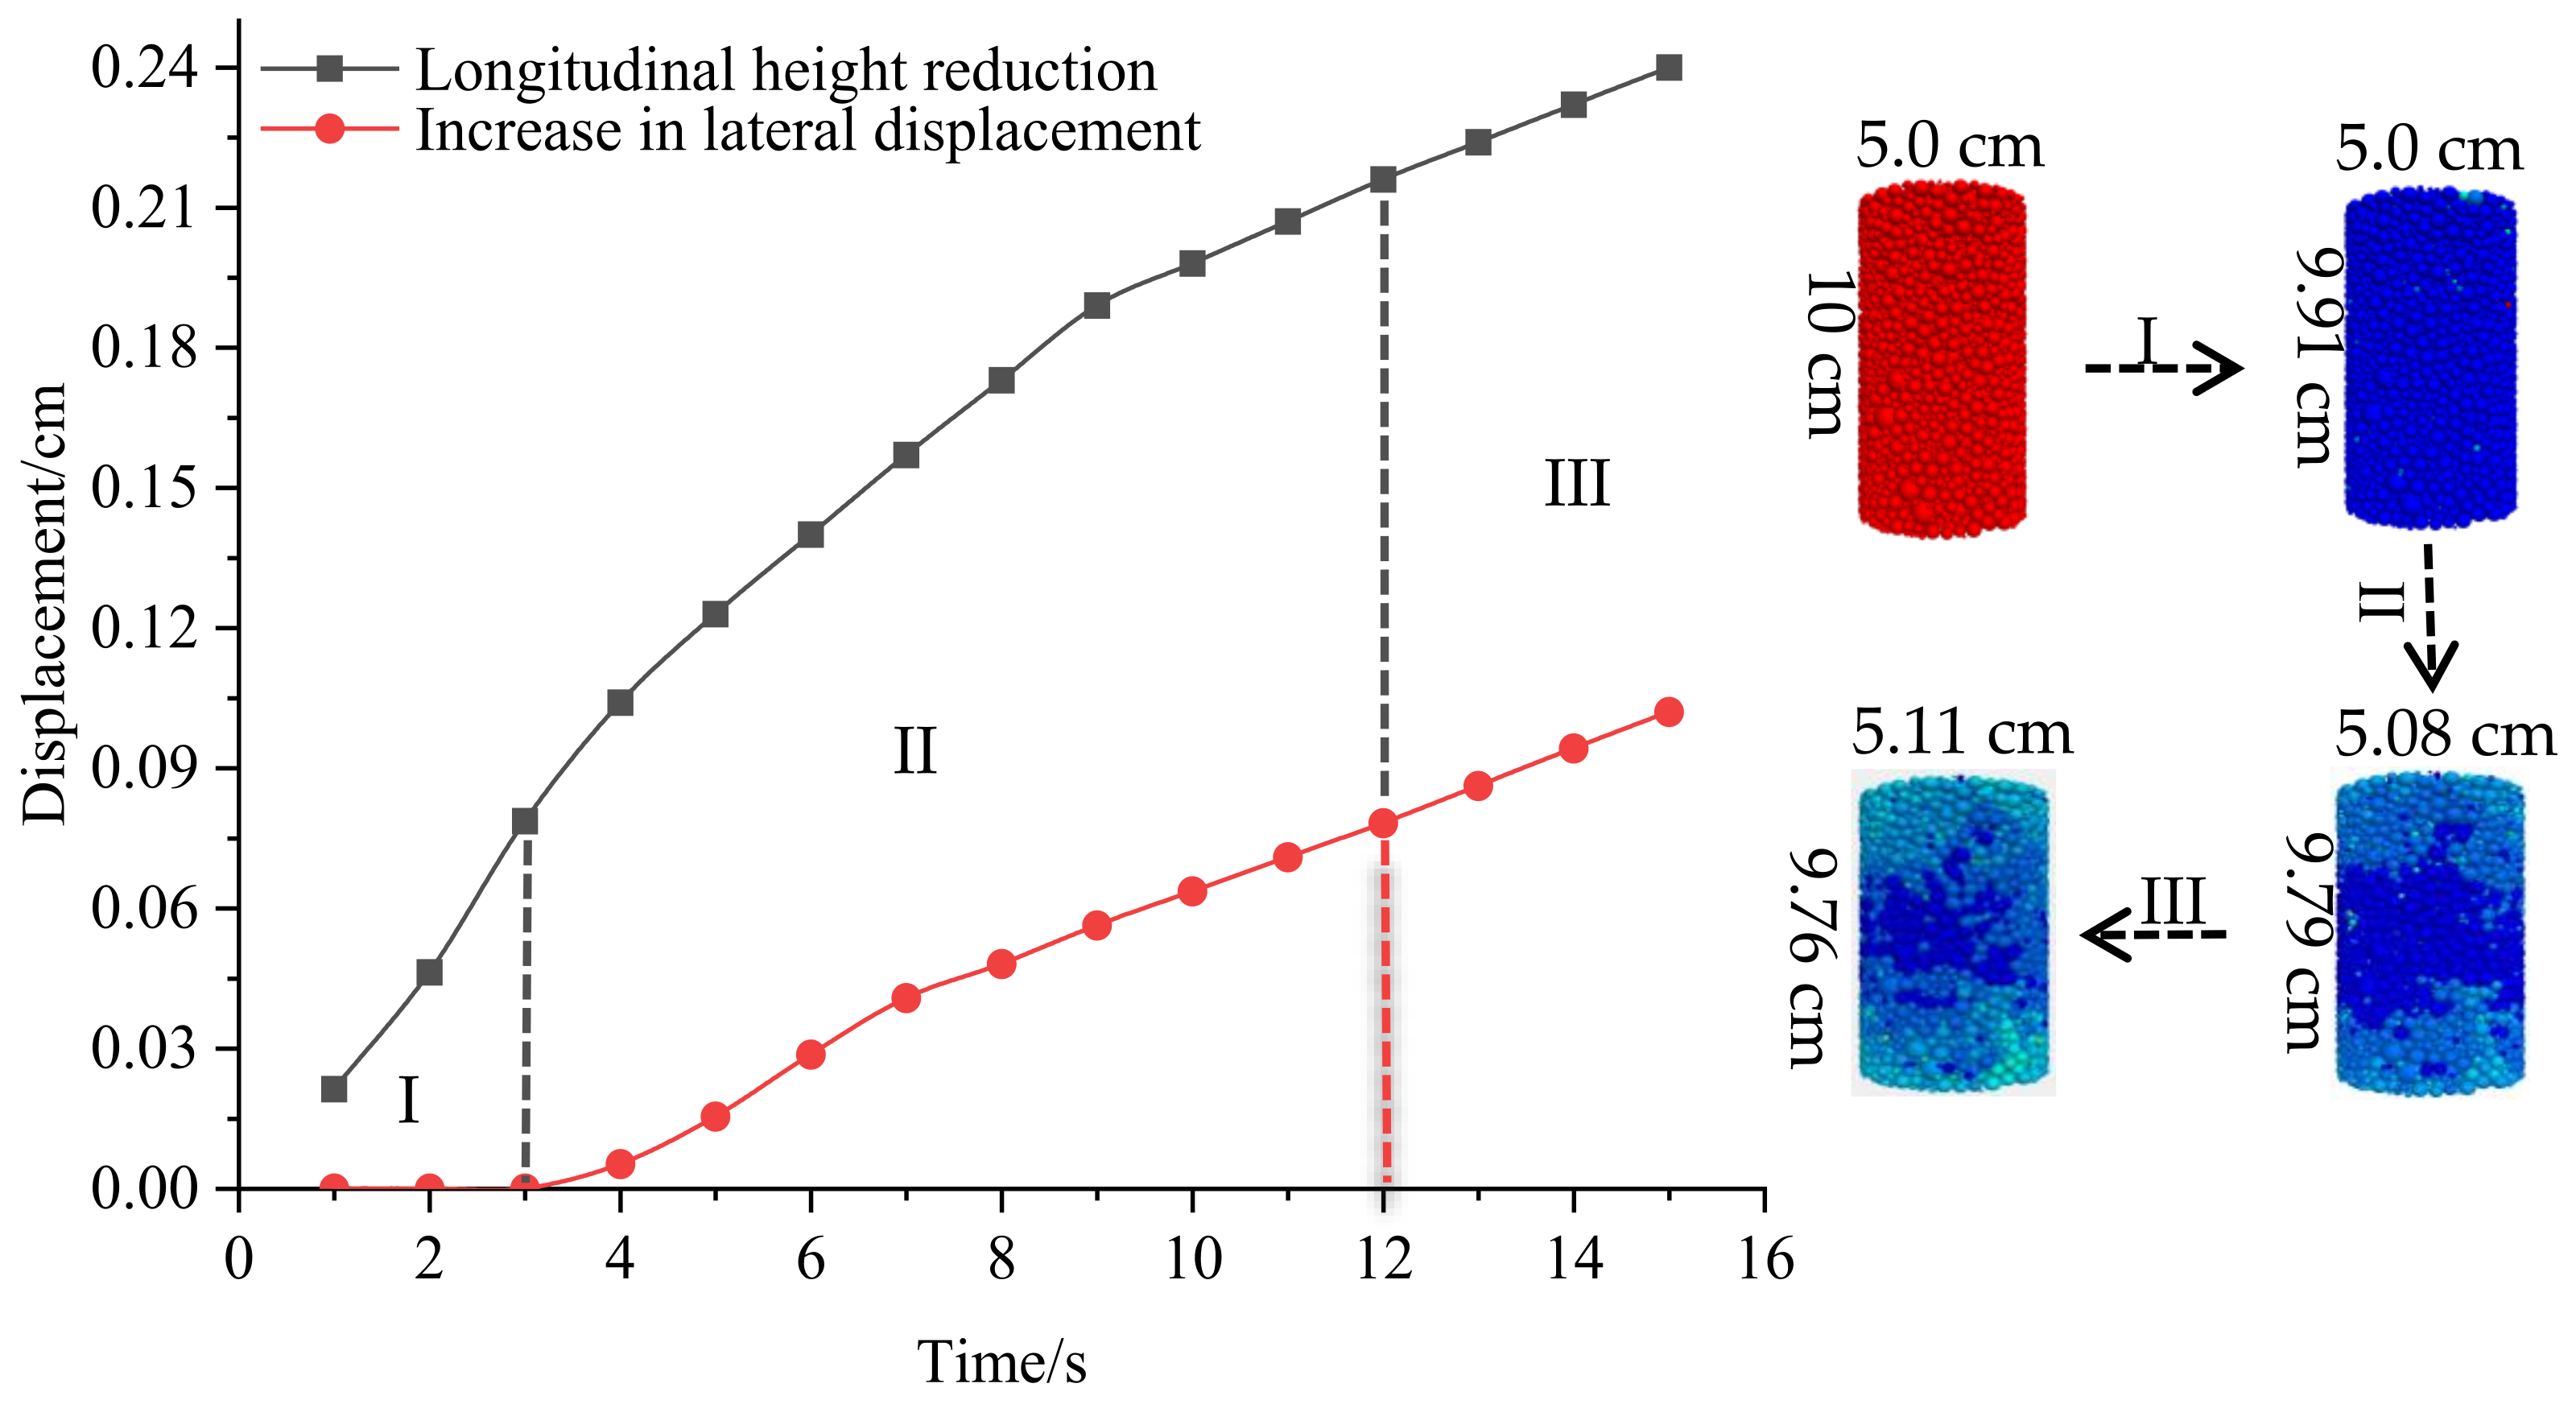
3.2. Movement Law of the Sand Particles during Vibratory Compaction

3.2.1. Compactness Process

As can be seen in Figure 11, the longitudinal height of the sand-gabion decreases continuously from 0 s–12 s and the longitudinal height decreases at the same rate after 12 s. However, the lateral displacement of the sand-gabion does not shift significantly from 0 s–3 s. Still, it increases from 3 s–12 s later, and the longitudinal height increases at the same rate after 12 s.
Appeal case because the sand-gabion filling body is different in the process of compaction stage, and the characteristics of each stage are different, the following the stages respectively: the first stage: Initial stage of compaction of sand-gabion backfill, because of aeolian sand exists a lot of space inside when the vibration load was carried out on the sand-gabion, mainly for the decrease of the longitudinal height. The lateral compaction of the accumulation of sand on the sand-gabion will not be noticeable at this stage, and the compaction will be better [19,20]; Phase 2: Middle stage of compaction of sand-gabion backfill, the compression of the smaller voids requires the reinforcement of the lateral confinement of the sand-gabion since the larger voids inside the aeolian sand are filled by minute grains. In this phase, the vertical height of the sand-gabion decreases. At the same time, the transverse displacement gradually becomes apparent, and the compaction effect diminishes in the third stage. In the late stage of compaction of sand-gabion backfill, the longitudinal compression volume of the sand-gabion filling body will be exclusively offset by the transverse external extrusion volume because the lateral constraint provided by the sand-gabion is not sufficient to allow the internal void to continue to reduce. At this point, the compactness of the aeolian sand in the sand-gabion does not increase.

3.2.2. Movement Law of the Sand Particles

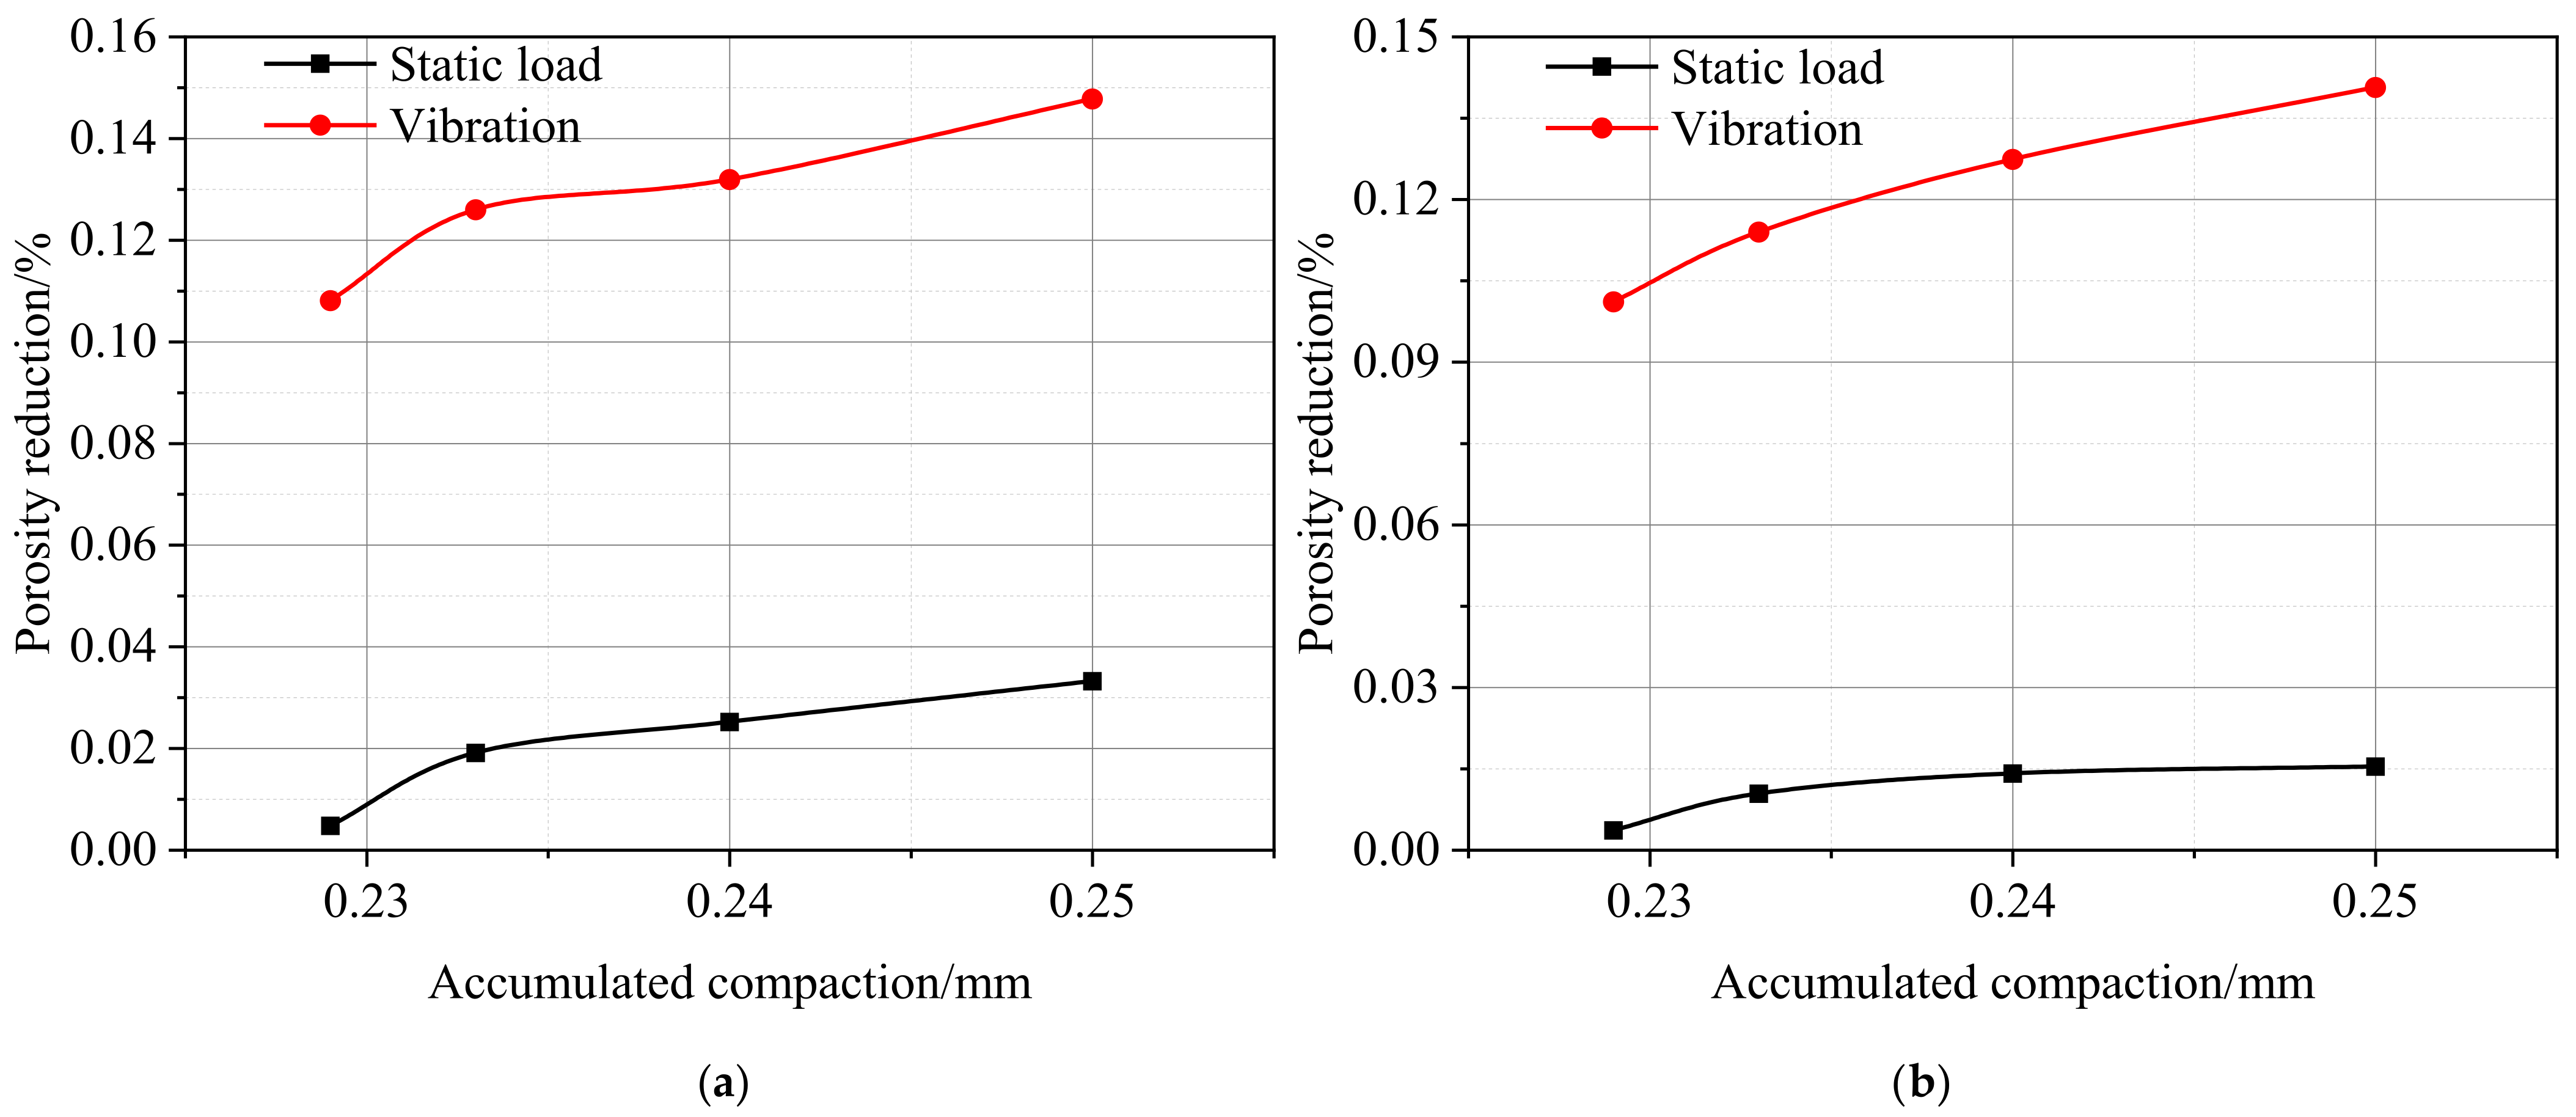
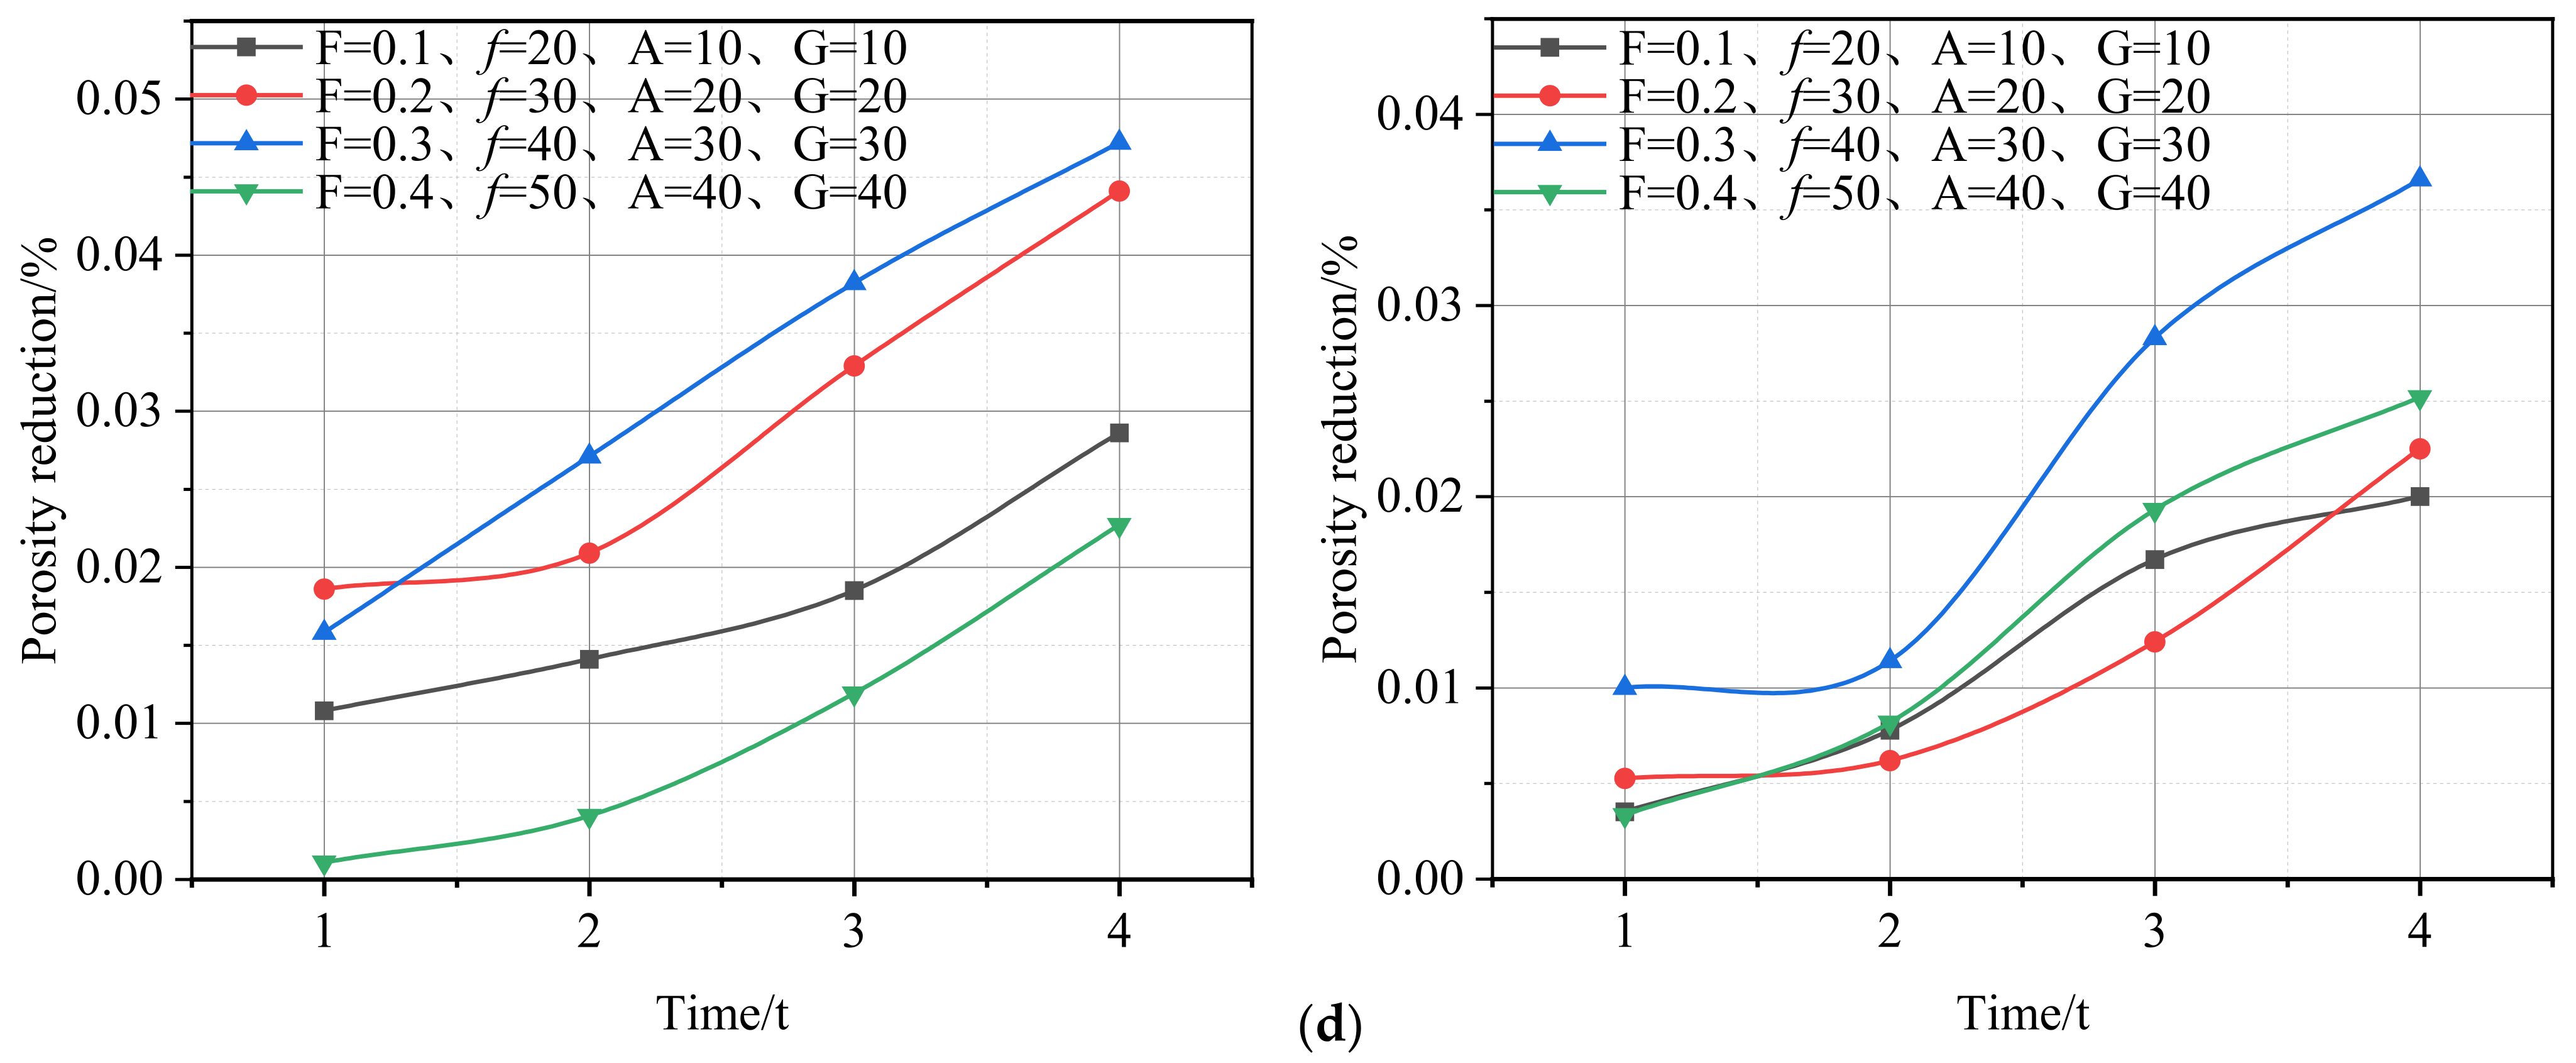
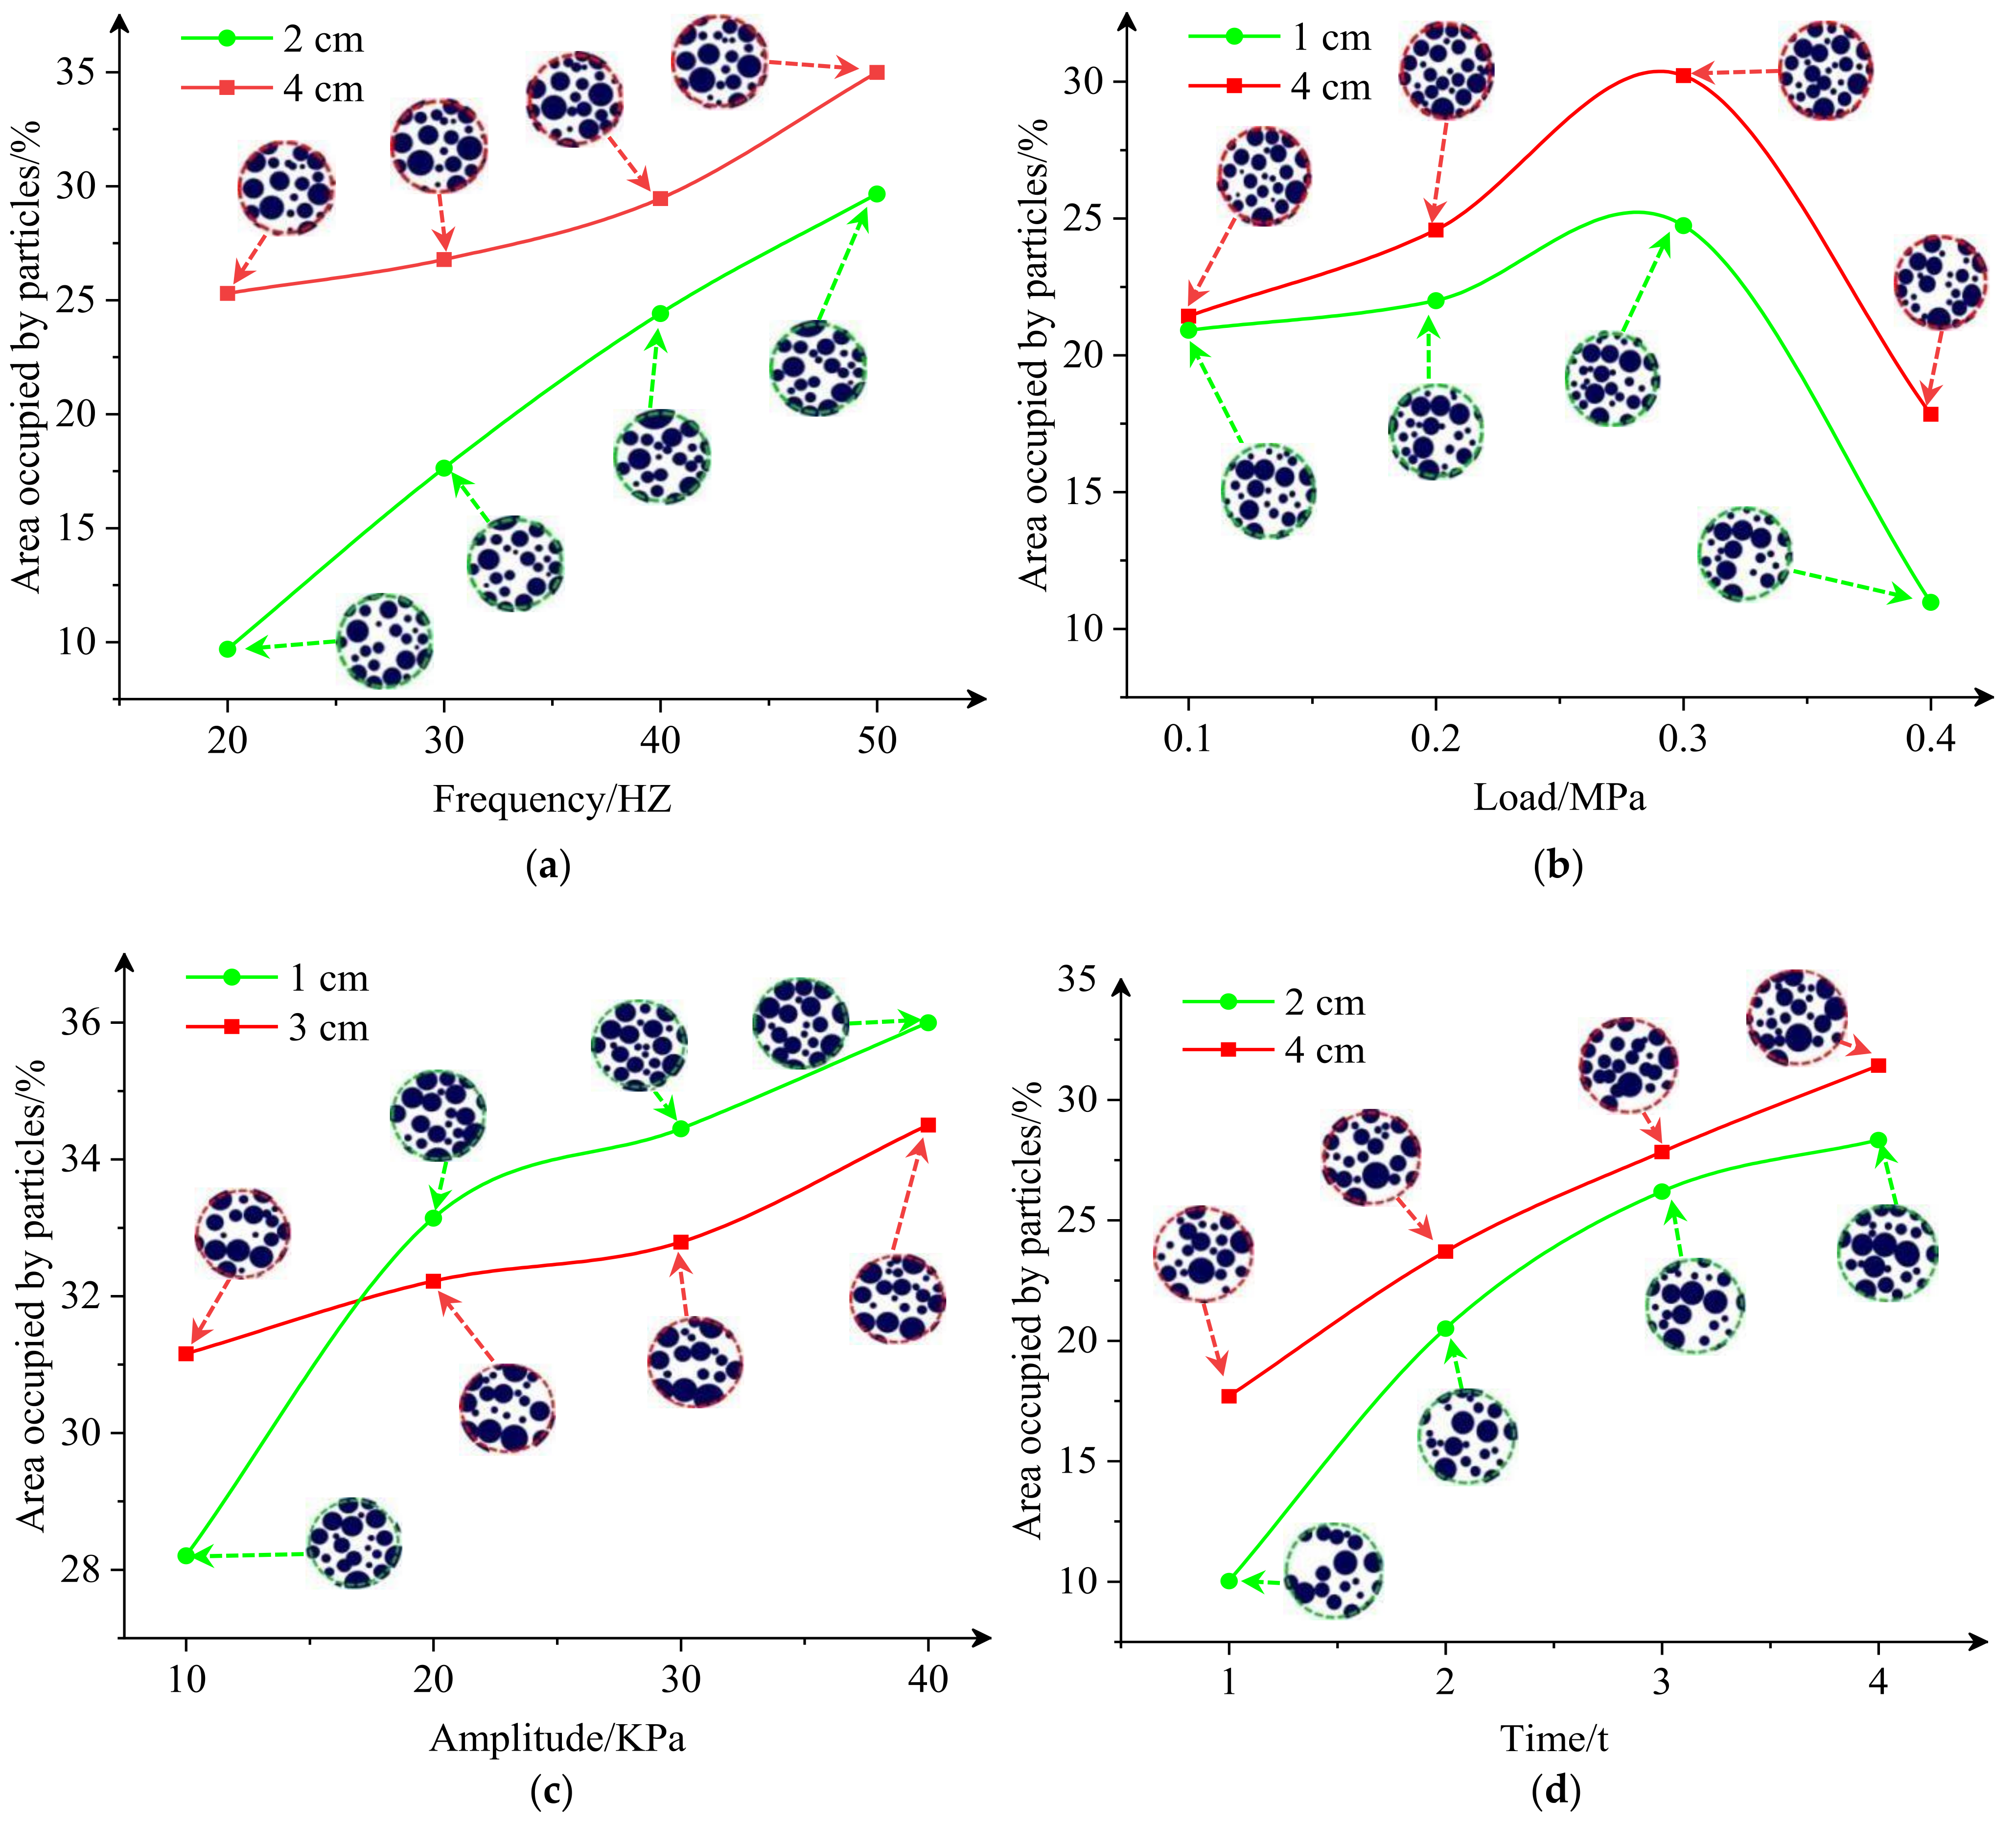
  • The influence of vibration parameters on the porosity and particle transport of Sand-gabion backfill material
Figure 12a shows that porosity reduction in the upper and middle positions of aeolian sand increases with the frequency increase at different frequencies in the same component. The maximum reduction of porosity in the upper and middle positions was 0.076% and 0.04%, respectively, under the same frequency of different components.
This phenomenon is because the transfer of stress wave energy decreases step by step from top to bottom. When the resonance effect affects the wind accumulation of sand particles, the upper particles’ equilibrium state is first broken [41]. The upper particles overcome the friction and start to move relative to each other, the small particles fill the gaps between the large particles, and the porosity of the upper position decreases rapidly. However, when the vibration energy is transferred to the middle position, due to the reduction of energy, the particles can only move in a small range, and the porosity changes are relatively small.
Figure 12b shows that the porosity reduction in the upper and middle positions of aeolian sand increases with the force when the excitation force in the same component is between 0.1 MPa and 0.3 MPa. When the excitation force is between 0.3 MPa–0.4 MPa, the porosity reduction in the upper and middle positions of aeolian sand increases with force. The maximum reduction of porosity in the upper and middle positions was 0.11% and 0.053%, respectively, under the same amplitude of different components.
The reason for the above phenomenon is that the vibration pressure destroys the occlusion force between the particles so that the aeolian sand particles can move freely. The particles close to the vibration source produce a more significant acceleration; at the same distance, the acceleration of small particles is greater than that of large particles. Thus, the particles inside the aeolian sand are in perpetual relative motion, making it easier for small particles to enter the gap between large particles [42]. As the excitation force increases, the greater the vibration pressure generated, the faster the relative movement of the particles in the aeolian sand and the corresponding increase in porosity reduction [43]. Nevertheless, when the excitation force reaches a certain level, the inertia force on the particle increases, thus offsetting part of the vibration pressure, resulting in smaller particle acceleration and a corresponding decline in porosity reduction.
Figure 12c shows that the reduction of porosity in the upper and middle positions of aeolian sand increases with the increase of amplitude at different amplitudes in the same component. The maximum reduction of porosity in the upper and middle positions was 0.068% and 0.064%, respectively, under the same amplitude of different components.
The reason for the above phenomenon is that the larger the vibration energy is, the stronger the rearrangement effect of aeolian sand particles will be, and the more significant the porosity reduction will be. The vibration energy decreases along the longitudinal depth, and the energy transmitted down by the vibration source has a more significant effect on the rearrangement of the particles at the upper position [44]. Due to the reduction of energy when transferring to the middle, the rearrangement effect of aeolian sand particles in the middle position is not strong, and the reduction of porosity in the middle position is reduced accordingly.
Figure 12d shows that the porosity reduction in the upper and middle positions of aeolian sand increases with the increase of vibration time at different vibration times in the same component. The maximum reduction of porosity in the upper and middle positions was 0.047% and 0.0366%, respectively, under the same amplitude of different components.
The reason for the above phenomenon is that, with the increase of time, the particles’ movement range is broader, and the gap of different positions in aeolian sand is continuously filled so that the sample is more compact [45]. The reduction of porosity is constantly increasing. As the lower particles are hindered and buffered by the upper particles, the particles are not easy to move, and the movement range of particles is small, so the porosity reduction is correspondingly reduced.
From Figure 13a, the area occupied by aeolian sand particles increased from 9.684% to 29.66% during the process of frequency increase from 20 HZ to 50 HZ at the position of 2 cm of the specimen, an increase of 300%. In the frequency increase from 20 HZ to 50 HZ at the position of 4 cm of the sample, the area occupied by aeolian sand particles increases from 25.296% to 34.989%, with an increase of 138%.
This phenomenon is because the particles in the upper position are subjected to more energy, making it easier to overcome the friction between the particles. More small particles fill the gap between large particles, resulting in the apparent movement of upper particles. Moreover, the more downward to overcome the friction between the particles is more complex; the aeolian sand particles reduce the range of movement, resulting in the phenomenon of particle movement is not apparent [46].
Figure 13b shows that the area occupied by aeolian sand particles increased from 21.43% to 30.221% during the excitation force increase from 0.1 MPa to 0.3 MPa at the position of 1 cm of the specimen, an increase of 141%. When the excitation force increases from 0.3 MPa to 0.4 MPa, the area occupied by aeolian sand particles is reduced from 30.221% to 17.839%, a reduction of 169%. In the frequency increase from 0.1 MPa to 0.3 MPa at the position of 4 cm of the sample, the area occupied by aeolian sand particles increases from 20.91% to 20.91%, with an increase of 118%. When the excitation force increases from 0.3 MPa to 0.4 MPa, the area occupied by aeolian sand particles decreases from 24.737% to 10.967%, a reduction of 226%.
This phenomenon occurs because as the excitation force increases, the stress wave transmitted from the vibration source gradually increases. The upper position is closer to the vibration source so that the small particles in the wind-deposited sand get more excellent acceleration, which leads to the apparent movement of the upper particles [47]. However, when the excitation force reaches a certain degree, the acceleration obtained by the particles is not enough to move in the aeolian sand in a large area because the inertia force and part of the vibration stress cancel each other, resulting in no apparent signs of particle movement.
From Figure 13c, the area occupied by aeolian sand particles increased from 28.202% to 35.998% during the process of the amplitude increase from 10 KPa to 40 KPa at the position of 1 cm of the specimen, an increase of 128%. In the process of the amplitude increase from 10 KPa to 40 KPa at the position of 3 cm of the sample, the area occupied by aeolian sand particles increases from 31.157% to 34.502%, with an increase of 111%.
This phenomenon is because as the amplitude gradually increases, the vibration energy also increases. The tiny particles in aeolian sand have more energy to move to the gap between the large particles, leading to a significant increase in signs of particle movement at different locations [48]. The energy decreases from top to bottom, and the particles at the bottom do not have enough speed to move to other, more distant gaps. Thus the signs of particle movement are not very obvious.
From Figure 13d, the area occupied by aeolian sand particles increased from 10.019% to 28.334% during the vibration time increase from 1 s to 4 s at the position of 2 cm of the specimen, an increase of 283%. In the process of vibration, time increases from 1 s to 4 s at the position of 4 cm of the sample, and the area occupied by aeolian sand particles increases from 17.691% to 31.419%, with an increase of 176%.
The reason for this phenomenon is that the particles move over a wide range over time so that the pores of aeolian sand are filled. The particles’ upper part is due to moving for a long time to make the upper pore filling denser, which hinders the downward movement of other small particles [49]. Only a tiny part of the particles’ downward movement, resulting in the central location of the particle movement phenomenon, is not apparent.
2.
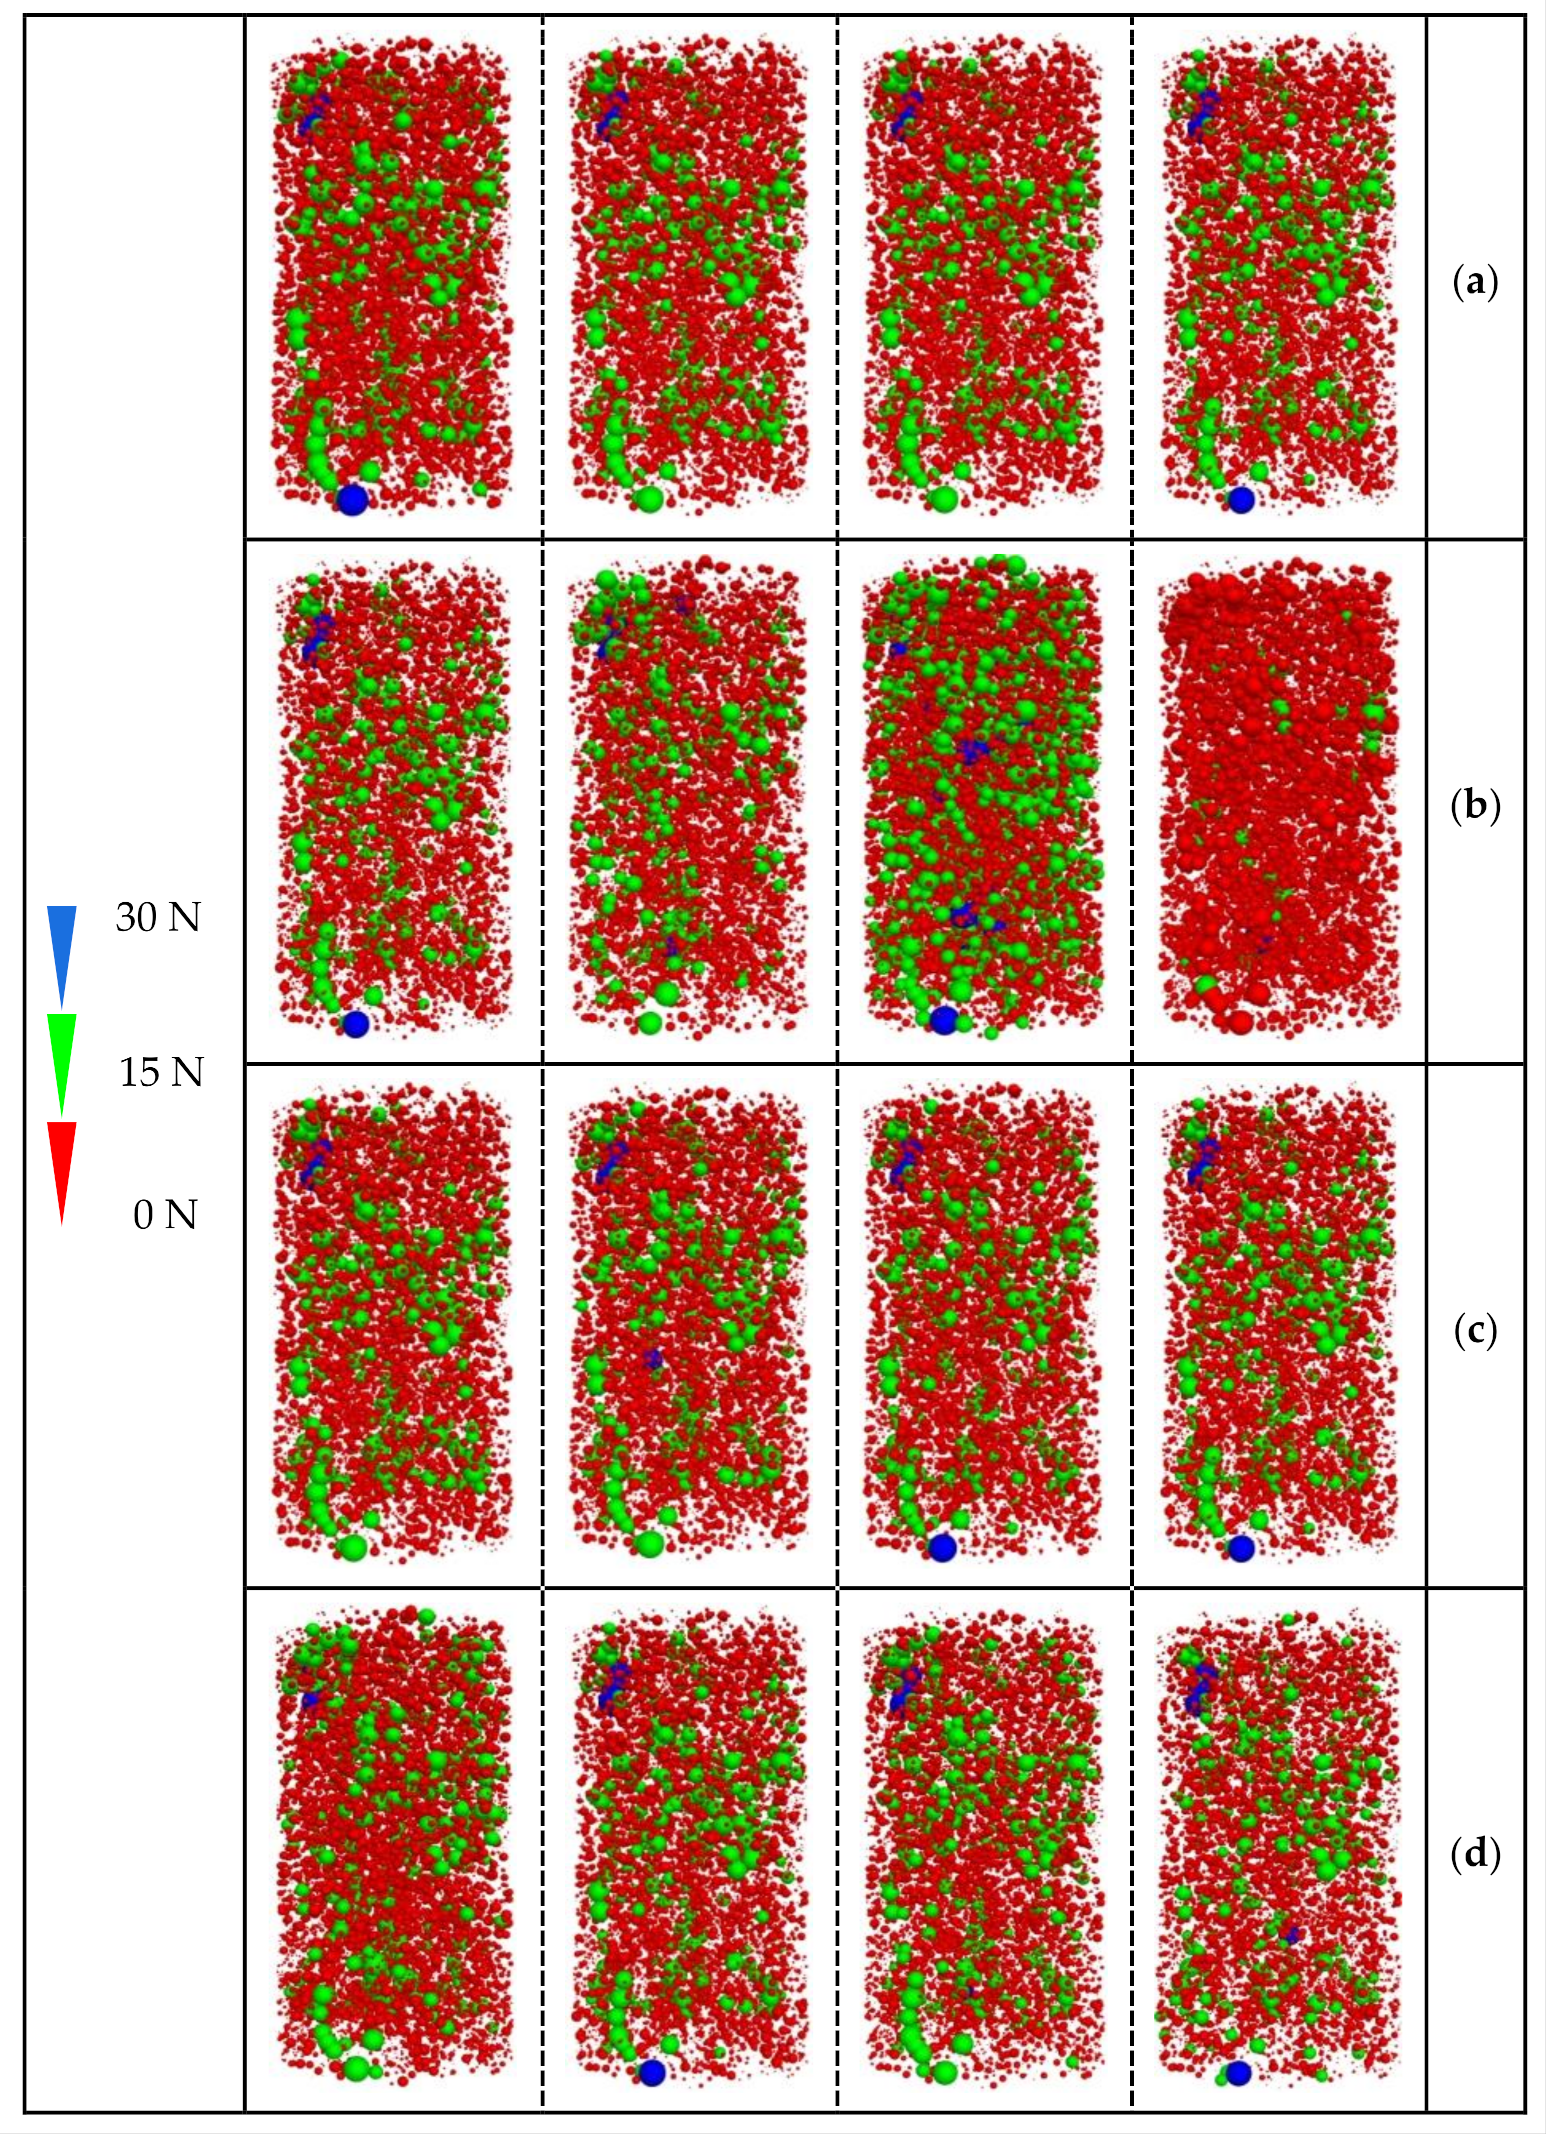
The influence of vibration parameters on the contact force chain of sand-gabion backfill material
From Figure 14a, the weak force chain looks more uniform in spatial distribution during the growth of frequency from 20 to 50 HZ. The number of solid force chains does not decrease, but the contact force continuously decreases. In terms of spatial distribution, the overall structure of the force chain does not change and is still a long strip.
The reason for this phenomenon is that the resonance action breaks the force chain skeleton supported by several strong force chains, causing the weak force chains to detach from the strong force chains, thus reducing the weak force chains. At the same time, the resonance action removes the closed state of particles between the two strong force chains, making the particle position change faster and the force chain more uniformly distributed in space [50].
Figure 14b shows that both the strong and weak force chains increase during the increase of the excitation force from 0.1 MPa to 0.3 MPa in the process. The strong chain is distributed more evenly and densely in terms of spatial distribution. The strong force chain decreases during the growth from 0.3 MPa to 0.4 MPa, and the weak force chain gradually increases.
This phenomenon is because the gradually increasing excitation force destroys the original force chain, and the newly formed force chain has higher strength than the original force chain. When the excitation force reaches a certain level, the inertia force offsets part of the vibration pressure, slowing down the force chain formation.
From Figure 14c, in the process of increasing the amplitude from 10 KPa to 40 KPa, the weak force chain located in the middle position keeps decreasing, and the strong force chain located in the upper and lower positions gradually increases. In spatial distribution, the weak chains cross each other and fill in the strong chains.
This phenomenon is because as the amplitude increases, the vibration energy breaks the strong force chain and the weak force chain inside the aeolian sand. Closer to the vibration source, the energy is more extensive, making the force chain more fully destroyed, and the newly formed force chain network is more uniform and firmer [35]. While the transmission of vibration energy is decaying downward, the middle position of the weak force chain by the energy transfer gradually evolves from the weak force chain to the strong force chain.
As seen in Figure 14d, the number of weak force chains has decreased from 1 s to 4 s, and the long strip structure composed of solid force chains has also partially disappeared. In the spatial distribution, the vital force chain in the middle position is broken more, while the small part of the vital force chain in the upper and lower positions slowly increases.
This phenomenon is because the blockade state between particles is opened as time increases, and a relatively stable state cannot be formed. Hence, the number of force chains and contact forces decreases [51]. Due to the wide range of particle movement in the upper and lower positions, the force chain is reduced the most, while in the middle position, the particle movement is limited, so the force chain is reduced less.
By the propagation of vibrational waves, the aeolian sand particles in the range of the action can be rearranged and squeezed. The mechanism of vibrational compaction of aeolian sand has been observed and analyzed through the migration of aeolian sand particles, porosity changes, and force chain relations. The relationship between micro and macro is used to guide the filling of goaf under the aeolian manhole.

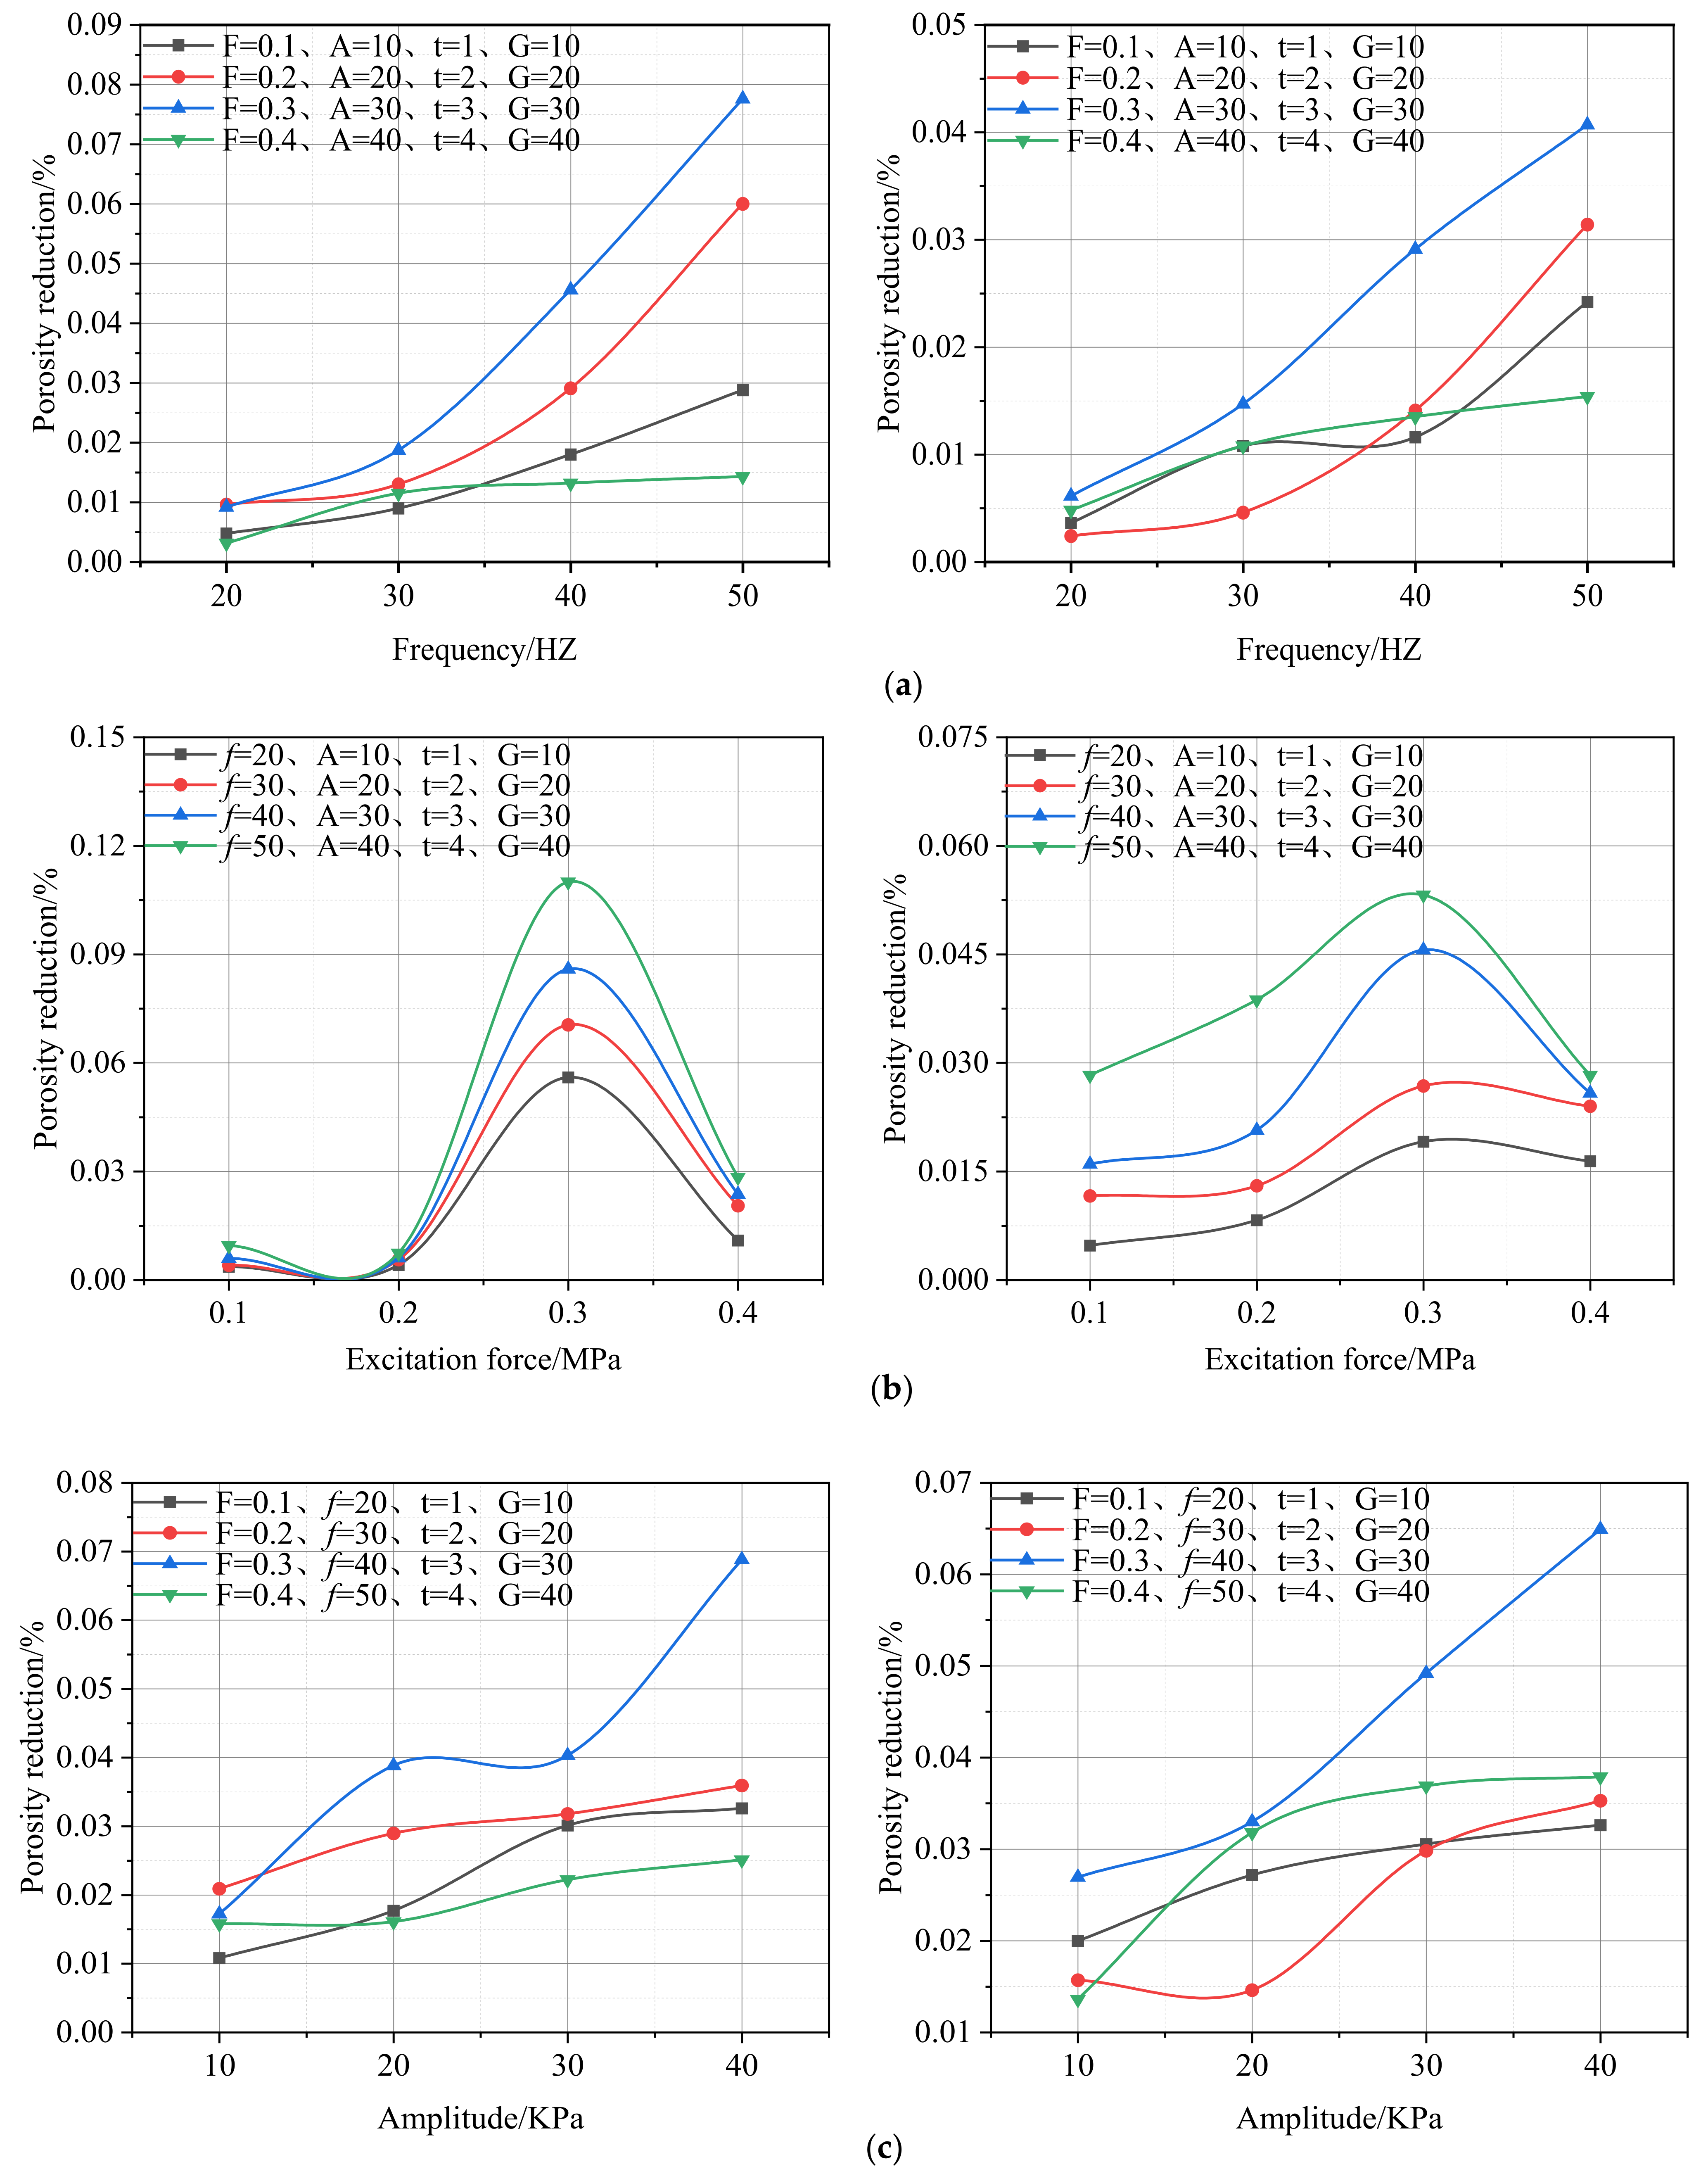
3.3. Influence Law of the Vibratory Parameters on the Ultimate Compactness

From Figure 15a, the cumulative compaction of aeolian sand increases with the increase of frequency at different frequencies of the same component. At the same frequency of different components, the maximum compaction is 0.78 mm, which occurs in the group F = 0.3 MPa, A = 30 KPa, t = 3 s, G = 30 KPa, and f = 50 HZ.
The reason for the above phenomenon is that aeolian sand is a loose aggregate composed of different grain sizes and contains many internal voids. As the frequency of the vibration source increases, it causes the resonance effect of the particles inside the aeolian sand. The resonance effect breaks the original equilibrium of aeolian sand itself so that the small particles and the vibration source have the same frequency motion. As a result of the external force change, the aeolian sand’s small particles produce a corresponding velocity change, resulting in a small-scale movement of small particles to fill the gap.
Figure 15b shows that the cumulative compaction of aeolian sand increases with the increase of excitation force in the excitation force between 0.1 MPa–0.3 MPa in the same component. When the excitation force is between 0.3 MPa–0.4 MPa, the accumulative compaction of aeolian sand decreases with the excitation force. At the same excitation force of different components, the maximum compaction is 1.32 mm, which occurs in the group f = 50 HZ, A = 40 KPa, t = 4 s, G = 40 KPa, and F = 0.3 MPa.
The reason for the above phenomenon is that with the increase of the excitation force, the internal stress of the aeolian sand changes and loses its initial equilibrium state. The excitation force acting on the aeolian sand gradually increases, and the internal small-sized particles reorganize, arrange, and accumulate to form a new skeleton structure, filling the internal voids of aeolian sand. The greater the load applied to the aeolian sand within a certain range, the greater the energy of the particle’s relative motion and the filling space [52]. The inner space of the aeolian sand is denser. When the external excitation force reaches a certain level, it no longer promotes the compaction of aeolian sand but reduces the degree of compaction.
Figure 15c shows that the cumulative compaction of aeolian sand increases with amplitude at the different amplitudes of the same component. At the same amplitude of different components, the maximum compaction is 0.82 mm, which occurs in the group F = 0.3 MPa, f = 40 HZ, t = 3 s, G = 30 KPa, and A = 40 KPa.
The reason for the above phenomenon is that with the gradual increase in amplitude, the vibration energy, and vibration intensity increase. The huge vibration energy destroys the original internal structure of the aeolian sand. It rearranges it, and the gaps between the large particles are filled more fully by the small internal particles. The gradually increasing vibration energy makes the particles rearrange more strongly, the rearrangement effect of the original ordering structure is better, and the compactness corresponds.
From Figure 15d, the cumulative compaction of aeolian sand increases with the increase of vibration time at different vibration times of the same component. At the same vibration time of different components, the maximum compaction is 1.04 mm, which occurs in the group F = 0.3 MPa, f = 40 HZ, A = 30 KPa, G = 30 KPa, and t = 4 s.
The reason for the above phenomenon is that as the vibration time increases, the particles adjust their spatial position by continuously transforming, rotating, and colliding to fill the voids in the aeolian sand. The vibration causes serious damage to the interior of the aeolian sand so that the movement range of small particles increases and the interior of the aeolian sand becomes more uniform.
The optimal vibrational parameters suitable for aeolian sand were obtained by performing a large number of vibrational numerical tests on aeolian sand, which avoids the problem of insufficient compactness of aeolian sand due to spatial and mechanical limitations in the filling of a goaf.

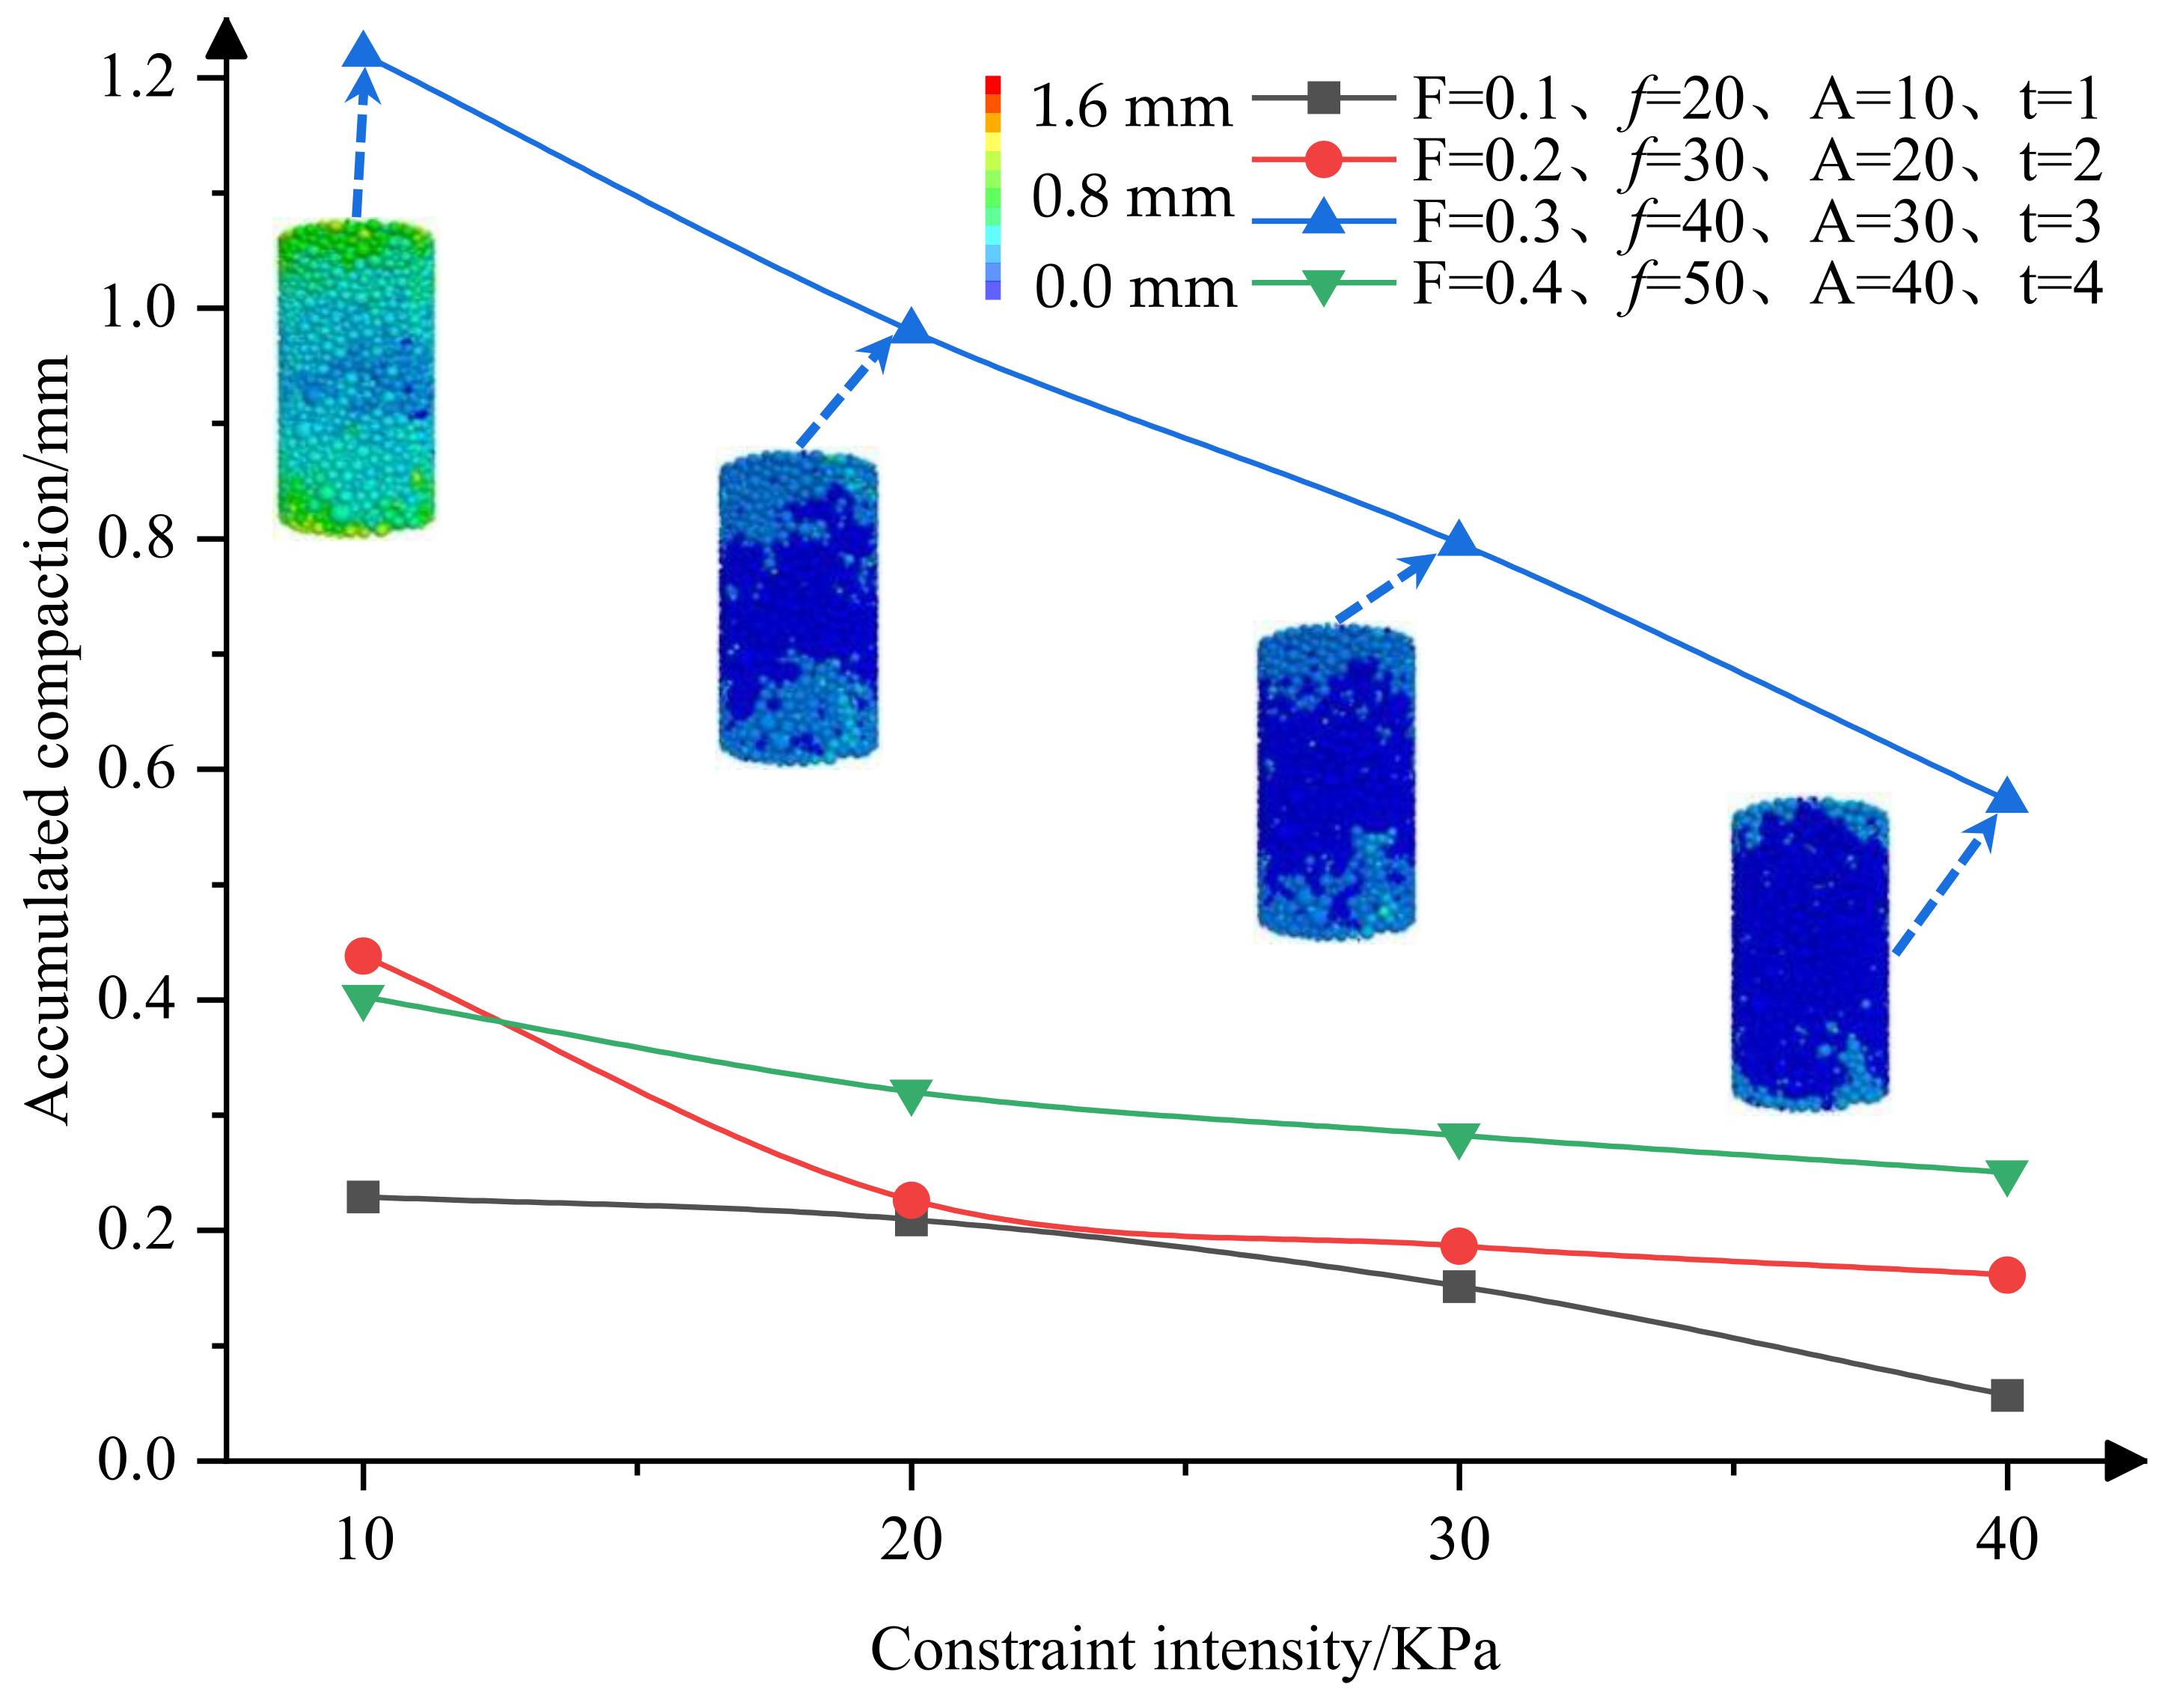
3.4. Influence Law of the Gabion Constraint on the Ultimate Compactness

From Figure 16, the cumulative compaction of aeolian sand reduces with the increase of constraint strength at different constraint strengths of the same component. At the same confinement strength for different components, the maximum compaction is 1.22 mm, which occurs in groups F = 0.3 MPa, A = 30 KPa, t = 3 s and F = 40 HZ, G = 10 KPa.
The reason for the appeal phenomenon is that the sand-gabion exerts different degrees of reaction force on the aeolian sand particles with different lateral restraint strengths. In the process of vibration, when the aeolian sand particles collide, the minute aeolian sand particles will fill the pores and produce large compression deformation to generate large contact stress and reaction force between the particles, which directly acts on the side wall of the sand-gabion and gradually transfers energy. When the strength of the lateral confinement is changed, the maximum variation of the vibrational force on the compaction transfer process of the aeolian sand is mainly reflected in the lateral displacement of the aeolian sand particles by the confinement. The larger the transverse confinement strength, the larger the lateral displacement of the sand-gabion wall from the aeolian sand particles bound to it. The greater energy wastage and strong reaction forces due to vibrational processes make the compaction of the aeolian sand poor [53].
The distribution characteristics and evolution law of the stress and deformation in the gabion on the compaction of aeolian sand were analyzed, and the external mechanism of the box constraint on the compaction of aeolian sand was revealed. Instruct the strength, cost, and size of gabion in the production process.

4. Conclusions

In this paper, only the numerical simulation experiment of sand-gabion is carried out without laboratory verification, and the sand-gabion filling body with a large enough size is not considered. We focus on the macroscopic and microscopic analysis of the vibrational process and confinement strength of the sand-gabion and reveal the mechanism of the vibration of the sand-gabion in terms of the degree of compaction and particle motion. In this paper, physical experiments and numerical simulation experiments are conducted on aeolian sand-gabion backfill, which mainly leads to the following conclusions:
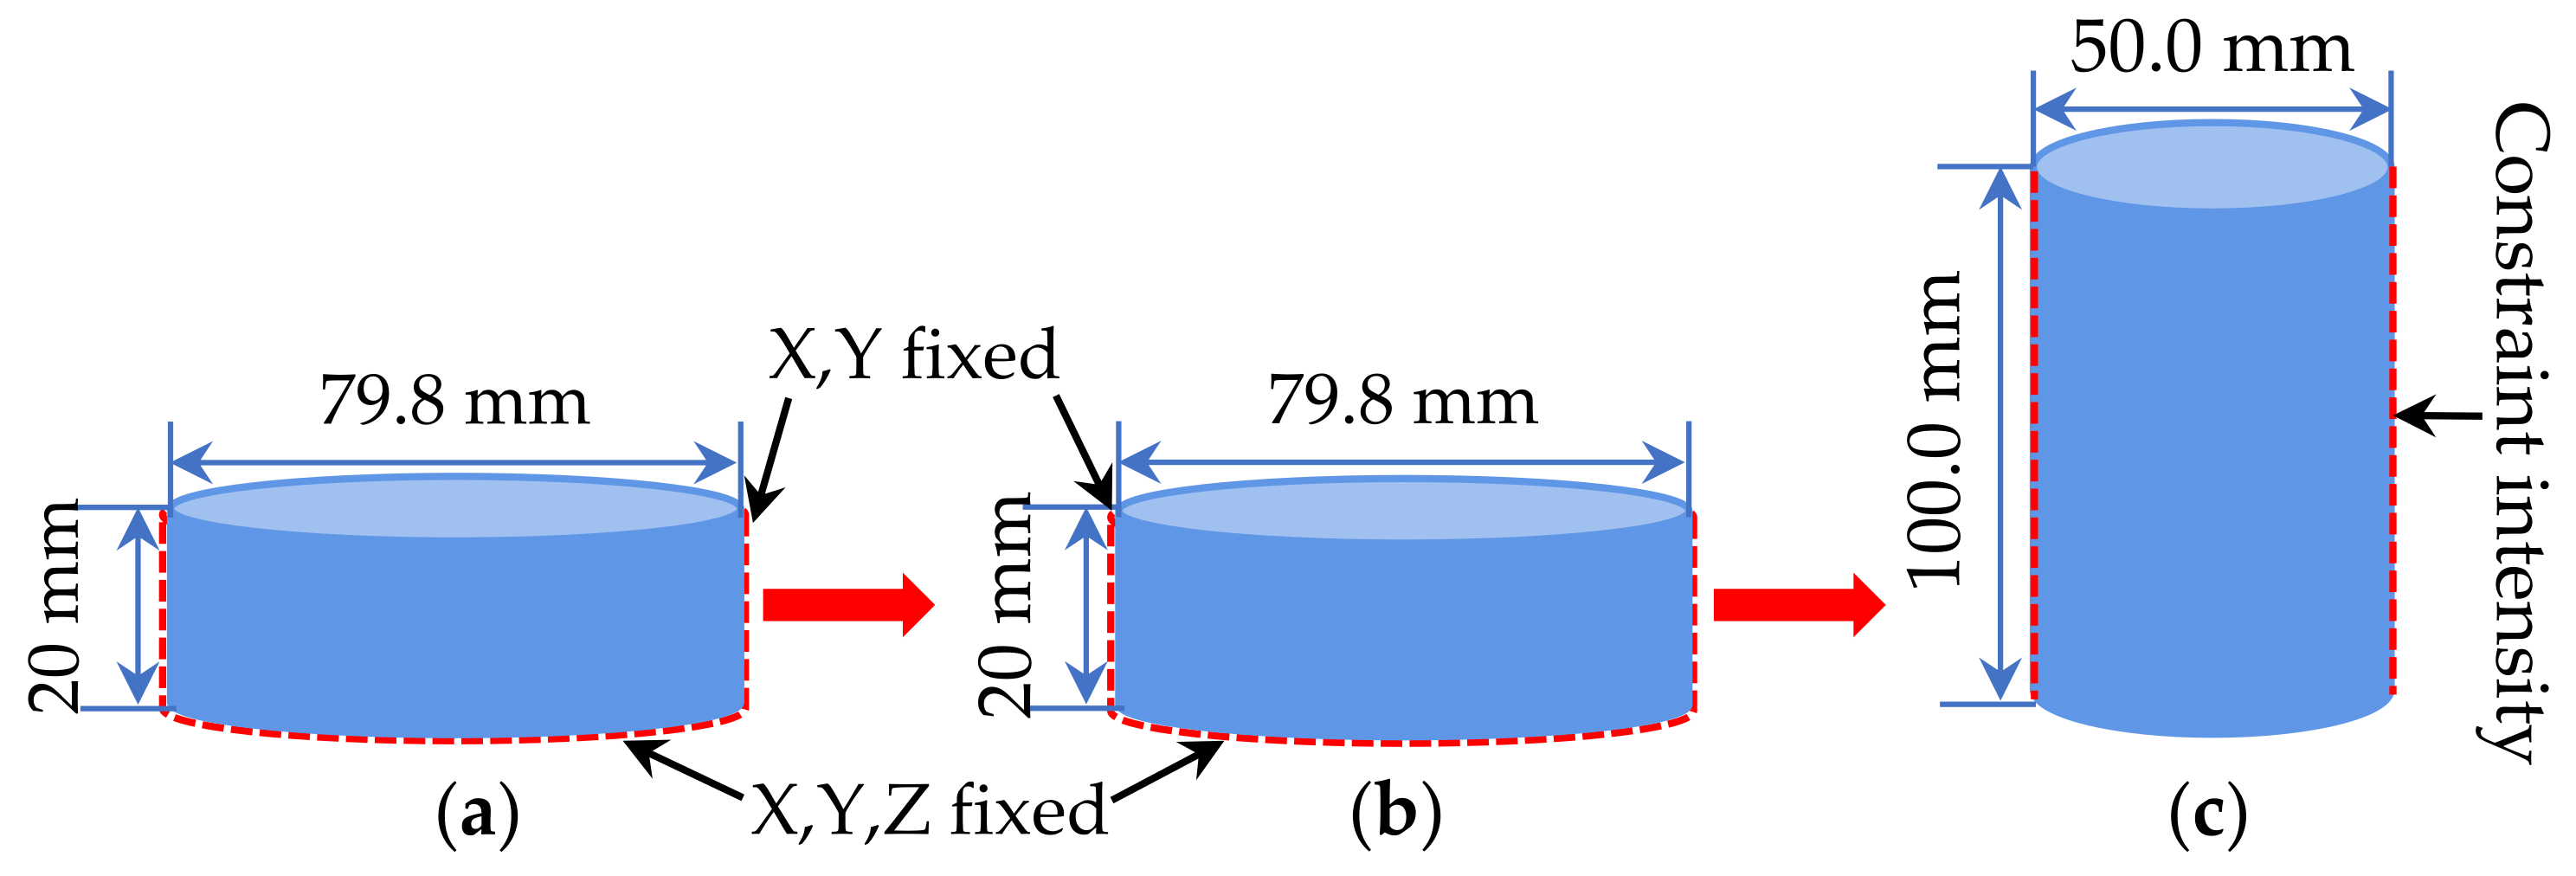
  • The compaction effect of aeolian sand under vibration conditions is better than its compaction effect under static load conditions. Under sand-gabion constraints, to obtain compaction of 0.25 mm for a cylindrical aeolian sand specimen with a diameter of 5 cm and a height of 10 cm, the load required for the static method is 1.22 times the excitation force for the vibratory method.
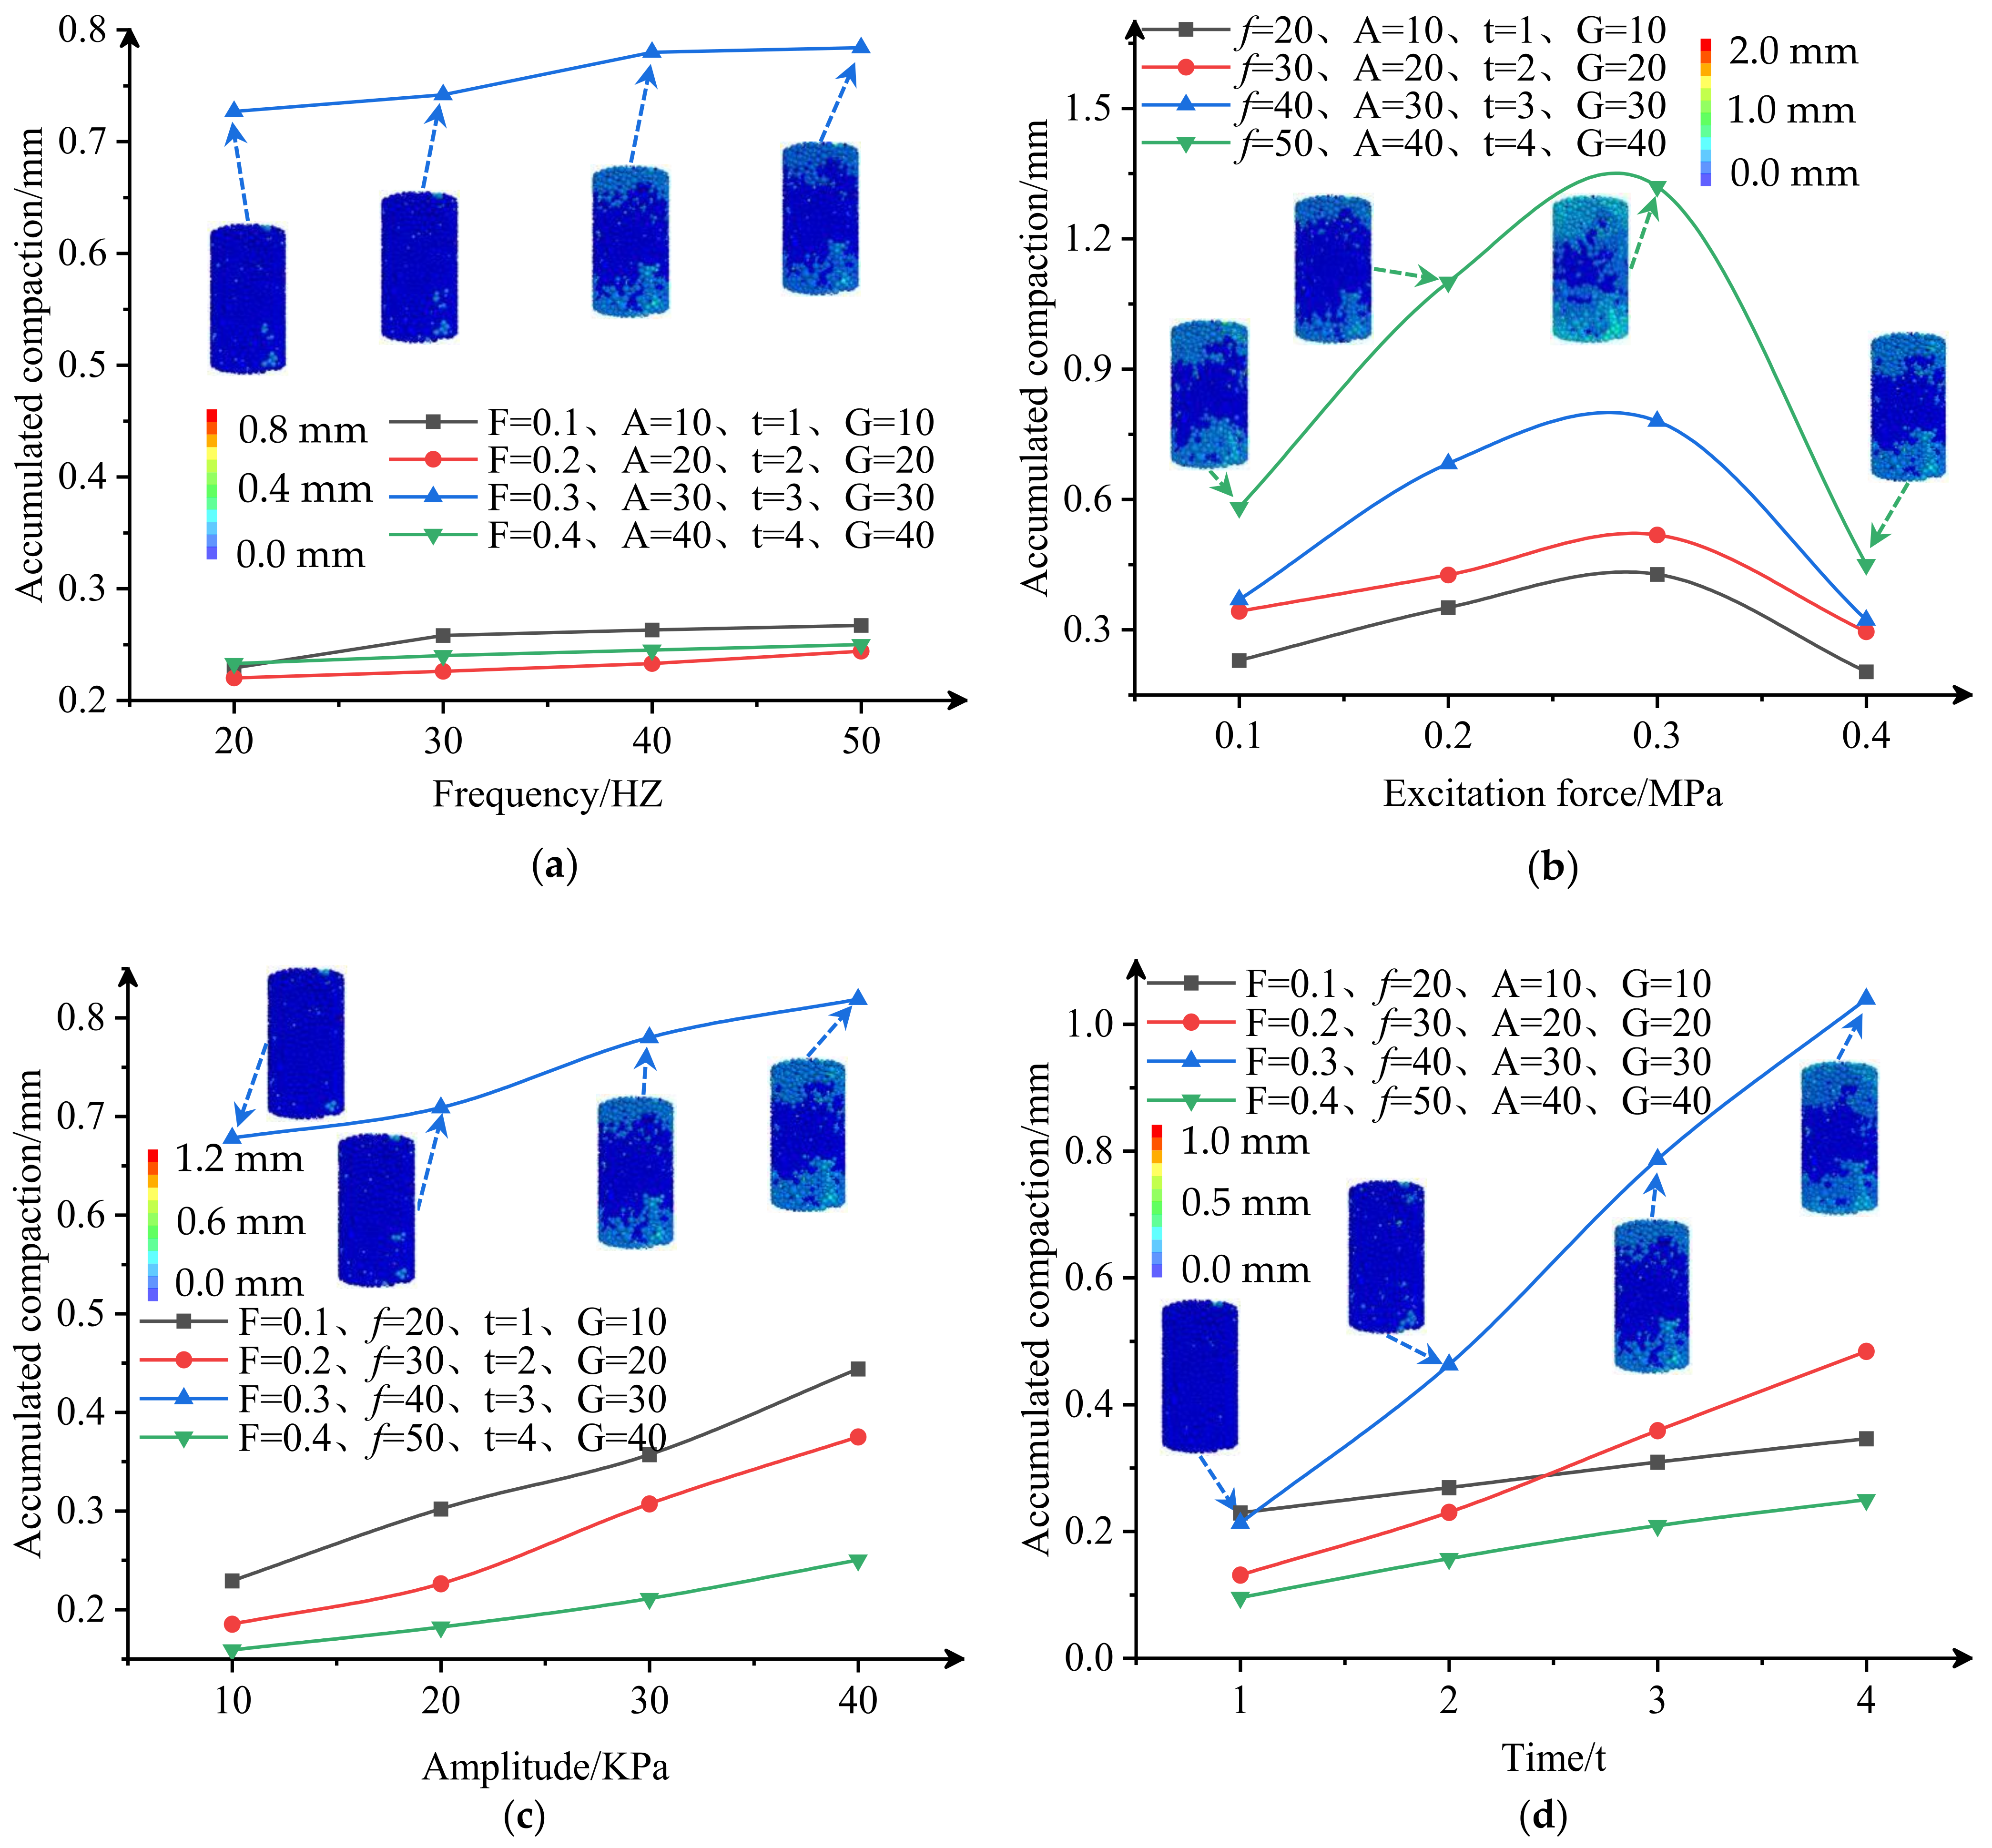
  • The typical evolution process of particle contacts force chain network, particle transport, porosity, and other mesoscopic structural characteristic indexes of the aeolian sand samples was quantitatively analyzed. The influence law of frequency, excitation force, amplitude, and vibration time of the sand particles during vibratory compaction has been revealed from the mesoscopic view level. It is considered that when the frequency is 50 HZ, the excitation force is 0.3 MPa, the amplitude is 40 KPa, and the vibration time is 4 s, the denseness of the sand-gabion backfill is the highest.
  • Influencing law of the vibration parameters and gabion constraints on the ultimate compactness of the sand-gabion backfills are as follows: The compactness of the sand-gabion showed an increasing trend when the frequency was 20 HZ–50 HZ, the amplitude was 10 KPa–40 KPa, and the time was 1 s–4 s. For excitation forces of 0.1 MPa–0.4 MPa, the compactness of the sand-gabion first increases and then decreases. The compactness of the sand-gabion exhibits a decreasing trend from 10 KPa to 40 KPa in the confinement strength of the cage.
However, there are still various shortcomings in numerous aspects that need to be further improved in subsequent work. (1) The compaction characteristics of square and hexagonal need to be further analyzed and studied. Different sand-gabion (material, size, mesh number) and geotextile types all affect the compaction characteristics of sand-gabion. (2) The stability of the accumulation body of multiple sand-gabion can be considered on this basis in the future.

Author Contributions

Conceptualization, Z.Z.; methodology, Z.Z.; validation, W.W. and B.Z.; formal analysis, W.W.; investigation, Z.Z. and W.W.; data curation, B.Z. and W.W.; writing—original draft preparation, W.W.; writing—review and editing, Z.Z.; funding acquisition, Z.Z. All authors have read and agreed to the published version of the manuscript.

Funding

This research was funded by the National Natural Science Foundation of China (51964042).

Data Availability Statement

Not applicable.

Acknowledgments

We acknowledge the administrators and technicians in the Xinjiang Wucaiwan coal field for their contributions to the aeolian sand collection and geological data providing. We also thank the editors and reviewers for their comments on this paper.

Conflicts of Interest

The authors declare no conflict of interest.

References

  1. Jiang, J.; Abulizi, A.; Abliz, A.; Zayiti, A.; Akbar, A.; Ou, B. Construction of Landscape Ecological Security Pattern in the Zhundong Region, Xinjiang, NW China. Int. J. Environ. Res. Public Health 2022, 19, 6301. [Google Scholar] [CrossRef] [PubMed]
  2. Zhang, Z.; Liu, H.; Su, H.; Zeng, Q. Green Mining Takes Place at the Power Plant. Minerals 2022, 12, 839. [Google Scholar] [CrossRef]
  3. Yu, H.; Li, S.; Wang, X. The Recent Progress China Has Made in the Backfill Mining Method, Part I: The Theory and Equipment of Backfill Pipeline Transportation. Minerals 2021, 11, 1274. [Google Scholar] [CrossRef]
  4. Li, S.; Zhao, Z.; Yu, H.; Wang, X. The Recent Progress China Has Made in the Backfill Mining Method, Part II: The Composition and Typical Examples of Backfill Systems. Minerals 2021, 11, 1362. [Google Scholar] [CrossRef]
  5. Li, S.; Zhang, R.; Feng, R.; Hu, B.; Wang, G.; Yu, H. Feasibility of Recycling Bayer Process Red Mud for the Safety Backfill Mining of Layered Soft Bauxite under Coal Seams. Minerals 2021, 11, 722. [Google Scholar] [CrossRef]
  6. Xie, H.; Ju, Y.; Ren, S.; Gao, F.; Liu, J.; Zhu, Y. Theoretical and Technological Exploration of Deep in Situ Fluidized Coal Mining. Front. Energy 2019, 13, 603–611. [Google Scholar] [CrossRef]
  7. Jiang, Y.; Misa, R.; Gao, J.; Liu, H.; Sroka, A.; Preusse, A.; Jiang, Y. Non-Pollution Damage Hazard of Underground Mining on Reservoir Ecological Environment. Environ. Earth Sci. 2021, 80, 431. [Google Scholar] [CrossRef]
  8. Xu, J.; Zhu, W.; Xu, J.; Wu, J.; Li, Y. High-Intensity Longwall Mining-Induced Ground Subsidence in Shendong Coalfield, China. Int. J. Rock Mech. Min. Sci. 2021, 141, 104730. [Google Scholar] [CrossRef]
  9. Liu, S.; Bai, J.; Wang, G.; Wang, X.; Wu, B. A Method of Backfill Mining Crossing the Interchange Bridge and Application of a Ground Subsidence Prediction Model. Minerals 2021, 11, 945. [Google Scholar] [CrossRef]
  10. Zhang, Q.; Zhang, B.; Chen, Q.; Wang, D.; Gao, X. Safety Analysis of Synergetic Operation of Backfilling the Open Pit Using Tailings and Excavating the Ore Deposit Underground. Minerals 2021, 11, 818. [Google Scholar] [CrossRef]
  11. Shi, P.; Zhang, J.; Yan, H.; Zhang, Y.; Zhang, Q.; Feng, W. Evaluation of Operating Performance of Backfilling Hydraulic Support Using Six Hybrid Machine Learning Models. Minerals 2022, 12, 1388. [Google Scholar] [CrossRef]
  12. Feng, X.; Ding, Z.; Ju, Y.; Zhang, Q.; Ali, M. “Double Peak” of Dynamic Strengths and Acoustic Emission Responses of Coal Masses Under Dynamic Loading. Nat. Resour. Res. 2022, 6, 1705. [Google Scholar] [CrossRef]
  13. Zhang, J.; Li, M.; Taheri, A.; Zhang, W.; Wu, Z.; Song, W. Properties and Application of Backfill Materials in Coal Mines in China. Minerals 2019, 9, 53. [Google Scholar] [CrossRef] [Green Version]
  14. Ning, S.; Lou, J.; Wang, L.; Yu, D.; Zhu, W. Stability Influencing Factors and Control Methods of Residual Coal Pillars with Solid Waste Materials Backfilling Method. Minerals 2022, 12, 1285. [Google Scholar] [CrossRef]
  15. Shao, X.; Wang, L.; Li, X.; Fang, Z.; Zhao, B.; Tao, Y.; Liu, L.; Sun, W.; Sun, J. Study on Rheological and Mechanical Properties of Aeolian Sand-Fly Ash-Based Filling Slurry. Energies 2020, 13, 1266. [Google Scholar] [CrossRef] [Green Version]
  16. Shao, X.; Tian, C.; Li, C.; Fang, Z.; Zhao, B.; Xu, B.; Ning, J.; Li, L.; Tang, R. The Experimental Investigation on Mechanics and Damage Characteristics of the Aeolian Sand Paste-like Backfill Materials Based on Acoustic Emission. Materials 2022, 15, 7235. [Google Scholar] [CrossRef]
  17. Ma, B.; Gao, L.; Cheng, J.; Ding, B.; Ding, L.; Qu, L.; An, Y. Characteristics and Hazards of an Aeolian Sand Environment along Railways in the Southeastern Fringe of the Taklimakan Desert and Sand Control Measures. Appl. Sci. 2022, 12, 9186. [Google Scholar] [CrossRef]
  18. Li, M.; Zhang, J.; Sun, K.; Zhang, S. Influence of Lateral Loading on Compaction Characteristics of Crushed Waste Rock Used for Backfilling. Minerals 2018, 8, 552. [Google Scholar] [CrossRef] [Green Version]
  19. Li, G.; Wan, Y.; Guo, J.; Ma, F.; Zhao, H.; Li, Z. A Case Study on Ground Subsidence and Backfill Deformation Induced by Multi-Stage Filling Mining in a Steeply Inclined Ore Body. Remote Sens. 2022, 14, 4555. [Google Scholar] [CrossRef]
  20. Feng, X.; Zhang, Q. The Effect of Backfilling Materials on the Deformation of Coal and Rock Strata Containing Multiple Goaf: A Numerical Study. Minerals 2018, 8, 224. [Google Scholar] [CrossRef]
  21. Feng, X.; Zhang, Q.; Ali, M. 3D modelling of the strength effect of backfill-rocks on controlling rockburst risk: A case study. Arab. J. Geosci. 2020, 1, 128. [Google Scholar] [CrossRef]
  22. Zhang, Y.; Liu, F.; Bao, Y.; Yuan, H. Research on Dynamic Stress–Strain Change Rules of Rubber-Particle-Mixed Sand. Coatings 2022, 12, 1470. [Google Scholar] [CrossRef]
  23. Chang, D.-W.; Lu, C.-W.; Tu, Y.-J.; Cheng, S.-H. Settlements and Subgrade Reactions of Surface Raft Foundations Subjected to Vertically Uniform Load. Appl. Sci. 2022, 12, 5484. [Google Scholar] [CrossRef]
  24. Liu, Z.; Li, J.; Zhao, Q.; Wang, J.; Liu, T.; Zhang, Q. Gradation Design of Phosphorus Tailing–Graded Waste Rock Subgrade Filling Using Discrete Element Method. Minerals 2022, 12, 573. [Google Scholar] [CrossRef]
  25. Wang, J.Q.; Chang, Z.C.; Xue, J.F.; Lin, Z.N.; Tang, Y. Experimental Investigation on the Behavior of Gravelly Sand Reinforced with Geogrid under Cyclic Loading. Appl. Sci. 2021, 11, 12152. [Google Scholar] [CrossRef]
  26. Zhang, X.G.; Cai, Q.E.; Liu, J.Y. Study on Method Defining Maximum Dry Density of Aeolian Sand Filler along Tong’e Highway Embankment. Subgrade Eng. 2016, 5, 102. [Google Scholar] [CrossRef]
  27. Frid, V.; Potirakis, S.M.; Shulov, S. Study of Static and Dynamic Properties of Sand under Low Stress Compression. Appl. Sci. 2021, 11, 3311. [Google Scholar] [CrossRef]
  28. Miao, Y.; Yu, W.; Hou, Y.; Guo, L.; Wang, L. Investigating the Functions of Particles in Packed Aggregate Blend using a Discrete Element Method. Materials 2019, 12, 556. [Google Scholar] [CrossRef] [Green Version]
  29. Turan, C.; Javadi, A.A.; Vinai, R. Effects of Class C and Class F Fly Ash on Mechanical and Microstructural Behavior of Clay Soil—A Comparative Study. Materials 2022, 15, 1845. [Google Scholar] [CrossRef]
  30. Dun, H.; Yue, P.; Huang, N.; Zhang, J. Discrete Element Simulation on Sand-Bed Collision Considering Surface Moisture Content. Processes 2022, 10, 52. [Google Scholar] [CrossRef]
  31. Xie, Y.P.; Zhang, C.; Yang, J.S. Study on failure characteristics and reinforcement measures of tunnel’s surrounding rocks in glacial deposits based on coarse-grained dem. Chin. J. Rock Mech. Eng. 2021, 3, 556. [Google Scholar] [CrossRef]
  32. Rong, H.; Li, G.; Liang, D.; Sun, C.; Zhang, S.; Sun, Y. Numerical Investigation on the Evolution of Mechanical Properties of Rock Affected by Micro-Parameters. Appl. Sci. 2020, 10, 4957. [Google Scholar] [CrossRef]
  33. Li, J.; Huang, Y.; Chen, Z.; Li, M.; Qiao, M.; Kizil, M. Particle-Crushing Characteristics and Acoustic-Emission Patterns of Crushing Gangue Backfilling Material under Cyclic Loading. Minerals 2018, 8, 244. [Google Scholar] [CrossRef] [Green Version]
  34. Ji, X.; Lu, H.; Dai, C.; Ye, Y.; Cui, Z.; Xiong, Y. Characterization of Properties of Soil–Rock Mixture Prepared by the Laboratory Vibration Compaction Method. Sustainability 2021, 13, 11239. [Google Scholar] [CrossRef]
  35. Ding, F.; Song, L.; Yue, F. Study on Mechanical Properties of Cement-Improved Frozen Soil under Uniaxial Compression Based on Discrete Element Method. Processes 2022, 10, 324. [Google Scholar] [CrossRef]
  36. Zhang, Y.; Yan, Y.; Dai, H.; Zhu, Y.; Wu, T. Stability and Force Chain Characteristics of “Inclined Step Cutting Body” in Stope. Appl. Sci. 2021, 11, 10276. [Google Scholar] [CrossRef]
  37. Shi, D.; Shi, Q. Study on Mechanical Properties and Mesoscopic Numerical Simulation of Recycled Concrete. Sustainability 2022, 14, 12125. [Google Scholar] [CrossRef]
  38. Zhou, H.; Guo, Y.; Xu, Q.; Zhang, G.; Wang, Z. Study on Vibration Compaction Energy of Basement Material. Coatings 2022, 12, 1495. [Google Scholar] [CrossRef]
  39. Zhang, Y.; Yang, G.; Chen, W.; Sun, L. Relation between Microstructures and Macroscopic Mechanical Properties of Earthen-Site Soils. Materials 2022, 15, 6124. [Google Scholar] [CrossRef]
  40. Wang, F.; Shao, J.; Li, W.; Wang, L.; Wang, Y.; Liu, H. Numerical Simulation Study on Lining Damage of Shield Tunnel under Train Load. Sustainability 2022, 14, 14018. [Google Scholar] [CrossRef]
  41. Beben, D.; Maleska, T.; Bobra, P.; Duda, J.; Anigacz, W. Influence of Traffic-Induced Vibrations on Humans and Residential Building-A Case Study. Int. J. Environ. Res. Public Health 2022, 9, 5441. [Google Scholar] [CrossRef] [PubMed]
  42. He, Z.L.; Lu, C.P.; Zhang, X.F. Experimental and Numerical Investigations of Dynamic Failure Mechanisms of Underground Roadway Induced by Incident Stress Wave. Appl. Sci. 2022, 12, 10350. [Google Scholar] [CrossRef]
  43. Sun, B.; Chen, R.; Ping, Y.; Zhu, Z.; Wu, N.; He, Y. Dynamic Response of Rock-like Materials Based on SHPB Pulse Waveform Characteristics. Materials 2022, 15, 210. [Google Scholar] [CrossRef] [PubMed]
  44. Sanayei, M.; Kayiparambil, P.A.; Moore, J.A.; Brett, C.R. Measurement and prediction of train-induced vibrations in a full-scale building. Eng. Struct. 2014, 7, 77. [Google Scholar] [CrossRef]
  45. Guo, J.; Xu, L.; Xu, C.; Chen, R.; Lin, J. Dynamic Response Analysis on Stress and Displacement of the Shield Tunnel Structure and Soil Layer under Train-Induced Vibration in Xiamen Metro Line 6. Sustainability 2022, 14, 11962. [Google Scholar] [CrossRef]
  46. Jiang, Y.; Li, M.; Luan, H.; Shi, Y.; Zhang, S.; Yan, P.; Li, B. Discrete Element Simulation of the Macro-Meso Mechanical Behaviors of Gas-Hydrate-Bearing Sediments under Dynamic Loading. J. Mar. Sci. Eng. 2022, 10, 1042. [Google Scholar] [CrossRef]
  47. Liang, C.; Zhang, H.; Liu, F.; Yan, X.; Bi, H. Simulation Analysis of Cement-Stabilized Macadam Compaction Processing Based on the Discrete Element Method. Appl. Sci. 2022, 12, 8505. [Google Scholar] [CrossRef]
  48. Zvonarić, M.; Barišić, I.; Galić, M.; Minažek, K. Influence of Laboratory Compaction Method on Compaction and Strength Characteristics of Unbound and Cement-Bound Mixtures. Appl. Sci. 2021, 11, 4750. [Google Scholar] [CrossRef]
  49. Maksimov, F.; Tombari, A. Derivation of Cyclic Stiffness and Strength Degradation Curves of Sands through Discrete Element Modelling. Modelling 2022, 3, 400–416. [Google Scholar] [CrossRef]
  50. Chen, X.; Chen, N.; Wei, Z.; Zhang, X.; Yang, F.; Zhao, H.; You, M.; Wang, W. Research on the Influence of Loading Frequency on the Dynamic Response of Concrete Sleepers. Appl Sci 2022, 12, 7245. [Google Scholar] [CrossRef]
  51. Lian, X.; Zhang, Y.; Yuan, H.; Wang, C.; Guo, J.; Liu, J. Law of Movement of Discontinuous Deformation of Strata and Ground with a Thick Loess Layer and Thin Bedrock in Long Wall Mining. Appl Sci 2020, 10, 2874. [Google Scholar] [CrossRef] [Green Version]
  52. Germonpré, M.; Degrande, G.; Lombaert, G. A study of modelling simplifications in ground vibration predictions for railway traffic at grade. J. Sound Vib. 2017, 6, 406. [Google Scholar] [CrossRef]
  53. Zhang, R.; Ma, L.; Wang, Q.; Li, J.; Wang, Y.; Chen, H.; Samosvat, V. Experimental Studies on the Effect of Properties and Micro-Structure on the Creep of Concrete-Filled Steel Tubes. Materials 2019, 12, 1046. [Google Scholar] [CrossRef] [PubMed]
Figure 1. Distribution of coal resources in China.
Minerals 12 01428 g001
Figure 2. Overburden movement of underground coal mining; (a) without backfills; (b) with sand-gabion backfills.
Minerals 12 01428 g002
Figure 3. Sand-gabion backfill at different stages.
Minerals 12 01428 g003
Figure 4. Process of aeolian sand experiment; (a) Physical consolidation test; (b) Numerical simulation of consolidation test; (c) Numerical simulation experiment of sand-gabion.
Minerals 12 01428 g004
Figure 5. Physical consolidation test model and results; (a) Physical consolidation test model; (b) Physical consolidation test results.
Minerals 12 01428 g005
Figure 6. Numerical simulation model and results of consolidation experiment; (a) Numerical simulation model of consolidation experiment; (b) Numerical simulation results of consolidation experiment (x-axis shows the force applied, y-axis shows the amount of compaction).
Minerals 12 01428 g006
Figure 7. Numerical simulation scheme of sand-gabion; (a) Vibration test (x-axis shows the time, y-axis shows the excitation force); (b) Static load test (x-axis shows the compaction amount, y-axis shows the Static load).
Minerals 12 01428 g007
Figure 8. Eolian sand slicing process; (a) Overall sample and measurement ball of position; (b) Sample section; (c) Selected position; (d) ImageJ processing.
Minerals 12 01428 g008
Figure 9. Comparison diagram of vibration and static loading (x-axis shows the load, y-axis shows the compaction amount).
Minerals 12 01428 g009
Figure 10. Porosity changes at different locations; (a) Upper position porosity changes (x-axis shows the compaction amount, y-axis shows the porosity reduction); (b) Middle porosity changes (x-axis shows the compaction amount, y-axis shows the porosity reduction).
Minerals 12 01428 g010
Figure 11. Diagram of compaction stage of sand-gabion (x-axis shows the vibration time, y-axis shows the compaction amount).
Minerals 12 01428 g011
Figure 12. Variation of porosity at different locations; (a) Porosity varies with frequency at different locations (x-axis shows the frequency, y-axis shows the porosity reduction); (b) Porosity varies with excitation force at different locations (x-axis shows the excitation force, y-axis shows the porosity reduction); (c) Porosity varies with amplitude at different locations (x-axis shows the amplitude, y-axis shows the porosity reduction); (d) Porosity varies with vibration time at different locations (x-axis shows the vibration time, y-axis shows the porosity reduction).
Minerals 12 01428 g012aMinerals 12 01428 g012b
Figure 13. Particle movement and variation; (a) Particle area varies with frequency (x-axis shows the frequency, y-axis shows the change in particle area); (b) Particle area varies with excitation force (x-axis shows the excitation force, y-axis shows the change in particle area); (c) Particle area varies with frequency (x-axis shows the amplitude, y-axis shows the change in particle area); (d) Particle area varies with vibration time (x-axis shows the frequency, y-axis shows the change in particle area).
Minerals 12 01428 g013
Figure 14. Variation diagram of force chain network; (a) Force chain varies with frequency; (b) Force chain varies with excitation force; (c) Force chain varies with amplitude; (d) Force chain varies with vibration time.
Minerals 12 01428 g014
Figure 15. Change of accumulated compaction; (a) Amount of compaction varies with frequency (x-axis shows the frequency, y-axis shows the compaction amount); (b) Amount of compaction varies with excitation force (x-axis shows the excitation force, y-axis shows the compaction amount); (c) Amount of compaction varies with amplitude (x-axis shows the amplitude, y-axis shows the compaction amount); (d) Amount of compaction varies with vibration time (x-axis shows the vibration time, y-axis shows the compaction amount).
Minerals 12 01428 g015
Figure 16. Change of cumulative compaction under constraint strength (x-axis shows the sand-gabion restraint strength and y-axis shows the compaction amount).
Minerals 12 01428 g016
Table 1. Microscopic parameters of aeolian sand [30].
Contact ModelNormal Stiffness of Wall/N·m−1Tangential Stiffness of Wall/N·m−1Particle Normal Stiffness/N·m−1Tangential Stiffness of Particles/N·m−1FrictionDampDensity
(Kg/m3)
Porosity
Linear contact1.8 × 1081.8 × 1081.8 × 1081.8 × 1080.30.726000.35
Table 2. Vibration experiment scheme.
ComponentFrequency
/HZ
Excitation Force
/MPa
Amplitude
/KPa
Vibration time/sSand-Gabion/KPa
120,30,40,500.110110
220,30,40,500.220220
320,30,40,500.330330
420,30,40,500.440440
5200.1,0.2,0.3,0.410110
6300.1,0.2,0.3,0.420220
7400.1,0.2,0.3,0.430330
8500.1,0.2,0.3,0.440440
9200.110,20,30,40110
10300.210,20,30,40220
11400.310,20,30,40330
12500.410,20,30,40440
13200.1101,2,3,410
14300.2201,2,3,420
15400.3301,2,3,430
16500.4401,2,3,440
17200.110110,20,30,40
18300.220210,20,30,40
19400.330310,20,30,40
20500.440410,20,30,40
Table 3. The vibration and static loads required by the same cumulative compaction.
Accumulated Compaction/mm0.2850.60.750.87
Vibration load/MPa0.10.20.30.4
Static load/MPa0.1360.2650.3800.491
Publisher’s Note: MDPI stays neutral with regard to jurisdictional claims in published maps and institutional affiliations.

