1. Introduction
Dense medium separation (DMS) is widely used for the upgrading of coal, iron ore, diamonds and industrial minerals. This technique has also been used in the base metals industry for the preconcentration of ores before their main processing stage, e.g., the Camrose DMS 2 Project and the Chemaf DMS plant at Etoile, for copper upgrading in the Democratic Republic of Congo [
1,
2]. The aim is to discard a large proportion of unwanted gangue upfront to reduce the time, costs and energy consumption of downstream processes such as milling and flotation.
Preconcentration of ores using methods such as DMS is becoming important as mining of lower-grade, disseminated ores increases, with previously uneconomic deposits able to be considered for mining if the run-of-mine (ROM) feed grade can be upgraded to an acceptable level for processing [
3,
4]. In addition to particle density and size, mineralogy is known to affect the efficiency of DMS [
5,
6]. Low-grade ores commonly display complex mineralogy in terms of mineral composition and texture, the understanding of which is important when concentrating the valuable minerals. Of particular importance in preconcentration is the mineralogy of the gangue minerals, especially as physical separation methods are usually conducted at coarse particle sizes, where gangue minerals such as silicates and carbonates may dominate the majority of particles.
This work is focused on studying the influence of mineralogy on DMS performance when separating nickel sulfide ores, with two southern African deposits selected as case studies. Previous test work for ore A did not support DMS as a viable upgrade option, with nickel recoveries usually lower than desired. Ore B is also evaluated for comparative purposes, as DMS is used successfully at the mine to upgrade the nickel before flotation [
7]. Both ores are magmatic Ni-Cu-sulfide ores, with the primary ore minerals formed by exsolution of immiscible sulfides from a melt during igneous processes and secondary mineralization formed by late-stage hydrothermal alteration and weathering [
8,
9]. The sampled zones are dominantly disseminated in sulfide texture.
A process mineralogy approach was taken, using DMS and sink-float analysis with traditional chemical assaying to evaluate separation efficiency, together with more advanced mineralogical characterisation using QEMSCAN (Quantitative Evaluation of Minerals by Scanning Electron Microscopy). The differences in the mineralogical properties within the overflow and underflow of each ore were described, to understand the extent to which individual properties affect the separation.
2. Materials and Methods
Unless otherwise stated, all sample preparation, experiments and analyses were conducted at Mintek, South Africa, using ISO9001 certified sampling and analysis procedures. Ore A was sampled from a conveyor belt leaving the primary crusher at the mine. The belt was stopped, and a sample was collected from a belt length of 3 m. A bulk sample of approximately one tonne was collected for subsequent work. The bulk sample was crushed to −12 mm for the test work. A one-tonne sample of the dense medium cyclone (DMC) feed was collected from the plant treating ore B. The plant sample was already crushed to sub-25 mm. Prior to performing experiments, each ore sample collected was thoroughly blended over a concrete pad using a hopper on rails, to homogenize the material before sub-sampling. A sub-sample of approximately 20 kg was removed and halved using a riffle splitter to produce a ~10 kg representative head sample for assaying.
The remaining sample was then de-slimed by screening sub-1 mm particles from the material. The resulting two fractions (+1 mm and −1 mm) were then subdivided into portions of ~10 kg each. An additional 50 kg of the +1 mm material was removed for the laboratory sink-float analysis. The three 10 kg samples were split using a spinning riffler, to provide representative samples for chemical analyses. The remaining +1 mm bulk material was used to carry out DMS tests using a pilot-scale DMS plant at Mintek.
2.1. Density Separation
Sink-float analysis was performed on the +1 mm size fraction from the 50 kg sub-sample of each DMC feed, to determine if a nickel upgrade is possible using DMS and the density cut-point associated with the separation. Based on Gy’s sampling theory [
10,
11], 6.7 kg would be the minimum mass required for a representative sample of ore A. For ore B, the smallest representative sample should be 57.8 kg, due to its larger particle size. A 50 kg sample was used due to limited sample availability. Sink-float analyses were also carried out on the DMC overflow and underflow following the DMS to evaluate the efficiency of the separation. Tetrabromoethane (TBE) was the heavy liquid used as the separating medium, with a specific gravity (SG) of 2.96. To produce liquids with lower SGs, the TBE was diluted with acetone, and for higher SG cut-points, −25 µm atomised ferrosilicon (FeSi, SG ~7) was added to the TBE. The samples were separated at the following SG cut-points: 2.7, 2.8, 2.9, 2.95, 3.0, 3.1, 3.2, 3.3 and 3.4. The material less dense than each liquid density is referred to as the “floats” for that specific cut-point, and the material denser than the medium is the “sinks”.
The bulk ore sample was run through a DMS pilot plant, which consists of a Multotec cyclone of 360 mm diameter with a 100 mm spigot. A suspension was created as the separating medium, using 150D FeSi (approximately 80% passing 45 µm) added to water. The following operating conditions were monitored throughout the separation to ensure consistency: circulating feed density, feed pressure, cyclone underflow density and cyclone overflow density. The key aspects of the experiments performed are summarized in the schematic given in
Figure 1.
Each sample produced from the test work was analysed for major element composition using ICP-OES (Inductively Coupled Plasma Optical Emission Spectrometry) to measure its metal grades and for validation of the mineralogical data. The following elements were measured: Mg, Al, Si, Ca, Ti, V, Cr, Mn, Fe, Co, Ni, Cu and Zn. Total sulfur analyses were carried out by combustion (LECO) using a SANAS 17025 accredited method internal to Mintek. The analytical instruments were calibrated using certified reference standards (see
Supplementary Data for more details).
2.2. Mineralogy
Quantitative X-ray diffraction (QXRD) analysis was used to determine the bulk mineralogy of the feed and product samples. The sub-samples for pulverizing were produced using a rotary splitter. For each pulverized sample, 2 g of material was removed and micronized in ethanol for the analysis. Careful sub-sampling is required throughout to minimize the errors associated with the analysis of a small sample mass, and the results are interpreted semi-quantitatively, to evaluate broad changes in mineral proportions with density. Samples were analyzed using a Bruker D8 Advance diffractometer with a LynxEye detector and Fe-filtered CoKα radiation. The measurement was performed over a range of 5–80° 2θ, with a step size of 0.02° 2θ and a counting time of 8 s per step. The Rietveld method was used for quantification together with the fundamental parameters approach [
12,
13]. Detection limits for this technique range from 1–5 mass% [
13] and are dependent on mineral diffraction behaviour. As a result of the long counting times used in this study, the detection limits for the samples measured are estimated to be closer to 1–2 mass%.
A CAMECA SX50 electron probe microanalyzer (EPMA) was used to classify minerals by their chemical composition and identify any nickel occurring in solid solution in pyrrhotite and silicate minerals. The analysis was conducted using wavelength dispersive spectrometry and the system was calibrated and checked using oxide and sulfide reference standards for silicate and sulfide minerals, respectively. Analysis was done at an accelerating voltage of 25 kV with a beam current of 30 nA.
For each ore, samples from three corresponding density classes in the overflow and underflow were analyzed by QEMSCAN (
Table 1). Two QEMSCAN instruments were used, on Leo (at the University of Cape Town) and Zeiss EVO (at Mintek) platforms, with Bruker detectors. This was due to instrument availability. Each sample was split using a rotary splitter and screened into two size fractions, +5.6 mm and −5.6 mm, before mounting in epoxy resin. Polished blocks of approximately 75 × 80 mm in size were produced, as a standard 30 mm polished section would not accommodate more than a few particles of this size. A custom-made sample holder, previously designed at Mintek, was used to fit the samples into the QEMSCAN sample chamber (
Figure 2). A total of five blocks were carbon-coated and analyzed per sample (three from the +5.6 mm fraction and two from the −5.6 mm fraction) in order to increase the representativeness of the sub-samples analyzed. Screening into a larger number of size fractions was limited by low sample masses in certain density classes.
The Field Image measurement mode was used to map individual fields of view, which were stitched together to produce a single image of each polished block. These mapped images were then ‘particulated’ using the iExplorer v5.2 software to separate individual particles from each other so that mineral liberation, particle size and shape could be described. The polished blocks were analyzed at a magnification of 20× (2 mm field size), with a 25 µm point spacing, which resulted in an analysis time of approximately 20 h per block. Grains smaller than the point spacing distance may have been missed during analysis. However, additional results gained from higher resolution analyses did not justify the unreasonably long analysis times, and optical microscopy was used to confirm size and texture information for smaller grains. From the particle maps, the minerals identified and their relative proportions, mineral liberation, association, grain and particle sizes, and particle shapes, were derived. The QEMSCAN results were validated by comparing the chemistry of the samples calculated from the modal analysis with measured major element chemistry. Mineral compositions measured by EPMA were used for the calculation. The measured and calculated assays correlated well for all samples (see
Supplementary Data).
3. Density Separation Results
Ore A had a DMC feed grade of 0.4% nickel. The nickel grade of ore B was measured at 0.28%, with the DMC feed grade at 0.22% after removing the fines fraction, which has a higher nickel grade at 0.56%. Both ores showed upgradeability from the preliminary sink-float analysis, and a cut-point of 3.0 was selected for the DMS test work on both ores to maximize waste rejection. Ore A was expected to have a slightly higher grade and recovery than ore B at this cut-point. The nickel was expected to be upgraded to 0.76% at an 83% recovery for ore A and 0.59% at a 76% recovery for ore B (
Figure 3A). This would increase the feed grade to the flotation plant while reducing the mass input.
The nickel grades and recoveries, as well as mass distribution for the two ore samples, were calculated for different streams of the flowsheet. This includes mass-balanced data from the ROM material to the calculated flotation feed, which is made up of the DMC underflow and the −1 mm fines that were initially removed (
Table 2). The sample of ore A showed a 54% total nickel upgrade from 0.43% in the ROM to 0.66% in the flotation feed, with an 87% nickel recovery to the flotation plant. Calculated results indicate that 44% of the ROM mass was rejected in the DMC overflow, which had a nickel grade of 0.13%. The nickel in the bulk sample of ore B was upgraded by 52%, from 0.28% in the ROM to 0.42% in the flotation feed. Ninety-three per cent of the ROM nickel was recovered to the flotation plant. The mass-balanced data indicated that 39% of the ROM mass was rejected in the DMC overflow. The average nickel grade of the rejected material contained in the overflow stream was 0.05%.
The partition curves for the separations indicate a slight difference in separation efficiency for the two ore types (
Figure 3B). Ore A has a slightly steeper partition curve than ore B, indicating a smaller region of error. The misplacement of low density particles is more pronounced for ore B than ore A, which has almost no material recovered to the sinks fraction at densities less than 2.94. The probable error of separation or the Ecart probable (Ep) is calculated according to the definition by [
10] of half the difference between the densities where 75% and 25% is recovered to the sinks. Ore A separation displayed the lower probable error of separation (Ep) at 0.04, indicating a lower degree of particle misplacement. The Ep shown by the ore B sample was in the acceptable range but slightly higher than ore A, at 0.05.
4. Mineralogical Characterization
4.1. Bulk Mineralogy
Both ores A and B formed as magmatic sulfide deposits of mafic-ultramafic composition [
9,
14,
15], with olivine, pyroxene and plagioclase as the dominant primary minerals. Geologically, the rocks were subjected to alteration at a later stage, during which new secondary minerals, mainly hydrous silicates, were formed from primary mineral assemblages [
16]. Late-stage fluid movement through the rock also created quartz and carbonate veins, which were not part of the original rock. The feed sample of ore A is mostly composed of amphibole, pyroxene, chlorite, carbonates, talc and pyrrhotite (
Figure 4). For ore B, the primary silicate minerals are pyroxene and plagioclase, with the pyroxenes mostly replaced by amphibole and chlorite, and some of the plagioclase altered to epidote (as fine-grained aggregates or saussurite).
From the QXRD of the DMC products, separation of silicate minerals can be observed based on their density differences, in addition to the concentration of sulfide minerals in the higher density fractions (
Figure 5). For ore A, apart from sulfide concentration, pyroxene has also increased in proportion in the DMC underflow due to its SG of 3.4–3.55 [
17], which is much higher than the separation cut-point of 3.0 (
Figure 5). Differences in gangue mineral proportions between the overflow and underflow are more pronounced in ore A with quartz, feldspar and carbonates more abundant in the overflow. The general trend is for primary mafic silicate minerals (pyroxene and olivine) in the rock to be of higher density than the products of their alteration, which are most commonly chlorite, amphibole, serpentine and talc [
16,
18,
19]. Plagioclase feldspar often alters to epidote and in this case, the alteration product is of higher density than the primary silicate and reports preferentially to the underflow, particularly, in ore B where it is more abundant (
Figure 5).
4.2. Nickel Deportment
Nickel deportment was calculated using the relative proportions of the nickel-bearing minerals as determined by QEMSCAN, and their nickel contents measured by EPMA (
Table 3). Pentlandite is the main nickel ore mineral, with pyrrhotite containing averages of 0.51% nickel in ore A and 2.03% nickel in ore B. These are similar values to those measured by [
20]. Although many silicate minerals host nickel in ore A, together they generally account for less than 10% of the total nickel contribution for the ore (
Figure 6). This is due to the low proportion (generally less than 0.1%) of solid solution nickel in each mafic silicate mineral. In ore B, the total sulfide content is lower than ore A and up to 53% of the nickel is hosted in silicate minerals, in the 3.0 floats of the DMC overflow.
4.3. Grain Size, Liberation and Mineral Associations
Grain sizes are described for composite grains of sulfide minerals within particles, as they cannot be separated from each other by DMS and rely on their combined density contribution towards a particle to report to the underflow. In both ores, A and B, composite sulfide mineral grain sizes increase steadily from the low to the high-density classes of each DMC product. By qualitative assessment of the QEMSCAN and optical microscope images, this has been shown to correspond to a change in texture from disseminated to blebs, net-textured or massive, with sulfide grains being larger as the texture becomes more massive (
Figure 7; [
18]). The size of the composite sulfide grains is controlled mostly by pyrrhotite grain size, as the dominant sulfide mineral. Pentlandite occurrence is also observed to change as the overall sulfide texture changes. In disseminated zones, pentlandite mainly occurs as flames in pyrrhotite [
14,
15], whereas granular pentlandite is only noted in association with pyrrhotite in areas containing coarse net-textured or massive sulfides.
The grain sizes are reported in terms of equivalent sphere diameter (ESD) as provided in the QEMSCAN iExplorer software. The ESD represents the diameter of a sphere of equal volume to the grain/particle measured assuming that the measurements are random cross sections through the particle and have been argued to be stereologically sound [
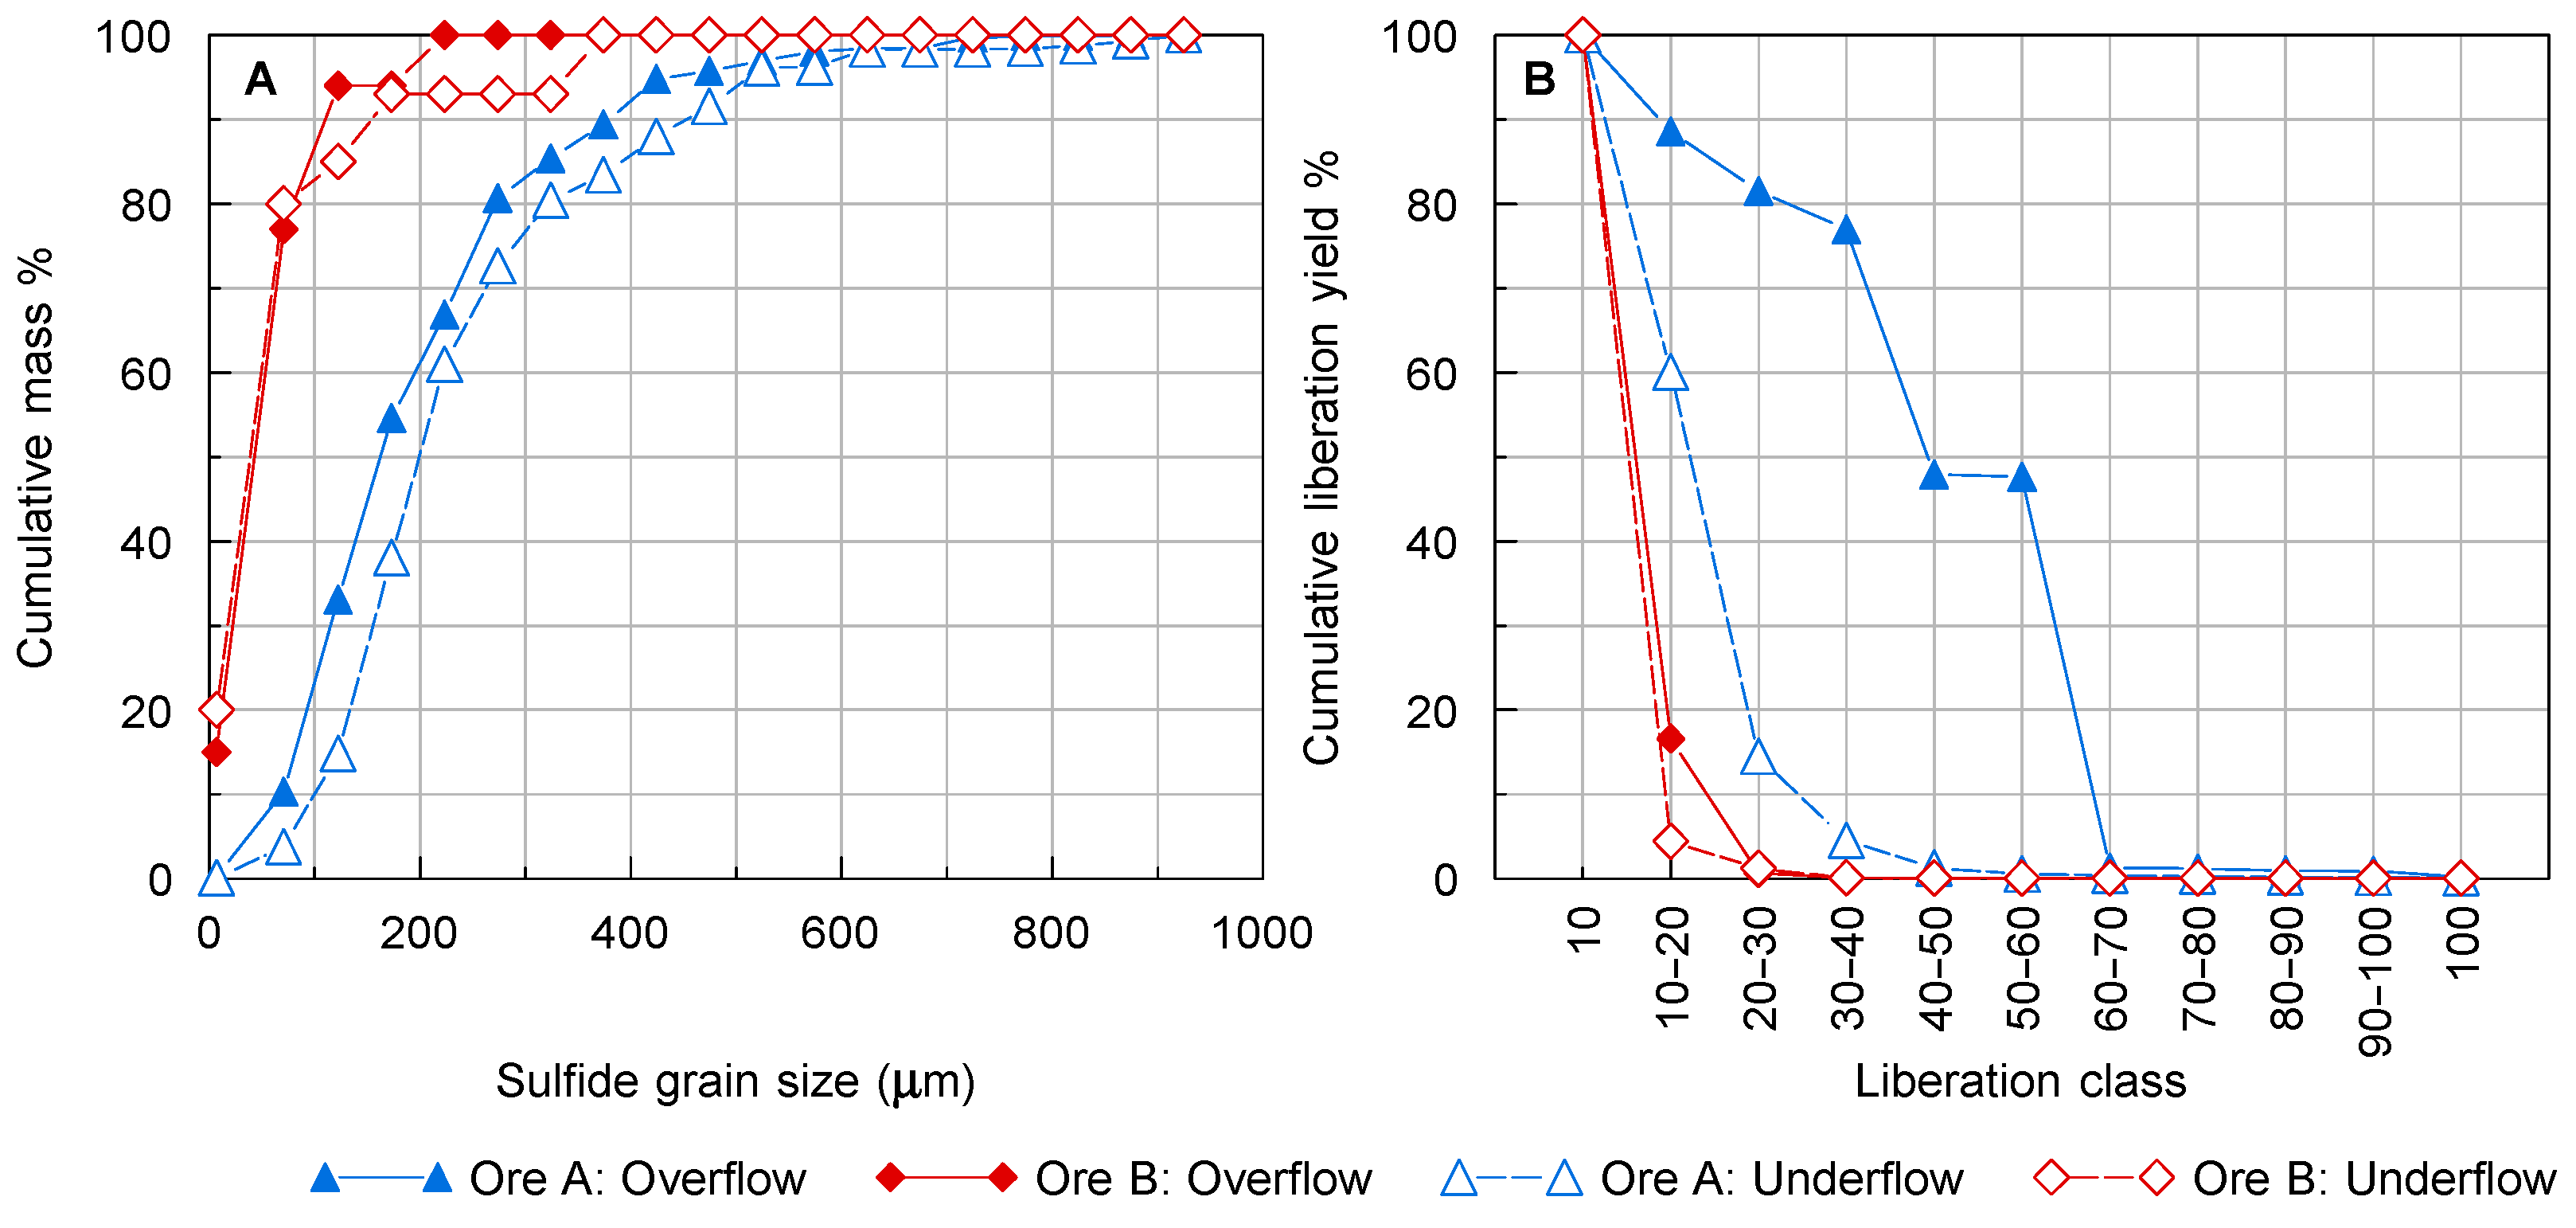
21]. In general, the composite sulfides show smaller grain sizes in the overflow than in the underflow, with most sulfide grains in the overflow smaller than 400 µm (
Figure 8). The largest size difference between grains of the same density was noted between the 3.0 floats in the overflow and underflow of both ores.
Apart from the increase in sulfide grain size with increasing density, grains are also larger, on average, in the DMC underflow than in the overflow for a given density class. This can be attributed to the concentration of a higher proportion of net-textured sulfides to the underflow, whereas finer disseminated sulfides would be more likely to be rejected to the overflow. In general, sulfide particles in ore A are larger than those in ore B within a given density class (
Figure 8A). The smaller ore B sulfides are a result of the mostly disseminated texture of the ore compared with ore A, in which the net-texture commonly occurs. The larger grains and more massive texture occurring in higher density fractions of the ores are also associated with higher nickel grades than the finely disseminated sulfides.
Sulfide mineral liberation is considered for composite grains, as it would be difficult to liberate the closely intergrown sulfides from each other. Pentlandite liberation, in particular, would be near impossible, as pentlandite commonly occurs as fine flame-like exsolution lamellae in pyrrhotite with an average size of 3 µm × 30 µm, as determined by optical microscopy measurements. For DMS especially, the aim would be rather to liberate sulfides as a whole from silicates and other gangue minerals than to try to separate individual sulfide minerals. Even if the liberation of pentlandite was feasible, it would not be achievable at the larger particle sizes required for physical separation methods [
22].
Liberation is influenced by grain size, as larger sulfide grains make up a higher proportion of a particle at a specific particle size, and therefore contribute more to the overall particle density [
5,
6]. In both ores studied, generally >80% of sulfide grains are smaller than 300 µm. With particle sizes of −12 + 1 mm in ore A and −25 + 1 mm in ore B, it is unlikely that many sulfide grains would be liberated (making up >80 area% of the particle section). This is shown from the liberation data, where most composite sulfide grains in both ores are locked (<30 area% of the particle section) in the density classes analyzed by QEMSCAN, and only minor amounts report to the middlings class (30–80 area% of the particle section) in some samples. The sulfides in ore B, however, show lower liberation than the ore A sulfides, with most sulfides making up less than 20% of the particle section area (
Figure 8B). At the DMS cut-point, ore A sulfides are more liberated in the overflow than the underflow. The overflow showed smaller particle sizes, which explains the higher liberation due to the higher area of sulfides in a particle section. The sulfides in ore B are also slightly smaller in size, with more than 80% of grains less than 200 µm, as compared with ore A sulfides, where ~40–60% of grains are less than 200 µm (
Figure 8). With smaller grain sizes and larger particles for the ore B bulk sample, these size differences may have contributed to the slightly lower liberation. This may be a possible factor in the lower nickel recovery attained from the ore B bulk sample compared with the ore A sample, although a reduction to a top size smaller than 25 mm is unlikely to increase the liberation of <200 µm sulfide grains. Tests conducted by Mintek on ores associated with the mine where ore B was derived have shown no observable improvement in nickel grades and recoveries achieved by DMS with a decrease in the top size of the crushed particles.
Sulfide mineral associations with gangue are linked to the relative abundance of the gangue minerals within each sample. Higher density samples contain sulfides that are more closely associated with denser minerals such as pyroxene and epidote. Near the cut-point density, amphibole associations are higher, and at low densities associations with feldspar increase. No preferred association of sulfides with any gangue minerals was noticed. Zones of late-stage alteration, however, such as those containing quartz and calcite veins, did not appear to contain sulfide grains when examined using an optical microscope.
4.4. Particle Properties
4.4.1. Particle Size
The particles from QEMSCAN measurements of both samples from ore A and B show very similar trends in their size distribution. Particle sizes are smaller in the DMC overflow samples when compared with those of the underflow. The largest size differences occur in the denser fractions of both ores, where heavier particles that have reported to the overflow have very small particle sizes (
Figure 9). This is an indication of the misplacement of small particles to the overflow regardless of their density, because of their lower settling rate in the medium [
10,
23]. The 3.1 sinks of the ore A overflow particularly, contained very small particles compared with all the other density classes of both the overflow and underflow. Greater than 90% of the particles in this sample are less than 2 mm, which is near the minimum size of 1 mm for the DMS. Particle size differences are also more pronounced near the DMS cut-point where particles near the cut-point density have an equal chance of floating or sinking and therefore tend to separate on size rather than density.
4.4.2. Particle Shape
The distribution of particle shapes was calculated using shape factor (perimeter
2/area) and elongation (1–width/length). These descriptors were selected to assess the effect of shape on DMS, as rounded and spherical particles are known to be easier to concentrate than elongated, angular or irregular-shaped particles [
24,
25]. The coarse particle sizes (>1 mm) analyzed allow for the use of perimeter-based shape measurements. This is due to the high resolution possible when mapping, compared with particles smaller than 75 µm [
26]. A shape factor of 12.6 corresponds to a circle, with a value of 400 calculated for a needle-shaped particle. A square has a shape factor of approximately 16, with a triangle at ~23 [
27]. For elongation, values nearing 0 signify more or less equidimensional particles, whereas values closer to 1 correspond to very elongate or oblong particles.
Both ores A and B show preferential recovery of higher shape factor particles to the underflow (
Figure 10). More particles with shape factors greater than 25 are found in both the underflow fractions compared with the overflow fractions in both ores. The overflow also shows a narrower distribution of shapes than the underflow. The shape differences are most pronounced at the DMS cut-point, particularly for the ore A sample.
Particle elongation is also slightly higher in the underflow samples, at and lower than the DMS cut-point. This has not been observed from the higher density samples, where a similar distribution of particle elongation occurs in the overflow and underflow, particularly in ore A where the overflow and underflow particles show an almost identical elongation distribution.
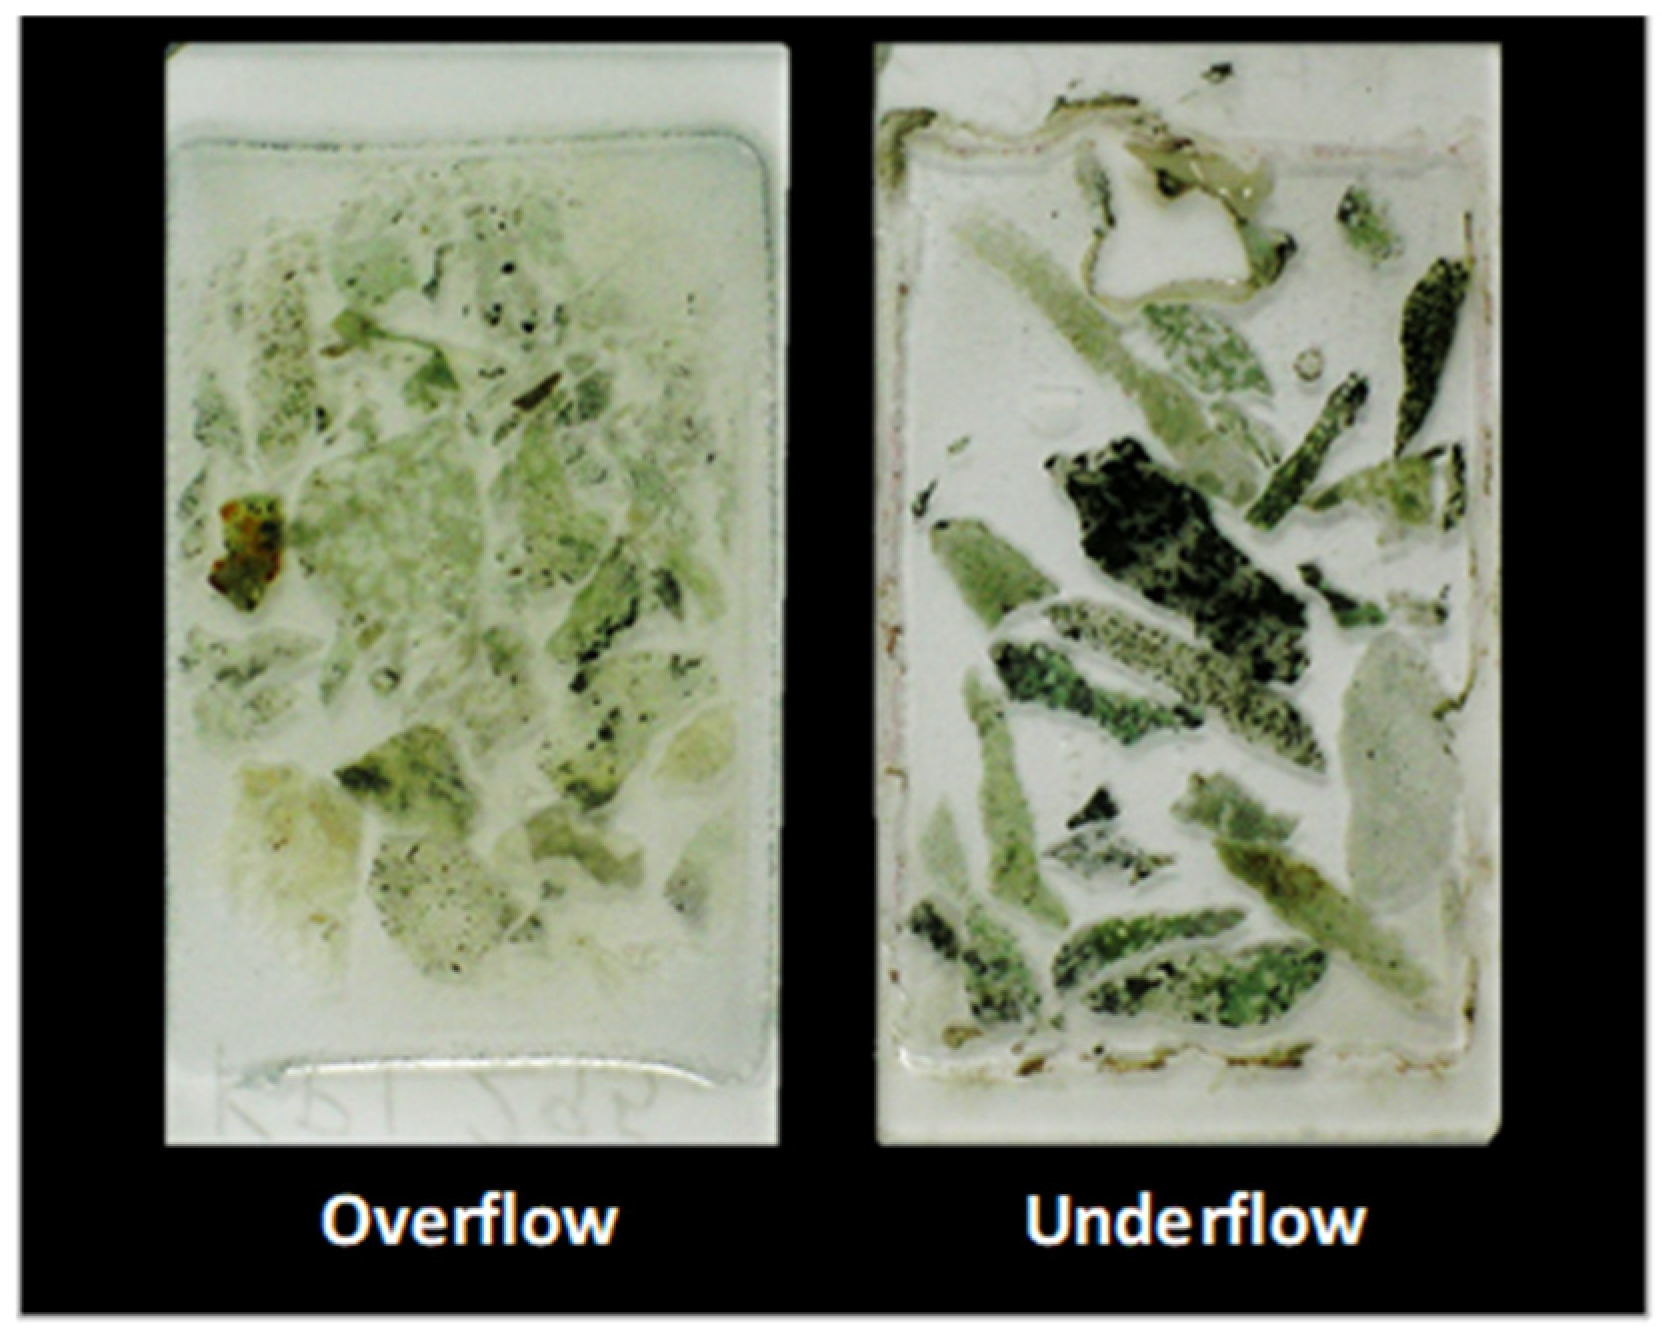
Figure 11 shows thin sections of ore A within the 2.9 floats fraction, in which shape differences could be observed visually between particles of the DMC overflow and underflow. The underflow contains a larger proportion of elongated particles than the overflow, and these were mostly composed of alteration products such as saussurite, sericite, epidote and actinolite. This indicates that shape has a minor effect on the separation.
It has been shown that irregular-shaped and elongate particles are more commonly rejected to the overflow by density separation methods than more spherical, equidimensional or smoother particles, owing to their higher drag coefficients and lower settling rates [
23,
24,
25]. The present results do not conform to the general trend, with more irregular-shaped and elongated particles being preferentially recovered to the underflow. This has been described by [
28], where high shape factor and flattened or elongated particles of shells and roots have become trapped within the dense outer flow of the cyclone. The observed trends may be also explained by turbulence and particle orientation to the flow direction, which can additionally influence which product a particle will report to [
29].
5. Discussion
A combination of mineralogical factors was observed, which contribute to the behaviour of ore particles within a DMC. These are presented in decreasing order of importance:
Particle density: Although different factors influence particle separation, overall particle density remains the strongest control. This is governed by the proportion and SG of each mineral in a particle. Both ores are mineralogically complex and contain a variety of primary and secondary gangue minerals with a wide range in SG [
14,
15]. Generally denser primary silicates such as pyroxene are more likely to be concentrated in the underflow than their less dense alteration products, e.g., chlorite and talc [
30]. Dense particles recovered to the underflow therefore may be barren of sulfides, consisting rather of dense gangue minerals. Associations of fine-grained sulfides with different gangue minerals may affect whether they are concentrated or rejected.
Sulfide texture: Three sulfide textures were identified in the ores: disseminated/bleb-textured, net-textured and massive. A change in sulfide texture from disseminated to net-textured to massive is linked to an increase in sulfide mineral grain size, which in turn increases liberation. Although liberation is poor throughout the samples because of the large particle sizes, net-textured to massive sulfides are more often recovered to the product than finely disseminated sulfides, which dominate the overflow. The change in texture from disseminated to massive also corresponds to a change in the pentlandite occurrence from flame-like lamellae in pyrrhotite to granular pentlandite. [
31] also emphasized the importance of sulfide texture contributing to the performance of the DMC.
Particle size: Size separation is most important for particles nearing the cut-point density, which have a more-or-less equal chance of floating or sinking. These particles tend to then separate dominantly on size rather than density, with larger particles concentrated to the underflow and smaller particles rejected to the overflow. The rejection of particles less than ~2 mm to the overflow is also common even for particles of high density, as particles close to the minimum cut-off size have a low settling rate and are therefore easily dragged into the overflow.
Particle shape: Particle shape does not appear to have a major influence on the separation of the ores studied. As in the case of size, shape differences are more pronounced at the DMS cut-point, and slightly below the cut-point, where factors other than density have a stronger influence on the separation. For both ores, more irregular and elongated particles tended to sink rather than float.
Understanding the above factors can help to predict the separation based not only on overall particle density but as a function of mineral textures and compositions, a further advantage is the availability of data for individual particles. This can aid in the development of models that account for factors such as the potential recovery of dense barren gangue particles, or the loss of silicate-hosted nickel to the overflow, which the traditional method of sink-float analysis does not consider. The detailed information gained on the ore can also be used for the selection and optimization of downstream processes following preconcentration and will give an indication of the complexity and variability of the ore body in terms of geometallurgical units [
32]. Although the costs of quantitative mineralogy are generally high and analyses can be time-consuming, [
33,
34] have calculated a higher return on investment for projects where automated mineralogy is an early step in ore characterization.
6. Conclusions
For the nickel sulfide ores studied, apart from overall particle density, sulfide texture is observed to be the main mineralogical control on the individual particle recovery by DMS. This is due to massive and net-textured sulfides having larger grain sizes and therefore higher liberation than disseminated sulfides. In addition to the DMS concentration of sulfide minerals, primary and secondary silicate minerals are separated by their density differences, which can affect the recovery of finely disseminated sulfides associated with them. Silicate-hosted nickel is another factor that accounts for higher nickel losses to the overflow, observed particularly in ore B. Particle size is also an important control on DMS, where particles near the cut-point, particularly those less than ~2 mm, tend to separate on size rather than density. An evaluation of particle shapes shows that shape separation plays a minor role for the ores studied, and shape differences are most pronounced nearer to the DMS cut-point, where a higher proportion of irregular-shaped and elongated particles have been concentrated to the underflow.
These observations show that mineralogical properties have the potential to predict the behaviour of an ore when subjected to DMS. This will be useful because only the feed sample is needed to perform the evaluation before deciding on the processing route. The density of the components and the liberation state of the feed can be used to determine if DMS will be a suitable preconcentration method for gangue removal. The level of detail provided by quantitative mineralogical techniques can also be used to build toward a model that accounts for individual particle separation based on the mineral compositions and textural relationships, as well as ore variability.
Author Contributions
Conceptualization, K.P., M.B. and D.C.; methodology, K.P., M.B. and D.C.; formal analysis, K.P., M.B., D.C. and A.N.M.; writing—original draft preparation, K.P.; writing—review and editing, K.P., M.B., D.C. and A.N.M.; funding acquisition, K.P. and D.C. All authors have read and agreed to the published version of the manuscript.
Funding
This research was funded by Mintek through its State Grant allocation.
Data Availability Statement
Acknowledgments
The mines providing samples of ores A and B are gratefully acknowledged for their support of this project. Staff at the Centre for Minerals Research and Mintek are also gratefully acknowledged for their assistance with the experimental work and mineralogical characterization.
Conflicts of Interest
The authors declare no conflict of interest.
References
- Bergmann, C. Preconcentration or Ores: Overview. In Proceedings of the SAIMM Mineral Processing Conference Workshop “Pre-Concentration in and Upgrading of Ores”, Cape Town, South Africa, 1 August 2012; SAIMM, Vineyard Hotel: Cape Town, South Africa, 2012. [Google Scholar]
- Callaghan, C. Mineral Resource Based Growth Pole Industrialisation—Base Metals Report. 2013. Available online: https://www.academia.edu/10226757/Mineral_Resource_Based_Growth_Pole_Industrialisation_Base_Metals_Report (accessed on 13 October 2022).
- Legault-Seguin, E.; Mohns, C.; Rylatt, M. Dense Medium Separation—An Effective and Robust Preconcentration Technology. In Proceedings of the 48th Annual Canadian Mineral Processors Operators Conference, Ottawa, ON, Canada, 19–21 January 2016; CMP: Ottawa, ON, Canada, 2016; pp. 381–400. [Google Scholar]
- Lessard, J.; De Bakker, J.; McHugh, L. Development of ore sorting and its impact on mineral processing economics. Miner. Eng. 2014, 65, 88–97. [Google Scholar] [CrossRef]
- Burt, R. Developments in Mineral Processing, Volume 5: Gravity Concentration Technology; Elsevier Science Publishers: New York, NY, USA, 1984. [Google Scholar]
- Jones, M.P. Applied Mineralogy: A Quantitative Approach; Graham and Trotman: London, UK, 1987. [Google Scholar]
- Morgan, P. The Impact of Crushing Plant Upgrade and DMS Pre-Concentration on the Processing Capability of the Tati Nickel Concentrator. In Proceedings of the SAIMM Base Metals Conference, Kasane, Botswana, 27–29 July 2009; Southern African Institute of Mining and Metallurgy: Johannesburg, South Africa, 2009; pp. 231–244. [Google Scholar]
- Barnes, S.-J.; Lightfoot, P.C. Formation of Magmatic Nickel Sulfide Deposits and Processes Affecting Their Copper and Platinum Group Element Contents. In Economic Geology: One Hundredth Anniversary Volume; Hedenquist, J.W., Thompson, J.F.H., Goldfarb, R.J., Richards, J.P., Eds.; Society of Economic Geologists: Littleton, CO, USA, 2005. [Google Scholar] [CrossRef]
- Robb, L. Introduction to Ore Forming Processes; Blackwell Publishing: Malden, MA, USA, 2005. [Google Scholar]
- Wills, B.A.; Napier-Munn, T.J. Will’s Mineral Processing Technology: An Introduction to the Practical Aspects of Ore Treatment and Mineral Recovery, 7th ed.; Elsevier: Amsterdam, The Netherlands, 2006. [Google Scholar]
- Gy, P.M. The Sampling of Broken Ores—A General Theory. In Proceedings of the Sampling Practices in the Mineral Industries Symposium, Melbourne, Australia, 16 September 1976; Australasian Institute of Mining and Metallurgy: Melbourne, Australia, 1976; p. 17. [Google Scholar]
- Rietveld, H.M. A profile refinement method for nuclear and magnetic structures. J. Appl. Crystallogr. 1969, 2, 65–71. [Google Scholar] [CrossRef]
- Pecharsky, V.; Zavalij, P. Fundamentals of Power Diffraction and Structural Characterization of Materials; Springer Science and Business Media: New York, NY, USA, 2005. [Google Scholar]
- Gauert, C.D.K. Sulphide and oxide mineralisation in the Uitkomst Complex, South Africa: Origin in a magma conduit. J. Afr. Earth Sci. 2001, 32, 149–161. [Google Scholar] [CrossRef]
- Maier, W.D.; Barnes, S.-J.; Chinyepi, G.; Barton, M.J.; Eglington, B.; Setshedi, I. The composition of magmatic Ni–Cu–(PGE) sulfide deposits in the Tati and Selebi-Phikwe belts of eastern Botswana. Miner. Depos. 2008, 43, 37–60. [Google Scholar] [CrossRef]
- Steenkamp, N. Alteration Assemblage in the Lower Units of the Uitkomst Complex, Mpumalanga Province, South Africa. Ph.D. Thesis, University of Pretoria, Pretoria, South Africa, 2012. [Google Scholar]
- Deer, W.A.; Howie, R.A.; Zussman, J. An Introduction to the Rock—Forming Minerals, 2nd ed.; Addison, Wesley, Longman: Essex, UK, 1992. [Google Scholar]
- Mishra, G. A Geometallurgical Assessment of the Geological and Mineralogical Influences on Flotation Performance at the Nkomati Nickel Mine, Mpumalanga, South Africa. Ph.D. Thesis, University of Johannesburg, Johannesburg, South Africa, 2014. [Google Scholar]
- Barthelmy, D. Webmineral. Available online: http://www.webmineral.com/ (accessed on 1 June 2022).
- Becker, M.; de Villiers, J.; Bradshaw, D. The Mineralogy and Crystallography of Pyrrhotite from Selected Nickel and PGE Ore Deposits. Econ. Geol. 2010, 105, 1025–1037. [Google Scholar] [CrossRef]
- Haider, A.; Levenspiel, O. Drag coefficient and terminal velocity of spherical and nonspherical particles. Powder Technol. 1989, 58, 63–70. [Google Scholar] [CrossRef]
- Cresswell, G.M. Pre-Concentration of Base Metal Ores by Dense Medium Separation. In Proceedings of the SAIMM Copper, Cobalt, Nickel and Zinc Recovery Conference, Livingstone, Zambia, 9–12 July 2018; Southern African Institute of Mining and Metallurgy: Johannesburg, South Africa, 2001; p. 10. [Google Scholar]
- Napier-Munn, T.J.; Scott, I.A. The effect of demagnetisation and ore contamination on the viscosity of the medium in a dense medium cyclone plant. Miner. Eng. 1990, 3, 607–613. [Google Scholar] [CrossRef]
- Furuuchi, M.; Gotoh, K. Shape separation of particles. Powder Technol. 1992, 73, 1–9. [Google Scholar] [CrossRef]
- Ferrara, G.; Bevilacqua, P.; De Lorenzi, L.; Zanin, M. The influence of particle shape on the dynamic dense medium separation of plastics. Int. J. Miner. Process. 2000, 59, 225–235. [Google Scholar] [CrossRef]
- Little, L.; Becker, M.; Wiese, J.; Mainza, A.N. Auto-SEM particle shape characterisation: Investigating fine grinding of UG2 ore. Miner. Eng. 2015, 82, 92–100. [Google Scholar] [CrossRef]
- Grobler, J.D.; Bosman, J.B. Gravity Separator Performance Evaluation Using Qemscan® Particle Mineral Analysis. J. South. Afr. Inst. Min. Metall. 2011, 111, 401–408. [Google Scholar]
- Chaston, I.; Napier-Munn, T. Design and Operation of Dense-Medium Cyclone Plants for the Recovery of Diamonds in Africa. J. South. Afr. Inst. Min. Metall. 1974, 75, 120–133. [Google Scholar]
- Loth, E. Drag of non-spherical solid particles of regular and irregular shape. Powder Technol. 2008, 182, 342–353. [Google Scholar] [CrossRef]
- Gibson, C.E.; Aghamirian, M.; Grammatikopoulos, T.; Smith, D.L.; Bottomer, L. The Recovery and Concentration of Spodumene Using Dense Media Separation. Minerals 2021, 11, 649. [Google Scholar] [CrossRef]
- Altun, N.E.; Weatherwax, T.; Klein, B. Upgrading valuable mineralization and rejecting magnesium silicates by pre-concentration of mafic ores. Physicochem. Probl. Miner. Process. 2014, 50, 203–215. [Google Scholar] [CrossRef]
- Lotter, N.O.; Kormos, L.; Oliveira, J.; Frangomeni, D.; Whiteman, E. Modern Process Mineralogy: Two case studies. Miner. Eng. 2011, 24, 638–650. [Google Scholar] [CrossRef]
- Gu, Y.; Schouwstra, R.P.; Rule, C. The value of automated mineralogy. Miner. Eng. 2014, 58, 100–103. [Google Scholar] [CrossRef]
- Lotter, N.O.; Baum, W.; Reeves, S.; Arrué, C.; Bradshaw, D.J. The business value of best practice process mineralogy. Miner. Eng. 2018, 116, 226–238. [Google Scholar] [CrossRef]
Figure 1.
Schematic showing the tests performed on samples split from the bulk sample collected. Samples on which the mineralogical analysis was undertaken are shaded. * A crush top size of 12 mm was used for ore A, and 25 mm for ore B.
Figure 1.
Schematic showing the tests performed on samples split from the bulk sample collected. Samples on which the mineralogical analysis was undertaken are shaded. * A crush top size of 12 mm was used for ore A, and 25 mm for ore B.
Figure 2.
Sample holder containing the carbon-coated polished block (75 mm × 80 mm) used for the analysis.
Figure 2.
Sample holder containing the carbon-coated polished block (75 mm × 80 mm) used for the analysis.
Figure 3.
Comparison of grade and recovery curves (A) and partition curves (B) for ores A and B.
Figure 3.
Comparison of grade and recovery curves (A) and partition curves (B) for ores A and B.
Figure 4.
Bulk mineralogy of the DMC feeds as determined by QXRD, with average SGs given in brackets. The Fe-Ti oxides grouping includes magnetite, hematite, chromite, ilmenite and rutile.
Figure 4.
Bulk mineralogy of the DMC feeds as determined by QXRD, with average SGs given in brackets. The Fe-Ti oxides grouping includes magnetite, hematite, chromite, ilmenite and rutile.
Figure 5.
Bulk mineralogy of the individual density fractions for the ore A (A) and B (B) overflow, and ore A (C) and B (D) underflows. The change in quartz + feldspar content with density is shown with dotted lines, as an example of gangue separation.
Figure 5.
Bulk mineralogy of the individual density fractions for the ore A (A) and B (B) overflow, and ore A (C) and B (D) underflows. The change in quartz + feldspar content with density is shown with dotted lines, as an example of gangue separation.
Figure 6.
Nickel deportment in the DMC overflow and underflow products for ore A (A) and ore B (B). For simplification, chlorite, serpentine, talc and epidote are grouped as ‘alteration minerals’.
Figure 6.
Nickel deportment in the DMC overflow and underflow products for ore A (A) and ore B (B). For simplification, chlorite, serpentine, talc and epidote are grouped as ‘alteration minerals’.
Figure 7.
Selected false colour particle images of ore A mapped by QEMSCAN, showing observed sulfide textures and corresponding changes in grain size.
Figure 7.
Selected false colour particle images of ore A mapped by QEMSCAN, showing observed sulfide textures and corresponding changes in grain size.
Figure 8.
Cumulative sulfide grain size distribution (A) and cumulative liberation yield (B) in the cut-point samples of ore A (3.1 floats) and ore B (3.0 floats) DMC products.
Figure 8.
Cumulative sulfide grain size distribution (A) and cumulative liberation yield (B) in the cut-point samples of ore A (3.1 floats) and ore B (3.0 floats) DMC products.
Figure 9.
Cumulative particle size distribution in samples of the ore A (overflow 3.1 sinks and underflow 3.2 floats) and ore B (overflow and underflow 3.1 floats) DMC products, at densities higher than the cut-point.
Figure 9.
Cumulative particle size distribution in samples of the ore A (overflow 3.1 sinks and underflow 3.2 floats) and ore B (overflow and underflow 3.1 floats) DMC products, at densities higher than the cut-point.
Figure 10.
Distribution of particle shape at the DMS cut-point.
Figure 10.
Distribution of particle shape at the DMS cut-point.
Figure 11.
Illustration of the variation in shape of particles recovered to the overflow and underflow at the DMS cut-point for ore A. Thin section glass slides are 46 mm × 26 mm in size.
Figure 11.
Illustration of the variation in shape of particles recovered to the overflow and underflow at the DMS cut-point for ore A. Thin section glass slides are 46 mm × 26 mm in size.
Table 1.
List of samples analyzed by QEMSCAN. The mass proportion of the DMC product and the number of particles measured is also given.
Table 1.
List of samples analyzed by QEMSCAN. The mass proportion of the DMC product and the number of particles measured is also given.
| | SG Class | Mass% | No. of Particles |
|---|
| Ore A DMC Overflow | 3.0 floats (SG 2.95–3.0) | 18.13 | 4321 |
| 3.1 floats (SG 3.0–3.1) | 13.26 | 890 |
| 3.1 sinks (SG 3.1+) | 0.42 | 5854 |
| Ore A DMC Underflow | 3.0 floats (SG 2.95–3.0) | 7.66 | 3223 |
| 3.1 floats (SG 3.0–3.1) | 40.19 | 2606 |
| 3.2 floats (SG 3.1–3.2) | 20.02 | 3616 |
| Ore B DMC Overflow | 2.95 floats (SG 2.9–2.95) | 23.8 | 4060 |
| 3.0 floats (SG 2.95–3.0) | 14.7 | 2755 |
| 3.1 floats (SG 3.0–3.1) | 2.6 | 5752 |
| Ore B DMC Underflow | 2.95 floats (SG 2.9–2.95) | 12.1 | 3058 |
| 3.0 floats (SG 2.95–3.0) | 18.9 | 2442 |
| 3.1 floats (SG 3.0–3.1) | 43.2 | 2215 |
Table 2.
Mass-balanced mass, grade and recovery information at different points in the flowsheet.
Table 2.
Mass-balanced mass, grade and recovery information at different points in the flowsheet.
| | Stream | Mass% | Ni Grade (%) | Ni Recovery (%) |
|---|
| Ore A | ROM | 100 | 0.43 | 100 |
| −25 + 1 mm | 84 | 0.39 | 76 |
| −1 mm | 16 | 0.62 | 24 |
| DMC overflow | 44 | 0.13 | 13 |
| DMC underflow | 40 | 0.67 | 63 |
| Float feed | 56 | 0.66 | 87 |
| Ore B | ROM | 100 | 0.28 | 100 |
| −25 + 1 mm | 82 | 0.22 | 65 |
| −1 mm | 18 | 0.56 | 35 |
| DMC overflow | 39 | 0.05 | 7 |
| DMC underflow | 43 | 0.37 | 58 |
| Float feed | 61 | 0.42 | 93 |
Table 3.
Measured nickel contents (mass%). n = no. of grains analyzed.
Table 3.
Measured nickel contents (mass%). n = no. of grains analyzed.
| Mineral | Ore A | Ore B |
|---|
| n | Average | Std Dev. | n | Average | Std Dev. |
|---|
| pentlandite | 48 | 34.28 | 0.19 | 22 | 37.52 | 0.22 |
| pyrrhotite | 13 | 0.51 | 0.11 | 50 | 2.03 | 1.02 |
| chlorite | 10 | 0.07 | 0.05 | 16 | 0.10 | 0.05 |
| mica | 11 | 0.07 | 0.04 | - | - | - |
| serpentine | 6 | 0.09 | 0.05 | - | - | - |
| talc | 11 | 0.08 | 0.04 | - | - | - |
| epidote | - | - | - | 10 | 0.06 | 0.02 |
| pyroxene | 8 | 0.06 | 0.02 | 15 | 0.02 | 0.02 |
| amphibole | 22 | 0.04 | 0.01 | 20 | 0.05 | 0.02 |
| Publisher’s Note: MDPI stays neutral with regard to jurisdictional claims in published maps and institutional affiliations. |
© 2022 by the authors. Licensee MDPI, Basel, Switzerland. This article is an open access article distributed under the terms and conditions of the Creative Commons Attribution (CC BY) license (https://creativecommons.org/licenses/by/4.0/).


