Article

Evolution of the Piauí Laterite, Brazil: Mineralogical, Geochemical and Geomicrobiological Mechanisms for Cobalt and Nickel Enrichment

1
Department of Earth Sciences, Natural History Museum, London SW7 5BD, UK
2
Williamson Research Centre, School of Earth and Environmental Sciences, University of Manchester, Manchester M13 9PL, UK
3
Camborne School of Mines, University of Exeter, Penryn TR10 9FE, UK
4
Diamond Light Source Ltd., Harwell Science and Innovation Campus, Chilton OX11 0DE, UK
5
School of Ocean and Earth Science, University of Southampton, Southampton SO14 3ZH, UK
6
Brazilian Nickel PLC, 10 Lonsdale Gardens, Tunbridge Wells TN1 1NU, UK
*
Author to whom correspondence should be addressed.
Minerals 2022, 12(10), 1298; https://doi.org/10.3390/min12101298
Submission received: 6 September 2022 / Revised: 28 September 2022 / Accepted: 3 October 2022 / Published: 14 October 2022
(This article belongs to the Special Issue Geochemistry and Mineralogy of Ni-Co Laterite Deposits)

Abstract

:
The Piauí laterite (NE Brazil) was initially evaluated for Ni but also contains economic concentrations of Co. Our investigations aimed to characterise the Co enrichment within the deposit; by understanding the mineralogy we can better design mineral processing to target Co recovery. The laterite is heterogeneous on the mineralogical and lithological scale differing from the classic schematic profiles of nickel laterites, and while there is a clear transition from saprolite to more ferruginous units, the deposit also contains lateral and vertical variations that are associated with both the original intrusive complex and also the nature of fluid flow, redox cycling and fluctuating groundwater tables. The deposit is well described by the following six mineralogical and geochemical units: SAPFE, a clay bearing ferruginous saprolite; SAPSILFE, a silica dominated ferruginous saprolite; SAPMG, a green magnesium rich chlorite dominated saprolite; SAPAL, a white-green high aluminium, low magnesium saprolite; saprock, a serpentine and chlorite dominated saprolite and the serpentinite protolith. Not all of these units are ‘ore bearing’. Ni is concentrated in a range of nickeliferous phyllosilicates (0.1–25 wt%) including serpentines, talc and pimelite, goethite (up to 9 wt%), magnetite (2.8–14 wt%) and Mn oxy-hydroxides (0.35–19 wt%). Lower levels of Ni are present in ilmenites, chromites, chlorite and distinct small horizons of nickeliferous silica (up to 3 wt% Ni). With respect to Co, the only significant chemical correlation is with Mn, and Mn oxy-hydroxides contain up to 14 wt% Co. Cobalt is only present in goethite when Mn is also present, and these goethite grains contain an average of 0.19 wt% Co (up to a maximum of 0.65 wt%). The other main Co bearing minerals are magnetite (0.41–1.89 wt%), chlorite (up to 0.45 wt%) and ilmenite (up to 0.35 wt%). Chemically there are three types of Mn oxy-hydroxide, asbolane, asbolane-lithiophorite intermediates and romanechite. Spatially resolved X-ray absorption spectroscopy analysis suggests that the Co is present primarily as octahedrally bound Co3+ substituted directly into the MnO6 layers of the asbolane-lithiophorite intermediates. However significant levels of Co2+ are evident within the asbolane-lithiophorite intermediates, structurally bound along with Ni in the interlayer between successive MnO6 layers. The laterite microbial community contains prokaryotes and few fungi, with the highest abundance and diversity closest to ground level. Microorganisms capable of metal redox cycling were identified to be present, but microcosm experiments of different horizons within the deposit demonstrated that stimulated biogeochemical cycling did not contribute to Co mobilisation. Correlations between Co and Mn are likely to be a relic of parent rock weathering rather than due to biogeochemical processes; a conclusion that agrees well with the mineralogical associations.

1. Introduction

Nickeliferous laterite deposits are an increasingly important resource for a range of critical metals such as Ni and Co, e.g., [1,2,3,4,5], but also including rare earth elements (REE), platinum group elements (PGE) and green technology elements such as Sc e.g., [6,7,8,9]. Nickel-cobalt lateritic deposits form in tropical and sub-tropical environments through extensive weathering of ultramafic rocks. Variations in climate, weathering and erosional environment have a significant impact on the nature of laterite deposits and, based largely upon their nickeliferous mineralogy, they are often classified as one of three distinct deposit types; oxide dominated, clay rich or hydrous Mg-silicate e.g., [10,11,12,13,14].
Many of the globally most significant Ni-Co laterite deposits occur in the humid tropical regions within New Caledonia, Colombia, Cuba, Indonesia, Philippines, Dominican Republic and Venezuela e.g., [11,15]. In addition to these deposits are those within more temperate, semi-arid and arid regions such as Australia, USA, Central America, Brazil, Madagascar, Kazakhstan, Russia, Turkey, Greece, and the Balkan region of Europe e.g., [11,14,16], and these deposits are often referred to as palaeolaterites or palaeodeposits e.g., [11,12,15]. Distinct laterite deposits are distributed throughout Brazil though they are less common in the south and northeastern regions [17,18] and are mostly correlated to the Sul Americano and Velhas (Lower and Upper Tertiary, respectively) levelling cycles [18]. These Brazilian lateritic deposits are broadly consistent with the general description for laterites from around the world and there is a numerical dominance of hydrous Mg-silicate deposit types over oxidised types [18]. One of these Brazilian nickeliferous laterites is that of São João do Piauí, northeastern Brazil e.g., [19,20], and while being generally consistent with the standard laterite description, the profile maintains an additional complexity due to a series of mafic intrusions within the original dunite source.
The nickel-cobalt laterite deposit at São João do Piauí, located in Piauí State of northeastern Brazil (Figure 1), was acquired by Brazilian Nickel Ltd. (BRN) in 2014 with a view to applying heap leach technology e.g., [21], for ore processing. The deposit resource is 72 Mt with 1.00% Ni and 0.05% Co with 73% of the resource measured [22]. By the end of 2017 a demonstration plant had successfully established a low-impact heap leaching, purification and recovery process for the hydrometallurgical recovery of nickel and cobalt as mixed-metal (Ni and Co) hydroxide products. This demonstration technology produced heap extractions in excess of 80% Ni. By the end of 2022 it is hoped that BRN will be continuously producing Ni and Co, aiming towards 1400 t of Ni and 35 t of Co per year [23].
In this manuscript we investigate the factors that contribute to the mobilisation and enrichment of cobalt in a nickel-laterite deposit. We provide a description of the mineralogy, geochemistry, geomicrobiology and evolution of the São João do Piauí nickel-cobalt laterite deposit with an emphasis on the mobility and potential cycling of cobalt.

2. Geological Context

The São João do Piauí deposit is situated in the igneous mafic-ultramafic Brejo Seco–Piauí Complex in the São Francisco craton [20,24,25]. The complex is bound between two contrasting tectonic settings with the metasedimentary Morro Branco Complex to the north and the syn-collisional granite of the Rajada Suite to the south (Figure 1). The deposit is set within a terrain of intensely deformed volcanic, volcano–sedimentary and sedimentary rocks of Precambrian age that have been intruded by mafic-ultramafic bodies. These mafic-ultramafic bodies are differentiated and comprise serpentinised ultramafics at their base with the upward progression towards troctolites, metagabbros and anorthosites [22,25]. The entire sequence has been intruded by granitic and granodioritic bodies and is unconformably overlain by sediments of the Sierra Grande Formation, Pimenteiras Formation and Cabeças Formation [25,26].
The Brejo Seco–Piauí Complex is dominantly gabbroic in nature and has been divided into four zones [25,27] with a north to south progression starting with the lower mafic zone followed by the ultramafic zone, transitional mafic zone and the upper mafic zone. The lower mafic zone is an olivine-rich troctolite cumulate, while the ultramafic zone is a serpentinised dunite which grades through a complex of diorites, gabbros and troctolites forming the transitional mafic zone and upper mafic zone [27]. The ultramafic body at São João do Piauí lies within the ultramafic zone, is capped by a silcrete crust and has undergone intense and extensive laterisation resulting in the formation of the nickel-cobalt laterite deposit [18,19,25].
The ultramafic unit of the ultramafic zone outcrops in a zone some 3.5 km in strike running east–west and 1.5 km wide at the widest point north–south. A pronounced silica cap forms a 100 m high plateau that is related to the palaeosurface of the Sul Americano and Velhas levelling cycle [18]. This silica cap overlies and protects the underlying mineralised weathered ultramafic unit itself, and locally the cap forms a topographic plateau that measures some 2 km × 0.2–0.7 km in extent. The mineralised profile is 30 to 50 m thick below this cap and is partly exposed on the slopes of the dissected plateau, although colluvium derived from the silica cap obscures much of the geology and the bulk of the geology of the deposit has only been revealed by drilling [28].

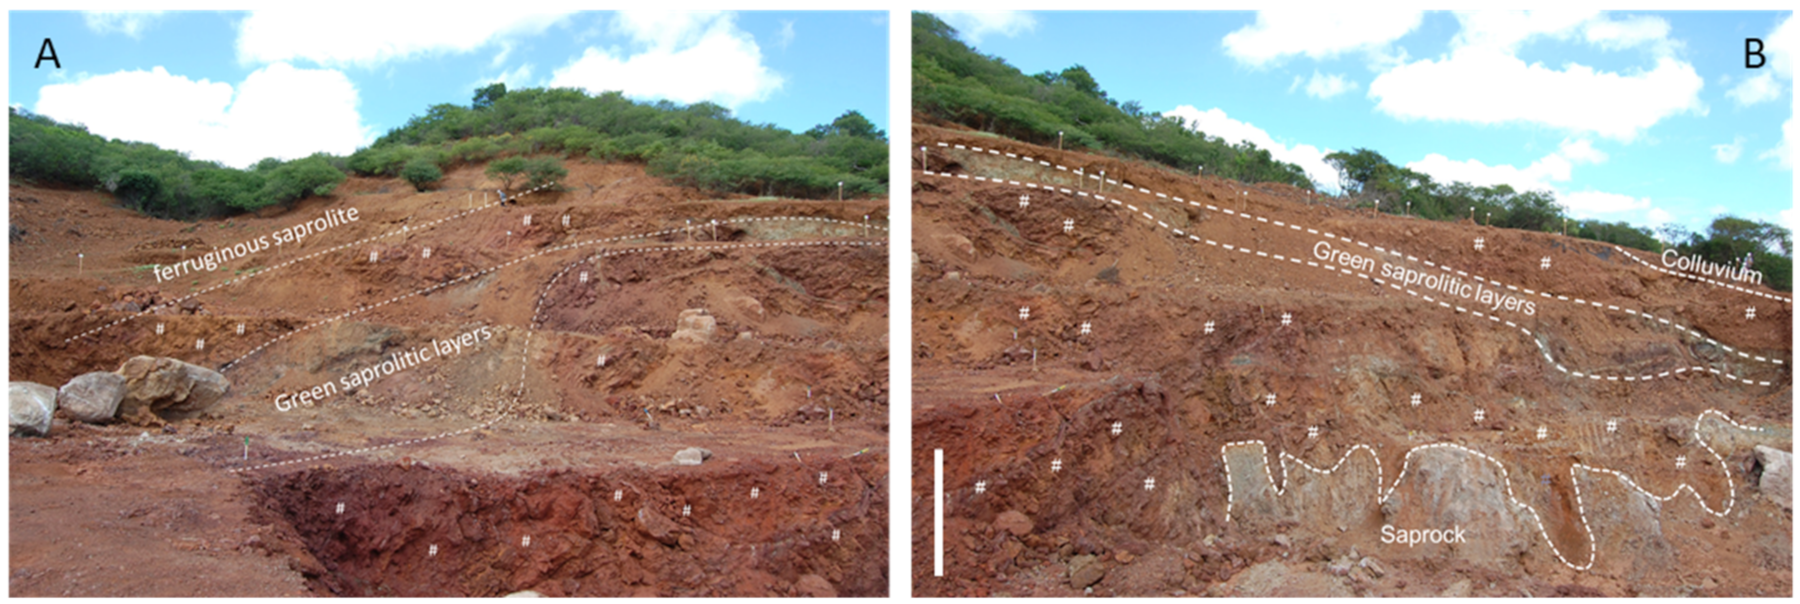
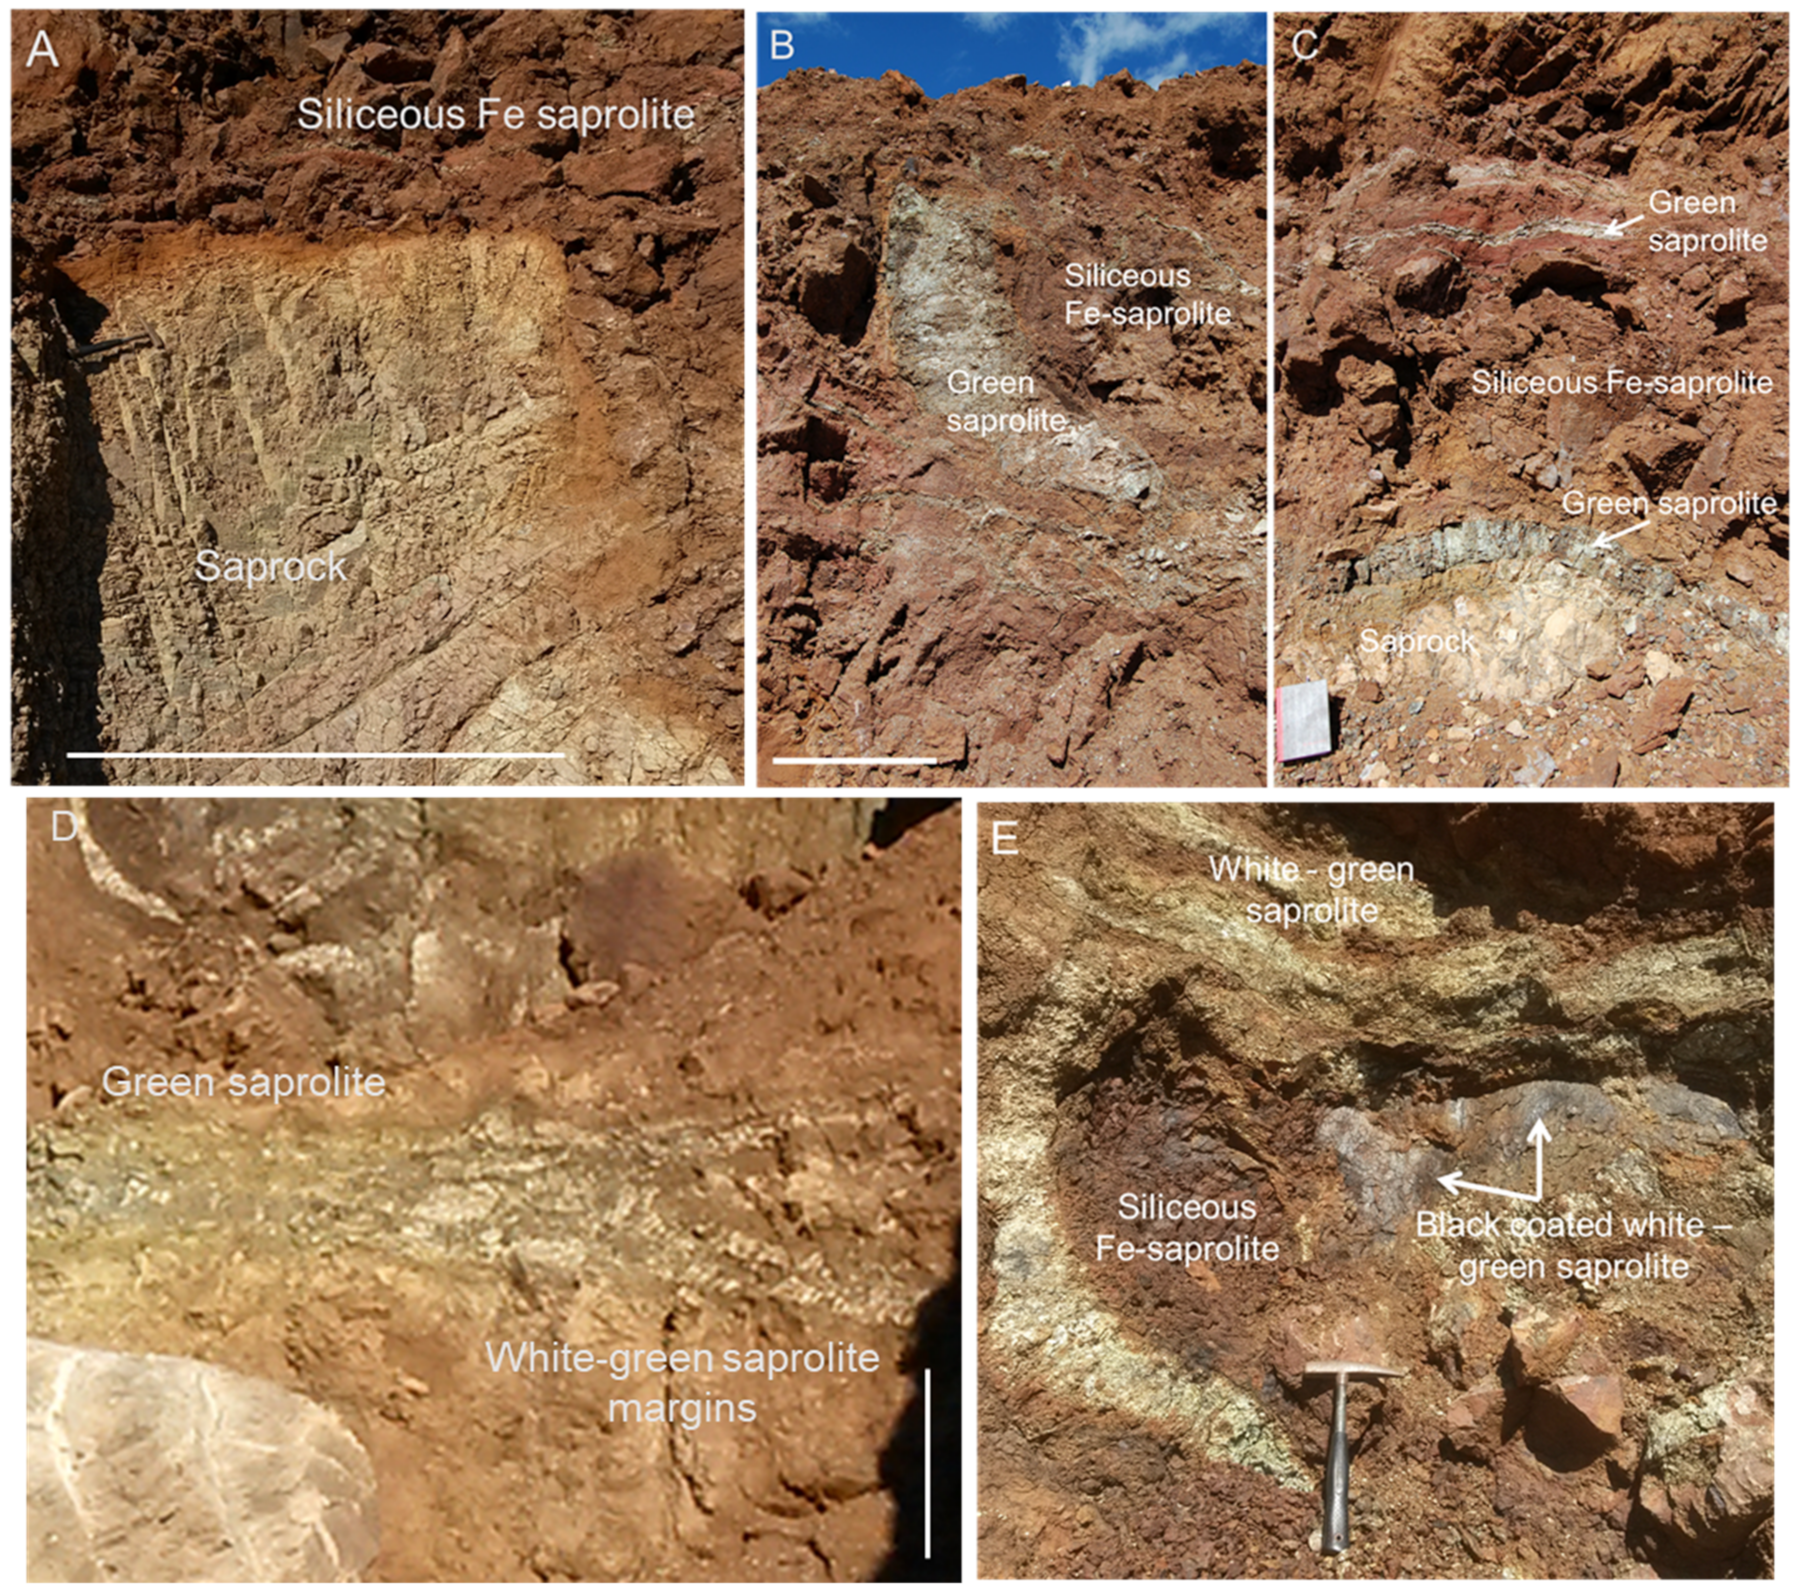
3. Profile Description and Sample Collection

The laterite profile at the Piauí deposit site was exposed in a small trial open pit excavated to remove 10,000 tonnes of ore for mineral test work, completed in early 2016 shortly before the authors visited the site. The maximum depth of the exposed profile was approximately 30 m. Figure 2 shows the profile of the Piauí laterite as viewed from within the test pit with the major lithological units indicated.
The profile as sampled is rather atypical if compared to the classic published schematic profiles [4]. At the base of the exposed profile is a yellow-white (occasionally yellow-green), coarse to medium grained, strongly leached blocky saprolite that preserves its source rock adcumulate texture and contains occasional clusters of magnetite/chromite. This unit is labelled saprock in Figure 2B and shown in more detail in Figure 3A. Overlying the saprock is an iron oxide rich silicified ferruginous saprolite that varies in colour from deep red-brown to orange-ochre and occasionally sandy yellow close to the highly irregular contact with the saprock (Figure 3A). The extent of the silicification is highly variable, present either as a siliceous stockwork (Figure 4C,D) or as an extensive boxwork (Figure 4A). The silicified ferruginous saprolite is volumetrically the most significant lithological unit exposed in the profile.
Within the silicified ferruginous saprolite several layers of green saprolite are developed varying in thickness from a few cm up to ~2 m. These green layers generally have white-green outer zones or margins, and, occasionally, white-green layers up to ~30 cm are present within the green saprolite where multiple layers merge (Figure 3D). The layers are generally horizontal in nature, but are occasionally steeply dipping (Figure 3B,C and Figure 4B). The interface of the white-green saprolite layers with the silicified ferruginous saprolite are often found in association with black staining or concentrations of black Mn-oxide rich saprolite (Figure 3E and Figure 4E–G). The green or white-green layers are generally friable though yield preserved igneous textures in places and, while the green parts of these layers contain disseminated magnetite/chromite and are weakly magnetic, the white-green layers contain ilmenite rather than magnetite and are therefore not magnetic. Rarely, elongate nodules or veinlets (10s of cm in length and 2–5 cm thick) of massive bright green serpentine or garnierite are present along the interface between these green or white-green saprolite layers and the silicified ferruginous saprolite.
Overlying the silicified ferruginous saprolite is a red-brown or orange-ochre coloured friable granular ferruginous saprolite dominated by iron oxides and clay minerals (e.g., Figure 2A). Within both the ferruginous saprolite and silicified ferruginous saprolites are magnesite and kaolinite veins, either horizontal or very steeply dipping, that vary in thickness from ~1 cm up to ~15 cm. At the very top of the profile an iron cap has developed at the surface, partly formed of magnetic iron oxides, often containing colluvium of residual and transported material. The serpentinised dunite protolith did not outcrop within the test pit.
In the test pit, two distinct sampling strategies were employed to sample the range of lithologies in the profile. Firstly, a suite of samples was collected from across the profile in order to define the variation of the major lithological units and also characterise specific features including veins, nodules, clasts and unusual textural components. It should be noted that the serpentinised dunite protolith was not sampled from within the test pit but from a locality exposing unweathered bedrock, approximately 1.5 km from the pit towards the processing plant.
Secondly, a depth profile of fresh samples was collected from the newly exposed laterite section for geomicrobiological investigation. These samples were collected from depths of 1 m to approximately 5 m below the April 2016 ground level. Samples were collected from the exposed rock face after removing approximately 15 cm of surface material with a clean stainless steel trowel sterilised with 70% ethanol. For microbial community profiling, a similarly sterilised hand auger was used to recover undisturbed sediment cores directly into sterilised plastic core liners, which were immediately sealed to minimise air ingress. Bulk samples were collected for mineralogical characterisation and microcosm experiments and placed into sterilised containers with ambient air head space. The 10 samples were stored in cool boxes and shipped back to the UK for analysis.
The Supplementary Materials contains a schematic of the Piauí test pit (Figure S1) and details the spatial distribution of the samples (Figures S1–S3).

4. Experimental Methods

4.1. Whole Rock Geochemistry

Thirty-nine samples were analysed for a suite of 53 elements by inductively coupled plasma-atomic emission spectroscopy (ICP-AES) and inductively coupled plasma atomic mass spectrometry (ICP-MS) at the OMAC Laboratories Ltd., Loughrea, Ireland. For the following suite of elements samples were prepared by lithium borate fusion and analysed by ICP-MS: Ba, Ce, Cr, Cs, Dy, Er, Eu, Ga, Gd, Hf, Ho, La, Lu, Nb, Nd, Pr, Rb, Sm, Sn, Sr, Ta, Tb, Th, Tm, U, V, W, Y, Yb and Zr. Samples were prepared by 4 acid digestion and analysed with ICP-AES for the remaining suite of elements: Ag, As, Cd, Co, Cu, Li, Mo, Ni, Pb, Sc, Tl, Zn and majors Si, Al, Fe, Ca, Mg, Na, K, Cr, Ti, Mn, P and Ba. For quality control purposes, a set of standards, blanks and sample duplicates were analysed as independent laboratory checks.

4.2. Bulk Mineralogy Using X-ray Diffraction

X-ray powder diffraction (XRD) patterns were collected with a Panalytical XPert Pro MPD diffractometer (PANalytical, Almelo, the Netherlands) equipped with an Xcelerator real-time strip with an active detector length of 2.122° and using either Cu Kα1 or Co Kα. Data were recorded in continuous mode over the 3–70 2Theta range with 0.017° steps, 175 s per step and a scan rate of 0.01° s−1. The total scan time was less than 2 h. Each sample was powdered first using a mortar and pestle and then processed further by wet milling using a Retsch XRD Mill McCrone to obtain a fine powder with narrow particle size distribution (down to 3 µm). The powders were than packed into aluminium sample wells using a back loading method with portions of loose powder pressed firmly to achieve good packing density and a random orientation. Mineral identification from the XRD patterns was performed using search-match routines with reference patterns from the ICDD database. The following reference patterns were used for mineral identification: goethite (#00-029-0713), hematite (#00-033-0664), maghemite (#00-039-1346), talc (#00-013-0558), quartz (#00-046-1045), chlorite (#00-029-701), kaolinite (#00-083-0971), lizardite (#00-050-1625), antigorite (#00-002-0095), ilmenite (#01-073-1255), nontronite (#00-29-1497), vermiculite (#01-76-0847).

4.3. Spatially Resolved Mineralogy Using Electron Microscopy

Electron microprobe analysis (EMPA) was performed using wavelength-dispersive spectrometry on a Cameca SX100 electron microprobe. Operating conditions were: 20 kV accelerating voltage, 20 nA current and a 1 µm spot size. Standards used were a combination of natural minerals for Na (jadeite), Mg (olivine), Al (corundum), Ca (wollastonite), Si (fayalite) and Ti (rutile); synthetic compounds for Ti and Mn (MnTiO3), P (ScPO4), K (KBr), Fe (FeO), Ni (NiO2) and pure metals (Co). All data were matrix-corrected using the Cameca version of the PAP PhiRhoZ programme after [29,30].
Quantitative X-ray microanalysis was performed using the Oxford Instruments INCA XMax Energy Dispersive Spectrometer (EDS, Oxford Instruments, Santa Barbara, CA, USA) on the Zeiss EVO 15LS scanning electron microscope (SEM, Zeiss, Oberkochen, Germany). Objective lens to specimen working distance was kept constant at 8.5 mm (fixed focus). The electron beam accelerating voltage was 20 kV, and electron beam current 3 nA. X-ray acquisition live-time was 20 s. Quant optimisation was performed on cobalt metal, typically every 3 h. Beam current was monitored regularly during the analysis session. Large area energy-dispersive X-ray (EDX) maps were collected on the polished block samples. Rectangular areas were selected over a sample and split into individual tiles using a minimum magnification of 250x per tile. Acquisition conditions for EDX smartmap on individual tiles were set as follows: dwell time of 100 µs, process time of 2, minimum 30 frames, overlap of 20 pixels. Large area EDX maps were then montaged from individual tiles using the Automate function in the Oxford Instruments INCA software.
FEI Quanta 650 FEG SEM (Thermo Fisher Scientific, Brno, Czech Republic) was used to collect smartmaps in samples where high spatial resolution was required. EDX maps were collected using the Bruker Nano XFlash® energy dispersive detector operating at 12 kV with a sample working distance fixed at approximately 25–26 mm. Maps were processed using ESPIRIT version 1.9 software. Pixel resolution for the maps collected varied from 50 nm to 0.4 µm depending on the area mapped and acquisition time for each map was at least 45 min.

4.4. Synchrotron Analysis

Micro-focus X-ray absorption spectroscopy (µXAS) measurements were carried out on the microfocus beamline I18 at Diamond Light Source Ltd. (DLS), Chilton, UK [31,32]. Data were collected in fluorescence mode with polished resin blocks mounted vertically in reflection geometry and the Si-drift fluorescence detector with XSPRESS3 read-out electronics set at 90° to the incident beam. X-ray energies were selected using a Si(111) double crystal monochromator. Tests for self-absorption from the samples were carried out by performing an XAS measurement at each edge with the sample set at varying degrees to the incident beam. No changes to the spectral structure were evident as a function of incident angle, suggesting that self-absorption effects, if present at all, were minimal. µXAS spectra were acquired with the sample at 45° using a beam focussed to either 3.4 µm vertically and 2.8 µm horizontally or 2.2 µm (vertically) and 2.2 µm (horizontally). X-ray absorption near edge structure (XANES) and X-ray absorption fine structure (XAFS) spectra were acquired at the Co K-edge (~7709 eV) and Ni K-edge (~8333 eV) to 12 Å−1. A minimum of 2 scans per point were collected and no beam related degradation of the sample was observed within the asbolane-lithiophorite minerals analysed.
XAS spectra were calibrated, background subtracted and normalised usi ng Athena [33], and Artemis [33] was used for XAFS analysis. Shell-by-shell fits of the XAFS spectra were developed with path lengths, Debye–Waller (σ2) factors, coordination number (CN) and the relative energy shift (δE) allowed to vary independently while the amplitude function (S02) remained fixed. Further shells were only added to the model if they were shown to significantly improve the fit.
Scanning transmission X-ray microscopy (STXM) and L-edge XANES measurements were performed at the I08 beamline at DLS, UK. Focused ion beam sections 100 nm thick were extracted from Mn oxy-hydroxide grains in sample F030. Spatially correlated energy dependent image stacks (~7 × 8 µm, 70 × 80 pixels) were acquired at the Co (770–810 eV), Mn (630–668 eV) and Fe (700–735 eV) L-edges with a nominal beam size of ~100 nm and a dwell time per pixel of 7 ms (Co, Mn) or 10 ms (Fe). For all measurements the energy step size was 0.1 eV over the main L3 and L2 edges. The MANTiS program [34] was used to align the image stacks, normalize to the background X-ray intensity (I0) and extract XANES spectra from any pixel or specific regions of interest (ROIs) in the image stacks.

4.5. Identification of Microorganisms in Field Samples

The composition and abundance of microbial communities in different laterite horizons were characterised by Illumina MiSeq amplicon sequencing and quantitative polymerase chain reaction (qPCR). Samples were selected to represent the range of lithologies present and different depths beneath the 2016 ground level. DNA was extracted from six sediment core or bulk samples using a PowerSoil kit (Qiagen); two samples yielded insufficient DNA, therefore, another extraction was performed using a FastDNA spin kit for soils (MP Biomedicals), which yielded sufficient DNA from one sample (Table S5, Supplementary Materials). To confirm the lithological unit classification and geochemistry of the microbiology samples, the chemical composition was analysed by X-ray fluorescence (XRF), mineralogy by XRD (Bruker D8 Advance), and total organic carbon (TOC) was measured using a Shimadzu SSM5000A. The pH was measured using a calibrated electrode 1 h after adding 1 g of laterite (wet weight) to 10 mL deionised water. Full details of the DNA amplification, primers, sequencing, and qPCR are provided in the Supporting Material. Briefly, DNA was sequenced using the Illumina MiSeq platform: for prokaryotes, the 16S rRNA gene was amplified using the primers 515F and 806R; for fungi, the ITS2 region was amplified using the primers ITS4F and 5.8SR. For qPCR, the primers 8F and 1492R were used to quantify prokaryotes and the primers EUKF and EUKR were used to quantify eukaryotes.
Microcosm experiments were performed on seven samples of different laterite horizons to investigate whether the microbial community present in different horizons could mobilise metals by stimulating the development of reducing conditions. Laterite sediment microcosms comprised 3 g laterite, 30 mL of sterile artificial groundwater and either 10 mM glucose or a mixture of 5 mM acetate and 5 mM lactate as a source of organic matter and as an electron donor [35]. The headspace was degassed with an 80:20 N2:CO2 mix and the bottles were incubated in the dark at 30 °C. The sediment microcosms were periodically monitored for geochemical changes by removing an aliquot of sediment slurry using a N2 degassed needle and syringe. The Ferrozine assay was used to measure Fe(II) and Fe(III); Fe(II) was assessed after digesting 0.1 mL of sediment slurry in 4.9 mL 0.5 N HCl for 1 h, and then total Fe after an additional 1 h digest in 0.5 N hydroxylamine-HCl [36,37]. Supernatant was separated from the sediment slurry by centrifugation (16,200× g, 5 min). Major anions and volatile fatty acids were measured by ion chromatography (Dionex ICS 5000), and pH and Eh by calibrated electrodes. To measure aqueous metal concentrations the supernatant was diluted into 2% nitric acid and analysed by ICP-AES.

5. Results

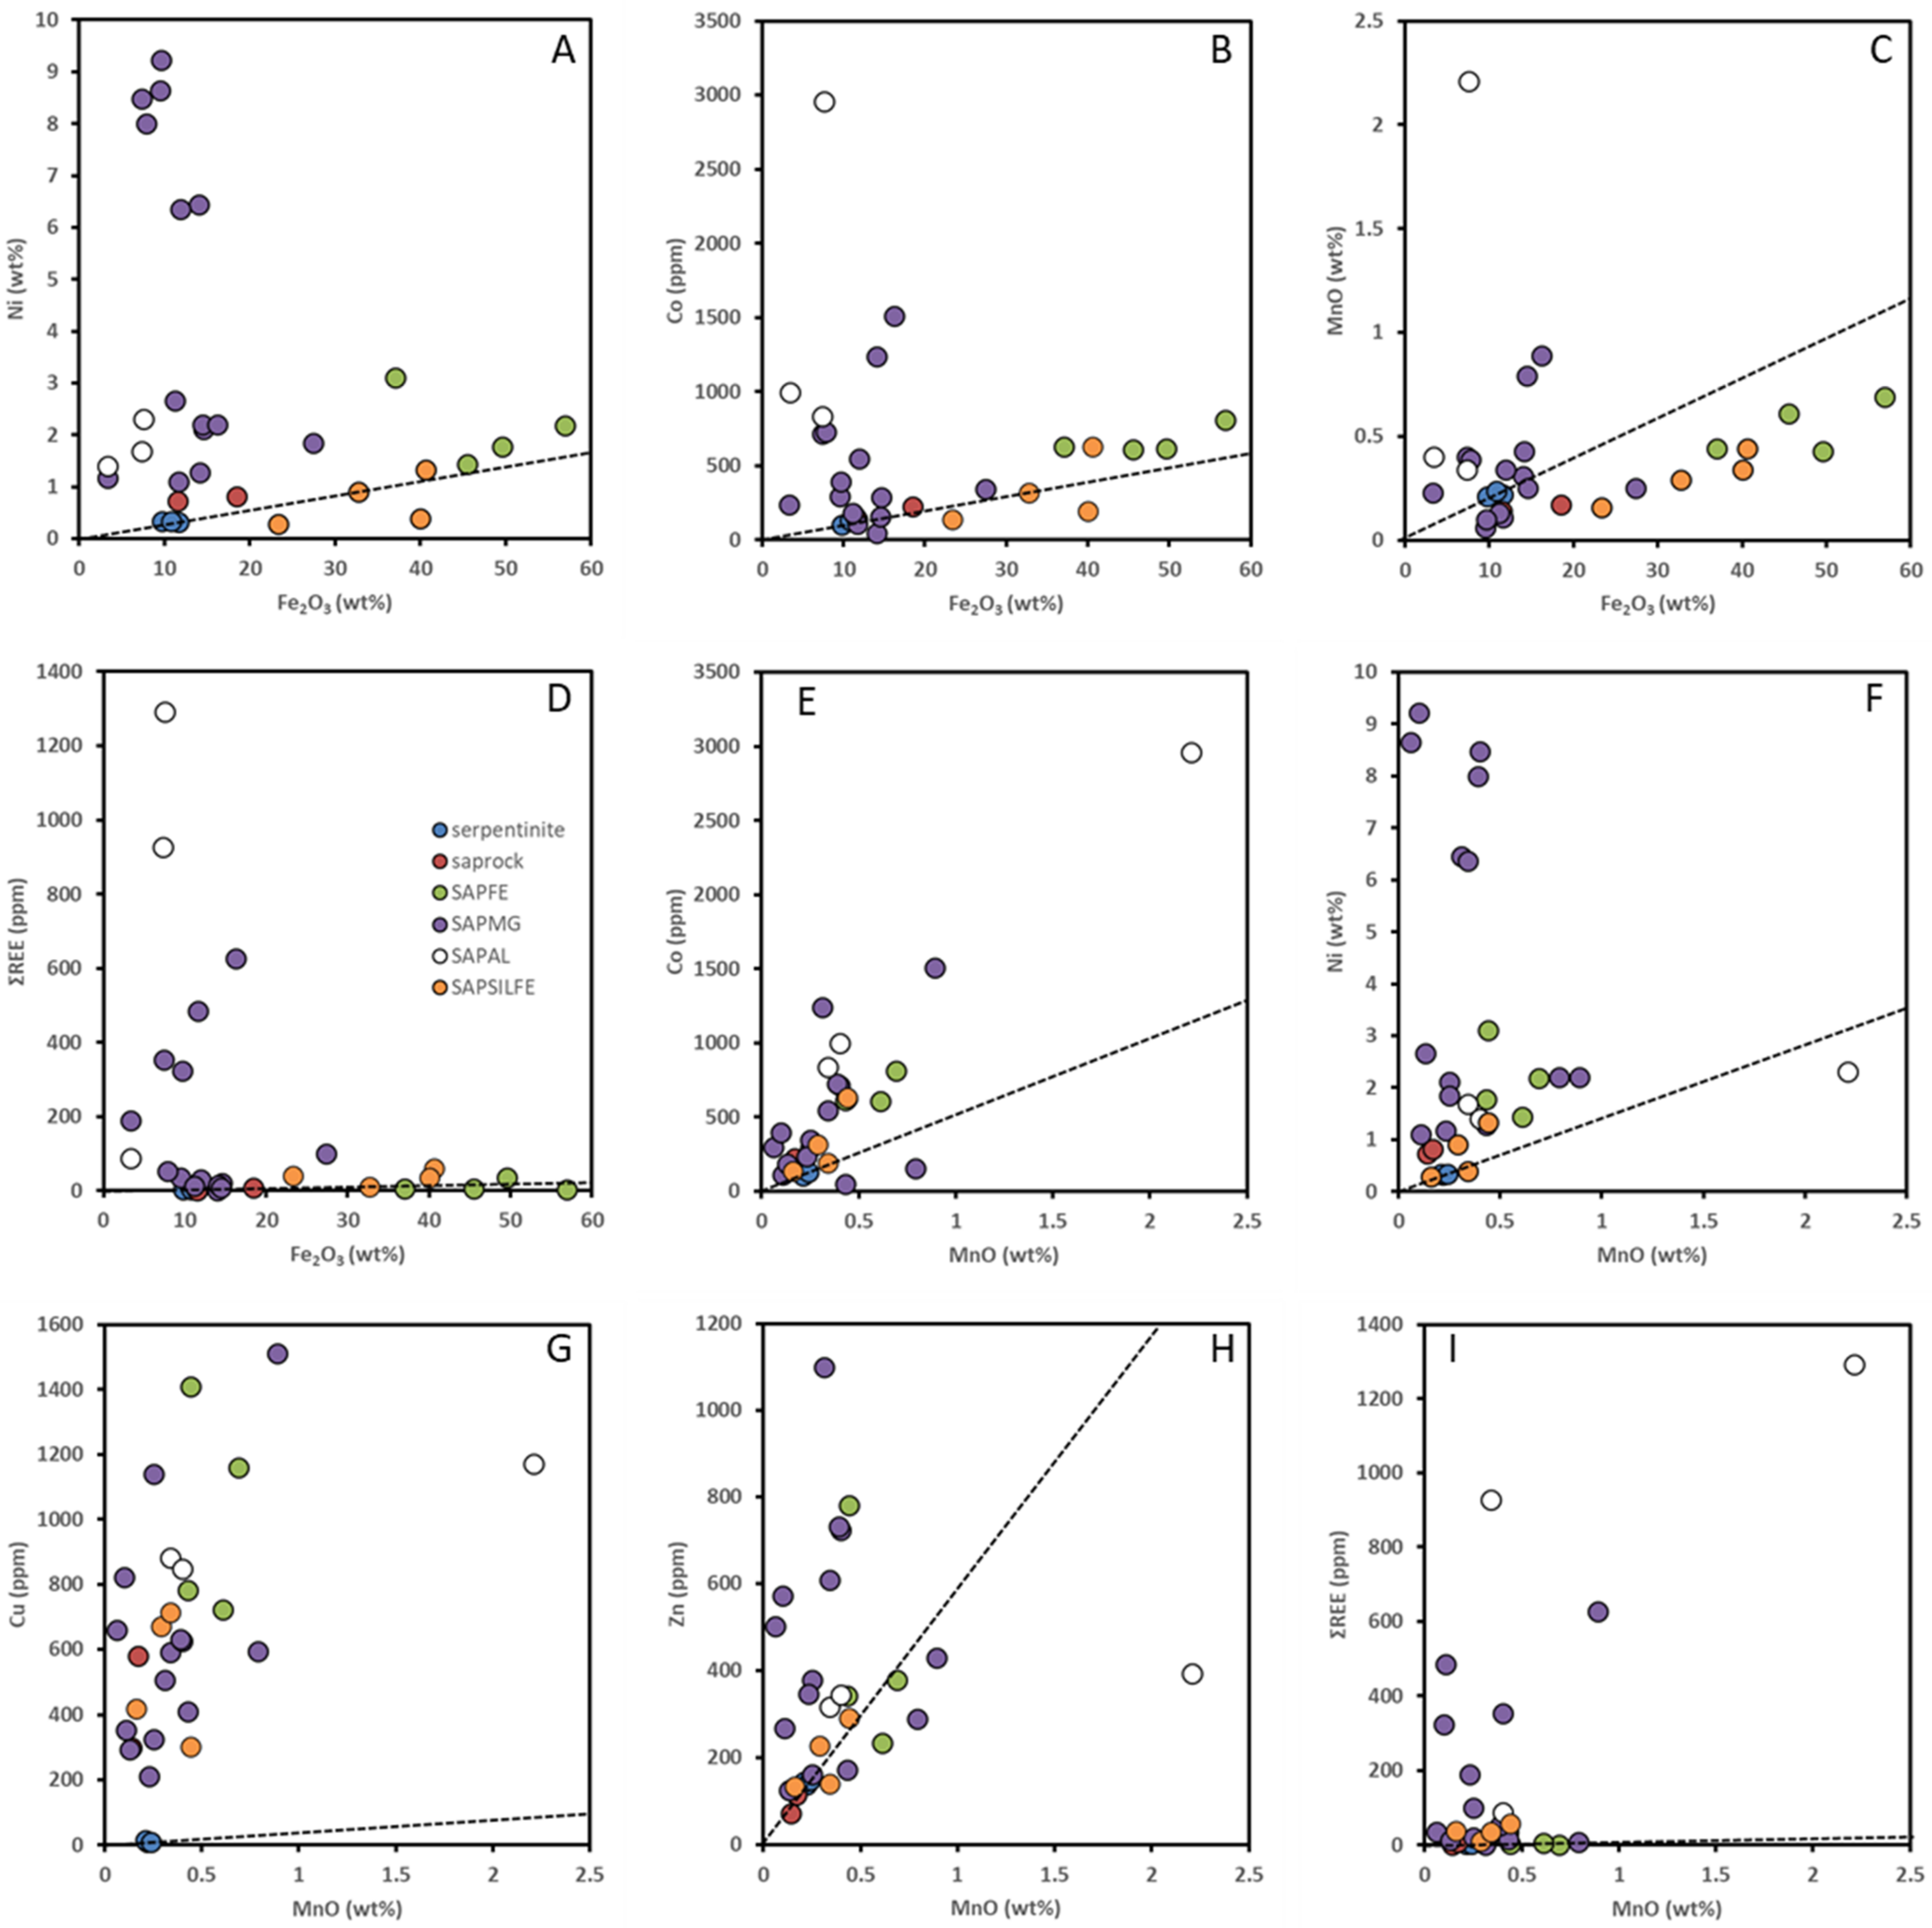
5.1. Whole Rock Geochemistry

The bulk chemistries of the samples (Table 1 and Table 2, with additional elements in Tables S1 and S2 of the Supplementary Materials, with some minor and trace elements presented in Figure 5) describe the geochemical variation across the whole profile. Combining these data with hand specimen and field observations (e.g., Figure 2, Figure 3 and Figure 4), and adapting the terminology adopted in the report of [28] and the previous work cited therein [38] we have subdivided the deposit into seven fundamental lithological units: Serpentinite, Saprock, SAPSILFE, SAPMG, SAPAL, SAPSFE and COB (Table 3).
The average bulk chemistries for these lithological units (Table 4) shows that across the whole deposit, the composition of the samples (excluding the silica nodules and Mn oxide rich sample) is dominated by SiO2 (average 36 wt%), with average concentrations for Fe2O3, MgO and Al2O3 of 19 wt%, 17 wt% and 8.6 wt%, respectively. The Co content varies widely from 47 ppm to 2960 ppm, with an average of 543 ppm, but is strongly enriched in the SAPAL unit. The Ni content is heterogeneous (0.28–9.2 wt%) with an average of 2.70 wt%.
The serpentinite is primarily MgO and SiO2 with about 10% Fe2O3. The saprock has depleted MgO and elevated Fe2O3 compared to the serpentinite though sample F017 is very similar geochemically to the serpentinite, with depleted Al2O3, MnO and Cr2O3 the only clear differences in terms of major elements. Sample F017 was from the base of the test pit and was potentially close to the serpentinite protolith (which was not actually exposed). The ferruginous saprolite SAPFE has the lowest SiO2 (20 wt%) and highest Fe2O3 (47 wt%) contents across the profile and its MgO content is depleted to the range 6.2–15 wt%. With respect to the green and white-green saprolitic lithologies, SAPMG has higher MgO and Fe2O3, and lower SiO2 and Al2O3 than SAPAL, with the MgO and Fe2O3 in the ranges 13–30 wt% and 3.3–16 wt% in SAPMG, and SAPAL containing 42–44 wt% and 22–28 wt% SiO2 and Al2O3, respectively. SAPMG and SAPAL have the highest levels of TiO2 from the whole profile. The silicified ferruginous saprolite SAPSILFE has the highest SiO2 values (average 46.8 wt%) of the lithological units, though this highly variable (29–64 wt%) with the Fe2O3 content lowest for SAPSILFE samples with the highest SiO2 and vice versa. Indeed, as the SiO2 content of the SAPSILFE decreases, the chemistry becomes increasingly similar to that of the ferruginous saprolite SAPFE. The Cr2O3 values are highest in the two ferruginous saprolites SAPFE (3.4 wt%) and SAPSILFE (2.2 wt%), compared to 1.7 wt% in the serpentinite protolith. The saprock, SAPMG and SAPAL are increasingly depleted in Cr2O3 with respect to the serpentinite protolith. TiO2 is significantly more concentrated in the green and white-green saprolites SAPMG (0.93 wt%) and SAPAL (0.55 wt%) than in any other unit (0.03–0.10 wt%).
Geochemical analysis enables the recognition of general trends (Figure 5) for the elements Mn, Ni and Co, and the trace elements Cu, Zn and rare earth elements (REE). The green and white-green saprolite lithologies SAPMG and SAPAL have the highest concentrations of Co and Mn and, aside from one SAPFE sample, also for Ni. Both Co and Ni within the serpentinite, saprock, SAPFE and SAPSILFE are linearly correlated with Fe2O3. (Figure 5A,B). Concentrations of Ni reach > 9 wt% in SAPMG and 1.4–2.3 wt% in SAPAL (Table 2, Figure 5A), and while there is some degree of correlation between the Ni and MnO contents across all lithologies (Figure 5F) the SAPMG samples with the highest Ni values (>~6 wt%) appear to have a fairly constant MnO concentration. Co is strongly enriched in the SAPAL samples and most of the SAPMG samples, but no distinct enrichment with respect to the serpentinite protolith is evident for the other lithological units (Table 1 and Table 2 and Figure 5B). Similarly, MnO is enriched in SAPAL and many of the SAPMG samples, but is depleted with respect to the serpentinite for the other lithologies (Table 1, Table 2 and Figure 5C). The Co and MnO are strongly correlated (Figure 5E) throughout the profile. REEs appear to be enriched in the SAPAL and about half of the SAPMG samples (Table 2, Figure 5D), with these REE enriched samples showing a possible correlation with MnO (Figure 5I).
Appreciable concentrations of Ni (0.5–3.1 wt%) are also found in a layer of green silica nodules from within the silicified ferruginous saprolite which had the lowest concentration of Co amongst all samples tested. The highest concentration of Co (4.4 wt%) was measured in the Mn oxide rich mineral aggregates associated with the SAPAL units which also contain high concentrations of Ni (3.55 wt%). The magnesite veins have very low concentrations of Ni and Co, while the kaolinite veins have 0.5 wt% Ni and >500 ppm Co as well as elevated levels of Cu (652 ppm).
Cu is enriched in all units of the profile with respect to the serpentinite protolith (Table 1 and Table 2), with concentrations consistently higher than generally reported for other Ni-Co laterite deposits e.g., [6,8,9,15]. Considering the saprock, SAPFE and SAPSILFE units, the concentration of Cu is correlated to some degree with that of Fe2O3 and MnO (Figure 5G). Zn is enriched in the SAPMG and SAPAL units compared to concentrations in the serpentinite, saprock, SAPFE and SAPSILFE units (Figure 5H). The concentrations of Zn in the green and white-green saprolite units are generally within the upper bounds of the range reported by [8] and [15], though are consistently higher than reported elsewhere e.g., [9,39]. Sc concentrations range up to 60 ppm, and, while slightly low, are within the range presented for most other laterite deposits e.g., [6,8,9,15,39,40], though well below those reported for the Syerston–Flemington deposit [41].
Chondrite normalised REE concentrations averaged across each profile unit are shown in Figure 6 (sample specific REE plots are given in Figure S4 of the Supplementary Materials). SAPMG and SAPAL show a negative slope across the sequence with SAPMG showing a distinct negative Ce anomaly. The serpentinite protolith has a generally flat trend, while the saprock displays a negative slope from La to Tb followed by a flat trend from Tb to Lu. The silicified ferruginous saprolite SAPSILFE shows a negative sloping trend while the SAPFE unit displays a negative slope from La to Er and a positive slope from Er to Lu.

5.2. Bulk Mineralogy

XRD analyses reveal the differences in bulk mineralogy between the lithological units within the profile (Figure 7). The serpentinite is dominated by lizardite with traces of chlorite, chrysotile, chromite and hematite evident in the XRD patterns. The overlying saprock also contains significant serpentine minerals, predominantly lizardite, but in association with chlorite minerals, Fe-oxides (hematite, maghemite and goethite), with traces of chromite and magnetite subsequently confirmed from SEM analyses.
The ferruginous saprolite SAPFE is dominated by Fe-oxides, with goethite generally the most abundant, but occasionally hematite was the primary Fe-oxide mineral. Traces of serpentine minerals remain in this unit, however there is a far more diverse suite of layered silicates in SAPFE than for the serpentinite and saprock with chlorite, vermiculite, saponite and nontronite all observed by XRD. Quartz was identified in about half of the SAPFE samples. The silicified ferruginous saprolite SAPSILFE is dominated by goethite, hematite, maghemite, quartz and hydrated silica, with traces of nontronite, chlorite and saponite commonly observed. The relative variation of the different Fe-oxide minerals within and between the two ferruginous units (SAPFE and SAPSILFE) can be seen in Figure S5 (Supplementary Materials), associated with the bulk Ni content, highlighting that the samples with the highest concentrations of Ni are all mineralogically dominated by chlorite. XRD of the green silica nodules reveals that appreciable levels of talc are present within the predominantly quartz samples
The green saprolitic SAPMG units are dominated by chlorite with traces of other layered silicates lizardite, vermiculite and saponite, along with quartz being commonly observed. Ilmenite is also frequently observed in SAPMG, with the presence of magnetite and chromite confirmed as trace minerals using SEM analyses. The XRD patterns of the SAPMG samples with the highest concentrations of Ni show very little mineralogical variation, being dominated by chlorite (Figure S5), with vermiculite occasionally observed. The white-green saprolite SAPAL, on the other hand, is dominated by kaolinite with vermiculite and saponite, and only traces of chlorite and occasional quartz are observed.

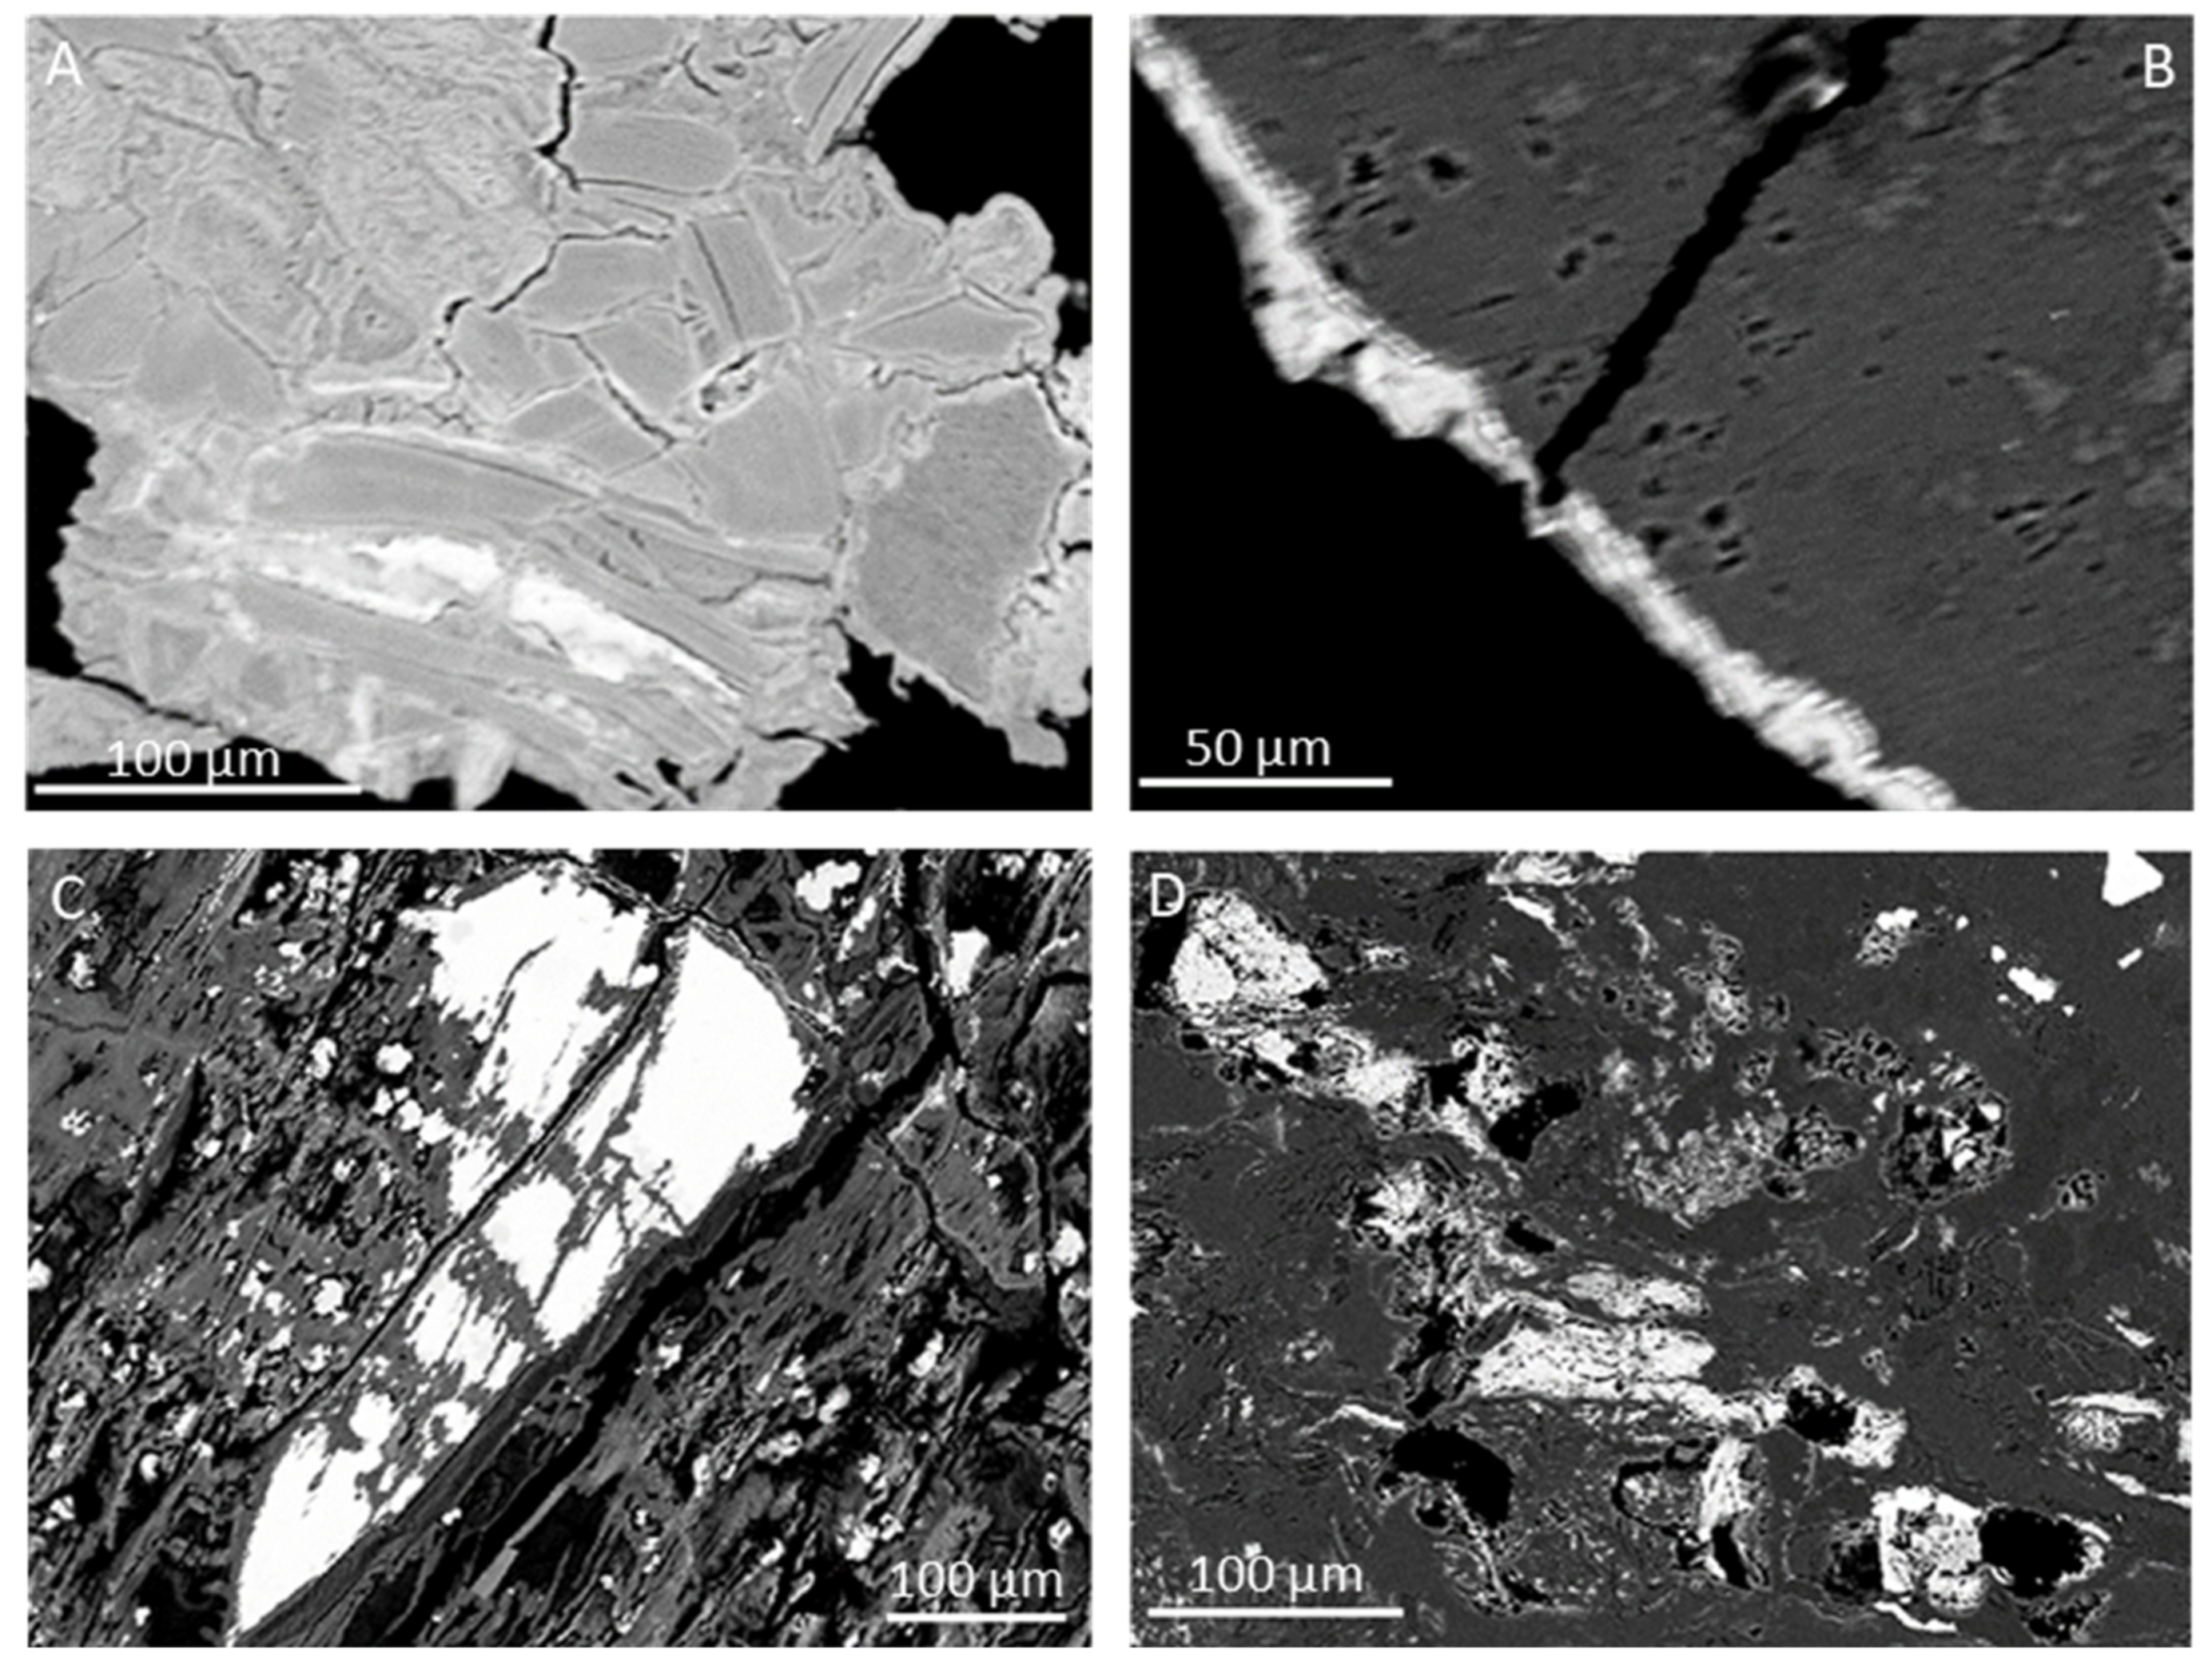
5.3. Petrography and Mineral Chemistry of the Laterite Profile

5.3.1. The Serpentinite Protolith

The serpentinite protolith is a highly serpentinised dunite consisting predominately of serpentine and opaque minerals (Figure 8A,B). It is characterised by the strong or complete pseudomorph replacement of primary olivine into serpentine minerals, primarily lizardite, along with fibrous chrysotile in the form of thick mm-sized veins (Figure 8C), which gives the rock a mesh-like texture on both macro- and micro-scales, and chlorite is also occasionally observed. These are type-I serpentines e.g., [43]. The prevalence of lizardite in the serpentinite samples, as suggested by our characterisation, further from the saprock boundary may suggest that the serpentinisation occurred below 300–320 °C e.g., [44]. The alteration of serpentine into serpentine-II is evident along trans-granular cracks and fractures, but also takes place as a coating along grain edges. Our characterisation suggests that lizardite is the dominant component of serpentine-II. Secondary magnetite has precipitated in fissures and the proportion of magnetite increases with increased weathering of the serpentinite. Secondary Fe-oxides are also seen to have precipitated between serpentine grains, most significantly within chrysotile veins, and silica is observed in samples considered to be close to the serpentinite–saprock boundary, where magnetite is altering to hematite (Figure 8B). The fibrous chrysotile veins are sheared in places and talc-magnesite alteration of serpentine-I minerals is retained locally within some veins (Figure 8C,D). With increased weathering, the birefringence of the chrysotile increases, possibly correlating with an increased Ni content and suggesting that some chrysotile is second generation serpentine-II type.
While XRD shows lizardite to be the most abundant phase with traces of hematite, chlorite and chrysotile, SEM-EDX also identifies magnetite, chromite and Mn oxy-hydroxides. EPMA analyses show that Ni is most abundant in the magnetite and Mn oxy-hydroxides, and present at <0.5 wt% levels in chromite, serpentine and hematite (Table 5). The hematite additionally contains almost 1 wt% Cr2O3 (Table 5). Co was detected in Mn oxy-hydroxides, magnetite and chromite (Table 5). Mn oxy-hydroxides generally show higher concentrations of Co than Ni (Table 5).
SEM imaging of the serpentinite revealed the presence of small (<2 µm in diameter) faceted particles of roughly spherical morphology (Figure 9) similar (though smaller) to those described by [15]. EPMA revealed them to be Fe-rich with unusually high Co and Ni concentrations, though their small particle size precluded precise measurement of their chemistry. Based on their different morphology to other Fe oxides in the serpentinite samples, elemental composition (in particular an unusual enrichment in Co, no detectable Al and Cr) these particles were tentatively identified as magnetite and subsequently confirmed via STXM Fe L-edge XAS spectra. Highly altered chromites are identified within the serpentinite that show evidence of former martitisation and extensive weathering (Figure 9C). These chromites are similar to the ferritchromites described by [45] within the Nkamouna serpentinite, southeast Cameroon, and also display overgrowths of highly Ni enriched Fe-oxides on the grain rims (Figure 9D).

5.3.2. Co and Ni Mineralogy and Chemistry of the Saprolite Units

Cobalt concentrations vary widely across the Piauí profile, with the lowest concentration observed in a sample of SAPMG (47 ppm) and the highest concentration in a sample SAPAL (2960 ppm), although 4.36 wt% Co was detected in a sample of Mn oxy-hydroxide (F050, Table 1). While Co is clearly enriched in the majority of the green SAPMG and white-green SAPAL saprolitic layers (Figure 5), the clearest correlations observed from bulk chemical analyses across the profile (Table 1 and Table 2) were between Co and Mn with r = 0.86 (Figure 5) and between Co and Ni for all units excluding SAPMG and SAPAL (r = 0.87). This is supported by SEM-EDX analysis which revealed that Co is predominantly associated with Mn oxy-hydroxides and its distribution within the samples is much more discrete compared to that of Ni. A range of minerals are identified as Co hosts in the Piauí profile (Table 6).
The highest average concentrations of Co are associated with Mn oxy-hydroxides, thus reflecting the significant Co-Mn correlation. Four different textures and morphologies of Mn oxy-hydroxide grains frequently occur in the Piauí samples, including: aggregates of plates/layers (5–10 µm thick) with highly zoned and chemically complex grains (>~25 µm), thin (~10 µm thick) coatings on grain surfaces or in intragranular spaces, and highly fractured and veined grains > 100 µm in size (Figure 10A–C respectively). The fourth morphological type is occasionally observed within the ferruginous saprolites and potentially reflects a grain size reduction and slight deformation of pre-existing Mn-oxyhydroxide grains. Mn-oxyhydroxides infill spaces within the ferruginous saprolitic fabric, producing very small grains and mineral coatings (Figure 10D).
The Mn oxy-hydroxide phases vary chemically as a function of their host profile unit as highlighted by a Co-Ni-Al diagram (Figure 11A). Based on the Al content, these phases can be classified as asbolane and asbolane-lithiophorite intermediates e.g., [3,46,47]. Barium was also detected in some grains and an inverse relationship was observed between the Ba content and Co enrichment (Figure 11B). The presence of Ba indicates a transition of Mn oxy-hydroxides from the phyllomanganate lithiophorite/asbolane type to the hollandite group mineral romanechite. It is possible that there are multiple types of romanechite within the Piauí deposit, similar, to some degree, to the two generations described for the Wingellina laterite by [46]. The romanechites at Piauí were most commonly observed in SAPAL with romanechite-I having higher Ba contents (>2 wt% Ba) but reduced Co and Ni (average 1.82 wt% and 6.24 wt%, respectively), while romanechite-II had reduced Ba content (<2 wt% Ba) with enrichment of Co and Ni (average 4.69 wt% and 12.15 wt%, respectively).
The highest concentration of Co from any of the bulk samples was found in F050 (4.36 wt%), an aggregate of black mineral grains and coatings both within and directly adjacent to a white-green SAPAL saprolitic layer (Figure 4F). SEM-EDX imaging and Fourier transform infrared (FTIR) spectra (Figure S6, Supplementary Materials) indicated the presence of only one type of Ba-bearing Mn oxy-hydroxide, with the chemical composition most closely matching romanechite, with concentrations of 12.5 wt% Ba, 48.0 wt% Mn, 1.8 wt% Fe, 3.0 wt% Co, 0.63 wt% Ni and 0.97 wt% Cu. Cobalt concentrations varied considerably from 1.5 to 10.4 wt% between all the grains probed. In contrast to other Mn oxy-hydroxides in the Piauí samples, identified as asbolane and asbolane-lithiophorite intermediates, this romanechite phase had Co concentrations significantly higher than Ni. Moreover, this romanechite contradicts the inverse relationship between Ba and Co observed in all other romanechite type Mn oxy-hydroxides of the Piauí deposit (e.g., Figure 11B). This suggests a third type or generation of romanechite at Piauí, with romanechite-III being relatively enriched in Ba and Co (12.5 wt% and 3.0 wt% respectively) and relatively depleted in Ni (0.63 wt%) and appearing in concentrated locations at the interface between the ferruginous saprolitic units and the white-green SAPAL saprolite layers.
In this study we employed a detection limit of 0.03 wt% for Co in our EMPA analyses of goethite in order to reliably account for the impact of the Fe induced background and provide consistency across this study and associated work e.g., [48,49]. Cobalt was detected in goethite only when Mn was also present in the goethite, with the Mn either substituted into the goethite at the atomic level or possibly present as nanoscale cobaltiferous Mn oxy-hydroxide inclusions. Over half of the goethite analyses showed no Co present, and, as such, there are two types of goethite in the Piauí deposit, Co-free and Co bearing manganoan goethite (Table 6). Although Co was only present in manganoan goethite, there is a distinct correlation between Co and Ni within the goethite (Figure 12), with correlation values of 0.65 between Co and Ni compared to 0.56 between Co and Mn.
Chlorite, which is an important mineral host for Ni at Piauí, also contained small quantities of Co with an average Co concentration of 0.05 wt%, however ranging widely with a maximum concentration of 0.45 wt% (Table 6). There is a positive relationship between the Co and Ni content in the chlorite, with the grains most enriched in Ni also having the highest Co concentration.
The highest concentrations of Co in the chlorite phase were identified in SAPMG, particularly sample F002, which also had a high bulk Co concentration of 1240 ppm (Table 2). SEM-EDX mapping of this sample indicated that the primary hosts for Co were chlorite and Mn-rich ilmenite with no Mn oxy-hydroxides identified. It is of course possible that Mn oxy-hydroxides could be present as very small heterogeneously distributed grains not detected or not present in the small subsample analysed, and Mn oxy-hydroxides were detected in other Piauí samples with similar bulk Mn concentration to F002. High resolution imaging and mapping of the chlorites in sample F002 revealed distinct Ni enriched silicate inclusions within the chlorite fabric, that have an elongate laminate morphology up to ~60 µm long and <10 µm thick, that have levels of Co far higher than in the surrounding chlorite (Figure 13). Co concentrations in these inclusions range from 0.10 wt% to 0.45 wt% with an average of 0.24 wt%, consistently higher than the Co levels in the host chlorite matrix (Figure 13). Average chemical analyses of these Co-bearing Ni-silicate inclusions have compositions 19.95 wt% Ni, 4.95 wt% Mg, 3.10 wt% Al, 16.63 wt% Si and 5.92 wt% Fe, consistent with a cobalt enriched nimite.
Of all the saprolitic units, sample F033 from the white-green SAPAL lithology has the highest concentrations of Co (2960 ppm, Table 2, Figure 3E). The bulk mineralogy from XRD comprises two crystalline phases, chlorite and vermiculite, and despite containing over 2 wt% MnO, no specific Mn oxy-hydroxide minerals were identified in the XRD pattern. SEM-EDX imaging, however, revealed the presence of dispersed Mn oxy-hydroxides primarily as grain boundary coatings and as void infillings, and EMPA analysis showed that these Mn oxy-hydroxides had high concentrations of Co between 0.64 and 4.53 wt% and Ni between 2.50 and 18.8 wt%, whereas the chlorite within the sample contained 0.94 wt% Ni and no detectable Co. While the majority of the Mn oxy-hydroxides in this SAPAL sample are asbolane-lithiophorite intermediates, there are also areas of elevated Ba where the EMPA analyses reveal the presence of a romanechite-type phase similar to that described for F050 (also within or adjacent to SAPAL).
Although there are limited chemical correlations with Ni across the profile (for Ni:Mn and Ni:Fe in all units excluding SAPMG and SAPAL r = 0.71 and 0.68, respectively), XRD and bulk chemistry showed that the bulk Ni contents of the five saprolitic lithologies is ultimately linked to their mineralogy. The samples with the highest Ni concentrations in SAPMG are dominated by the presence of chlorite and other layered silicates, while goethite, which dominates SAPFE and SAPSILFE, consistently shows significant Ni incorporation, albeit at lower levels compared to chlorites. SEM-EDX element maps reveal the ubiquitous presence of Ni associated with chlorite, whereas Mn and Ti are present in discrete mineral phases either as inclusions within the chlorite or filling in pores and cracks. Ni was detected by SEM-EDX and/or EMPA in 11 different minerals (Table 7), whereby a relationship between Ni and Mg within the silicate phases becomes evident (Figure 14). While the pimelite and nickeliferous talc (found exclusively within the green silica nodules, see below) has fairly well-defined Ni concentrations, there is a huge variation in the Ni abundance in chlorites from the SAPMG lithology. Nickeliferous chlorite is also reported in the Vermelho deposit of the Pará region of Brazil with 2–3 wt% NiO recorded in the chlorite of the silicate zone and up to 12 wt% NiO in chlorites from the oxidised zone [50]. By contrast, smectites In the clay bearing saprolites from Barro Alto (Goiás State, Brazil) only contain up to 3.3 wt% Ni [51]. Two distinct groupings of serpentine can be observed at Piauí (Figure 10), highlighting the persistence of low Ni serpentine-I (Table 5) in the serpentinite and the second-generation serpentine-II with elevated Ni contents e.g., [15,43] found mostly in SAPMG and the saprock, but also in the serpentinite.
The goethite within the saprolite units incorporated a range of trace elements detectable by EMPA (following the criteria of [52]) including Co, Ni, Mn, Al, Si and Mg with the maximum wt% element measured being 0.65, 0.90, 5.87, 3.05, 4.65 and 2.25 wt%, respectively. The highest total trace element substitution in goethite totalled 12.15 wt%. The Al, Si and Mg all increase linearly in concentration as Fe decreases while Co, Ni and Mn contents seem to be unrelated to Fe content. As reported above, there is a distinct correlation between Ni and Co in the goethite, but no clear relationship between Ni and Mn (Figure 12).

5.3.3. Ni mineralogy and Chemistry of the Green Silica Nodules

Within the SAPSILFE lithology close to the boundary with the saprock, three horizontal layers of green silica plates and nodules were observed. Bulk chemical analyses of these nodules (Table 1 and Table 4) show that they contain up to 3.14 wt% Ni as well as up to 5.29 wt% MgO and 3.48 wt% Fe2O3. XRD analyses identified the presence of talc minerals along with quartz. SEM-EDX and EMPA analyses showed the presence of two distinct talc chemistries and associated textures (Figure 15), and that the Ni was entirely partitioned into these talc minerals.
Nickeloan talc was observed as very porous massive clusters (Figure 15A) and microcrystalline inclusions within the quartz matrix, and pimelite occurs as pockets of very porous material embedded within the quartz matrix (Figure 15B). The average Ni content in the nickeloan talc was 13.5 wt% with small variations observed (Table 7, Figure 14). Other elements detected in this phase included Al, Fe, Ca, Cu (all below 1 wt%) and very small quantities of Co, mostly at the detection limit of the electron microprobe (0.03 wt%). Average composition of the pimeleite phase was 28.9 wt% NiO, 9.5 wt% MgO and 45 wt% SiO2, while cobalt was not detected in this phase.

5.4. Cobalt and Nickel Speciation in Asbolane-Lithiophorite Intermediates

Microfocus XAS experiments were performed on asbolane-lithiophorite intermediates from the SAPAL sample F033. This sample contains the highest abundance of Co (2960 ppm) and Mn (1.71 wt%) of any of the rock samples, it was collected from a region of the SAPAL unit containing black coatings (Figure 3E), and SEM and EMPA analysis showed asbolane-lithiophorite intermediates mostly as grain boundary coatings and as void infillings.
Co K-edge XANES spectra, extracted EXAFS and their Fourier transforms (FT) are presented in Figure 16. There is an energy shift of ~5 eV for the absorption edge and white line intensity positions in the XANES spectra of Co2+ bearing erythrite (Co3(AsO4)2.8H2O) compared to those of Co3+ bearing heterogenite (CoOOH) (Figure 16A). As reported by [53] we also found that the XANES spectrum for Co in Co-doped synthetic goethite had an absorption edge and white line position very similar to that of the Co2+ standard (see Figure 16A), indicating that any Co within goethite in the Piauí samples may be present as Co2+.
While the Co XANES spectra of the asbolane-lithiophorite intermediates within F033 all appear broadly similar to each other with a general shape similar to that of Co3+ substituted phyllomanganates e.g., [35,53], there is a clear shoulder to the absorption edge at ~7725 eV, equivalent to the white line position of the Co2+ standard. This low energy shoulder is slightly more pronounced in the XANES spectra for grains 1 and 2 compared to those of the grains 3 and 4. Moreover, there is a shift to lower energy in the position of the XANES white line for grains 1 and 2 compared to those of grains 3 and 4. The XANES spectra suggested that some Co2+ may be present in these asbolane-lithiophorite intermediates with a Co2+/Co3+ ratio higher in grains 1 and 2 compared to grains 3 and 4.
The EXAFS spectra for grains 1 and 2 are similar to each other, as are the spectra for grains 3 and 4 (Figure 16B). The principal difference between the spectra of grains 1 and 2 compared to those of grains 3 and 4 is in the region 4.8–6 Å−1 where the spectra of grains 1 and 2 show a small feature at ~5.7 Å−1 on top of the rising slope of the asymmetric maximum at ~6.8 Å−1, whereas the spectra for grains 3 and 4 show a distinct feature at ~5.6 Å−1, separated from the more symmetrical maximum at ~6.8 Å−1. Additionally, the intensity of the feature at ~6.75 Å−1 is greater for the spectra of grains 3 and 4 than it is for grains 1 and 2. The first peak in the FT of the EXAFS spectrum of grain 1 (Figure 16C) has a clear shoulder on the high R side, whereas this is marked by a single peak for the FTs of the EXAFS spectra for the other three grains. Detailed results of the EXAFS modelling are provided in Table S3 of the Supplementary Materials.
The best fit model for the spectrum of grain 3 is with a two shell model, such that there is an oxygen shell at a distance of 1.91 (2) Å consistent with Co3+ in octahedral coordination [53,54,55,56] and a cationic shell with Co-(Co,Mn) interatomic distances of 2.83 (2) Å, typical for Mn-Mn edge sharing octahedra [54,55,56]. These distances are consistent with Co3+ substituting for Mn in the Mn layer of the asbolane-lithiophorite intermediates e.g., [56]. The best fit model for the spectra of grains 2 and 4 are similar, though they required a three shell model, with a Co-O distance of 1.96 (1) Å and 1.92 (2) Å, respectively, a second shell Co-(Co,Mn) distance of 2.80 (1) Å and 2.85 (2) Å, respectively, and a 2nd cationic shell (of a smaller intensity than the first cationic shell) with a Co-(Co,Mn) distance of 3.46 (4) Å and 3.53 (6) Å, respectively, which is typical for Mn-Mn corner sharing octahedra [56,57].
The spectrum of grain 1 however did not fit well to a 2 or 3 shell model as determined for grains 2–4, with Co-O first shell fitting particularly poorly. Instead, it became evident that a second Co species with a longer Co-O distance was required, and, as such, the best fit model for this spectrum requires two specific clusters. The first cluster represents Co3+ substituting for Mn in the Mn layer of asbolane-lithiophorite intermediates with a Co-O distance of 1.90 (5) Å, a Co-(Co,Mn) distance of 2.83 (3) Å and a Co-(Co,Mn) distance of 3.54 (9) Å. The second cluster comprises a single shell with a Co-O distance of 2.09 (7) Å, indicative of octahedral Co2+ [56], and the fit to the data is optimum with this cluster being present at the 40% level. This mixed Co3+ and Co2+ model also fits well to the additional shoulder apparent on the first peak of the FT for grain 1.
A third shell Co-(Co,Mn) distance of ~3.5 Å is indicative of both Co3+, substituting for Mn in the Mn layer of the asbolane-lithiophorite intermediate, but also of octahedral Co2+ within the interlayer [56]. This shell is required for fitting the spectrum of grains 1 and 2, not required for fitting the spectrum of grain 3 and marginally improved the fit for grain 4. The spectra of both grains 3 and 4 are well modelled by a single Co3+ species. However, the presence of this third shell is essential for the fit of the spectrum of grain 2 and, together with the lengthened Co-O distance in the model for the spectrum of grain 2, strongly suggests that a significant proportion of the Co in grain 2 is present as Co2+, potentially up to 30% based upon the Co-O distance alone. While the two-cluster model does fit the spectrum of grain 2 well, it does not show a significant improvement to the fit compared to the single cluster 3 shell model. Nevertheless, supporting the qualitative assessment of the XANES, there is strong evidence from the EXAFS analysis that Co2+ is present at significant levels within the interlayer in some of these asbolane-lithiophorite intermediates.
To try and further confirm the presence of Co2+ within the asbolane-lithiophorite intermediates, as suggested by the Co K-edge XANES and EXAFS analyses, we performed a STXM study to extract L-edge XANES spectra for Co, Ni and Mn from asbolane-lithiophorite intermediate grains in sample F033. L-edge XANES spectra are excellent fingerprints for transition metal oxidation states in minerals, e.g., [58,59,60,61], and have been used recently to characterise Ni and Co in laterite materials e.g., [35,62]. The application of STXM for extracting L-edge XANES spectra provides a spatial context for the spectra.
The Co L2,3 XANES spectra are presented in Figure 17 with the points from which they were extracted shown in the STXM images. The L3-edge spectrum for octahedrally coordinated Co3+ in heterogenite is dominated by a strong absorption peak at 783.6 eV with smaller shoulders on the low (781.6 eV) and high (785.9 eV) energy sides (Figure 17). The L3-edge spectrum for octahedral Co2+ in erythrite has a much broader main feature with more spectral detail than for Co3+ that is centred around 781.8 eV. Six spectra (A-F) extracted from the STXM energy stack for a F033 asbolane-lithiophorite intermediate are shown in Figure 17. Spectra A, B and C are very similar to that of heterogenite, indicating that the Co is trivalent and octahedrally coordinated. Spectra D, E and F, however, show a progressively increasing intensity around 781.8 eV and a distinct change in the shape of the absorption peak at 783.6 eV. This is strongly indicative of the presence of Co2+. Also shown in Figure 17 are oxidation state images for Co3+ and Co2+ extracted from the STXM energy stacks, demonstrating that the Co2+ is located in a distinct area within the asbolane-lithiophorite grain. L-edge XANES analysis for Mn and Fe show no variation across the sample indicating that the nature of the asbolane-lithiophorite intermediate does not change and there are no goethite inclusions associated with these changes in Co oxidation state (within the 100 nm resolution of the experiment).
The Ni K-edge XANES spectra (Figure 18A) of the same grains described above are very similar, with a sharp white line and a broad two-component feature at ~8400 eV, as described for a Ni species developing a Ni(OH)2 ‘brucite-like’ layer [47]. The EXAFS spectra (Figure 18B) and their associated FTs (Figure 18C) are similar for each grain, with some variation evident within the EXAFS in the range 7–9 Å−1, and are similar to those presented by [47] and [63]. All these spectra are well fitted to a 2 shell model (Table S4, Supplementary Materials) with a Ni-O interatomic distance of 2.03–2.06 (1) Å and a Ni-Ni distance of 2.97–3.08 (3) Å, indicative of Ni as Ni(OH)2. e.g., [47,55,63]. Although we found no evidence for Ni-Al distances, as observed by [47] in their Co-poor sample, it is likely that these Ni(OH)2 ‘brucite-like’ layers are associated with the Al(OH)3 layers in these asbolane-lithiophorite intermediates.

5.5. Composition and Diversity of the Microbial Community Present across the Piauí Laterite

DNA was extracted from laterite sediment and sequenced to investigate the composition and diversity of the microbial community and to look for the presence of potential metal cycling microorganisms. The prokaryotic community was profiled in samples from five different laterite horizons by 16S rRNA gene amplicon sequencing (Figure 19A,B). Three samples were selected for fungal community characterisation, and two were successfully profiled by sequencing the ITS region (Figure 19C).

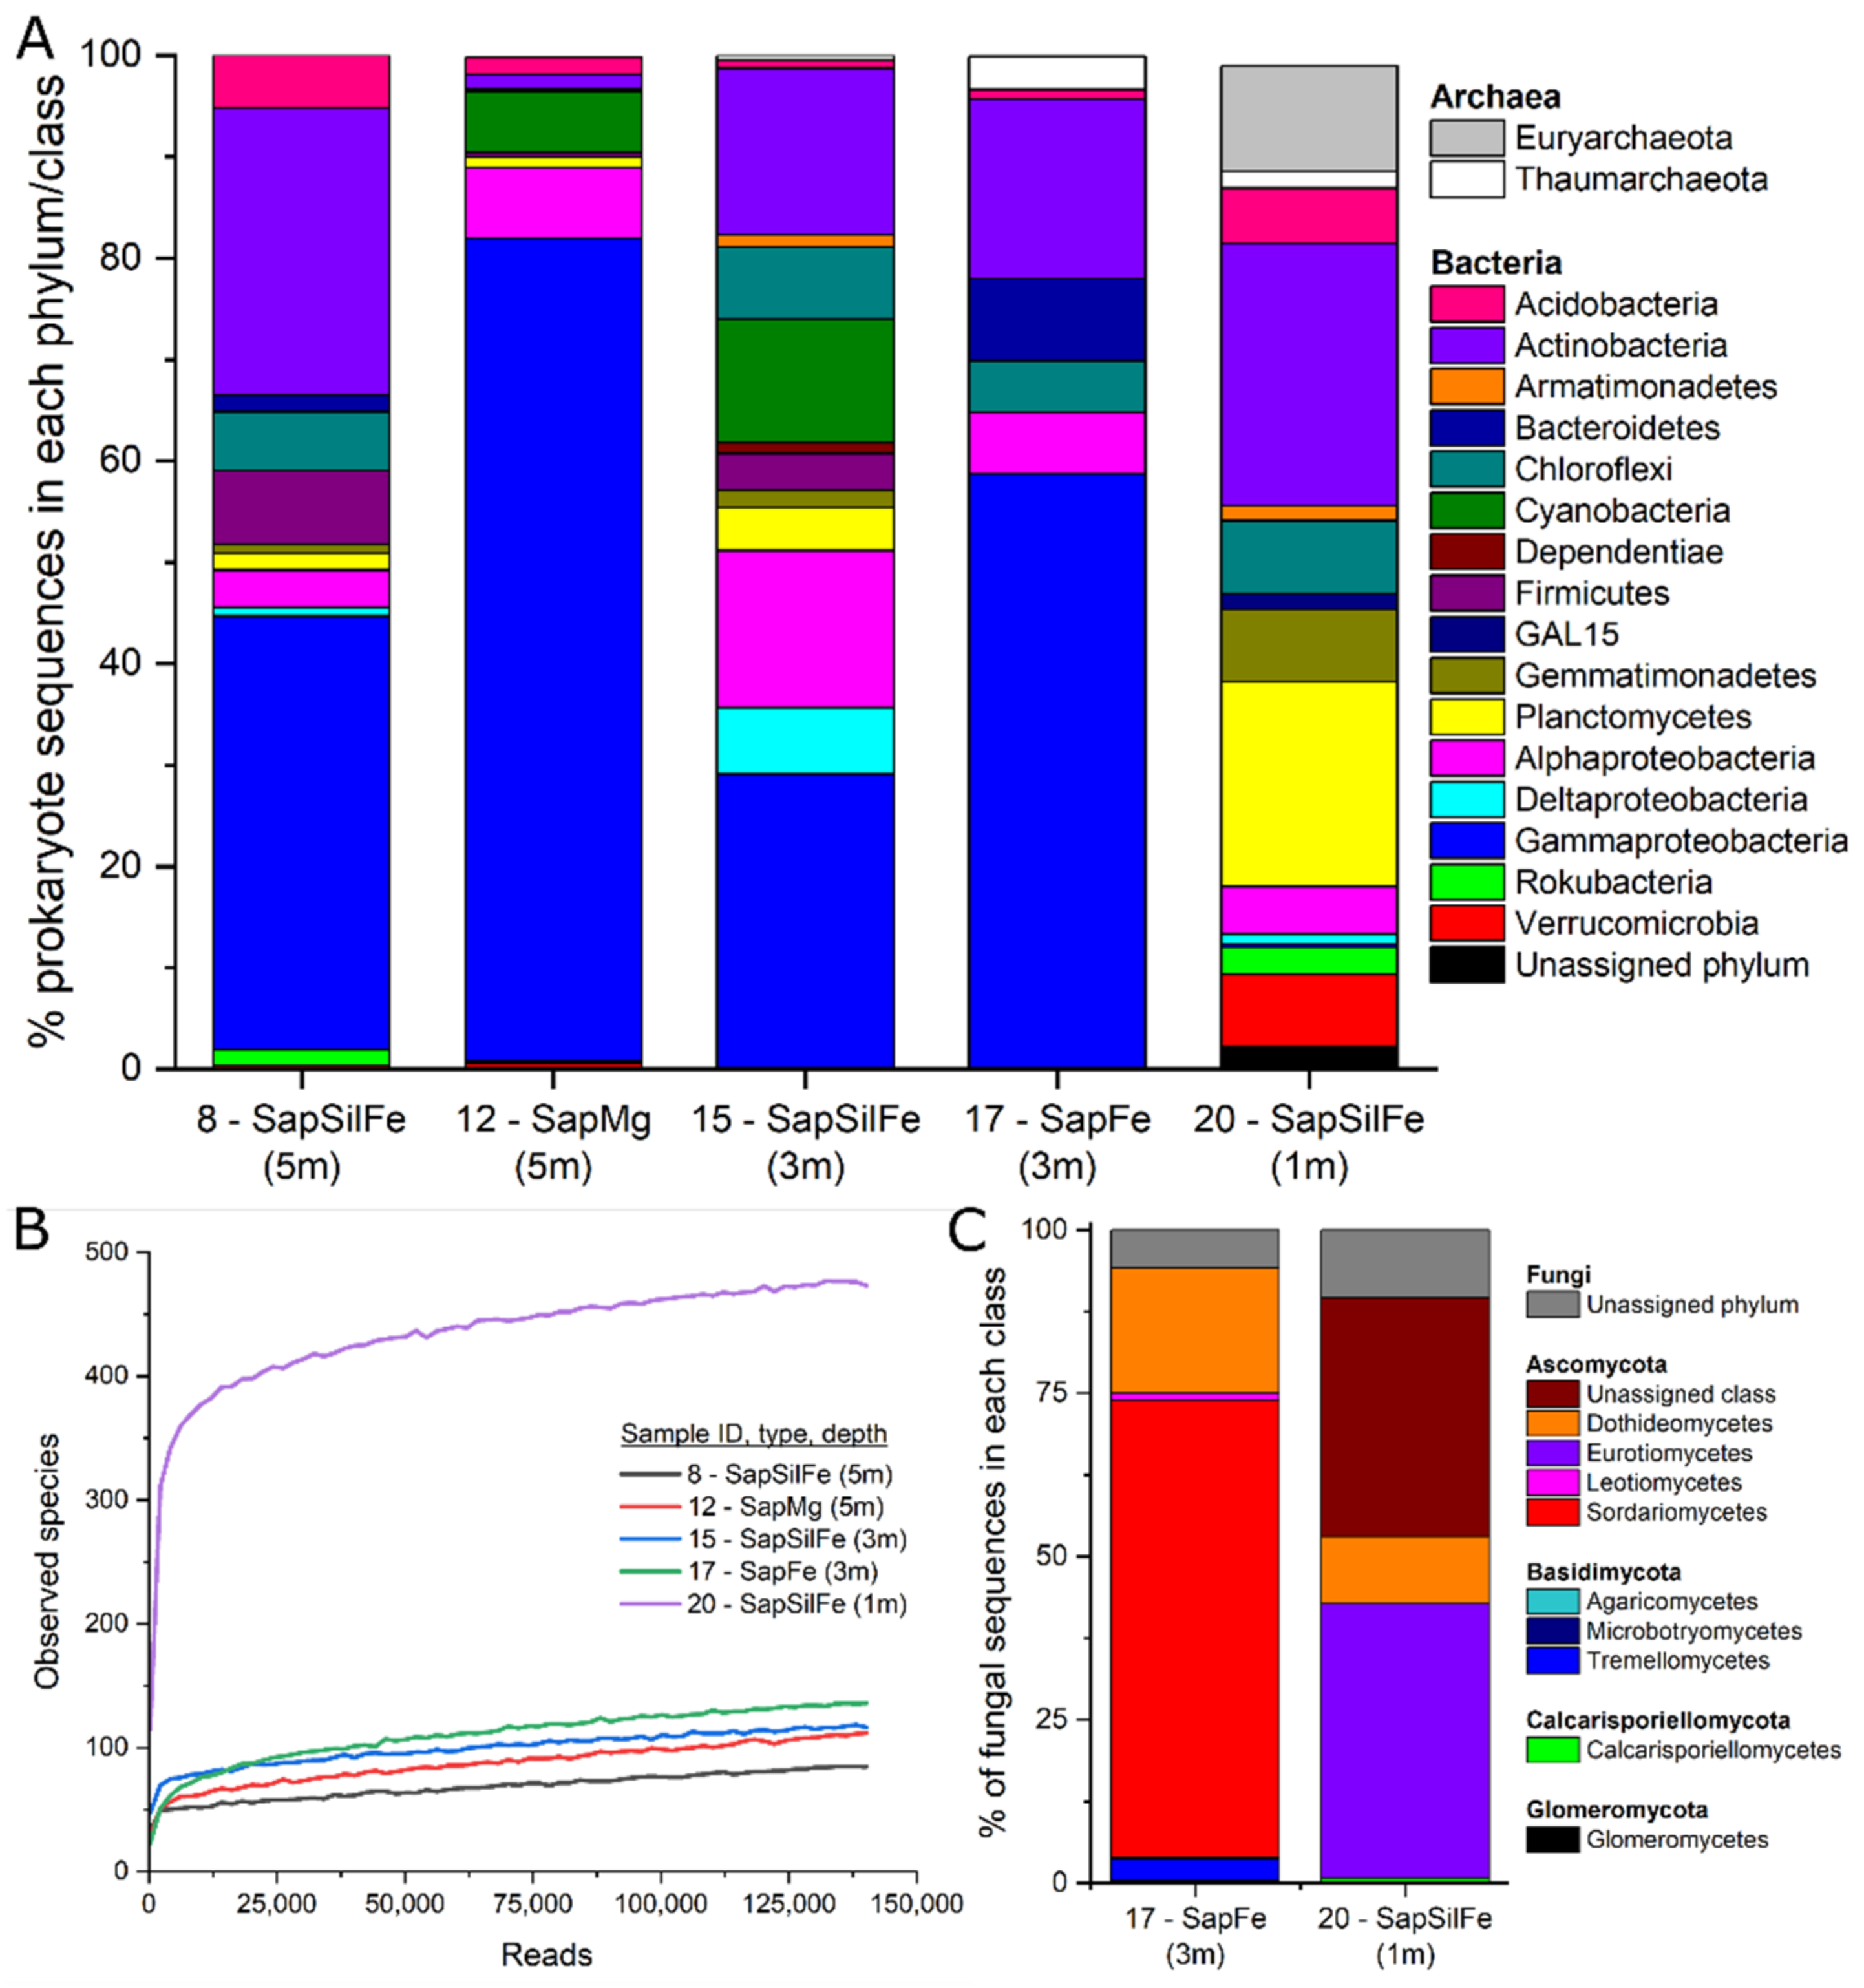
5.5.1. Microbial Abundance and Diversity

The highest number (478) of observed prokaryotic species (operational taxonomic units, OTUs) and the greatest Shannon diversity (7.38) were found in sample 20, a SAPSILFE collected approximately 1 m below ground level (mbgl) (Figure 19B, Table S5 Supplementary Materials). The number of OTUs was much lower (79–125) in the four other samples. The Shannon diversity was higher in the three SAPSILFE samples (4.3–7.4) compared to the SAPMG (3.3) and SAPFE (2.9) samples, but there is no trend with sample depth.
Correlation plots between prokaryotic diversity indicators (Shannon diversity and number of OTUs) and geochemical variables (Table S5) were made to identify whether laterite geochemistry may control microbial diversity. There is a positive relationship between the diversity indicators and concentrations of K (R2 > 0.68), but few significant trends were observed, including for essential elements (e.g., Mg, P, Mn, Na, Ca) and major laterite components (Fe, Si). Positive correlations are evident for Al, Co and Ni concentrations (elements sometimes considered toxic), and total organic carbon, but these are strongly influenced by sample 20, which has the highest concentrations of these variables and the highest prokaryotic diversity; the trends were not observed in the remaining four samples.
Of the five samples where 16S rRNA gene copies were quantified using qPCR, the highest values were from sample 17 (1270 fg g−1 laterite), a SAPFE, followed by sample 20 (44 fg g−1 laterite), a SAPSILFE, while the other three samples were below detection (Table S5). The value for sample 17 is broadly comparable with a previous study of Cuban laterites, which reported data in the order of 1 × 10⁷–1 × 10⁸ copy number per gram dry sample [64] compared to 2.3 x 10⁶ here (result converted from fg g−1 into copy number g−1). The value for sample 20 is within the range reported for composite samples from Piauí, which contain 32–49 fg g−1 laterite [35].
There were also very low numbers of observed fungal species, with only 21 and 32 fungal OTUs present in the two samples sequenced (samples 17 and 20) and insufficient fungal DNA present for sequencing in sample 8, a SAPSILFE from 5 mbgl. The amount of 18S rRNA gene copies quantified by qPCR (note this will include all eukaryotes not just fungi) was 125–167 fg g−1 laterite.
Overall, the microbial diversity in the Piauí laterite is low, perhaps reflecting the challenges of living in a such a highly weathered, oxidising environment, with low concentrations of organic carbon and essential elements available to support growth (Table S5). There do not appear to be any significant trends in microbial abundance and diversity with depth, or by lithological unit type, or with geochemical conditions.

5.5.2. Prokaryotic Community Composition

The most common phyla/classes observed in the Piauí laterite samples are the Actinobacteria and Gammaproteobacteria (in particular, the Burkholderiaceae family) (Figure 19A). The closest phylogenetic relatives to the five most frequently detected OTUs in each sample were identified using Blastn (Table S6 Supplementary Materials). Commonly reported are sequences closely related to those from soil environments, e.g., from studies of the rhizosphere, endophytes, crops, ferralsol and also from human impacted environments such as from studies of the impact of wetland restoration, wastewater irrigation, mining and heavy metal contamination. Sequences closely related to those from studies of clays, lithifying microbialites, ureolysis, soils with elevated CO2 conditions and bacteria involved in hydrocarbon biodegradation are also common.
The dataset was analysed to identify the presence of metal-cycling prokaryotes, which could potentially reduce or oxidise Mn, Fe and S minerals and therefore contribute to the mobilisation and enrichment of Co via indirect redox transformations [35]. Many sequences were assigned to the Burkholderiaceae (0.1% to 78%), some of which are known to oxidise Mn(II) and Fe(II) [65]. Some sequences are closely related to genera with known Mn(II)-oxidising activity, including Sphingopyxis (0%–1.8%), Streptomyces (0%–2.0%) and Pseudomonas (0%–3.1%) [66]. Although some sequences were assigned to the Nitrospirales (0.1%–0.9%) which contain known Fe(II) oxidisers, none were assigned to the Fe(II)-oxidising Leptospirillum genus [67]. Other Fe(II)-oxidising groups include Acidithiobacillus sp. (0%–7.6%); these are acidophilic prokaryotes, although the pH of the laterites was circumneutral (5.1–7.4). Acidithiobacillus and Sulfurifustis sp. (0%–5.0%) are acidophiles known to oxidise sulphur [68,69,70]. In general, relatively few sequences were assigned to genera closely related to known Fe(III)- and sulfate reducers, although some sequences were aligned with Desulfosporosinus sp. (0%–6.3%), which are known to reduce Mn(IV), Fe(III) and sulfate, in some cases at low pH [71,72]. Microbial siderophores are able to complex metals, especially Fe, and enhance their mobility. Some sequences in the Piauí laterite are closely related to well-known siderophore producing genera included Acinetobacter (0%–1.9%), Pseudomonas (0%–3.1%) and Streptomyces (0%–2.0%) [73,74,75,76].
Other prokaryotes of interest include nitrogen cycling organisms, which are fairly common in all samples, including sequences closely related to known nitrogen fixers such as Burkholderia (0%–61%), Ralstonia (0%–2.6%) and Sphingomonas (0%–4.0%) spp. [77,78], and anaerobic ammonium oxidisers including sequences from the Nitrospirales (0.1%–0.9%) and Nitrosomonadaceae (0%–2.3%), and most closely related to Nitrososphaera viennensis (0%–3.2%) [67,79,80]. Sequences assigned to Massilia spp. (0%–55%) are closely related to species known to hydrolyse urea, reduce nitrate and metabolise organic compounds, and Massilia spp. have previously been isolated from mining impacted soils [81,82]. Phosphorus mobilising prokaryotes are also prevalent, including sequences assigned to Burkholderia (0%–61%), Pseudomonas (0%–3.1%) and Ralstonia (0%–2.6%) spp., all of which have been shown to solubilise inorganic phosphorus and/or mineralise organic phosphorus compounds [83].
Overall, the composition of the prokaryote communities in the laterite sediments shows the presence of sequences closely related to organisms known to oxidise Mn, Fe and S minerals at different horizons within the deposit. These microbes can trap cobalt e.g., through the formation of Mn(IV)/Fe(III) oxides, or mobilise cobalt e.g., through the dissolution of sulphide minerals. As well as this, sequences closely related to organisms known to reduce metals (which could mobilise Co associated with Mn(IV)/Fe(III) oxides under anoxic conditions) and those that secrete siderophores (which could solubilise Co associated with Fe(III) oxides) were also identified, which could support the hypothesis that microbes contribute to the weathering of laterite and enhance the mobility of cobalt. Although the concentrations of elements essential for growth in the laterite were low, sequences closely related to organisms capable of fixing N and mobilising P were present, suggesting these may be able to provide these elements and support microbial growth.

5.5.3. Fungal Community Composition

The Piauí laterite contained very few fungal OTUs identified by ITS sequencing (Table S5). Samples 17 and 20 predominantly contained sequences assigned to Ascomycota (Figure 19C). Of the five most abundant OTUs for each sample (ten in total), only five sequences could be identified with confidence (Table S7 Supplementary Material). Four were from sample 17 and comprised common environmental yeast and mould and a pathogenic fungus that infects plant roots, the other was a versatile saprotroph from sample 20. Siderophore-producing fungi were identified to be present including Rhodotorula sp. (0%–0.2%) and Aspergillus sp. (0%–5.5%) [84].

5.5.4. Microcosm Experiments

Previous data for composite Piauí samples showed that adding an organic substrate stimulated the development of metal-reducing conditions and enhanced the recovery of cobalt [35]. Here, microcosm experiments were set up to investigate whether this would also be the case for individual horizons of the Piauí deposit collected for these experiments, stimulated using glucose or an acetate/lactate mix as a source of carbon and electron donor, and to see whether the heterogeneity in the microbial community was reflected in the biogeochemical response to redox cycling.
No significant changes in sediment texture were observed during the 105 day incubation, unlike in previous experiments comprising composite samples from the Piauí laterite [35]. Geochemical monitoring showed that nitrate reduction was stimulated in all samples with both electron donors (Figures S7 and S8 Supplementary Materials). Trace amounts of Mn and Fe were released to the aqueous phase, but there was no clear evidence of Fe(II) production or sulfate reduction with either electron donor. Volatile fatty acids (VFAs) were measured as a proxy for glucose breakdown products or to show consumption of acetate/lactate; the overall results from these experiments showed the indigenous microbial community was stimulated by the addition of organic substrates, but this did not lead to substantial microbial metal reduction and dissolution of cobalt.
The results of the sediment microcosm study show that, for the most part, the microbial community is able to metabolise carbon compounds and reduce nitrate. This is consistent with the results of the DNA sequencing analysis which identified that the microbial community is dominated by prokaryotes involved in C and N cycling. There was no conclusive evidence that microbial metal reduction had been stimulated in the seven samples of the different Piauí laterite horizons. This is in contrast to earlier work that demonstrated that microbial Mn(IV) and Fe(III) reduction was stimulated by the addition of organic electron donors in composite samples of the Piauí laterite; samples collected from heaps created from the excavation of 10,000 tonnes of laterite [35]. This suggests that mineral processing, including the physical disaggregation of Piauí sediment into composite samples during mining (and the consequent exposure to air and rainfall) may have somehow primed the microbial community to favour the capacity for metal reduction.

6. Discussion

6.1. Mineralogical Development the Piauí Lateritic Profile

The dunite of the ultramafic zone of the Brejo Seco–Piauí Complex originally comprised >90 vol% olivine with substantial chromite (<7 vol%) and a small proportion of plagioclase, clinopyroxene, orthopyroxene and phlogopite [27]. Serpentinisation replaced the olivine with serpentine-I and magnetite (e.g., Figure 8) with the ongoing replacement of chromite by ferrichromite and magnetite (e.g., Figure 9) [27].
During the laterisation process, the serpentine-I and any remaining olivine and pyroxene is altered into Ni-bearing serpentine-II, Fe-oxides including Ni-rich goethite, hematite and magnetite. Where Al is available, Ni bearing chlorite and/or other clays (mostly smectite) formed. Continued leaching, particularly of Mg and Si, results in the formation of the saprock and ferruginous saprolite that comprise the majority of the Piauí laterite and a significant Mg-discontinuity between these two units. This typical progression for laterite formation under tropical to sub-tropical climatic conditions, e.g., [11], can be visualised in a Si-Al-Fe (SAF) ternary plot (dotted line, Figure 20A) and quantified using the index of laterisation (IOL), as defined by [85] and expressed in Equation (1):
IOL = 100 × [(Al2O3 + Fe2O3)/(SiO2 + Al2O3 + Fe2O3)]
The IOL (calculated in wt%) gives average values of 24 and 30 for the serpentinite and saprock at Piauí, slightly higher than similar lithologies formed from serpentinised harzburgite and peridotite [86]. The oxide zone at Piauí represented by the SAPFE lithology, however, has IOL values between 63 and 83 within the moderately laterised division of the IOL scheme [85,86], reflecting the presence of numerous phyllosilicates and clays. Had laterisation continued under these conditions, it may be expected that the SAPFE lithology would have completely transformed into a strongly laterised traditional limonite, however, an extended period of silicification occurred throughout the lower two thirds of the ferruginous saprolite unit cementing Fe-oxides, forming extensive silica vein networks, stockwork alteration and boxwork structures (e.g., Figure 4A,C,D).
This silicification process is suggestive of a wet-to-dry scenario, whereby a change either in weathering conditions from a tropical climate to a seasonal or semi-arid environment promotes silica precipitation [12,14] or a restriction to drainage, promoting extensive silicification at the water table [14]. The extent of the silicification and its impact upon the IOL is evident in Figure 20A, with the seemingly retrograde laterisation step shown by the dashed line, whereby the samples of silicified ferruginous saprolite (SAPSILFE) have an average IOL value of 45.
Considering the importance of MgO and SiO2 in the weathering of ultramafic bodies and the enrichment of Fe2O3 and Al2O3 during the laterisation process, [9] developed the quantitative ultramafic index of alteration (UMIA) that has recently been utilised to describe laterite development e.g., [6,9,15,86]. The UMIA is calculated using molar ratios from Equation (2):
UMIA = 100 × [(Al2O3 + Fe2O3)/(SiO2 + MgO + Al2O3 + Fe2O3)]
The serpentinite at Piauí has an UMIA between 5 and 6 while the saprock evolves from 5 at the lower part of this unit up to 10 close to the Mg-discontinuity at the saprock-SAPSILFE interface. These values are well matched to those for similar rocks at other laterite deposits [9,15,86]. The ferruginous saprolite SAPFE varies from 25 to 55, well below the values calculated for limonite horizons [9,15,86], again reflecting the persistence of phyllosilicates and clays within SAPFE. This developmental pathway can be indicated on the AF-S-M plot in Figure 20B by the dotted line where the loss of MgO and SiO2, and limited enrichment on Fe2O3 is evident. The silicification process is also well highlighted in Figure 20B where the enrichment of the ferruginous saprolite in SiO2 is indicated by the dashed line and the SAPSILFE samples develop lower UMIA values (13–31) compared to those of the SAPFE samples.
The bulk chemistry for the ultramafic zone dunite reported by [27] is very similar to that of the serpentinised dunite of the Piauí laterite (Table 4), with the olivine of the ultramafic zone dunite containing 1000–3000 ppm NiO [27], suggesting this is the source of the Ni in the bulk of the laterite profile. The dunite olivine has up to 2800 ppm MnO [27], but the serpentinisation phase does not produce nickeliferous or manganiferous serpentine (Table 5). Instead, the serpentine-I is low in trace elements although Mn-bearing Ni and Co-rich magnetite (Figure 9) formed along with asbolane (Figure 11) containing ~7 wt% of both Co and Ni (Table 5).
The weathering process consumed any remaining olivine, producing Ni-bearing serpentine-II in the saprock. This serpentine-II is richer in Ni and Fe than serpentine-I and thus, is substantially more resilient within the weathering profile than the first formed, trace element-poor serpentine. This process preserved the igneous textures and further increased the porosity with the Si/Mg ratio increasing from 0.75 in the serpentinite to 0.98 in the saprock, just below the Mg-discontinuity e.g., [15]. High Si/Mg ratios during this phase may have induced the formation of the pimelite and nickeliferous talc bearing silica nodules within the ferruginous saprolite (prior to the late-stage conversion of SAPFE to SAPSILFE) just above the saprock e.g., [15,87]. Continued saprolitisation developed the ferruginous saprolite above the saprock and Mg-discontinuity, within which the less mobile elements Fe, Cr and Al are concentrated (Table 4) relative to the saprock and serpentinite.
In addition to the silicification process, the Piauí laterite profile is further complicated by the presence of the green (SAPMG) and white-green (SAPAL) layers. These have weathered via a different mineralogical pathway to the main parts of the profile based in part on a different starting mineralogy, geochemistry and texture, but perhaps also due to enhanced fluid flow pathways at the interfaces between the ferruginous saprolite and these layers. SAPMG and SAPAL are, in general, substantially richer in Al2O3 compared to SAPFE or SAPSILFE, while SAPMG has retained between 13 and 30 wt% MgO, levels approaching those of the saprock and serpentinite (Table 1, Table 2 and Table 4).
Salgado et al. (2016) [27] show that the ultramafic zone dunite has numerous troctolite intercalations or layers, with significant levels of plagioclase associated with the olivine. Moreover, in places, the ultramafic zone dunite possesses layers (from a few cm to several metres thick) characterised by larger amounts of interstitial minerals, particularly plagioclase. Troctolites within the transition and upper zones of the Brejo Seco–Piauí Complex possess 16–21 wt% Al2O3, 10–20 wt% MgO and 5–15 wt% Fe2O3 [27]. Importantly, however, the analyses of [27] show that these troctolites contain substantially lower Ni (100–750 ppm) than the dunite (1500–3300 ppm). The SAPMG and SAPAL units at Piauí likely derive from similar troctolitic intercalations/layers, and while the geochemistry of SAPMG is very variable (Table 2), average values (Table 4) do relate well to the troctolite chemistry of [27].
Considering the high concentrations of Al2O3, the initial serpentinisation of the troctolitic layers may have produced a mixed chlorite and serpentine (serpentine-I) assemblage where both phases had low Ni contents. The onset of saprolitisation provided substantial Ni into these chloritic layers, stabilising the chlorite by Ni for Mg exchange while the more soluble serpentine is lost [14], with the elevated levels of Ni permitting the occasional formation of nimite. During continued saprolitisation of the whole profile fluid flow may have become concentrated around the margins of the intercalated layers, as reported to have occurred at the Siberia Complex, Western Australia [88], further depleting the MgO and SiO2 in these areas, leaving Al2O3-rich layers dominated by kaolinite (with aluminous vermiculite and smectite), associated with the margins of the chloritic SAPMG layers. Moreover, if the Ni content of the chlorite in these margins was less than for the chlorite in the core regions of the layers (as suggested by Table 2) then these would have been preferentially solubilised [14], enhancing the alteration in the margins to produce the SAPAL units (Figure 3D).
Such an alteration pathway can be envisaged in Figure 20B, where an initial troctolite composition evolves into a MgO enriched saprolite (SAPMG), while the highly leached margins of the intercalated troctolite become very depleted in MgO. The alteration pathway of these green and white-green saprolitic layers may be better described as bauxitisation rather than laterisation, as it progresses entirely along a SiO2 + MgO − Al2O3 join, as seen in the A-SM-F plot of Figure 20C.

6.2. Element Mobility during the Piauí Laterite Formation

Within the main part of the Piauí profile, the silicified ferruginous saprolites have the highest average ΣREE (36 ppm), while the serpentinite, saprock and SAPFE all have similar abundances with average values of 3.5, 5 and 12, respectively. Although only two saprock samples were analysed, the one closest to the serpentinite has the lowest levels of REE, while the one closest to the Mg-discontinuity has REE values between those of the two ferruginous saprolite units, with a general trend very similar to that displayed by the SAPSILFE samples (Figure 6) and the overlying SAPSILFE. While there is no true limonite unit in the Piauí profile, elevated REE levels in the upper saprock are similar to those reported for the saprolites of Loma de Hierro [15] and Ibra [89], in contrast to the highest levels being reported for the limonites at Punta Gorda, Loma Caribe, Loma Peguera [8] and Wingellina [6]. In general, though not always, the oxide-rich zones have REE trends revealing enrichment in LREE, while the saprolite and protolith/bedrock show flat trends across the REEs. At Piauí, the SAPSILFE and upper part of the saprock show LREE enrichment, while the serpentinite, saprock and SAPFE show no consistent enrichment across the REEs (Figure 6).
The SAPMG and SAPAL units are very much enriched in REE relative to the other parts of the Piauí profile, with maximum ΣREE values of 626 ppm and 1292 ppm, respectively, reflecting their troctolitic source, and all of these samples show a negative slope. There is good correlation between the ΣREE and Mn (r = 0.70) and Co (r = 0.69) for the SAPMG and SAPAL units, suggesting that the REEs may be hosted within Mn oxy-hydroxide phases, but, contrary to previous findings [6,8,15], not across the other lithologies.
Serpentinisation of the dunite mobilised the Co and Ni to magnetite/spinel and into asbolane, with a Co:Ni ratio averaging close to 1 (Table 5; Figure 11). Serpentine-I contains very little Ni and no detectable Co (by EMPA), and the weathering stages of the profile development initially resulted in Ni-bearing serpentine-II and nickeliferous chlorite. We have no evidence for Co hosted within serpentine, contrary to the findings of [53], who used linear combination fitting of XANES data to confirm that serpentine in laterites from the Goro Peninsula, New Caledonia, contain Co. As the saprolitisation process continues, asbolane within the serpentinite is reworked to produce low-Al asbolane-lithiophorite intermediates with an average Ni:Co ratio of about 3.5 (Figure 11), reflecting the increased availability of Ni as the silicates are removed. While Ni-rich goethite is commonplace across the main lateritic profile units, SAPSILFE and SAPFE, we find that Co incorporation into goethite has a strong dependency upon Mn, such that the only Co bearing goethites are those with significant levels of Mn. This may reflect local reworking or dissolution of asbolane within an increasingly Fe-rich environment, or direct formation from Co and Mn-rich magnetite.
The uppermost unit of the profile (SAPFE) has the highest levels of Co, Ni and Mn from the main profile, with these elements hosted primarily within low-Al asbolane-lithiophorite intermediates and goethites, and there is no textural or geochemical evidence to suggest that the asbolane-lithiophorite intermediates within SAPFE are a different generation to those from SAPSILFE. Indeed, there is no strong evidence for multiple generations of Mn oxy-hydroxides within the SAPFE or SAPSILFE profile units. Moreover, it is possible that the remobilisation of Ni and Co downward within the profile, as is common in other deposits, has not occurred at Piauí, as either the lateritisation process has not proceeded far enough, or perhaps due to the change in weathering environment and the extensive late-stage silicification. Limited downward mobilisation and enrichment of Ni was also suggested for the Intex deposit, correlating with the less advanced degree of weathering overall [86].
This observation correlates with the limited evidence found for microbial weathering or a microbial contribution to metal enrichment. The present day Piauí laterite contains a relatively low diversity of prokaryotes and fungi, commonly associated with soil/rhizosphere environments, rather than necessarily reflecting the laterite geochemistry. While it was not possible to identify many of the fungal species, the prokaryotic community is primarily composed of bacteria capable of oxidising simple N and C compounds and Mn(II) and Fe(II) under oxic or suboxic conditions, and a small proportion of sequences are closely related to Fe(III)- and sulphur-reducers, which could suggest there is potential for active microbial metal cycling in the Piauí laterite, and associated redistribution of redox sensitive metals. However, microcosm experiments conducted to stimulate metal-reducing conditions in sediments collected from different horizons of the laterite showed limited evidence for metal mobilisation. Therefore, it is unlikely that active biogeochemical cycling of metals is occurring and contributing to Co enrichment in the present day Piauí laterite. Correlations between Co and Mn are likely to be a relic of parent rock weathering, rather than due to biogeochemical processes; a conclusion that agrees well with the mineralogical associations.
The presence of the SAPMG and SAPAL layers within the Piauí profile have had a profound effect upon the mobility of Co, Ni and Mn. The chlorite dominated SAPMG layers have the highest Ni concentrations, with substantial amounts of Ni hosted within chlorite (Table 7; Figure 14). Additionally, chlorite within SAPMG is also the only silicate phase we identified that hosts levels of Co detectable by EMPA (Table 6). SAPAL has the highest levels of Mn and Co across the entire deposit, more than double the levels of Co and almost double the levels of Mn compared to SAPFE, the next most concentrated unit (Table 4). The elevated levels of Mn in SAPAL are reflected by the high number of Mn oxy-hydroxide grains, and the field observations of regions of concentrated Mn oxy-hydroxide formation as layers or coatings at the SAPAL boundary with the ferruginous saprolite (e.g., Figure 3E and Figure 4E –G). These Mn oxy-hydroxides, along with those in SAPMG, are all rich in Al and are classed as asbolane-lithiophorite intermediates (Figure 11) and have an average Ni:Co ratio of ~4. Within these intermediates, the Ni is incorporated as Ni(OH)2 within the interlayer.
Dublet et al. (2017) [53] proposed that within laterite profiles Co is progressively incorporated in Mn oxy-hydroxides as oxidized Co3+ as the serpentinite is weathered to saprolite and further to limonite. Using XANES, EXAFS and STXM we find, however, that in the Al-rich, clay dominated SAPMG and SAPAL, there is substantial Co2+ in the asbolane-lithiophorite intermediates hosted within the interlayer, while the Co3+ replaces Mn in the MnO6 layers. There is no evidence for the presence of nanoscale goethite, that can contain Co2+ [53], and it is possible that in parts of the asbolane-lithiophorite intermediate grains all the available sites in the MnO6 layers that are required for the oxidation of Co2+ to Co3+ are used up. Potentially, the geochemical and Eh/pH properties of the Mn oxy-hydroxide forming fluids within SAPMG and SAPAL are different to those of the ferruginous saprolite at Piauí and in other laterite deposits, promoting the precipitation of asbolane-lithiophorite intermediates as surface coatings and that limit the oxidation of Co2+ upon incorporation into the Mn oxy-hydroxide structure e.g., [56,90]. In essence there is the potential for the development of redox fronts at or close to the SAPAL and ferruginous saprolite boundary, similar to the changes in Eh and pH between lateritic clay and limonite zones [88], a mechanism suggested for the similarly silicified, clay rich deposit at Ravensthorpe [91].
Additionally, it may be that the seasonal or reduced rate of the lateritisation process at Piauí related to a change in climatic conditions, silicification and limited drainage promoted more reducing conditions with hydromorphic activity at the SAPAL–ferruginous boundary, e.g., [3], or even precluded the gradual reworking of these Mn oxy-hydroxides and subsequent complete oxidation of Co2+ to Co3+. The presence of Al in the asbolane-lithiophorite intermediates may make these Mn oxy-hydroxides more resistant to weathering and subsequent reworking e.g., [92]. Nevertheless, the presence of these SAPMG and SAPAL layers have clearly influenced the local precipitation and nature of the Mn oxy-hydroxides, and moreover, the fluid flow within the adjoining ferruginous saprolite, further supported by the localised precipitation of romanechite phases. The SAPMG and SAPAL layers have effectively created a hydrologic barrier promoting Eh/pH conditions suitable for Mn oxy-hydroxide precipitation further into the ferruginous saprolite and channelling Ni and Co-rich fluids into these regions (e.g., Figure 4E,F), as shown to have occurred in the laterite deposit over the Siberia Complex Laterite, Western Australia [88].

7. Conclusions

The laterite profile at Piauí is essentially an oxide type deposit, though the lack of a true limonite layer and the presence of clay rich units dominated by chlorite, smectite and kaolinite give the profile some clay silicate deposit characteristics. The deposit formed on a serpentinised dunite that contained many troctolitic intercalated layers relatively rich in Al compared to the rest of the ultramafic protolith. The profile was further complicated by a change in climatic and weathering conditions that induced late stage silicification throughout the saprolite units.
Within the ferruginous saprolite layers (SAPSILFE and SAPFE), goethite is volumetrically the most significant Co and Ni bearing mineral, while low-Al asbolane-lithiophorite intermediates possess the highest concentrations of these elements. Within the intercalated green and white-green layers (SAPMG and SAPAL) chlorite is volumetrically the most significant Ni bearing mineral, with concentrations of Ni up to 24 wt% Ni. Al-rich asbolane-lithiophorite intermediates and Ba-rich romanechite with high concentrations of both Co and Ni are associated with these two layers often concentrated at the interface between the SAPAL and ferruginous saprolitic units.
The Co and Ni are structurally bound within the asbolane-lithiophorite intermediates, such that Co3+ substitutes for Mn in the MnO6 layers and Ni is hosted as Ni(OH)2 within the ‘brucite-like’ layers. Substantial levels of Co2+ are identified structurally bound within the asbolane-lithiophorite intermediates, a finding that may be unique to Piauí, associated with its complex petrologic structure and formation history, or may reflect the limited number of equivalent studies on other similar deposits. The formation of the asbolane-lithiophorite intermediates, romanechites and other Mn oxy-hydroxide minerals is associated with redox cycling whereby fluid flow is strongly affected by the presence of the SAPMG and SAPAL layers or where these layers locally impart a defining influence on the redox properties of the metal loaded fluids.
The mineralogy of limonites has a profound impact on their leaching properties [93] and knowledge that Co is predominantly present in Mn oxy-hydroxides and Ni in clays may be used to target mineral processing methods to recover these elements. The mineralogy and geotechnical properties of the Piauí laterite make it very amenable to long term atmospheric heap leaching to extract the Co, Ni and other technologically significant metals. Indeed, the application of tailored short-duration bioreductive technologies, e.g., [48,49], have the potential to specifically target the Mn oxy-hydroxides and the Ni-rich clays at Piauí to recover the Co and Ni hosted within these phases [35,94].

Supplementary Materials

The following supporting information can be downloaded at: https://www.mdpi.com/article/10.3390/min12101298/s1. Figure S1: Schematic of Piauí Test Pit; Figure S2: sampling sites; Figure S3: Sampling sites continued; Figure S4: REE plots; Figure S5: XRD patterns of high Ni samples and Fe oxides; Figure S6: FTIR spectrum of F050; Figure S7: Glucose stimulated microcosm results; Figure S8: Acetate/lactate stimulated microcosm results; Table S1: Additional elements from the bulk chemical analyses; Table S2: Additional elements from the bulk chemical analyses; Table S3: Fitting parameters for the Co K-edge microfocus XAS spectra; Table S4: Fitting parameters for the Ni K-edge microfocus XAS spectra; Table S5: Details of samples analysed for microbial communities; Table S6: Closest phylogenetic relatives of the five most abundant prokaryotic OTUs; Table S7: Closest phylogenetic relatives of the five most abundant fungal OTUs; Methods for microbiological characterisation: Prokaryotes; Methods for microbiological characterisation: Fungi [95,96,97,98,99,100,101,102,103,104,105,106,107,108,109,110,111,112,113,114,115,116,117].

Author Contributions

Conceptualisation: A.D., P.F.S., L.N., R.J.H. and A.O; Methodology: A.D., P.F.S., L.N., R.J.H., J.F.W.M., B.K., M.K., T.A., J.K. and J.R.L.; Analytical Investigation: A.D., P.F.S., L.N., T.J.S., J.F.W.M., B.K., T.A., M.K. and R.L.N.; Field Investigation: P.F.S., L.N., R.J.H., J.K. and A.O.; Resources: P.F.S., L.N., R.J.H., J.F.W.M., B.K. and J.R.L.; Data Curation: A.D., P.F.S. and L.N.; Original Draft Preparation: A.D., P.F.S. and L.N.; Review and Editing: A.D., P.F.S., L.N., J.F.W.M., R.J.H., B.K., T.A., M.K., T.J.S., J.K., A.O., R.L.N. and J.R.L.; Funding Acquisition: R.J.H., P.F.S., J.F.W.M., B.K. and J.R.L. All authors have read and agreed to the published version of the manuscript.

Funding

This work was funded by the Natural Environment Research Council, UK (COG3: The geology, geometallurgy and geomicrobiology of cobalt resources leading to new product streams) Grant references NE/M011488/1, NE/M011518/1 and NE/M011127/1. The work was also supported by Diamond Light Source, proposal references NT14882, SP14908 and SP17882. JK received funding from the People Programme (Marie Curie Actions) of the European Union’s Seventh Framework Programme FP7/2007–2013/under REA grant agreement No. [608069].

Data Availability Statement

Data supporting reported results can be found in the Supplementary Materials.

Acknowledgments

This work was supported by the Natural Environment Research Council, UK (COG3: The geology, geometallurgy and geomicrobiology of cobalt resources leading to new product streams NE/M011488/1, NE/M011518/1 and NE/M011127/1). The authors are grateful to Mike Oxley and all the staff of Brazilian Nickel for their support, guidance and hospitality, particularly during the sample collecting at the Piauí deposit. Synchrotron work was carried out with the support of Diamond Light Source, instruments I18 (proposals NT14882 and SP14908) and I08 (proposal SP17882). JK received funding from the People Programme (Marie Curie Actions) of the European Union’s Seventh Framework Programme FP7/2007–2013/under REA grant agreement No. [608069]. We are grateful to Rachael James, Jens Najorka, John Spratt, Tobias Salge, Simon Kocher, Ashley King, Christopher Boothman, Paul Lythgoe and Alastair Bewsher for their help during this study.

Conflicts of Interest

The authors declare no conflict of interest.

References

  1. Gleeson, S.A.; Herrington, R.J.; Durango, J.; Velásquez, C.A.; Koll, G. The mineralogy and geochemistry of the Cerro Matoso S.A. Ni laterite deposit, Montelíbano, Colombia. Econ. Geol. 2004, 99, 1197–1213. [Google Scholar] [CrossRef]
  2. Thorne, R.L.; Roberts, S.; Herrington, R. Climate change and the formation of nickel laterite deposits. Geology 2012, 40, 331–334. [Google Scholar] [CrossRef]
  3. Lambiv Dzemua, G.L.; Gleeson, S.A.; Schofield, P.F. Mineralogical characterization of the Nkamouna Co–Mn laterite ore, southeast Cameroon. Miner. Depos. 2013, 48, 155–171. [Google Scholar] [CrossRef]
  4. Butt, C.R.M.; Cluzel, D. Nickel Laterite Ore Deposits: Weathered Serpentinites. Elements 2013, 9, 123–128. [Google Scholar] [CrossRef]
  5. Mudd, G.M.; Weng, Z.; Jowitt, S.M.; Turnbull, I.D.; Graedel, T.E. Quantifying the recoverable resources of by-product metals: The case of cobalt. Ore Geol. Rev. 2013, 55, 87–98. [Google Scholar] [CrossRef]
  6. Putzolu, F.; Boni, M.; Mondillo, N.; Maczurad, M.; Pirajno, F. Ni-Co enrichment and High-Tech metals geochemistry in the Wingellina Ni-Co oxide-type laterite deposit (Western Australia). J. Geochem. Explor. 2019, 196, 282–296. [Google Scholar] [CrossRef]
  7. Samouhos, M.; Godelitsas, A.; Nomikou, C.; Taxiarchou, M.; Tsakiridis, P.; Zavasnik, J.; Gamaletsos, P.N.; Apostolikas, A. New insights into nanomineralogy and geochemistry of Ni-laterite ores from central Greece (Larymna and Evia deposits). Geochemistry 2018, 79, 268–279. [Google Scholar] [CrossRef]
  8. Teitler, Y.; Cathelineau, M.; Ulrich, M.; Ambrosi, J.P.; Munoz, M.; Sevin, B. Petrology and geochemistry of scandium in New Caledonian Ni-Co laterites. J. Geochem. Explor. 2019, 196, 131–155. [Google Scholar] [CrossRef]
  9. Aiglsperger, T.; Proenza, J.A.; Lewis, J.F.; Labrador, M.; Svojtka, M.; Rojas-Purón, A.; Longo, F.; Durisova, J. Critical metals (REE, Sc, PGE) in Ni-laterites from Cuba and the Dominican Republic. Ore Geol. Rev. 2016, 73, 127–147. [Google Scholar] [CrossRef]
  10. Brand, N.W.; Butt, C.R.M.; Elias, M. Nickel laterites: Classification and features. J. Aust. Geol. Geophys. 1998, 17, 81–88. [Google Scholar]
  11. Freyssinet, P.; Butt, C.R.M.; Morris, R.C.; Piantone, P. Ore-forming processes related to lateritic weathering. Econ. Geol. 2005, 100, 681–722. [Google Scholar] [CrossRef]
  12. Thorne, R.; Herrington, R.; Roberts, S. Composition and origin of the Çaldağ oxide nickel laterite, W. Turkey. Miner. Depos. 2009, 44, 581–595. [Google Scholar] [CrossRef]
  13. Mudd, G.M. Global trends and environmental issues in nickel mining: Sulfides versus laterites. Ore Geol. Rev. 2010, 38, 9–26. [Google Scholar] [CrossRef]
  14. Golightly, J.P. Progress in understanding the evolution of nickel laterites. Soc. Econ. Geol. Spec. Publ. 2010, 15, 451–475. [Google Scholar]
  15. Domènech, C.; Galí, S.; Soler, J.M.; Ancco, M.P.; Meléndez, W.; Rondón, J.; Villanova-de-Benavent, C.; Proenza, J.A. The Loma de Hierro Ni-laterite deposit (Venezuela): Mineralogical and chemical composition. Boletín Soc. Geológica Mex. 2020, 72, A050620. [Google Scholar] [CrossRef]
  16. Herrington, R.; Mondillo, N.; Boni, M.; Thorne, R.; Tavlan, M. Bauxite and Nickel-Cobalt Lateritic Deposits of the Tethyan Belt. Soc. Econ. Geol. Spec. Publ. 2016, 19, 349–387. [Google Scholar]
  17. Trescases, J.J.; Melfi, A.J.; de Oliveira, S.M.B. Nickeliferous laterites of Brazil. In Proceedings of the Laterisation Processes, Proceedings of the International Seminar on Laterisation Processes, Trivandrum, India, 11–14 December 1979; Balkema: Rotterdam, The Netherlands, 1981; pp. 170–184. [Google Scholar]
  18. de Oliveira, S.M.B.; Trescases, J.J.; Melfi, A.J. Lateritic nickel deposits of Brazil. Miner. Depos. 1992, 27, 137–146. [Google Scholar] [CrossRef]
  19. Melfi, A.J.; Trescases, J.J.; de Oliveira, S.M.B. Les “laterites” nickeliferes du Brésil. Cah. ORSTOM Série Géologie 1979, 11, 15–42. [Google Scholar]
  20. Dino, R. Gênese do Minério de Niquel de São João do Piauí Por Alteração Intempérica. Ph.D. Thesis, Instituto do Geosciéncias, Universidade de Sao Paulo, Sao Paulo, Brazil, 1984. [Google Scholar]
  21. Oxley, A.; Smith, M.E.; Caceres, O.Y. Why heap leach nickel laterites? Miner. Eng. 2016, 88, 53–60. [Google Scholar] [CrossRef]
  22. Oxley, A.; Smith, M.E.; Caceres, O.Y. The Piauí Nickel heap leach project, Brazil. Proc. Heap Leach Solut. 2015, 2015, 123–133. [Google Scholar]
  23. BRN. The Piauí Nickel Project Fact Sheet. 2021. Available online: https://www.braziliannickel.com/piaui-nickel-project/ (accessed on 30 December 2021).
  24. De Almeida, F.F.M.; Hasui, Y.; Brito Neves, B.B.; Fuck, R.A. Brazilian Structural Provinces: An introduction. Earth Sci. Rev. 1981, 17, 1–29. [Google Scholar] [CrossRef]
  25. Salgado, S.S.; Ferreira Filho, C.F.; Uhlein, A.; de Andrade Caxito, F. Geologia, Estratigrafia e Petrografia do Complexo de Brejo Seco, Faixa Riacho do Pontal, sudeste do Piauí. Geonomos 2014, 22, 10–21. [Google Scholar] [CrossRef] [Green Version]
  26. Oliveira, R.G. Geophysical Framework, Isostasy and Causes of the Cenozoic Magmatism of the Province of Borborema and Its Continental Margin (Northeastern Brazil). Ph.D. Thesis, Instituto do Geosciéncias, Universidade Federal do Rio Grande do Norte, Natal, Brazil, 2008. [Google Scholar]
  27. Salgado, S.S.; Ferreira Filho, C.F.; de Andrade Caxito, F.; Uhlein, A.; Dantas, E.L.; Stevensen, R. The Ni-Cu-PGE mineralized Brejo Seco mafic-ultramafic layered intrusion, Riacho do Pontal Orogen: Onset of Tonian (ca. 900 Ma) continental rifting in Northeast Brazil. J. S. Am. Earth Sci. 2016, 70, 324–339. [Google Scholar] [CrossRef]
  28. Devlin, R.; (CSA Global, Perth, Australia). Mineral Resource Estimate, Brazilian Nickel Ltd, Piaui Nickel Project Sao Joao do Piauí, Piauí, Brazil. Unpublished Report No: R259.2013. 2013.
  29. Pouchou, J.L.; Pichoir, F. A New Model for Quantitative X-ray Microanalysis, Part I: Application to the Analysis of Homogeneous Samples. Rech. Aerosp. 1984, 3, 13–38. [Google Scholar]
  30. Pouchou, J.L.; Pichoir, F. A New Model for Quantitative X-ray Microanalysis, Part II: Application to In-depth Analysis of Heterogeneous Samples. Rech. Aerosp. 1984, 5, 47–65. [Google Scholar]
  31. Mosselmans, J.F.W.; Quinn, P.D.; Roque Rosell, J.; Atkinson, K.D.; Dent, A.J.; Cavill, S.I.; Hodson, M.E.; Kirk, C.A.; Schofield, P.F. The first environmental science experiments on the new microfocus spectroscopy beamline at Diamond. Mineral. Mag. 2008, 72, 197–200. [Google Scholar] [CrossRef]
  32. Mosselmans, J.F.W.; Quinn, P.D.; Dent, A.J.; Cavill, S.A.; Diaz-Moreno, S.; Peach, A.; Leicester, P.J.; Keylock, S.J.; Gregory, S.; Atkinson, K.D.; et al. I18-the microfocus spectroscopy beamline at the Diamond Light Source. J. Synchrotron Radiat. 2009, 16, 818–824. [Google Scholar] [CrossRef]
  33. Ravel, B.; Newville, M. ATHENA, ARTEMIS, HEPHAESTUS: Data analysis for X-ray absorption spectroscopy using IFEFFIT. J. Synchrotron Radiat. 2005, 12, 537–541. [Google Scholar] [CrossRef] [Green Version]
  34. Lerotic, M.; Mak, R.; Wirick, S.; Meirer, F.; Jacobsen, C. MANTiS: A program for the analysis of X-ray spectromicroscopy data. J. Synchrotron Radiat. 2014, 21, 1206–1212. [Google Scholar] [CrossRef]
  35. Newsome, L.; Solano Arguedas, A.; Coker, V.S.; Boothman, C.; Lloyd, J.R. Manganese and cobalt redox cycling in laterites; Biogeochemical and bioprocessing implications. Chem. Geol. 2020, 531, 119330. [Google Scholar] [CrossRef]
  36. Lovley, D.R.; Phillips, E.J. Organic matter mineralization with reduction of ferric iron in anaerobic sediments. Appl. Environ. Microbiol. 1986, 51, 683–689. [Google Scholar] [CrossRef] [PubMed] [Green Version]
  37. Lovley, D.R.; Phillips, E.J.P. Rapid assay for microbially reducible ferric iron in aquatic sediments. Appl. Environ. Microbiol. 1987, 53, 1536–1540. [Google Scholar] [CrossRef] [PubMed] [Green Version]
  38. Caldeira, J.F.; (Vale, Belo Horizonte, Brazil). Relatorio Preliminar De Pesquisa Integrado, Processos DNPM 803.156/2009 E 803.158/2009, Municipio: Capitao Gervasio Oliveira—PI, Belo Horizonte. VALE Unpublished Internal Report. July 2012.
  39. Al-Khirbash, S. Geology, mineralogy, and geochemistry of low grade Ni-lateritic soil (Oman Mountains, Oman). Chem. Erde 2016, 76, 363–381. [Google Scholar] [CrossRef]
  40. Chassé, M.; Griffin, W.L.; O’Reilly, S.Y.; Calas, G. Australian laterites reveal mechanisms governing scandium dynamics in the critical zone. Geochim. Cosmochim. Acta 2019, 260, 292–310. [Google Scholar] [CrossRef] [Green Version]
  41. Chassé, M.; Griffin, W.L.; O’Reilly, S.Y.; Calas, G. Scandium speciation in a world-class lateritic deposit. Geochem. Perspect. Lett. 2017, 3, 105–114. [Google Scholar] [CrossRef] [Green Version]
  42. McDonough, W.F.; Sun, S.-S. The composition of the Earth. Chem. Geol. 1995, 120, 223–253. [Google Scholar] [CrossRef]
  43. Villanova-de-Benavent, C.; Domènech, C.; Tauler, E.; Galí, S.; Tassara, S.; Proenza, J.A. Fe-Ni-bearing serpentines from the saprolite horizon of Caribbean Ni-laterite deposits: New insights from thermodynamic calculations. Miner. Depos. 2017, 52, 979–992. [Google Scholar] [CrossRef]
  44. Schwartz, S.; Guillot, S.; Reynard, B.; Lafay, R.; Debret, B.; Nicollet, C.; Lanari, P.; Auzende, A.L. Pressure-temperature estimates of the lizardite/antigorite transition in high pressure serpentinites. Lithos 2013, 178, 197–210. [Google Scholar] [CrossRef] [Green Version]
  45. Lambiv Dzemua, G.L.; Gleeson, S.A. Petrography, mineralogy, and geochemistry of the Nkamouna serpentinite: Implications for the formation of the cobalt-Manganese laterite deposit, southeast Cameroon. Econ. Geol. 2012, 107, 25–41. [Google Scholar] [CrossRef]
  46. Putzolu, F.; Balassone, G.; Boni, M.; Maczurad, M.; Mondillo, N.; Najorka, J.; Pirajno, F. Mineralogical association and Ni-Co deportment in the Wingellina oxide-type laterite deposit (Western Australia). Ore Geol. Rev. 2018, 97, 21–34. [Google Scholar] [CrossRef]
  47. Roqué-Rosell, J.; Mosselmans, J.F.W.; Proenza, J.A.; Labrador, M.; Galí, S.; Atkinson, K.D.; Quinn, P.D. Sorption of Ni by “lithiophorite–asbolane” intermediates in Moa Bay lateritic deposits, eastern Cuba. Chem. Geol. 2010, 275, 9–18. [Google Scholar] [CrossRef]
  48. Santos, A.L.; Dybowska, A.; Schofield, P.F.; Herrington, R.J.; Johnson, D.B. Chromium (VI) Inhibition of low pH Bioleaching of Limonitic Nickel-Cobalt Ore. Front. Microbiol. 2022, 12, 802991. [Google Scholar] [CrossRef]
  49. Santos, A.L.; Dybowska, A.; Schofield, P.F.; Herrington, R.J.; Johnson, D.B. Sulfur-enhanced reductive bioprocessing of cobalt-bearing materials for base metals recovery. Hydrometallurgy 2020, 195, 105396. [Google Scholar] [CrossRef]
  50. Carvalho e Silva, M.L.M.d.; de Oliveira, S.M.B. As fases portadoras de níquel do minério laterítico de níquel do Vermelho, Serra dos Carajás (PA). Rev. Bras. Geociências 1995, 25, 69–78. [Google Scholar] [CrossRef]
  51. Ratié, G.; Garnier, J.; Calmels, D.; Vantelon, D.; Guimarães, E.; Monvoisin, G.; Nouet, J.; Ponzevera, E.; Quantin, C. Nickel distribution and isotopic fractionation in a Brazilian lateritic regolith: Coupling Ni isotopes and Ni K-edge XANES. Geochim. Cosmochim. Acta 2018, 230, 137–154. [Google Scholar] [CrossRef] [Green Version]
  52. Andersen, J.C.Ø.; Rollinson, G.K.; Snook, B.; Herrington, R.; Fairhurst, R.J. Use of QEMSCAN for the characterization of Ni-rich and Ni-poor goethite in laterite ores. Miner. Eng. 2009, 22, 1119–1129. [Google Scholar] [CrossRef]
  53. Dublet, G.; Juillot, F.; Brest, J.; Noël, V.; Fritsch, E.; Proux, O.; Olivi, L.; Ploquin, F.; Morin, G. Vertical changes of the Co and Mn speciation along a lateritic regolith developed on peridotites (New Caledonia). Geochim. Cosmochim. Acta 2017, 217, 1–15. [Google Scholar] [CrossRef]
  54. Burns, R.G. The uptake of cobalt into ferromanganese nodules, soils and synthetic manganese (IV) oxides. Geochim. Cosmochim. Acta 1976, 40, 95–102. [Google Scholar] [CrossRef]
  55. Manceau, A.; Llorca, S.; Calas, G. Crystal chemistry of cobalt and nickel in lithiophorite and asbolane from New Caledonia. Geochim. Cosmochim. Acta 1987, 51, 105–113. [Google Scholar] [CrossRef]
  56. Manceau, A.; Drits, V.A.; Silvester, E.; Bartoli, C.; Lanson, B. Structural mechanism of Co2+ oxidation by the phyllomanganate buserite. Am. Mineral. 1997, 82, 1150–1175. [Google Scholar] [CrossRef]
  57. Manceau, A.; Combes, J.M. Structure of the Mn and Fe oxides and oxyhydroxides: A topological approach by EXAFS. Phys. Chem. Miner. 1988, 15, 283–295. [Google Scholar] [CrossRef]
  58. Cressey, G.; Henderson, C.M.B.; van der Laan, G. Use of L-edge X-ray absorption spectroscopy to characterize multiple valence states of 3d transition metals; a new probe for mineralogical and geochemical research. Phys. Chem. Miner. 1993, 20, 111–119. [Google Scholar] [CrossRef]
  59. Schofield, P.F.; Henderson, C.M.B.; Cressey, G.; van der Laan, G. 2p X-ray absorption spectroscopy in the Earth sciences. J. Synchrotron Radiat. 1995, 2, 93–98. [Google Scholar] [CrossRef]
  60. Smith, A.D.; Schofield, P.F.; Cressey, G.; Cressey, B.A.; Read, P.D. The development of X-ray photo-emission electron microscopy (XPEEM) for valence-state imaging of mineral intergrowths. Mineral. Mag. 2004, 68, 859–869. [Google Scholar] [CrossRef]
  61. Schofield, P.F.; Smith, A.D.; Scholl, A.; Doran, A.; Covey-Crump, S.J.; Young, A.T.; Ohldag, H. Chemical and oxidation-state imaging of mineralogical intergrowths: The application of X-ray photo-emission electron microscopy (XPEEM). Coord. Chem. Rev. 2014, 277–278, 31–43. [Google Scholar] [CrossRef]
  62. Mulroy, D.S.J. The Microbiology of Lateritic Co-Ni-Bearing Manganese Oxides. Ph.D. Thesis, University of Manchester, Manchester, UK, 2020. [Google Scholar]
  63. Dublet, G.; Juillot, F.; Morin, G.; Fritsch, E.; Fandeur, D.; Ona-Nguema, G.; Brown, G.E., Jr. Ni speciation in a New Caledonia lateritic regolith: A quantitative X-ray absorption spectroscopy investigation. Geochim. Cosmochim. Acta 2012, 95, 119–133. [Google Scholar] [CrossRef]
  64. Perez, O.C.; Coto, J.M.; Schippers, A. Quantification of the microbial community in lateritic deposits. Integr. Sci. Ind. Knowl. Biohydrometall. 2013, 825, 33–36. [Google Scholar] [CrossRef]
  65. Algora, C.; Vasileiadis, S.; Wasmund, K.; Trevisan, M.; Krüger, M.; Puglisi, E.; Adrian, L. Manganese and iron as structuring parameters of microbial communities in Arctic marine sediments from the Baffin Bay. FEMS Microbiol. Ecol. 2015, 91, fiv056. [Google Scholar] [CrossRef]
  66. Carmichael, S.K.; Bräuer, S.L. Microbial Diversity and Manganese Cycling: A Review of Manganese-oxidizing Microbial Cave Communities. In Microbial Life of Cave Systems; Engel, A.S., Ed.; Walter de Gruyter Gmbh: Berlin, Germany; Boston, MA, USA, 2015; Chapter 3; pp. 137–160. [Google Scholar]
  67. Daims, H. The Family Nitrospiraceae. In The Prokaryotes; Springer: Berlin/Heidelberg, Germany, 2014; pp. 733–749. [Google Scholar] [CrossRef]
  68. Colmer, A.R. Relation of the iron oxidizer, Thiobacillus ferrooxidans, to thiosulfate. J. Bacteriol. 1962, 83, 761–765. [Google Scholar] [CrossRef] [Green Version]
  69. Hallberg, K.B.; Hedrich, S.; Johnson, D.B. Acidiferrobacter thiooxydans, gen. nov. sp. nov.; an acidophilic, thermo-tolerant, facultatively anaerobic iron- and sulfur-oxidizer of the family Ectothiorhodospiraceae. Extremophiles 2011, 15, 271–279. [Google Scholar] [CrossRef]
  70. Norris, P.R. Acidimicrobiia class. nov. In Bergey’s Manual of Systematics of Archaea and Bacteria; Trujillo, M.E., Dedysh, S., De Vos, P., Hedlund, B., Kämpfer, P., Rainey, F.A., Whitman, W.B., Eds.; John Wiley & Sons, Ltd.: Chichester, UK, 2015. [Google Scholar] [CrossRef]
  71. Pester, M.; Brambilla, E.; Alazard, D.; Rattei, T.; Weinmaier, T.; Han, J.; Lucas, S.; Lapidus, A.; Cheng, J.-F.; Goodwin, L.; et al. Complete genome sequences of Desulfosporosinus orientis DSM765T, Desulfosporosinus youngiae DSM17734T, Desulfosporosinus meridiei DSM13257T, and Desulfosporosinus acidiphilus DSM22704T. J. Bacteriol. 2012, 194, 6300–6301. [Google Scholar] [CrossRef] [PubMed] [Green Version]
  72. Senko, J.M.; Zhang, G.; McDonough, J.T.; Bruns, M.A.; Burgos, W.D. Metal Reduction at Low pH by a Desulfosporosinus species: Implications for the Biological Treatment of Acidic Mine Drainage. Geomicrobiol. J. 2009, 26, 71–82. [Google Scholar] [CrossRef]
  73. Dimkpa, C.; Svatos, A.; Merten, D.; Büchel, G.; Kothe, E. Hydroxamate siderophores produced by Streptomyces acidiscabies E13 bind nickel and promote growth in cowpea (Vigna unguiculata L.) under nickel stress. Can. J. Microbiol. 2008, 54, 163–172. [Google Scholar] [CrossRef] [PubMed]
  74. Dorsey, C.W.; Tomaras, A.P.; Connerly, P.L.; Tolmasky, M.E.; Crosa, J.H.; Actis, L.A. The siderophore-mediated iron acquisition systems of Acinetobacter baumannii ATCC 19606 and Vibrio anguillarum 775 are structurally and functionally related. Microbiology 2004, 150, 3657–3667. [Google Scholar] [CrossRef] [Green Version]
  75. Kloepper, J.W.; Leong, J.; Teintze, M.; Schroth, M.N. Enhanced plant growth by siderophores produced by plant growth-promoting rhizobacteria. Nature 1980, 286, 885–886. [Google Scholar] [CrossRef]
  76. Podschun, R.; Fischer, A.; Ullmann, U. Siderophore production of Klebsiella species Isolated from Different Sources. Zent. Bakteriol. 1992, 276, 481–486. [Google Scholar] [CrossRef]
  77. Chen, W.-M.; Moulin, L.; Bontemps, C.; Vandamme, P.; Béna, G.; Boivin-Masson, C. Legume symbiotic nitrogen fixation by beta-proteobacteria is widespread in nature. J. Bacteriol. 2003, 185, 7266–7272. [Google Scholar] [CrossRef] [Green Version]
  78. Videira, S.S.; de Araujo, J.L.S.; da Silva Rodrigues, L.; Baldani, V.L.D.; Baldani, J.I. Occurrence and diversity of nitrogen-fixing Sphingomonas bacteria associated with rice plants grown in Brazil. FEMS Microbiol. Lett. 2009, 293, 11–19. [Google Scholar] [CrossRef] [Green Version]
  79. Prosser, J.I.; Head, I.M.; Stein, L.Y. The Family Nitrosomonadaceae. In The Prokaryotes; Rosenberg, E., De Long, E.F., Lory, S., Stackebrandt, E., Thompson, F., Eds.; Springer: Berlin/Heidelberg, Germany, 2014; pp. 901–918. [Google Scholar] [CrossRef]
  80. Stieglmeier, M.; Klingl, A.; Alves, R.J.E.; Rittmann, S.K.-M.R.; Melcher, M.; Leisch, N.; Schleper, C. Nitrososphaera viennensis gen. nov.; sp. nov.; an aerobic and mesophilic, ammonia-oxidizing archaeon from soil and a member of the archaeal phylum Thaumarchaeota. Int. J. Syst. Evol. Microbiol. 2014, 64, 2738–2752. [Google Scholar] [CrossRef]
  81. Baldani, J.I.; Rouws, L.; Cruz, L.M.; Olivares, F.L.; Schmid, M.; Hartmann, A. The Family Oxalobacteraceae. In The Prokaryotes; Springer: Berlin/Heidelberg, Germany, 2014; pp. 919–974. [Google Scholar] [CrossRef]
  82. Du, Y.; Yu, X.; Wang, G. Massilia tieshanensis sp. nov.; isolated from mining soil. Int. J. Syst. Evol. Microbiol. 2012, 62, 2356–2362. [Google Scholar] [CrossRef] [Green Version]
  83. Alori, E.T.; Glick, B.R.; Babalola, O.O. Microbial phosphorus solubilization and its potential for use in sustainable agriculture. Front. Microbiol. 2017, 8, 971. [Google Scholar] [CrossRef] [Green Version]
  84. Ahmed, E.; Holmström, S.J.M. Siderophores in environmental research: Roles and applications. Microb. Biotechnol. 2014, 7, 196–208. [Google Scholar] [CrossRef]
  85. Babechuk, M.G.; Widdowson, M.; Kamber, B.S. Quantifying chemical weathering intensity and trace element release from two contrasting basalt profiles, Deccan Traps, India. Chem. Geol. 2014, 363, 56–75. [Google Scholar] [CrossRef]
  86. Tupaz, C.A.J.; Watanabe, Y.; Sanematsu, K.; Echigo, T.; Arcilla, C.; Ferrer, C. Ni-Co Mineralization in the Intex Laterite Deposit, Mindoro, Philippines. Minerals 2020, 10, 579. [Google Scholar] [CrossRef]
  87. Galí, S.; Soler, J.M.; Proenza, J.A.; Lewis, J.F.; Cama, J.; Tauler, E. Ni-enrichment and stability of Al-free garnierite solid-solutions: A thermodynamic approach. Clays Clay Miner. 2012, 60, 121–135. [Google Scholar] [CrossRef] [Green Version]
  88. Elias, M.; Donaldson, M.J.; Giorgetta, N. Geology, Mineralogy, and Geochemistry of Lateritic Nickel-Cobalt Deposits near Kalgoorlie, Western Australia. Econ. Geol. 1981, 76, 1775–1783. [Google Scholar] [CrossRef]
  89. Al-Khirbash, S.; Semhi, K.; Richard, L.; Nasir, S.; Al-Harthy, A. Rare earth element mobility during laterization of mafic rocks of the Oman ophiolite. Arab. J. Geosci. 2014, 7, 5443–5454. [Google Scholar] [CrossRef]
  90. Murray, K.J.; Webb, S.M.; Bargar, J.R.; Tebo, B.M. Indirect oxidation of Co(II) in the presence of the marine Mn (II)-oxidizing bacterium Bacillus sp. Strain SG-1. Appl. Environ. Microbiol. 2007, 73, 6905–6909. [Google Scholar] [CrossRef] [Green Version]
  91. Miller, G.W.; Sampson, D.; Fleay, J.; Conway-Mortimer, J.; Roche, E. Ravensthorpe nickel project beneficiation prediction MLR and interpretation of results. In Proceedings of the International Laterite Nickel Symposium, Charlotte, NC, USA, 14–18 March 2004; pp. 121–136. [Google Scholar]
  92. Dowding, C.E.; Fey, M.V. Morphological, chemical and mineralogical properties of some manganese-rich oxisols derived from dolomite in Mpumalanga province, South Africa. Geoderma 2007, 141, 23–33. [Google Scholar] [CrossRef]
  93. Stanković, S.; Martin, M.; Goldmann, S.; Gäbler, H.-E.; Ufer, K.; Haubrich, F.; Moutinho, V.F.; Giese, E.C.; Neumann, R.; Stropper, J.L.; et al. Effect of mineralogy on Co and Ni extraction from Brazilian limonitic laterites via bioleaching and chemical leaching. Miner. Eng. 2022, 184, 107604. [Google Scholar] [CrossRef]
  94. Smith, S.L.; Grail, B.M.; Johnson, D.B. Reductive bioprocessing of cobalt-bearing limonitic laterites. Miner. Eng. 2017, 106, 86–90. [Google Scholar] [CrossRef]
  95. Lane, D.J. 16S/23S rRNA sequencing. In Nucleic Acid Techniques in Bacterial Systematics; Stackebrant, E., Goodfellow, M., Eds.; John Wiley & Sons Ltd.: London, UK, 1991; pp. 115–175. [Google Scholar]
  96. Caporaso, J.G.; Lauber, C.L.; Walters, W.A.; Berg-Lyons, D.; Huntley, J.; Fierer, N.; Owens, S.M.; Betley, J.; Fraser, L.; Bauer, M.; et al. Ultra-high-throughput microbial community analysis on the Illumina HiSeq and MiSeq platforms. ISME J. 2012, 6, 1621–1624. [Google Scholar] [CrossRef] [Green Version]
  97. Caporaso, J.G.; Lauber, C.L.; Walters, W.A.; Berg-Lyons, D.; Lozupone, C.A.; Turnbaugh, P.J.; Fierer, N.; Knight, R. Global patterns of 16S rRNA diversity at a depth of millions of sequences per sample. Proc. Natl. Acad. Sci. USA 2010, 108, 4516–4522. [Google Scholar] [CrossRef]
  98. Kozich, J.J.; Westcott, S.L.; Baxter, N.T.; Highlander, S.K.; Schloss, P.D. Development of a dual-index sequencing strategy and curation pipeline for analyzing amplicon sequence data on the MiSeq Illumina sequencing platform. Appl. Environ. Microbiol. 2013, 79, 5112–5120. [Google Scholar] [CrossRef] [Green Version]
  99. Martin, M. Cutadapt removes adapter sequences from high-throughput sequencing reads. EMBnet J. 2011, 17, 10. [Google Scholar] [CrossRef]
  100. Joshi, N.A.; Fass, J.N. Sickle: A Sliding-Window, Adaptive, Quality-Based Trimming Tool for FastQ Files. 2011. Available online: http://github.com/najoshi/sickle (accessed on 31 August 2017).
  101. Nurk, S.; Bankevich, A.; Antipov, D.; Gurevich, A.A.; Korobeynikov, A.; Lapidus, A.; Prjibelski, A.D.; Pyshkin, A.; Sirotkin, A.; Sirotkin, Y.; et al. Assembling single-cell genomes and mini-metagenomes from chimeric MDA products. J. Comput. Biol. 2013, 20, 714–737. [Google Scholar] [CrossRef] [Green Version]
  102. Masella, A.P.; Bartram, A.K.; Truszkowski, J.M.; Brown, D.G.; Neufeld, J.D. PANDAseq: Paired-end assembler for Illumina sequences. BMC Bioinf. 2012, 13, 31. [Google Scholar] [CrossRef] [Green Version]
  103. Haas, B.J.; Gevers, D.; Earl, A.M.; Feldgarden, M.; Ward, D.V.; Giannoukos, G.; Ciulla, D.; Tabbaa, D.; Highlander, S.K.; Sodergren, E.; et al. Chimeric 16S rRNA sequence formation and detection in Sanger and 454-pyrosequenced PCR amplicons. Genome Res. 2011, 21, 494–504. [Google Scholar] [CrossRef] [Green Version]
  104. Edgar, R.C. UPARSE: Highly accurate OUT sequences from microbial amplicon reads. Nat. Methods 2013, 10, 996–998. [Google Scholar] [CrossRef]
  105. Edgar, R.C. Search and clustering orders of magnitude faster than BLAST. Bioinformatics 2010, 26, 2460–2461. [Google Scholar] [CrossRef] [Green Version]
  106. Caporaso, J.G.; Kuczynski, J.; Stombaugh, J.; Bittinger, K.; Bushman, F.D.; Costello, E.K.; Fierer, N.; Peña, A.G.; Goodrich, J.K.; Gordon, J.I.; et al. QIIME allows analysis of high-throughput community sequencing data. Nat. Methods 2010, 7, 335–336. [Google Scholar] [CrossRef] [PubMed] [Green Version]
  107. Wang, Q.; Garrity, G.M.; Tiedje, J.M.; Cole, J.R. Naive Bayesian classifier for rapid assignment of rRNA sequences into the new bacterial taxonomy. Appl. Environ. Microbiol. 2007, 73, 5261–5267. [Google Scholar] [CrossRef] [PubMed] [Green Version]
  108. Brown, A.E.; Muthumeenakshi, S.; Sreenivasaprasad, S.; Mills, P.R.; Swinburne, T.R. A PCR primer-specific to Cylindro-carpon heteronema for detection of the pathogen in apple wood. FEMS Microbiol. Lett. 1993, 108, 117–120. [Google Scholar] [CrossRef] [PubMed]
  109. Gardes, M.; Bruns, T.D. ITS primers with enhanced specificity for basidiomycetes--application to the identification of my-corrhizae and rusts. Mol. Ecol. 1993, 2, 113–118. [Google Scholar] [CrossRef]
  110. Taylor, D.L.; Walters, W.A.; Lennon, N.J.; Bochicchio, J.; Krohn, A.; Caporaso, J.G.; Pennanen, T. Accurate estimation of fun-gal diversity and abundance through improved lineage-specific primers optimized for Illumina amplicon sequencing. Appl. Environ. Microbiol. 2016, 82, 7217–7226. [Google Scholar] [CrossRef] [Green Version]
  111. Gweon, H.S.; Oliver, A.; Taylor, J.; Booth, T.; Gibbs, M.; Read, D.S.; Griffiths, R.I.; Schonrogge, K. PIPITS: An automated pipeline for analyses of fungal internal transcribed spacer sequences from the Illumina sequencing platform. Methods Ecol. Evol. 2015, 6, 973–980. [Google Scholar] [CrossRef] [Green Version]
  112. Edgar, R.C.; Haas, B.J.; Clemente, J.C.; Quince, C.; Knight, R. UCHIME improves sensitivity and speed of chimera detection. Bioinformatics 2011, 27, 2194–2200. [Google Scholar] [CrossRef] [Green Version]
  113. Borneman, J.; Triplett, E.W. Molecular microbial diversity in soils from eastern Amazonia: Evidence for unusual microorganisms and microbial population shifts associated with deforestation. Appl. Environ. Microbiol. 1997, 63, 2647–2653. [Google Scholar] [CrossRef] [Green Version]
  114. Wirth, F.; Goldani, L.Z. Epidemiology of Rhodotorula: An emerging pathogen. Interdiscip. Perspect. Infect. Dis. 2012, 465717. [Google Scholar] [CrossRef] [Green Version]
  115. MacGillivray, A.R.; Shiaris, M.P. Biotransformation of polycyclic aromatic hydrocarbons by yeasts isolated from coastal sediments. Appl. Environ. Microbiol. 1993, 59, 1613–1618. [Google Scholar] [CrossRef] [Green Version]
  116. Jurjevic, Z.; Peterson, S.W.; Horn, B.W. Aspergillus section Versicolores: Nine new species and multilocus DNA sequence based phylogeny. IMA Fungus 2012, 3, 59–79. [Google Scholar] [CrossRef]
  117. Giraldo, A.; Gené, J.; Sutton, D.A.; Madrid, H.; Cano, J.; Crous, P.W.; Guarro, J. Phylogenetic circumscription of Arthrographis (Eremomycetaceae, Dothideomycetes). Persoonia 2014, 32, 102–114. [Google Scholar] [CrossRef]
Figure 1. (A) The Amazonian, São Luis, São Francisco and Rio de la Plata continental cratons of South America with the poorly exposed areas indicated with dashed lines and the location of the Piauí laterite shown by a star. Modified after [24]. (B) A geological map of the Brejo Seco Complex with the location of the Piauí deposit shown by a star. Modified after [25].
Minerals 12 01298 g001
Figure 2. Profile of the Piauí deposit showing the rock units used during fieldwork ((A) looking west; (B) looking southwest). Unit indicated with # is a silicified ferruginous saprolite (scale bar = 3 m).
Minerals 12 01298 g002
Figure 3. Details from the rock units observed in the profile of the Piauí deposit (A) Contact between the saprock and the overlying siliceous saprolite. Scale bar is 1.5 m. (B,C) Examples of the green saprolite components within the siliceous Fe-saprolite. Scale bar on B is 1 m. (D) Green saprolite layer with white-green margins. Scale bar is 1 m. (E) Thick desiccating black coating on kaolinite rich white-green saprolite.
Minerals 12 01298 g003
Figure 4. Veining and boxwork textures from the saprolite units observed in the profile of the Piauí deposit (A) Finely meshed silica boxwork within the silicified Fe-saprolite. (B) Flat and steeply dipping, clay-rich, green saprolite veins commonly observed throughout the ferruginous saprolite units. Scale bar is 30 cm. (C) Discrete fine-scale silica veining within the silicified ferruginous saprolite. Scale bar is 15 cm. (D) Silicification within the silicified ferruginous saprolite facilitated by the discrete fine-scale, late-stage silica veins. (EG) Examples of black mineral aggregates and coatings associated with the white-green saprolitic layers. Scale bar is 50 cm in (E) and (F).
Minerals 12 01298 g004
Figure 5. (AD) Concentrations of Ni, Co, MnO and ΣREE plotted against wt% Fe2O3. (EI) Concentrations of Co, Ni, Cu, Zn and ΣREE as a function of wt% MnO. The dotted lines represent the equal residual enrichment trends e.g., [15] qualitatively showing relative enrichment with respect to the serpentinite.
Minerals 12 01298 g005
Figure 6. Chondrite normalised REE plots averaged within the profile units. REE concentrations are normalised to the CM values of [42].
Minerals 12 01298 g006
Figure 7. Representative XRD patterns from the different lithological units of the Piauí deposit (right). The XRD patterns are plotted with a stylized schematic profile for the Piauí laterite (left) and the associated average Co, Ni and Mn contents from Table 4 (centre). NB this is not a true representation of the profile of the deposit; the Piauí laterite is vertically and horizontally variable and the schematic shown here condenses the major features into a single representative profile. XRD patterns are from samples (top to bottom): SAPFE (F019), SAPSILFE (F043), SAPAL (F014), SAPMG (F006), SAPAL (F015), SAPSILFE (F030), green silica nodules (F008), saprock (F017), serpentinite (F046). chl = chlorite, lz = lizardite, ka = kaolinite, qz = quartz, sap = saponite, gt = goethite, hem = hematite, mg = maghemite.
Minerals 12 01298 g007
Figure 8. Photomicrographs of the serpentinite protolith. (A) Serpentinised olivine minerals (Serp) displaying meshwork textures. Secondary magnetite (Mag) has formed in fractures along serpentine grain boundaries. (B) Pseudomorph replacement of olivine by iron oxides (Hem = hematite). (C) Faulted fibrous chrysotile (Chry) veins and deformed secondary magnetite crystals suggesting local tectonic activity. (D) Talc (Tlc) replacement of serpentine minerals within chrysotile veins.
Minerals 12 01298 g008
Figure 9. (A,B) SEM backscatter electron (BSE) images of small neoformed grains of Co enriched magnetite within a serpentine matrix within the serpentinite protolith. (C,D) Element maps ((CEDX) red = Cr; green = Fe; (D) blue = Ni) of highly altered relict chromite grains with outer rims of newly formed Ni enriched Fe-oxides.
Minerals 12 01298 g009
Figure 10. BSE images of the four main textures of Mn oxy-hydroxide grains within the Piauí profile, as described in the text. (AC) are from SAPMG and (D) is form SAPFE.
Minerals 12 01298 g010
Figure 11. (A) Relative contents of Al, Ni and Co (wt%) measured by EMPA in Mn oxy-hydroxide grains from three units of the Piauí profile, and (B) the Co content (wt%) in the romanechite Mn oxy-hydroxide grains separated by Ba concentration. The Ba content cut-off between romanechite-I and romanechite-II was 2 wt%.
Minerals 12 01298 g011
Figure 12. Relationship between (A) Co and Mn, (B) Co and Ni, and (C) Ni and Mn as measured by EMPA in goethite grains from the saprolitic units of the Piauí profile.
Minerals 12 01298 g012
Figure 13. (Left) Al, Si, Ni and Mg element maps overlain the secondary electron (SE) image of Co enriched Ni silicate inclusions within the chlorite of SAPMG sample F002. (Right) Cobalt levels from EMPA analyses of the Co enriched Ni silicate inclusions. Blue filled circles = nimite, brown filled circles = chlorite.
Minerals 12 01298 g013
Figure 14. Partitioning of Ni within the silicate minerals across the Piauí laterite profile. The chlorite analyses all come from the SAPMG lithology. The Ni-rich serpentine analyses come from serpentinite-II, mostly in the SAPMG lithology and occasionally in the serpentinite. The low Ni analyses come from serpentine-I in the serpentinite.
Minerals 12 01298 g014
Figure 15. BSE images of silica nodules with (A) nickeloan talc and (B) pimelite.
Minerals 12 01298 g015
Figure 16. (A) Co K-edge XANES spectra of standards heterogenite, erythrite and synthetic Co-doped goethite plotted with those for 4 asbolane-lithiophorite grains. (B) EXAFS spectra for the same asbolane-lithiophorite intermediates points as shown in (A). (C) Fourier transforms of the Co EXAFS spectra from (B). Dashed lines in (B,C) are the modelled fits to the experimental data (solid lines).
Minerals 12 01298 g016
Figure 17. (A) L2,3 XANES spectra for Co extracted from STXM image stacks. The positions of the absorption maxima associated with Co2+ and Co3+ are indicated on the spectra plot. (B) Oxidation state images showing the distribution of Co2+ (top) and Co3+ (bottom) within the Mn oxy-hydroxide grain from sample F033. The points from which the spectra have been extracted are shown on the oxidation state images.
Minerals 12 01298 g017
Figure 18. (A) Ni K-edge XANES spectra of 4 asbolane-lithiophorite intermediate grains from sample F033. (B) EXAFS spectra for the same asbolane-lithiophorite intermediates points as shown in (A). (C) Fourier transforms of the Ni EXAFS spectra from (B). Dashed lines in (B) and (C) are the modelled fits to the experimental data (solid lines).
Minerals 12 01298 g018
Figure 19. (A) Prokaryote community composition at the phylum/class level, sequences > 1% in at least one sample shown. (B) Rarefaction curve for prokaryotes. (C) Fungal community composition at the class level.
Minerals 12 01298 g019
Figure 20. (A) Wt% SiO2-Al2O3-Fe2O3 (SAF) ternary plot showing the alteration trend during laterisation of the dunite protolith (dotted arrow) and the subsequent impact of late stage silicification (dashed arrow). (B,C) Molar ternary plots in UMIA space (SiO2-MgO-Fe2O3-Al2O3) showing the weathering trends of the dunite and troctolitic intercalations. (B) Highlighting the changed trend due to silicification of the SAPFE unit. Gold star represents average troctolite composition from [27]. (C) The bauxitisation trend associated with the formation of SAPMG and SAPAL compared to the laterisation process of the saprock SAPFE and SAPSILFE units.
Minerals 12 01298 g020
Table 1. Bulk chemical analyses of the Piauí laterite samples Serpentinite, Saprock, SAPFE, SAPSILFE, Green Silica Nodules and Mn-Oxide (Additional elements are presented in (Table S1 of the Supplementary Materials).
AnalyteUnitSerpentiniteSaprockSAPFESAPSILFEGreen Silica Nodules Mn Oxide
F046F047F049F017F039F018F019F022F028F030F032F043F044F008F009F011F012F013F050
SiO2wt%38.740.139.137.438.812.624.722.220.548.228.645.964.388.494.192.890.5856.31
Fe2O3wt%11.659.7410.811.518.4556.93745.549.632.740.64023.30.373.480.710.721.2610.1
MnOwt%0.220.210.240.140.170.690.440.610.430.290.440.340.160.010.040.010.010.0240.3
Al2O3wt%2.32.312.111.192.335.793.974.675.063.584.692.452.520.10.040.010.120.143.39
CaOwt%0.040.060.050.020.040.030.030.040.040.040.080.020.020.040.020.010.020.010.05
MgOwt%34.834.634.935.726.56.1714.959.2510.43.47.990.512.484.190.651.42.165.292.01
Cr2O3wt%1.541.6551.830.891.584.22.943.093.52.682.621.741.70.020.0080.0040.0090.0190.167
TiO2wt%0.030.030.030.020.040.10.070.120.110.070.060.080.080.060.05<0.010.010.020.01
Niwt%0.3290.3450.3430.7320.8242.183.111.431.780.9111.330.3940.2793.140.6831.1251.4151.9753.55
LOIwt%12.112.312.113.713.658.7511.811.98.737.5912.157.465.082.660.731.181.612.8513.35
Cdppm<0.5<0.51<0.50.6<0.51.71.41.80.60.8<0.50.51.90.71.11.21.53.8
Coppm
wt%
1381021301582248126286106163186321941362534947564.36
Cuppm
wt%
11151029957911601410723782671303713418157391722332861.02
Lippm<10<10<10<10<10<10<10<10<10<10<10<10<10<10<10<10<10<10<10
Moppm<1<11<123221<11321<1<1<11<1
Pbppm10392<24317<2<2314364440<2<20
Scppm5556626202120162119111<11258
Znppm1381451487111437978123334222829214113327123715469686
Ba
BaO
ppm
wt%
8.43.25.161.764.5157198129.5161165.526229.13873.82.62210.49.93
Ceppm0.80.40.6<0.51.9<0.5<0.51.46.12.416.614.88.9<0.50.30.10.40.21150
Dyppm0.130.260.21<0.050.330.140.40.361.370.512.311.361.770.12<0.05<0.050.060.0536.8
Erppm0.080.130.13<0.030.290.180.440.310.730.271.010.721.320.120.06<0.030.05<0.0318.5
Euppm0.090.120.1<0.030.190.050.130.10.50.190.770.320.46<0.03<0.03<0.03<0.03<0.0312.85
Gdppm0.210.240.350.050.560.150.290.291.860.782.661.171.990.10.1<0.050.06<0.0540.9
Hoppm0.040.050.050.020.060.060.080.110.260.120.430.260.390.040.020.010.010.026.62
Lappm0.80.50.7<0.52.6<0.51.31.411.1312.85.510.20.60.30.10.30.3255
Luppm0.020.030.030.020.030.070.050.070.110.050.130.150.180.030.020.01<0.010.022.45
Ndppm0.80.90.9<0.12.10.30.71.29.92.715.47.49.2<0.10.2<0.10.30.2265
Prppm0.20.160.18<0.030.43<0.030.060.21.980.793.021.421.95<0.030.04<0.030.060.0373.9
Smppm0.170.350.22<0.030.240.090.080.271.410.652.840.931.610.170.05<0.030.06<0.0356.9
Tbppm0.020.040.040.010.050.020.050.060.250.10.390.210.290.010.01<0.010.010.026.83
Tmppm0.030.030.02<0.010.030.050.030.030.090.050.110.110.190.010.010.010.020.012.89
Ybppm0.080.150.120.070.210.280.390.440.550.290.850.691.250.060.090.030.040.118.7
ΣREEppm3.473.363.650.179.021.3946.2436.2111.959.3235.0439.71.261.20.261.370.951947.34
Table 2. Bulk chemical analyses of the Piauí laterite samples SAPAL, SAPMG, magnesite and kaolinite (Additional elements are presented in Table S2 of the Supplementary Materials).
AnalyteUnitSAPALSAPMGMagnesiteKaolinite
F014F015F033F002F005F006F007F023F024F025F026F029F031F034F038F040F041F003F035
SiO2wt%44.446.8423137.432.636.642.538.538.131.531.233.934.33037.336.81.442.4
Fe2O3wt%7.323.367.54149.4711.97.3611.6514.611.1514.127.414.4516.23.289.637.820.210.3
MnOwt%0.340.42.210.310.060.340.40.110.250.130.430.250.790.890.230.10.390.010.3
Al2O3wt%24.927.92211.78.3613.7512.45.383.384.2414.253.3311.413.319.37.1311.60.0831
CaOwt%0.090.080.10.050.090.130.120.040.040.060.140.040.190.160.110.060.110.250.04
MgOwt%3.262.695.0919.518.616.915.5521.224.827.923.723.12113.0530.71713.0547.90.7
Cr2O3wt%0.120.020.050.240.790.120.130.512.041.230.051.530.060.240.070.870.150.010.43
TiO2wt%0.110.120.672.20.041.381.810.030.060.031.770.121.891.310.650.052.09<0.010.22
Niwt%1.6851.42.316.458.656.368.481.1052.112.671.281.8552.22.21.179.2280.03550.498
LOIwt%17.6516.8516.211.8514.114.115.0516.4514.4514.513.6511.7514.315.0514.9513.715.3551.114
Cdppm<0.5<0.50.72.10.92.33.40.61.62.21.31.41.91.41.41.22.6<0.5<0.5
Coppm8359962960124029554671510828918547346156151023639472813516
Cuppm88184811705076595936253533242944091140594151021182263266652
Lippm10102020201007030<1010801070601103060<10<10
Moppm2<1223321<1<11<111211<1<1
Pbppm4<2<21011810437277146<2<2<25
Scppm131329265292416993211601910624<116
Znppm317345394110050260972426816112617237829042934757373212169
Bappm31725136004430.877.690.646.867.984.120949.8537152078.232.913217.672.9
Ceppm64.719.76897.82.517.328.91.92.84.648.21.978.891.232.912.336.2<0.58.5
Dyppm32.82.7922.31.832.141420.71.250.921.164.030.448.964.247.812.9726.80.140.89
Erppm14.651.72101.091.277.2211.30.660.540.771.960.24.672.474.691.714.150.080.42
Euppm14.61.759.30.510.444.416.050.60.270.281.140.081.651.393.280.677.980.060.2
Gdppm50.83.9430.62.492.120.430.31.860.961.274.090.419.075.4915.252.7340.40.140.83
Hoppm6.050.63.930.410.452.854.330.250.240.250.770.081.760.91.650.655.380.020.15
Lappm29224.32076.991472113.22.82.911.12.326.723.7129.511.8260<0.52.9
Luppm1.80.31.180.130.220.671.310.070.110.080.230.040.690.330.440.291.390.020.08
Ndppm31221.722010.17.595.81117.42.22.917.91.636.124.692.112.9154.50.33.5
Prppm675.5448.61.821.882026.71.490.460.523.590.337.485.4719.252.4936.20.040.67
Smppm50.23.8435.62.211.4415.119.22.170.680.674.150.318.054.9211.52.3627.4<0.030.62
Tbppm60.564.060.340.372.653.80.270.130.190.650.071.430.751.40.444.90.020.14
Tmppm2.10.271.340.170.240.91.540.090.060.080.250.030.710.320.50.271.74<0.010.06
Ybppm11.71.68.610.731.455.228.510.450.430.431.890.214.212.113.131.669.090.030.44
ΣREEppm926.488.61129236.5331353.5484.621.6612.616.199.958190.3167.9323.453.23626.10.8519.4
Table 3. Definitions of the lithological units used in this work.
Lithological UnitDescription
SerpentiniteSerpentinised dunite source rock that maintains its broadly igneous though pseudomorphic texture and is geochemically described by MgO > ~35 wt%, SiO2 >~40 wt% and Al2O3 <~5 wt%.
SaprockHighly leached yellow to white adcumulate with MgO between 25 and 35 wt%, high SiO2 and low Al2O3.
SAPSILFESilicified ferruginous saprolite (silicious Fe-saprolite c/f Figure 2, Figure 3 and Figure 4) and is characterised by high Fe2O3 > ~25 wt% and high silica SiO2 >~ 25 wt%.
SAPMGPredominantly green saprolitic unit with MgO >~13 wt% and Al2O3 in the range 3–20 wt%.
SAPALWhite-green (occasionally pink) saprolitic unit with high Al2O3 >~20 wt% and low MgO <~5 wt%.
SAPFERed brown ferruginous saprolite with high iron oxide Fe2O3 > ~40 wt% and low silica SiO2 <~ 25 wt%.
COBUndifferentiated cover comprising an iron oxide sedimented breccia of silicified laterite.
Table 4. Average bulk chemistries in wt% for the Piauí laterite lithological units as described in this study and some green silica nodules from the SAPSILFE unit. F050 is an aggregate of black mineral grains and coatings within the SAPSILFE unit directly associated with a white-green SAPAL layers (see Figure 4F). * Co is listed in ppm except for ¥ where the value for F050 is in wt%.
Lithological UnitnSiO2Fe2O3MnOAl2O3MgOCaOCr2O3TiO2NiCo *
SAPFE420.0047.250.544.8710.190.043.430.102.13666
SAPMG1435.1212.360.339.9720.430.100.570.964.41485
SAPAL344.406.070.9824.933.680.090.060.301.801597
SAPSILFE446.7534.150.313.313.600.042.190.070.73320
Saprock238.1014.980.161.7631.100.031.240.030.78191
Serpentinite339.3010.730.222.2434.770.051.680.030.34123
F05016.3110.140.33.392.010.050.1670.013.554.36 ¥
Green silica nodules590.161.3080.0180.0822.7380.020.0120.0351.667636
Table 5. Average wt% chemical compositions of the main minerals in the serpentinite. n = number of EPMA analyses; nd = not detected; na = not analysed.
MineralnAl2O3MgOFe2O3Cr2O3SiO2MnONiCo
Ferritchromite812.033.9859.5829.69na2.670.160.06
Serpentine1060.4138.222.42nd44.82nd0.38nd
Hematite110nd1.0497.850.980.920.360.30nd
Magnetite48ndna51.71ndna0.108.931.18
Mn oxy-hydroxide870.88nd7.48ndnd28.056.617.41
Table 6. Host minerals for Co in the Piauí laterite profile. n = the total number of points analysed for each mineral across all samples tested. The average levels of MnO in manganoan goethite is 1.29 wt%, in manganoan ilmenite is 24.4 wt%, in aluminian chromite is 0.20 wt% and in ferritchromite is 2.67 wt%. Data are from EMPA analysis.
Mineral Concentration (wt%)
nMinMaxAverage
Mn oxy-hydroxide2840.3514.23.44
Manganoan goethite890.030.650.19
Magnetite520.411.891.14
Chlorite5520.030.450.05
Manganoan ilmenite420.040.350.12
Aluminian chromite1330.030.060.04
Ferritchromite630.030.160.06
Table 7. Host minerals for Ni in the saprolitic units of the Piauí laterite profile. n = the total number of points analysed for each mineral across all samples tested. Data are from EMPA analysis.
Mineral Concentration (wt%)
nMinMaxAverage
Chlorite5540.124.03.2 (med)
Nickeloan talc1015.815.313.5
Pimelite2819.525.021.7
Serpentine1540.043.520.40 (med)
Manganoan ilmenite660.031.360.35
Ilmenite1190.031.550.27
Aluminian chromite1580.080.180.13
Ferritchromite810.061.250.16
Goethite1160.039.01.32
Magnetite522.8414.18.60
Mn oxy-hydroxide2840.3518.88.49
Publisher’s Note: MDPI stays neutral with regard to jurisdictional claims in published maps and institutional affiliations.

