
A Near-Source Electromagnetic Method for Deep Ore Explorations

Abstract
:1. Introduction
2. Methodology
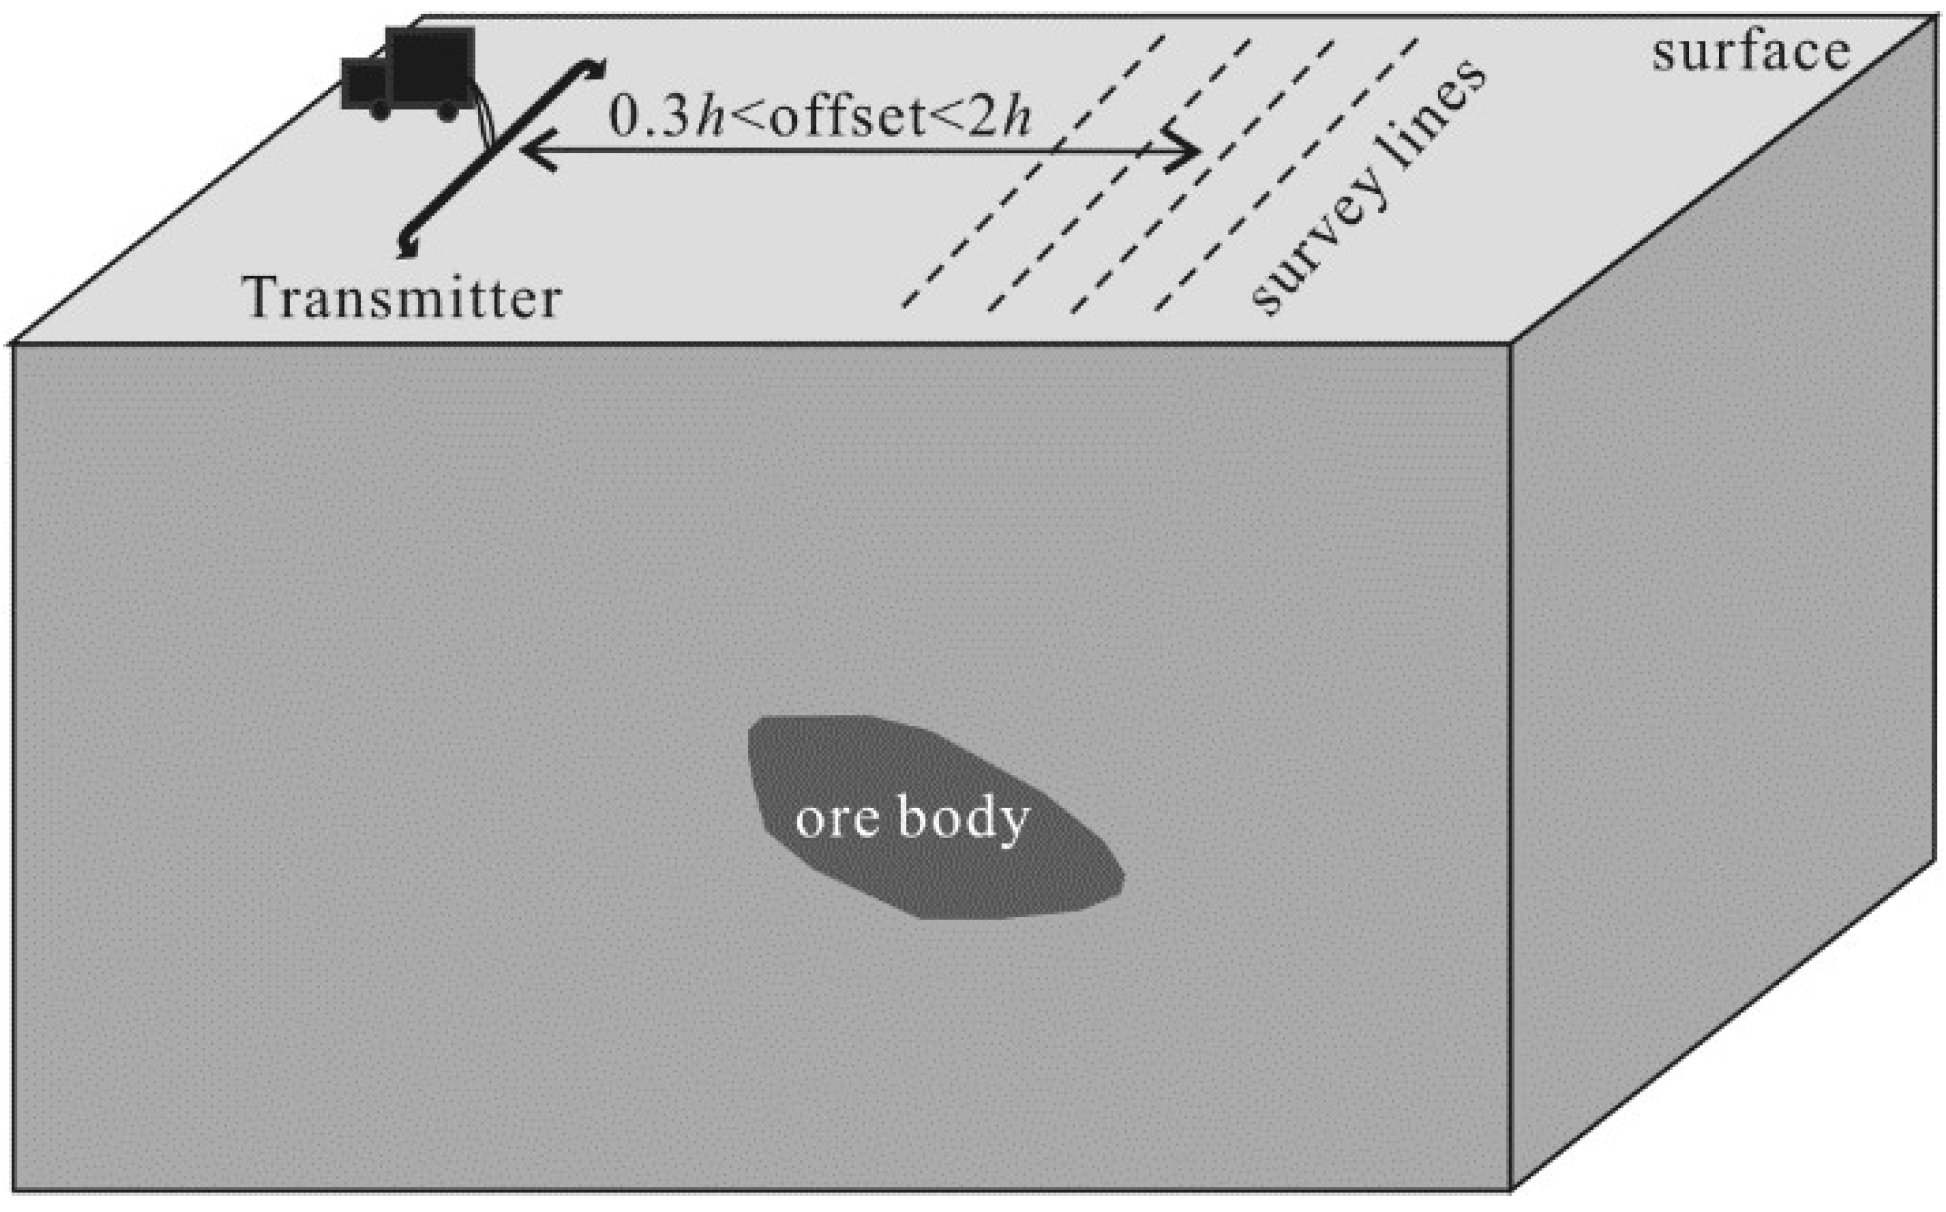
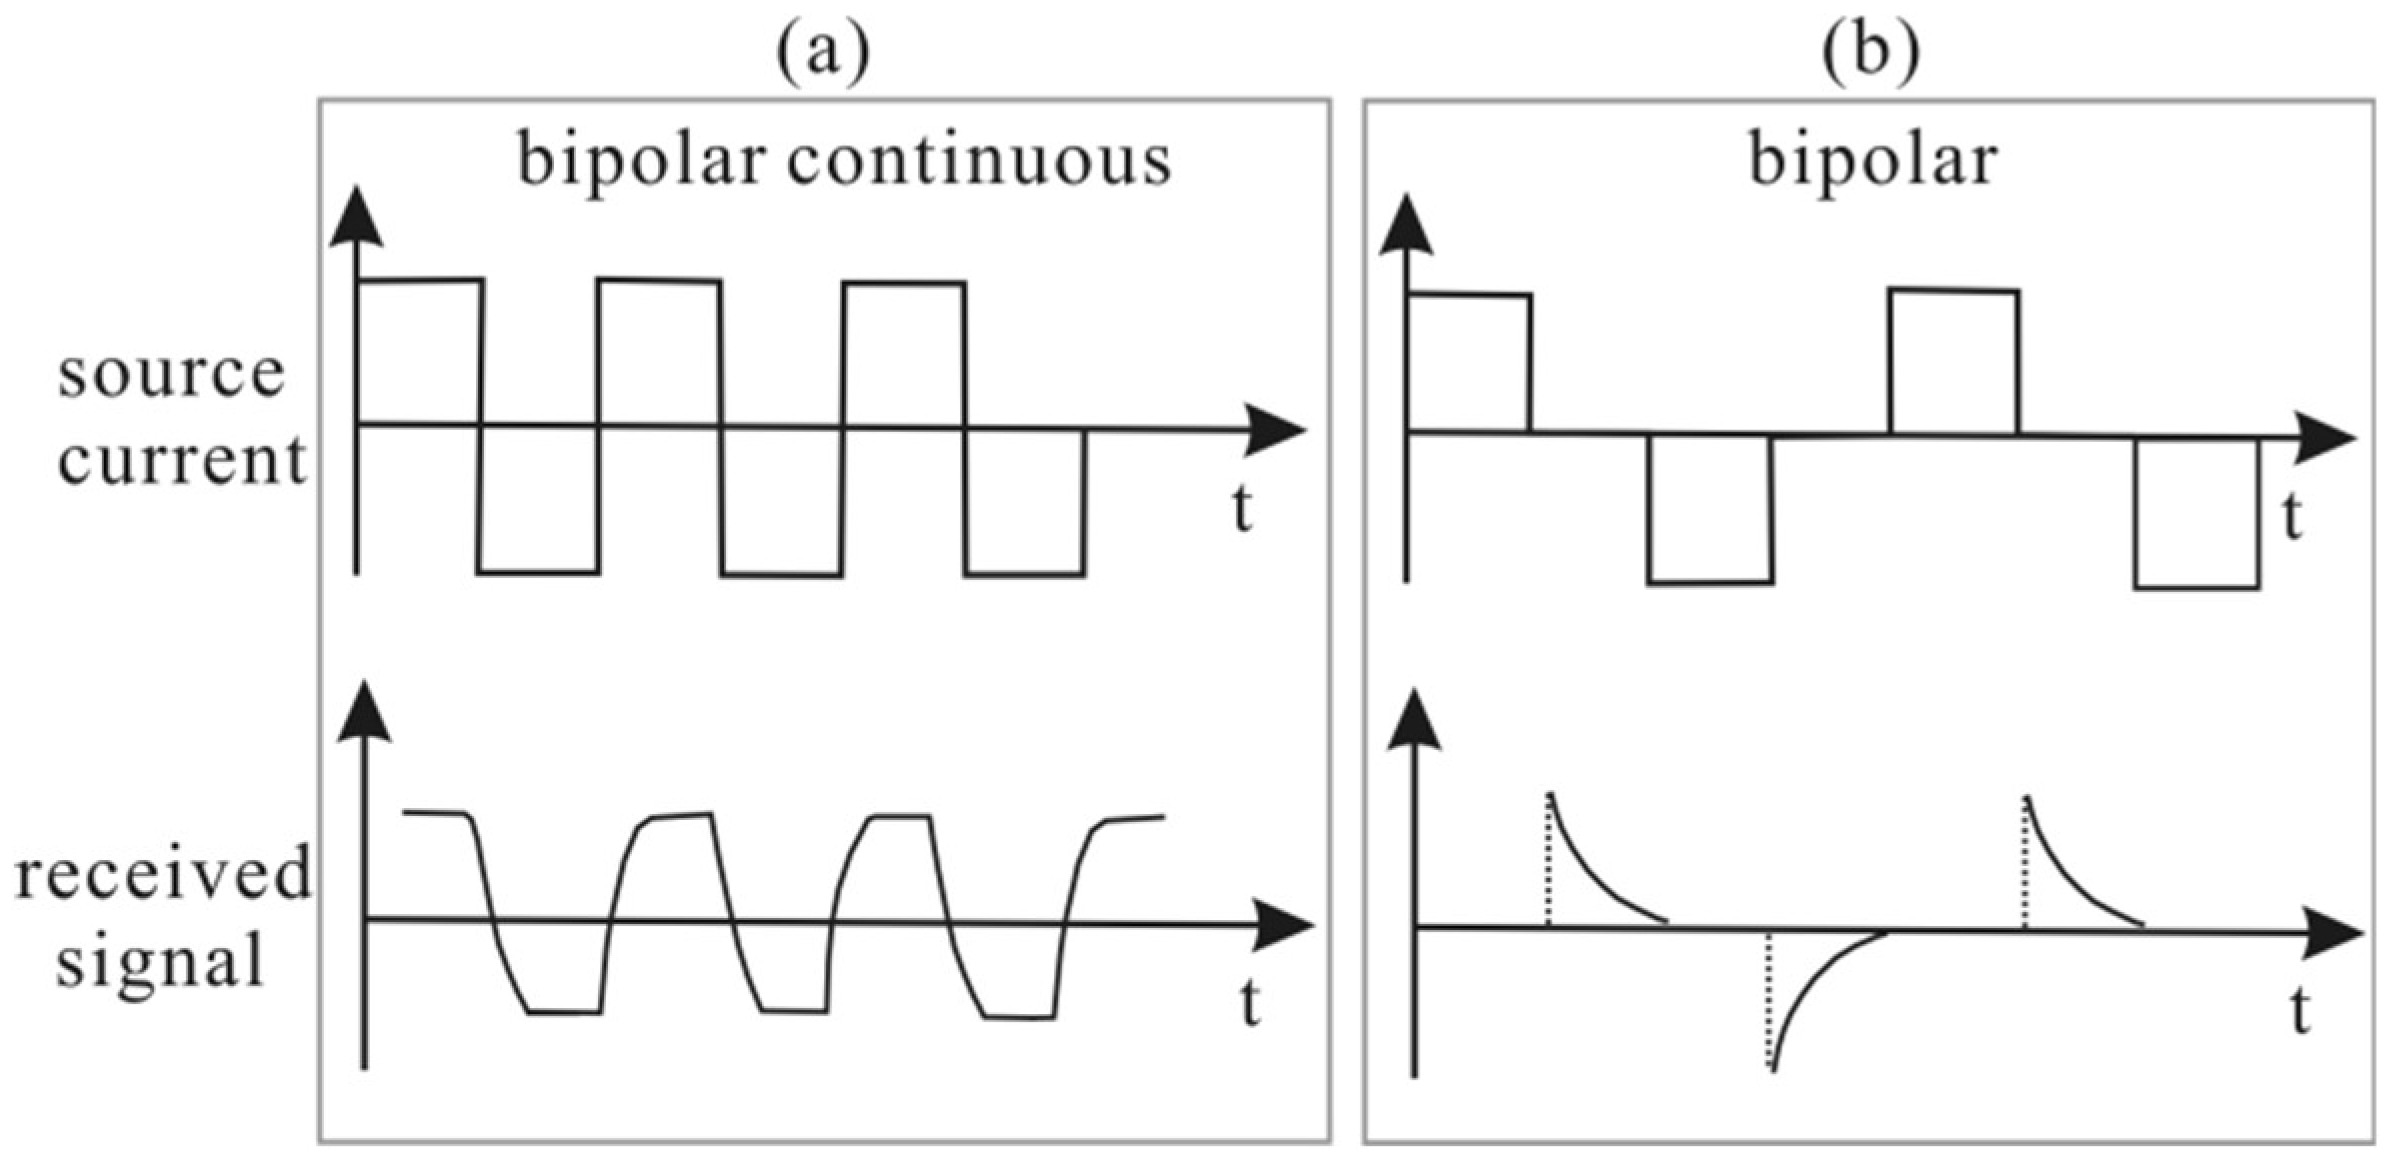
2.1. Introduction of SOTEM
2.2. Data Inversion
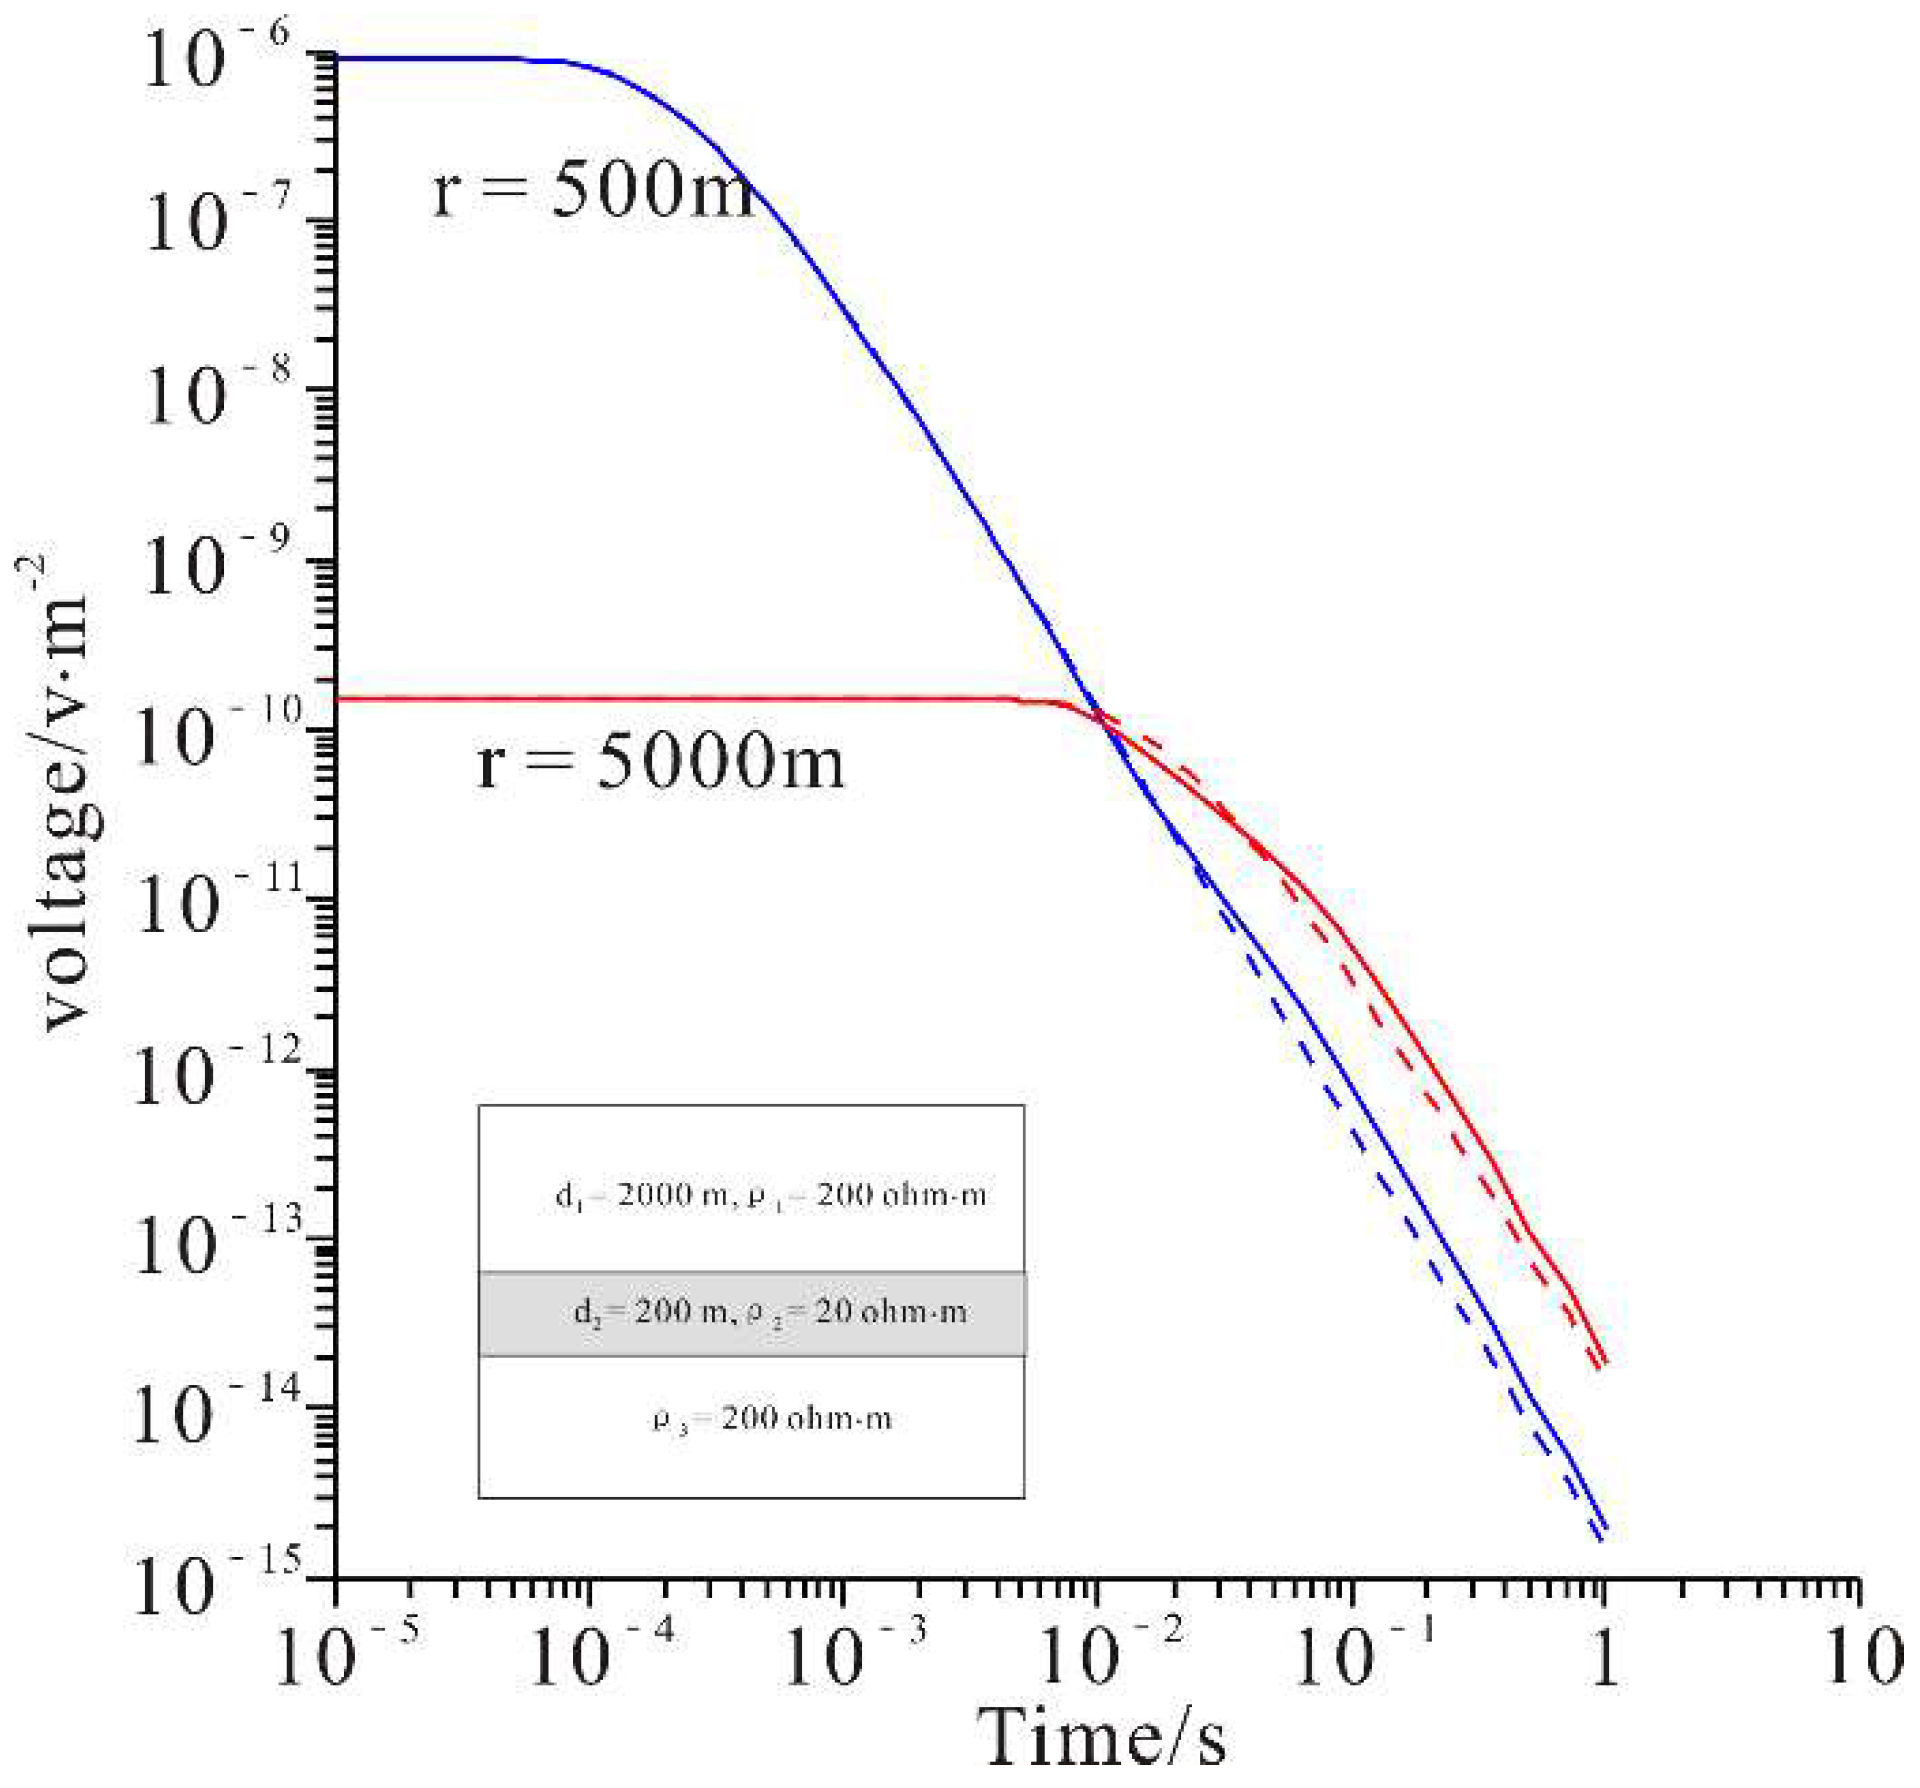
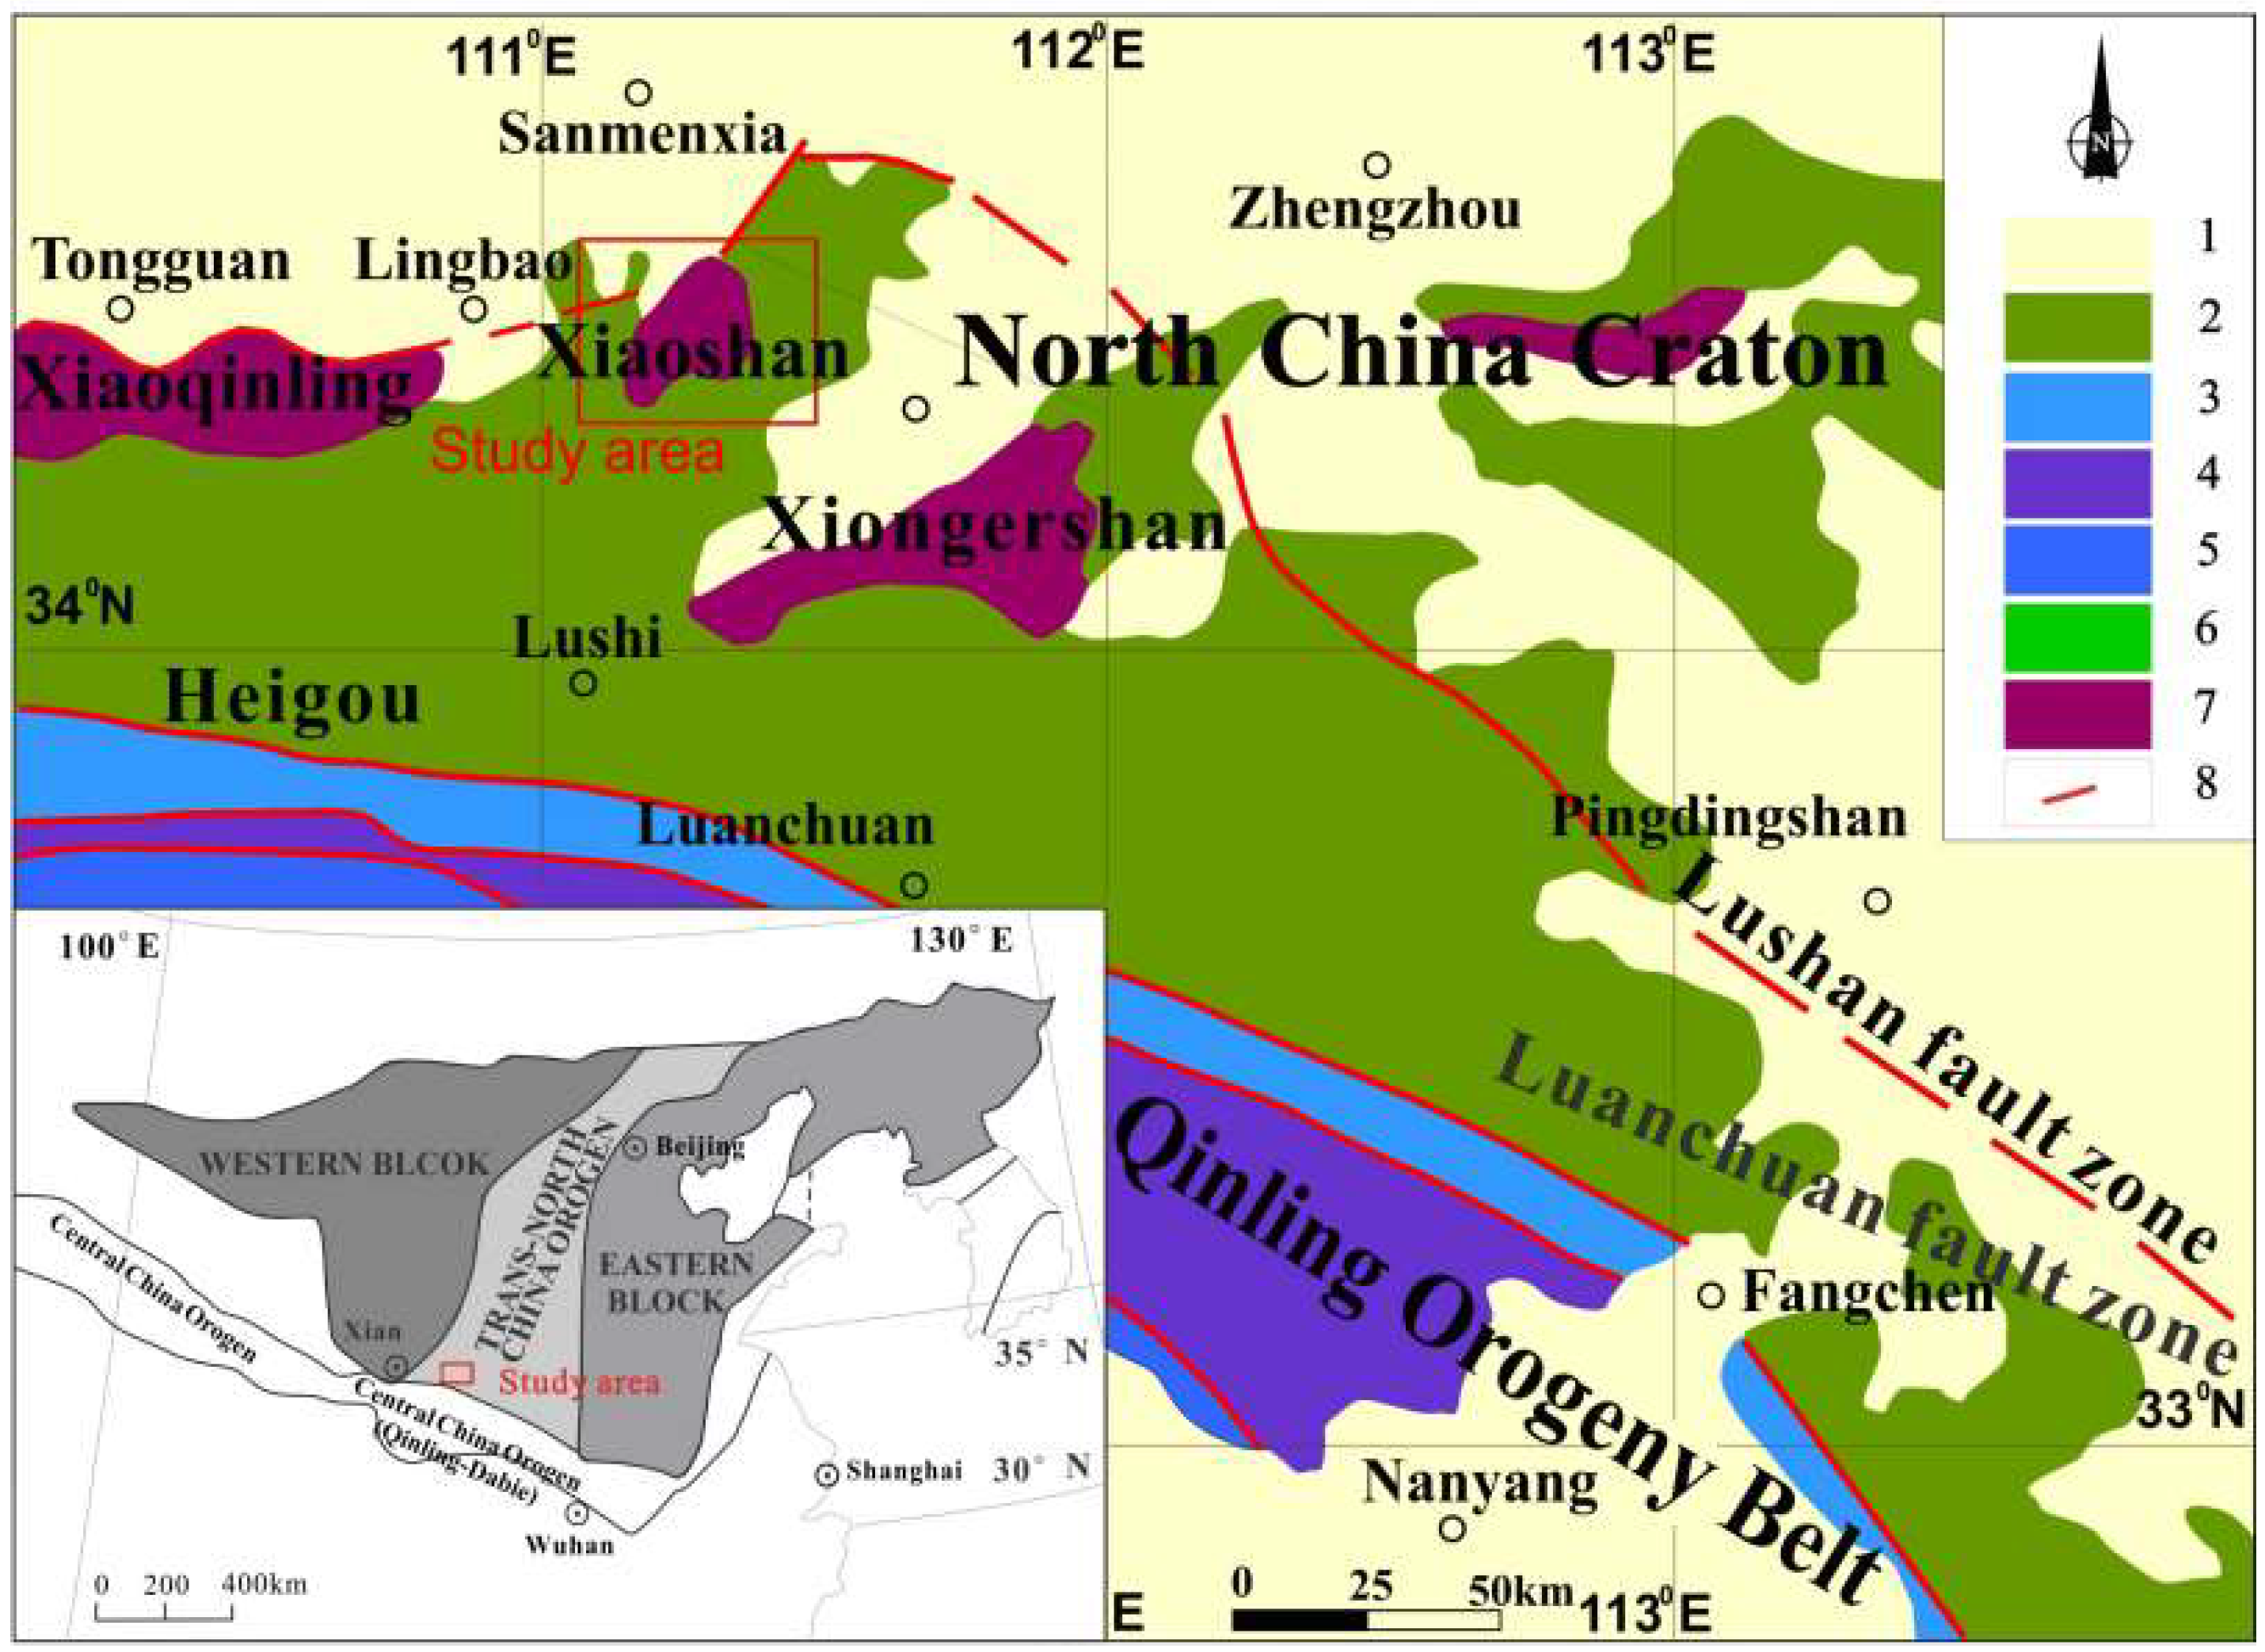
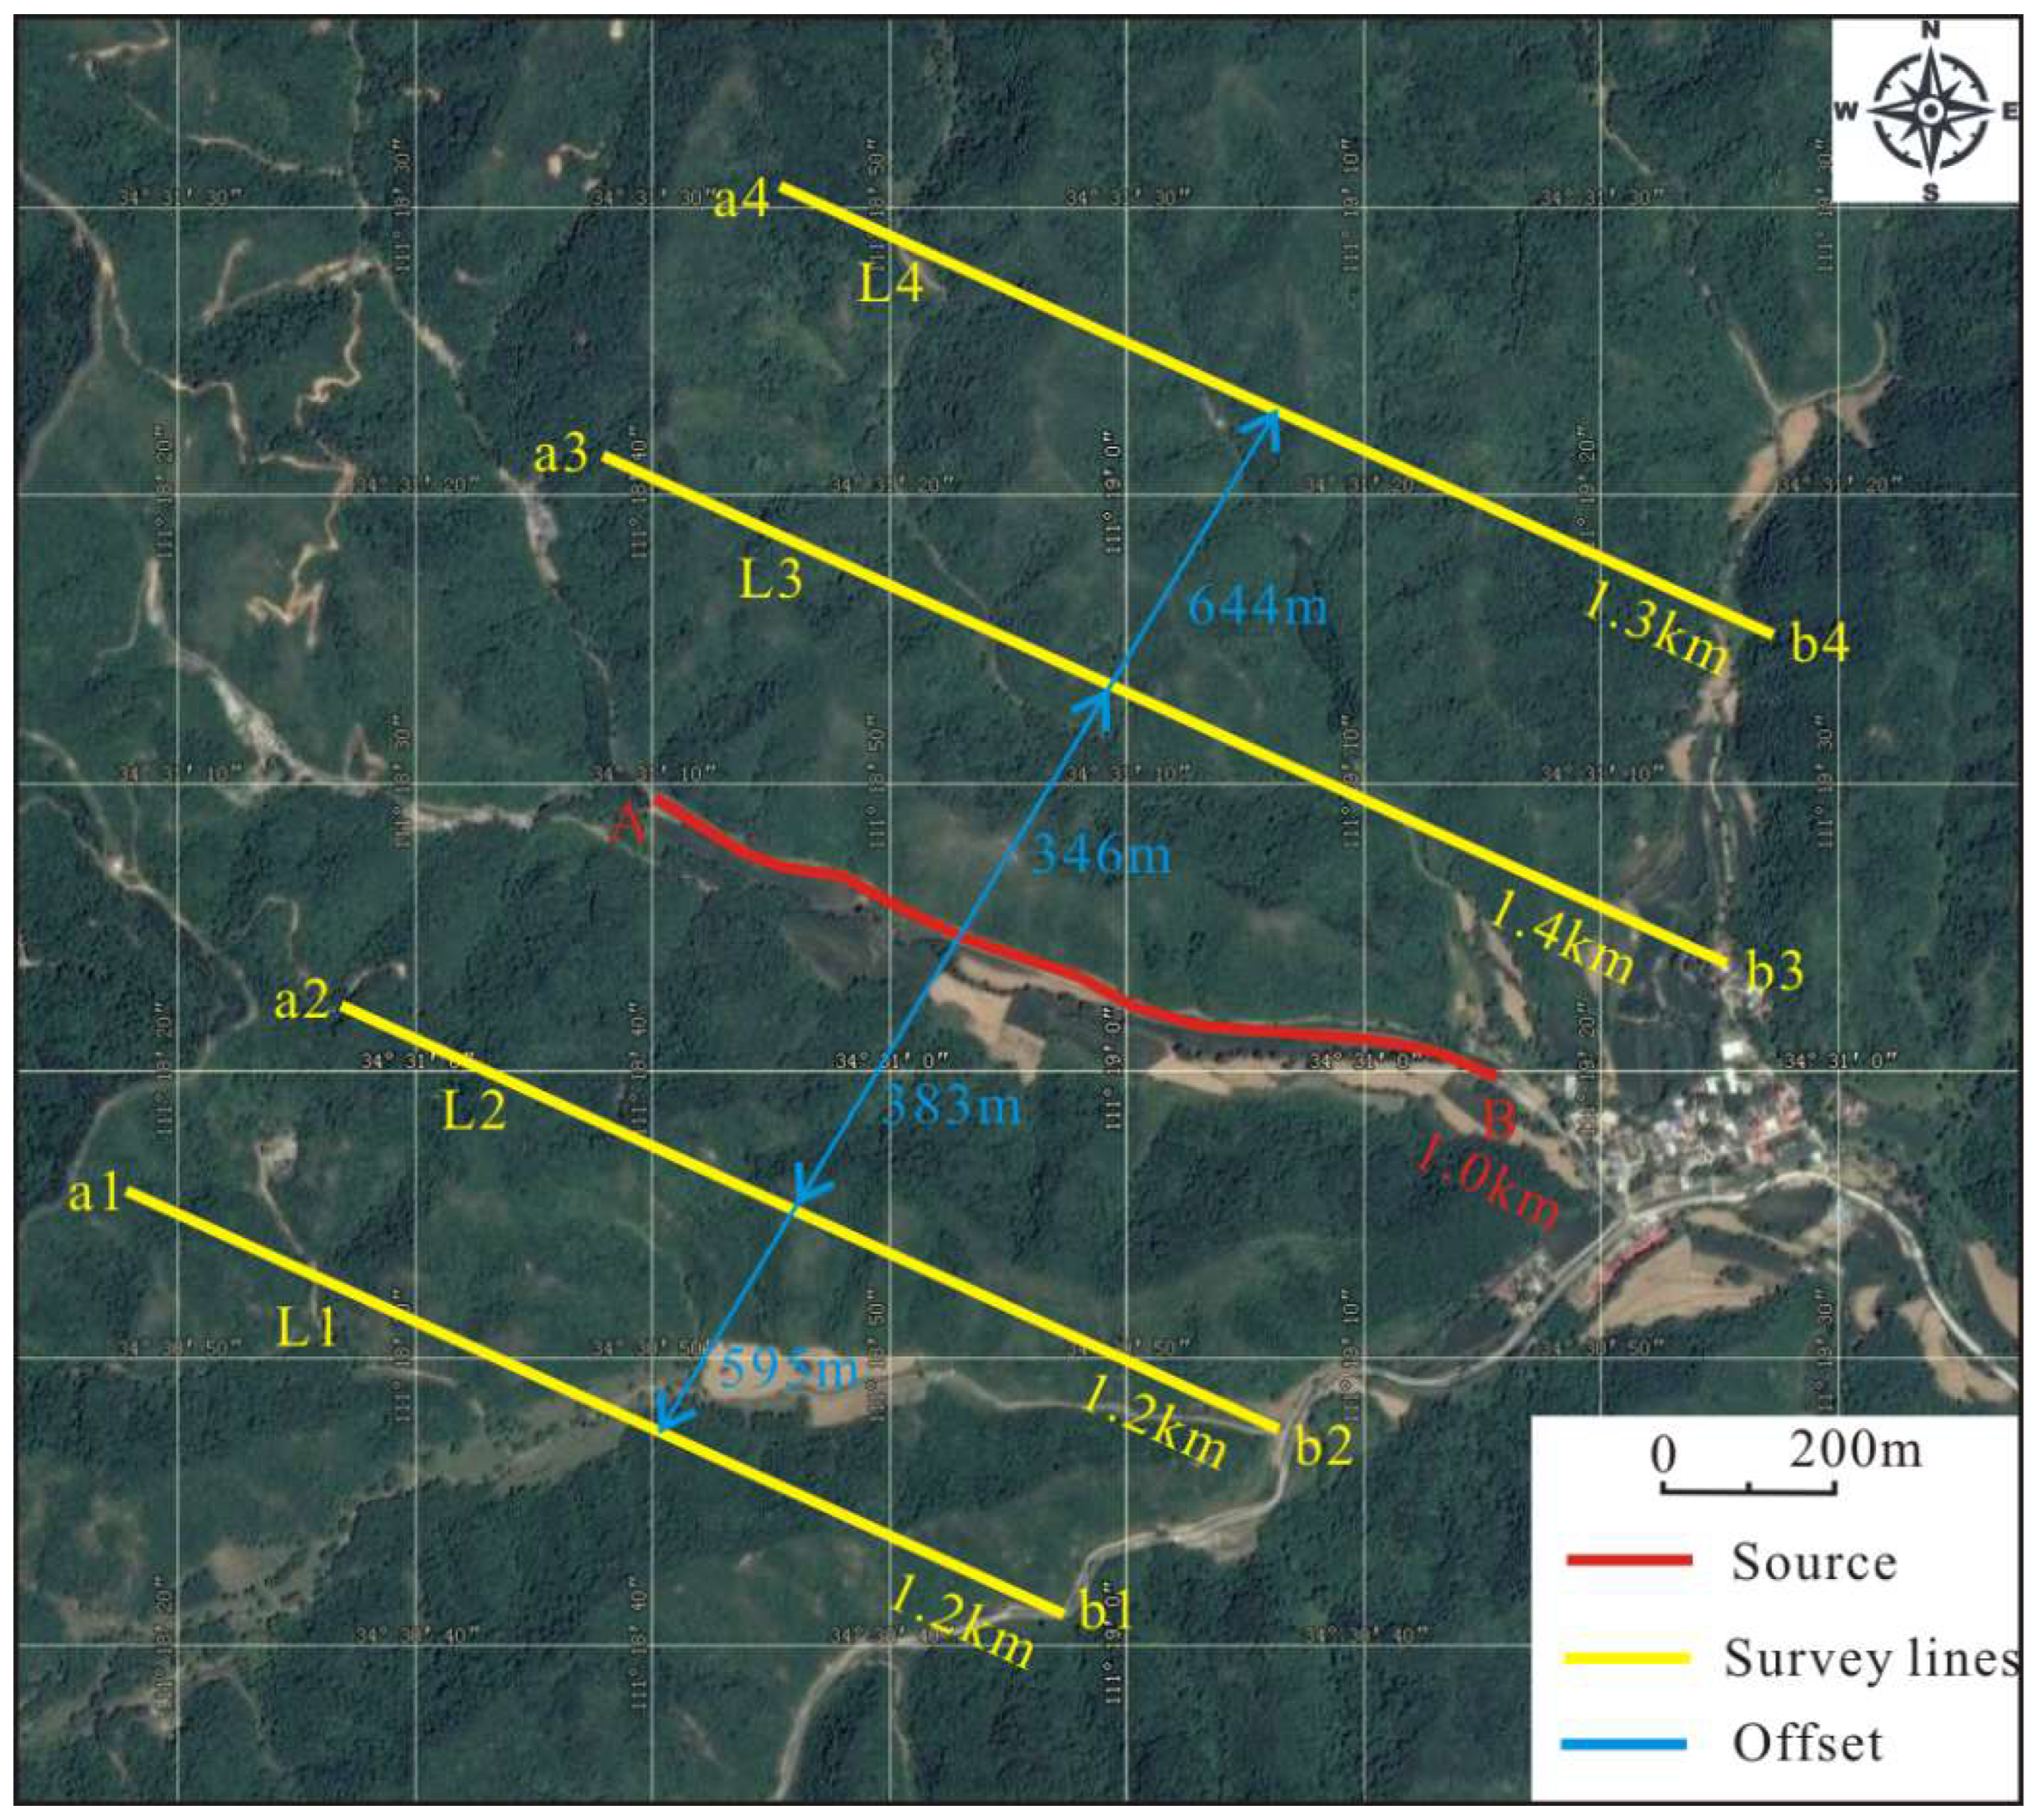
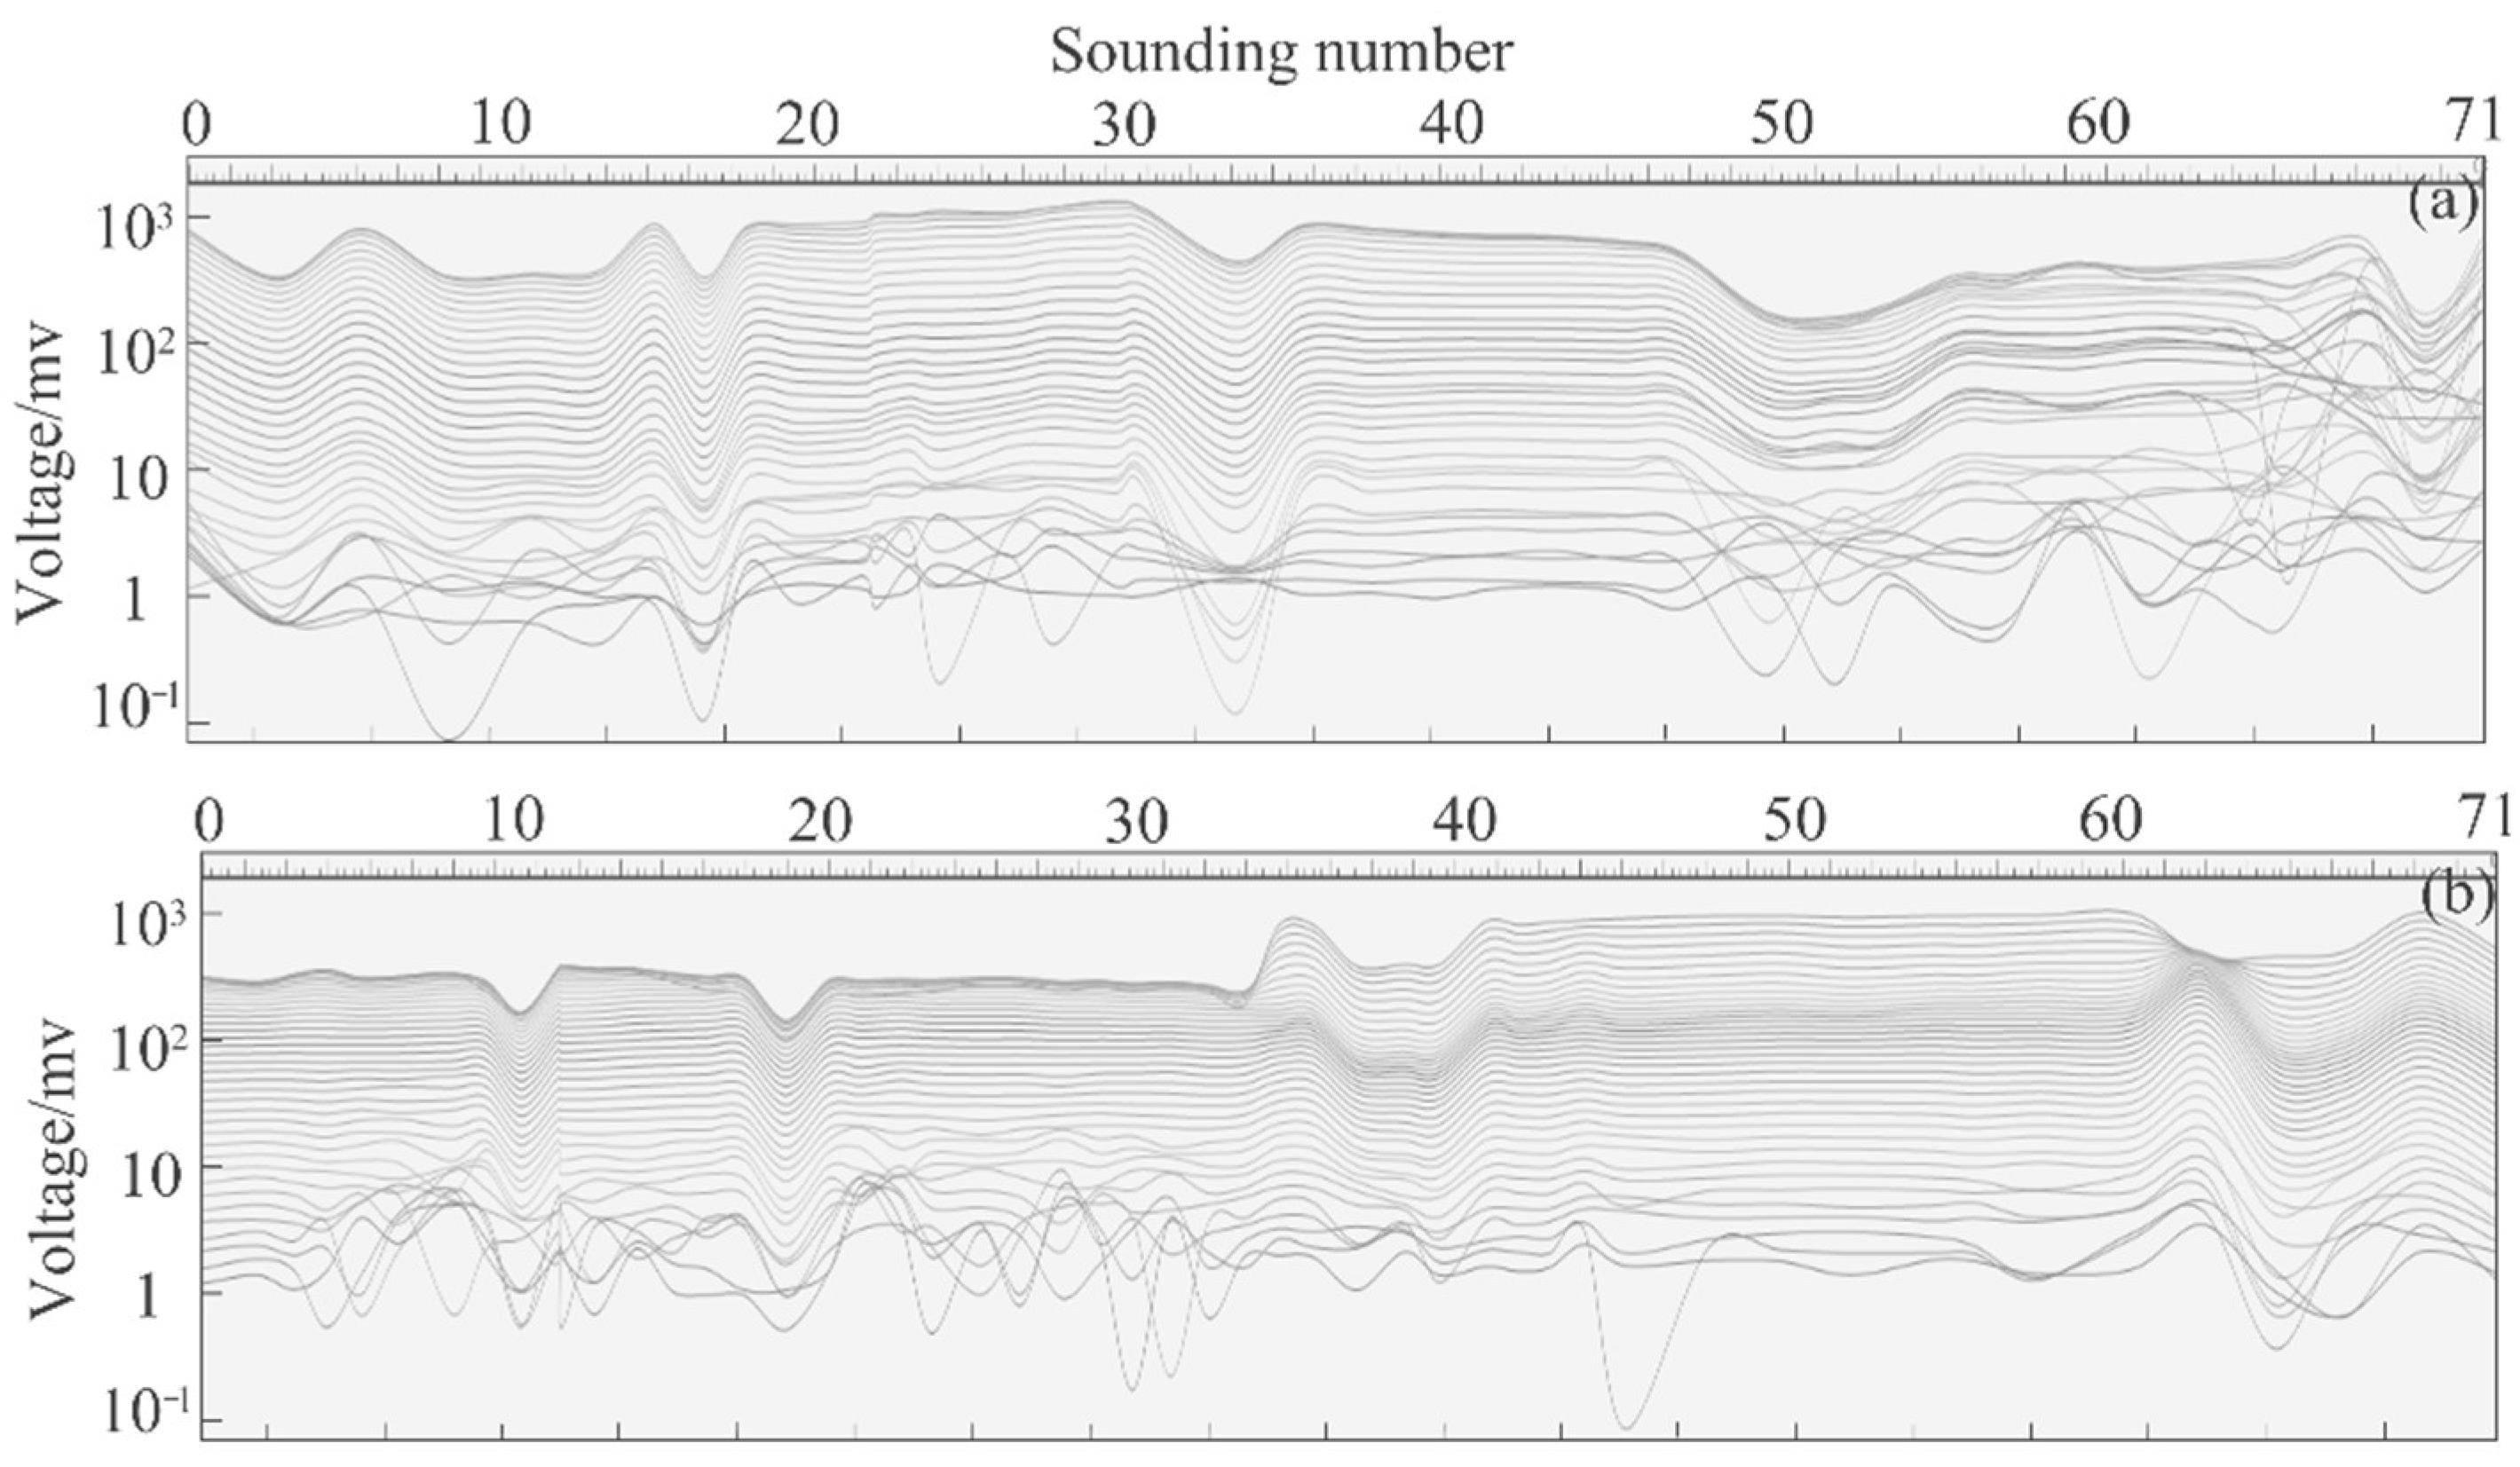
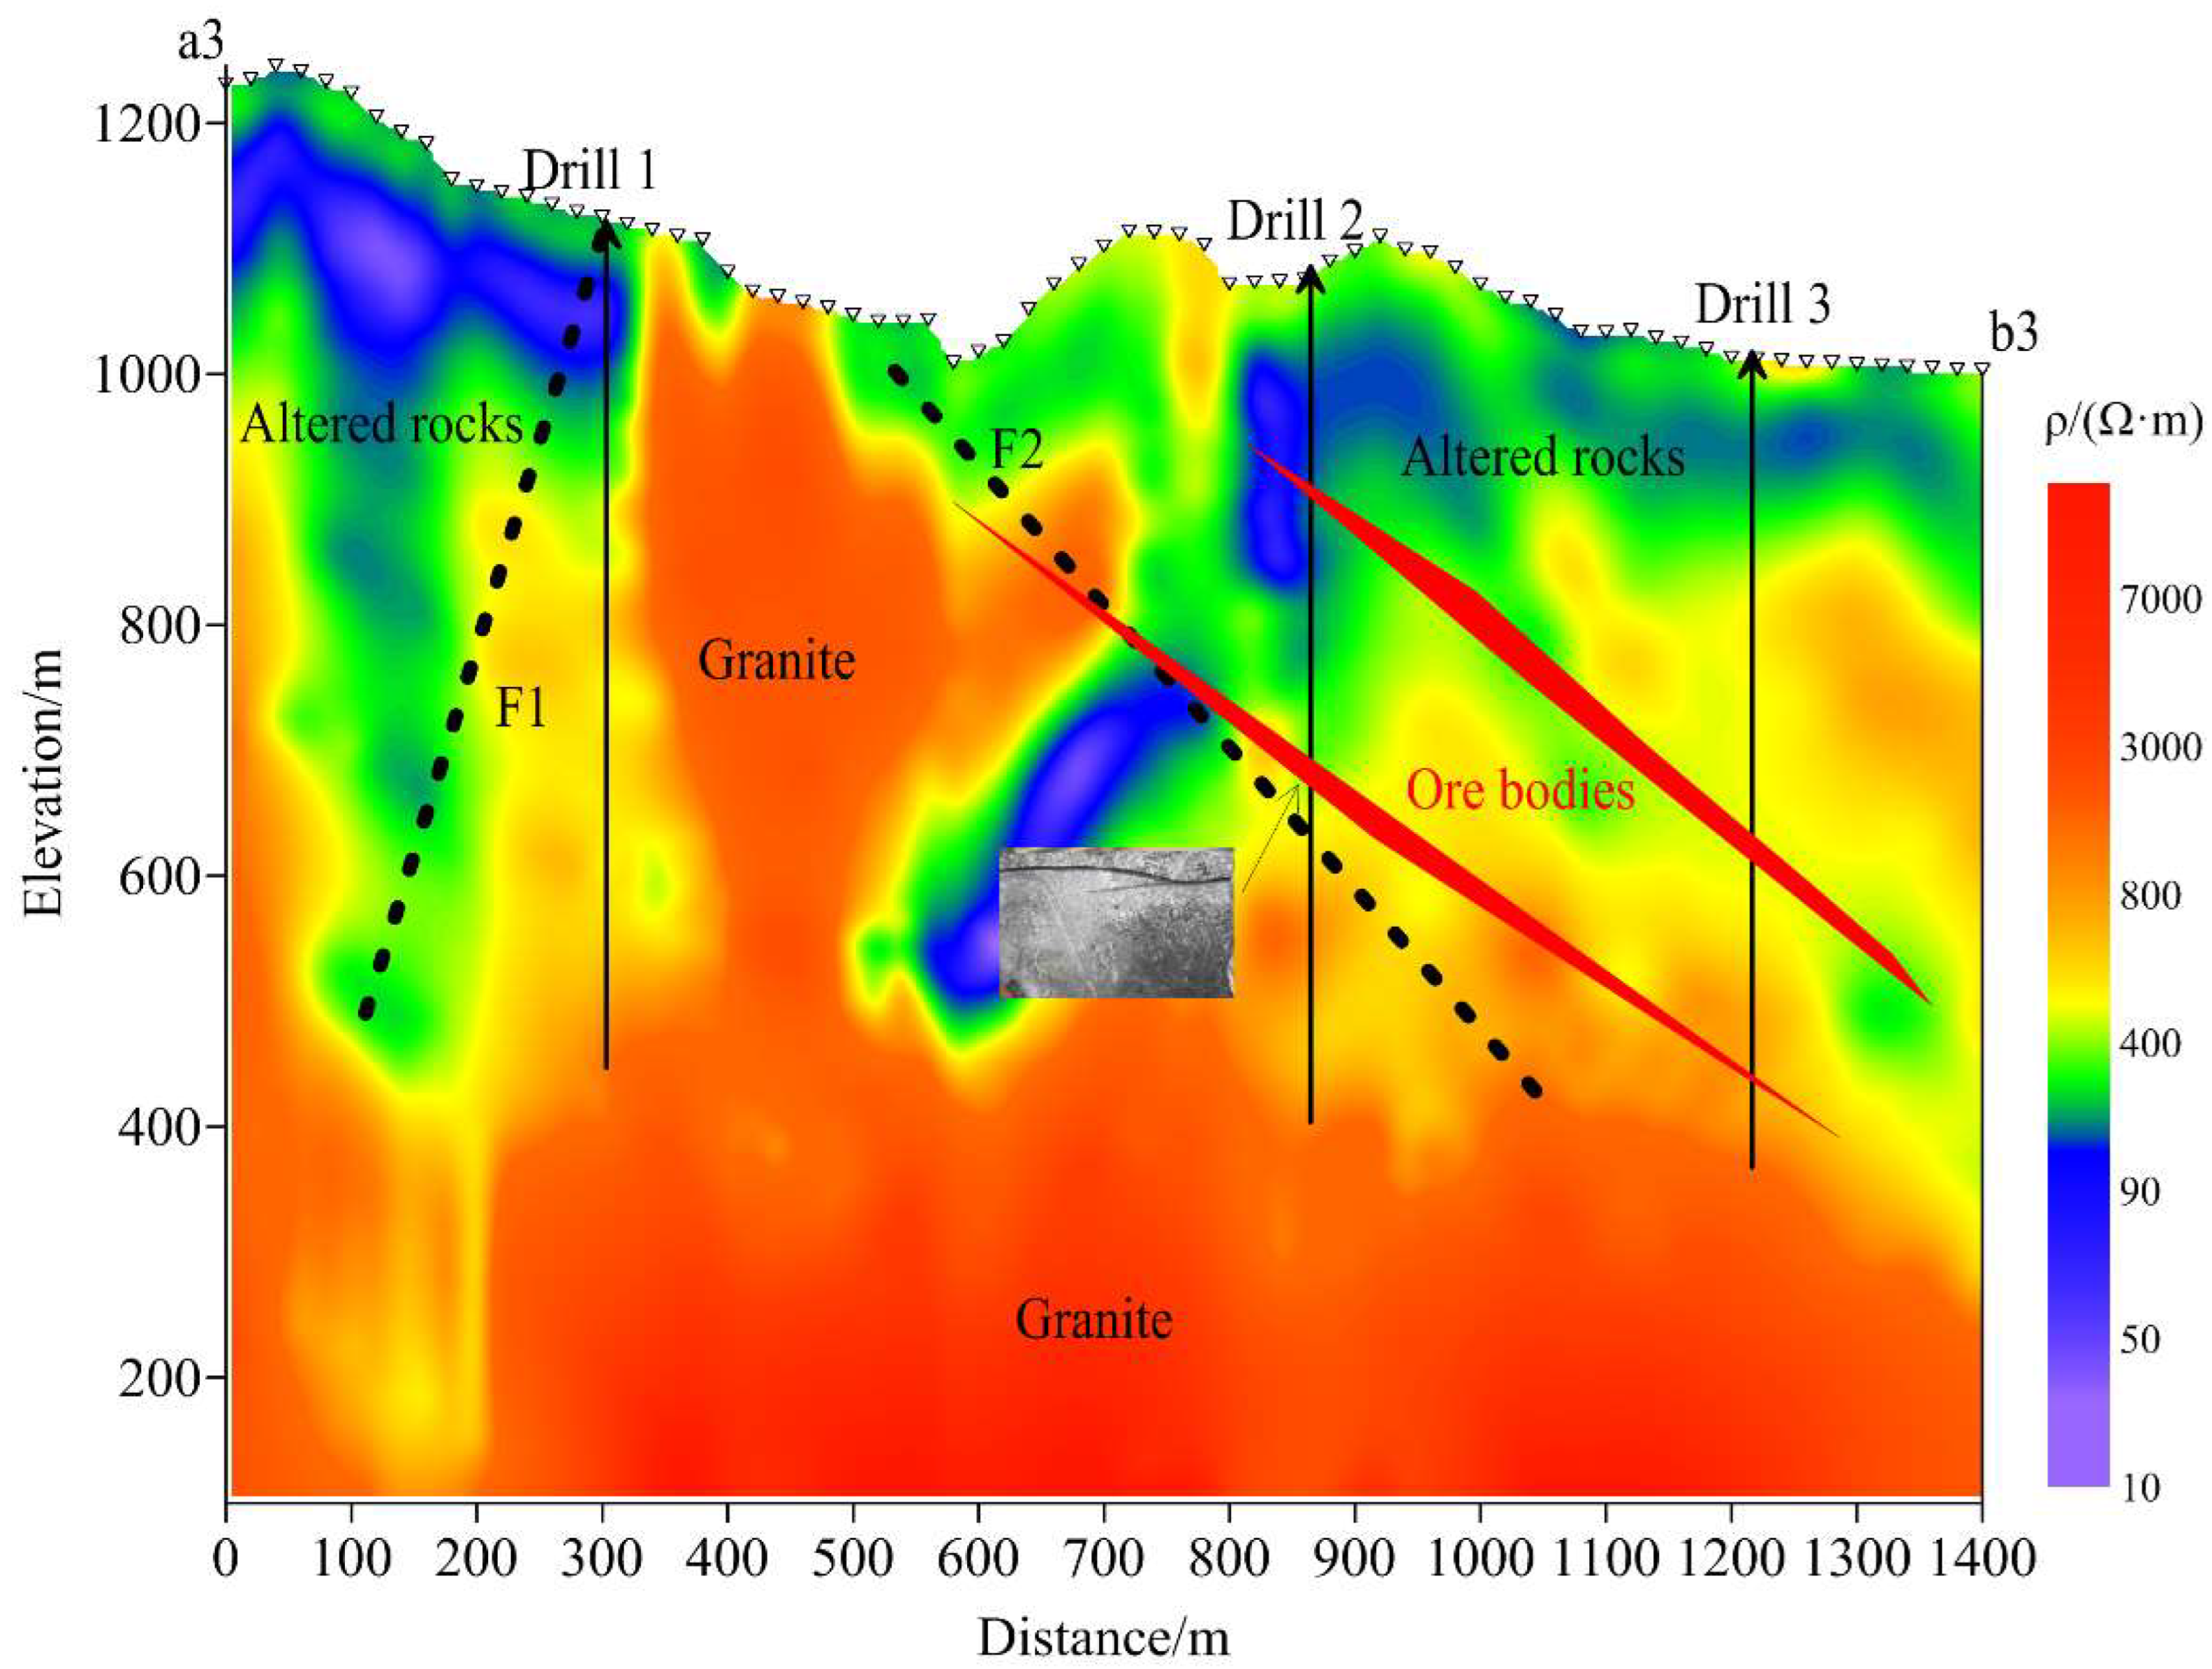
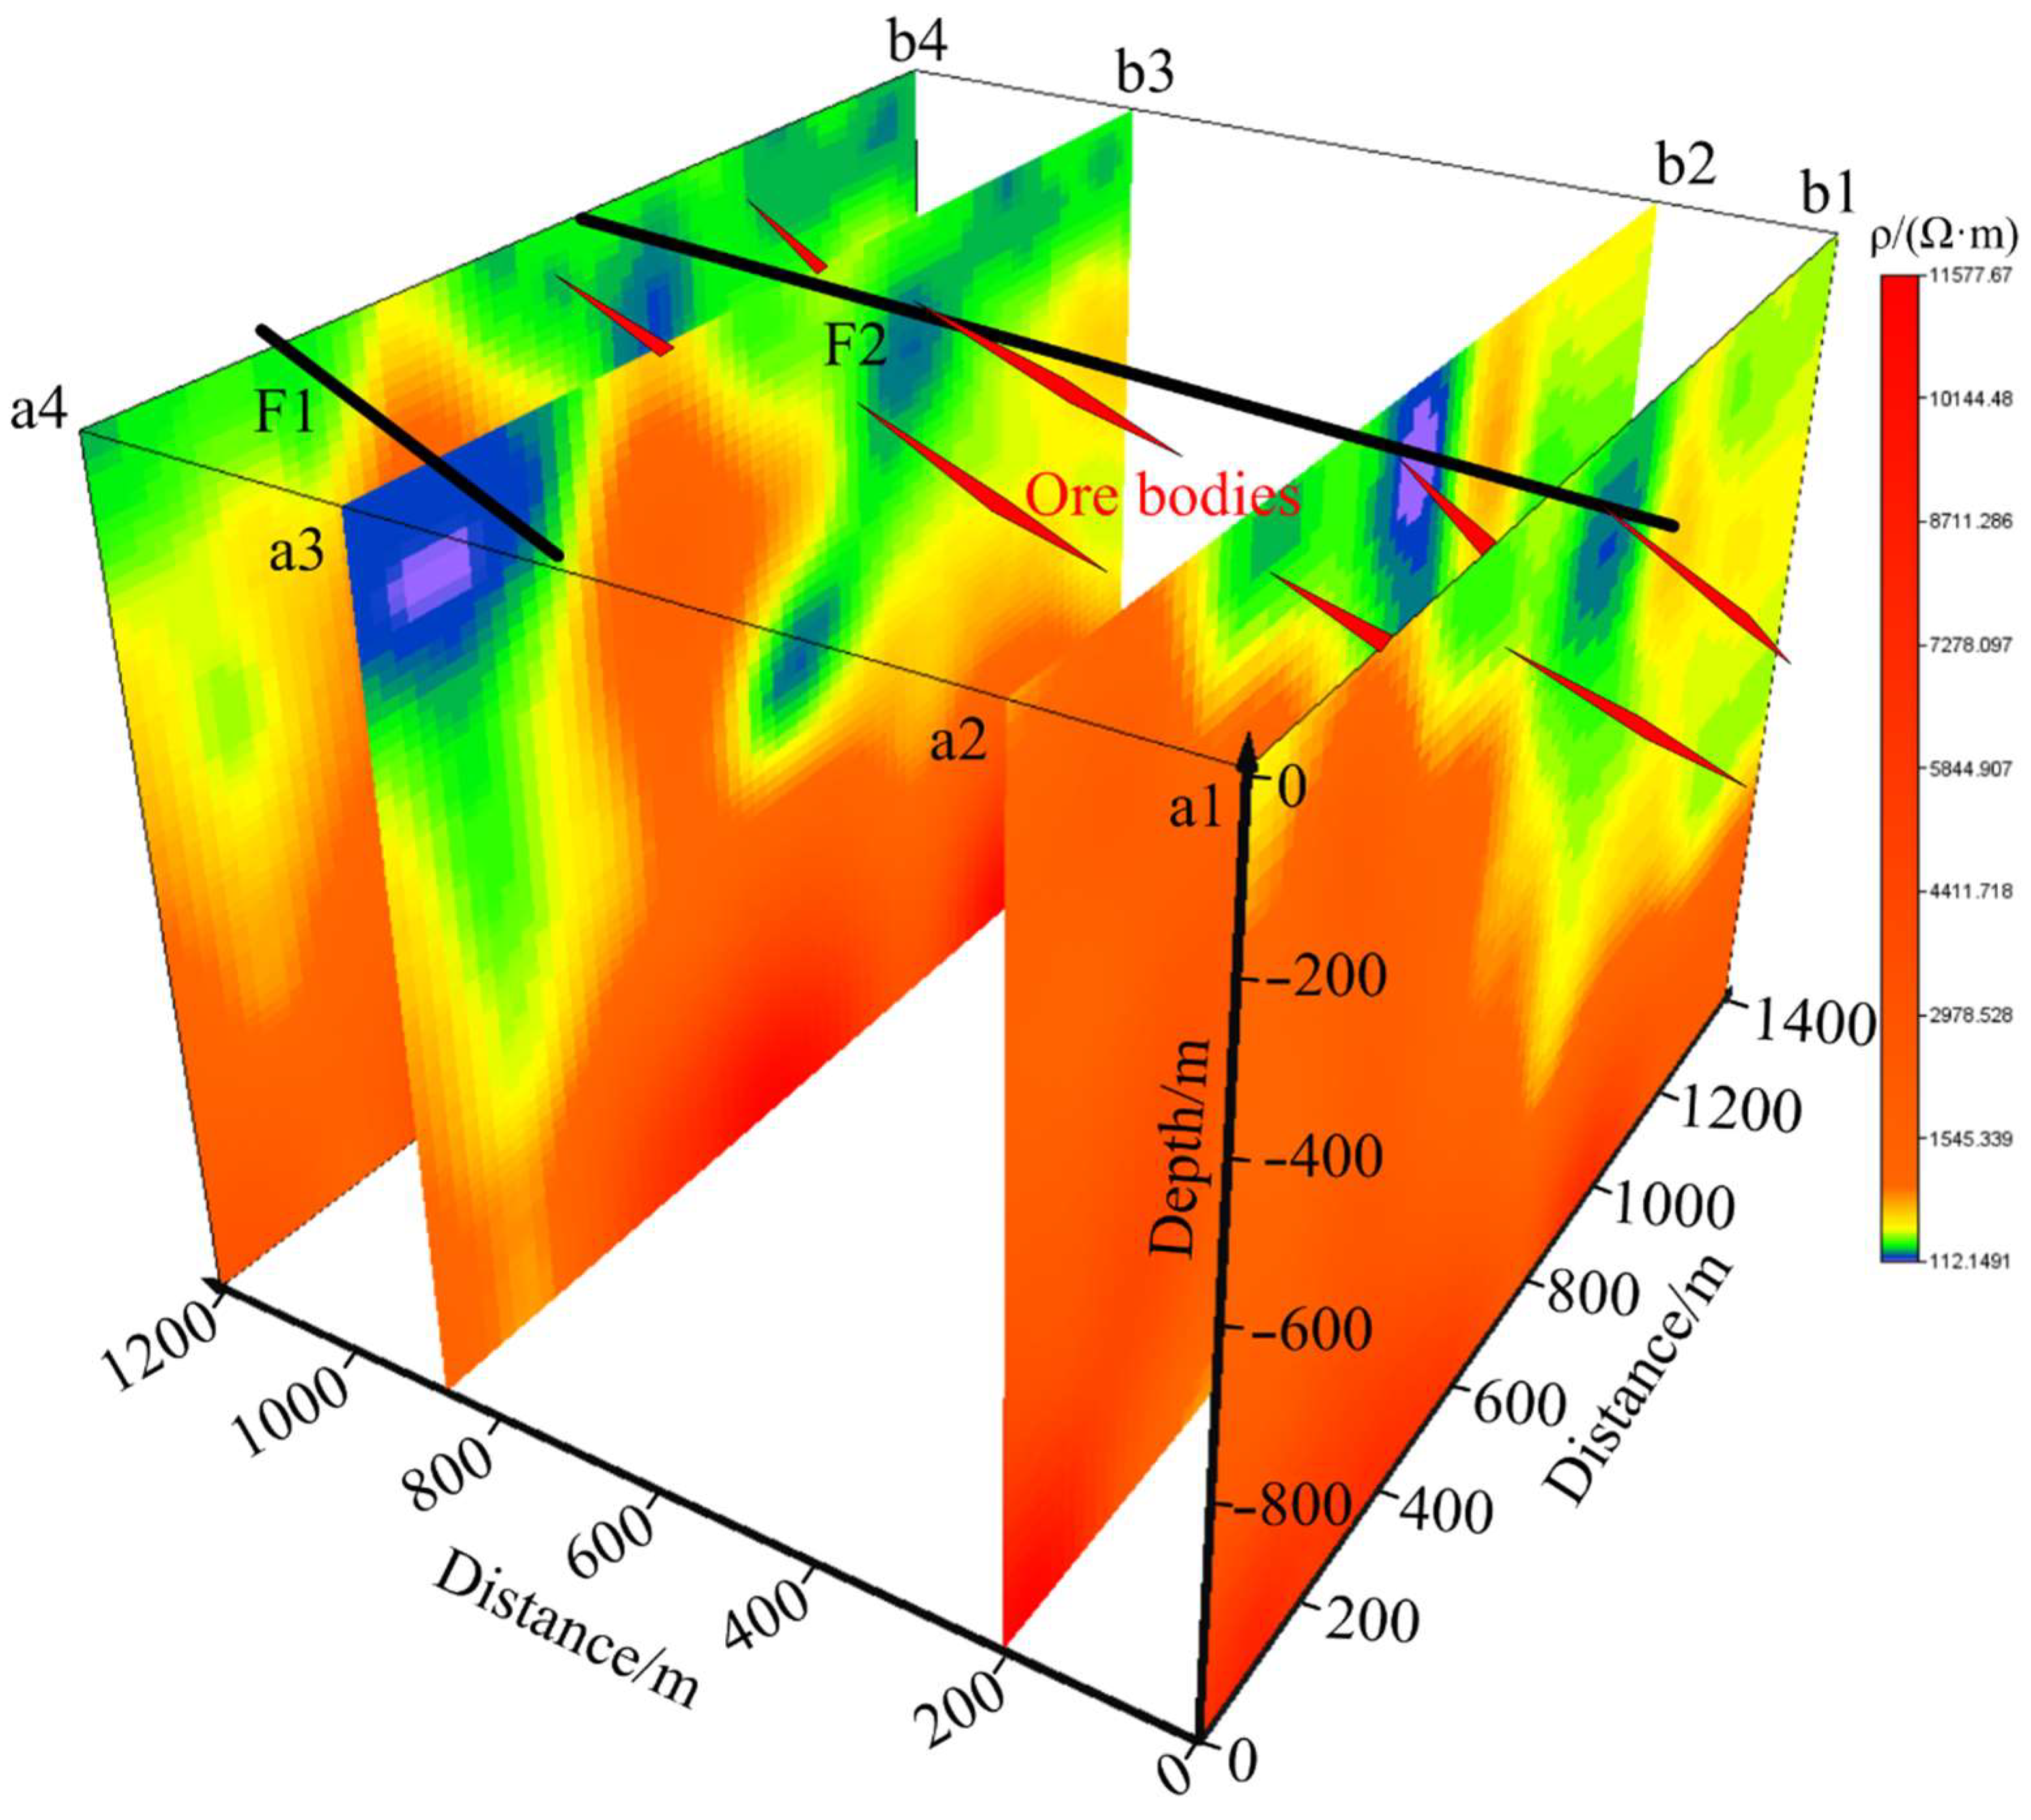
3. Case History
4. Conclusions
Author Contributions
Funding
Data Availability Statement
Conflicts of Interest
References
- Teng, J.W. Strengthening exploration of metallic minerals in the second depth space of the crust, accelerating development and industrialization of new geophysical technology and instrumental equipment. Prog. Geophys. 2010, 25, 729–748. [Google Scholar]
- Di, Q.Y.; Zhu, R.X.; Xue, G.Q.; Yin, C.; Li, X. New development of the Electromagnetic (EM) methods for deep exploration. Chin. J. Geophys. 2019, 62, 2128–2138. [Google Scholar]
- Cagniard, L. Basic theory of the magneto-telluric method of geophysical prospecting. Geophysics 1953, 18, 605–635. [Google Scholar] [CrossRef]
- Di, Q.Y.; Xue, G.Q.; Fu, C.M.; Wang, R. An alternative tool to controlled-source audio-frequency magnetotellurics method for prospecting deeply buried ore deposits. Sci. Bull. 2020, 65, 611–615. [Google Scholar] [CrossRef]
- Goldstrein, M.A.; Strangway, D.W. Audio-frequency magnetotellurics with a grounded electric dipole source. Geophysics 1975, 40, 669–683. [Google Scholar] [CrossRef]
- Zhou, N.N.; Xue, G.Q.; Hou, D.Y.; Lu, Y. An investigation of the effect of source geometry on grounded-wire TEM surveying with horizontal electric field. J. Environ. Eng. Geophys. 2018, 23, 143–151. [Google Scholar] [CrossRef]
- Nabighian, M. Electromagnetic Methods in Applied Geophysics (Volume 2); Society of Exploration Geophysicists: Tulsa, OK, USA, 1991. [Google Scholar]
- Strack, K.M. Exploration with Deep Transient Electromagnetic Method; Elsevier: New York, NY, USA, 1992. [Google Scholar]
- He, J.S.; Xue, G.Q. Review of the key techniques on short-offset electromagnetic detection. Chin. J. Gephys. 2018, 61, 1–8. [Google Scholar]
- Xue, G.Q. The Development of near-source electromagnetic methods in China. J. Environ. Eng. Geophys. 2018, 23, 115–124. [Google Scholar] [CrossRef]
- He, J.S. Wide-Field Electromagnetic Method and Pseudo-Random Signal; Higher Education Press: Beijing, China, 2010. (In Chinese) [Google Scholar]
- Ziolkowski, A.; Hobbs, B.A.; Wright, D. Multi-transient electromagnetic demonstration survey in France. Geophysics 2007, 72, 197–209. [Google Scholar] [CrossRef]
- Xue, G.Q.; Chen, W.Y.; Zhou, N.N.; Li, H. Short-offset TEM technique with a grounded wire source for deep sounding. Chin. J Geophys. 2013, 56, 255–261. [Google Scholar]
- Niu, Z.L. Principle of Time-Domain Electromagnetic Method; Central South University Press: Changsha, China, 2007. (In Chinese) [Google Scholar]
- Kaufman, A.A.; Keller, G.V. Frequency and Transient Soundings; Elsevier: New York, NY, USA, 1983. [Google Scholar]
- Chen, W.Y.; Xue, G.Q.; Cui, J.Y. Study on the response and optimal observation area for SOTEM. Chin. J. Geophys. 2016, 59, 739–748. [Google Scholar]
- Hördt, A.; Druskin, V.L.; Kinizhnerman, L.A.; Strack, K.M. Interpretation of 3-D effects in long-offset transient electromagnetic (LOTEM) soundings in the Munsterland area/Germany. Geophysics 1992, 57, 1127–1137. [Google Scholar] [CrossRef]
- Spies, B.R. Depth of investigation in electromagnetic sounding methods. Geophysics 1989, 54, 872–888. [Google Scholar] [CrossRef]
- Chen, X.; Zhao, G.; Tang, J.; Zhan, Y.; Wang, J.J. A adaptive regularized inversion algorithm for magnetotelluric data. Chin. J. Geophys. 2005, 48, 937–946. (In Chinese) [Google Scholar] [CrossRef]
- Constable, S.C.; Parker, R.L.; Constable, C.G. Occam’s inversion—A practical algorithm for generating smooth models from electromagnetic sounding data. Geophysics 1987, 52, 289–300. [Google Scholar] [CrossRef]
- Liu, H.T.; Di, Q.Y.; Xue, G.Q.; Luo, X.N.; Ding, Y.H.; Wang, C.Y. The metamorphic core complex in the Xiaoshan gold-polymetallic concentrating area of Henan Province and its implications for mineral exploration. Geol. Explor. 2018, 54, 230–242. [Google Scholar]
- Xue, G.Q.; Zhang, L.B.; Hou, D.Y.; Liu, H.T.; Ding, Y.H.; Wang, C.Y.; Luo, X.N. Integrated geological and geophysical investigations for the discovery of deeply buried gold-polymetallic deposits in China. Geol. J. 2020, 55, 1771–1780. [Google Scholar] [CrossRef]


| Offset (m) | 200 | 500 | 1000 | 2000 | 5000 |
| Error (%) | 72.93 | 69.42 | 63.66 | 48.61 | 25.46 |
| I (A) | ρ (Ω·m) | AB (m) | r (m) | η (nV) | df (m) | dn (m) |
|---|---|---|---|---|---|---|
| 5 | 50 | 300 | 200 | 60 | 526.4 | 576.5 |
| 300 | 625.2 | |||||
| 10 | 100 | 500 | 300 | 60 | 845.9 | 913.7 |
| 500 | 1012.0 | |||||
| 20 | 300 | 1000 | 700 | 60 | 1574.5 | 1779.3 |
| 1000 | 1910.9 |
Publisher’s Note: MDPI stays neutral with regard to jurisdictional claims in published maps and institutional affiliations. |
© 2022 by the authors. Licensee MDPI, Basel, Switzerland. This article is an open access article distributed under the terms and conditions of the Creative Commons Attribution (CC BY) license (https://creativecommons.org/licenses/by/4.0/).
Share and Cite
Xue, G.; Chen, W.; Wu, X.; Yan, S.; Guo, W. A Near-Source Electromagnetic Method for Deep Ore Explorations. Minerals 2022, 12, 1208. https://doi.org/10.3390/min12101208
Xue G, Chen W, Wu X, Yan S, Guo W. A Near-Source Electromagnetic Method for Deep Ore Explorations. Minerals. 2022; 12(10):1208. https://doi.org/10.3390/min12101208
Chicago/Turabian StyleXue, Guoqiang, Weiying Chen, Xin Wu, Shu Yan, and Wenbo Guo. 2022. "A Near-Source Electromagnetic Method for Deep Ore Explorations" Minerals 12, no. 10: 1208. https://doi.org/10.3390/min12101208