Article

The Meso-Structural Characteristics of Crack Generation and Propagation during Rock Fracturing

1
College of Mining Engineering, North China University of Science and Technology, Tangshan 063210, China
2
College of Science, North China University of Science and Technology, Tangshan 063210, China
*
Author to whom correspondence should be addressed.
Minerals 2022, 12(1), 94; https://doi.org/10.3390/min12010094
Submission received: 11 December 2021 / Revised: 9 January 2022 / Accepted: 10 January 2022 / Published: 14 January 2022
(This article belongs to the Special Issue Failure Characteristics of Deep Rocks)

Abstract

:
Meso-structure is an important factor affecting the characteristics of rock fracture. To determine the factors influencing the internal meso-structural characteristics upon the crack generation and extension, rock samples were tested under uniaxial cyclic loading and unloading and examined using computed tomography (CT) scanning. CT scanning was used to visualize and investigate the entire process of fracture source generation and its development in three dimensions, and finally the location information of the fracture source was determined. The mineral composition and structure along the fracture path inside the specimen were studied by using a polarizing microscope, and the evolution of fracture propagation around mineral particles was revealed based on its mineralogical characteristics. Results indicate that based on the fracture source around different rock meso-structure types, the initial fracture source can also be divided into different types, namely, the primary porosity type, the micro-crack type, and the mineral grain type. The strength characteristics of mineral grains can determine whether the crack extends around the gravel or through it. The hard grains at the crack-tip promote the transformation of tensile stress to shear stress, which lead to the change in the direction of crack extension and bifurcation. The spatial shape of the cracks after rock fracture is related to the initial distribution of minerals and is more complicated in areas where minerals are concentrated. The crack extension around gravel particles also generates a mode of failure, affecting large grains with gravel spalling from the matrix. The findings provide a study basis for identifying the potentially dangerous areas and provide early warning for the safety of underground engineering construction operations.

1. Introduction

Rock is a natural geological body formed from various minerals and interstitials. Many irregular, randomly distributed pores and cracks, or defects, are present within rocks, and the meso-structure of rock is complicated [1]. Natural defects represent potential hazards in engineering rock masses, such as rock slopes and underground roadways [2]. The macroscopic (macro-scale (>10−1 m), meso-scale (10−4~10−1 m), micro-scale (10−8~10−4 m) [3,4]) failure is the result of the cumulative meso-structure evolutions, and the source of fracture is often closely related to the meso-structure [5,6,7].
The study of meso-structural effects on the generation, expansion, and evolution of fracture sources, exploring the generation mechanism and evolution rules of fracture sources, will reveal potentially dangerous areas prone to instability. Some scholars studied the internal meso-structure, e.g., initial defects, mineral types, and particle size, to reveal the relationship between meso-structure and macro-fracture [8,9,10]. Li et al. [11] studied the rheological properties of tailings and cement with various structural characteristics. Cao et al. [12,13] added external fibrous materials with various meso-structural characteristics to concrete and backfill. The effects of this material on the strength, crack formation, and expansion of concrete and backfill materials were studied by using CT scanning and scanning electron microscopy. Ji [14] and Song [15] studied the fracture process of rocks by uniaxial loading and SEM, and found that the meso-structural destruction of weakly cemented rocks mainly occurred between the particles of the cemented material. Hasanipanah et al. [16] and Huang et al. [17] used different algorithms to predict the shear strength of the rocks with good prediction results. Ge et al. [18] studied the variation law of rock surface roughness under load by means of numerical simulation. Han et al. [19] established an evaluation index of crack extension capacity based on the deformation characteristics of rocks under triaxial compression, and compared this for rocks with different lithologies. Computed tomography (CT) has been used to extract the information about pore or crack morphology from rock specimens or rock-like materials, to compare and evaluate the changes in the meso-scale parameters, and quantitatively characterize the fractures therein [20,21,22]. To study the process of the fracture initiation, a single fissure, double fissures, and multiple fissures were prefabricated on rock samples or rock-like materials [23,24,25], and a single hole, double holes, and a combination of holes and cracks were prefabricated on rock specimens [26,27,28]. Chemical processes have a much greater impact on fracture extension than we thought. Many scholars have studied the fracture behavior of rocks under load after immersion in chemical solutions from the perspective of chemical reactions and revealed the damage mechanism of rocks after chemical reactions [29,30,31].
In terms of numerical simulation experiments involving rock fracturing, many scholars [32,33,34,35] found that the peak strength and Poisson’s ratio of rock are closely related to the mineral particle sizes. The effects of various particle gradations on tensile and compressive strengths were explored by adjusting the proportion of particles [36]. Bai et al. [37] established a pore distribution model, and analyzed the effect of the pore structure, such as the number, size, and location of pores, on the tensile strength of rocks. Yu et al. [38] established a three-dimensional (3D) model to characterize the meso-structure of minerals by using a digital image-processing technique, elucidating the thermal cracking mechanisms in rock.
In summary, most scholars studied the fracture initiation process and mechanical mechanism of fracture by prefabricating holes and fractures, but the reality is that there are multiple meso-structures within the rock, and the combination of these structures leads to fracture source generation and fracture extension. The association between fracture sources and meso-structures, and the types of fracture sources, are not well-defined, and there is a lack of in-depth research. The deep rocks are often in a state of stress redistribution and cyclic loading, and few studies have focused on the types of fracture in this state. Scholars have studied a lot about the influence of meso-structure on fracture extension, and very little about the source of fracture. Rocks are “black-box” materials, which cannot be directly observed inside, while CT scanning technology can reveal the internal structural features of rocks, providing technical support to explore the source of the fracture. To study the crack generation and propagation during rock fracturing on a meso-structural scale, a multi-stage loading experiment and CT scanning were performed. The distribution of internal pores or cracks was monitored, and the 3D reconstruction of rock specimens was undertaken using CT scanning and polarized-light microscopy. Finally, the influence of initial pores and micro-cracks and mineral particle distribution and strength were studied and discussed on the generation and propagation path of fracture sources.

2. Experimental Design

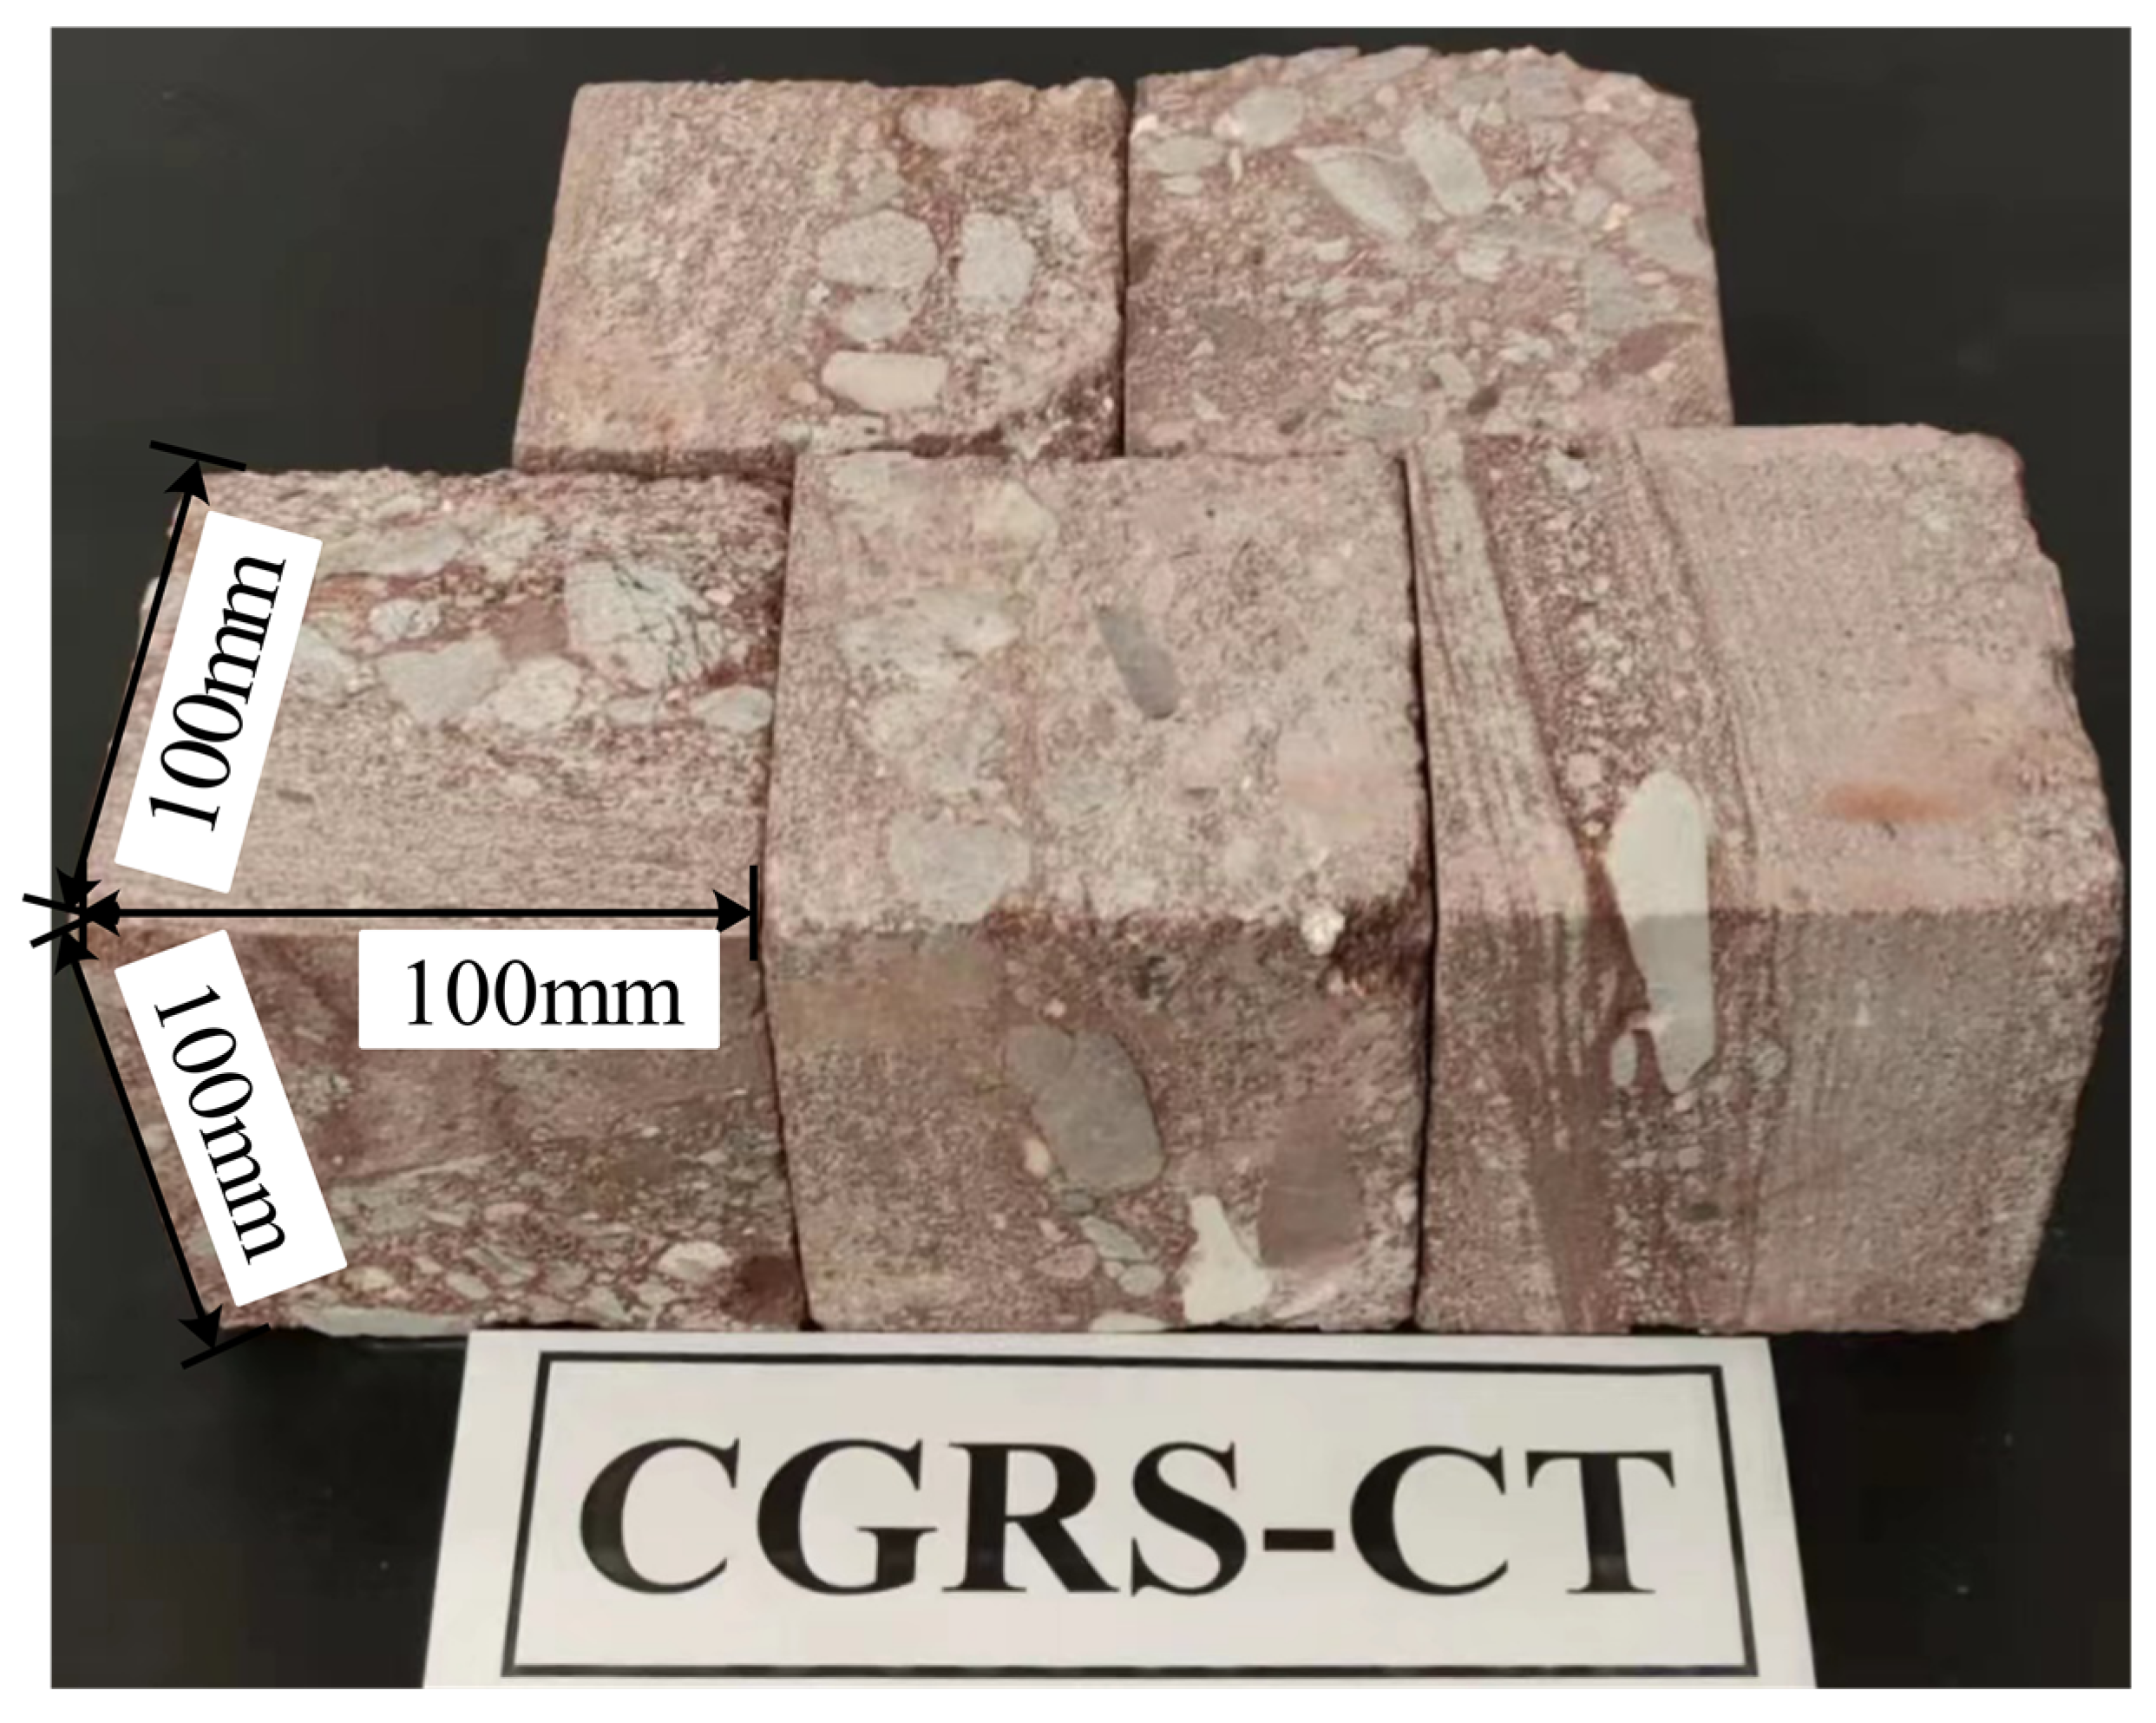
2.1. Specimen Selection

Deep mining has become the main battlefield for resource development. With the increase in mining depth, the change of mechanical properties of the rock mass is mainly manifested as the deterioration of rock strength and the accumulated deformation of the meso-structure under cyclic loading. This phenomenon is more common in the construction activities of geotechnical projects such as roadway boring and chamber excavation. The sample comes from an open quarry and is a sandstone layer in the Upper Cretaceous strata. The rock mass is produced in layers, and the thickness of a single layer is generally greater than 2 m, which is a sedimentary layered deposit, and the type of rock is mainly neritic sedimentary rocks. Red sandstone has a diversity of mineral particle sizes, and was selected as the specimen. Five rock specimens were prepared, each measuring 100 × 100 × 100 mm (Figure 1).
To determine the types and distribution of minerals, the rock slices were identified by polarizing microscopy. The rock we tested is mainly composed of clastic particles and interstitial substances: clastic particles include mainly quartz, feldspar, and cuttings. There are many methods of rock mineral grain size analysis, such as the laser method, screening method, light penetration method, and imaging methods. The particle size of mineral particles in rocks can be determined through these methods, and the imaging method is the most widely used to calculate the particle size distribution in the present work. It is noteworthy that the particle size distribution of mineral particles was roughly determined by polarized light microscopy and software, and then calculated by sieve analysis for purposes of correction of the initial data. The particle size was generally 2–8 mm, some particles were of 8–17 mm, and a few were between 0.5 and 2 mm (Figure 2). Most of them were subangular to sub-round, some were spherical, and the grains were poorly sorted. The interstitial materials (Figure 3) were mainly argillaceous, sand, sericite, carbonate minerals, and ferric oxide, which are mainly clay minerals, and show the pore type cementation between clastic particles.

2.2. Test System

The test system and key flow diagram are depicted in Figure 4. The loading equipment was a TAW-3000 rigid servo-motor controlled press, which can apply uniaxial compression and step loading. The maximum axial load was 3000 kN, and the measurement accuracy was ±1%. The Phoenix v|tome|xm Industrial CT scanner produced by German General Electric Company was used as the CT scanning equipment. The instrument is capable of scanning, high-power microfocus, and high-resolution nano-focus. The resolution of the micro-focus detail was less than 1 μm.

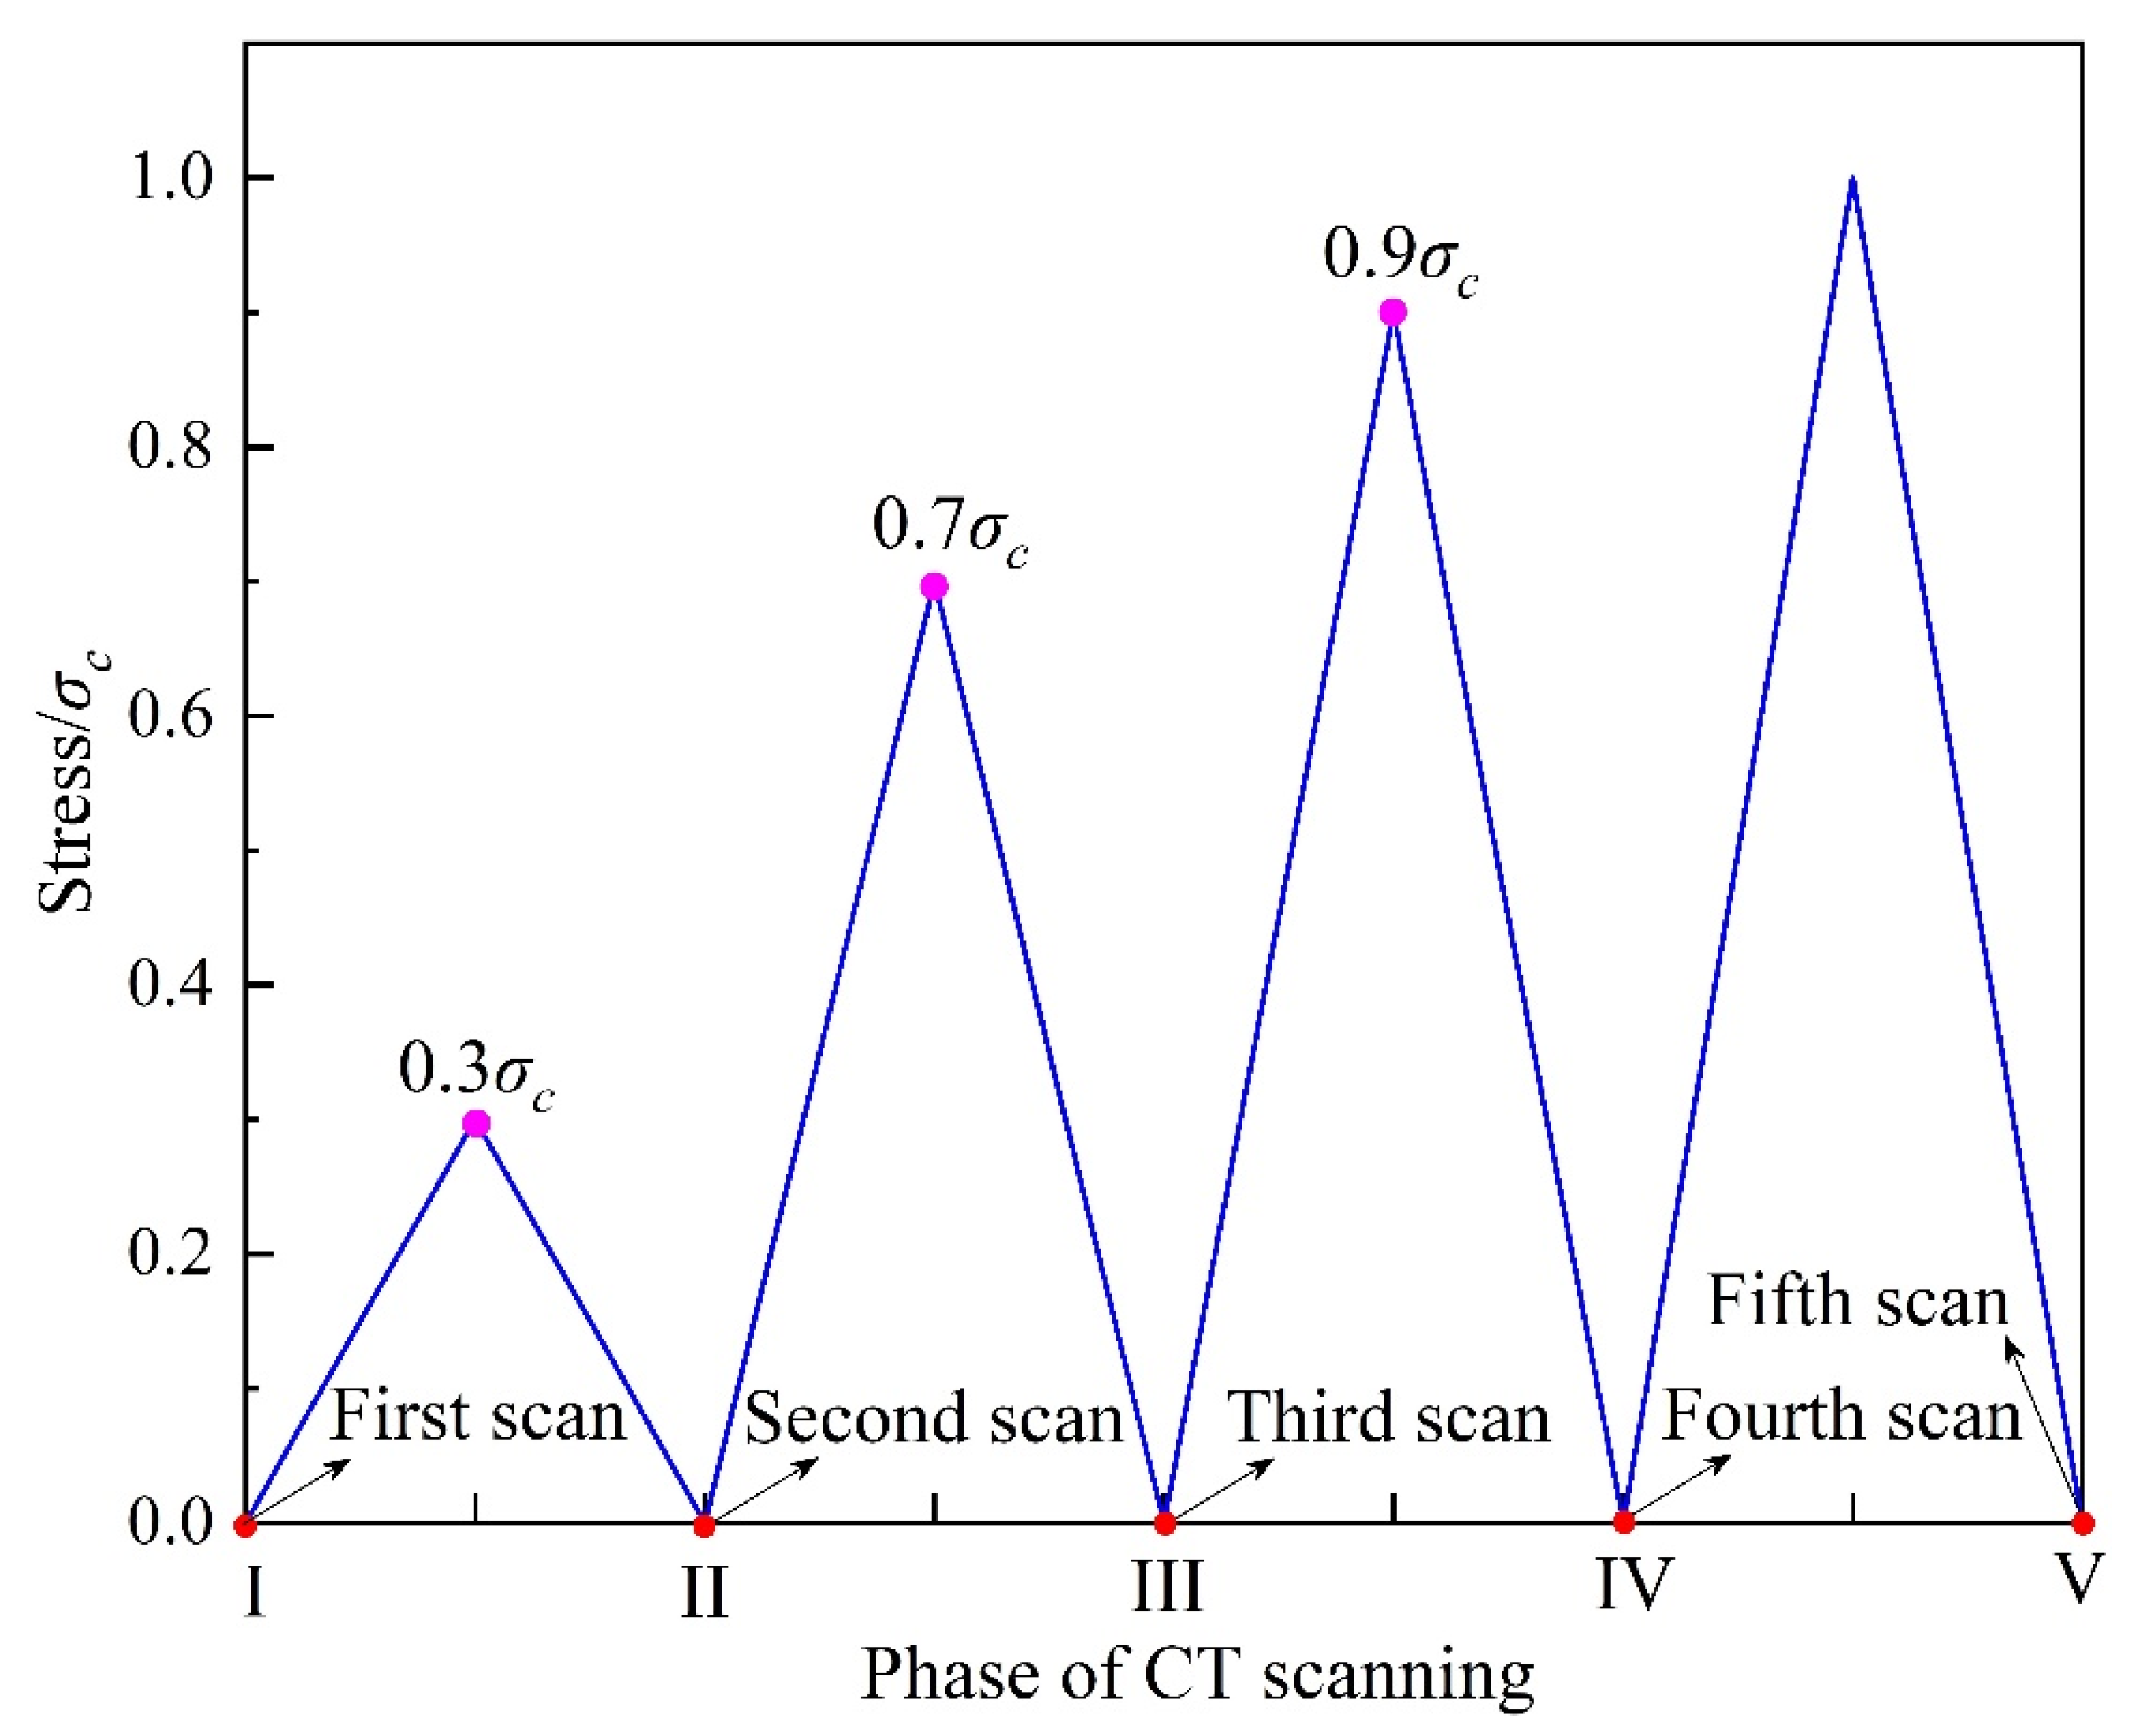
2.3. Experimental Process

To specifically determine the time points of loading, unloading, and CT scanning, the average peak stress, σc, on the lithology was 41.93 MPa after testing (this was taken as the standard value). According to the stage division of the rock stress–strain curve [39], the stress and the corresponding load at each CT scanning point during the experiment were determined (Table 1).
The sizes of most of the specimens studied by scholars have been small, however, which means that many meso-structural features are not included, so larger specimens were chosen for the present study. However, due to the limitations of the experimental conditions and CT equipment, the mechanical loading and unloading were performed separately from the CT scanning.
To maximize the information gleaned from CT scanning as to fracture source formation and crack expansion, rock specimens were tested under uniaxial cyclic loading and unloading and CT scanning: the circulating experimentation of “loading unloading CT scanning” was adopted.
(1) Before the start of the experiment, the surfaces of the rock samples were polished, and the standard position was marked on the upper and lower loading ends of the press. Lubricating silicone grease was applied to the upper and lower loading surfaces of the rock samples, and pads made from polytetrafluoroethylene (PTFE) sheets were used to avoid regional stress concentration at the loaded end.
(2) After the rock was loaded to the rated load for a period of time, then unloaded at the same rate, we removed the rock specimen and wrapped them in plastic film to avoid secondary damage during CT scanning.
The experimental scheme was designed according to the part of the division of the uniaxial compression stress–strain curve in the textbook of rock mechanics. The test is a cyclic loading and unloading test: each time, the specimen was loaded to a predetermined value and then unloaded to 0, then the specimen was removed and loaded again, and so on. To show the loading point and CT scanning point, the cyclic of loading and unloading and the phase of CT scanning were explained (Figure 5). The specific position of the CT scanning times was set as: (1) First (first scan in Figure 5): the specimen was subjected to the first time of the CT scan to obtain the initial microstructural information, (2) Second (second scan in Figure 5): the specimen was subjected to a load of up to 125.8 kN at a cross-head displacement rate of 0.15 mm/min. The stress level was 0.3σc, and the deformation stage was one involving compaction of the specimen. CT scanning for the second time after unloading followed. (3) Third (third scan in Figure 5): the force was increased to 293.5 kN, then unloaded before undertaking to the third CT scan. The stress was 0.7σc, and the deformation was such that stable fracturing occurred. (4) Fourth (fourth scan in Figure 5): the force was increased to 377.4 kN, then unloaded before undertaking another CT scan. The stress was 0.9σc, and the deformation stage led to unstable fracturing. (5) Finally (fifth scan in Figure 5): the fracturing specimen were scanned by CT for the fifth time.

3. Experimental Results

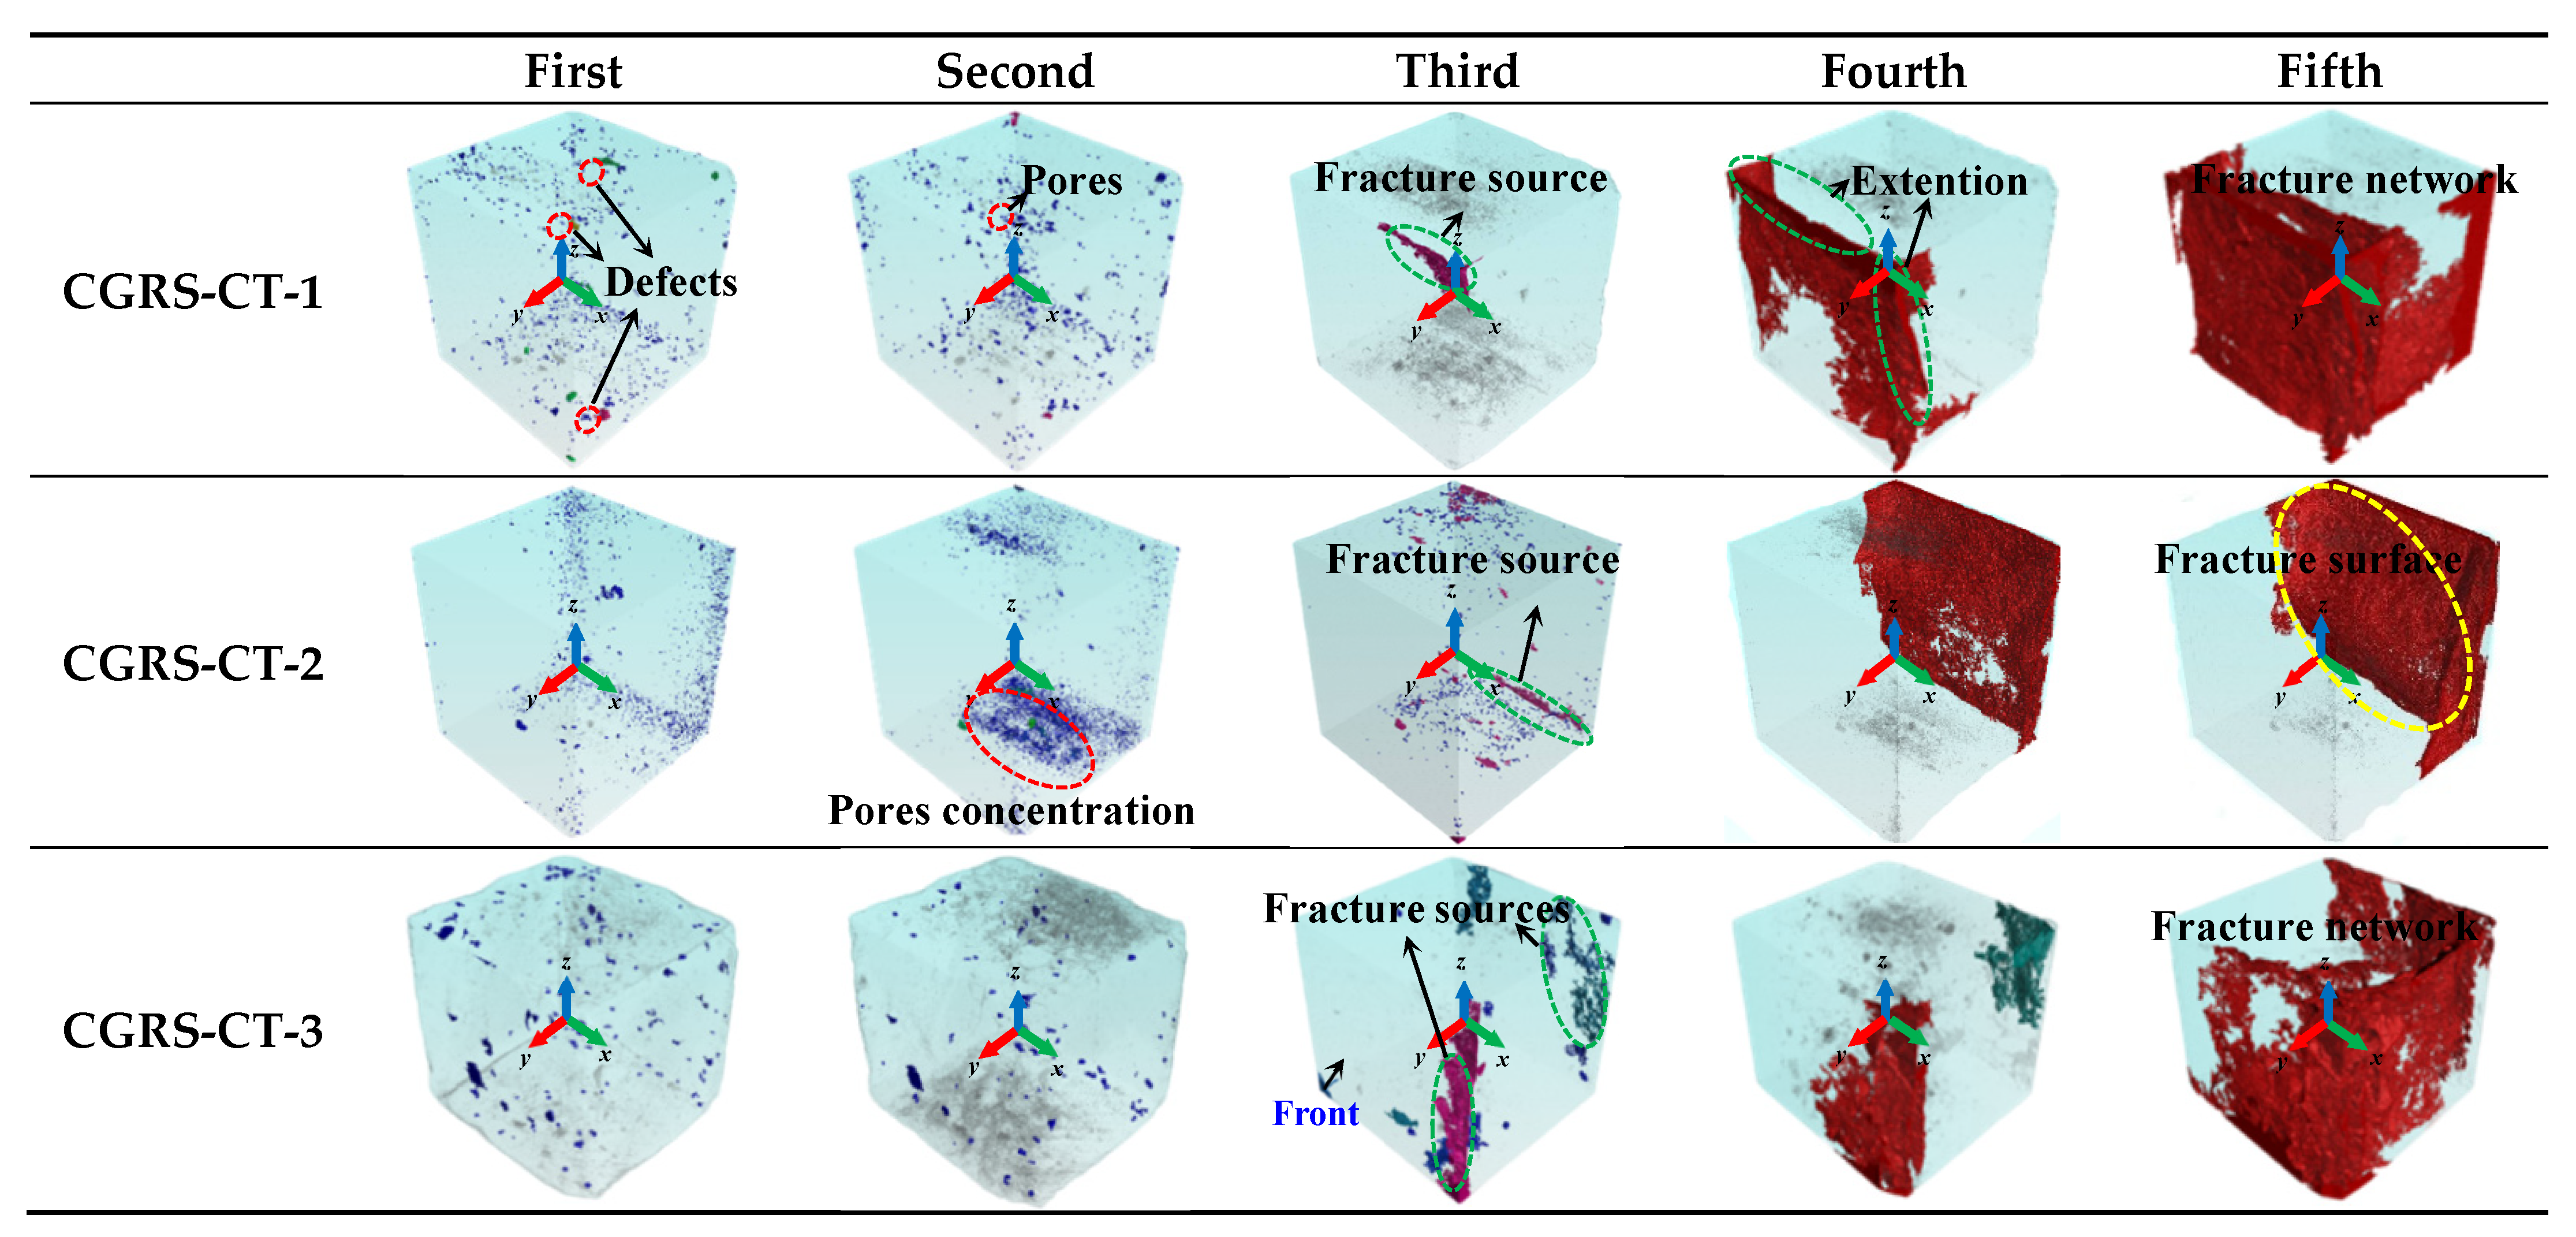
3.1. Location of Fracture Sources

To determine the areas representing fracture sources, VG software was used to reconstruct specimens at different stages after CT scanning (Figure 6). The scanned slices were input to the 3D reconstruction software VG. After threshold segmentation, cutting pages, defining the sample surface, and calculation, the digital models of the 3D fracture of the rock were obtained, and the internal holes and fractures of the models were marked with different colors. To better show the distribution of fractures, the transparency of the model was adjusted to 90%. At the beginning of the loading stage, the initial fracture sources were randomly distributed, and small fractures were difficult to distinguish from the original defects. In the present study, the focus was on the fracture sources related to the main crack. Crack expansion may also lead to the development of its relationship to the applied load [40].
Many kinds of main-fracture sources were found in specimens (Figure 6), e.g., where the fracture sources for both CGRS-CT-1 and CGRS-CT-2 were generated in the region of the specimen near the lateral edge, and there were two sources for CGRS-CT-3, one at the edge of the specimen, and others in a flake shape, parallel to the side surface. During sustained loading to the unstable fracturing stage, specimen CGRS-CT-1 started to expand horizontally and longitudinally based on the fracture sources, CGRS-CT-2 continued to expand, and the fracture sources at both ends of CGRS-CT-3 continued to develop and extend and were likely to converge. After final fracturing, the macroscopic cracks fully developed and formed a crack network of interconnected and interwoven fractures. In summary, it can be preliminarily determined that the fracture source of specimens CGRS-CT-1 and CGRS-CT-2 is the cavity. Under load, the cavity gradually evolved, leading to the generation of cracks. After loading and unloading again, the bearing capacity of the sample decreased, and finally, the crack expanded further and led to the formation of the final fracture surface. However, the fracture source of sample CGRS-CT-3 warrants further analysis.

3.2. Crack Propagation during Rock Fracturing Process

To further distinguish the fracture sources of specimens, and clarify the trend of crack expansion, specimen CGRS-CT-3 was taken as an example of these aspects in both the spatial and temporal domains. Figure 7 shows the longitudinal CT slices of specimen CGRS-CT-3 at different loading stages (the yellow and red curves indicate cracks).
-
First (Figure 7b) and second (Figure 7c) scans: the specimens showed no cracks in the initial state and the compaction stage.
-
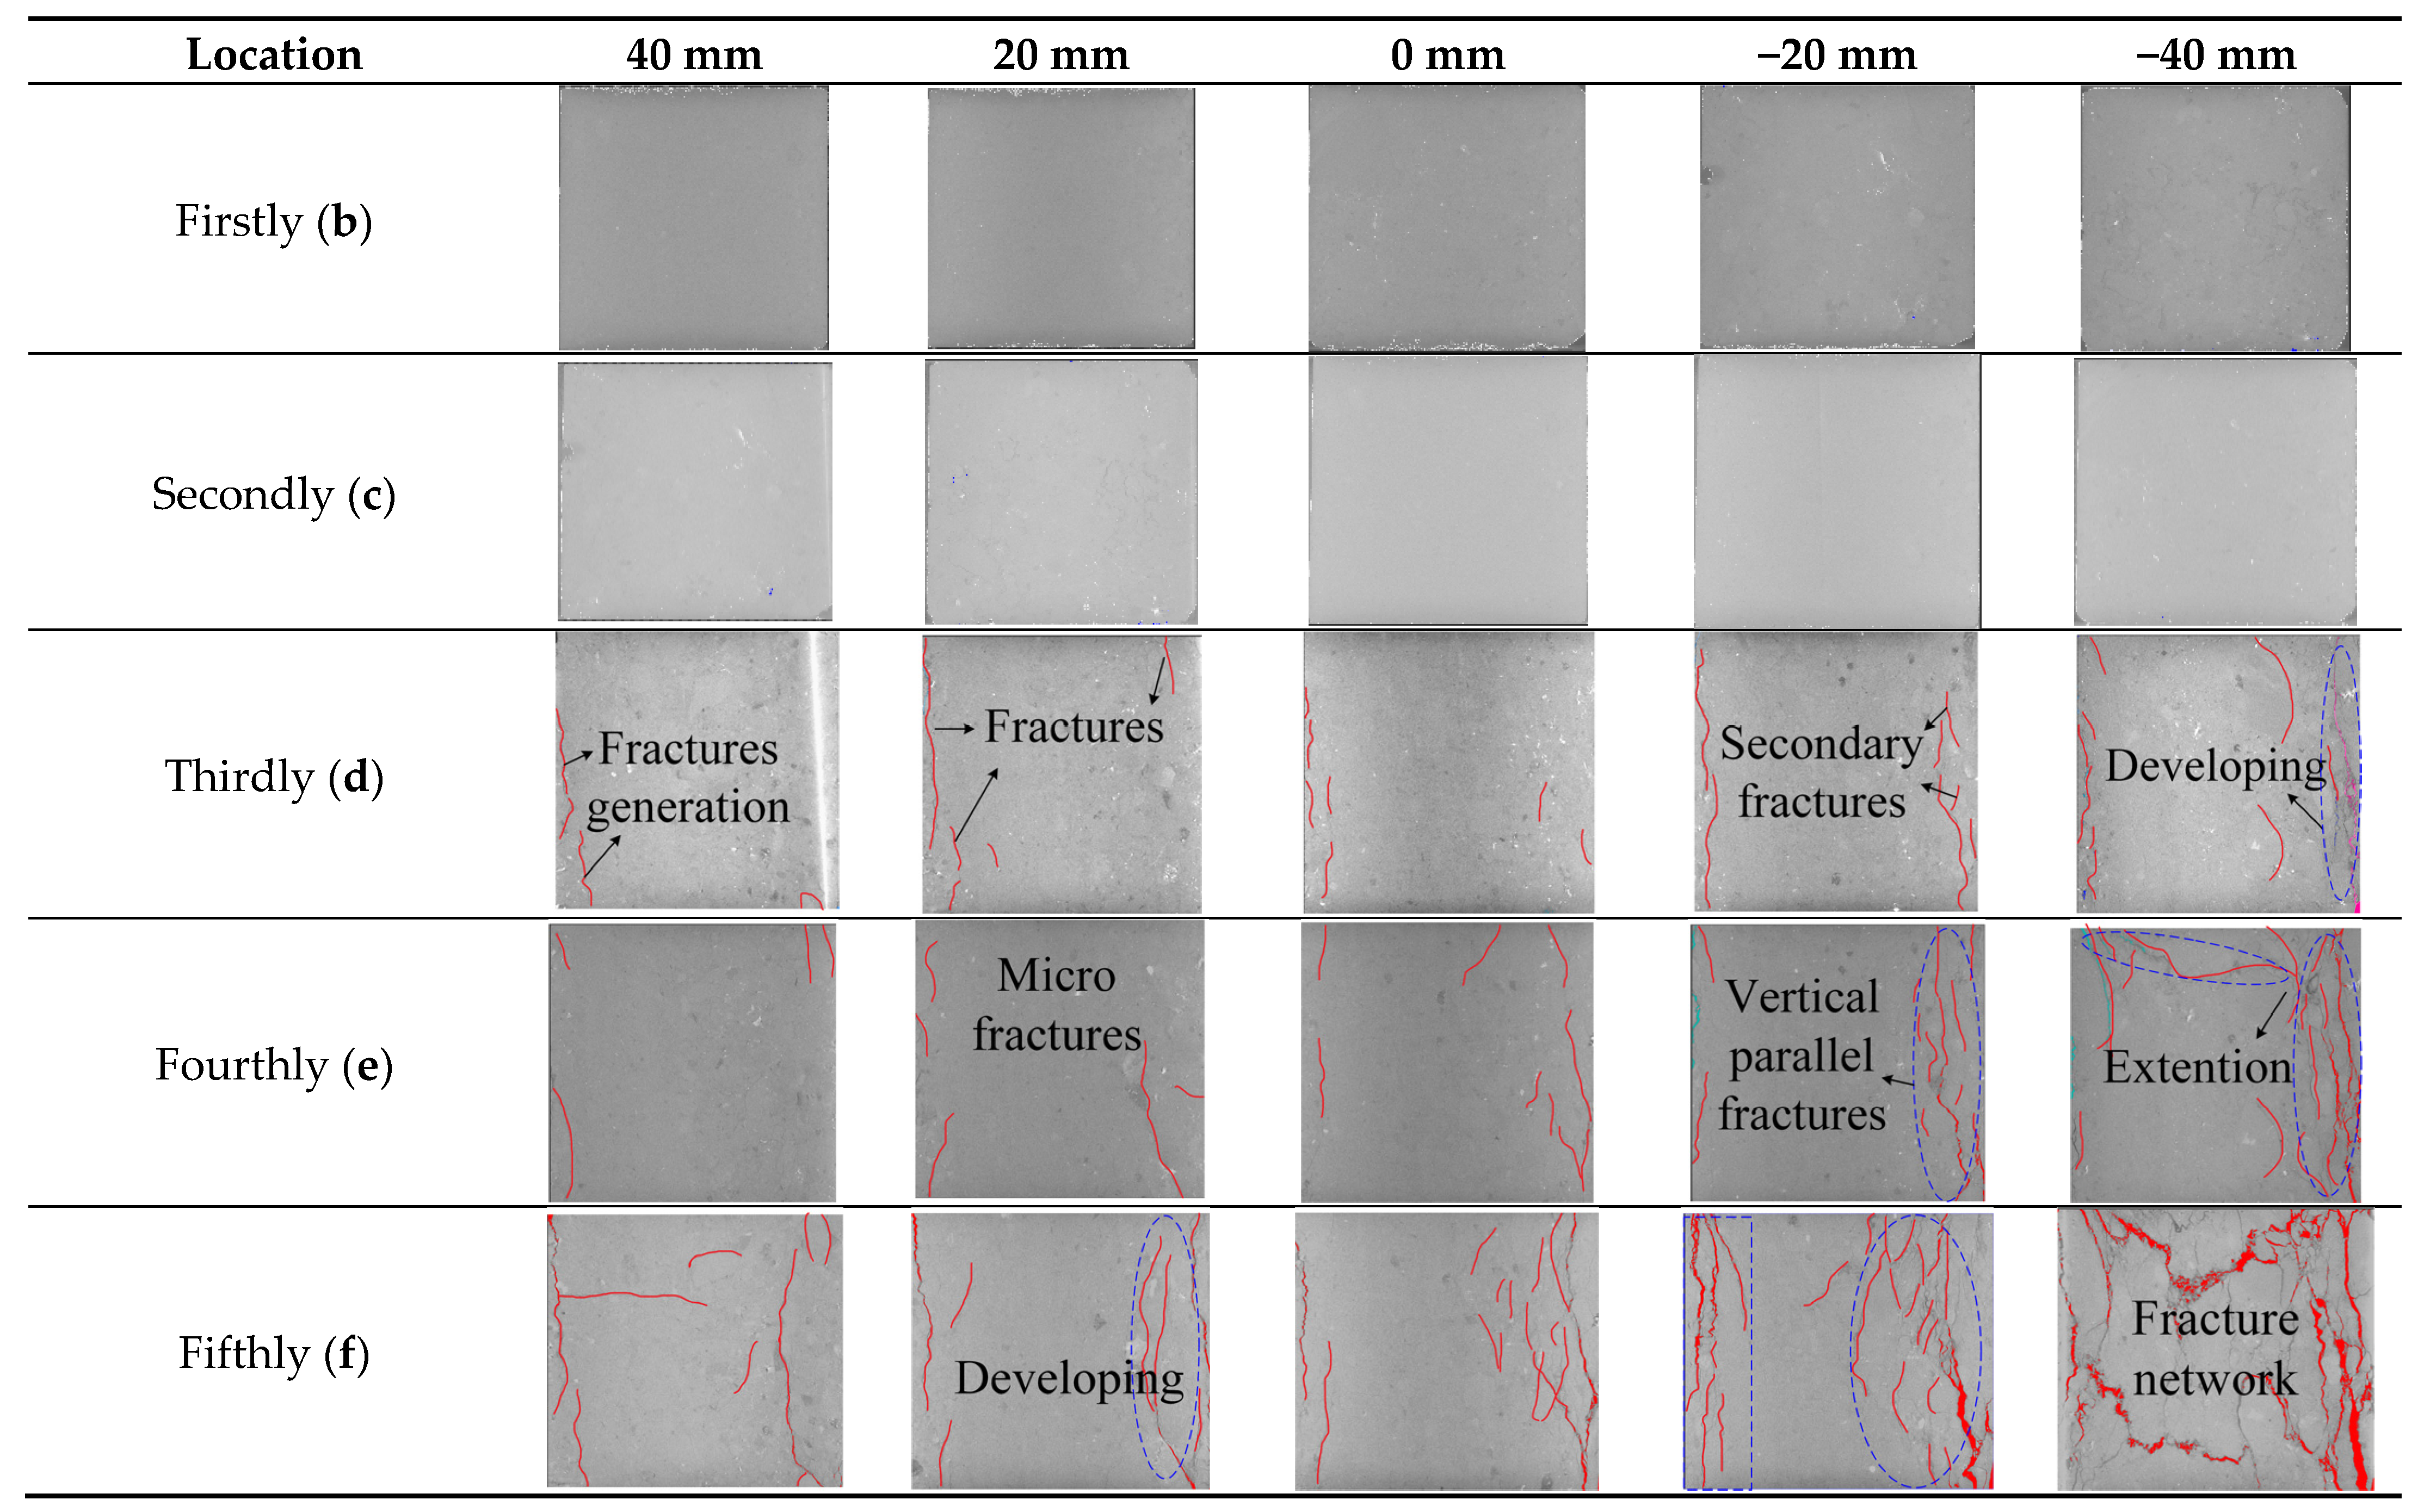
Third scan (Figure 7d): In the corresponding elastic phase, fractures could be found in all slices. On the slice at 40 mm, the fracture occurred at the edge of the specimen. On the slices at 20 and 0 mm, the number of microfractures gradually increased. On the slice at −20 mm, evidence of secondary fracture production can be found in a vertical distribution parallel to the end of the specimen. On the slice at −40 mm, the fracture on the right-hand side of the sample penetrated both end surfaces and extended to the middle area.
-
Fourth scan (Figure 7e): After the unstable fracture stage, the generation and expansion of microfractures could be found on the slices at 40 and 20 mm, and compared with the previous stage, the distribution of fractures did not change much. On the slice at 0 mm, the number of fractures on the right-hand side of the sample gradually increased with a tendency to penetrate the upper and lower end surfaces. On the slice at −20 mm, the fractures on the right-hand side were approximately vertically parallel, with the upper and lower end surfaces connected. On the slice at −40 mm, the transverse fracture on the left-hand side and the vertical fracture on the right were connected to each other.
-
Fifth scan (Figure 7f): After the final fracture, compared with the previous stage, on the slices at 40 and 20 mm, both the length of the fracture and the degree of fracture propagation were increased. On the slice at −20 mm, there were many more branching fractures, which were distributed on both sides of the sample. On the slice at −40 mm, the branching fractures were inter-connected, and a more complex fracture network was formed.

3.3. Types of Fracture Sources Based on Meso-Structure Scale

3.3.1. Fracture Sources of Pore Structure

There is a positive relationship between pore structure and crack initiation. The pore structure reduced the strength of specimens, readily causing local stress concentration, and rapidly reaching the stress required for crack initiation. Then, the cracks were mostly generated at the pore tip [41]. The meso-scale pores were one fracture source, and pore concentration and pore volume can be used to depict the proportion of pores. To ascertain that the fracture source of samples CGRS-CT-1 and CGRS-CT-2 was caused by pore concentration, the area of pore concentration was determined by coordinates, and this area was selected as the object of study and the percentage of pore volume in this area to the total pore volume was calculated. The proportion of pore volume of specimen CGRS-CT-1 was 18.75%, in specimen CGRS-CT-2 it reached to 23.56%, and in specimen CGRS-CT-3 it was 34.09% (Table 2).

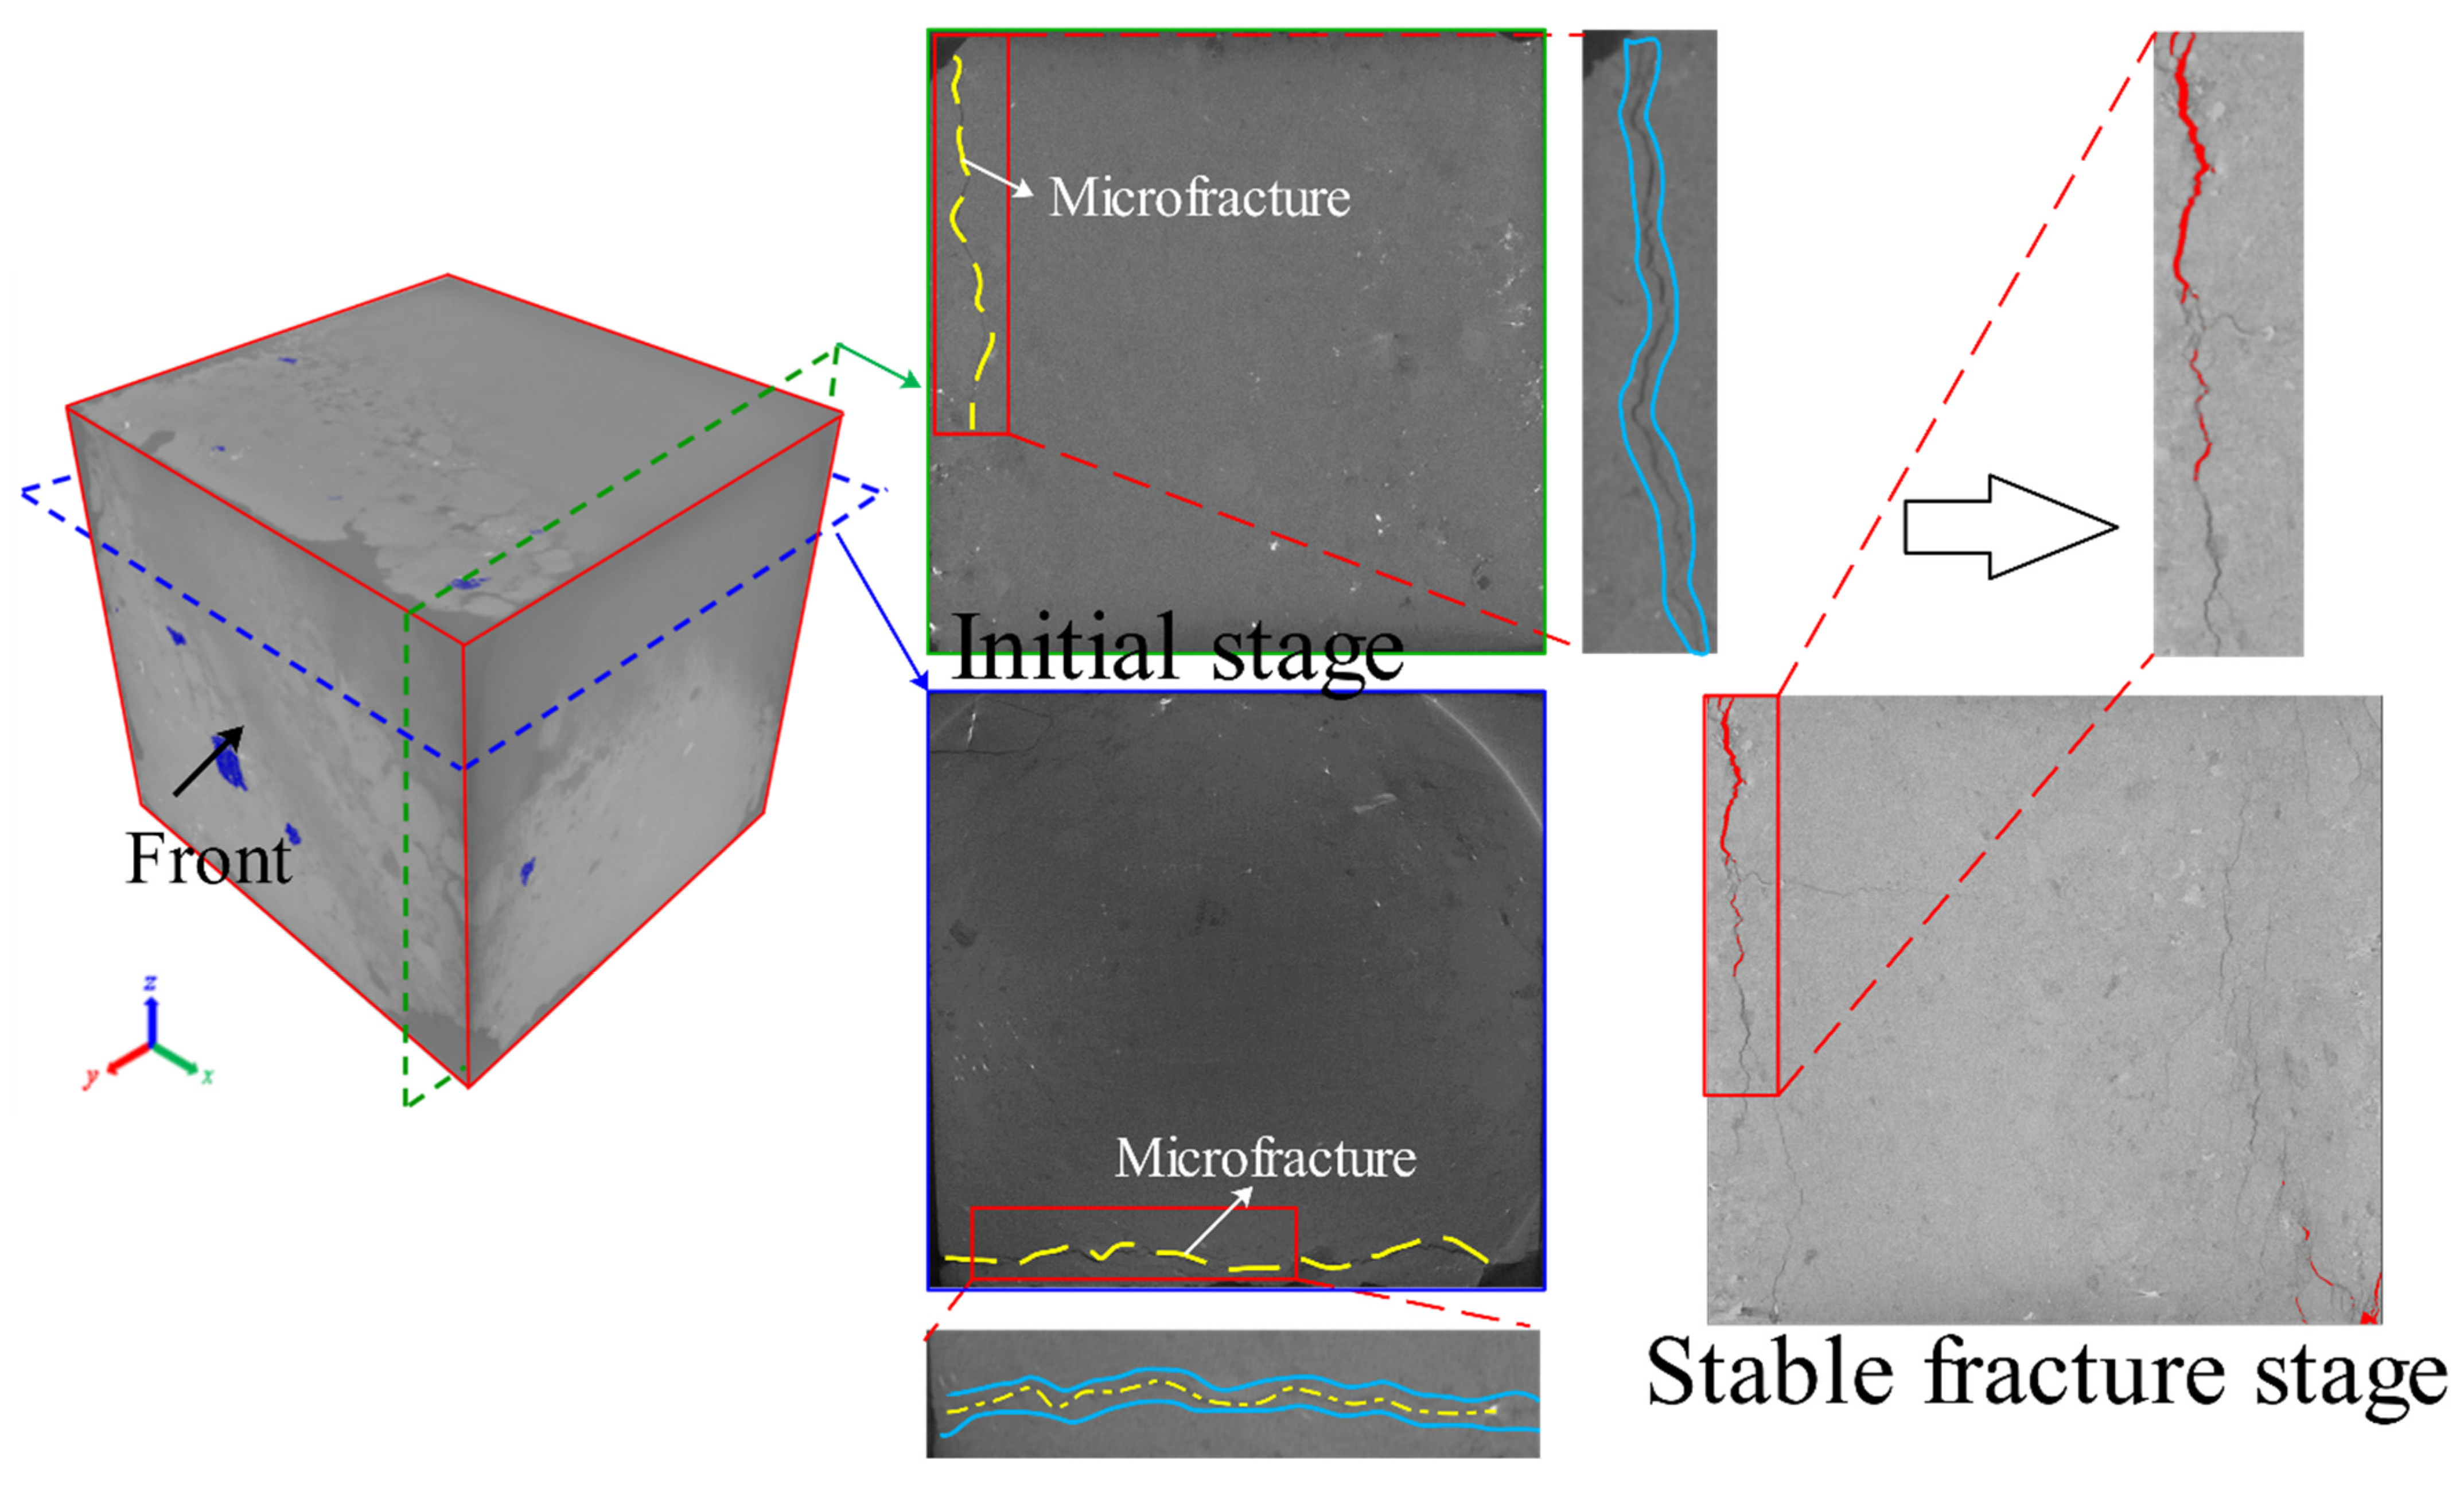
3.3.2. Fracture Sources of Micro-Cracks

The presence of micro-cracks also affected the crack initiation. Specimen CGRS-CT-3 had a micro-crack in its initial state, so the transverse and longitudinal CT slices were selected for micro-crack analysis (Figure 8).
The position of the crack and the initial micro-crack overlapped, indicating that the crack was closely related to the micro-crack. When the crack angle ran parallel to the direction of the applied load, most of the cracks were generated from the crack-tip [42]. The micro-cracks expanded and developed under continuous loading, forming a flake-like fracture network in the elastic stage.

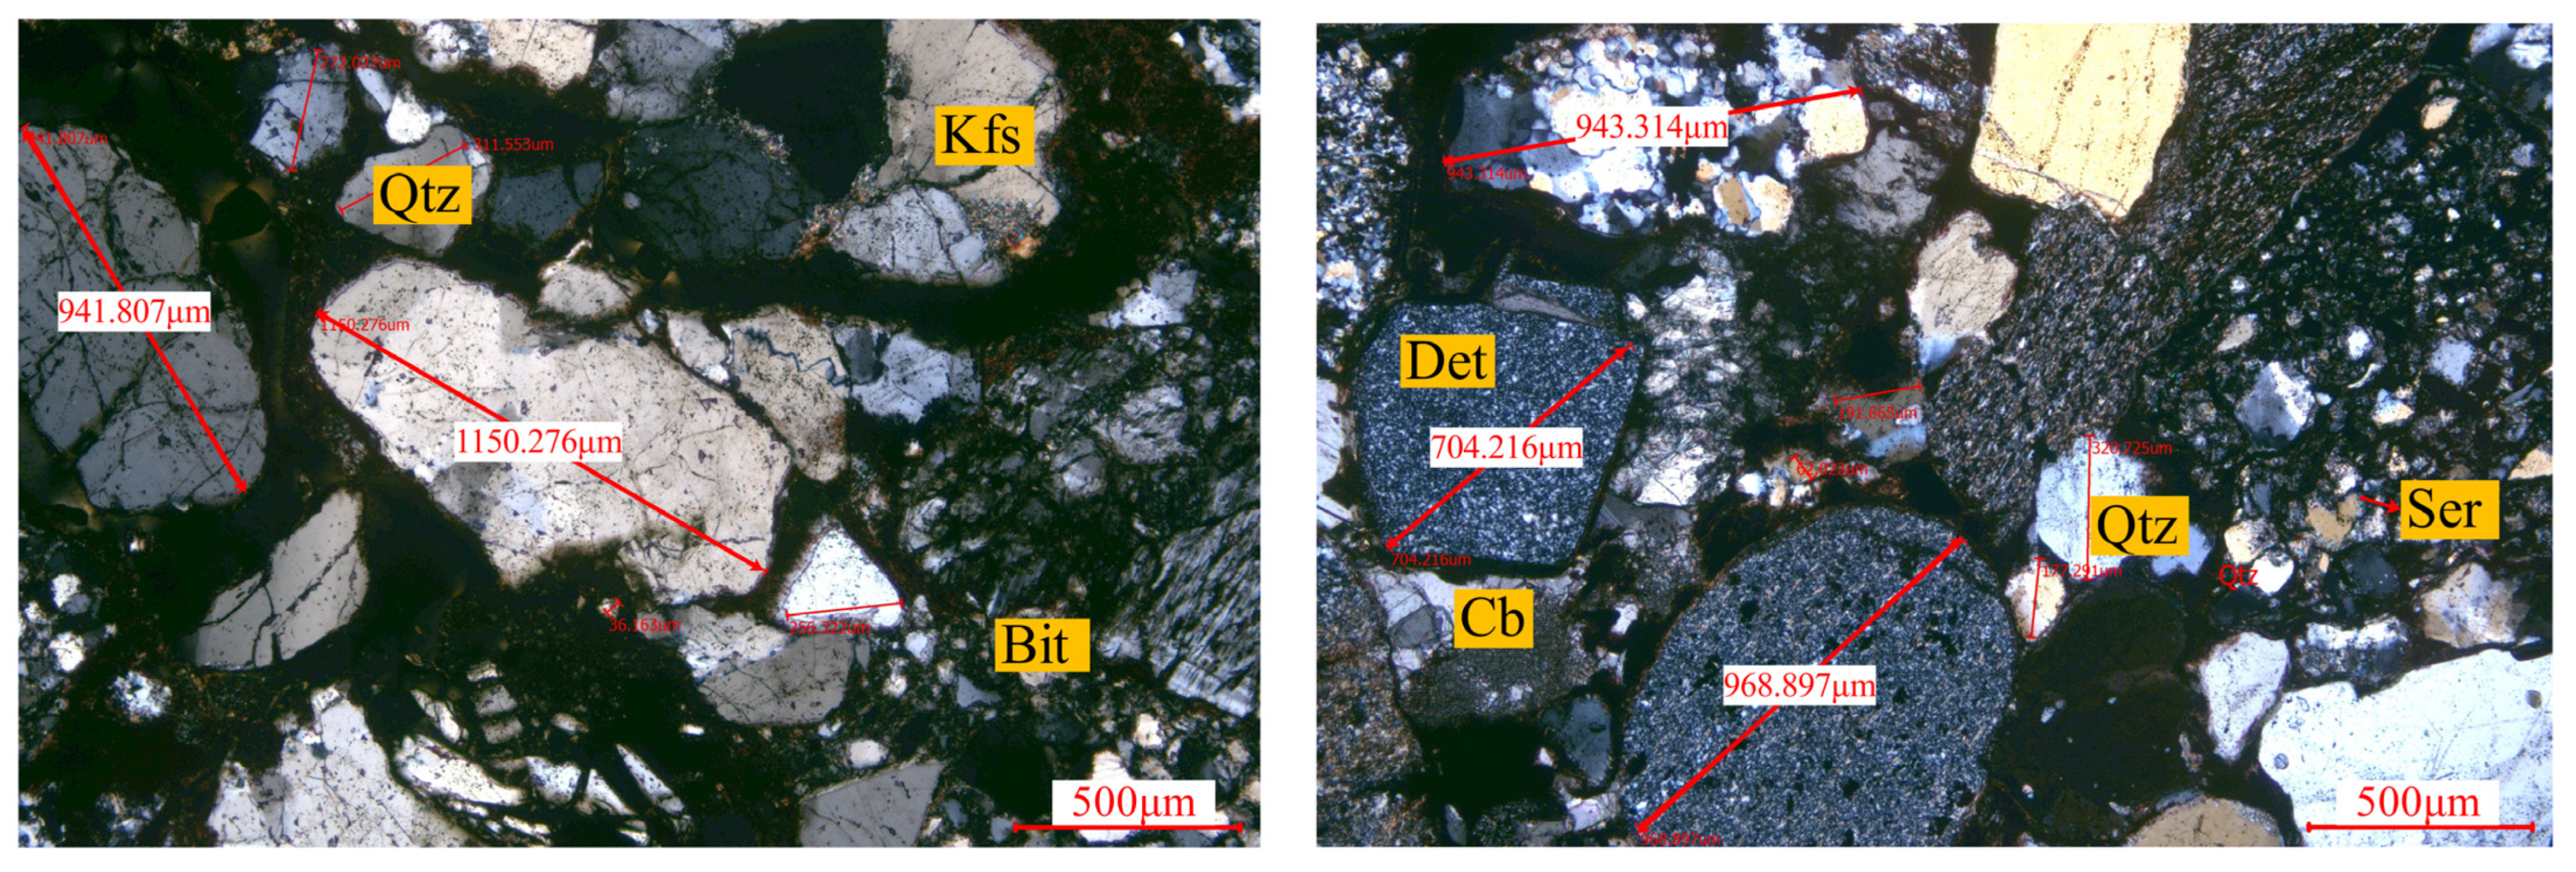
3.3.3. Fracture Sources of Mineral Particles

Mineral particles affect crack initiations, e.g., specimen CGRS-CT-3 was taken as an example to explore the characteristics of the mineral particle distributions. In Figure 9, the analysis of the longitudinal slice at this position indicates a mineral particle (particle R) at the middle and lower position of the fracture path. A large quartz particle was present near the side surface, which was near particle R. The crack expanded around it and was likely to extend in other directions.
Point-to-point contact mostly arose between the large pieces of quartz, cuttings, and particle R (Figure 9). Particles formed the framework in this area, and cement and interstitial matter filled the contact surface. The particles were prone to deformation under the external force, leading to cracking.

4. Discussion

4.1. Physical Mechanisms of Fracture Source Classification

Mineral particles and microfractures are encountered along the tip path, which change the state of extension of the cracks. The pore distribution and the existence of initial micro-cracks provide necessary conditions for their generation. The cementation and contact methods between mineral particles have a positive effect on subsequent crack generation. The location of fracture sources is likely to affect the strength of the mineral particles [43].
Compared with other areas, there are no large particles (>2–3 mm) in which there is mainly sandstone matrix. The rock cuttings are distributed in aggregated form, and the mechanical properties are weak. Thus, it is prone to generation of fracture sources. The fracture sources on the right-hand side of specimen CGRS-CT-3 generated by the initial micro-cracks continue to develop into a fracture surface. The fracture sources on the left are generated at the boundary of the mineral grains. The point-contacted particles are prone to dislocation and cementation under loading. The cementing material ruptures and produces fracture sources.
According to the different microscopic characteristics around the fracture sources, the fracture sources can be divided into three different types: the pore-based, the micro-crack-based, and the mineral particle-based.

4.2. Influence of Rock Physical Properties on Crack Propagation

4.2.1. Mineral Particle Strength

The crack propagation path is affected by the strength of the particles. The cracking path has places where mineral particles and debris aggregates are cemented as well as low-strength carbonate minerals and iron oxide debris aggregates, through which fractures will propagate (Table 3). The physical and mechanical properties of minerals, such as quartz and feldspar, and carbonate minerals are different, including the strength, and with continuous external loading, the deformation of the particles also varies [44]; thus, cracks easily expand and extend between them. Cracks mainly follow the path with the least energy required for expansion [45].
Cracks mostly expand along areas with weak mechanical properties, while the extension of tensile cracks is small, and the cracks are likely to change in direction due to the influence of the microstructure on the path [46]. A hard mineral particle could be observed on the crack propagation path at the upper end of specimen CGRS-CT-3, that is, point e (Figure 10), which serves as the fracture source for the next period, and the crack expands from here. After being blocked, multiple branching cracks appear.

4.2.2. Mineral Spatial Distributions

To evaluate the influence of the spatial distribution of minerals on crack expansion, the initial state of the mineral distribution inside the specimen after CT scanning was extracted. The result shows that the overall mineral distribution is similar to the fracture network distribution after failure. The specific distribution can be divided into two parts (Figure 11a). Many complex particles are observed in the middle and upper parts, and the lower part, distributed in bands. The overall spatial distribution of the fracture network after destruction is closely related to the particle distribution in the initial state (Figure 11b,c). Most of the particles at the upper end of the specimen are already discrete, and the particles and gravel show signs of collapsing and spalling (Figure 11d). This special failure mode is consistent with “quasi-phase transition” theory [47]. The cracks continue to extend between the particles, and the nature of the specimen itself and the boundary conditions limit the internal coarse particles or gravel will collapse or spall.
There exist many kinds of point-to-point or point-to-surface areas, and high local stress concentration will appear in these areas. The cracks expand between the contact surfaces, which are distributed in a net-like shape. The cementation materials between the particles affect the mechanical properties of the rock [48]. The spatial distribution of mineral particles is of great importance and influences the distribution morphology of the fracture network.

5. Conclusions

(1) The generation of rock fracture sources was visualized by CT scanning: There are three types of fracture source (pore-based, microfracture-based, and mineral particle-based). The pores and the initial micro-cracks were the initial weak surfaces. The fracture sources of mineral particles’ type were formed by destruction of the cemented materials under load.
(2) The expansion of the fracture path and mineral grains was revealed with the help of a polarizing microscope. According to the analysis of mineralogical characteristics, the mechanical properties of different mineral particles along the fracture propagation path can be obtained. Finally, the modes of propagation of cracks between particles with different intensities were obtained. The crack expansion around mineral particles can be determined by the strength of the mineral particle. The cracks between high-strength mineral particles, such as quartz, expanded around it, and the low-strength carbonates and rock cuttings and other particles expanded through it.
(3) The spatial distribution of cracks in the sample and the mineral distribution state in the original state were compared and studied by 3D reconstruction of the model. It can be concluded that there is a close relationship between the fracture evolution path and the fracture morphology: their distributions maintain a high degree of consistency, and the fracture morphology is more complicated in areas where minerals are concentrated. The expansion of cracks at the boundary between large particles and gravel also causes gravel collapse and shedding.

Author Contributions

Writing—original draft preparation, G.G.; software, S.Y.; data curation, X.L., X.Y. and P.L.; supervision, Y.X.; funding acquisition, Y.Z. All authors have read and agreed to the published version of the manuscript.

Funding

This research was funded by the National Natural Science Foundation of China (grant number 51774138, 51804122, 52074123), the Natural Science Foundation of Hebei Province(grant number E2021209052, E2021209148).

Institutional Review Board Statement

Not applicable.

Informed Consent Statement

Not applicable.

Data Availability Statement

Data is contained within the article.

Acknowledgments

The authors would like to thank all the technicians who worked on the experimental process. The authors also would like to express their sincere appreciation to the reviewers for their constructive comments on the revision and improvement of the manuscript. All the support is gratefully acknowledged.

Conflicts of Interest

The authors declare no conflict of interest.

References

  1. Xu, S.J.; Yin, X.T.; Dang, F.N. Mechanical characteristics of rock and soil affected by particle size of crystal and mineral. Rock Soil Mech. 2009, 30, 2581–2587. [Google Scholar] [CrossRef]
  2. Qin, Y.D.; Wang, H.; Wang, Z.X. Failure mechanism and control analysis of fractured and easily weathered roadway in deep mining. China Min Mag. 2020, 29, 388–393. [Google Scholar] [CrossRef]
  3. Anders, M.H.; Laubach, S.E.; Scholz, C.H. Microfractures: A review. J. Struct. Geol. 2014, 69, 377–394. [Google Scholar] [CrossRef] [Green Version]
  4. Wittmann, F.H.; RoelfstraP, E.; Sadouki, H. Simulation and analysis of composite structures. Mater. Sci. Eng. 1985, 68, 239–248. [Google Scholar] [CrossRef]
  5. Yu, Q.; Yang, T.; Zheng, C.; Tang, C.A.; Wang, P.T. Numerical analysis of influence of rock mesostructure on its deformation and strength. Rock Soil Mech. 2011, 32, 3468–3472. [Google Scholar] [CrossRef]
  6. Zhao, B.; Wang, Z.Y.; Wu, J.P. Relation between mineralogical composition and microstructure to the mechanical properties of rock materials. Coal Geol. Explor. 2013, 41, 59–63, 67. [Google Scholar] [CrossRef]
  7. Zhang, G.K.; Li, H.B.; Xia, X.; Li, J.R.; Li, X.F.; Song, T. Effects of microstructure and micro parameters on macro mechanical properties and failure of rock. Chin. J. Rock Mech. Eng. 2016, 35, 1341–1352. [Google Scholar] [CrossRef]
  8. Deng, C.F.; Liu, J.F.; Chen, L.; Li, Y.; Xiang, G. Fracture mechanical behaviors and acoustic emission characteristics of Beishan granites with different particle sizes. Rock Soil Mech. 2016, 37, 2313–2320. [Google Scholar] [CrossRef]
  9. Zhao, Y.C.; Liu, H.L.; Yang, T.H.; Xu, T.; Li, Y.; Hou, X.G.; Qin, Y. Effect of mesozoic sandstone meso structure on strength and energy dissipation characteristic. J. China Coal Soc. 2017, 42, 452–459. [Google Scholar] [CrossRef]
  10. Zhao, K.; Zhou, Y.T.; Zeng, P.; Yang, Z.Y.; Liu, C.F. Experimental study on acoustic emission characteristics of rock-like materials with different particle sizes under three-point bending. J. China Coal Soc. 2018, 43, 3107–3114. [Google Scholar] [CrossRef]
  11. Li, J.; Yilmaz, E.; Cao, S. Minerals influence of solid content, cement/tailings ratio, and curing time on rheology and strength of cemented tailings backfill. Minerals 2020, 10, 922. [Google Scholar] [CrossRef]
  12. Cao, S.; Xue, G.L.; Yilmaz, E.; Yin, Z.Y.; Yang, F.D. Utilizing concrete pillars asan environmental mining practice in underground mines. J. Clean. Prod. 2021, 278, 123433. [Google Scholar] [CrossRef]
  13. Cao, S.; Yilmaz, E.; Yin, Z.Y.; Xue, G.L.; Song, W.D.; Sun, L.J. CT scanning of internal crack mechanism and strength behavior of cement-fibertailings matrix composites. Cem. Concr. Compos. 2020, 116, 103865. [Google Scholar] [CrossRef]
  14. Ji, H.G.; Jiang, H.; Song, C.Y.; Liu, Z.Q.; Tan, J.; Liu, Y.J.; Wu, Y.F. Analysis on the microstructure evolution and fracture morphology during the softning process of weakly cemeted sandstone. J. China Coal Soc. 2018, 43, 993–999. [Google Scholar] [CrossRef]
  15. Song, C.Y.; Ning, F.B. Progress on the Association between Mesostructural Parameters and Macromechanical Behaviors of Weakly Cemented Rocks. Met. Mine. 2018, 12, 1–9. [Google Scholar] [CrossRef]
  16. Hasanipanah, M.; Meng, D.; Keshtegar, B.; Behrooz, K.; Nguyen, T.T.; Duc, K.T. Nonlinear models based on enhanced Kriging interpolation for prediction of rock joint shear strength. Neural Comput. Appl. 2021, 33, 4205–4215. [Google Scholar] [CrossRef]
  17. Huang, J.D.; Zhang, J.; Gao, Y. Intelligently predict the rock joint shear strength using the support vector regression and Firefly Algorithm. Lithosphere 2021, 2021, 2467126. [Google Scholar] [CrossRef]
  18. Ge, Y.F.; Tang, H.M.; Eldin, M.A.; Wang, L.Q.; Wu, Q.; Xiong, C.R. Evolution process of natural rock joint roughness during direct shear tests. Int. J. Geo. 2016, 17, E4016013. [Google Scholar] [CrossRef]
  19. Han, Q.; Feng, X.T.; Yang, C.X.; Kong, R.; Zhao, J.; Zhang, Y. Evaluation of the crack propagation capacity of hard rock based on stress-induced deformation anisotropy and the propagation angle of volumetric strain. Rock. Mech. Rock. Eng. 2021, 54, 6585–6603. [Google Scholar] [CrossRef]
  20. Sun, W.; Wu, A.; Hou, K.; Yang, Y.; Liu, L.; Wen, Y. Real-time observation of meso-fracture process in backfill body during mine subsidence using X-ray CT under uniaxial compressive conditions. Constr. Build. Mater. 2016, 113, 153–162. [Google Scholar] [CrossRef]
  21. Liu, S.; Wang, Z.; Zhang, L. Experimental study on the cracking process of layered shale using X-ray microCT. Energy Explor. Exploit. 2018, 36, 297–313. [Google Scholar] [CrossRef] [Green Version]
  22. Duan, Y.; Li, X.; Zheng, B.; He, J.; Hao, J. Cracking Evolution and Failure Characteristics of Longmaxi Shale Under Uniaxial Compression Using Real-Time Computed Tomography Scanning. Rock. Mech. Rock. Eng. 2019, 52, 3003–3015. [Google Scholar] [CrossRef]
  23. Wang, M.; Wan, W.; Zhao, Y. Experimental study on crack propagation and the coalescence of rock-like materials with two preexisting fissures under biaxial compression. Bull. Eng. Geol. Environ. 2020, 79, 3121–3144. [Google Scholar] [CrossRef]
  24. Pu, C.Z.; Cao, P. Failure characteristics and its influencing factors of rock-like material with multi-fissures under uniaxial compression. Trans. Nonferrous Met. Soc. China 2012, 22, 185–191. [Google Scholar] [CrossRef]
  25. Wang, D.J.; Tang, H.M.; Elsworth, D.; Wang, C.Y. Fracture evolution in artificial bedded rocks containing a structural flaw under uniaxial compression. Eng. Geol. 2019, 250, 130–141. [Google Scholar] [CrossRef]
  26. Du, M.R.; Jing, H.W.; Su, H.J.; Zhu, T.T. Experimental study of strength and failure characteristics of sandstone containing prefabricated elliptical hole. J. China Univ. Min. Technol. 2016, 45, 1164–1171. [Google Scholar] [CrossRef]
  27. Zhu, T.T.; Jing, H.W.; Su, H.J.; Yin, Q. Experimental investigation on mechanical behavior of sandstone with coupling effects under uniaxial compression. J. China Coal Soc. 2015, 40, 1518–1525. [Google Scholar] [CrossRef]
  28. Han, G.S.; Jing, H.W.; Su, H.J.; Zhu, T.T.; Du, M.R.; Xiong, F.; Wu, J.Y. Experimental study on compressive strength and fracture characteristics of sandstone containing double circular cavities. J. China Coal Soc. 2017, 42, 871–878. [Google Scholar] [CrossRef]
  29. Laubach, S.E.; Lander, R.H.; Criscenti, L.J.; Anovitz, L.M.; Urai, J.L.; Pollyea, R.M.; Hooker, J.N.; Narr, W.; Evans, M.A.; Kerisit, S.N.; et al. The role of chemistry in fracture pattern development and opportunities to advance interpretations of geological materials. Rev. Geophys. 2019, 57, 1065–1111. [Google Scholar] [CrossRef] [Green Version]
  30. Karfakis, M.G.; Akram, M. Effects of chemical solutions on rock fracturing. Int. J. Rock Mech. Min. Sci. Geomech. Abstr. 1993, 30, 1253–1259. [Google Scholar] [CrossRef]
  31. Miao, S.J.; Cai, M.F.; Guo, Q.F.; Wang, P.T.; Liang, M.C. Damage effects and mechanisms in granite treated with acidic chemical solutions. Int. J. Rock Mech. Min. Sci. 2016, 88, 77–86. [Google Scholar] [CrossRef]
  32. Přikryl, R. Some microstructural aspects of strength variation in rocks. Int. J. Rock Mech. Rock. Eng. 2001, 38, 671–682. [Google Scholar] [CrossRef]
  33. Han, Z.H.; Zhang, L.Q.; Zhou, J. Effect of mineral particle size heterogeneity on mechanical properties in PFC2D simulation. J. Eng. Geol. 2019, 27, 706–716. [Google Scholar] [CrossRef]
  34. Han, Z.H.; Zhang, L.Q.; Zhou, J.; Yuan, G.X.; Wang, P.J. Uniaxial compression test and numerical studies of grain size effect on mechanical properties of granite. J. Eng. Geol. 2019, 27, 497–504. [Google Scholar] [CrossRef]
  35. Sun, C.; Ao, Y.H.; Zhang, J.M.; Wang, S. Particle flow of meso-fracture characteristics and macro-scale effect of granites. Chin. J. Geotech. Eng. 2020, 42, 1687–1695. [Google Scholar] [CrossRef]
  36. Ye, G.; Cao, H.; Gao, Q.; Zhang, Z.; Wang, T.Y. Numerical simulation study on the influence of particle proportion on rock mechanics characteristics. J. Mech. 2019, 25, 1129–1137. [Google Scholar] [CrossRef]
  37. Bai, Q.; Tu, S.; Zhang, C. DEM investigation of the fracture mechanism of rock disc containing hole(s) and its influence on tensile strength. Theor. Appl. Fract. Mech. 2016, 86, 197–216. [Google Scholar] [CrossRef]
  38. Yu, Q.L.; Ranjith, P.G.; Liu, H.Y.; Yang, T.H.; Tang, C.A.; Yang, S.Q. A Mesostructure-based Damage Model for Thermal Cracking Analysis and Application in Granite at Elevated Temperatures. Rock. Mech. Rock. Eng. 2015, 48, 2263–2282. [Google Scholar] [CrossRef]
  39. Cai, M. Rock Mechanics and Engineering, 2nd ed.; Science Press: Beijing, China, 2018; pp. 44–46. [Google Scholar]
  40. Liu, X.X.; Wu, L.X.; Zhang, Y.B.; Wang, S.Z.; Yao, X.L.; Wu, X.Z. The characteristics of crack existence and development during rock shear fracturing evolution. Bull. Eng. Geol. Environ. 2020, 80, 1–12. [Google Scholar] [CrossRef]
  41. Li, J.; Kong, X.C.; Song, M.S.; Wang, Y.; Wang, H.; Liu, X.L. Study on the influence of reservoir rock micro-pore structure on rock mechanical properties and crack propagation. Rock Soil Mech. 2019, 40, 4149–4156, 4164. [Google Scholar] [CrossRef]
  42. Wang, H.; Li, Y.; Cao, S.G.; Pan, R.K.; Yang, H.Y.; Zhang, K.W.; Liu, Y.B. Brazilian splitting test study on crack propagation process and macroscopic failure mode of pre-cracked black shale. Chin. J. Rock Mech. Eng. 2020, 39, 912–926. [Google Scholar] [CrossRef]
  43. Li, M.; Guo, Y.; Wang, H.; Li, Z.; Hu, Y. Effects of mineral composition on the fracture propagation of tight sandstones in the Zizhou area, east Ordos Basin, China. J. Nat. Gas. Sci. Eng. 2020, 78, 103334. [Google Scholar] [CrossRef]
  44. Li, B.F.; Zuo, Y.J.; Li, W.; Cao, J. Analysis on fracture mechanics of granite containing flaws based on digital image processing. Mech Pract. 2016, 38, 262–268. [Google Scholar] [CrossRef]
  45. Zhang, C.; Yang, Q.J.; Cao, W.G. Simulation method of rock deformation and failure process considering initial imperfection and elastic modulus. Chin. J. Appl. Mech. 2020, 37, 286–292. [Google Scholar] [CrossRef]
  46. David, C.; Menéndez, B.; Bernabé, Y. The mechanical behaviour of synthetic sandstone with varying brittle cement content. Int. J. Rock Mech. Min. Sci. 1998, 35, 759–770. [Google Scholar] [CrossRef]
  47. Song, C.Y.; Ji, H.G.; Zeng, P.; Sun, L.H.; Tan, J. Phase-like transition characteristics of uniaxial compression failure of weakly cemented coarse-grained sandstone in western china. J. Min. Saf. Eng. 2020, 37, 1027–1036. [Google Scholar] [CrossRef]
  48. Song, C.Y. The Analysis and Application of mesoscopic Structure Characteristic and Deformation and Failure Mechanism of Weak Cemeted Sandstone. Ph.D. Thesis, Beijing University of Science and Technology, Beijing, China, 2017. [Google Scholar]
Figure 1. The sandstone blocks prepared for strength testing and CT scanning. “CGRS-CT” indicates: Coarse Grain Red Sandstone-CT. The length, width, and height of the specimens are all 100 mm. The type of specimen is a sedimentary rock, and the mineral grains within it vary in size, with good CT imaging results. To ensure the consistency of the experiment, the laminar direction and the loading direction are parallel.
Minerals 12 00094 g001
Figure 2. Particle size distribution. D indicates the particle size, φ is the common particle size unit for particle size analysis, and the relationship between the two can be expressed by the equation: φ = −log2D. The rock interior has the highest percentage of coarse sand content, followed by medium sand, and the lowest content of silt sand.
Minerals 12 00094 g002
Figure 3. Images of a rock thin section observed under a polarized light microscope with a scale of 500 μm. These mineral grains on the graph were identified according to the characteristics of the different mineral species. Det: Detritus; Qtz: Quartz; Kfs: Potash feldspar; Cb: Carbonate minerals; Ser: Sericite; Bit: Biotite.
Minerals 12 00094 g003
Figure 4. Experimental equipment and key flow diagram. (a) The specimens were tested with a uniaxial press after they were pre-treated. (b) The specimen was taken into the CT machine for scanning after it had been loaded and unloaded. (c) The 3D reconstructed model of the specimen was obtained after a series of processing of the rock images from the CT scan. (d) Slices in different directions can be selected by using the intercepted plane work of the software. (e) Intercepted sections of the specimen in the vertical direction for analysis.
Minerals 12 00094 g004
Figure 5. Schematic diagram of the cyclic loading and unloading process and CT scanning points. Each time, the specimen was loaded to a predetermined intensity value and then unloaded to 0, the CT scan was then performed, and so on. The red dots show the CT scan points.
Minerals 12 00094 g005
Figure 6. Three-dimensional crack spatial distribution of samples in different stages of the fracturing process. Horizontal graphs represent the same specimen in 3D at different scanning stages. The morphological distribution of cracks from sprouting to final rupture after loading of the specimens was recorded in detail.
Minerals 12 00094 g006
Figure 7. Slices of specimens in different positions. (a) Schematic diagram of section location, the specimen has a side length of 100 mm, the center of the specimen is the origin, the middle position is at 0 mm, and the sides are 50 and −50 mm each. The distribution of the fracture extension after the specimen has been loaded and unloaded several times. (b) Slices of the first CT scan. (c) Slices of the second CT scan. (d) Slices of the third CT scan. (e) Slices of the fourth CT scan. (f) Slices of the fifth CT scan.
Minerals 12 00094 g007aMinerals 12 00094 g007b
Figure 8. Schematic diagram of CT section. Extension and matching of microfractures in the initial and stable rupture stages.
Minerals 12 00094 g008
Figure 9. Results of fracture surface scanning. The meso-structural features at the source of fracture in rock sections of different orientations are shown, and it can be seen that the source of fracture there is the surrounding structure of quartz particles and R particles.
Minerals 12 00094 g009
Figure 10. Bifurcation point and stress diagram. Point e is a hard particle, the fracture was subjected to shear stress when passing through the particle, and then a bifurcation occurs.
Minerals 12 00094 g010
Figure 11. Top view of mineral distribution and fracture. (a) Mineral distribution area. (b) Part of the fracture network. (c) Particles and cracks. (d) Particles of real rock. Comparing (a) and (b), it is obvious to see similarities between the two, the fractures are more complex in the area where mineral particles are concentrated, and the mineral distribution area is consistent with the distribution of fractures.
Minerals 12 00094 g011
Table 1. Scanning times and states of samples.
Scan TimesStress LevelCorresponding Load Value/kNDeformation Stage
First00.00Initial stage
Second0.3σc125.80Compaction stage
Third0.7σc293.50Stable fracture stage
Fourth
Fifth
0.9σc
--
377.4.0
--
Unstable fracture stage
After rupture
Table 2. Pore volume and proportion.
Sample NumberPore Volume at Fracture Source/mm3Proportion of Total Pore Volume
/%
CGRS-CT-1906.118.75
CGRS-CT-2386.823.56
CGRS-CT-3362.7534.09
Table 3. Distribution of mineral characteristics in key areas of the fracture path. Area I is a region containing a complex fracture network, and there are many quartz particles, feldspar, and rock debris. Area II is a region wherein the fracture extends from the end to the middle, and the particles here are very fine and diverse. Area III contains the intersections of secondary fractures and main fractures. The mineral particles are mostly quartz sand and gravel with complex composition. Area IV is an area wherein the secondary fractures become concentrated.
Critical Area of Fracture PathSingle Polarized SliceOrthogonal Polarizing Sheet
Minerals 12 00094 i001 Minerals 12 00094 i002 Minerals 12 00094 i003
Minerals 12 00094 i004 Minerals 12 00094 i005
Minerals 12 00094 i006 Minerals 12 00094 i007 Minerals 12 00094 i008
Minerals 12 00094 i009 Minerals 12 00094 i010
Publisher’s Note: MDPI stays neutral with regard to jurisdictional claims in published maps and institutional affiliations.

