Article

Effects of Transition Metal Ions on the Colour of Blue-Green Beryl

School of Gemmology, China University of Geosciences (Beijing), Beijing 100083, China
*
Author to whom correspondence should be addressed.
Minerals 2022, 12(1), 86; https://doi.org/10.3390/min12010086
Submission received: 20 November 2021 / Revised: 6 January 2022 / Accepted: 10 January 2022 / Published: 12 January 2022
(This article belongs to the Special Issue Gems and Gem Minerals)

Abstract

:
This study reports the effects of transition metal ions on the colour of blue-green beryl. Industrial cameras were used to measure colour in the CIELAB colour space. X-ray fluorescence (XRF), X-ray diffraction (XRD), infrared spectroscopy (IR), and ultraviolet-visible (UV–vis) spectroscopy were used for characterization. The d–d transition of Fe3+ with sixfold coordination, the O2−→Fe3+ charge transfer, and the charge transition of binuclear metal M–M complexes formed by [Fe2(OH)4]2+ in the channel caused a yellow tone, whereas the charge transfer of Fe2+/Fe3+ with sixfold coordination caused a blue-green tone. The chroma of blue-green beryl was negatively correlated with the ratio of Cs+Mn to Fe contents. The lightness of blue-green beryl was negatively correlated with the total content of transition metal ions.

1. Introduction

Beryl (Be3Al2Si6O18) is a ring silicate mineral occurring in pegmatites, granites, and some metamorphic rocks. Pure beryl is colourless and transparent, but when chromophores are present, beryl produces different colours, thus forming different gem subspecies, such as green emerald containing Cr3+, blue aquamarine containing Fe2+, and pink morganite containing Mn2+. These gemstones make up a large share in the market and are becoming more and more popular.
As with other coloured gemstones, colour is the most important quality of beryl to evaluate. However, in recent years, high-quality beryl has become scarce. Taking blue-green beryl as an example, the most popular on the market is aquamarine, though most blue-green beryl minerals have a low lightness, low chroma, and a grey tone. Therefore, many scholars and merchants attempt to change the colour of blue-green beryl by heat treatment to obtain high quality aquamarine. For colourless beryl, Qi et al. [1] found that with irradiation and an annealing treatment, centres of [H0]I, [Fe3+]OH, and [Fe43+] form, whereby a low temperature annealing conditions of 280 °C helps to improve the concentration of the radiation beryl colour centre, leading to orange-yellow beryl. Yang [2] conducted heat treatment experiments on blue-green, yellow-green, and grey-green beryl, and obtained the optimal heat treatment conditions. It was found that yellow-green beryl could be transformed into an ideal sea-blue colour after heat treatment. After treatment under optimized conditions, beryl of high quality can be obtained.
To further guide the optimization process, the chromatic genesis and its contribution to colour evaluation of blue-green beryl need to be studied first. Previously, different scholars found different results on its chromaticity mechanism. Goldman et al. concluded that the Fe2+ channel occupation in beryl caused the light blue colour, the Fe2+–Fe3+ charge transfer caused the aquamarine colour [3], and the coexistence of Fe3+ charge transfer and Fe2+ channel occupation caused the blue-green colour. The Fe3+ channel occupation caused a yellow/orange-yellow colour [3,4]. Hu [5] concluded that [Fe2(OH)4]2+ in the channel was the cause of the yellow colour of beryl. Zhong et al. [6] concluded that the blue-green colour of paraiba colour beryl was jointly influenced by Cu2+, Fe2+, Fe3+, and Ni2+ in the crystal structure, though no definite conclusion was formed.
In this paper, based on the results of previous research, the influence of the type and location of chromaticity ions on the colour of blue-green beryl is further explored. In order to quantitatively describe the colour parameters, the CIE standard colour system by the International Commission on Illumination is introduced. This system is a colour mixing system forming the base of modern chromaticity. CIE 1976 is widely used at present, based on the CIE 1931 standard colour system and the CIE 1964 supplementary standard colour system. Scholars have used this system to quantitatively describe coloured gems. For example, Jiang et al. [7] classified Australian chalcedony in the CIE 1976 LAB uniform colour space and Tang et al. [8] studied the influence of illumination on the colour of magnesium olivine in the CIE 1976 LAB uniform colour space.
K-means clustering enables the rapid classification of data, ensuring objectivity and accuracy, maximizing the similarity within clusters, and minimizing the similarity between clusters. It helps to integrate the original data in the process of data analysis and reduce the workload [9,10]. Previously, scholars have applied this method to gem colour classification [11,12,13,14]. This method was applied in this study when exploring the correlation between the content of transition metal elements and colour parameters L*, a*, and b*.

2. Materials and Methods
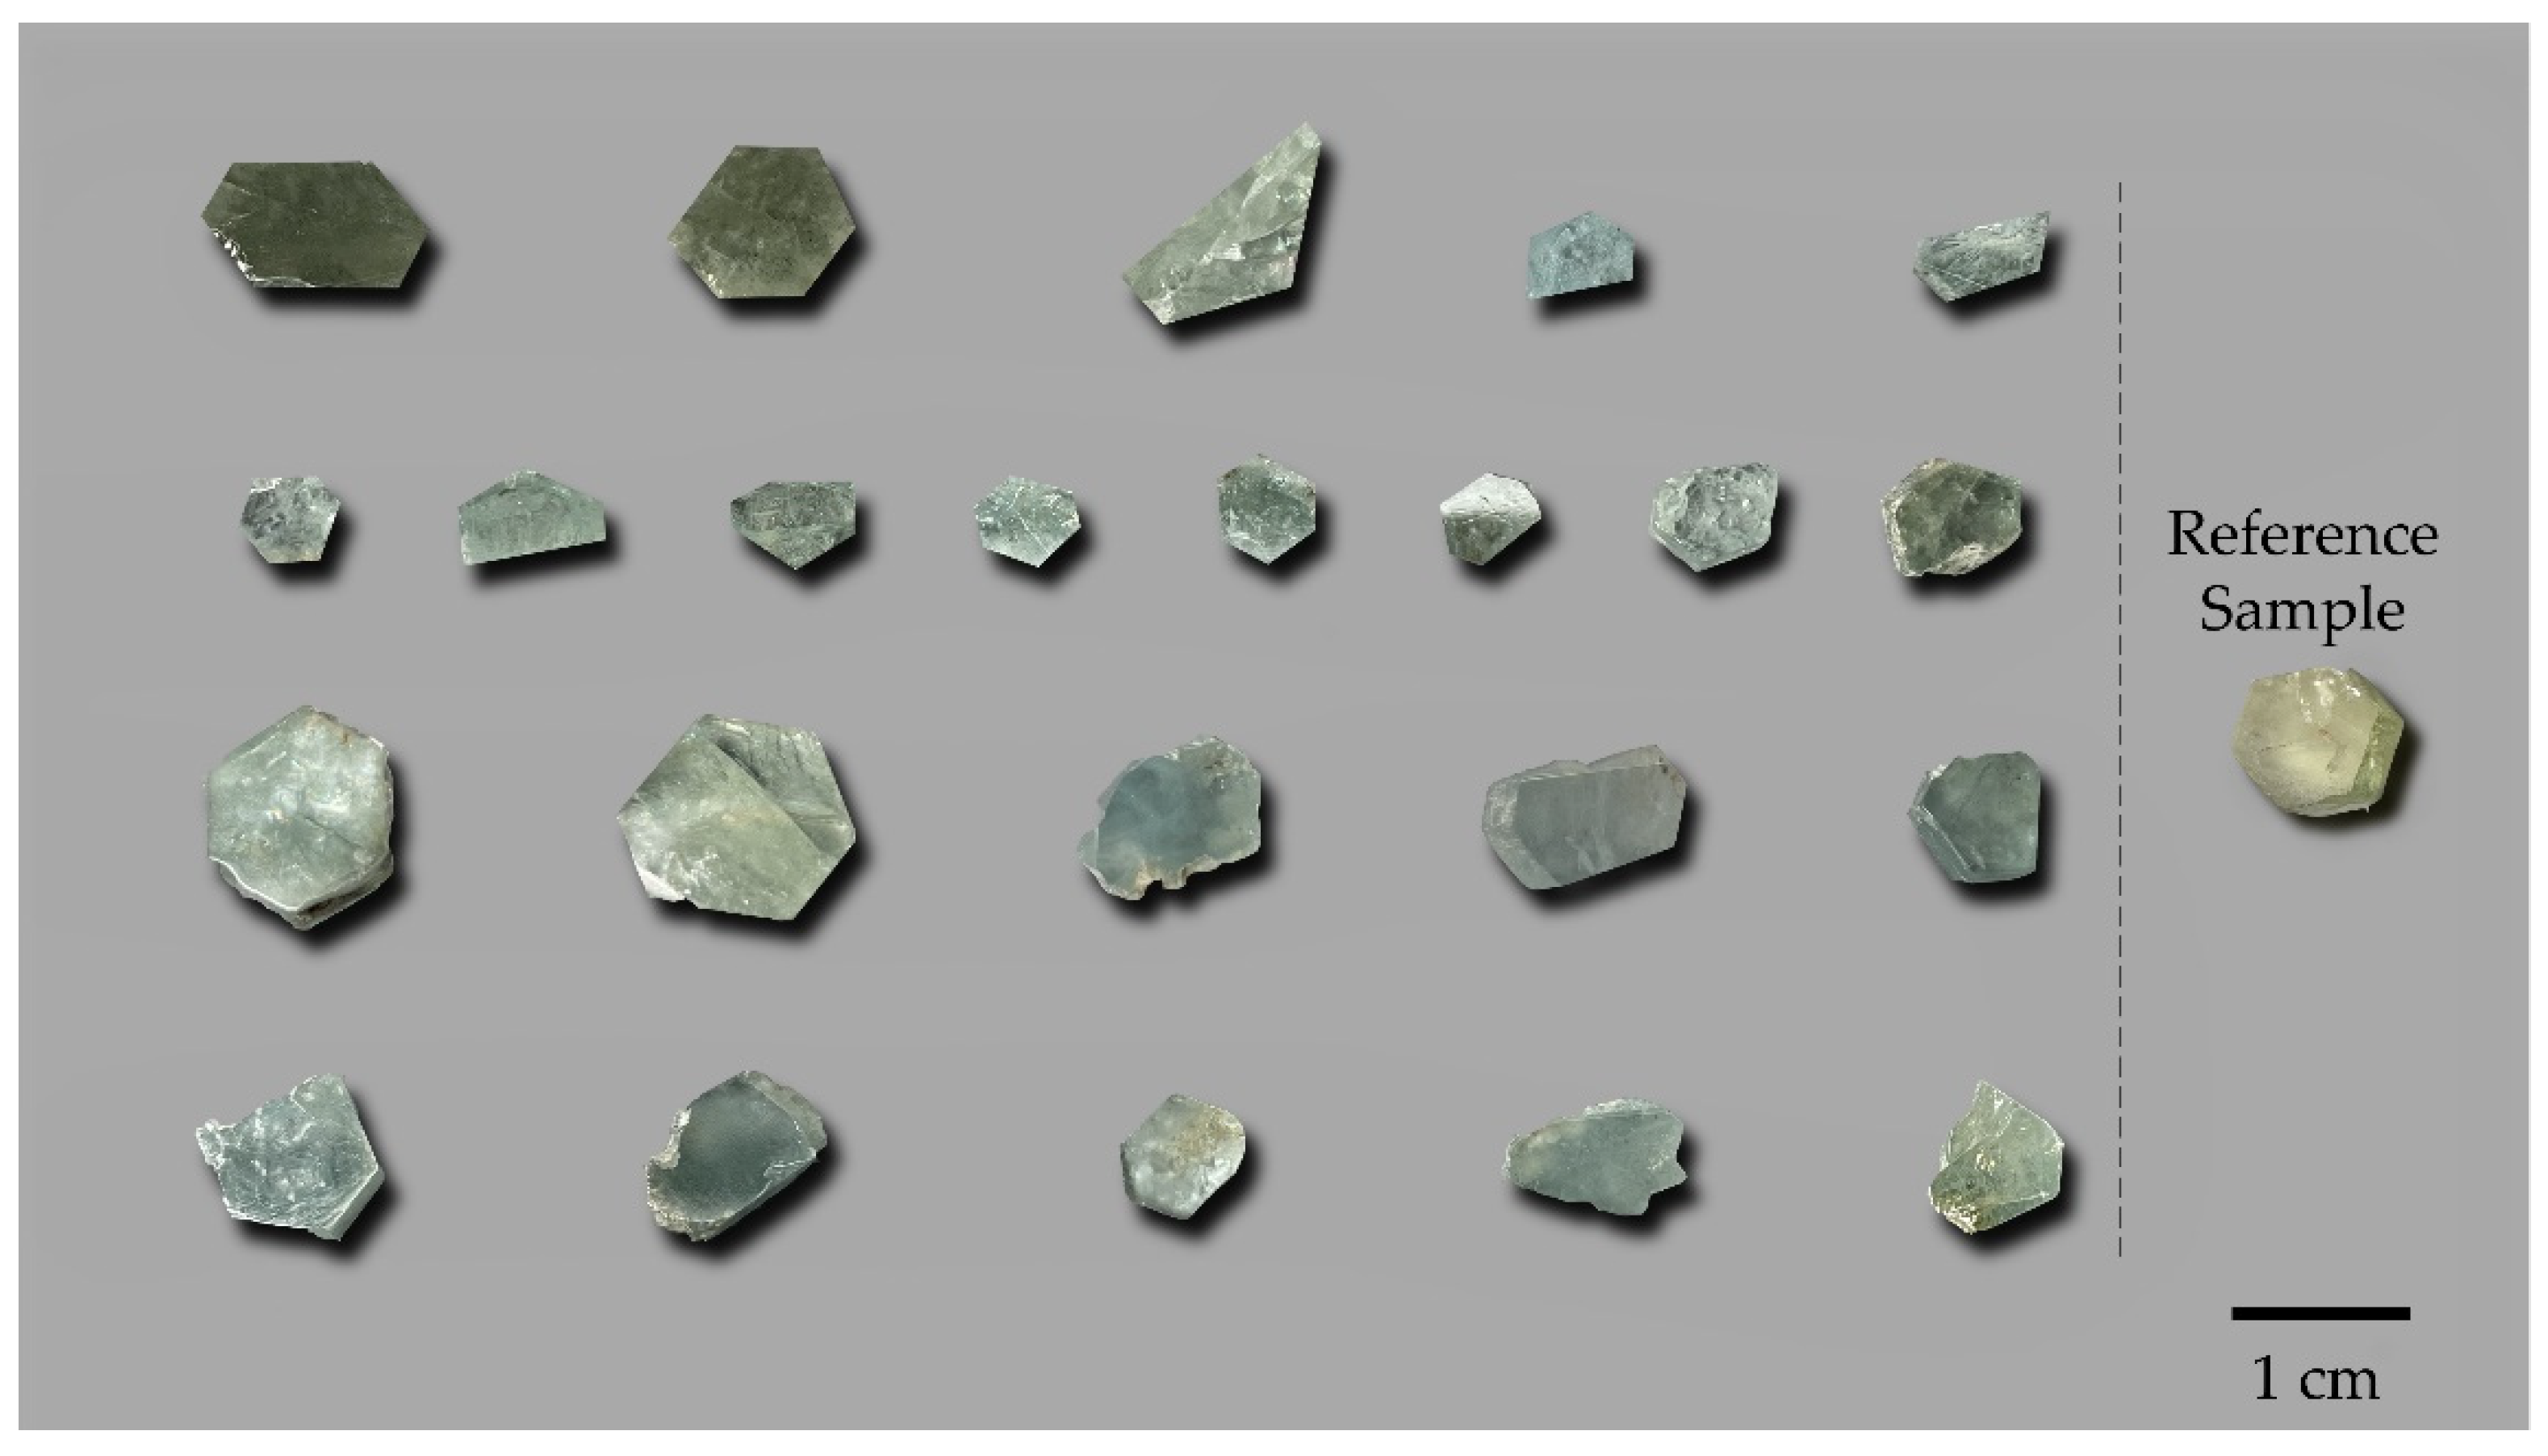
2.1. Samples

Twenty-three pieces of prismatic beryl with diameters of 6–12 mm were selected as the experimental samples, which were cut and ground into plate shapes perpendicular to the C-axis and polished on both sides. The samples were also polished on the side parallel to the C-axis. The samples were blue-green, glassy, and translucent to nontranslucent. A reference sample was also provided (Figure 1).

2.2. Colour Collection

The CIE 1976 LAB uniform colour space was adopted, which is the latest and most widely used uniform colour space.
L* is the lightness component ranging from 0 to 100 (from black to white). A* and B* are the chromaticity components. A* ranges from −128 to +127 (from negative green to positive red) and B* ranges from −128 to +127 (from negative blue to positive yellow). In addition, the C*ab (chroma value) and hab (tone angle) can be calculated according to L*, a*, and b* values:
C*ab = [(a*)2 + (b*)2]1/2
h ab = arctan ( b * a * )
The colour measuring instrument used was the industrial camera Mako G-507C (manufactured by Allied Vision Technologies, Stadtroda, Germany), with the following specifications: resolution: 2464 × 2056; frame rate: 23.7; sensitive chip: Sony IMX264; chip type: CMOS; target surface: 2/3inch; pixel: 3.45 × 3.45; exposure mode: global, colour; digital interface: GigE.
The light source was standard D65 and the test background was PANTONE Cool Gray 1C colourless background.

2.3. Structure and Composition Testing

The test samples were ground into transparent sheets with a thickness of 1 mm and tested by infrared (IR) spectroscopy, UV–visible (UV–vis) spectrophotometry, and X-ray fluorescence (XRF) spectrometry.
UV–vis tests were conducted using a Shimadzu UV-3600 series spectrophotometer with the following parameters: wavelength range: 300–900 nm; scanning speed: medium speed; sampling interval: 0.5; scan mode: single; determination method: absorption value; time constant: 1.0 s; conversion wavelength of light source: 300 nm; detector conversion wavelength: 850 nm; grating conversion wavelength: 850 nm; beam mode: dual beam.
IR tests were conducted using a Brooke Tensor 27 Fourier transform infrared spectrometer; wavenumber range: 400–4000 cm−1; test method: 400–2000 cm−1 for reflection, 2000–4000 cm−1 for transmission; resolution: 4 cm−1; scans: 32.
XRF tests were conducted using a Shimadzu EDX-700 spectrometer; collimator: 5 mm; atmosphere: air; Al-U: 50 KV, 272 uA, analysis: 0.00–40.00, time: live-100, DT%: 29; Na-Sc: 15 KV, 1000 uA, analysis: 0.00–4.40, time: live-100, DT%: 17.
Samples were grounded to powder and measured using an Ultima IV polycrystalline powder X-ray diffractometer (XRD) with the following settings: test conditions: copper target, nickel filter; wavelength: 0.15406 nm; current: 50 mA; voltage: 40 kV; continuous scanning: 5°/min; scanning range: 5–90°; step: 0.02; X-ray scan samples at different θ angles, detector at 2θ angle position; sample size: 400 mesh; standard PDF card for beryl: 09-4310.

3. Results

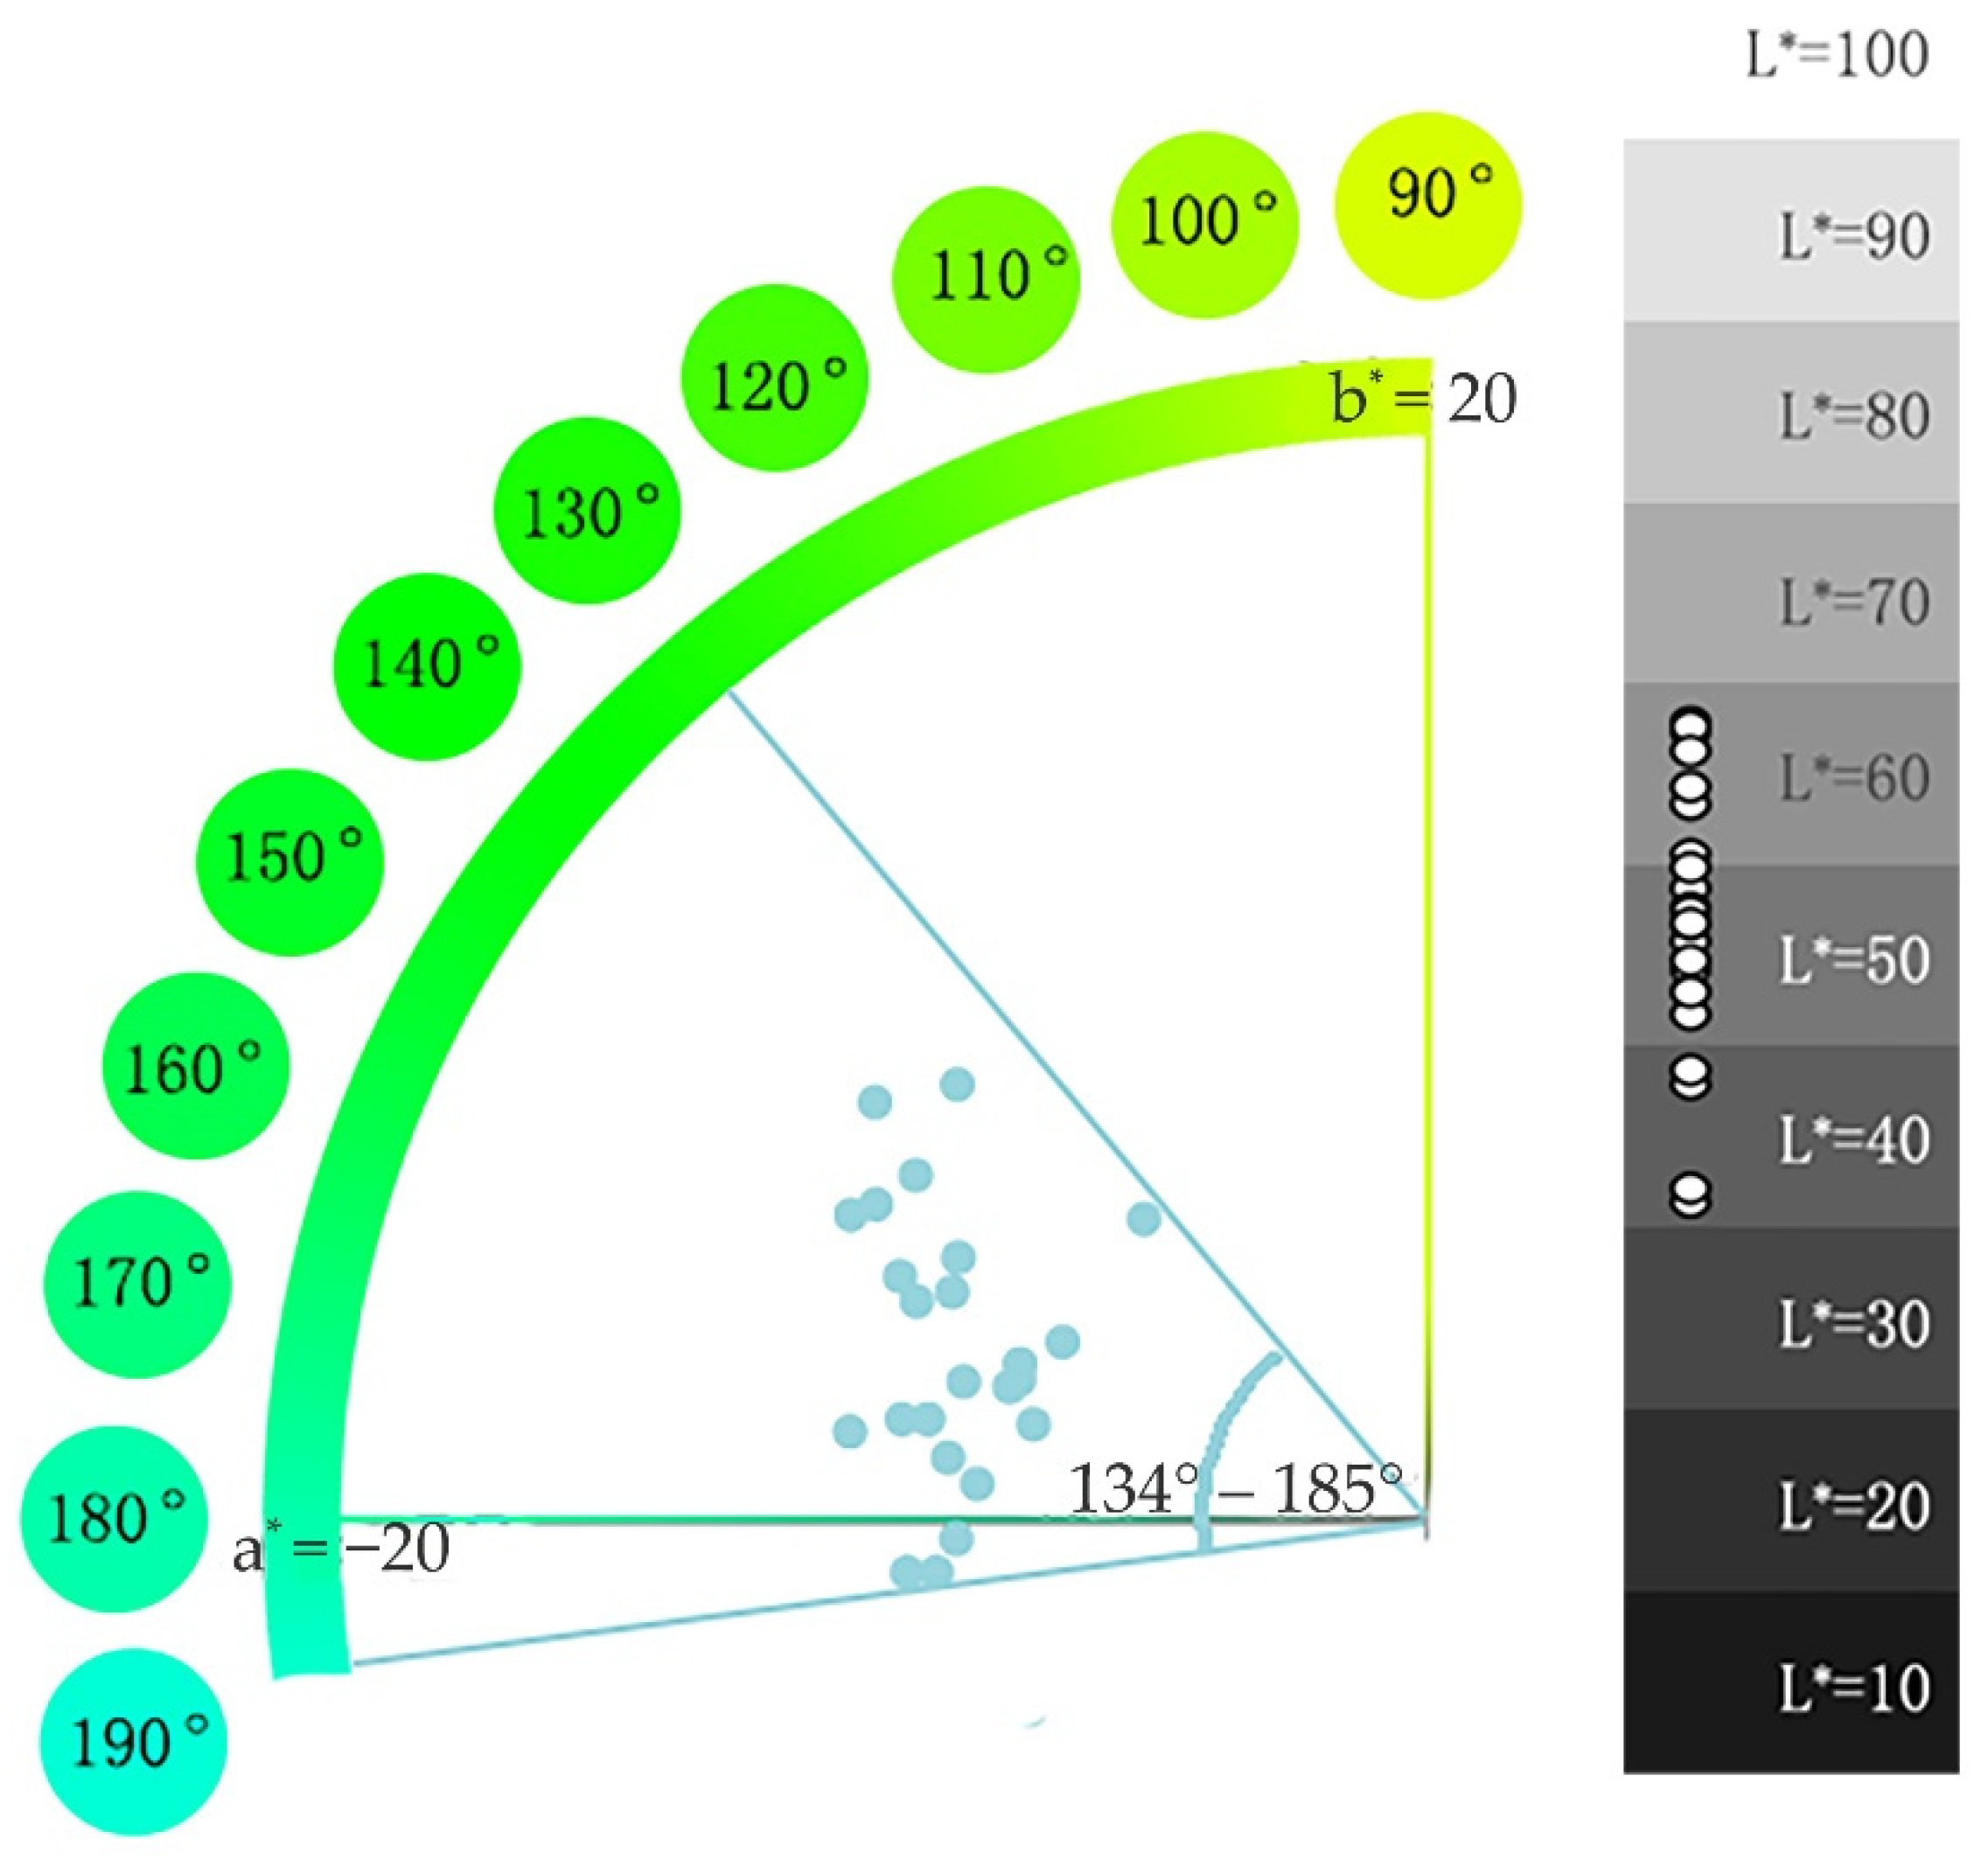
3.1. Colour Parameters

According to the test results, the colour parameters of the experimental samples L* ∈ (41.7, 68.05), a* ∈ (−10.8, −5.3), b* ∈ (−0.85, 7.84), C* ∈ (7.55, 12.78), and h ∈ (134.2°, 185.2°), belonged to a blue-green tone interval, medium lightness, and low chroma (Figure 2).
As shown in Figure 3, the parameter C* showed a strong negative correlation with a* and the parameter h showed a strong negative correlation with b* (Figure 3b).

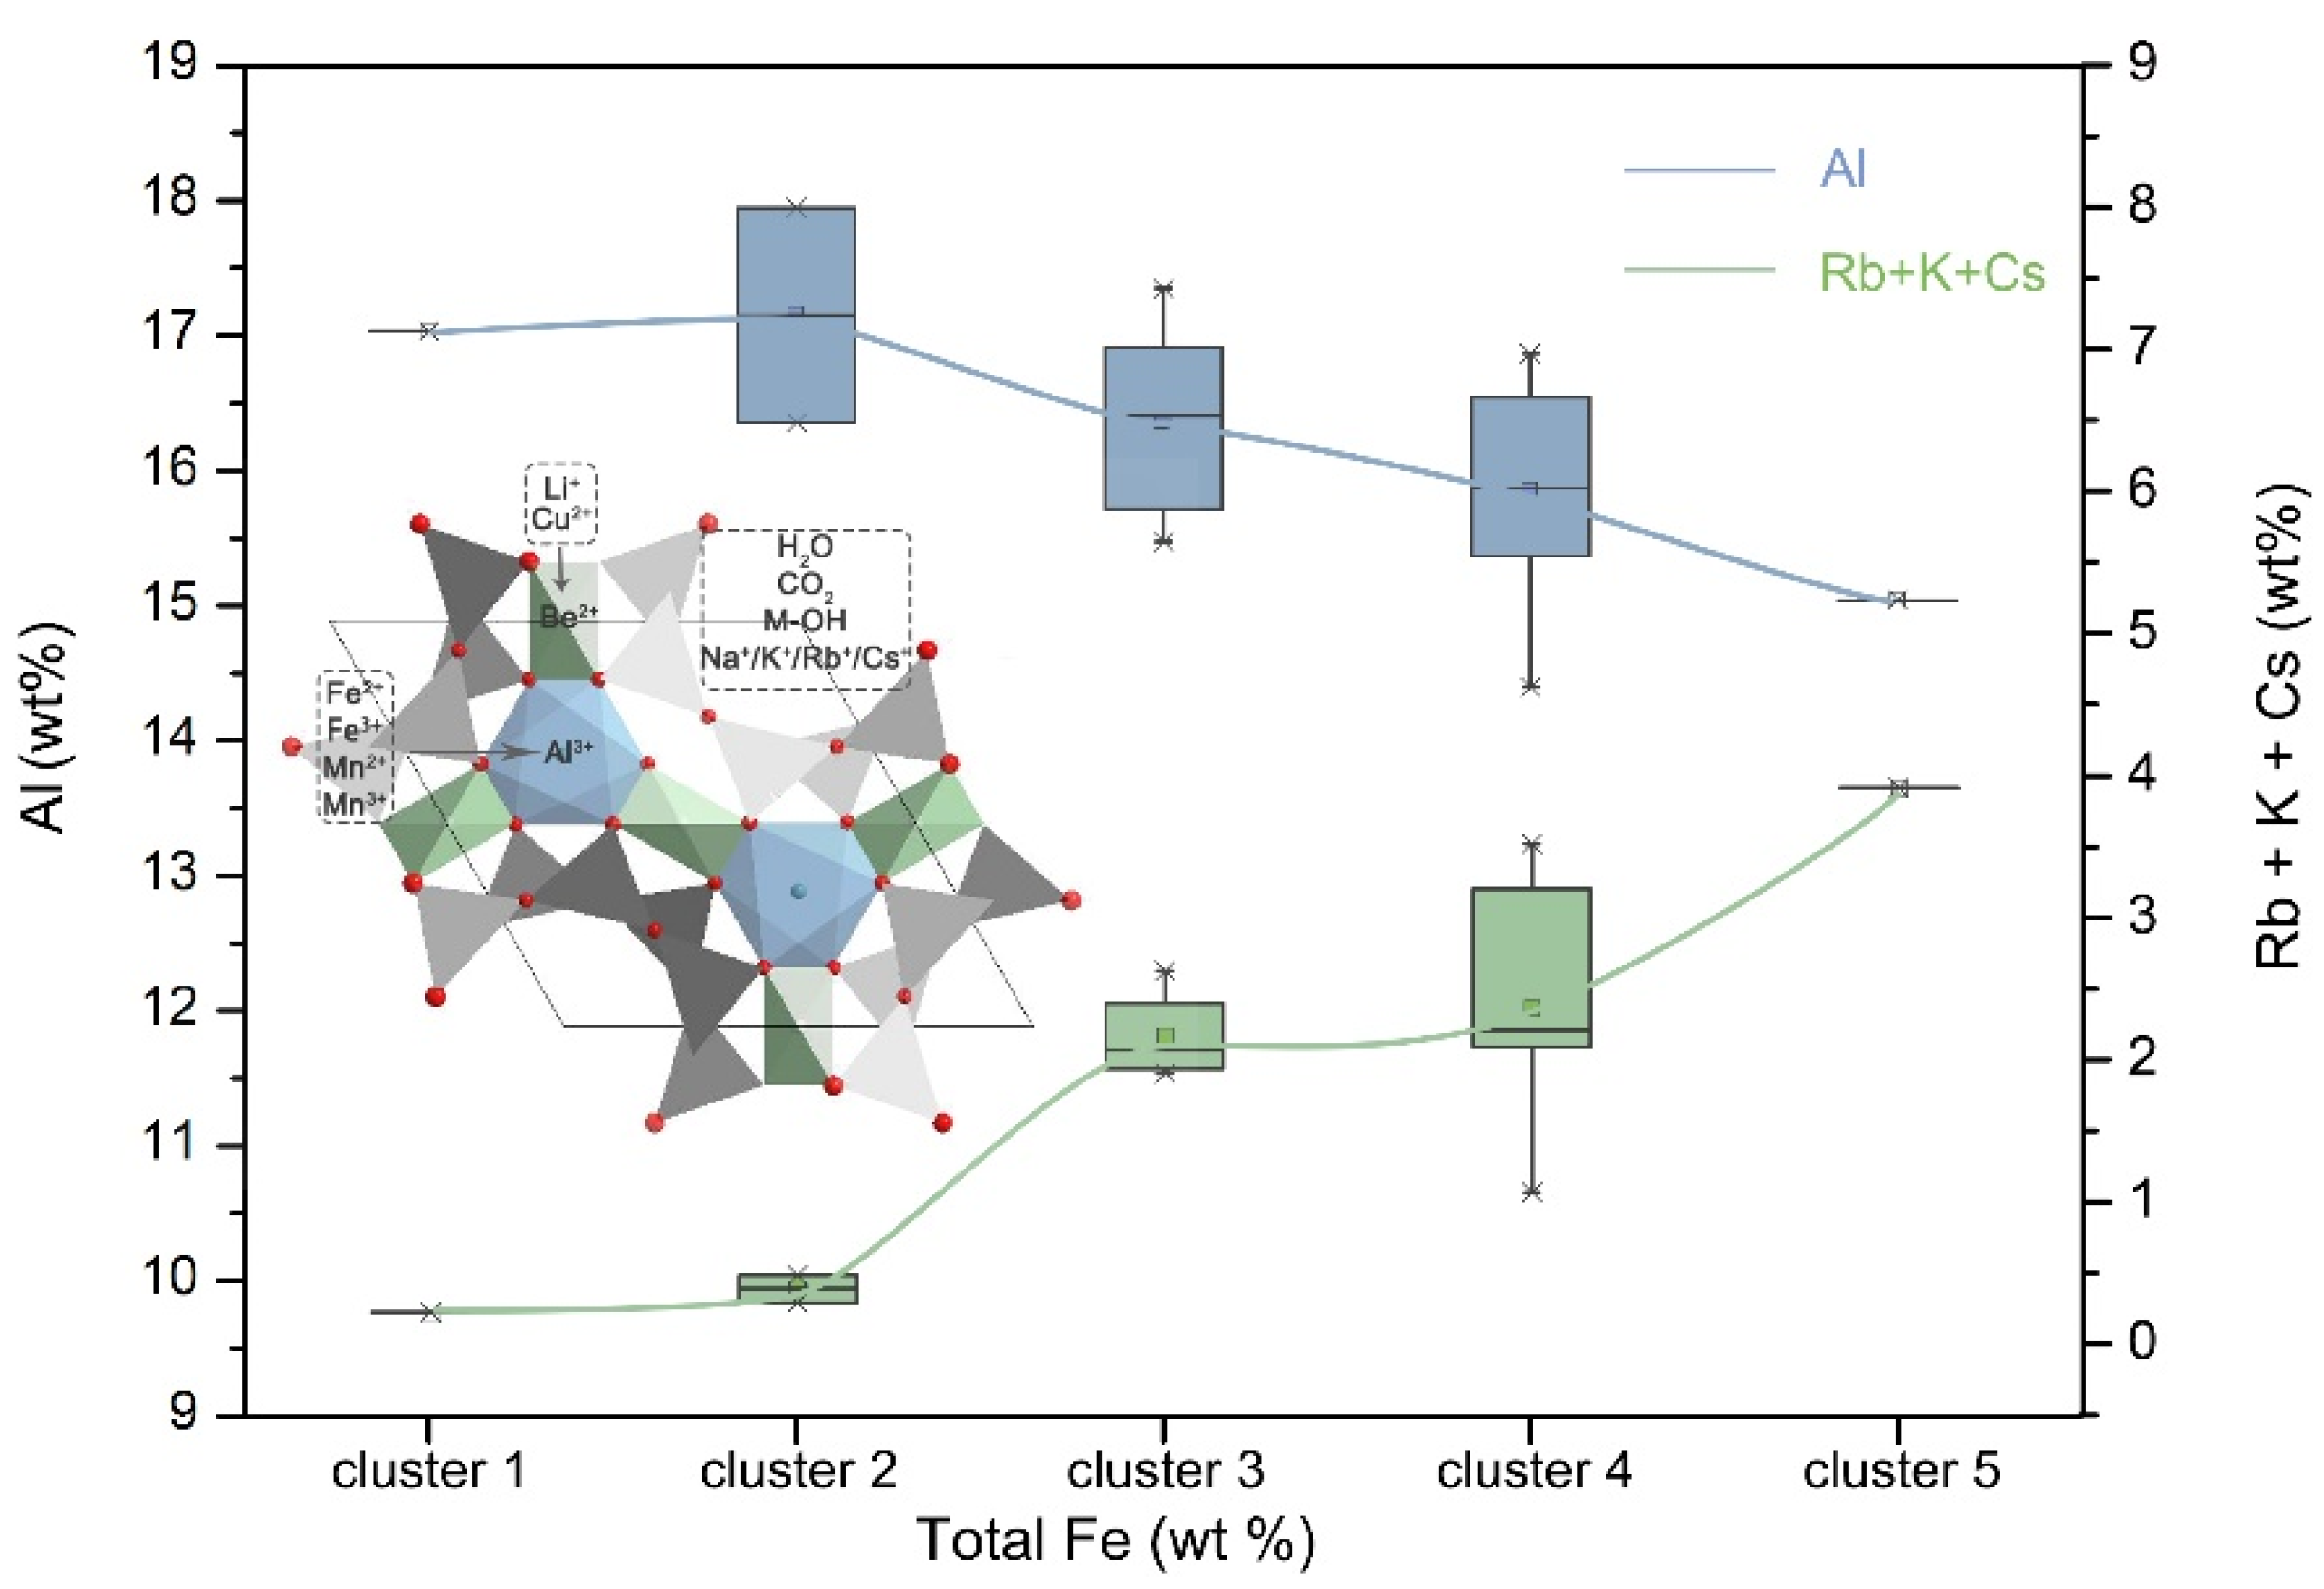
3.2. Characteristics of XRF

XRF is a semi-quantitative test which can only get the relative content of each element. According to the results from XRF on 23 samples, Si was the main element, accounting for 76.40–80.34%. The second element was Al, accounting for 14.18–17.95%. Transition metal elements such as Fe, Mn, V, Cr, and Ti can be detected, among which the total Fe content accounted for 1.80–3.99%, and Mn for <0.09%. The content of V, Cr, and Ti was very small. The content of V could only be tested in two samples with contents of 0.04% and 0.96%; Cr could only be tested in four samples with a content of 0.01–0.17%; Ti could only be measured in one sample with a content of 0.58%. In addition, the content of Cu and Cs could also be tested at 0.01–0.08% and 0.08–3.21%, respectively. Ca, K, and some rare earth elements were also detected.

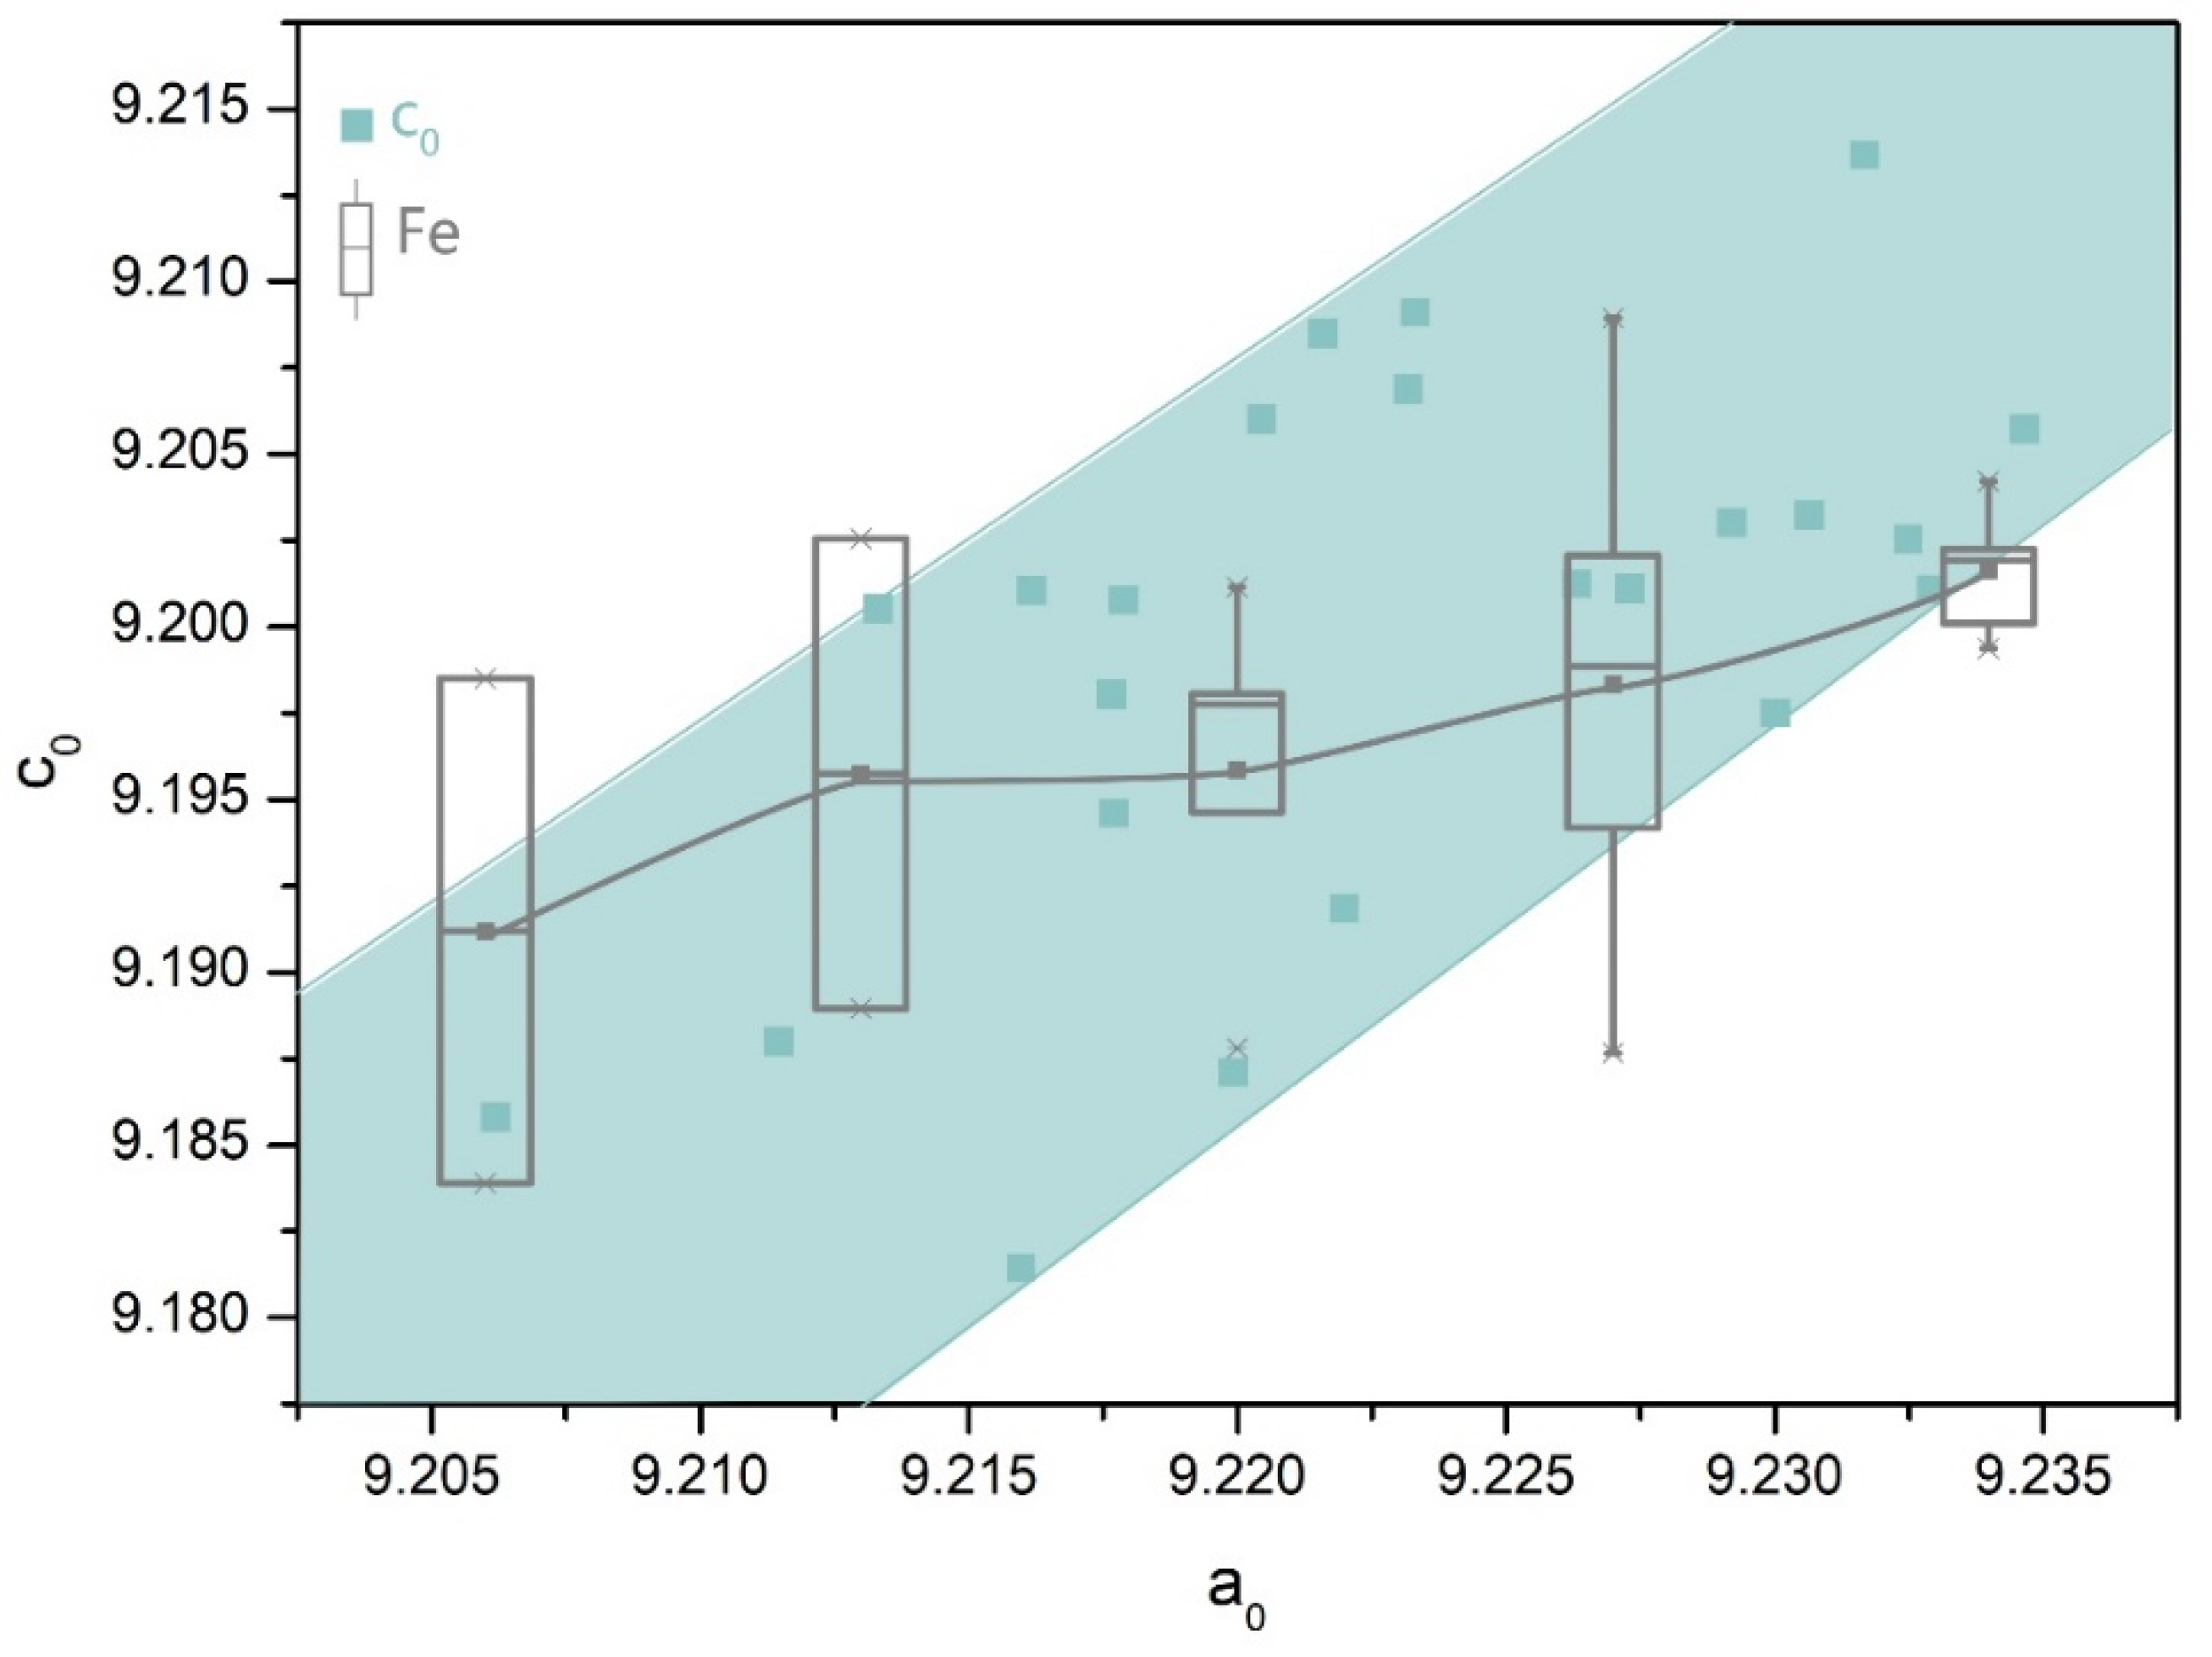
3.3. Characteristics of XRD

Beryl’s symmetry is C6/mcc (D6h2). The crystal cell parameters can be obtained by XRD and refinement. In standard beryl samples (PDF card: 09-4310), a0 = 9.217 Å and c0 = 9.192 Å. When the octahedral Al3+ is replaced by transition metal ions, a0 increases due to the increase of the ion radius, whereas when the tetrahedral Be2+ is replaced by Li+ or Cu2+, c0 increases. Beryl can be divided into two types according to the c/a value [15]:
  • Octahedral substitution of Al3+ is dominant: c/a = 0.991–0.998;
  • Tetrahedral substitution of Be2+ is dominant: c/a = 0.999–1.003.
It was found that a0 was proportional to c0, that is, when octahedral displacement increased, tetrahedral displacement also increased. Except for samples no. 2–3, 3–2, and 3–6 (where most iron ions existed in channels, as further explained below), the total Fe content increased with the increase of a0 (Figure 4, the comparison between Fe content and a0 is represented by a box diagram, which is explained in Box 1). It was proved that Fe ions existed in the octahedral position in the form of isomorphic substitution.
Box 1. Box diagram.
When there is a certain correlation between the two groups of parameters and the correlation coefficient is not very high, it is messy and confusing if a scatter graph is used to show the correlation stacked with other images. Thus, the data can be divided into different groups according to their characteristics, and each group of data can be represented by boxes, so that several boxes can be used to express a large amount of data. This simplified drawing can see the correlation between two groups of parameters as well as contributing to a beautiful and clear layout. When grouping data, K-means clustering was used. The principle and advantages of K-means clustering have been mentioned in the introduction. Take Figure 4 as an example, it was applied to show the correlation between the a0 and Fe content; for each sample, it had two features: a0 and Fe. First, the samples were sorted in accordance with the order of the a0 increasing. Then, the samples were divided into five groups by K-means clustering according to the cluster similarity and the difference between clusters of the independent variable a0. Accordingly, the dependent variable Fe content was divided into five groups that are shown in the box graph. With the increase of a0, the Fe content groups are on the rise. However, it should be noted that the positive direction of x-axis represents the direction of a0 increase, while the scale of each box is not the specific value, but the serial number of each cluster. For more examples of applications, see Xueding W. [16], Yuansheng J. [11], and Jun T. [13] et al.

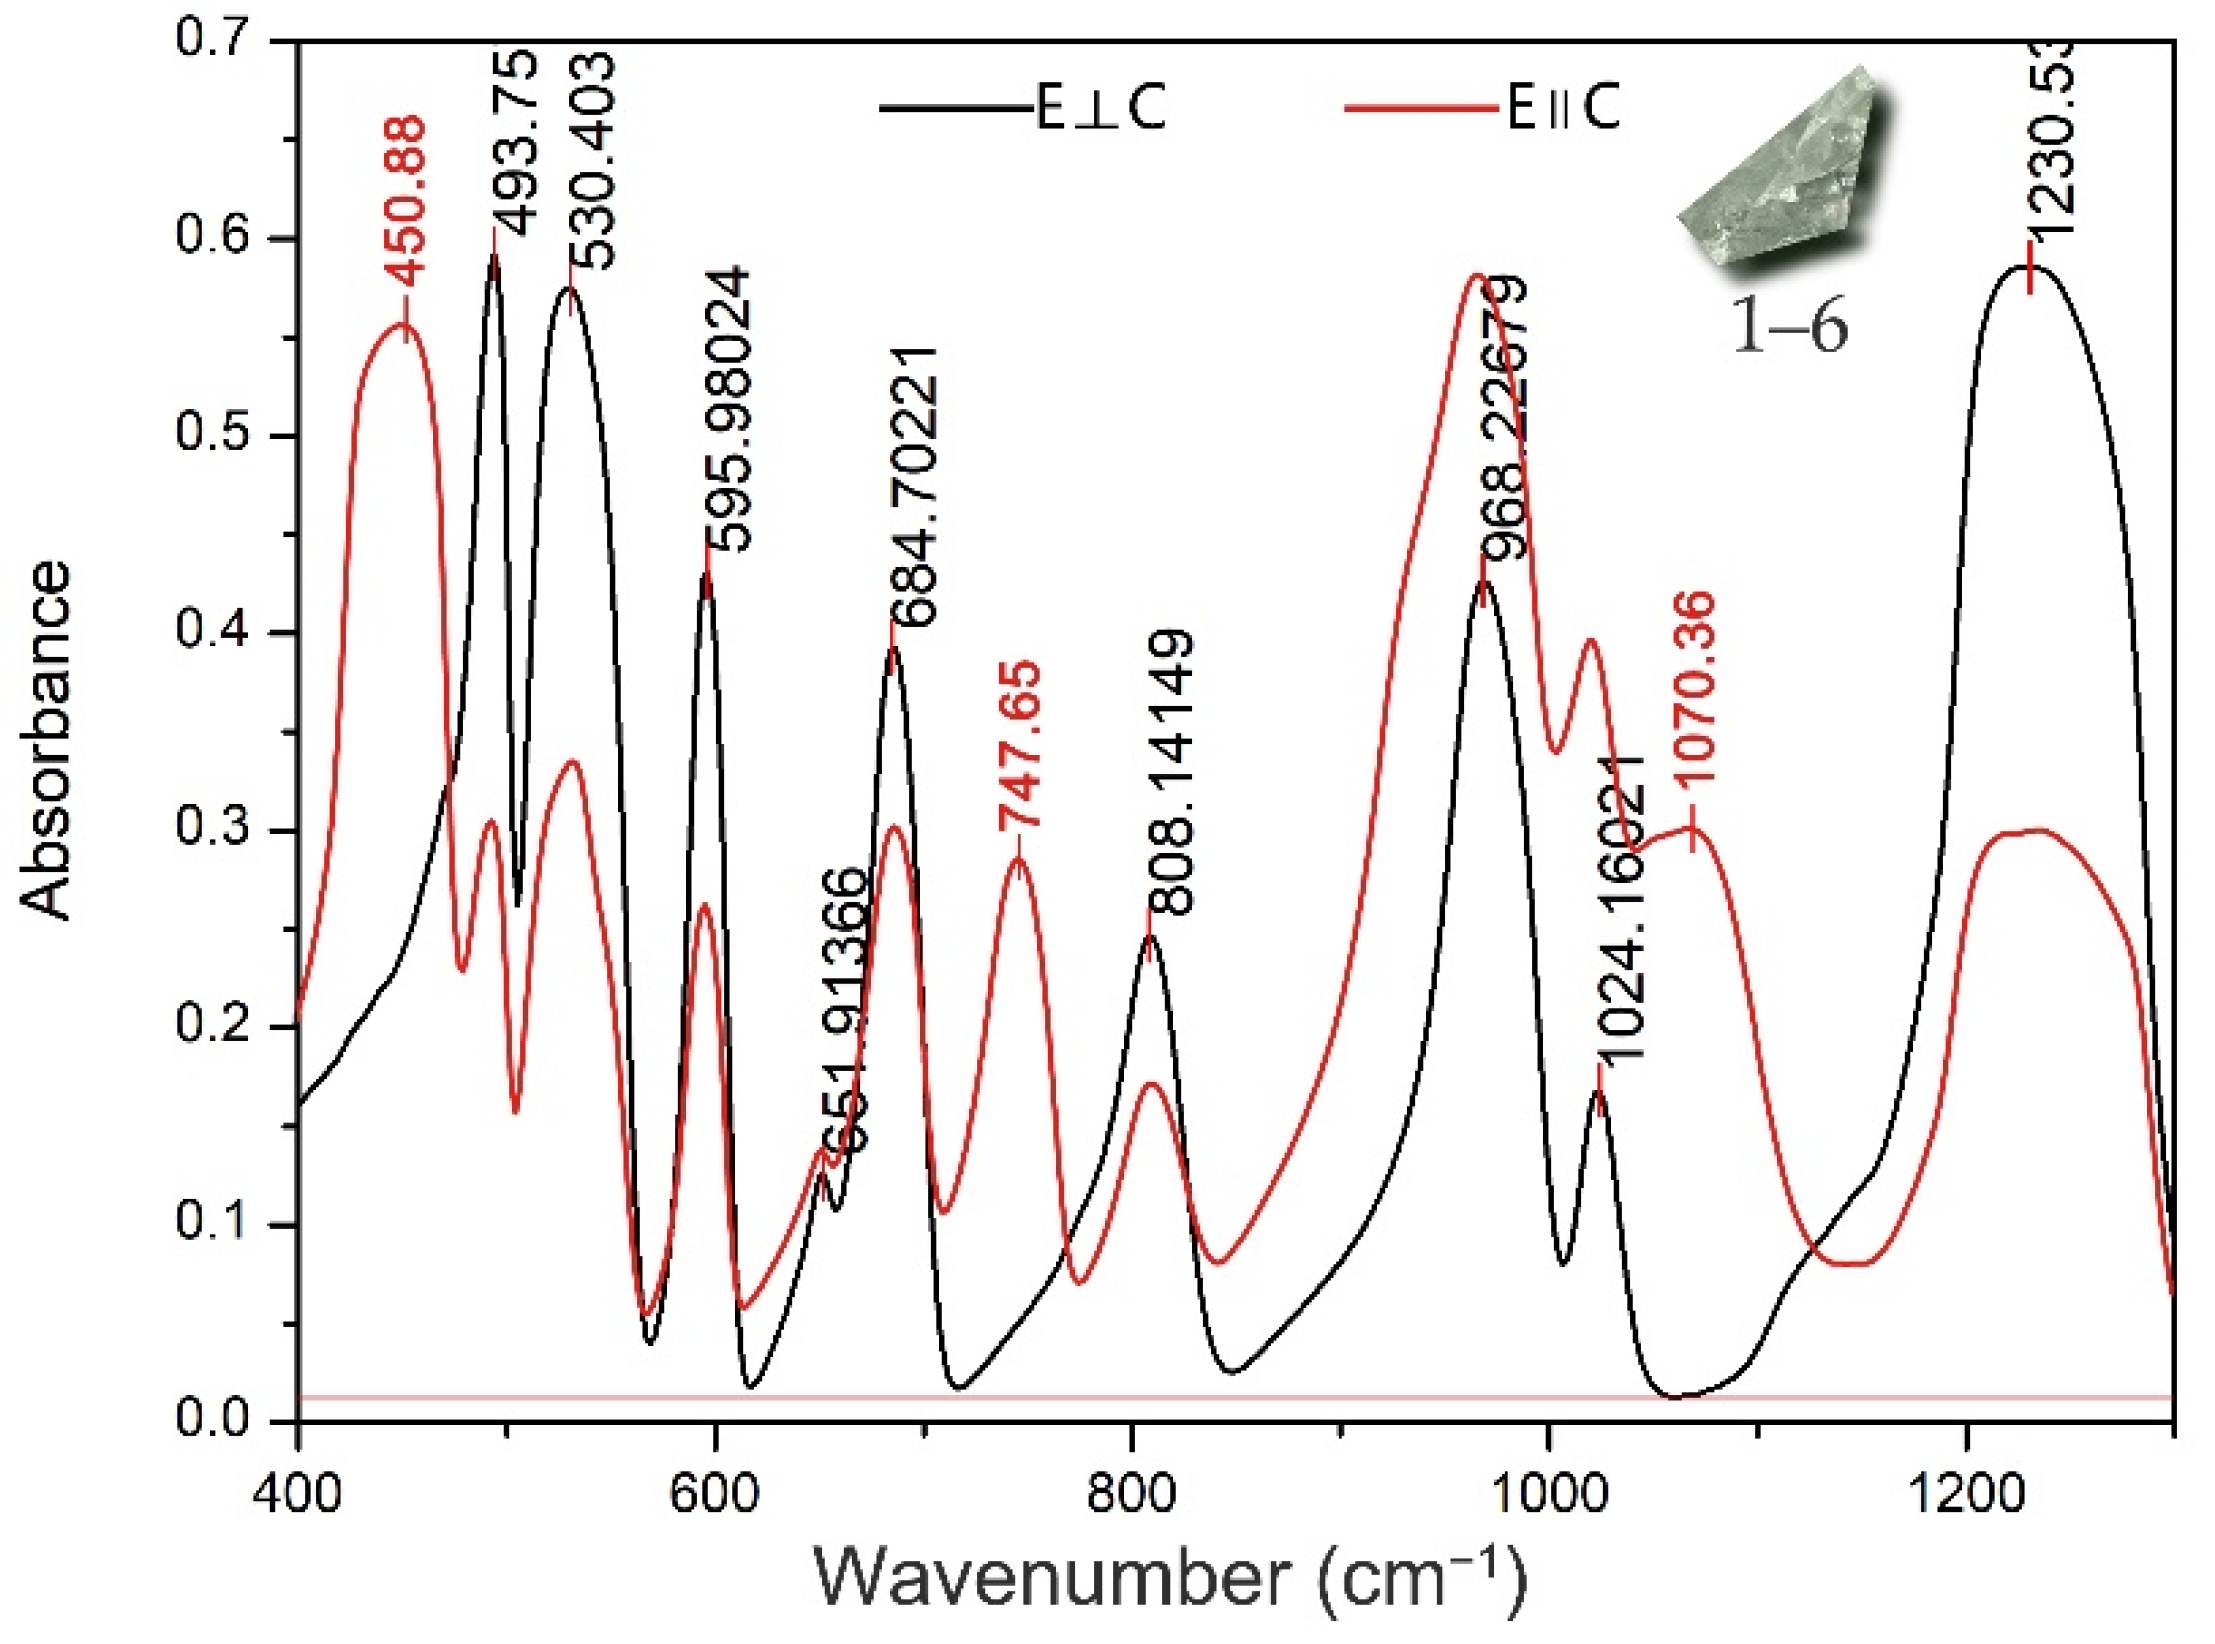
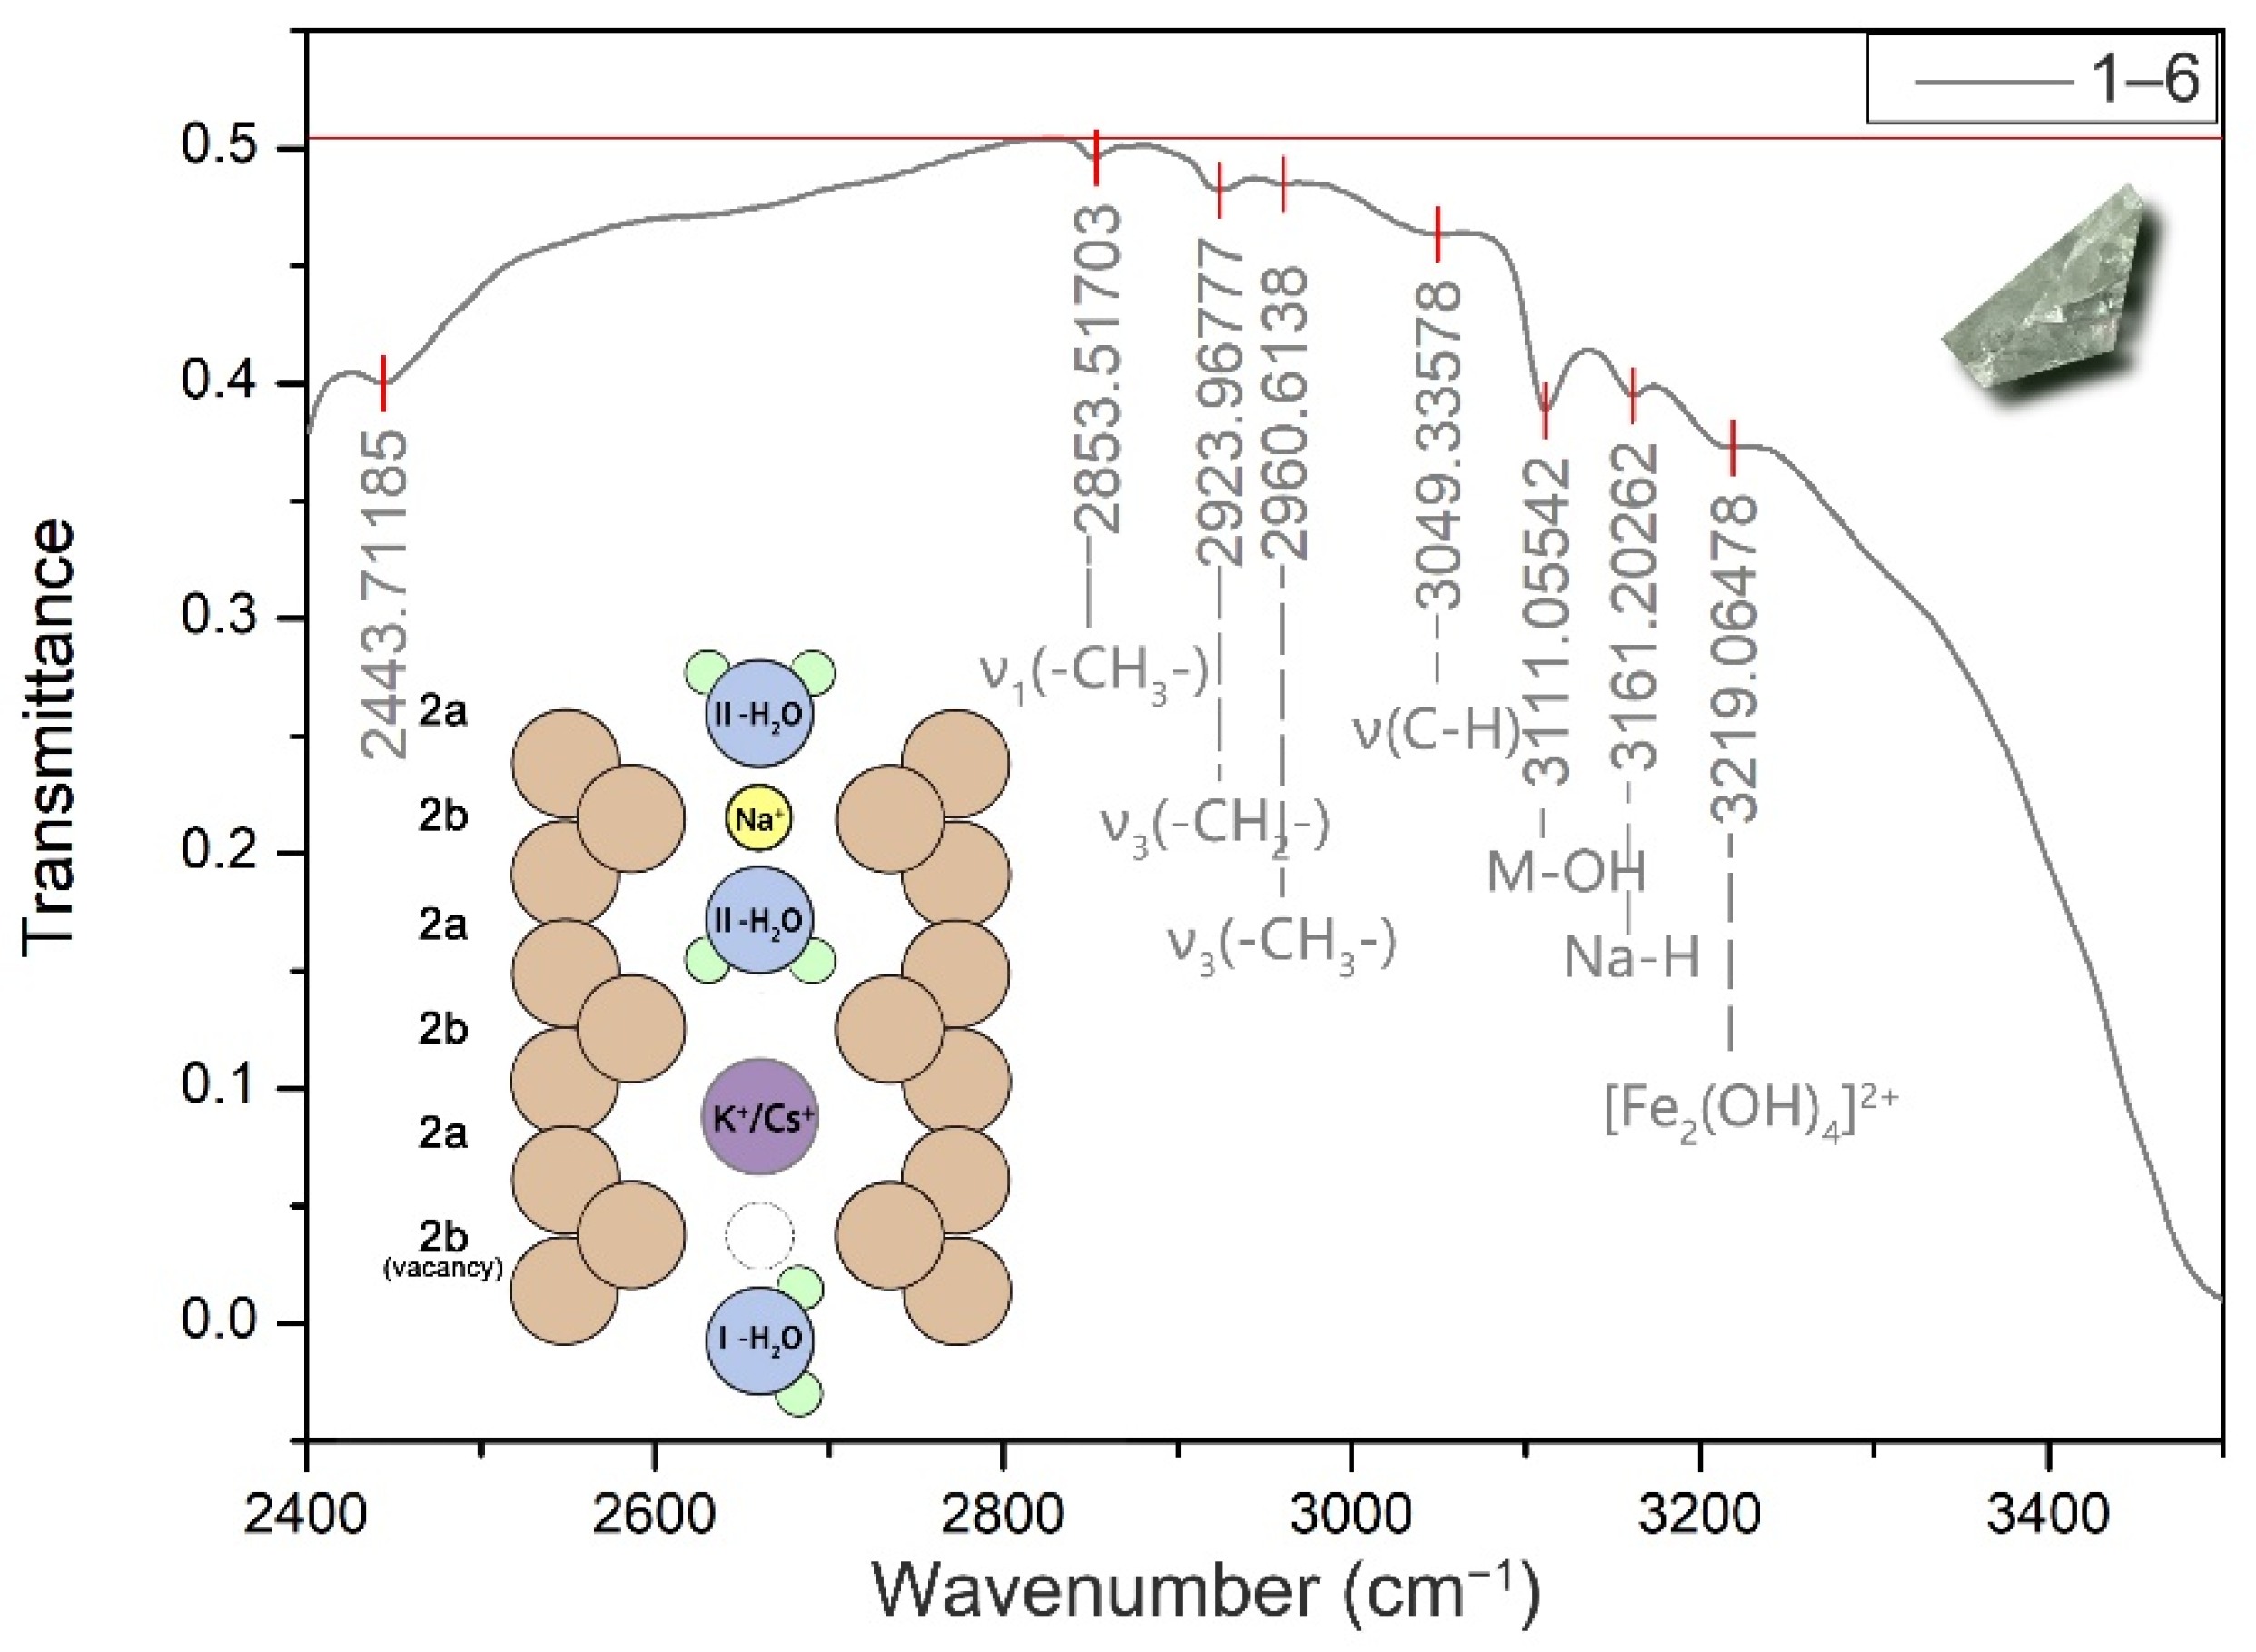
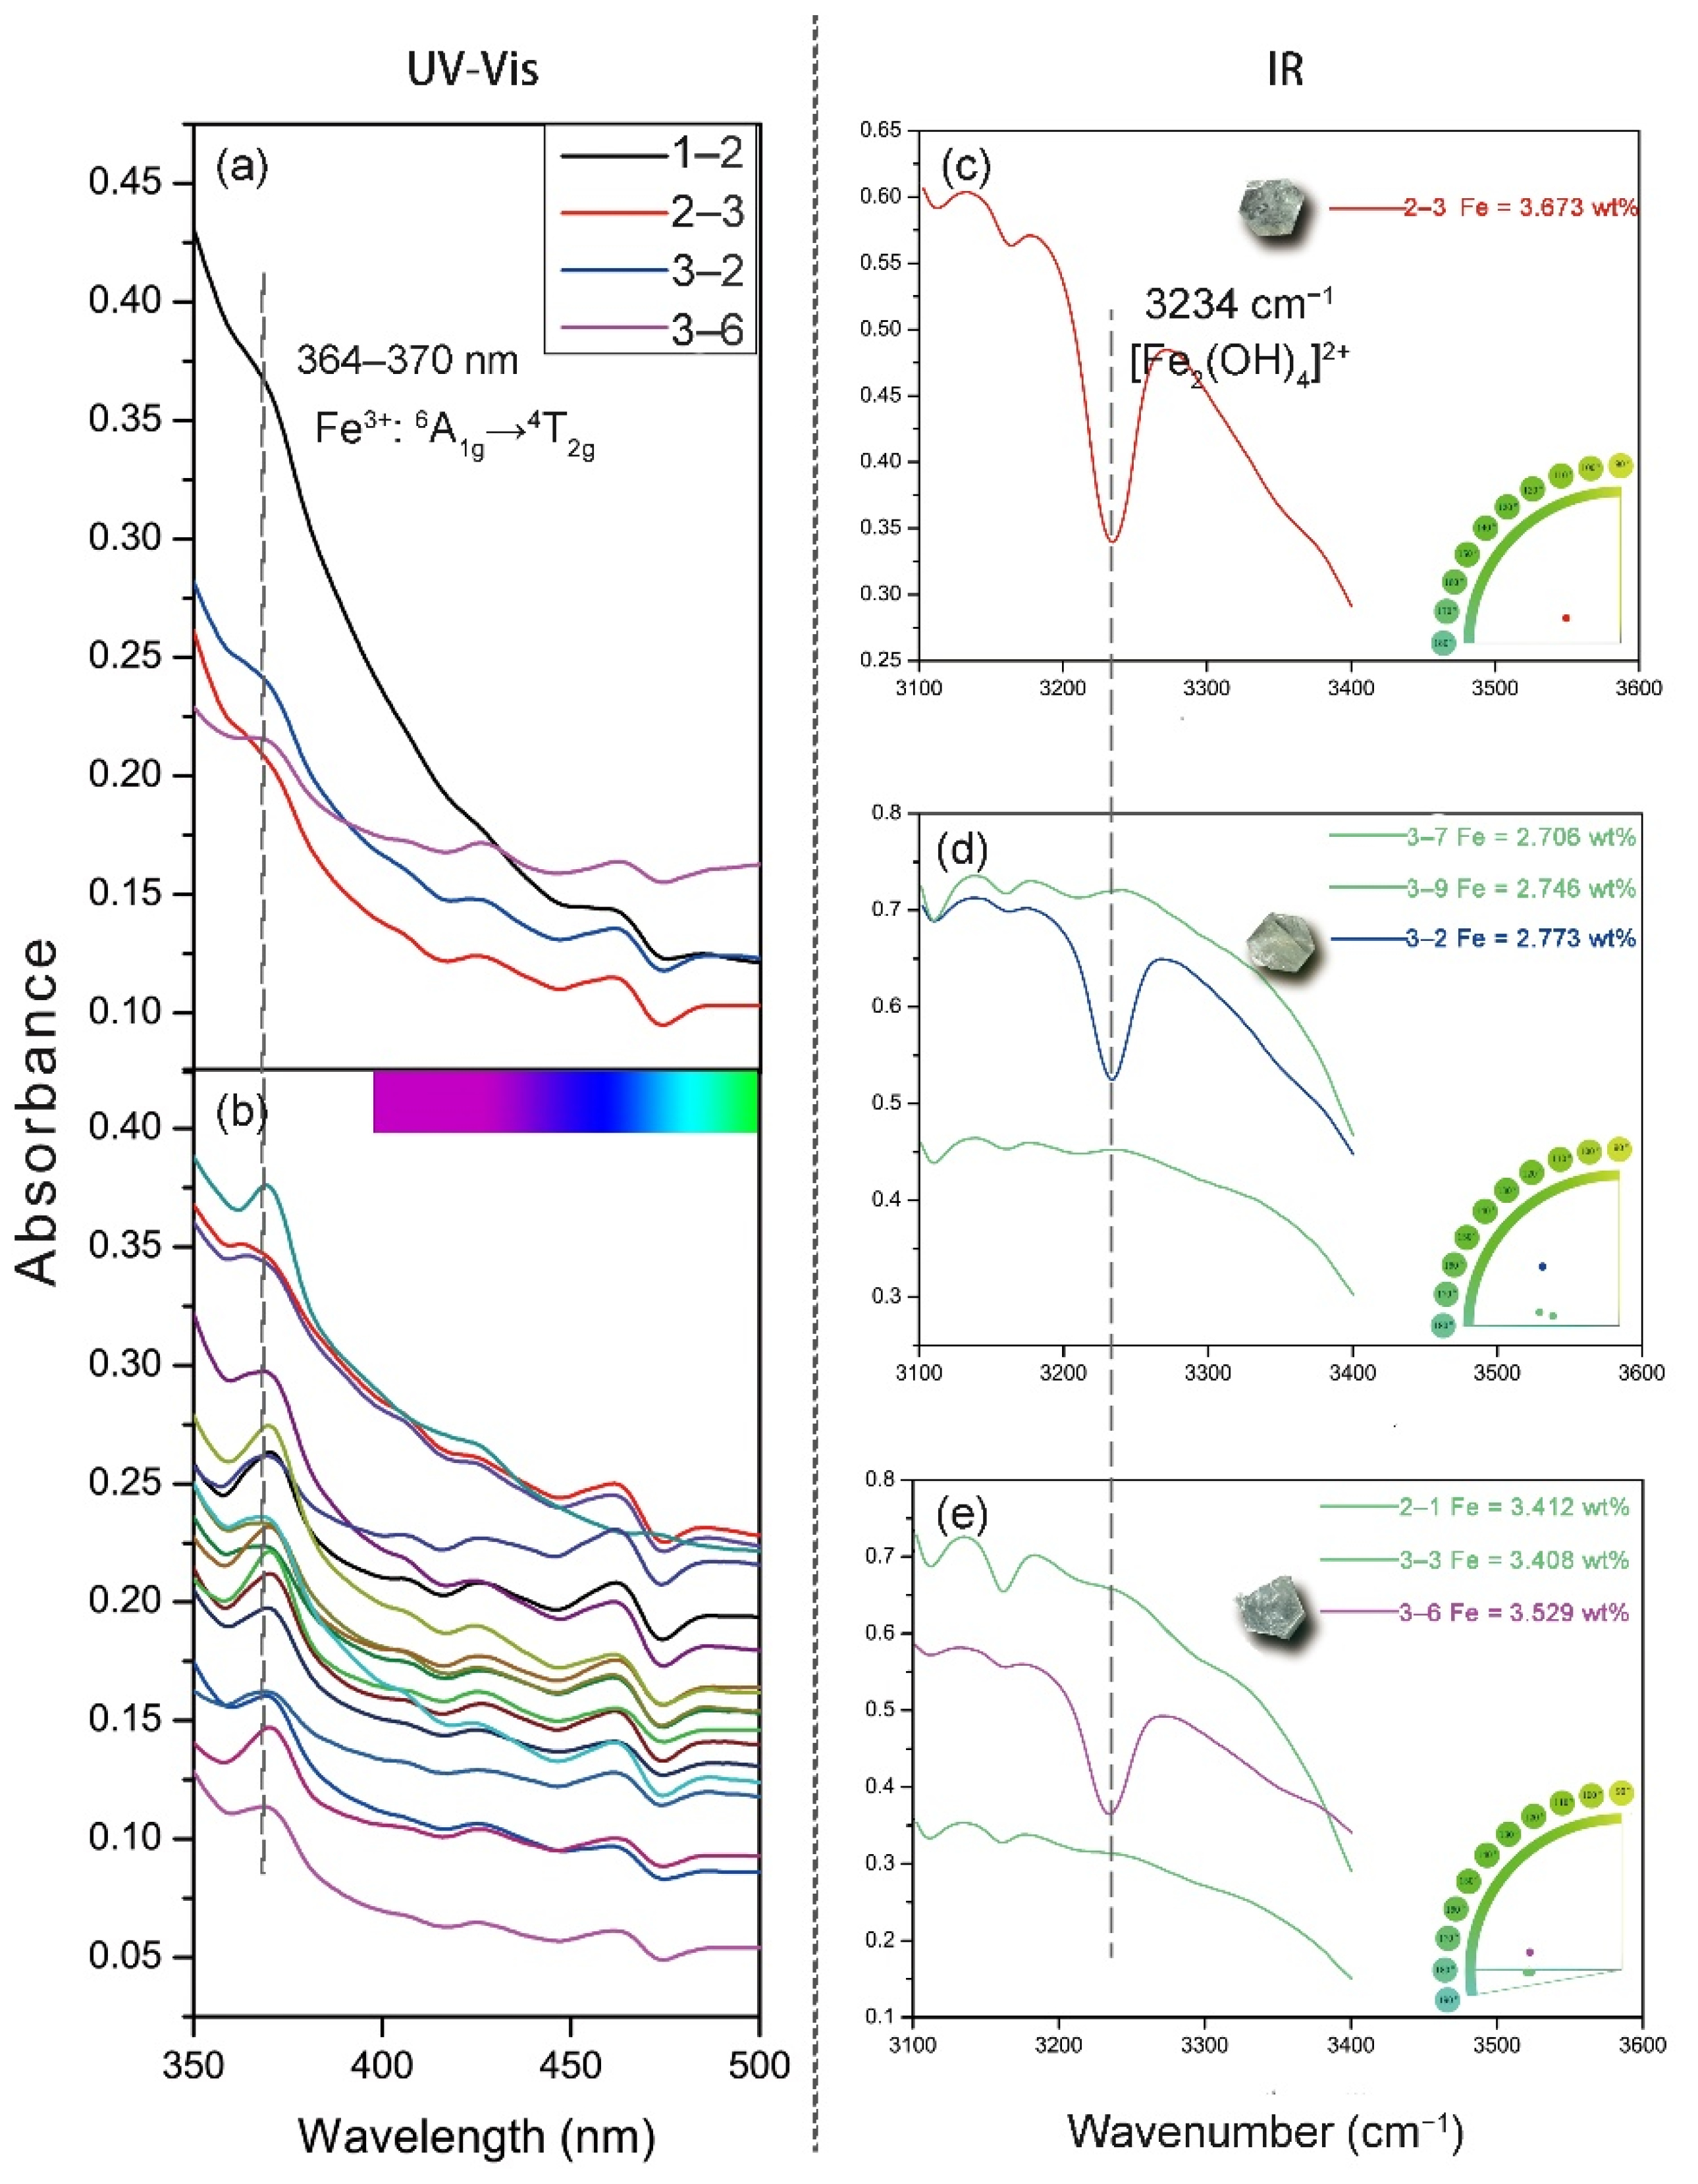
3.4. Characteristics of IR Spectroscopy

The IR spectrums of 23 samples were obtained in two directions: the transverse electric field of light (E) perpendicular to the optic axis (C) and the transverse electric field of light (E) parallel to the optic axis (C). The IR band in the 400–1300 cm−1 region is the fingerprint region of beryl. Taking no. 1–6 as an example, the IR absorption spectrums of E ⊥ C and E C are shown in Figure 5.
The main vibration peaks from Figure 5 and their causes are given in Table 1 [17,18,19,20].
Compared with the standard peak positions, the peak positions measured in the experiment were all shifted to higher wavenumbers, by up to 30 wavenumbers. The reason is that when tetrahedral and octahedral isomorphic substitutions exist in beryl, the bond length between the metal ions and oxygen ions increases. Due to the inductive effect, the distribution density of the O2 electron cloud moves to Si4+, the force constant increases, and the group vibration frequency increases [21].
The positions of the absorption peaks of all samples were consistent in the 2300–3500 cm−1 band, but the intensity of the peaks was different. Taking no. 1–6 as an example, its spectrum is given in Figure 6.
According to previous research [22,23], 2853 cm−1 and 2923 cm−1 are the vibration peaks of colourless oil, and 2960 cm−1 and 3049 cm−1 are the vibration peaks of organic glue. The hydrated ion vibration peak of M-OH is at 3111 cm−1, the vibration peak of Na-H is at 3161 cm−1, and the vibration peak of [Fe2(OH)4]2+ is at 3219 cm−1 (some samples show the peak at 3234 cm−1). These chemical groups mainly exist in the beryl channels, and their occupancy is shown in the diagram in Figure 6.

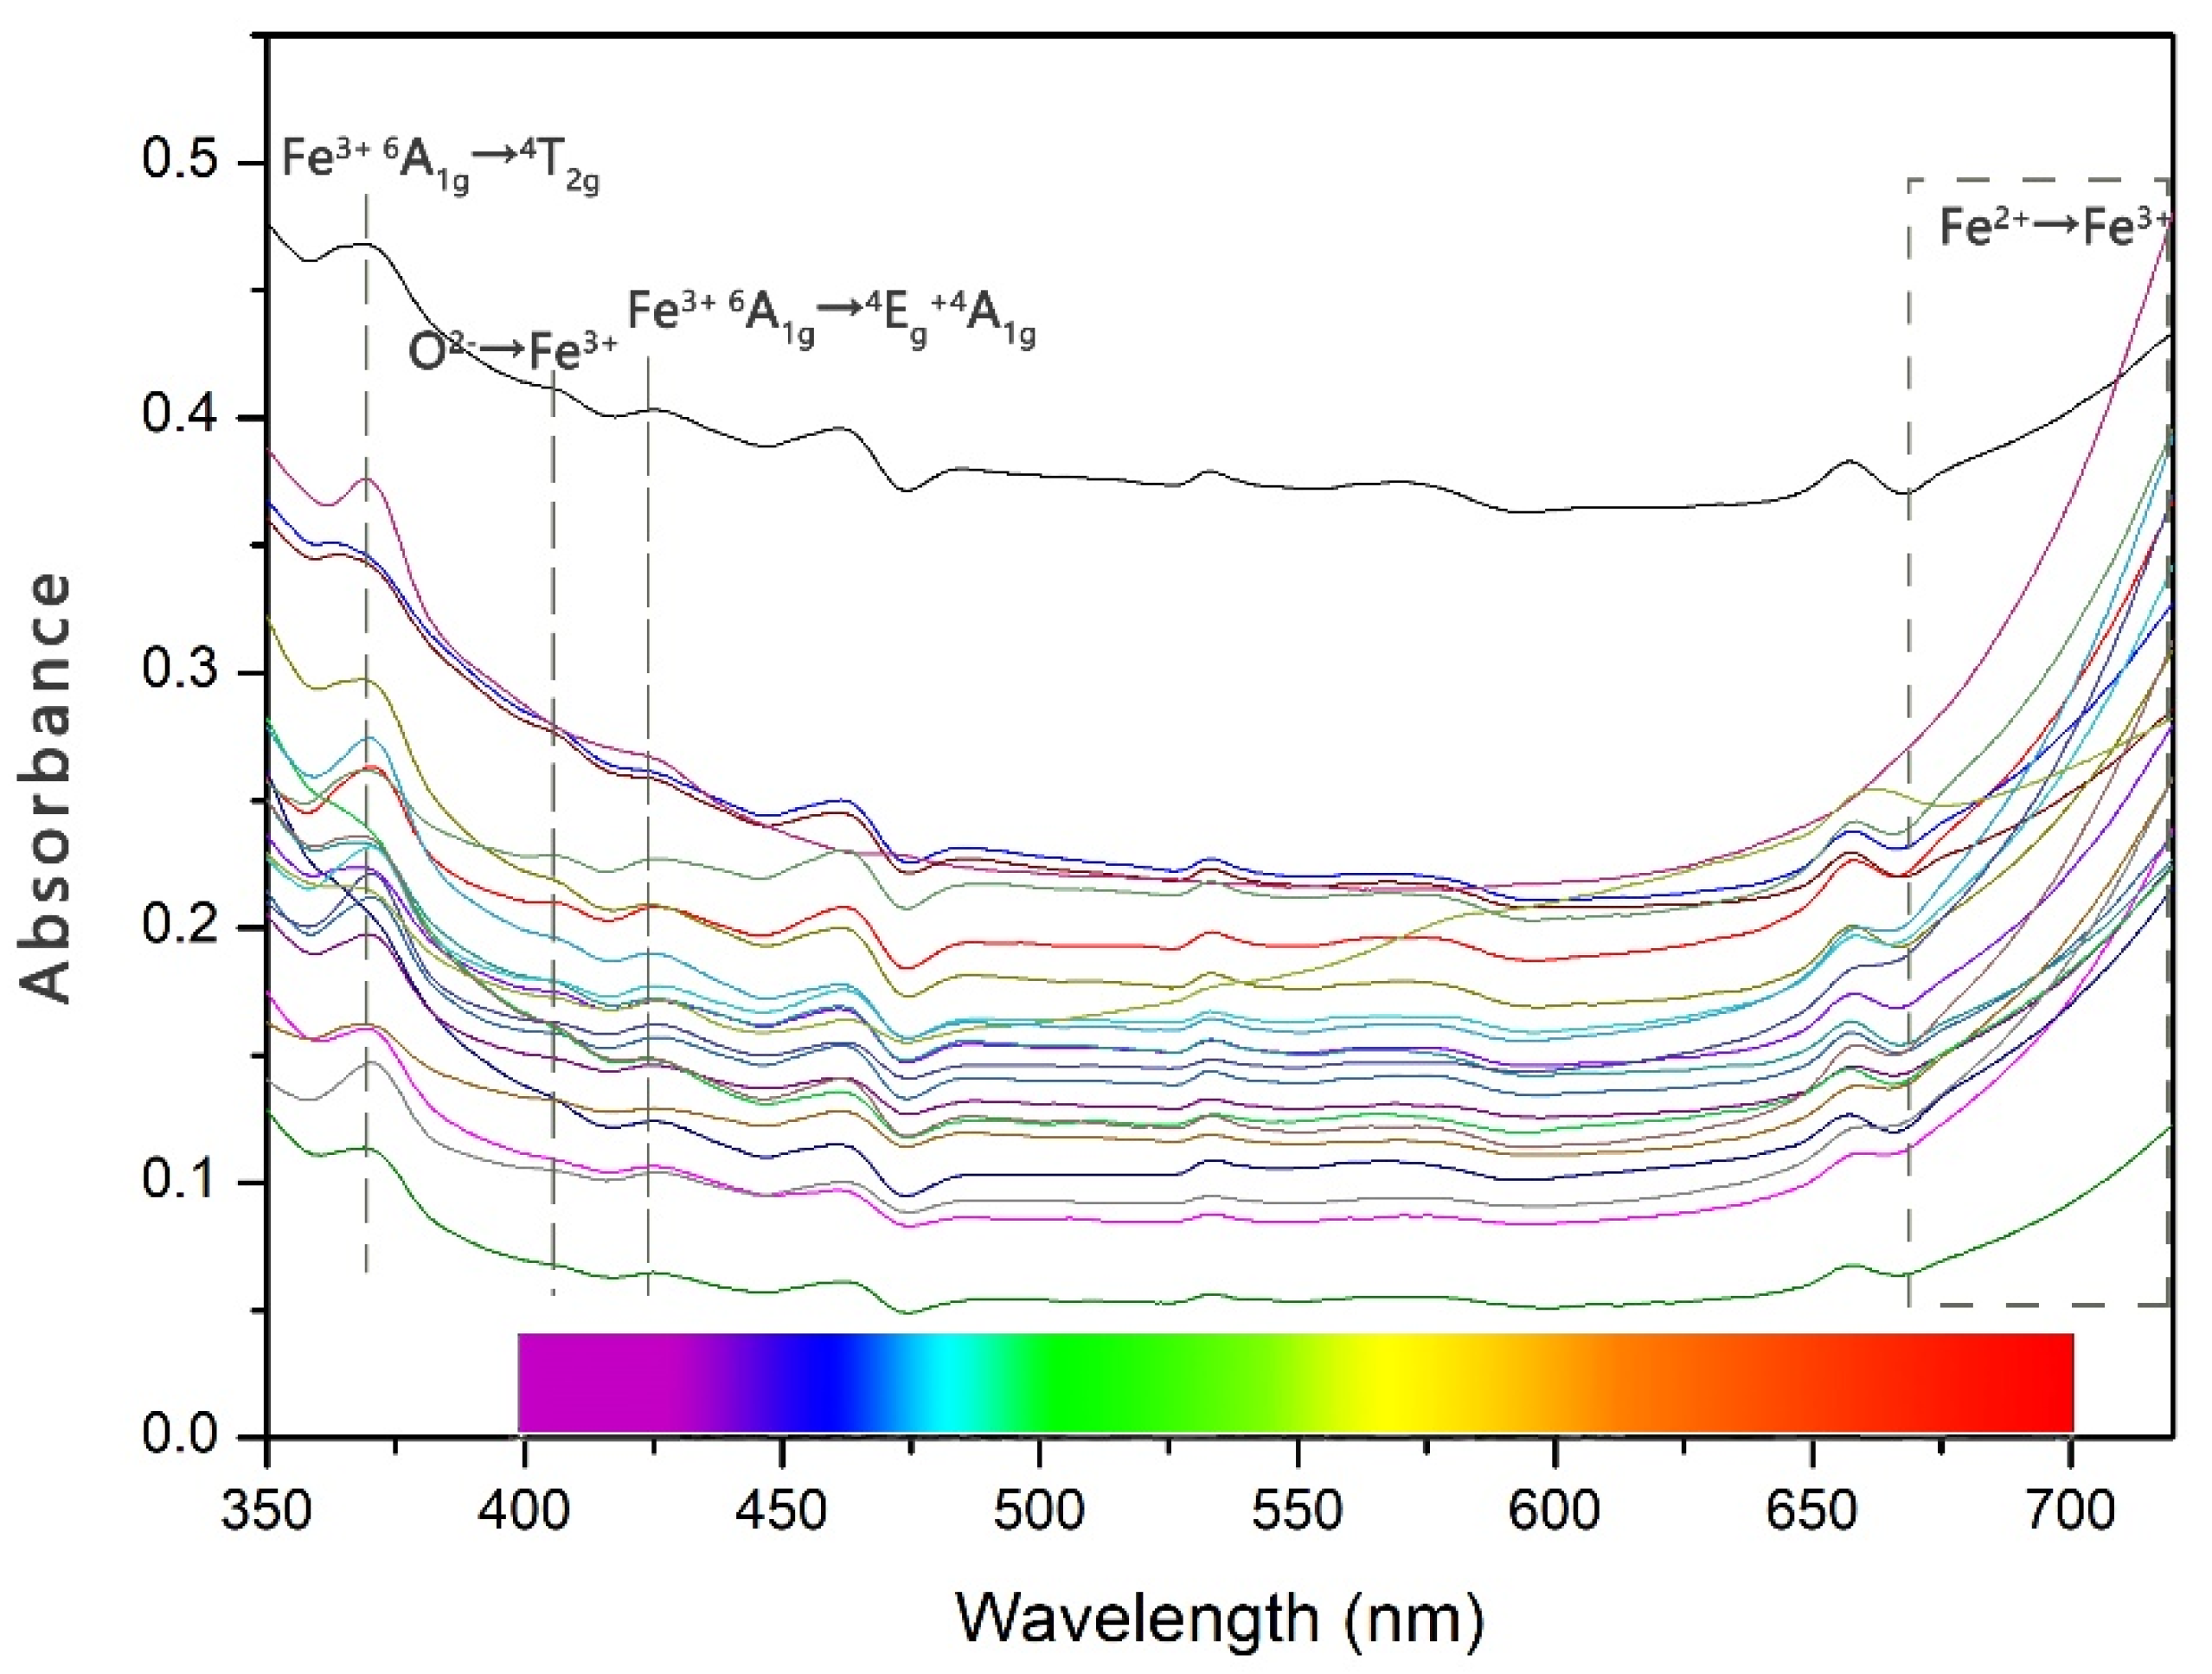
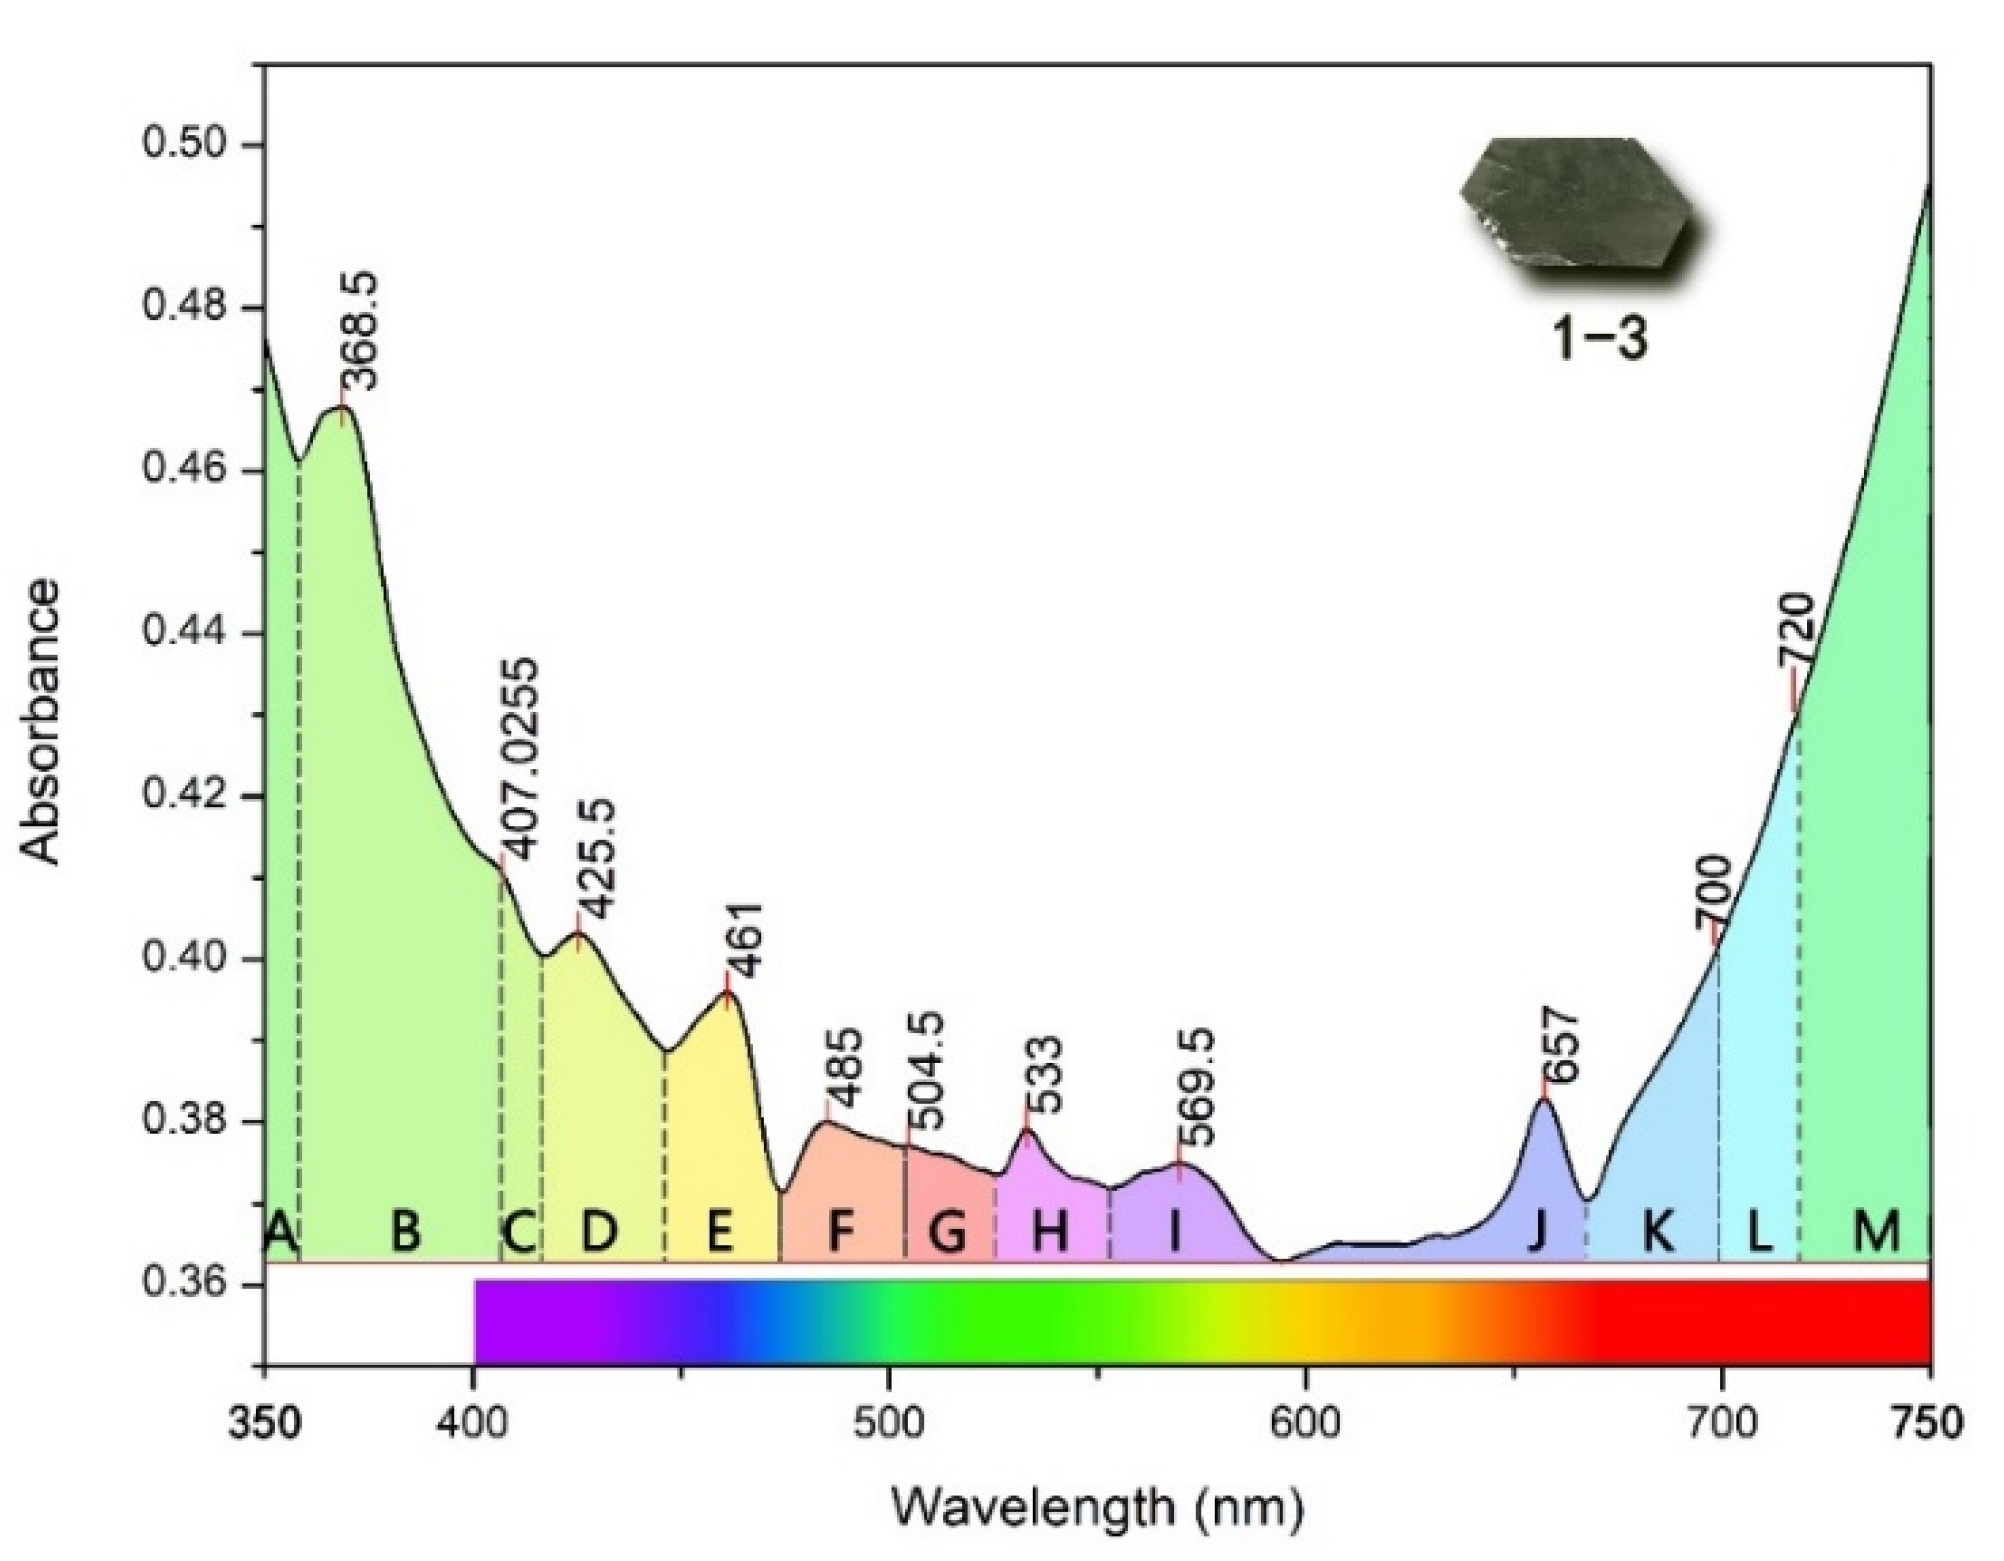
3.5. Characteristics of UV–vis Spectroscopy

The UV–vis absorption peaks of the samples within the range 350–700 nm are shown in Figure 7. The peak positions of all samples are essentially the same, except for differences in the peak intensity.
The absorptions at 368 nm and 425 nm (Figure 7) are caused by the 6A1g4T2g and 6A1g4Eg + 4A1g d–d electron transitions of Fe3+, respectively. The O2− → Fe3+ charge shift band below 320 nm is also attributed to the weak absorption peak at 407 nm. The absorption at 668–750 nm is attributed to the charge transfer of Fe2+ → Fe3+ in the octahedral position and extends to the infrared region, which is the main reason for the blue-green colour of beryl.

4. Discussion

4.1. Existence Form and Position of Fe Ions in Beryl

According to the XRF results, the following information can be obtained from the content of Al, total Fe, and alkali metal elements in Figure 8. The total Fe content was negatively correlated with the content of Al and was positively correlated with the content of alkali ions after removing the samples dominated by tetrahedral site substitution (with c/a = 0.998 as the dividing line). This can be explained by the two main forms of the Fe ion. The Fe ion replaces the octahedral Al ion, possibly in the form of Fe3+ or Fe2+. In the latter case, alkali metal ions go into the hexagonal ring channel, to compensate for the charge difference caused by Fe2+ replacing Al3+. Fe3+ enters the hexagonal ring channel in the form of filler impurity ions and hydrolyses with water molecules. Under the polymerization of alkali ions, [Fe2(OH)4]2+ copolymer and ion are generated [21]:
2Fe3+ + 2H2O = [Fe2(OH)4]2+ + 2H+ k = 10−291

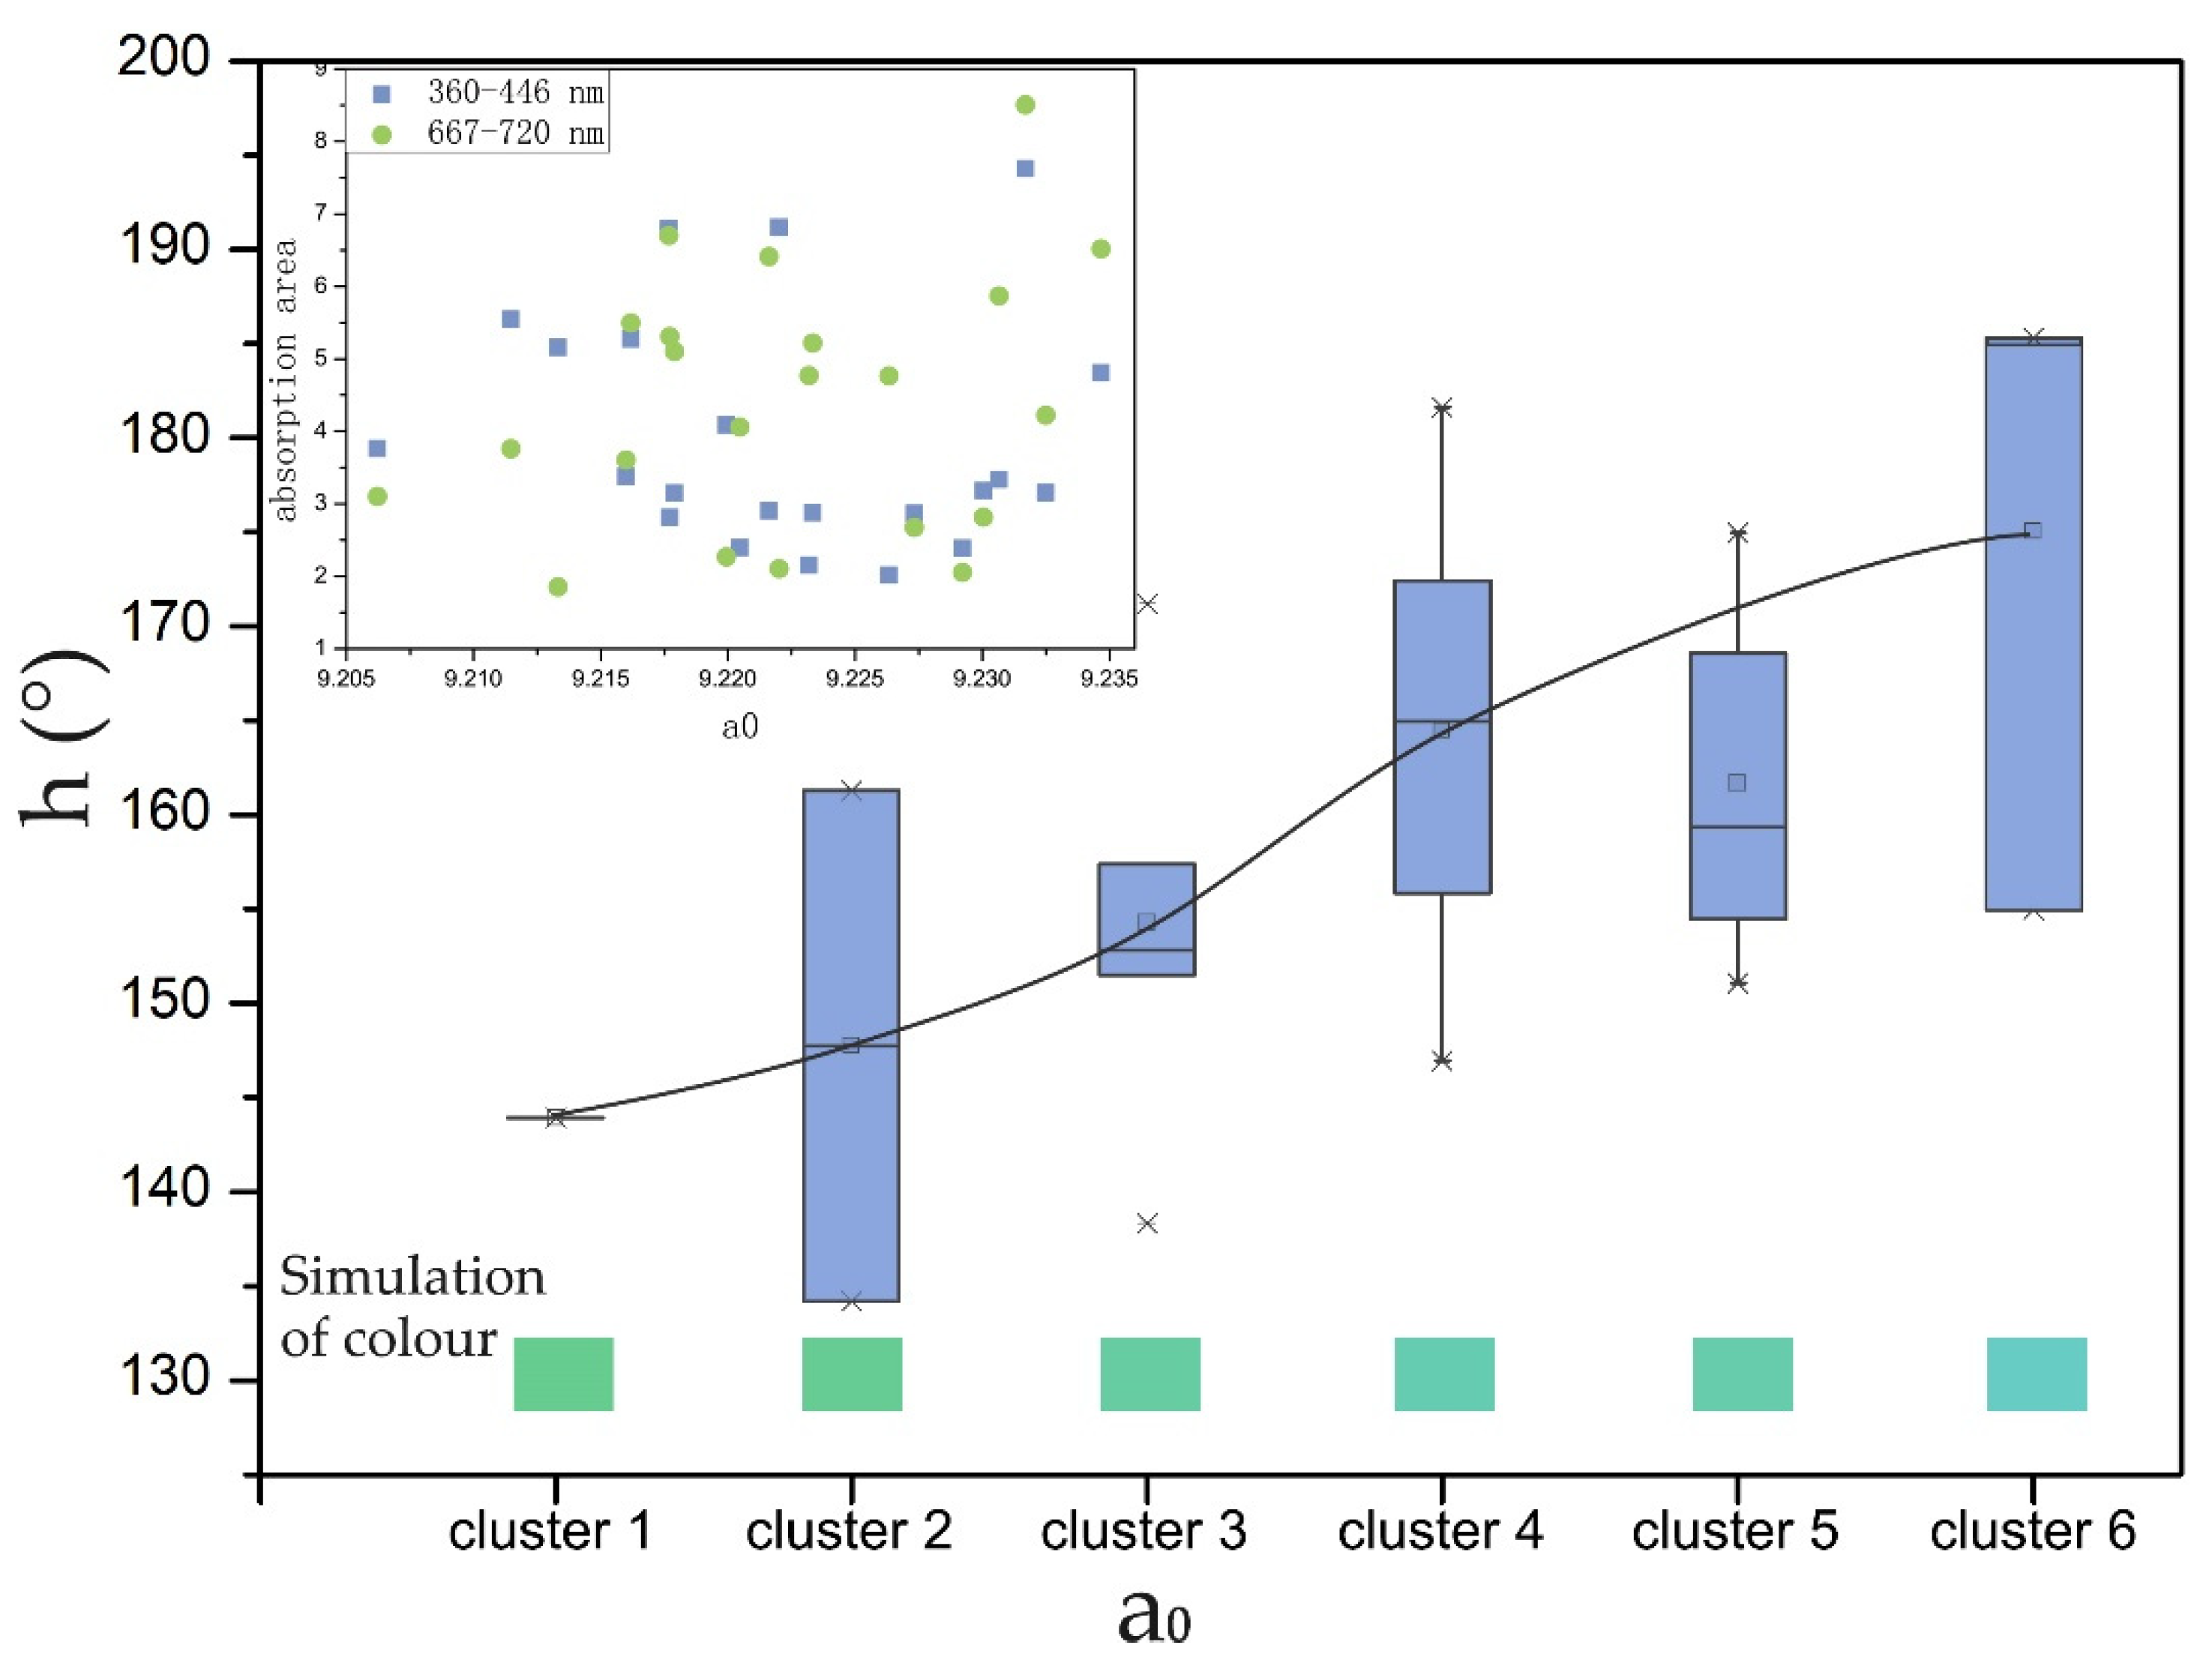
4.2. Effect of Fe Ions on the Tone Angle of Blue-Green Beryl

The UV–vis spectrum shows different absorptions of visible light, and according to the colour mixing principle, different absorptions of visible light superimpose to produce different colour. Taking sample no. 1–3 as an example, its UV–vis absorption spectrum is given in Figure 9. The visible spectrum corresponding to 400–750 nm is in the lower right, and the colour block under the absorption curve is the remaining visible colour within the region after absorption [23]. There is a boundary in the 400–700 nm range. The absorption to the left of the boundary and the absorption to the right superimpose to affect the hue of beryl. The valley is the place where the boundary is likely to occur. For example, dividing the absorption area on the left of 503 nm and the absorption area on the right gets a value that represents the ratio of absorption intensity on both sides of 503 nm, which directly determines the colour of beryl. After calculating the correlations between every ratio of absorption areas on the left and right sides of these boundaries (valley of the spectrum) and hue angle (h), it was found that 526 nm was the most accurate boundary. The ratio of absorption area on both sides around 526 nm had the highest correlation with h.
In order to make calculation easier, these absorption peaks were divided into different blocks (the boundary 526 nm is between block G and block H, Figure 9). We calculated the block areas and represented them with “S”.
Since absorption peaks also occur in the near-infrared and near-ultraviolet regions, in order to explore whether the absorption of these two regions affects the colour of beryl, the absorption areas of regions A (350–358 nm), B (358–407 nm), L (700–720 nm), and M region (720–750 nm) were added. The following calculations were made: S(C– G)/S(H–K), S(B–G)/S(H–K), S(A–G)/S(H–K), S(C–G)/S(H–L), S(B–G)/S(H–L), S(A–G)/S(H–L), S(C–G)/S(H–M), S(B–G)/S(H–M), and S(A–G)/S(H–M). The correlation between these results and the tone angle is shown in Figure 10. It can be seen that S(C–G)/S(H–L) has the highest correlation with the tone angle, i.e., absorption at 407–720 nm has an impact on the tone angle.
Shao and Zhang [24] concluded that the specific colour of transition metal complexes was related to specific charge transitions, which can be divided into four types: coordination field transition (d–d transition), charge transition (CT), intervalence transition (IT), and bonding–antibonding transition (b–a transition). Combined with the UV–vis and IR spectrums, it can be inferred that the absorption of visible light by iron ions in beryl mainly includes the d–d transition of Fe3+, the charge transition between O2− → Fe3+, the valence transition of Fe3+/Fe2+, and the charge transition of the metal M–M bond binuclear complex formed by [Fe2(OH)4]2+ in beryl channels.
Feng and Jiang [23] concluded that Fe3+ was the main reason for the absorption peaks at 373 nm and 429 nm. According to this, blue-green beryl is formed when the Fe3+–O2 charge transfer spectrum is weak, and the absorption peak extends not far into the purple zone. When the transfer spectrum is strong and the absorption peak extends to the blue zone, the blue light transmission of mineral species is weakened, so that beryl minerals appear green. When the transfer spectrum is strong and the absorption peak further extends to the green zone, beryl appears yellow.
However, the actual result was not so. For example, samples no. 2–3, 3–2, and 3–6 lacked the absorption peak at 364–379 nm, but still showed relatively more yellow tones. Through the absorption at 3234 cm−1 in the infrared spectrum, it was found that there was very little [Fe2(OH)4]2+ content in most of the 23 samples selected, and only samples no. 2–3, 3–2, and 3–6 had an [Fe2(OH)4]2+ absorption peak at 3234 cm−1. Samples with a similar iron content to these three samples were selected to compare their tone angles, and the data are listed in Table 2.
By comparison, it can be found that under the condition of similar total iron content, samples no. 2–3, 3–2, and 3–6 were more inclined towards a yellow tone (Figure 11).
Hu [5] also concluded that the absorption of Fe2+ and Fe3+ in the octahedral position did not occur in yellow beryl, which was mainly related to [Fe2(OH)4]2+ in the channel. In the comparative specimens adopted in this paper, there was also evidence that the tone angle of sample no. 1–2 was 113.192°, and the content of the iron ion was 3.843%, which was not much different from that of other samples, while the content of the alkali metals was 0.019%, which was far lower than that of other green beryl samples, indicating that most iron ions existed in the channel and were the main reason for the yellow tone.
It was speculated that the charge transition of the metal M–M bond in the binuclear complex of Fe3+ in [Fe2(OH)4]2+ occurs in the near ultraviolet region, superimposed with the absorption peak formed by the charge transition between the d–d transition of Fe3+ and O2 → Fe3+. When the content of [Fe2(OH)4]2+ is high, the ultraviolet absorption is strong. The absorption peak at approximately 364–370 nm caused by the d–d transition of Fe3+ is covered, forming an insignificant peak or a shoulder peak, whereby more absorption extends to the purple region of visible light, resulting in a more obvious yellow tone. When the content of [Fe2(OH)4]2+ is low, the absorption peak at 364–370 nm is clear and beryl is blue-green at this time.
It can also be proved by the relationship between a0 and hue angle (Figure 12). With the increase of a0, octahedral substitutions dominated by Fe ions increase, and the absorption areas of the purple and red zones change irregularly, because Fe2+ and Fe3+ exist at the same time, and the hue angle keeps increasing, shifting from yellow to blue, indicating that the absorption of the red zone is mainly the valence transition of Fe3+/Fe2+. The absorption in the blue-purple region is dominated by the charge transition of the metal M–M bond in the binuclear complex of Fe3+ in [Fe2(OH)4]2+.

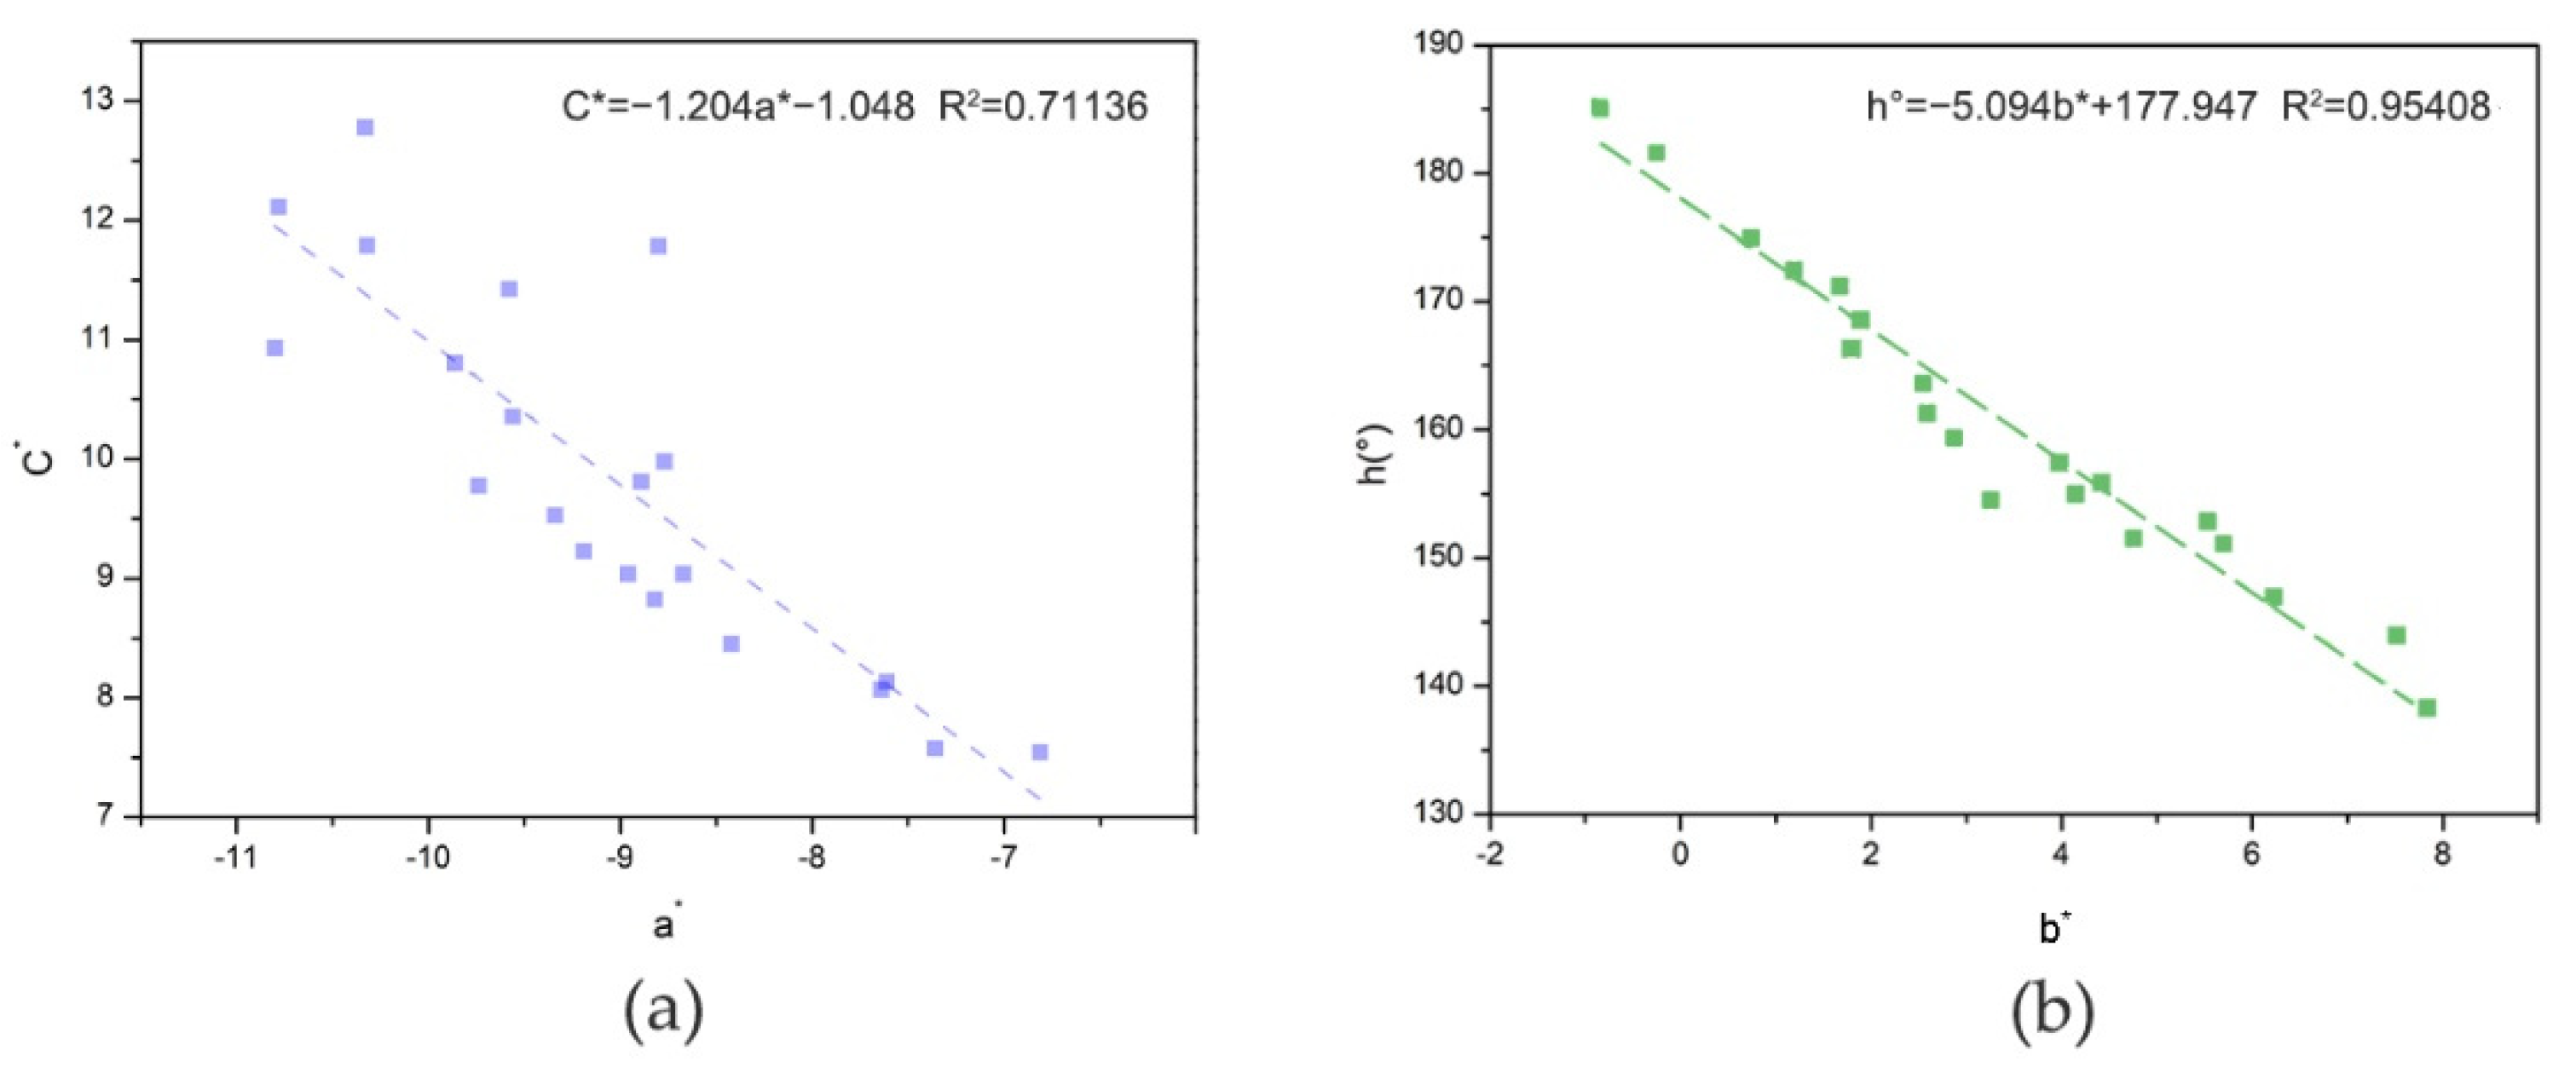
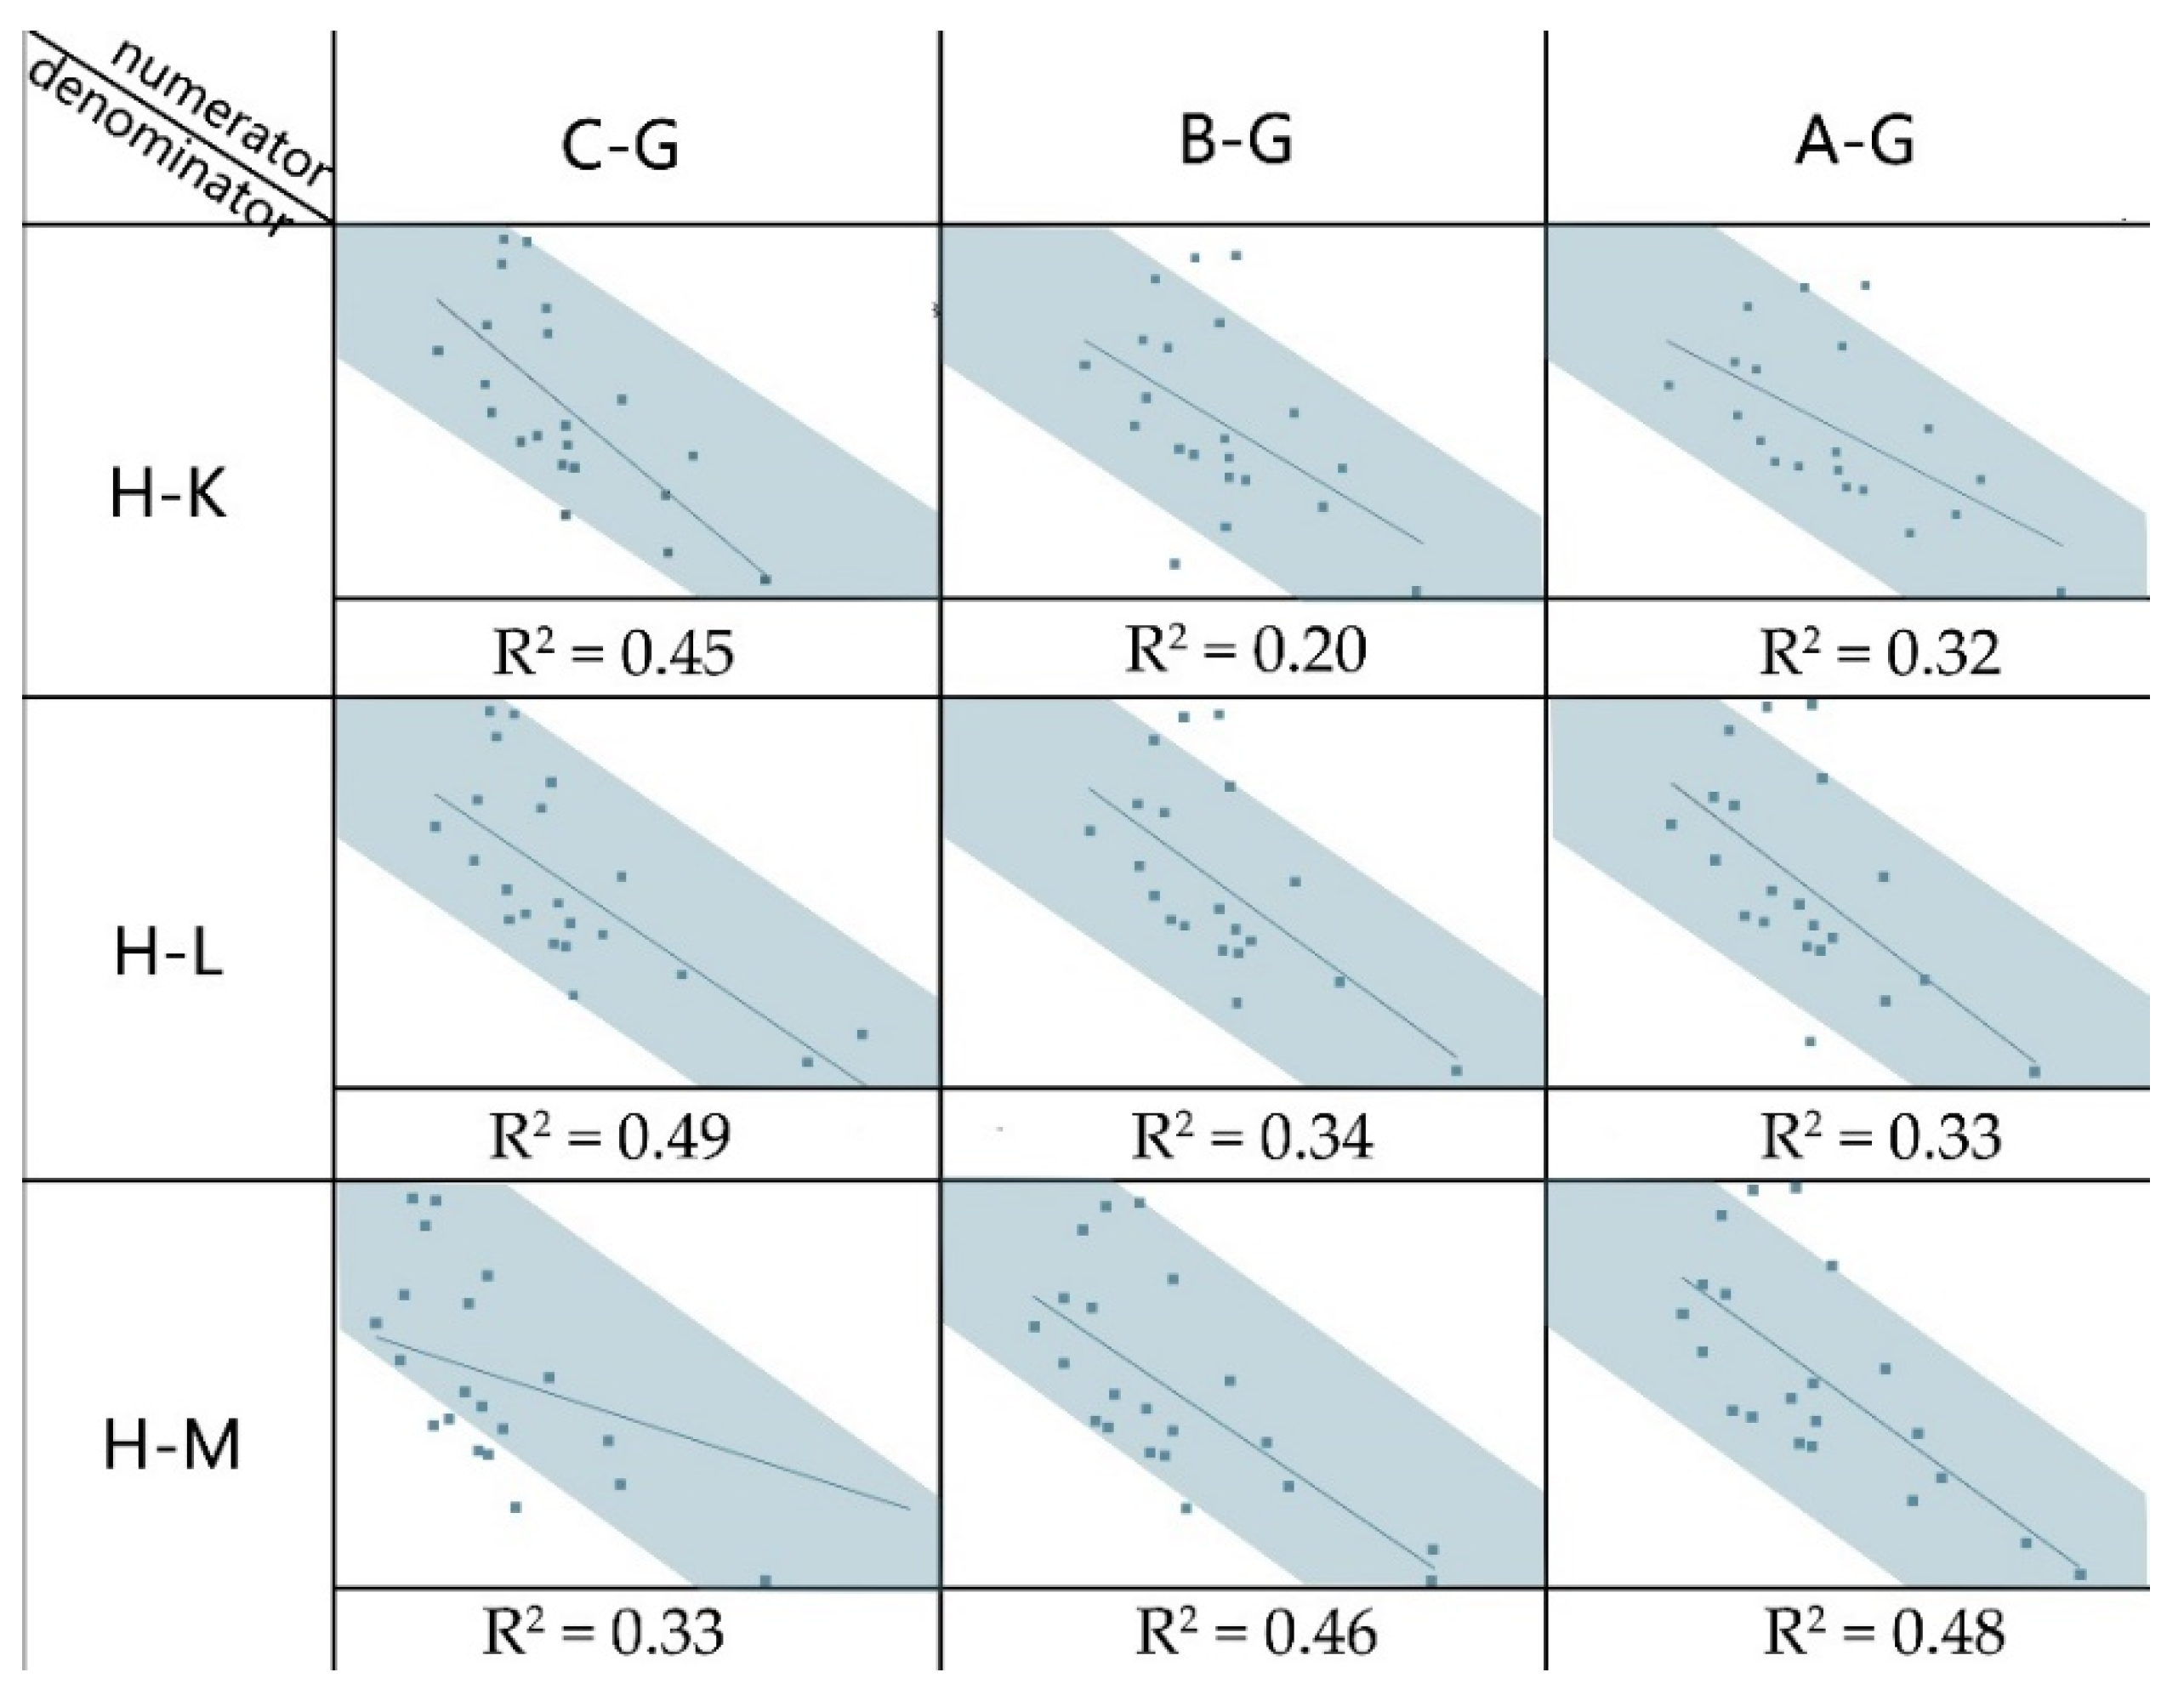
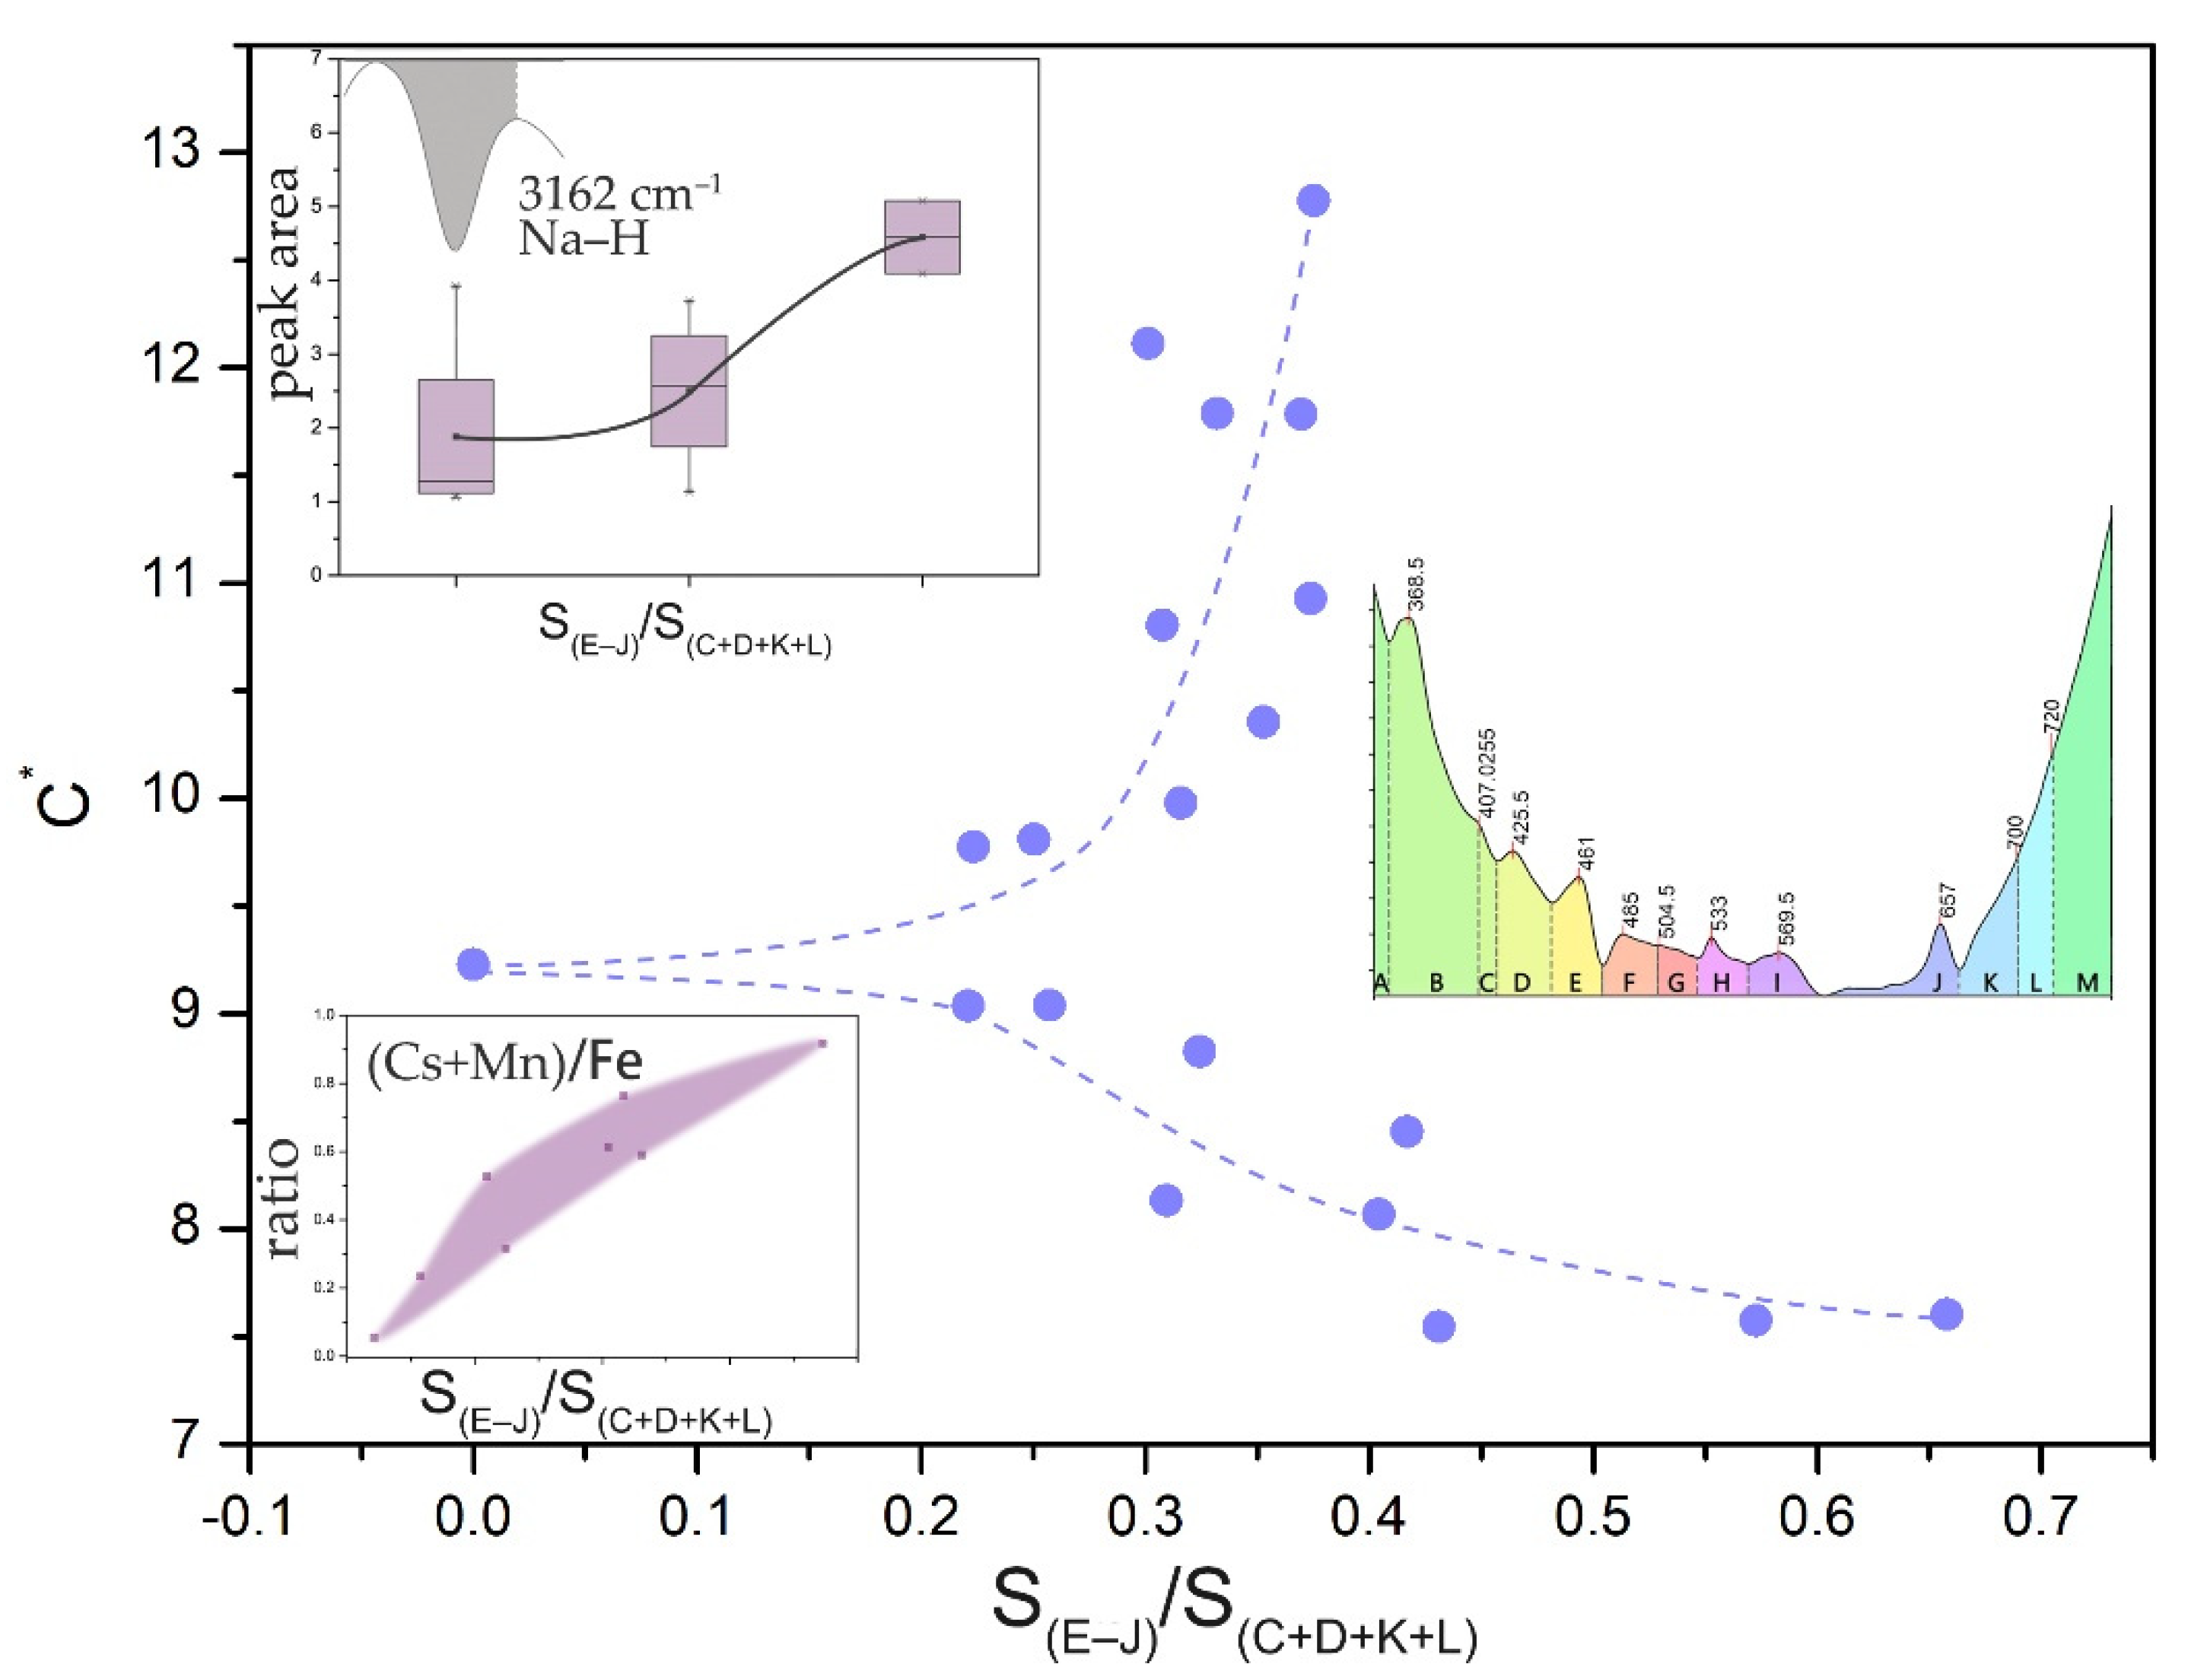
4.3. Influence of Transition Metal Elements on the Chroma of Blue-Green Beryl

Although Cs+ is not a transition metal ion, it can cause absorption at 450–500 nm and 605–745 nm, while Mn2+ can cause absorption at 550 nm [24]. The absorption peaks at 447–667 nm are thought to be caused by Cs+ and Mn2+ in blue-green beryl.
Monochromatic light in the visible spectrum is the most chromatic colour, and the chroma decreases when other spectral colours are superimposed [25]. Therefore, the absorption of Cs+ and Mn2+ in the range of 447–667 nm affects the chroma of blue-green beryl. By comparing the absorption area ratio of the E-J (447–667 nm) blocks and C + D + K + L (400–447 nm and 667–750 nm) blocks with C*, it can be found that a part of C* is positively correlated with S(E-J)/S(C+D+K+L), while the other part is negatively correlated. The contents of Cs + Mn in the latter also increased, indicating that the ratio of Cs + Mn to Fe content was negatively correlated with the chroma of blue-green beryl. It is speculated that the former is positively correlated with the contents of type I water and type II water in the channel, because the area at 3161 cm−1 (attributed to the vibration of Na-H, which leads to the transformation of type I water into type II water in the channel) shows an upward trend, while there is no obvious rule in the latter. This will be further explored in another article (Figure 13).

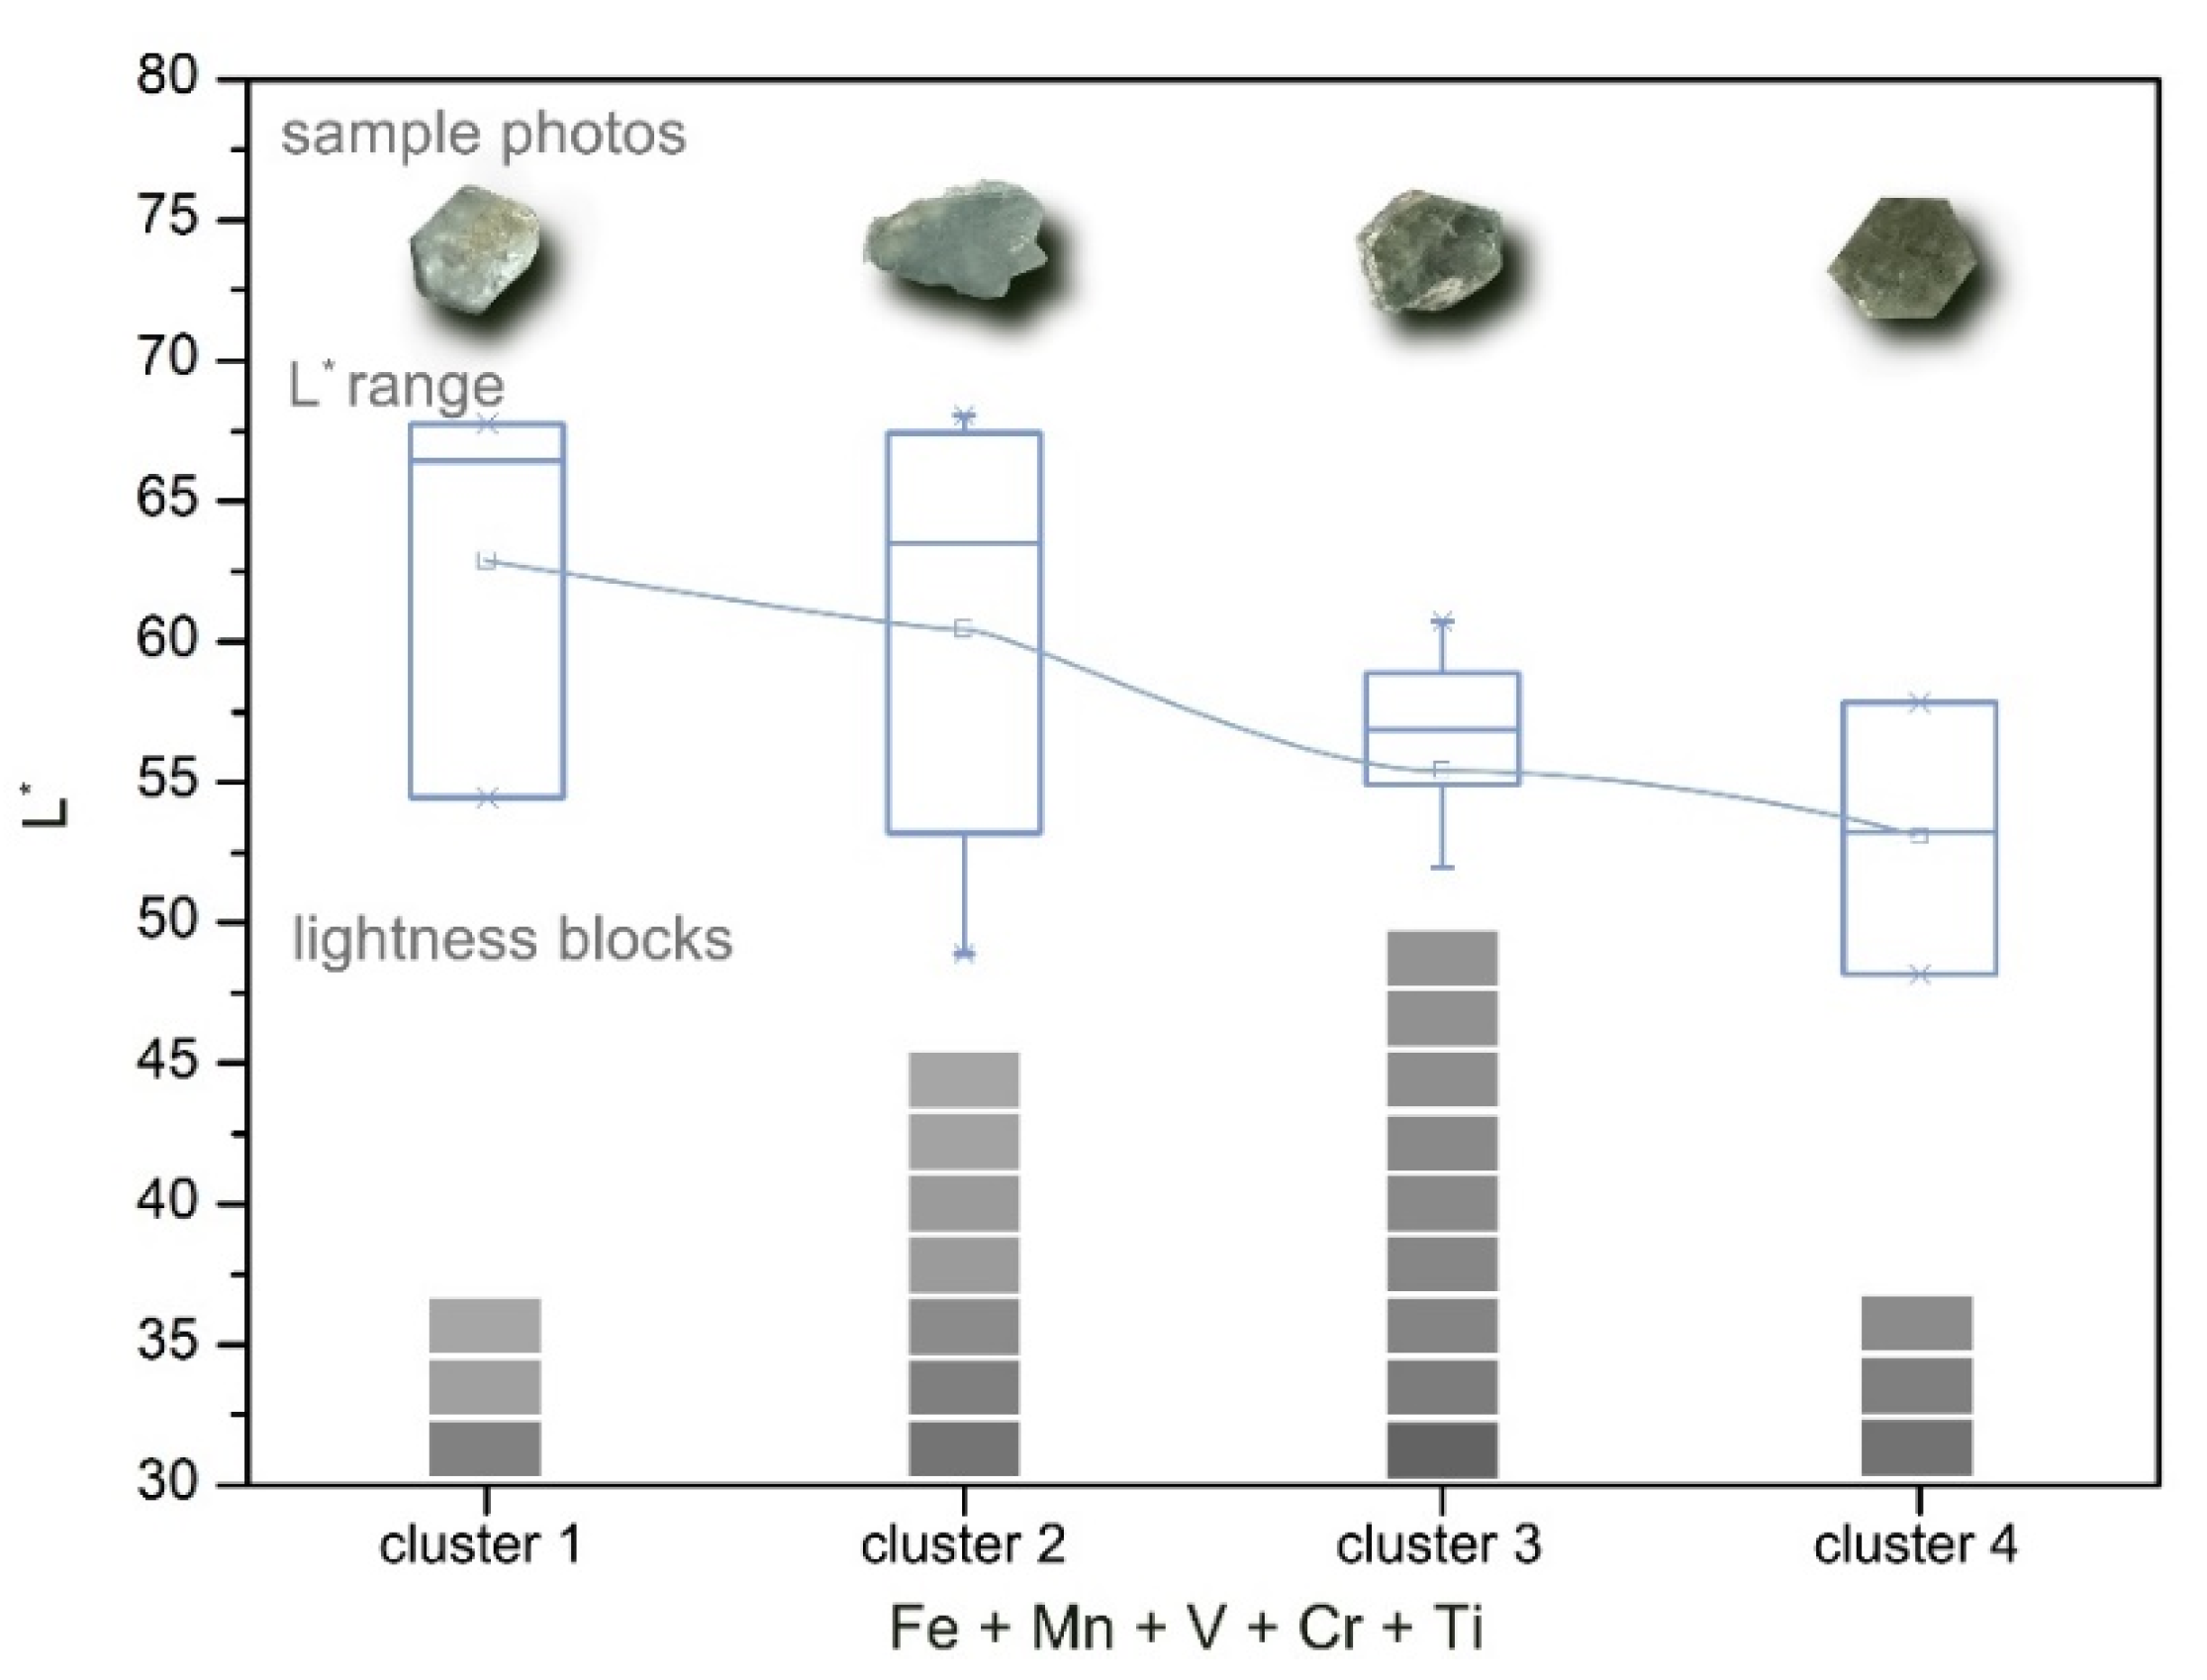
4.4. Influence of Transition Metal Elements on the Lightness of Blue-Green Beryl

By summarizing the content of transition metal elements in the sample and the lightness (L*, obtained by industrial camera Mako G-507C, mentioned in Section 3.1), it was found that when the total amount of chromaticity ions in the sample increased, the L* of the sample showed a downward trend (Figure 14).

5. Conclusions

The colour of blue-green beryl is determined by lightness (L*), chroma (C*), and hue angle (h). The influence factors of L*, C*, and h were obtained by UV-–vis, IR, XRF, and XRD.
Beryl is a kind of beryllium-aluminium silicate mineral. It can be tested by XRF that the impurities in beryl mainly include Fe, Cs, Cu, Mn, V, Cr, Ti, etc. These chromophores are the main factors leading to the blue-green colour of beryl. Secondly, alkaline ions such as K and Rb were detected, which existed in the channels to compensate for the charge difference caused by isomorphic substitution. The crystal cell parameters can be obtained after refining the XRD data. Compared with the standard crystal cell parameters, it was found that there was a substitution in tetrahedral and octahedral positions, and the Fe content had negative correlations with the Al content and the crystal cell parameter a0, respectively. As impurity ions replace Be and Al, the lattice is distorted and the vibration wavenumber in the fingerprint frequency region of IR spectrum is shifted. The peaks caused by Na-H, [Fe2(OH)4]2+, and M-OH were found in the group frequency region of the IR spectrum. These test results indicated the Fe ions existed not only in the octahedral position in the form of Fe2+ and Fe3+ but also in the channel.
According to the UV–vis and IR spectra, the absorption peaks at 368 nm and 425 nm were caused by the d-d transition of Fe3+, and the weak absorption peaks at 407 nm were caused by the charge transfer between O2 → Fe3+. Moreover, the charge transition of binuclear metal M–M complexes formed by [Fe2(OH)4]2+ in the channels was absorbed in the whole near-ultraviolet region, and they caused the yellow colour in the beryl. The absorption in the near-infrared region was due to the valence transition of Fe3+/Fe2+, which caused the blue colour in the beryl. The combination of absorption in the near ultraviolet and near infrared regions made the beryl blue-green.
The absorption at 447–667 nm was related to Cs+ and Mn2+. The ratio of (Cs + Mn)/Fe content was negatively correlated with the saturation of blue-green beryl.
By adding the contents of Fe, Mn, V, Cr, and Ti tested in XRF, it was found that when the total amount of transition metal elements increased, the lightness value L* decreased.

Author Contributions

Conceptualization, H.W.; methodology, H.W. and Q.G.; validation, Y.G.; formal analysis, Y.L.; investigation, H.W.; resources, Q.G. and Y.L.; data curation, Q.G. and Y.L.; writing—original draft preparation and editing, H.W.; supervision, Y.G.; project administration, Q.G.; funding acquisition, Y.L. All authors have read and agreed to the published version of the manuscript.

Funding

Not applicable.

Data Availability Statement

Not applicable.

Acknowledgments

The experiments in this research were conducted in the laboratoriess of the Gemological Institute, China University of Geosciences, Beijing.

Conflicts of Interest

The authors declare no conflict of interest.

References

  1. Qi, L.; Ye, S.; Xiang, C.; Pei, J.; Luo, Y. Colour Center and Colouring Mechanism of Irradiated Beryl. Geol. Sci. Technol. Inf. 2001, 20, 68–72. [Google Scholar]
  2. Yang, S. Aquamarine Optimization Process and Mechanism. Master’s Thesis, Tong Ji University, Shanghai, China, 2014. [Google Scholar]
  3. Goldman, D.S.; Rossman, G.R.; Parkin, K.M. Channel constituents in beryl. Phys. Chem. Miner. 1978, 31, 225–235. [Google Scholar] [CrossRef]
  4. Loeffer, B.M.; Burns, R.G. Shedding light other colour of gems and minerals. Am. Sci. 1976, 64, 636–647. [Google Scholar]
  5. Hu, D. Colouration Mechanism and Positions of Impurities in Yellow Beryl from Wulateqianqi, Inner Mongolia. Master’s Thesis, China University of Geosciences, Beijing, China, 2010. [Google Scholar]
  6. Zhong, Q.; Liao, Z.; Zhou, Z. Gemmological Characteristic of Hydrothermal Synthetic Paraiba-Colour Beryl. J. Gems Gemmol. 2016, 18, 1–7. [Google Scholar]
  7. Jiang, Y.; Guo, Y.; Zhou, Y.; Li, X.; Liu, S. The Effects of Munsell Neutral Grey Backgrounds on the Colour of Chrysoprase and the Application of AP Clustering to Chrysoprase Colour Grading. Minerals 2021, 11, 1092. [Google Scholar] [CrossRef]
  8. Tang, J.; Guo, Y.; Xu, C. Colour effect of light sources on peridot based on CIE1976L*a*b*colour system and round RGB diagram system. Colour Res. Appl. 2019, 44, 932–940. [Google Scholar] [CrossRef]
  9. Yan, J.; Zhao, C. Survey on K-Means Clustering Algorithm. Comput. Eng. Appl. 2019, 55, 7–14. [Google Scholar]
  10. Ahmad, N.; Ayob, D.; Samad, N.; Vagudeh, R.; Hamid, P. A comprehensive study of clustering ensemble weighting based on cluster quality and diversity. Theor. Adv. 2019, 22, 133–145. [Google Scholar]
  11. Jiang, Y.; Guo, Y. Genesis and influencing factors of the colour of chrysoprase. Sci. Rep. 2021, 11, 9939. [Google Scholar] [CrossRef] [PubMed]
  12. Guo, Y. Quality evaluation of tourmaline red based on uniform colour space. Clust. Comput. 2017, 20, 3393–3408. [Google Scholar] [CrossRef]
  13. Tang, J.; Guo, Y.; Xu, C. Metameric effects on peridot by changing background colour. J. Opt. Soc. Am. A 2019, 36, 2030–2039. [Google Scholar] [CrossRef] [PubMed]
  14. Guo, Y.; Wang, H.; Du, H. The foundation of a colour-chip evaluation system of jadeite-jade green with colour difference control of medical device. Multimed. Tools Appl. 2016, 75, 14491–14502. [Google Scholar] [CrossRef]
  15. Guo, Y.; Wang, R.; Xu, S. A Study of the Structure of a Rare Tabular Crystal of Beryl. Geol. Rev. 2000, 46, 312–317. [Google Scholar]
  16. Xueding, W.; Ying, G. The impact of trace metal cations and absorbed water on colour transition of turquoise. R. Soc. Chem. 2021, 8, 201110. [Google Scholar]
  17. Qu, M. Mineralogical and Gemological Study of Aquamarine from Keketuohai in Aletai of Xinjiang. Master’s Thesis, China University of Geosciences, Beijing, China, 2014. [Google Scholar]
  18. Aurisicchio, C.; Grubessi, O.; Zecchini, P. Infrared spectroscopy and crystal chemistry of the beryl group. Can. Mineral. 1994, 32, 55–68. [Google Scholar]
  19. Chen, J. Characteristics of Mineralogy and Spectroscopy of the Emerald Deposit. Master’s Thesis, China University of Geosciences, Beijing, China, 2015. [Google Scholar]
  20. Lu, W. The Infrared Spectroscopy of Minerals; Chongqing University Press: Chongqing, China, 1988; pp. 71–77. [Google Scholar]
  21. Weng, S.; Xu, Y. Fourier Transform Infrared Spectroscopy Analysis; Chemical Industry Press: Beijing, China, 2016; p. 35. [Google Scholar]
  22. Qi, L.; Ye, S.; Xiang, C. Vibration Spectrum and Irradiation Splitting of Mixture in Beryl Channels. Geol. Sci. Technol. Inf. 2001, 20, 59–64. [Google Scholar]
  23. Feng, Y.; Jiang, X. A Study of the Pegmatitic-Pneumatolytic-Hypothermal Beryls and Aquamarines from the Arskartor Mine in Xinjiang. Acta Petrol. Mineral. 1987, 4, 344–351. [Google Scholar]
  24. Li, J. Gemological Characteristics of Morganite from Brazil. Master’s Thesis, China University of Geosciences, Beijing, China, 2020. [Google Scholar]
  25. Tang, S. Colourimetry; Beijing Institute of Technology Press: Beijing, China, 1990. [Google Scholar]
Figure 1. Images of 23 cylindrical beryl samples. The experimental samples, which are blue-green, are on the left of the dotted line, and the reference sample, which is yellow, is on the right of the dotted line.
Minerals 12 00086 g001
Figure 2. Colour distribution of samples in the CIELAB space. Hab ranges from 134° to 185°. L* ranges from 41 to 68.
Minerals 12 00086 g002
Figure 3. Plots of the correlation between (a) a* and C*, and (b) b* and h.
Minerals 12 00086 g003
Figure 4. Diagram of a0, c0, and the total Fe in direct proportion. Blue dots are c0, which show a positive relationship with a0; Fe contents were divided into different groups by K-means clustering and every grey box is the Fe content within a group.
Minerals 12 00086 g004
Figure 5. Absorption spectrum between 400 and 1300 cm−1 of sample no.1–6 in two directions. Black spectrum was tested in the direction of E ⊥ C; red spectrum was tested in the direction of E C.
Minerals 12 00086 g005
Figure 6. IR transmittance spectrum at 2400–3500 cm−1, including assigned peaks and a diagram of the structure of beryl.
Minerals 12 00086 g006
Figure 7. UV–vis spectrum of 23 samples. The different absorption peaks of iron are also plotted.
Minerals 12 00086 g007
Figure 8. Box diagram of the relationship between the weight contents of total Fe, Al and alkali ions. K-means clustering were used to divide the data into different groups and every box represents the data within a group. A schematic diagram of the chemical group occupation in beryl also showed in the figure.
Minerals 12 00086 g008
Figure 9. UV–vis absorption spectrum of sample no. 1–3; the letters represent different blocks of absorption peaks.
Minerals 12 00086 g009
Figure 10. Correlation between different wavelength ranges and tone angles.
Minerals 12 00086 g010
Figure 11. UV–vis and IR spectral characteristics of samples no. 2–3, 3–2, and 3–6. (a) The weak absorption peaks at 364–370 nm of sample no. 2–3, 3–2, 3–6, and reference sample no.1–2. (b) The strong absorption peaks at 364–370 nm of all samples except no. 2–3, 3–2, 3–6. (c)The strong absorption peak at 3234 cm−1 caused by [Fe2(OH)4]2+ of no. 2–3, and the Fe content of it is 3.673 wt %. (d) The strong absorption peak at 3234 cm−1 caused by [Fe2(OH)4]2+ of no. 3–2, and the Fe content of it is 2.773 wt %. No.3–7 and 3–9 are lack of the peak caused by [Fe2(OH)4]2+ but have the similar Fe content with 3–2. (e) The strong absorption peak at 3234 cm−1 caused by [Fe2(OH)4]2+ of no. 3–6, and the Fe content of it is 3.529 wt %. No. 2–1 and 3–3 are lack of the peak caused by [Fe2(OH)4]2+ but have the similar Fe content with 3–6. These characteristics suggest that when Fe ions are mainly present in the channels, they cause absorption in the near ultraviolet region and absorb the absorption peak at 364–370 nm.
Minerals 12 00086 g011
Figure 12. Box diagram of the relationship between a0 and h; every blue box represents parameters h in the different groups divided by K-means clustering.
Minerals 12 00086 g012
Figure 13. Relationship between S(E-J)/S(C+D+K+L) and C*, including the change in (Cs + Mn)/Fe and the area of peaks at 3161 cm−1.
Minerals 12 00086 g013
Figure 14. Box diagram of the relationship between the transition metal element content and L*; every blue box represents parameters L* in the different groups divided by K-means clustering; simulation blocks of lightness in each group are shown on the bottom, which gets from light to dark with the transition metal element content increasing; representative sample pictures of every group are shown above.
Minerals 12 00086 g014
Table 1. Absorption bands in the region 400–1300 cm−1 and their cause.
OrientationWavenumber (cm−1)Standard Wavenumber (cm−1)Cause
E ⊥ C12301195νasSi-O-Si
10241020νasO-Si-O
968950νsO-Si-O
808, 684800, 680νsSi-O-Si
651650νsBe-O
590, 530, 493585, 515, 490δSi-O νM-O
E C12301195νasSi-O-Si
1070, 10241020νasO-Si-O
968950νsO-Si-O
808, 747, 684800, 740, 680νsSi-O-Si
651650νsBe-O
590, 530, 493, 450585, 515, 490, 434δSi-O νM-O
Table 2. Iron content and tone angle of samples no. 2–3, 3–7, 3–9, 3–2, 2–1, 3–3, and 3–6.
SchemeTotal Fe (wt %)Hue Angle (°)Simulation of Colour
2–33.673159.34
3–63.529168.56
3–33.408185.28
2–13.412184.93
3–22.773143.95
3–92.746171.21
3–72.706172.43
Publisher’s Note: MDPI stays neutral with regard to jurisdictional claims in published maps and institutional affiliations.

