Article

Effect of Point Defects on Electronic Properties and Structure of Talc (001) Surface by First Principles

1
School of Chemistry and Chemical Engineering, Guangxi University for Nationalities, Nanning 530008, China
2
Key Laboratory of New Technology for Chemical and Biological Transformation Process of Guangxi Higher Education Institutes, Guangxi University for Nationalities, Nanning 530008, China
3
School of Resources, Environment and Materials, Guangxi University, Nanning 530004, China
*
Author to whom correspondence should be addressed.
Minerals 2022, 12(1), 69; https://doi.org/10.3390/min12010069
Submission received: 7 December 2021 / Revised: 30 December 2021 / Accepted: 4 January 2022 / Published: 5 January 2022
(This article belongs to the Topic Industrial Application of Clays and Clay Minerals)

Abstract

:
The surface structure and electronic properties of Mg vacancy defects on talc (001) and impurity defects with Fe, Mn, Ni, Al, and Ca replacing Mg atoms were calculated by using density functional theory. The calculation results show that the order of impurity substitution energy is Mn < Ni < Al < Ca < Fe. This indicates that Fe impurity defects are most easily formed in talc crystals. The covalent bonding between Si atoms and reactive oxygen atoms adjacent to impurity atoms is weakened and the ionic property is enhanced. The addition of Fe, Mn, and Ni atoms makes the surface of talc change from an insulator to a semiconductor and enhances its electrical conductivity. The analysis of electron state density shows that surface states composed of impurity atoms 4S orbital appear near the Fermi level.
Keywords:
talc; DFT; point defects

1. Introduction

Talc is a layered magnesite silicate mineral belonging to the monoclinic crystal system with space group C1 [1]. The lattice constant of talc is a = 5.29 Å, b = 9.17 Å, and c = 9.46 Å [2,3]. The composition of talc is MgO 31.72%, SiO2 63.12%, and H2O 4.76%. It is one of the common gangue ores in sulfide ore, such as molybdate and nickel sulfide ores [4]. The surface of talc crystal is composed of the base plane and edge plane. The edge surface is hydrophilic and consists of -SiOH and -MgOH. The base plane is hydrophobic and consists of -Si-O-Si-. The hydrophobic surface accounts for 90% of the talc surface. Due to the strong natural floatability of talc, it is easy to float into concentrate with bubbles in the flotation process, resulting in a reduced concentrate grade. This property has a serious impact on subsequent smelting processing [5,6].
It was found that the composition and flotation recovery of different talc deposits differed in flotation practice. For example, Zhang [7] selected talc from Dandong, Liaoning Province, (95% purity) for pure mineral experimentation without inhibitor and collector, using Methyl isobutyl carbinol (MIBC) as foaming agent, and the talc recovery rate was over 90%. Long [8] used talc from Haicheng, Liaoning Province, and the flotation recovery was 80–90% in a pure mineral experiment. Ca2+ was found in talc by the amount of ion leaching from the mineral aqueous solution. Talc minerals used by Mahmoud [9] in an experiment were from Egypt, with high Al2O3 and Fe2O3 content in the composition, so the flotation results were somewhat different from those of talc from domestic mines. The reason for the difference in flotation recovery of talc from different producing areas is that talc is usually accompanied by different kinds of point defects due to differences in mineralization conditions and environment. Mg atoms in talc are often replaced by Fe, Mn, Ni, Al, and Ca atoms to form talc of different components [10,11,12]. Due to the presence of these impure atoms, the color of talc is also different, usually white, light yellow, light green, etc. Therefore, the study on the properties and floatability of talc with different kinds of point defects is beneficial to the selection and design of green, specific, and efficient inhibitor molecules in the flotation process of talc [13].
Mineral flotation is an interface process. The adsorption and electron transfer of reagent molecules take place at the mineral interface, so the electronic structure and properties of the mineral surface are the basis of the flotation interface [14,15]. The adsorption capacity of talc with different impurity types to reagent molecules varies to some extent, resulting in different flotation behaviors. In this paper, the structural properties, energy band structure, state density, charge density, and Mulliken population of talc (001) with point defects were studied at the atomic level by using the CASTEP module based on density functional theory, and the surface structures and electronic properties of talc with different point defects were obtained [16,17]. This can provide theoretical help for the design and development of talc inhibitors for different types of point defects.

2. Computational Methods and Models

2.1. Calculation Parameters and Models

In this study, the Castep code in Materials Studio7.0 software (7.0, BIOVIA, San Diego, CA, USA) is used for calculation, based on density functional theory and the plane wave pseudopotential method [18]. First, the calculation parameters were tested. The structure of the talc cell was optimized by using different exchange correlation functions, kinetic energy cutoff of the plane wave basis, and the K-Point. The optimum parameters were selected according to the error percentage of lattice parameters and the total energy of the system. The geometric optimization criteria converged according to the following parameters: the convergence threshold of atomic displacement was 0.001 Å; for self-consistent electronic minimization, the Pulay density mixing method was employed with convergence tolerance of 1.0 × 10⁻⁷ eV·atom−1; the energy tolerance was 1.0 × 10⁻⁷ eV·atom−1; and the force tolerance was 0.05 eV/Å. The calculated smearing value of the state density was 0.2 eV. Ultra-soft was chosen as the pseudopotential method. All calculations took place in reciprocal space. After testing, the thickness of the vacuum layer has little influence on the structure of talc, but considering the large polysaccharide molecule, 20 Å is selected as the thickness of the vacuum layer for subsequent calculation. The generalized-gradient approximation of Perdew-Burke-Ernzerhof (GGA-PBE) was chosen as the exchange correlation function. A cutoff energy of 600 eV was adopted for subsequent calculation. K-Points was 4 × 2 × 2.
The valence electrons selected by atomic pseudopotential calculation were H 1s1, O 2s22p4, Mg 2p63s2, Si 3s23p2, Fe 3d64s2, Ni 3d84s2, Al 3s23p1, and Mn 3d54s2. Spin was not taken into account in the calculations, since talc itself is not magnetic. Considering the Van der Waals force, dispersion correction for density functional theory (DFT + D) was adopted in the calculation [19,20]. After the above convergence test, the GGA-PBE was selected as the exchange correlation function, with cutoff energy of 600 eV and K-points of 4 × 2 × 2. The lattice parameters of talc are a = 5.33 Å, b = 9.21 Å, c = 9.46 Å, α = 90.05°, β = 91.16°, and γ = 90.00°, which have a small error with the experimental values a = 5.29 Å, b = 9.17 Å, c = 9.46 Å, α = 90.46°, β = 98.68°, and γ = 90.09°, and the calculated parameters are reliable. The calculated band gap energy of talc is 5.40 eV, but the PBE function tends to underestimate the band gap energy.
The point defect surface was constructed by replacing Mg atoms in the talc surface with Fe, Mn, Ni, Al, and Ca atoms [21]. The primitive cell structure of talc is shown in Figure 1.

2.2. Energy Calculation Method

The calculation method of the point defect formation energy is shown in Formula (1):
Δ E = E d e f e c t t o t a l + E M g E p e r f e c t t o t a l E x
where E d e f e c t t o t a l represents the total surface energy of talc with point defects, E p e r f e c t t o t a l represents the total surface energy of talc (001), E M g represents the energy of a single Mg atom, and E x represents the energy of a single impurity atom. The smaller the value of Δ E , the easier it is for the defect to form [22].

3. Results and Discussion

3.1. Formation Energy of Point Defects

Table 1 lists the formation energy of the different point defects on the talc surface. The calculation results show that the defect formation energy of the Mg atom replaced by the Fe atom is the smallest, which is −162.72 KJ/mol, far less than the defect formation energy of the other types of lattice. This shows that the reaction of the Fe atom replacing the Mg atom in talc crystal can be spontaneous, and it is easier to form defects with other impurities. The defect formation energy of Fe and Ca impurities is negative, indicating that the substitution reaction of these two atoms with Mg atoms can be spontaneous.
The formation energy of Mn, Ni, and Al impurity defects and Mg vacancy defects is positive, indicating that these four types of point defects cannot spontaneously occur at room temperature (simulation calculation was carried out at 0 °K). However, high temperature and high-pressure conditions often accompany the ore formation process. Therefore, according to the calculation results, only Mg vacancy defects are difficult to form under natural conditions.

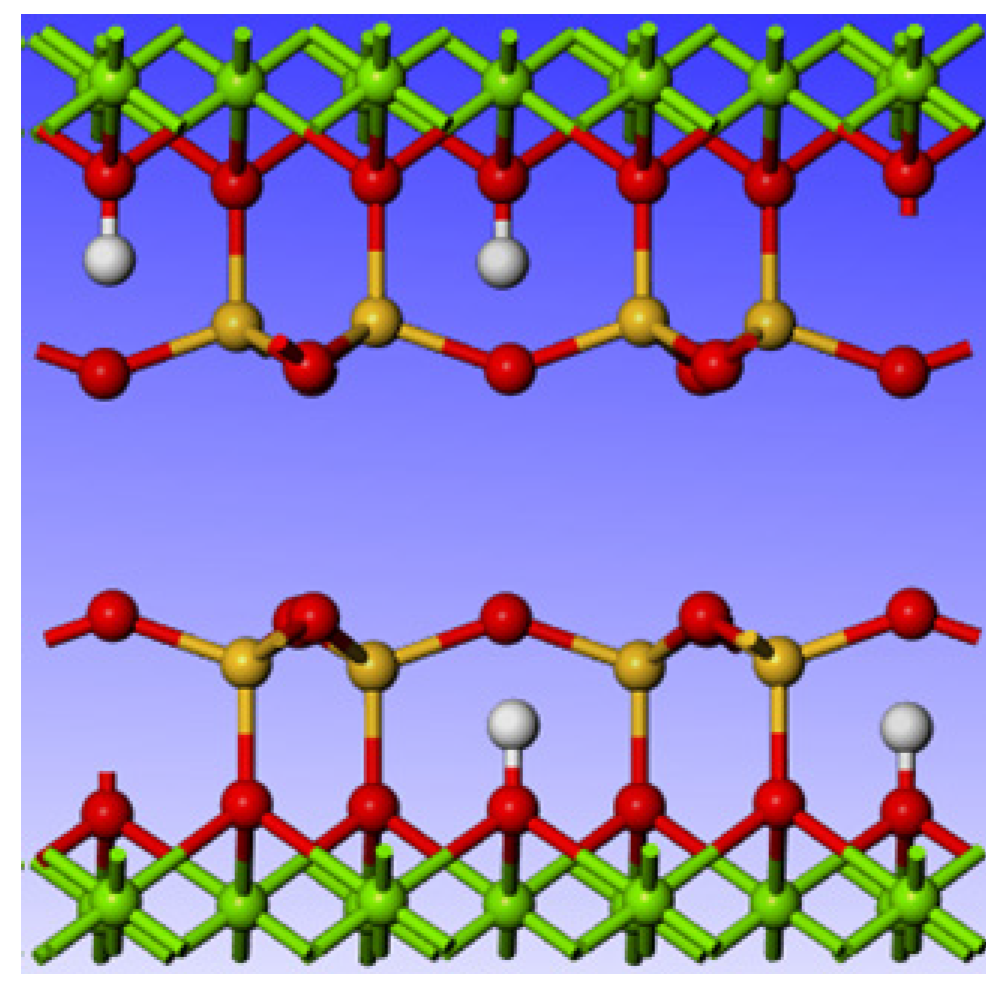
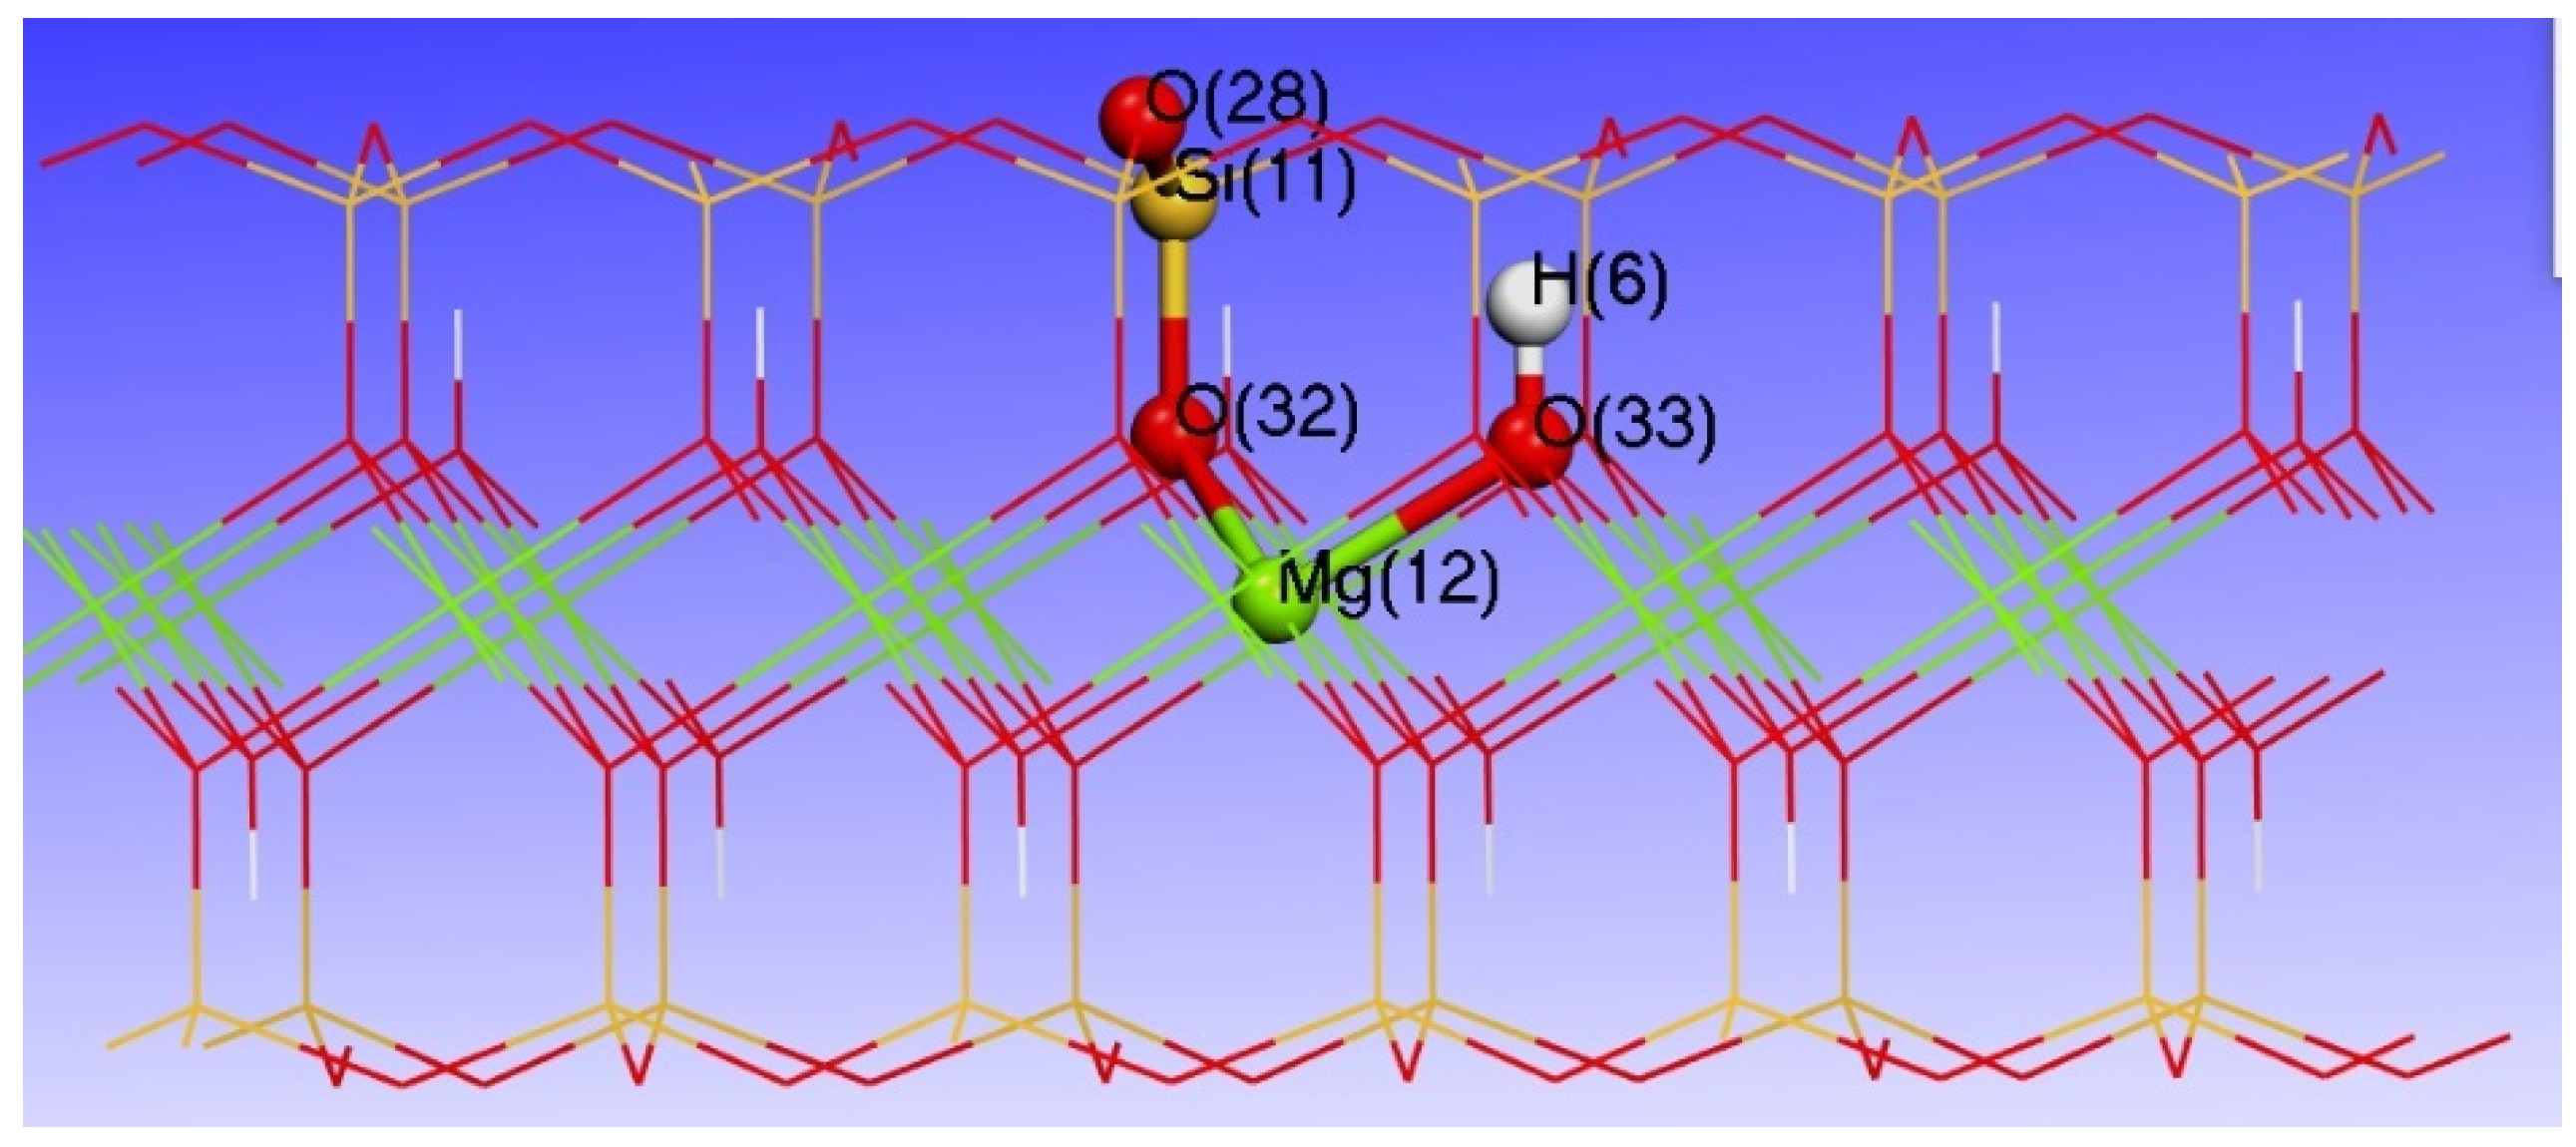
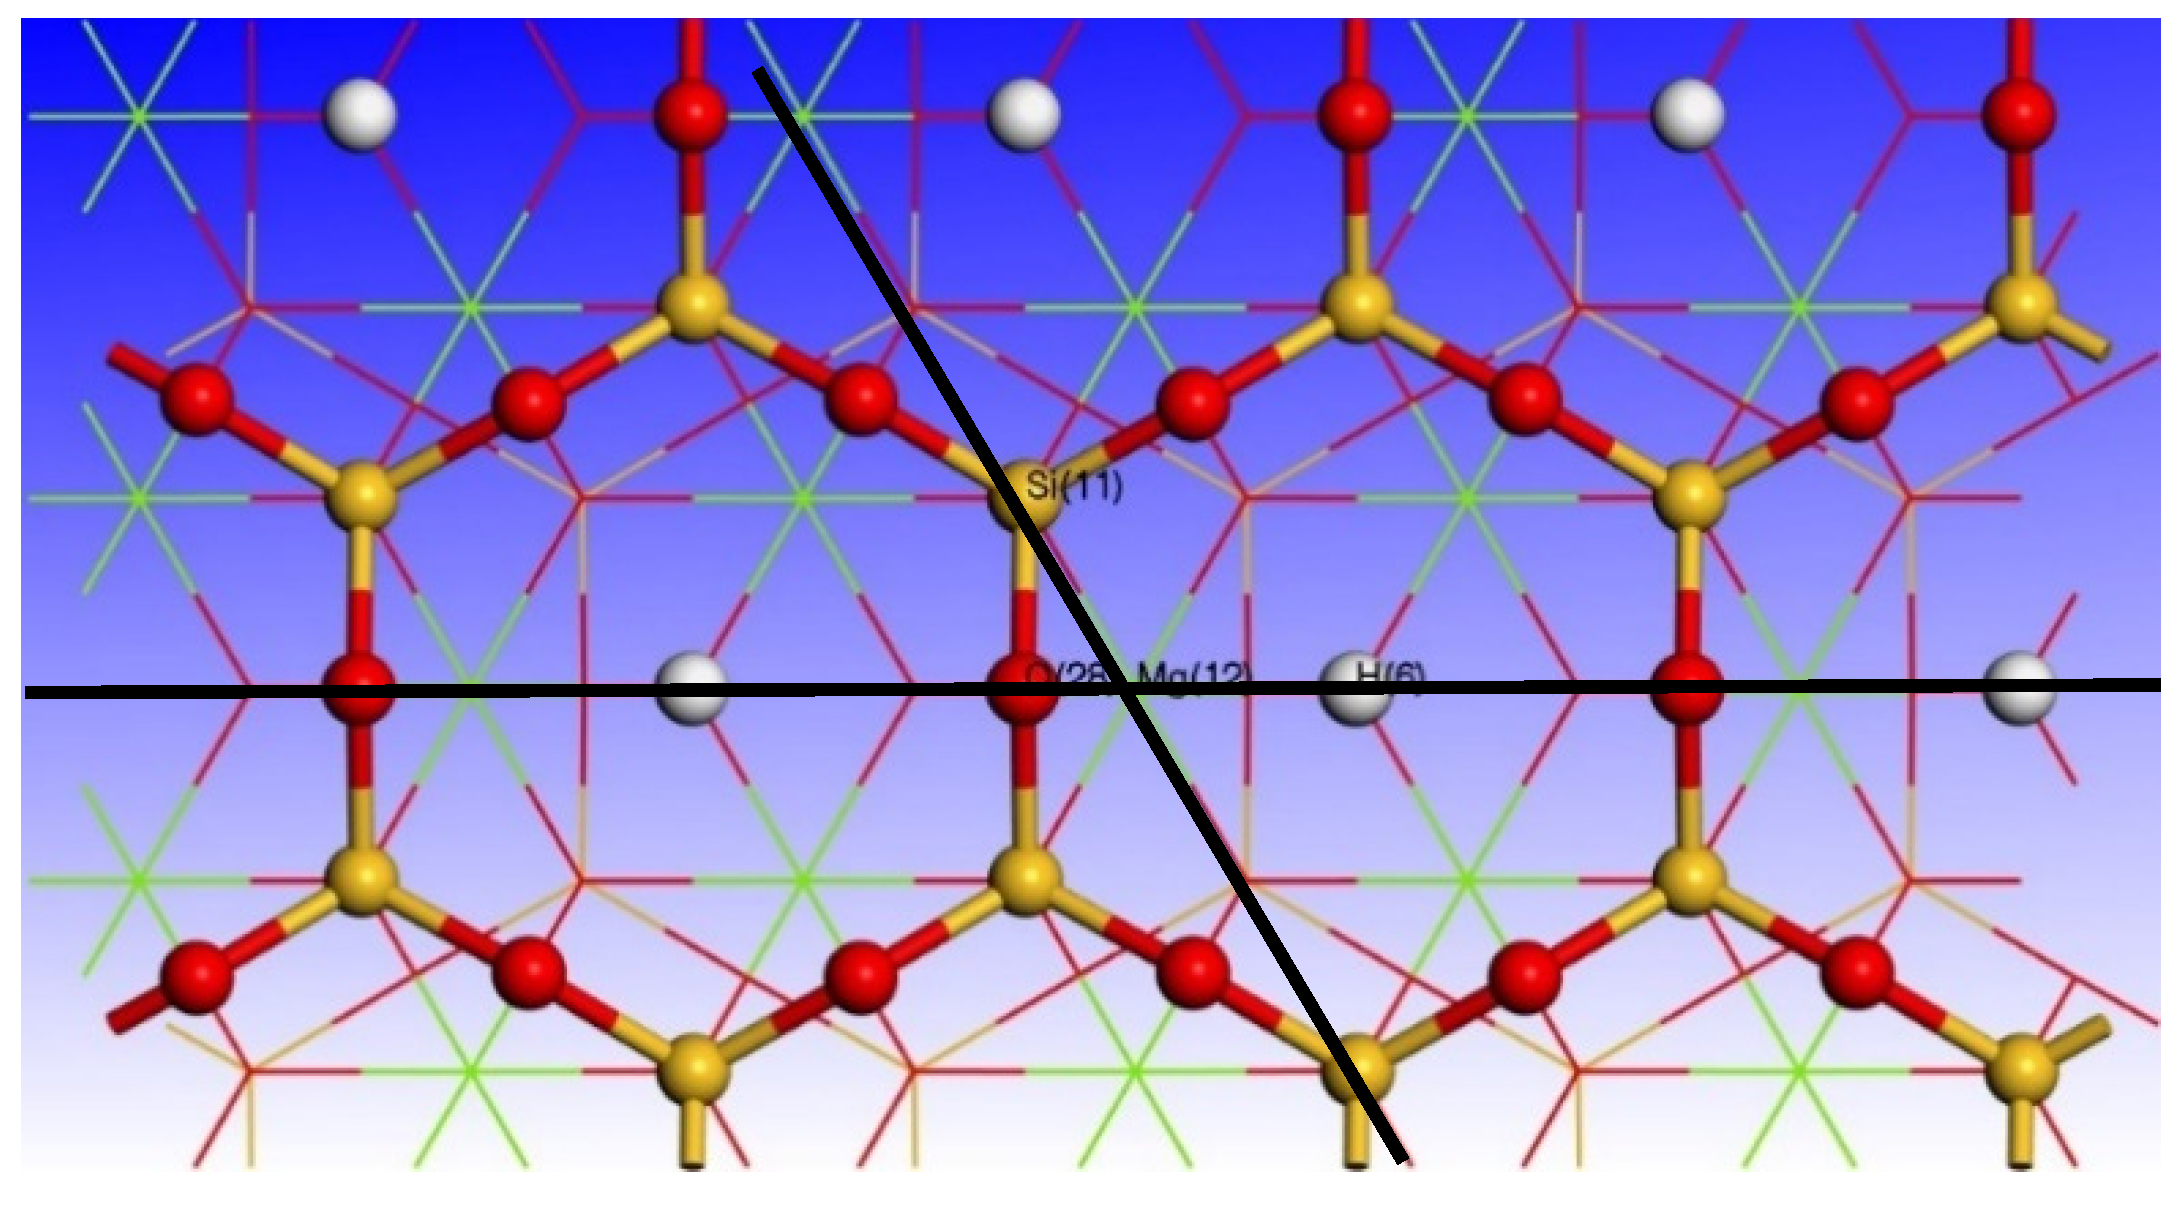
3.2. Effect of Point Defects on the Surface Structure of Talc (001)

The parameters of the ideal talc surface and the point defect surface are presented in Table 2. The table includes data such as talc layer thickness and bond length inside the point defect surface. Point defects were found to change the thickness of the talc layer through the calculated data. Compared with other impurities, the thickness of the unit layer containing the Ni impurity had the smallest change, and the difference between it and the ideal surface unit layer thickness was 0.01 Å. The Ca impurity defect had the greatest influence on the talc unit layer thickness, and the difference between it and the ideal surface layer thickness was 0.13 Å. Point defects cause changes in bond lengths on the surface of talc (001). From the data, compared with the ideal talc surface, the bond length of Si-Ob formed between Si atoms on the talc surface containing impurities and O atoms on the first layer of the surface changed less than 0.01 Å. In contrast, the Si-Oa bond length formed between Si atoms and the reactive oxygen species on the third layer of the surface varied greatly. The bond length of Si-Oa bond on the surface of the Al impurity defect had a significant difference of 0.03 Å from ideal talc.
The impurity atoms bond with both O(O-H) and Oa, and the bond lengths of O(O-H), are smaller than those of Oa. Each unit layer of talc contains two relative reactive oxygen species, and the distance between them changes due to the inclusion of impurities. Fe, Mn, and Al impurities shorten the distance between the two layers of reactive oxygen species, and Ni and Ca impurities and Mg vacancy defects increase the distance. This is consistent with the increasing and decreasing rule of the X-Oa bond length, and indicates that the point defect changes the distance between the upper and lower layers of the Mg atomic layer by changing the bonding length between impurity atoms and reactive oxygen species.
In order to facilitate the following analysis data to be presented more clearly, the ideal state of the talc (001) surface (2 × 2 × 1) supercell model is presented in Figure 2 and Figure 3.

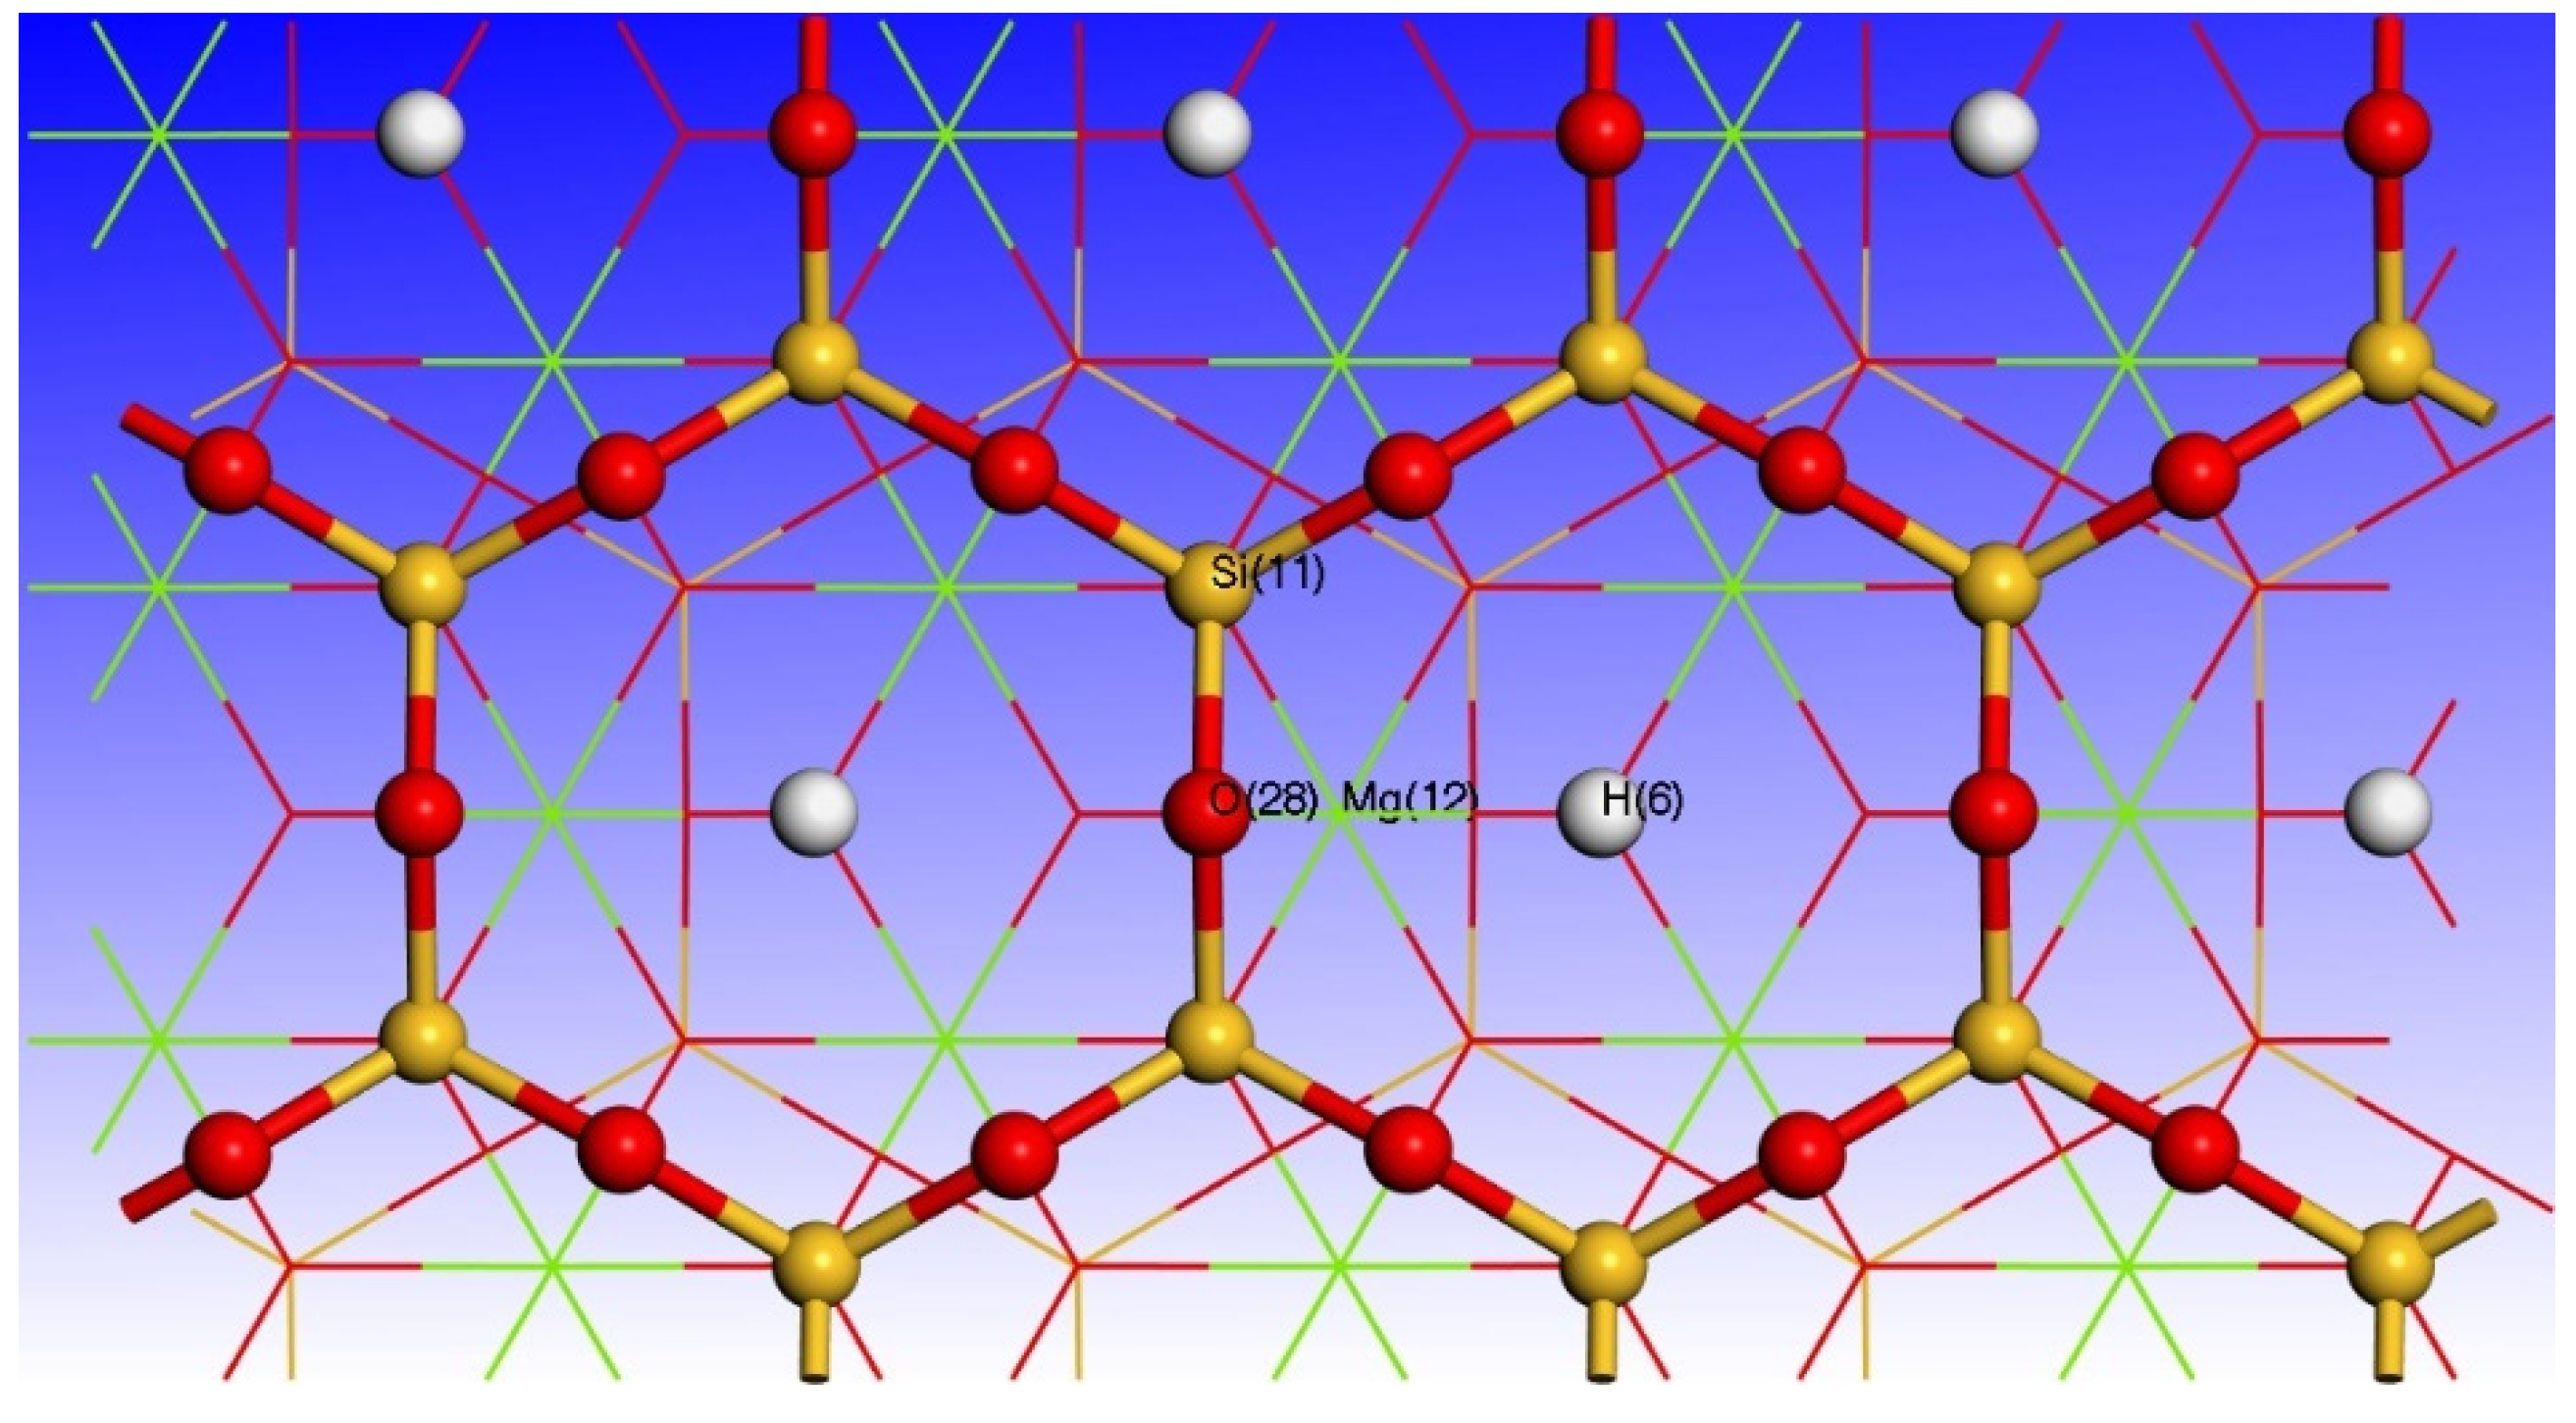
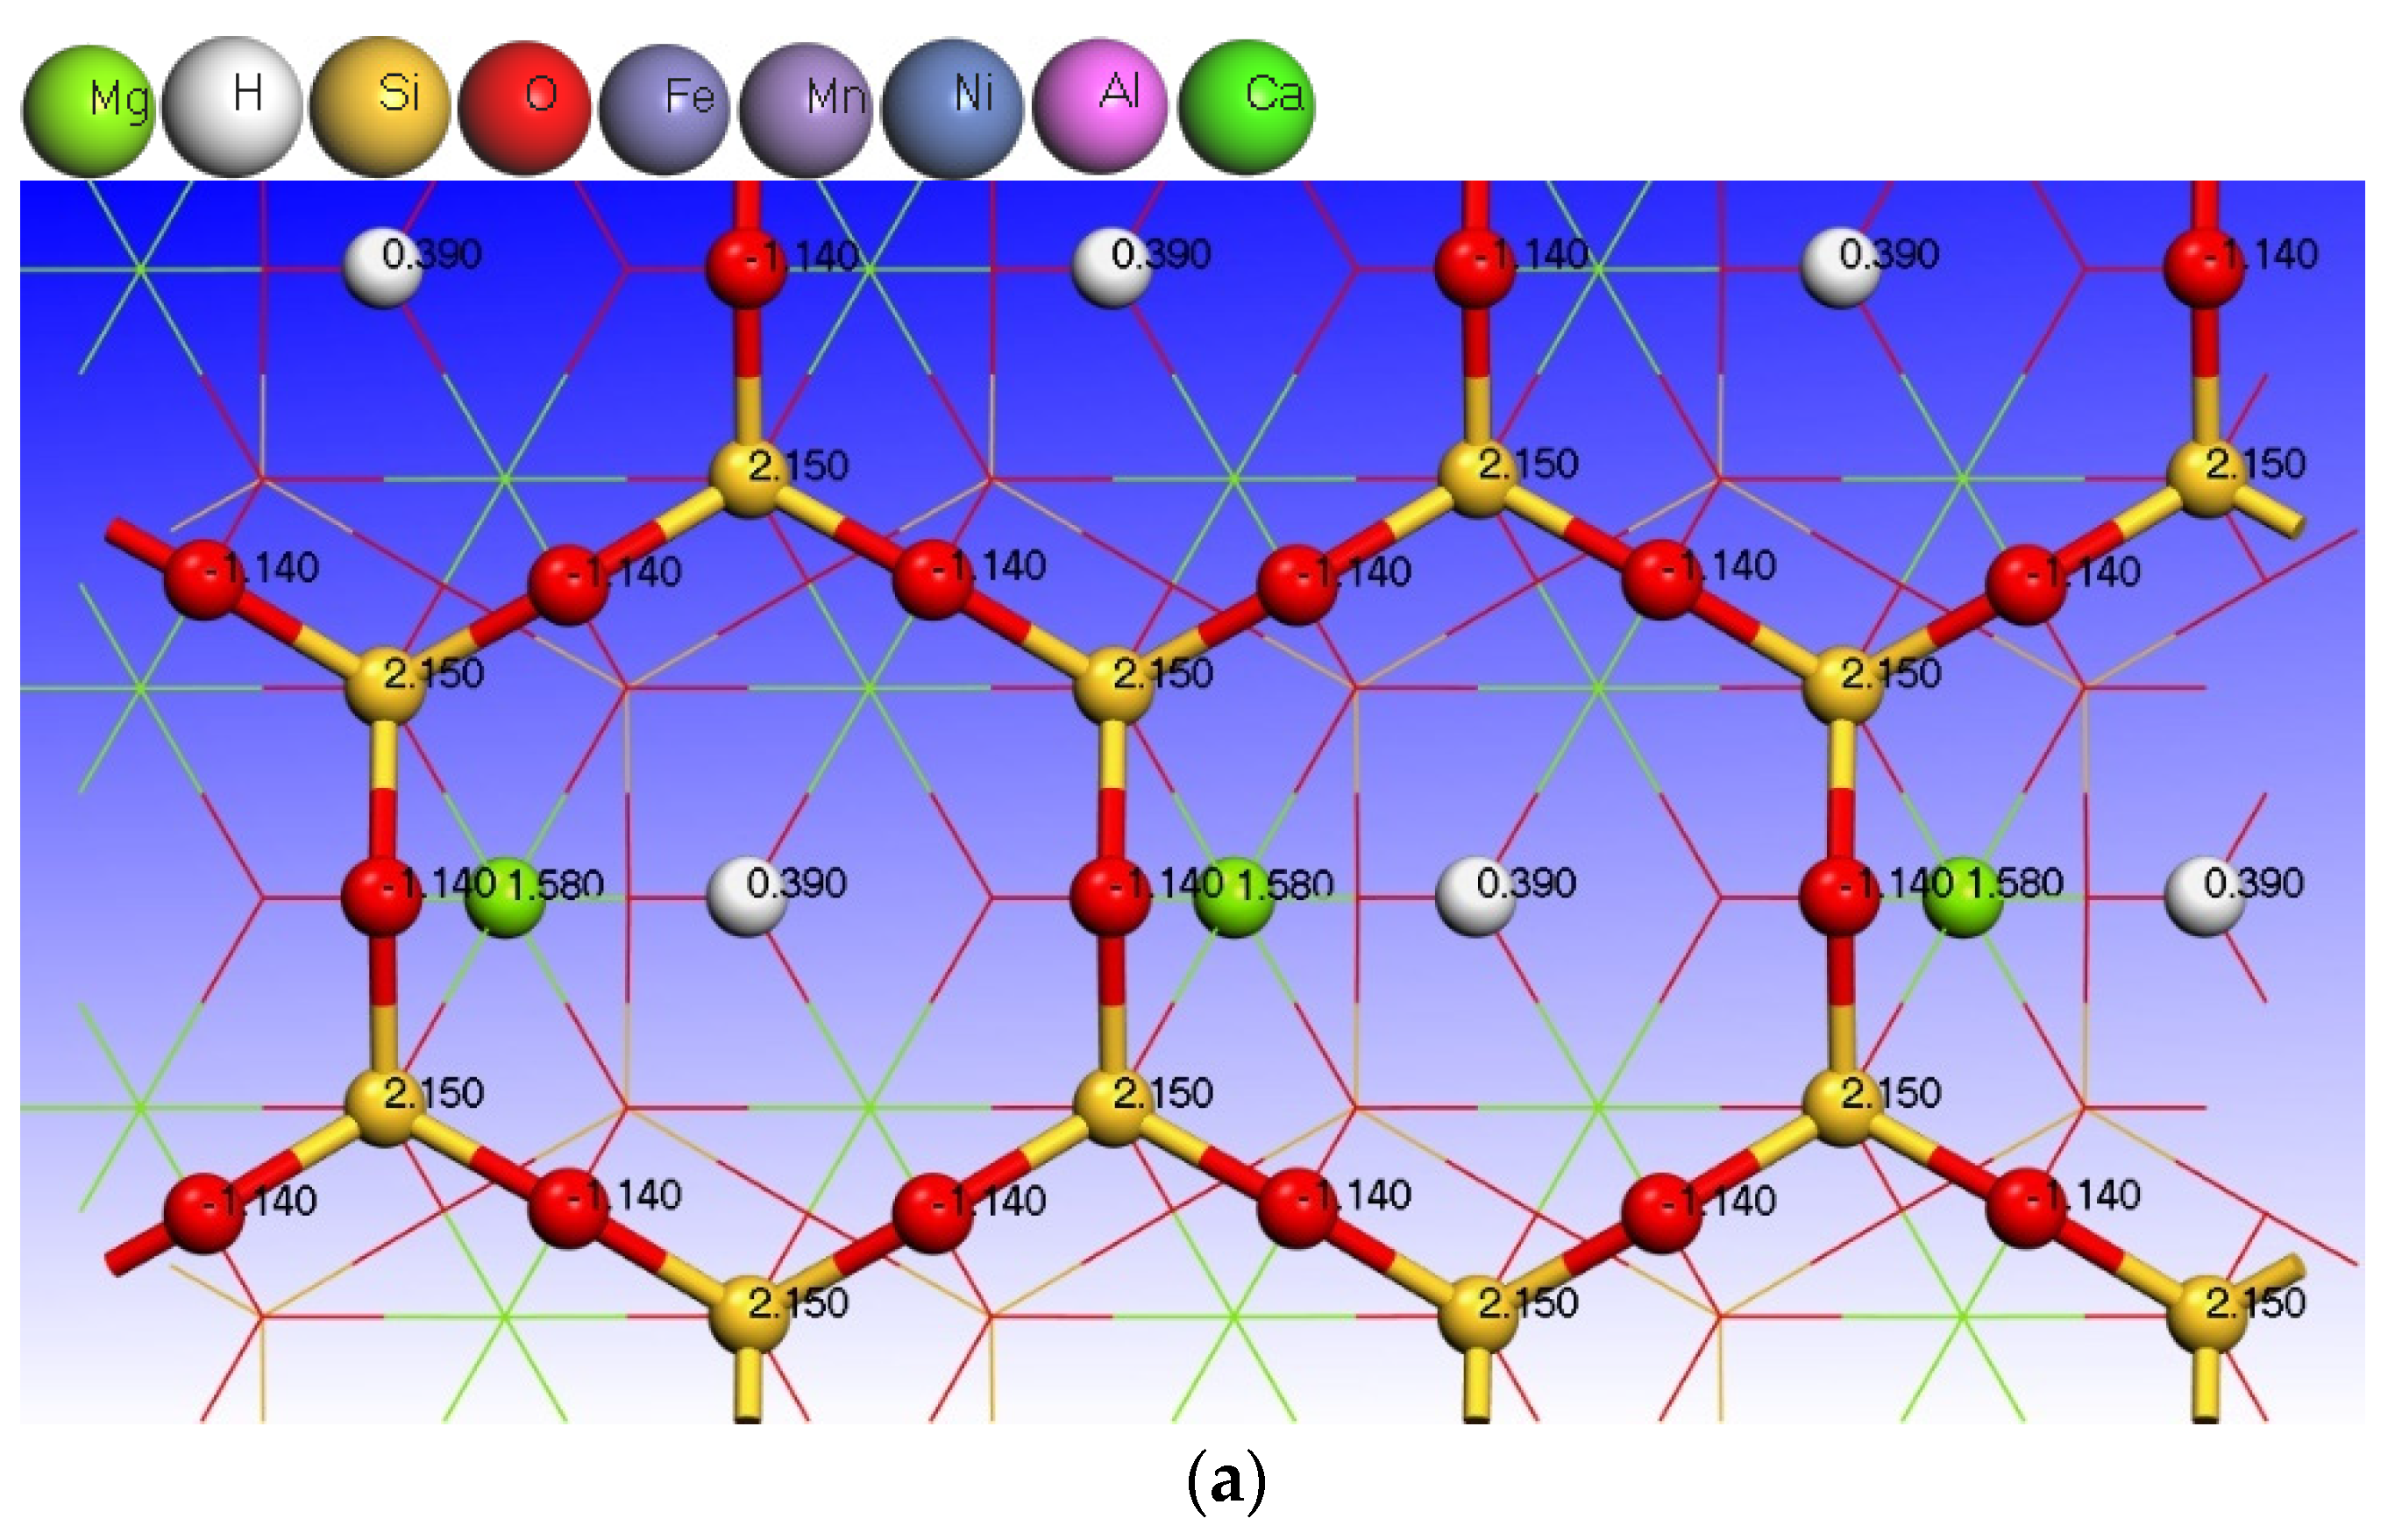
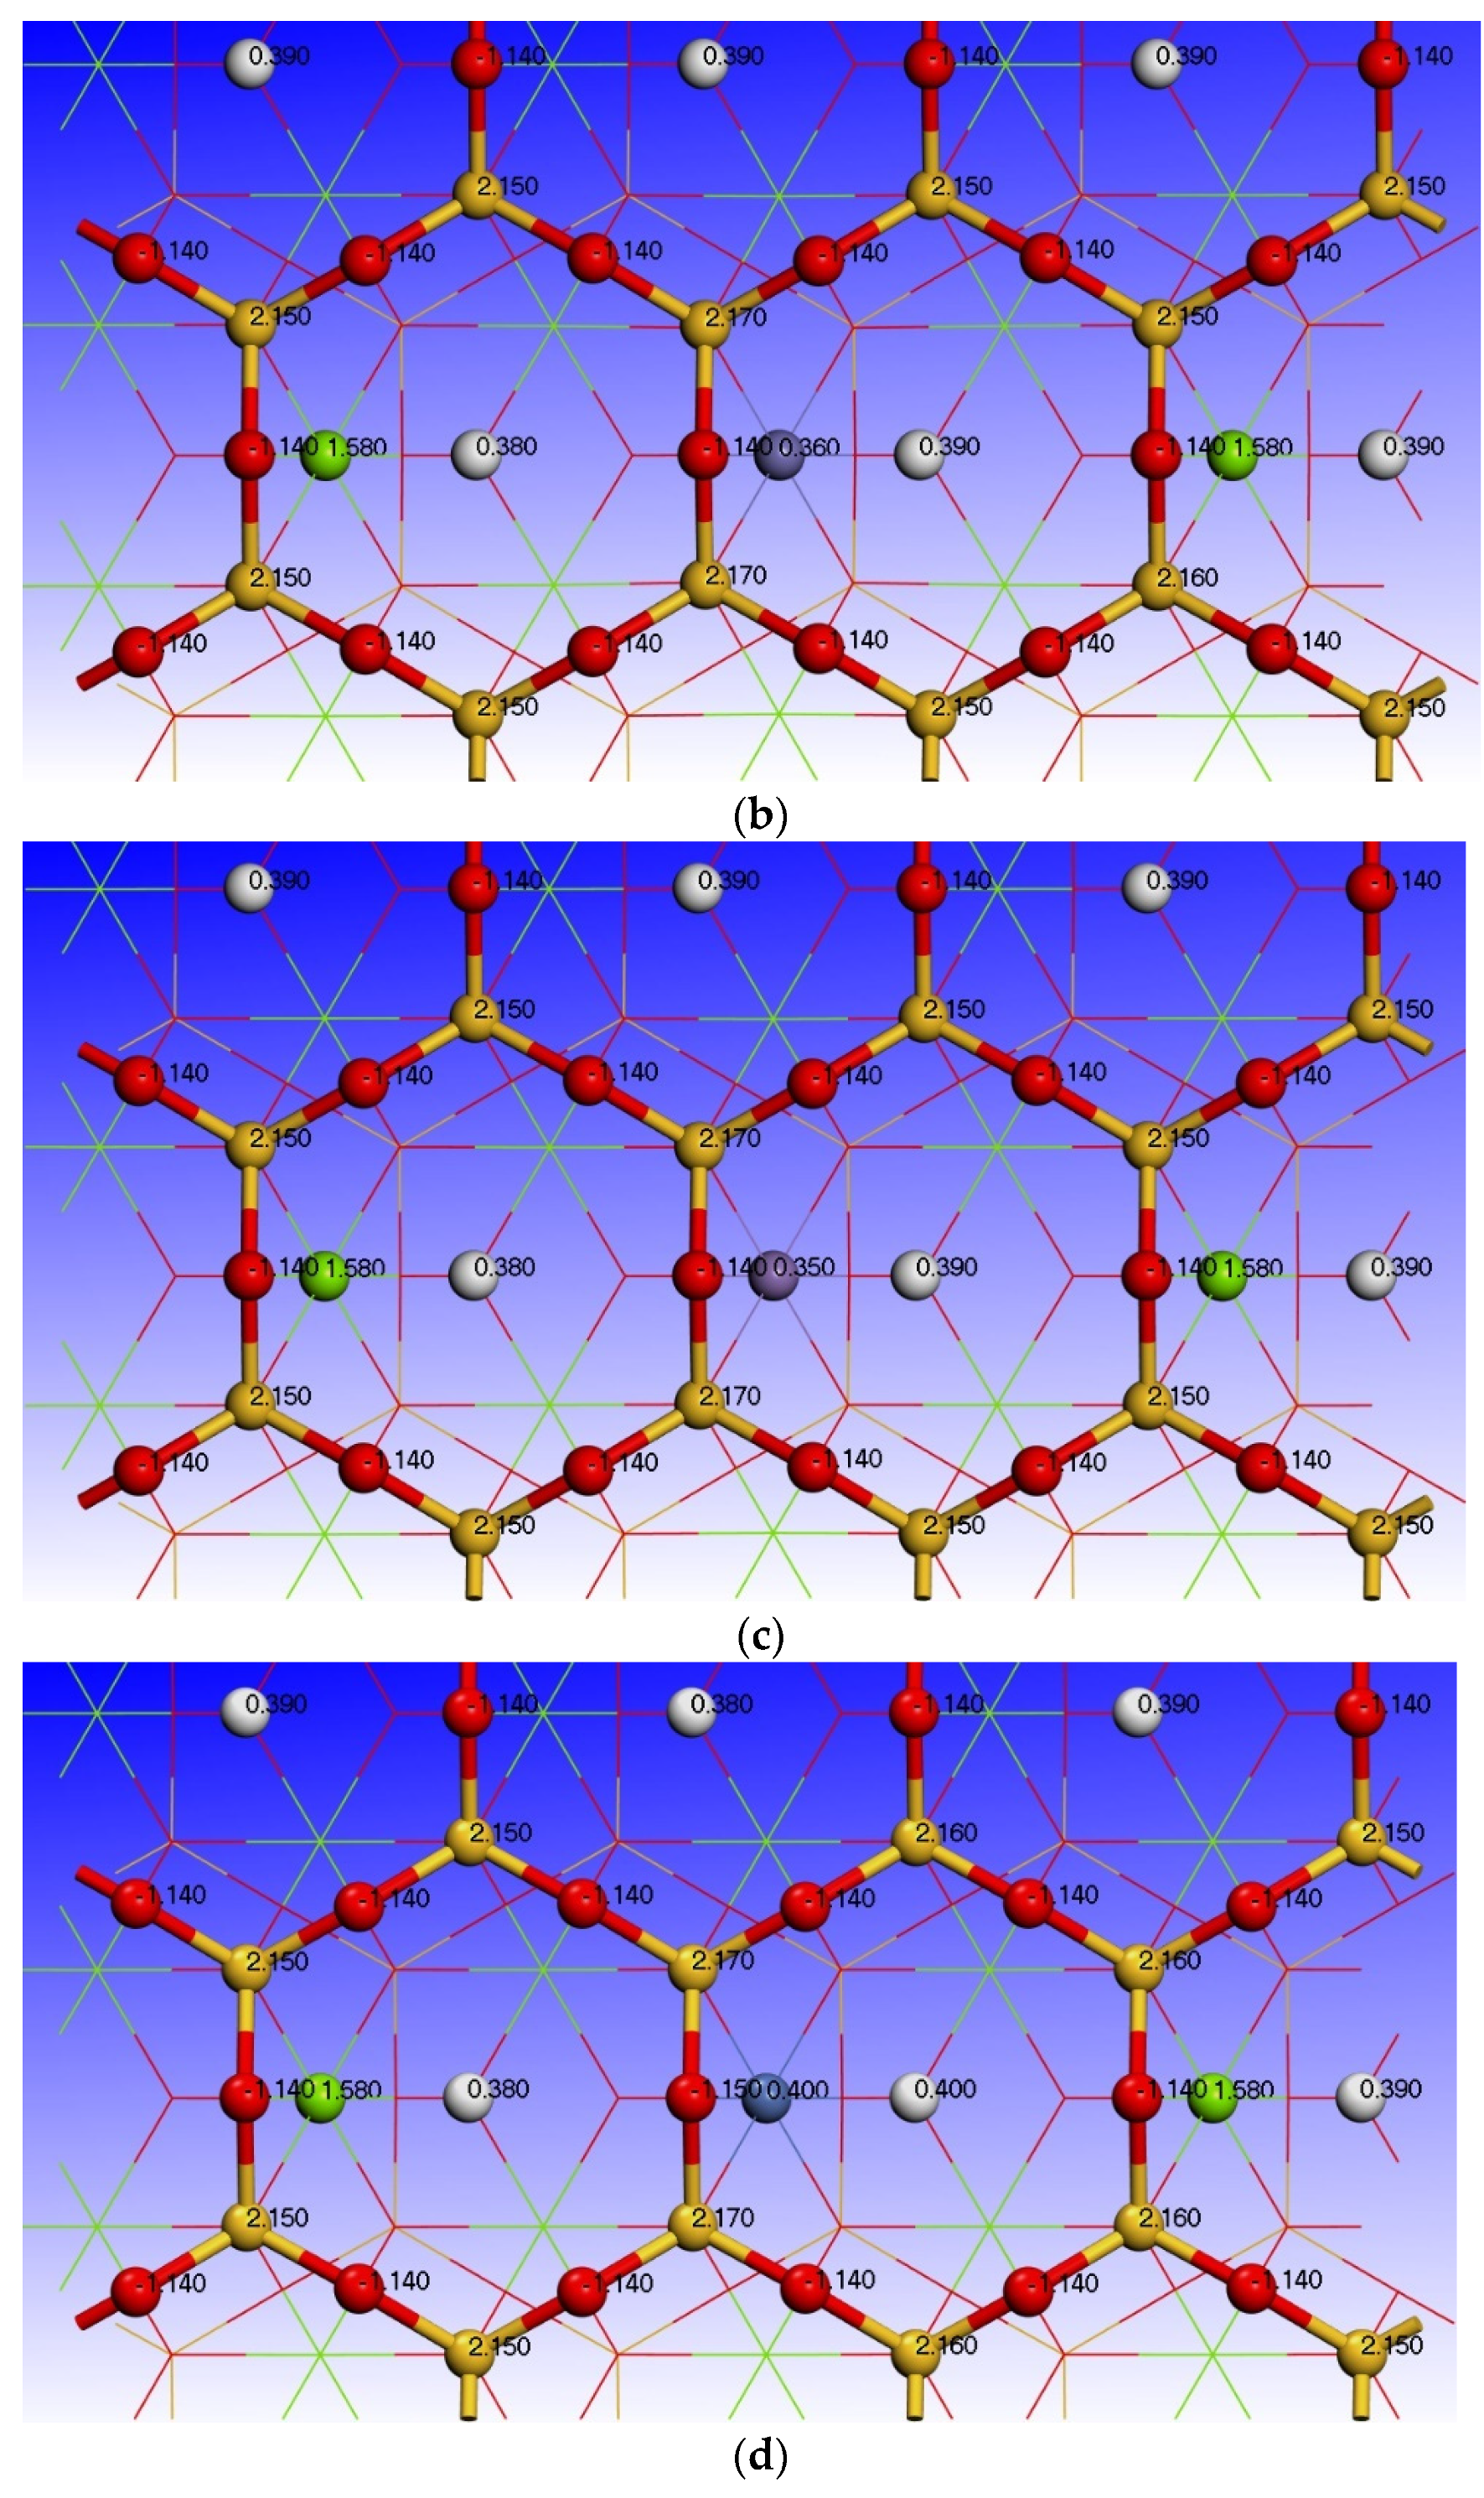
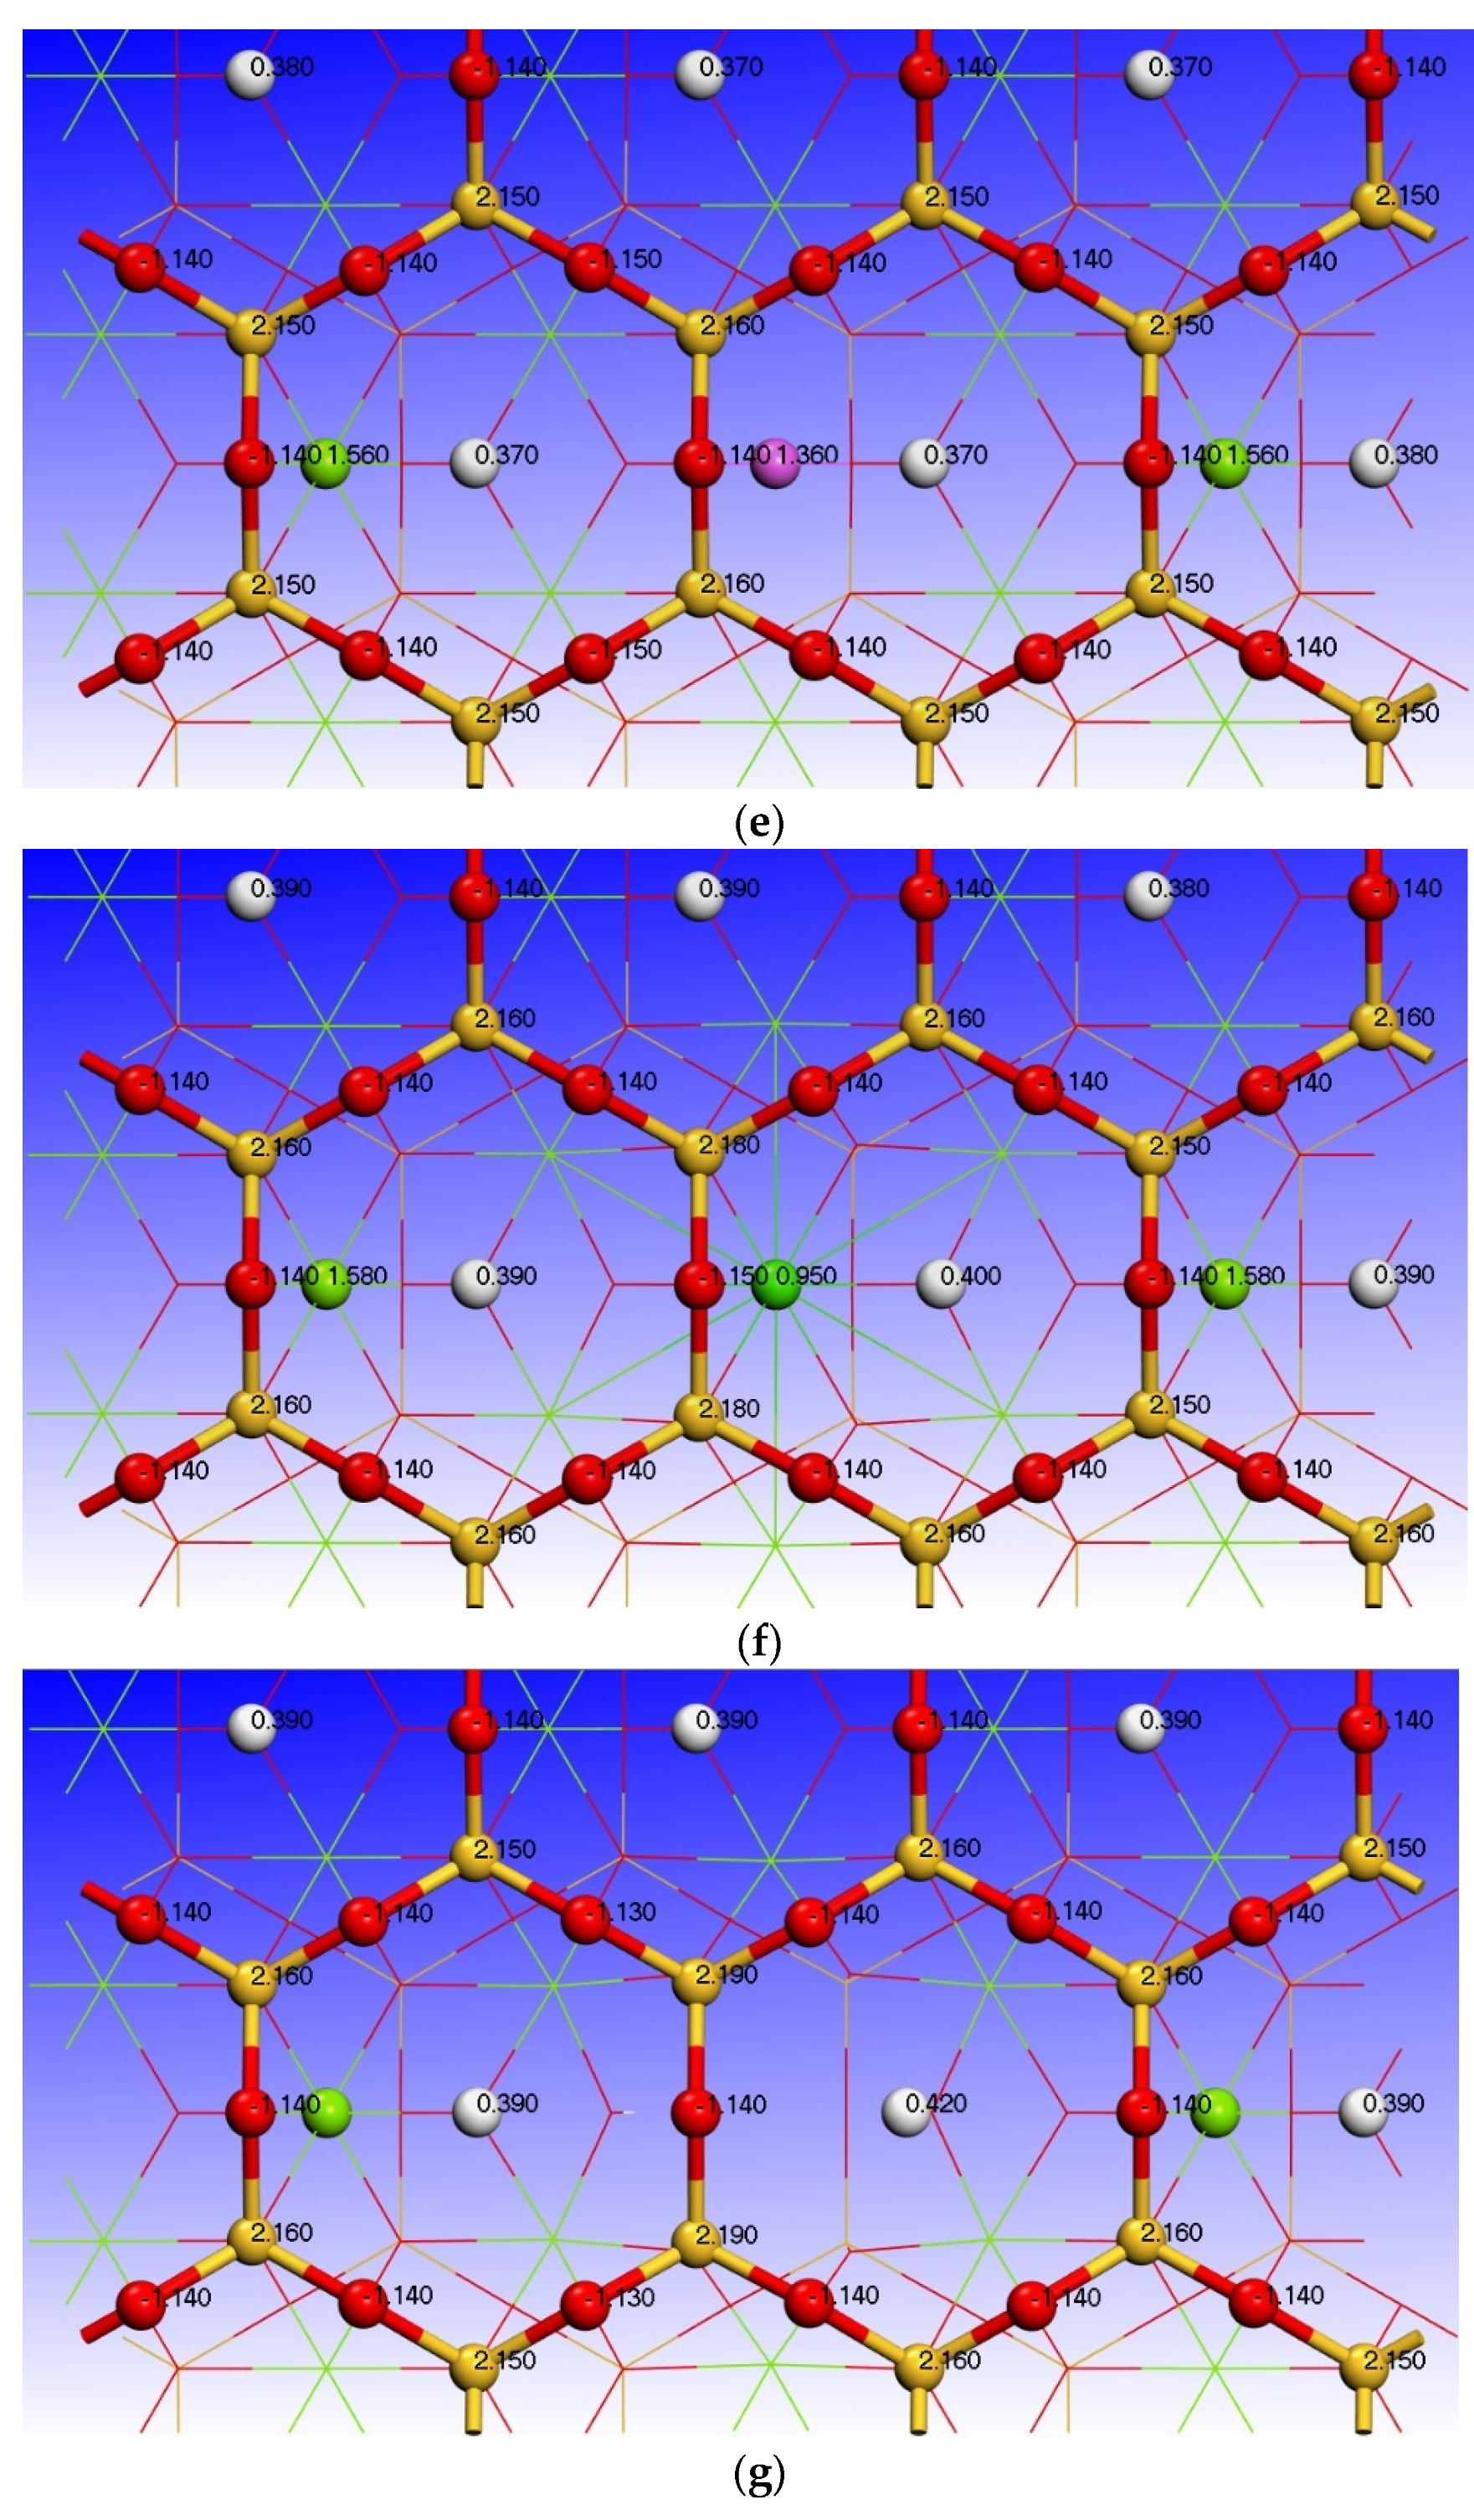
3.3. Effect of Point Defects on Surface Charge of Talc

In the flotation process, adsorption between reagent molecules and minerals mainly occurs in three layers of the mineral surface. Therefore, the surface atoms of talc layers 1–3 with point defects were analyzed. The surface atomic charge distribution is shown in Figure 4. The first layer of the talc (001) surface is composed of O atoms, and the charge of each O atom is −1.14 e. The total charge of the first layer of the 2 × 2 surface is −20.52 e. The second layer is composed of Si atoms, each Si atom has a charge of +2.15 e, and the total charge of the second layer is 12.90 e. The third layer consists of H atoms, each of which has a charge of +0.39 e, and the total charge of the third layer is 2.34 e. Al, Ni, and Mn impurities and Mg vacancy defects do not affect the charge of O atoms on the surface of talc. Ca and Ni impurities change the charge of O atoms in the first layer of the surface directly above the defect site to −1.15 e. This shows that the defects of the two impurities will increase the negative charge of the O atoms directly above them, which is beneficial for the adsorption of cationic inhibitors. All defects cause the charge of Si atoms to be greater than the +2.15 e of the ideal surface. Mg vacancy changes the charge of the adjacent Si atoms above to +2.19 e, which is larger than that of other point defects. This may be due to the lack of Mg atoms to contribute electrons, resulting in an increase in Si atoms to contribute electrons, so Si atoms lose more electrons.
Table 3 shows the Mulliken charge population of impurity atoms and their adjacent atoms. It can be seen from the table that the s orbital of the Mg (12) atom on the ideal talc surface loses electrons. Si (11) loses electrons in both the s and p orbitals. Mg (12) and Si (11) atoms contribute electrons to O (32) atoms, resulting in more electrons for O (32) atoms than for O (33) and O (28) atoms. According to the Mulliken population on the surface of Mg (12) atom vacancy defects, the number of electrons obtained by O (33) and O (32) atoms directly bonded to Mg (12) atoms decreases due to the absence of Mg (12) atoms. The number of electrons lost by Si (11) and H (6) atoms increases slightly. In the five impurity defects, the electron loss of the impurity atoms is lower than that of Mg (12) atoms on the ideal talc surface, and the electron loss of Si (11) atoms is slightly increased. The impurity atoms of Fe, Mn, Ni, Al, and Ca mainly lose electrons in the s and p orbitals, and gain a few electrons in the D orbitals. Among all impurity atoms, the electron loss of the Al atoms is 1.36, which is the smallest difference to that of Mg atom (1.58). In general, the electron distribution of the ideal surface atoms of talc changes due to the vacancy and substitution defects of Mg atoms on the talc surface. As the atomic number increases, the charge of the impurity atoms decreases. Mainly because of the strong electronegativity of the impurity atoms, the ability to lose electrons is weak. This also leads to a decrease in the number of electrons gained by O atoms adjacent to defect atoms and a slight increase in the number of electrons lost by Si atoms on the second layer of the surface. However, it has little effect on O atoms in the first layer of the surface.

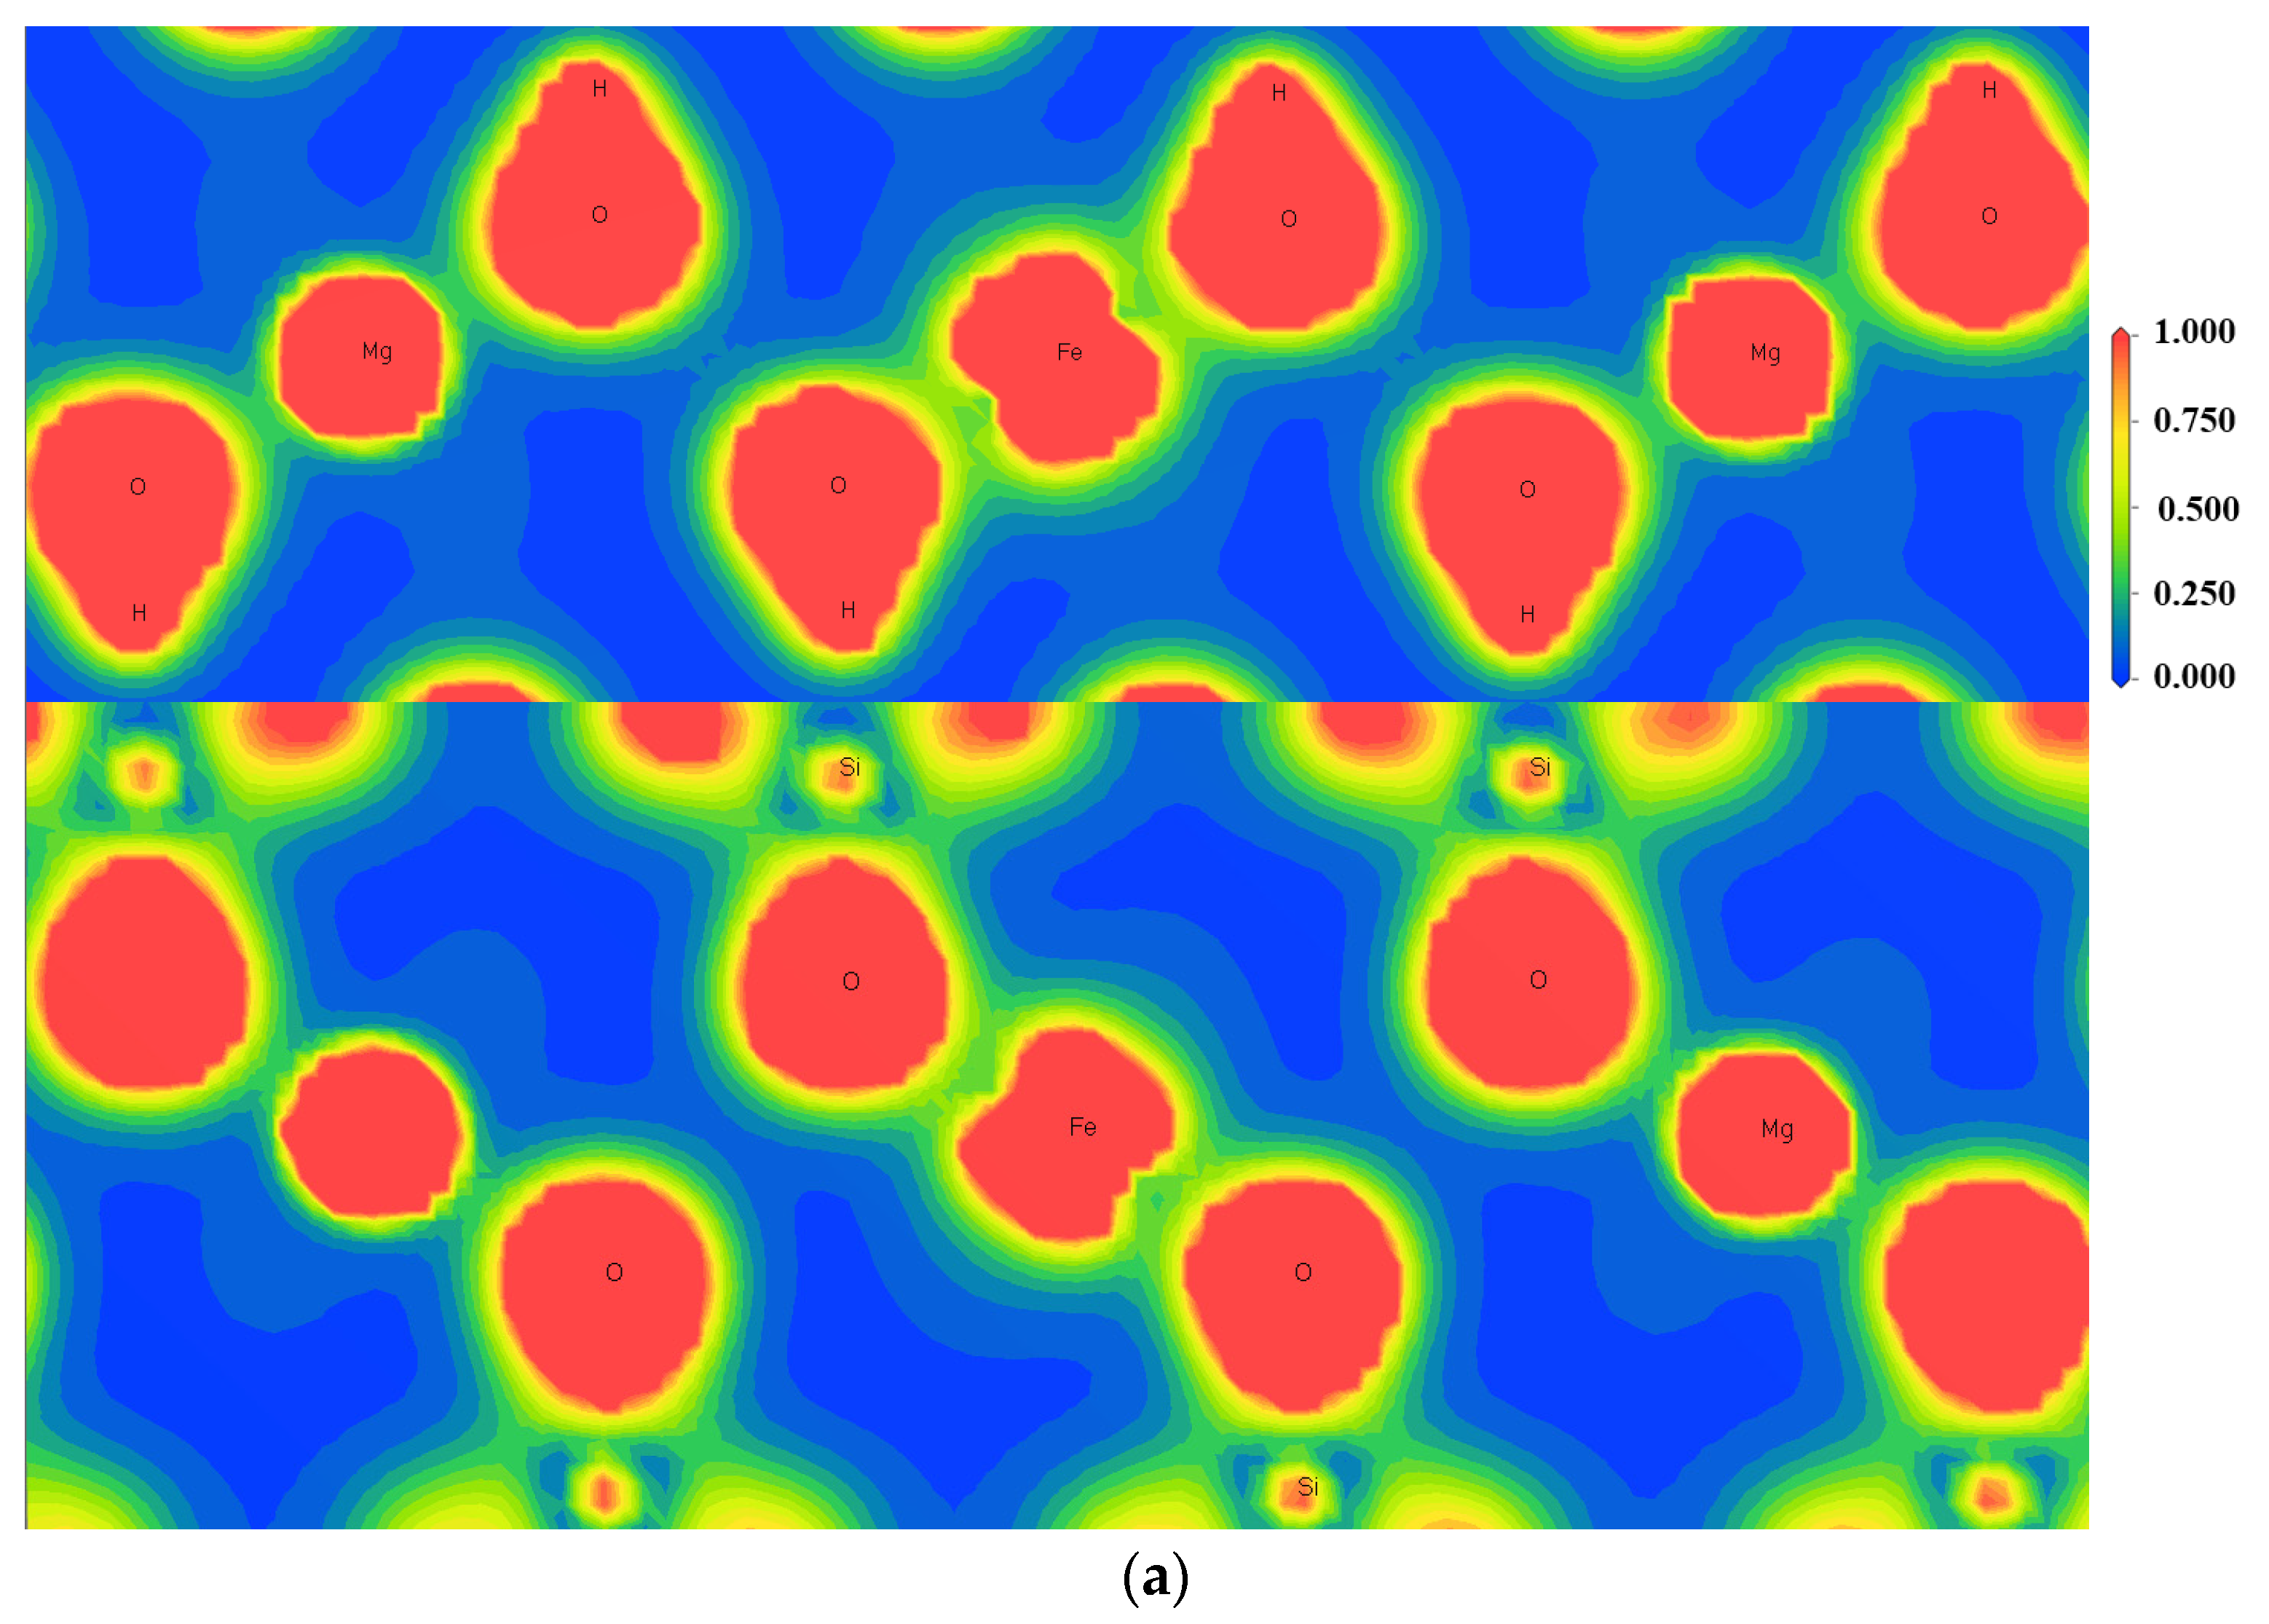
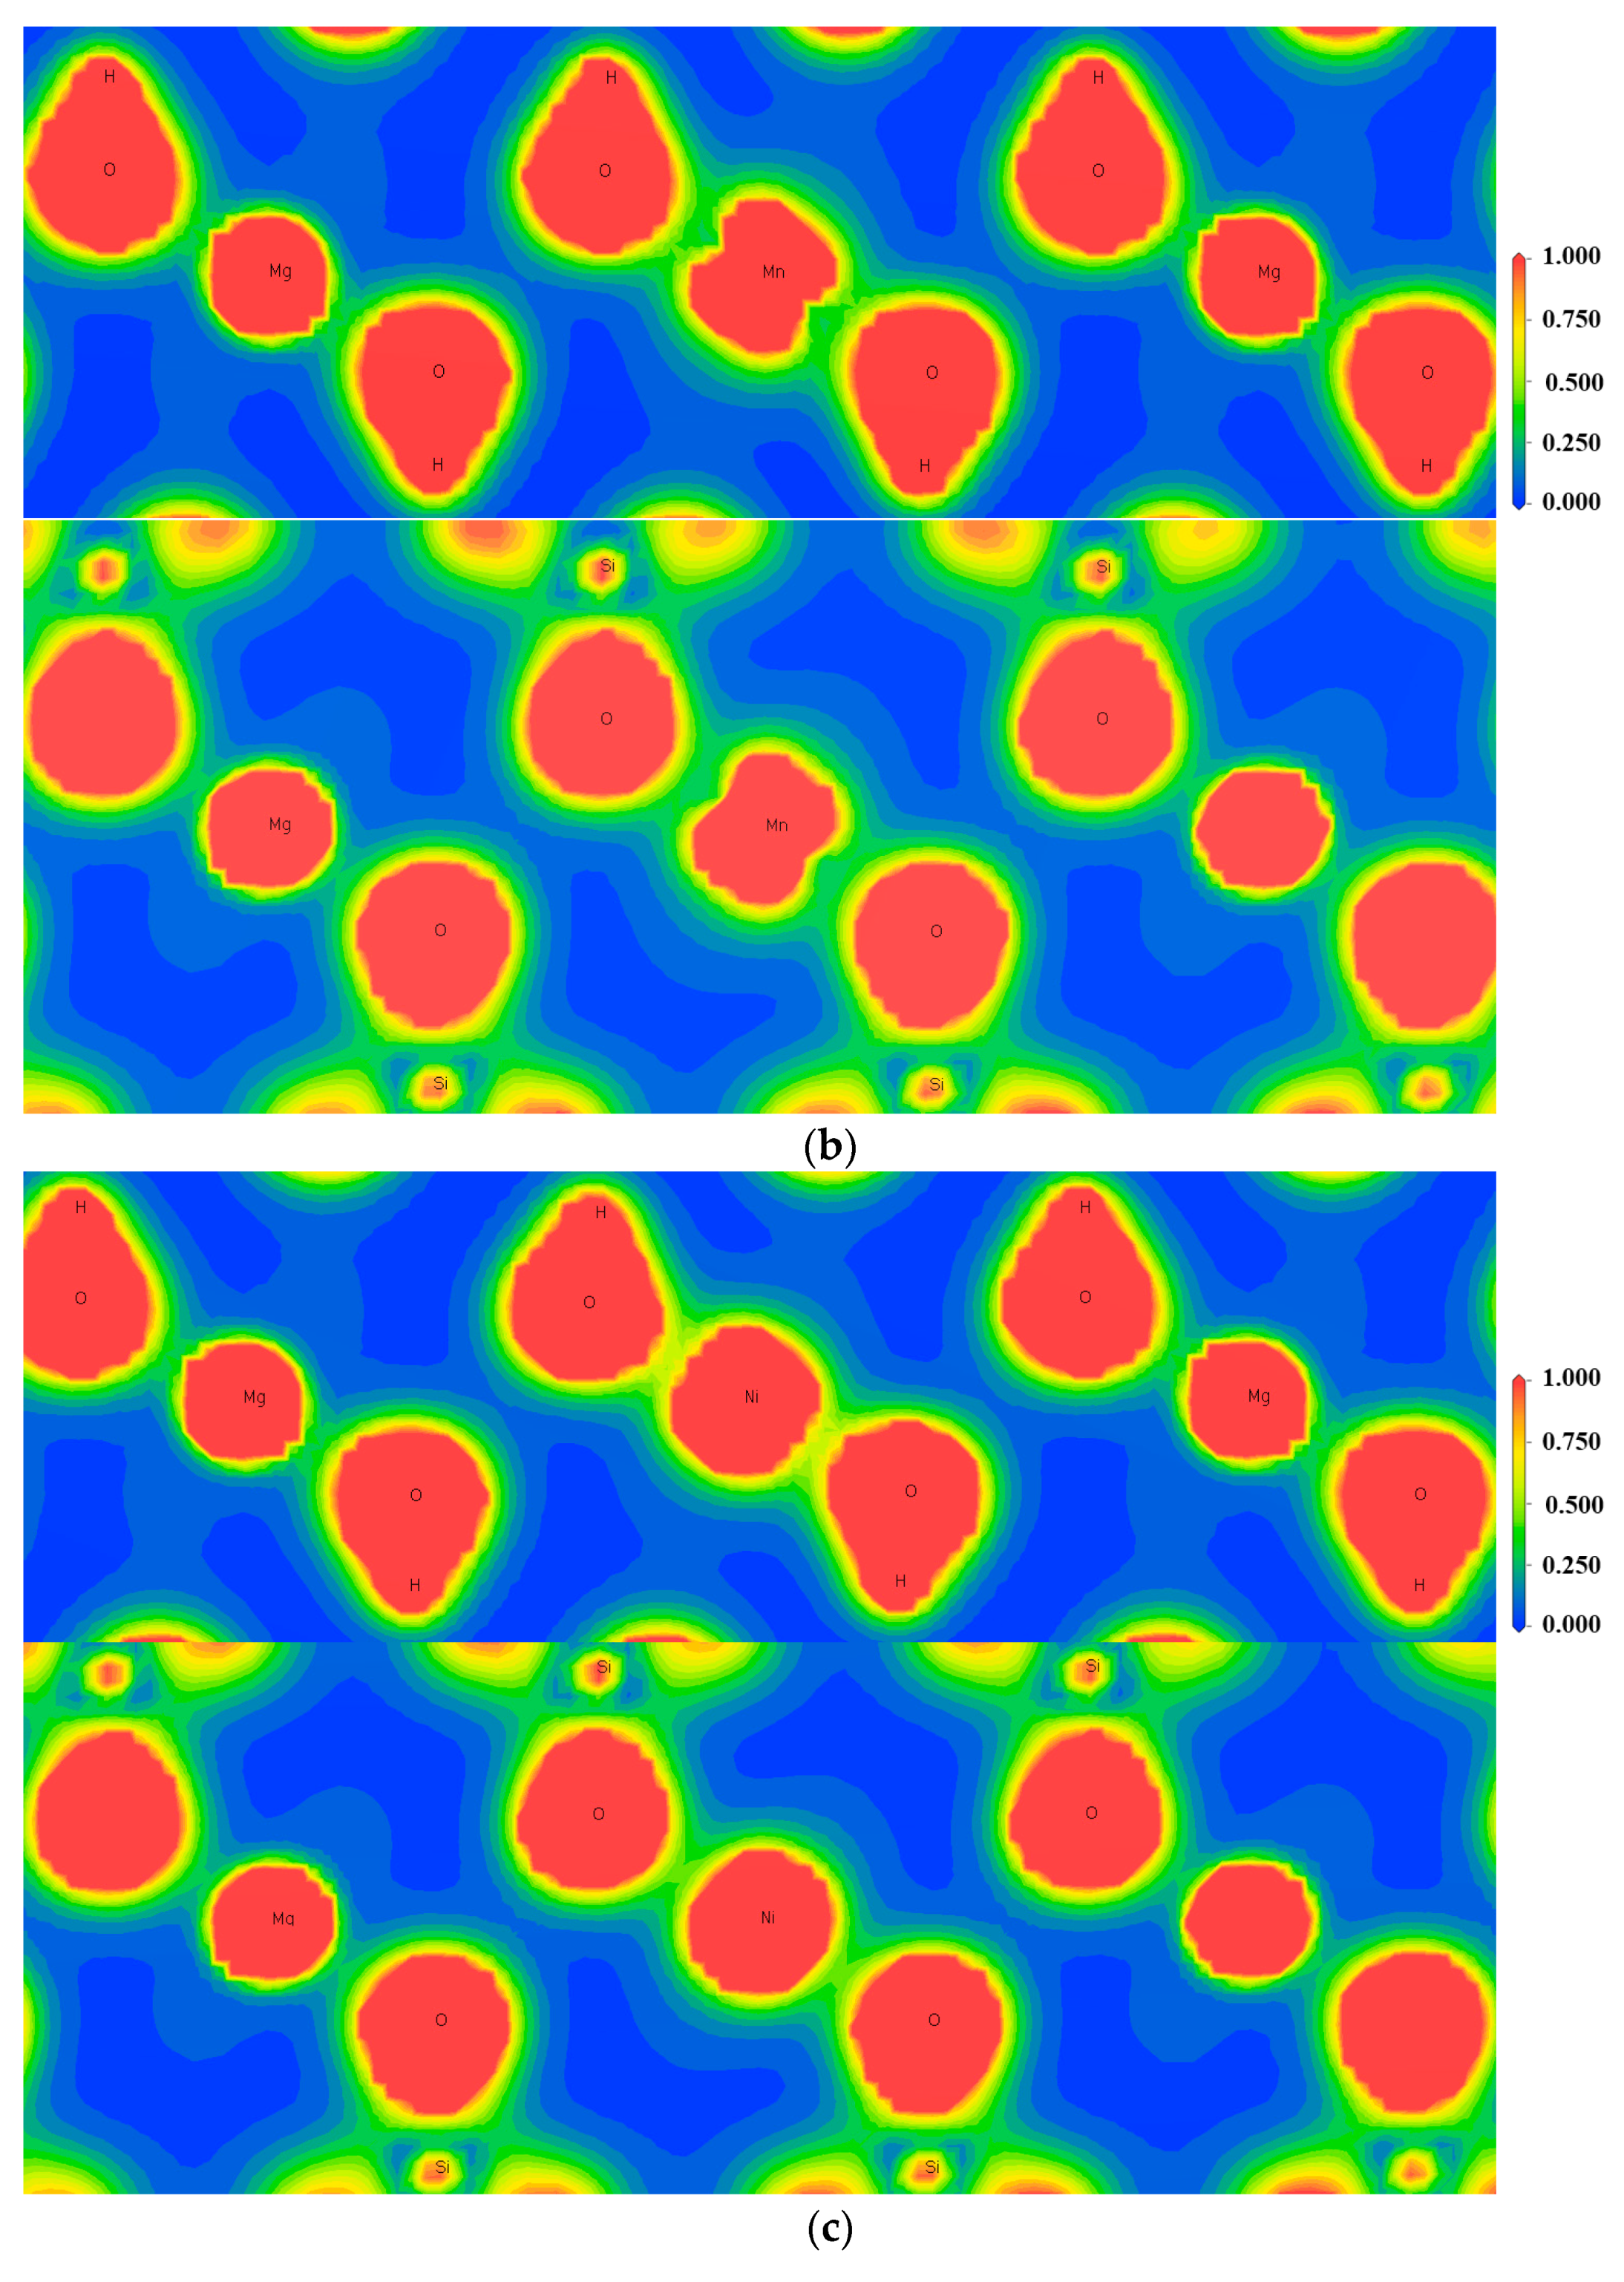
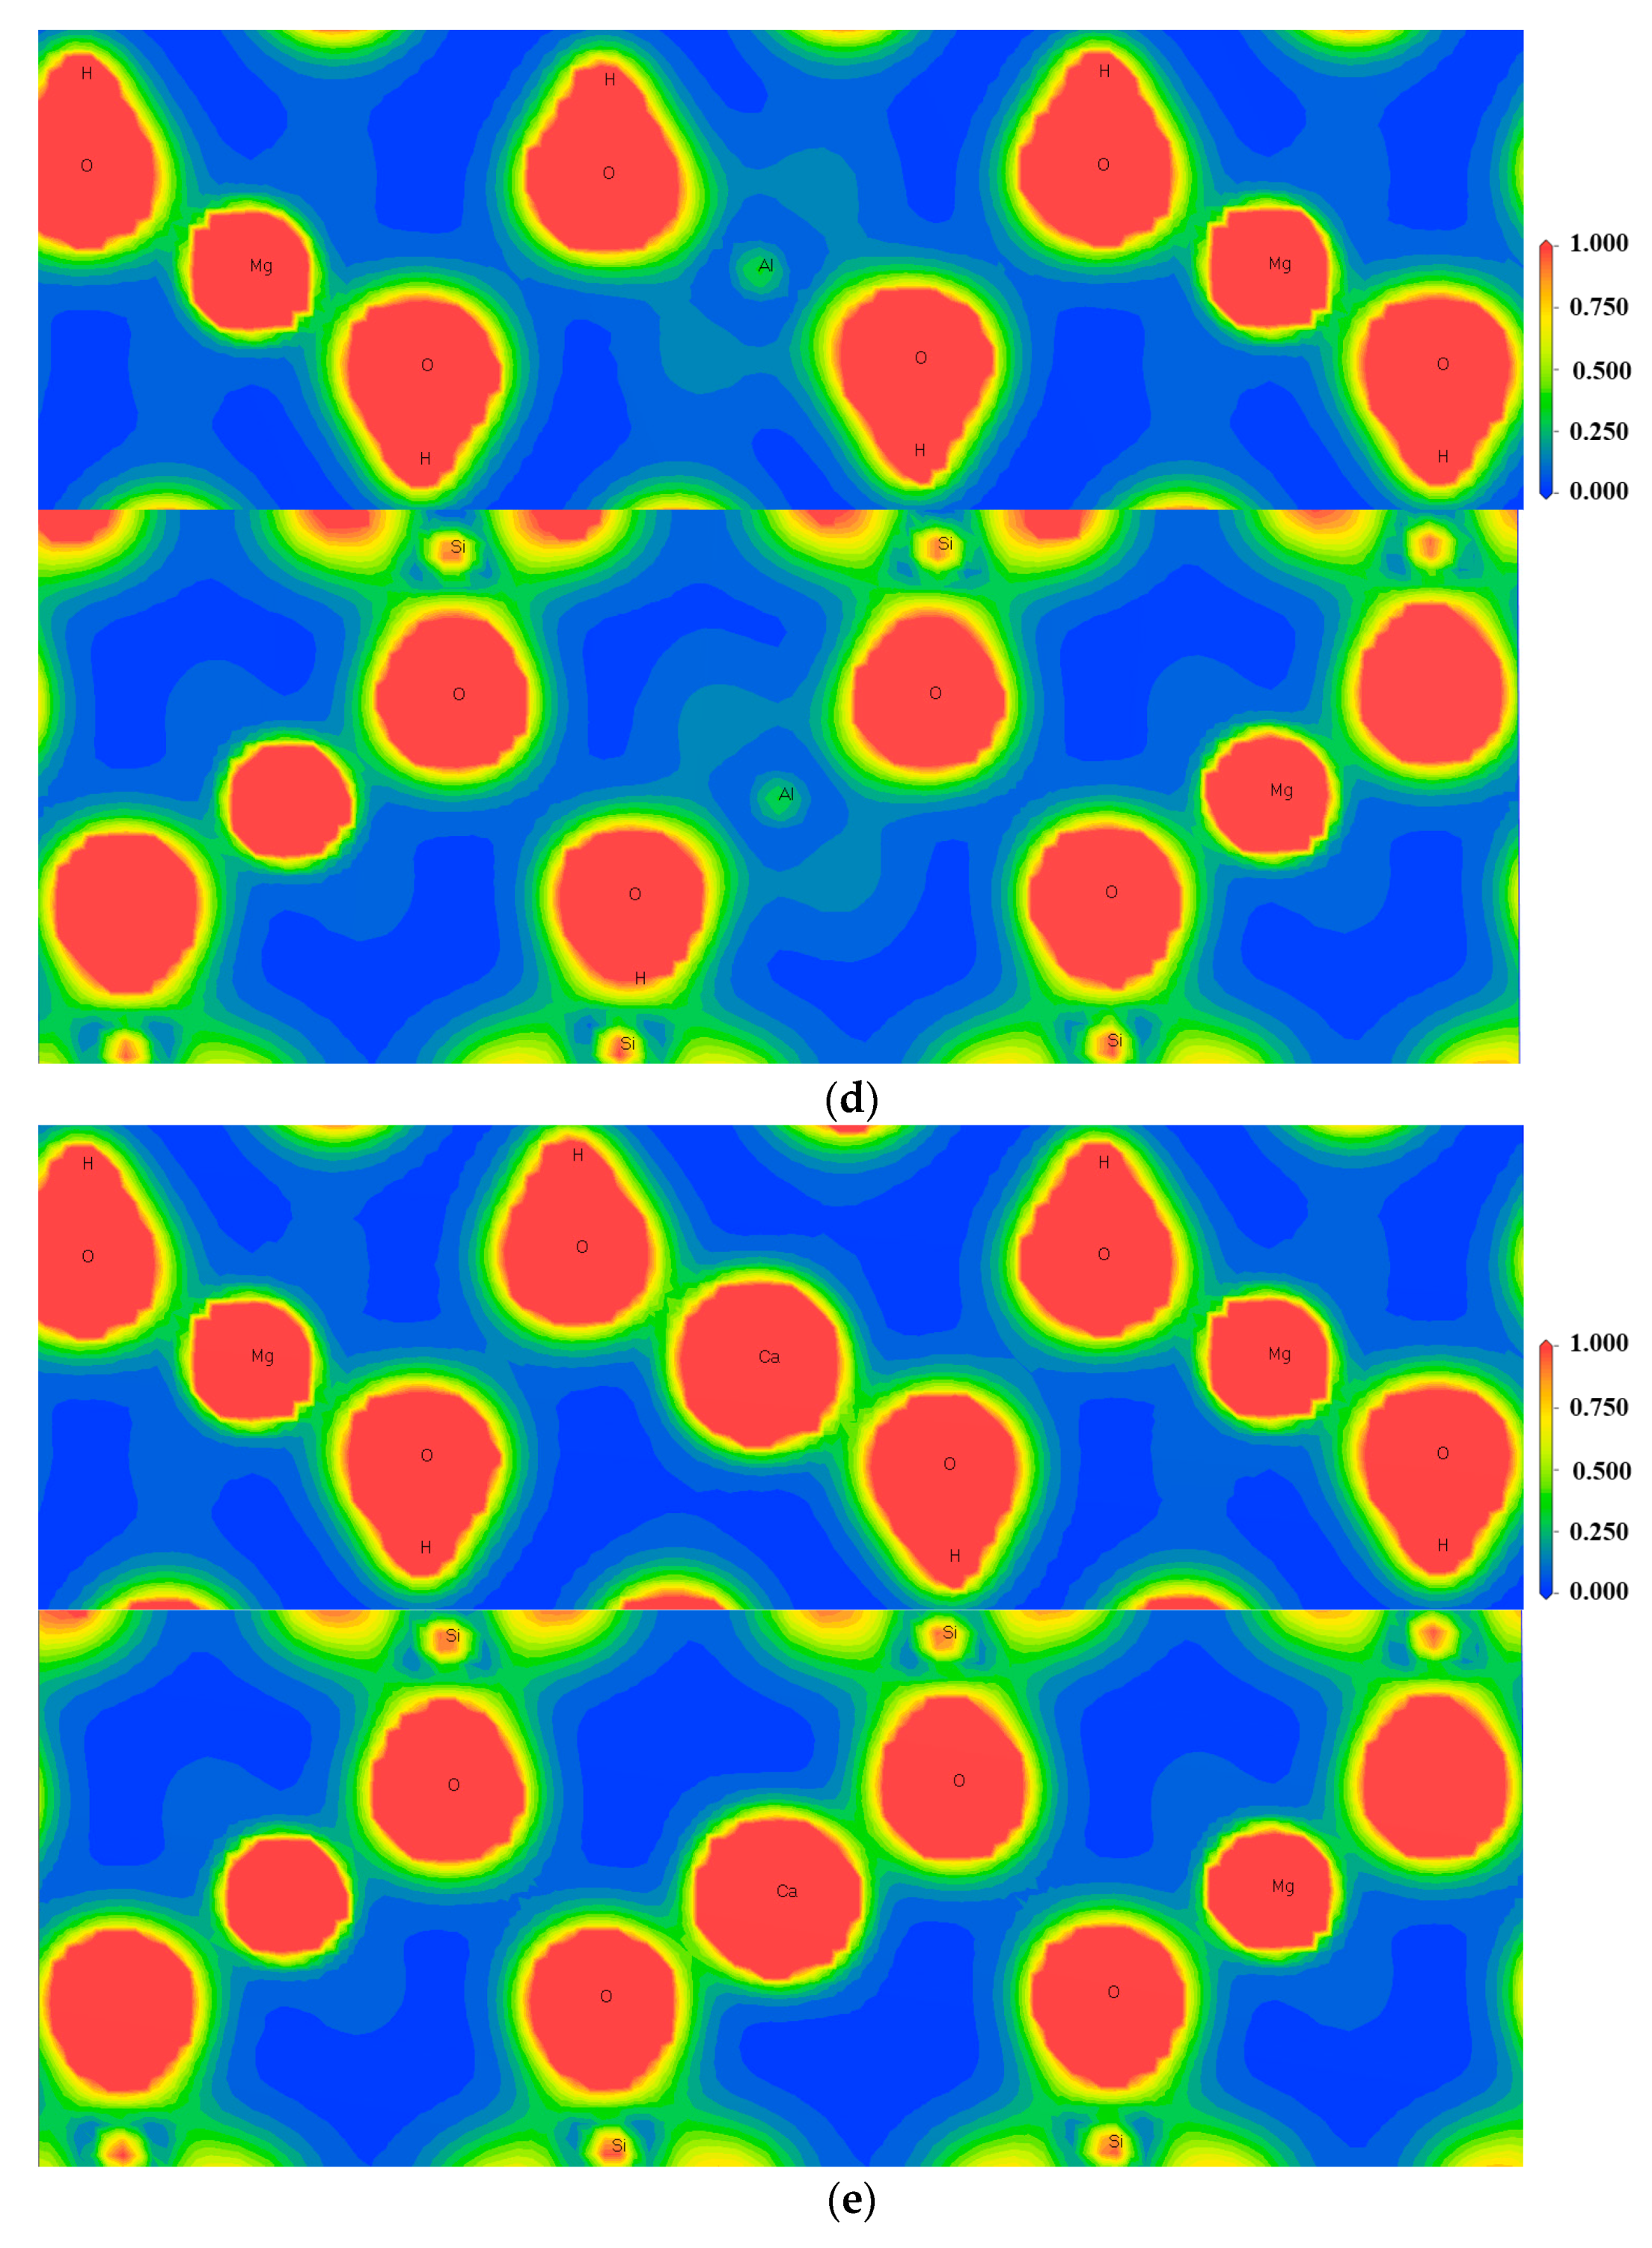
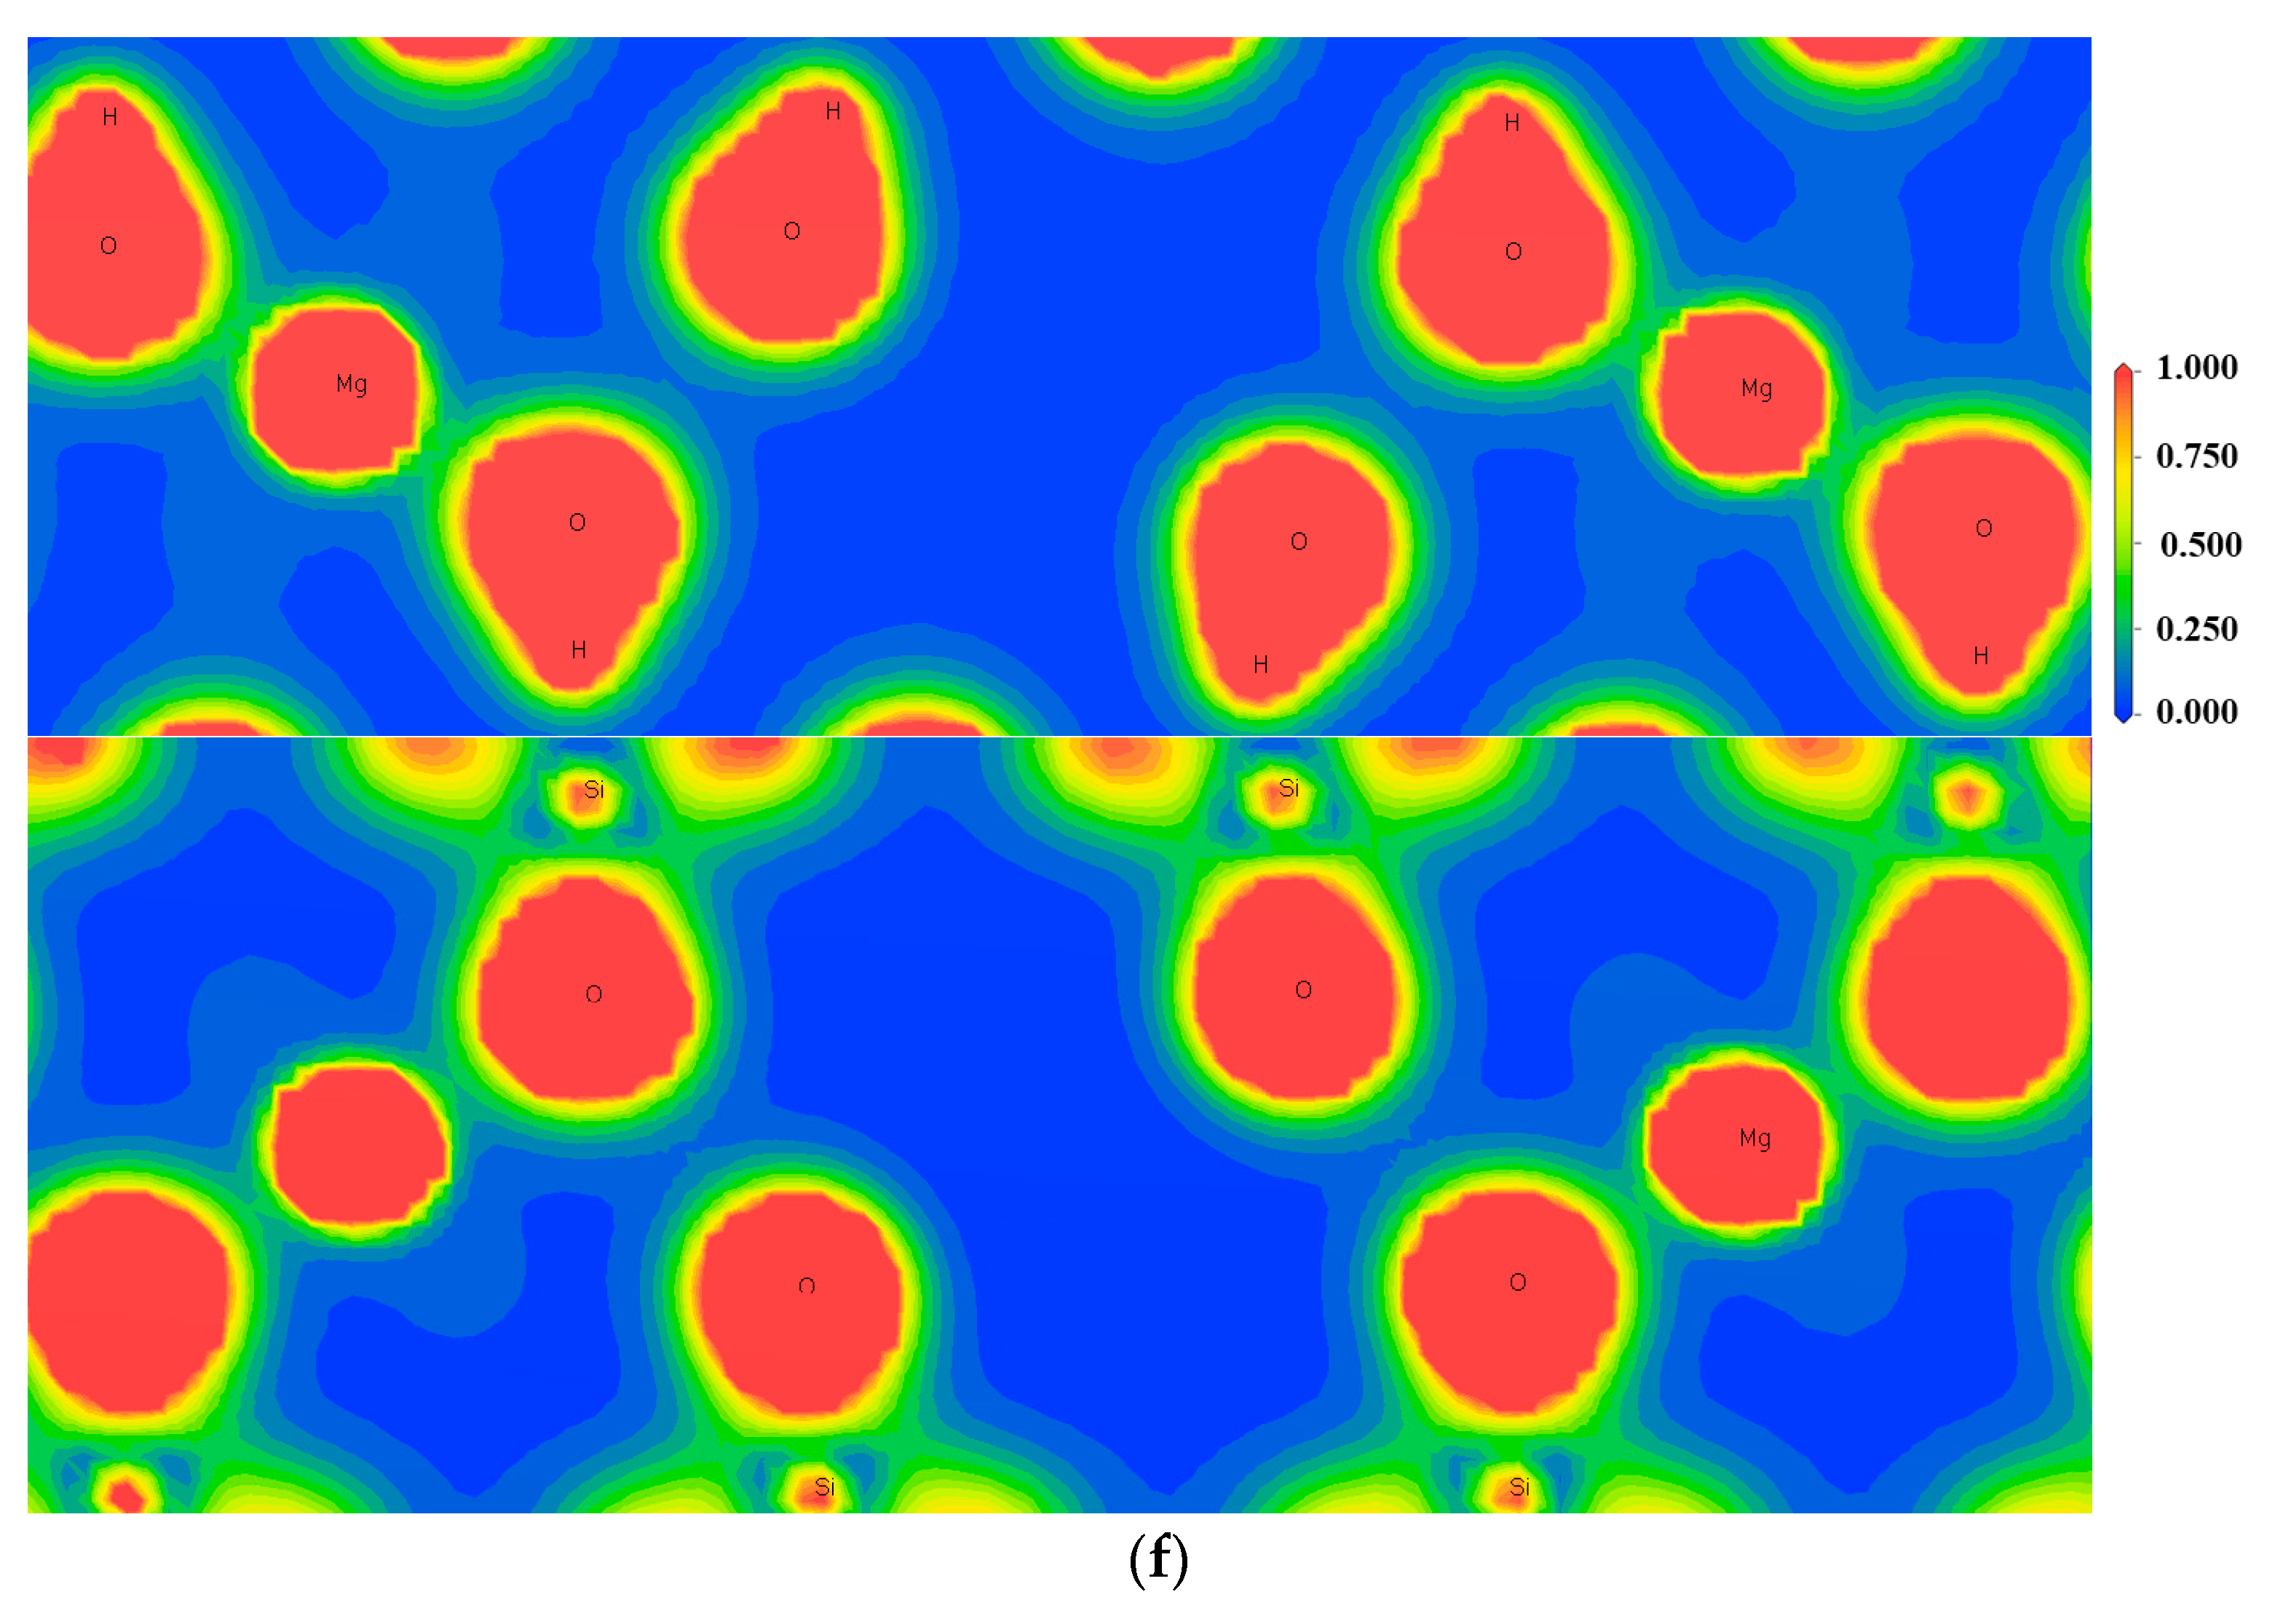
3.4. Charge Density Analysis

Figure 5 shows the two-dimensional charge density diagram of the talc (001) surface cut along the bonding direction of the point defect atoms. The cutting diagram is shown in Figure 6. The two-dimensional electron density map is cut along two black lines.
As can be seen from the diagram, the covalence of impurity atoms bonding with hydroxyl oxygen (O33) is generally stronger than that of impurity atoms bonding with reactive oxygen (O32) in the oxy-silicon tetrahedron.
This shows that the covalence of the inner surface of talc is stronger than that of the outer surface when Mg atoms are replaced by impurity atoms. The O-H attached to the impurity atoms inside the talc is tilted in the direction of the impurity atoms compared to the ideal O-H. Except for the defect of Al impurity, the charge overlap density region of other impurity atoms bonding with neighboring O atoms is larger than that of Mg atoms bonding with O atoms. This shows that the covalence of bonds around impurity atoms is enhanced after the impurity atoms replace Mg atoms. The charge density overlap region of Si atoms bonded to reactive oxygen species above the Ca impurity defects and Mg vacancy defects increases slightly, indicating that the covalence of the Si-O bonds on the surface is enhanced by these two types of point defects. The overlap area of the charge density of the Si atoms bonded with reactive oxygen species above the impurity sites of Fe, Mn, Ni, and Al decreases slightly, indicating that these impurities weaken the covalence of the Si-O bonds on the surface and enhance the ionic properties, thus affecting the hydrophilicity of the talc surface. It is found that this rule is consistent with the change of bond length between Si atoms and reactive oxygen species, and the covalence decreases when the bond length increases.

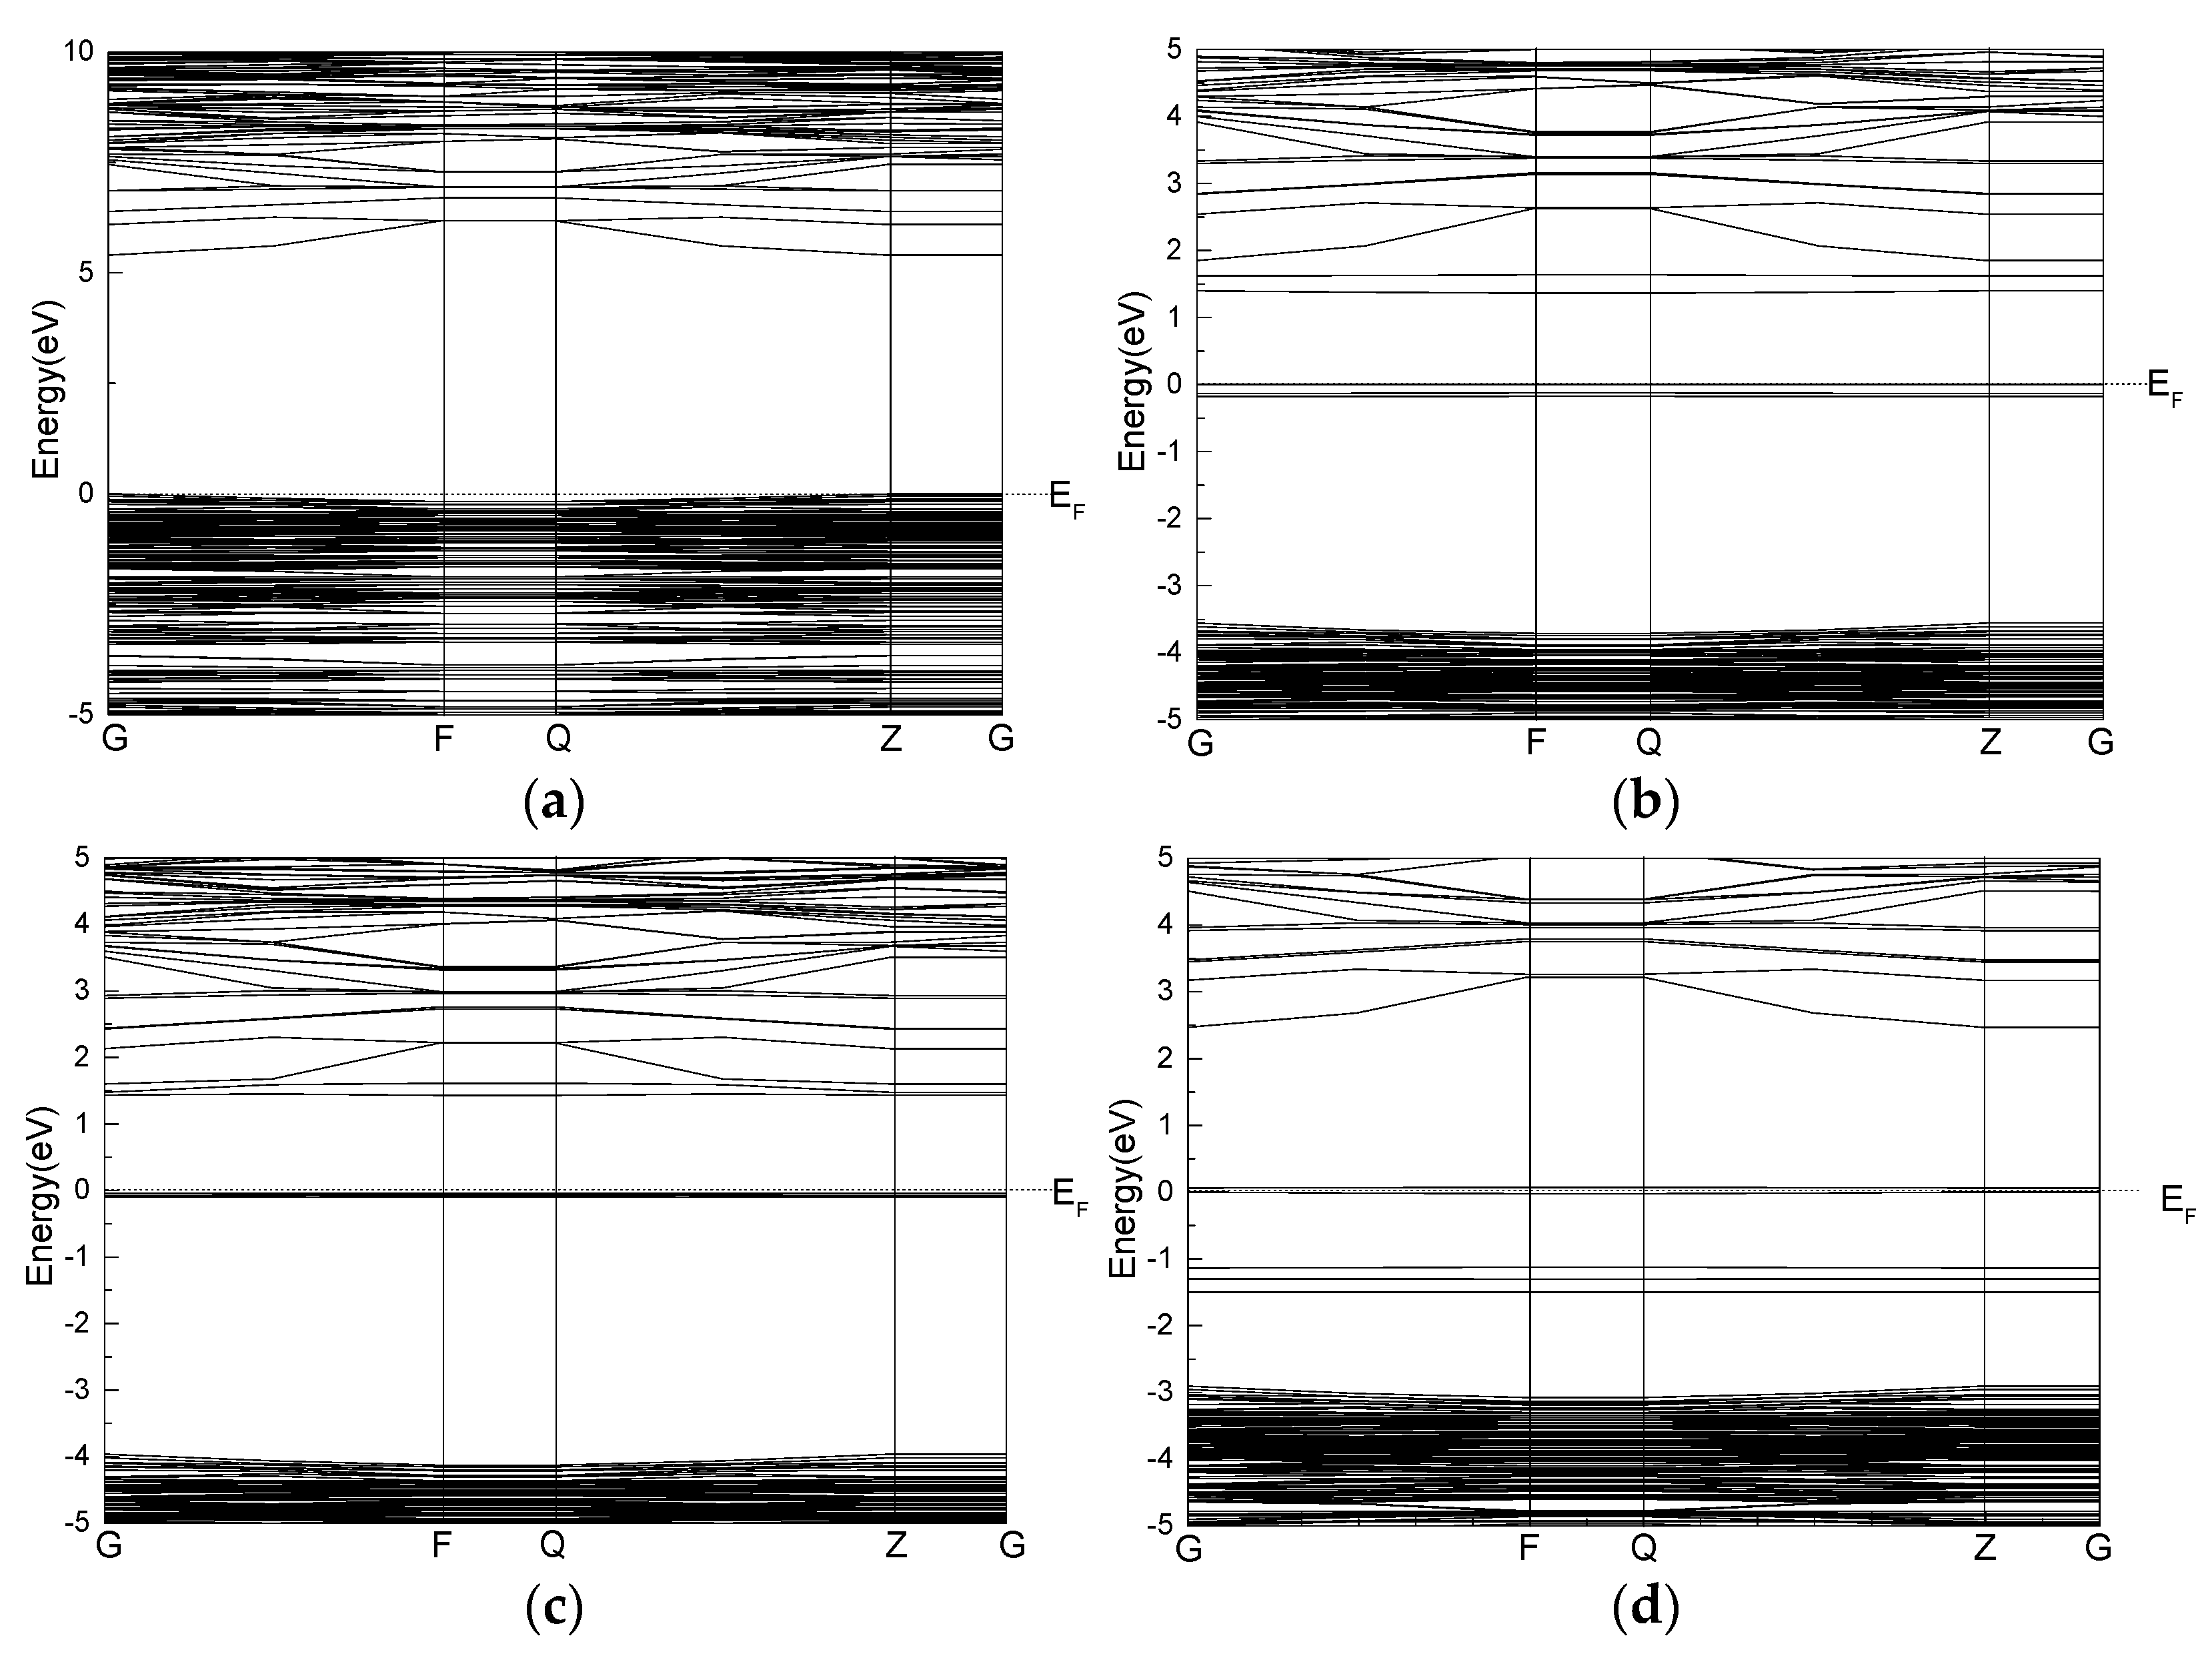
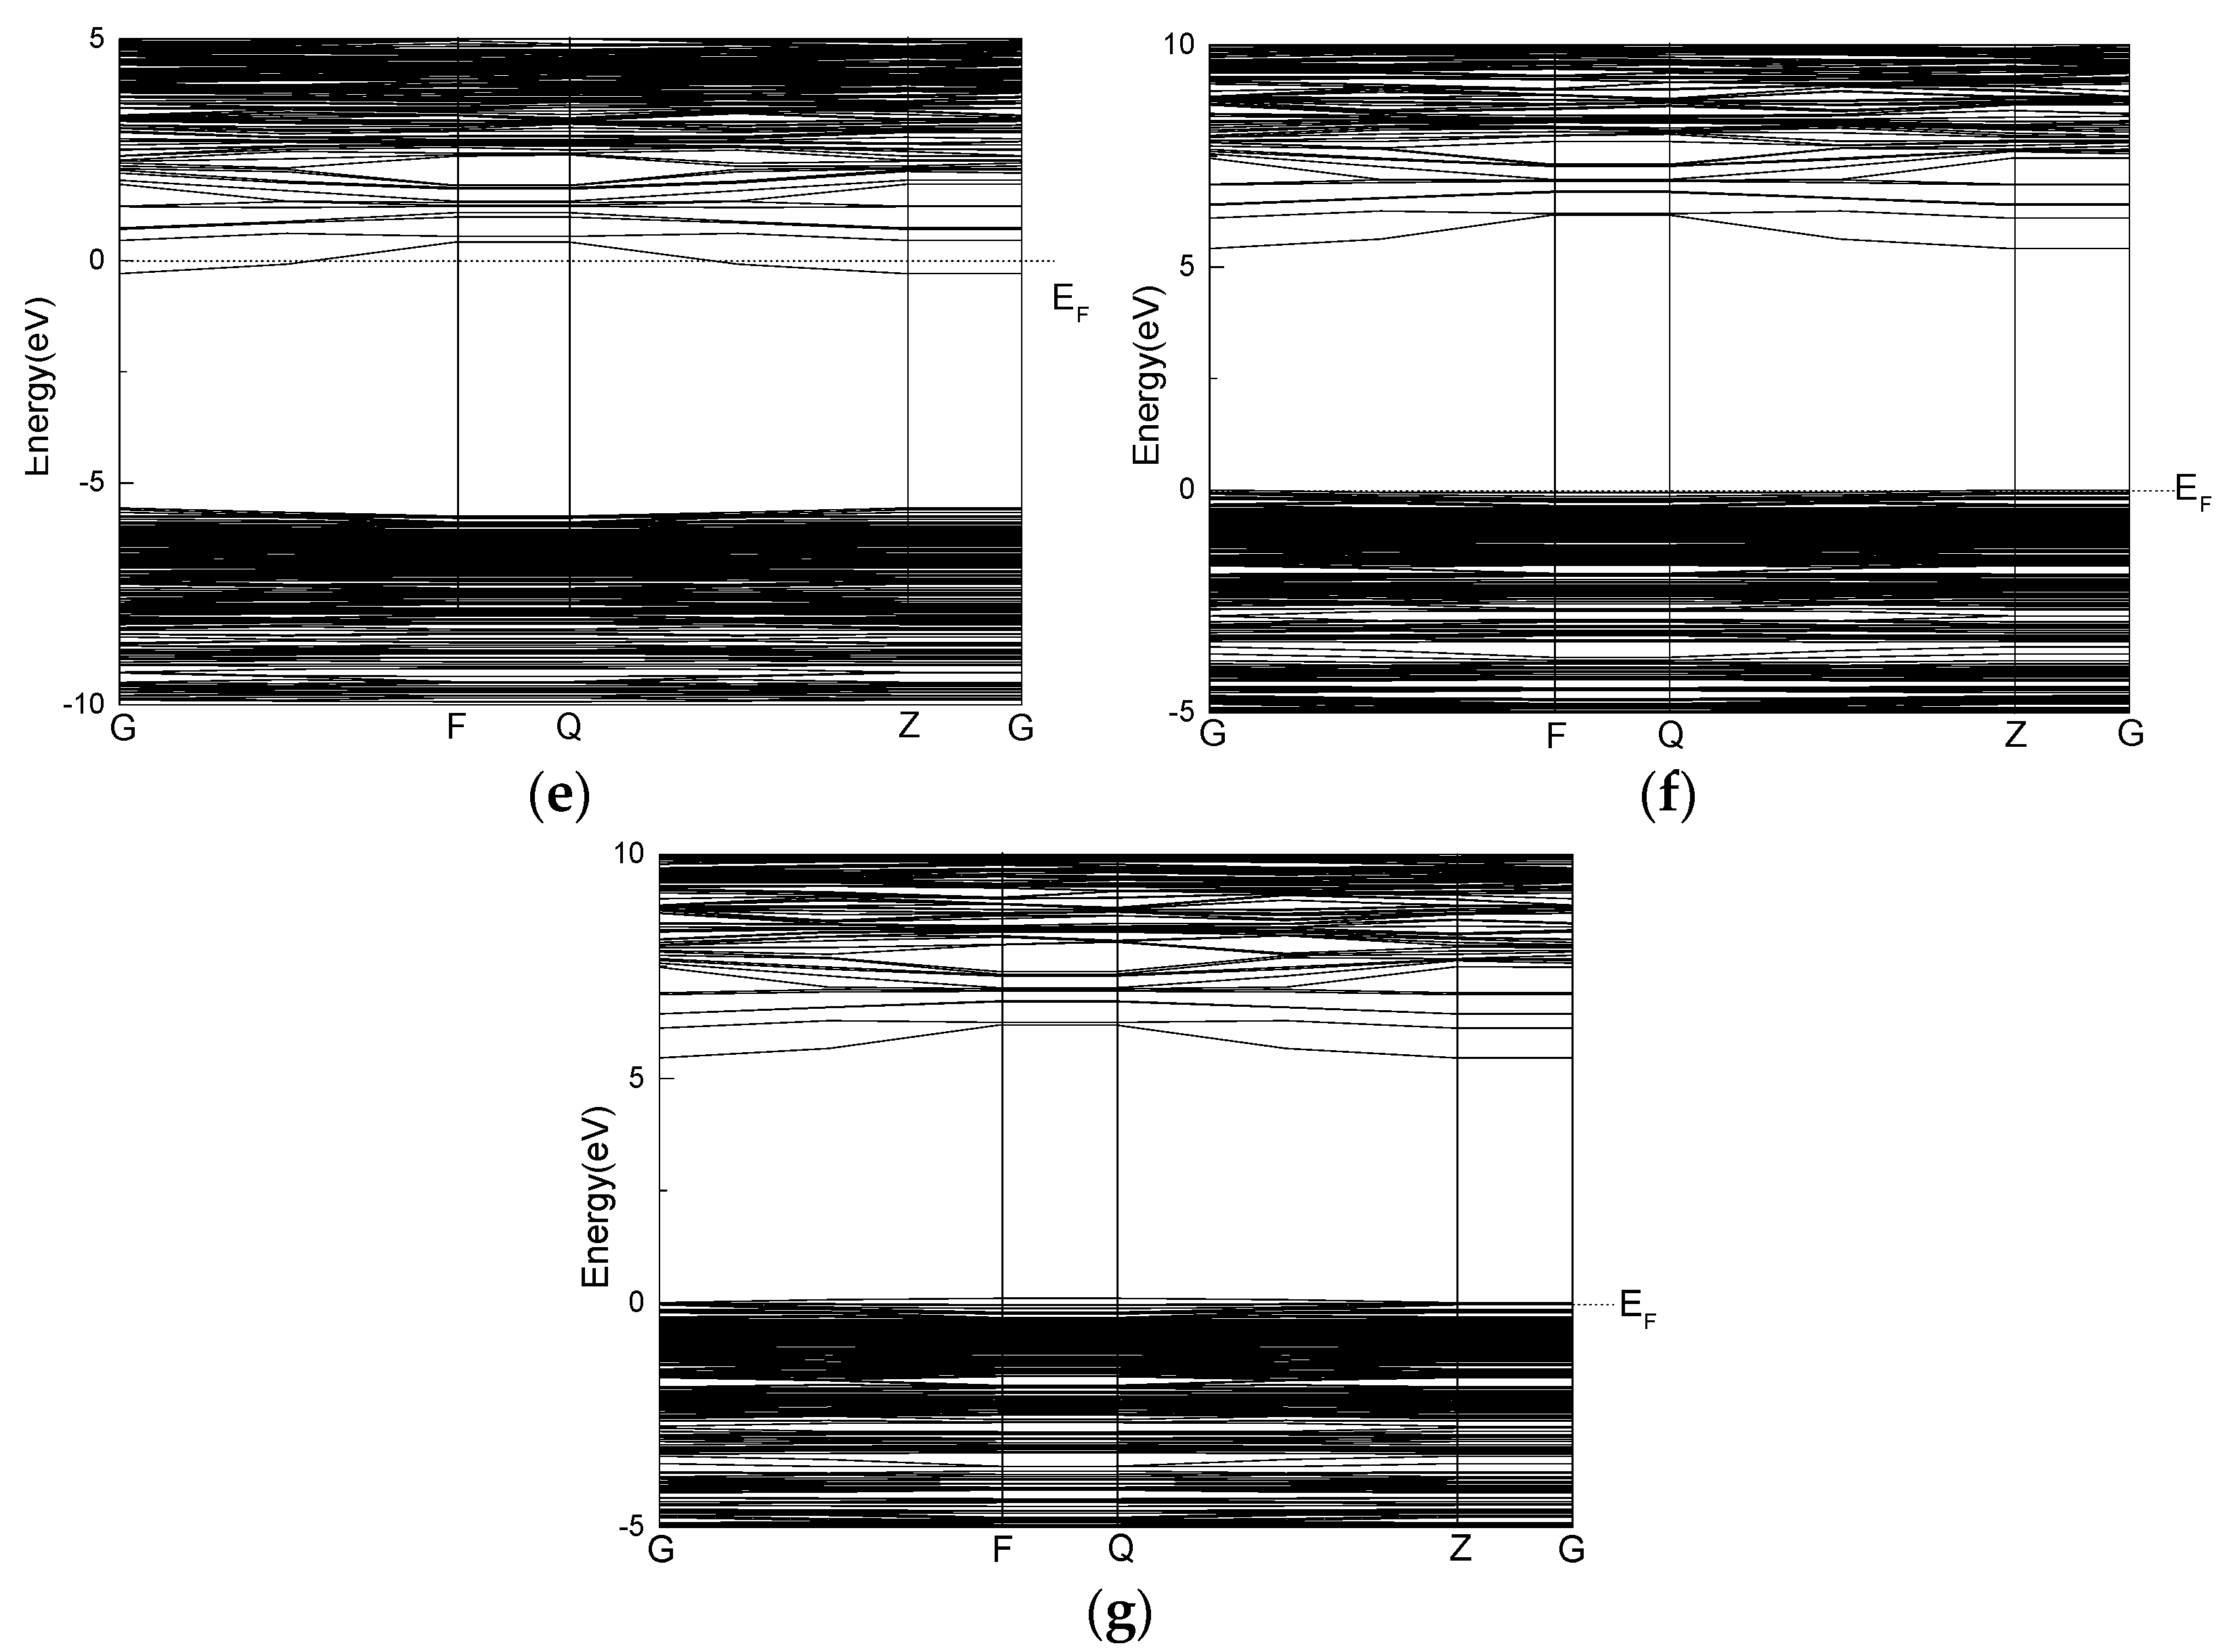
3.5. Effect of Point Defects on Surface Band Structure of Talc

Figure 7 shows the band structure of the ideal talc (001) surface and the surface with point defects. Obvious surface states of Fe, Mn, and Ni impurity atoms can be observed near the Fermi level. The bandgap width values of the Mg vacancy surface and the Ca and Al impurity defect surface are all over 5 eV, which is smaller than the ideal surface, indicating that these defects have little influence on the conductivity of the talc surface. The Fe, Mn, and Ni impurities make the state density of the talc surface layer pass through the Fermi level, and the band gap decreases from 5.411 eV on the ideal surface to below 2 eV, which enhances the surface conductivity of talc. The minimum band gap width of the talc surface containing Ni impurities is 0.058 eV. This shows that the presence of Ni impurity greatly increases the electron concentration on the talc surface, so its electrical conductivity increases.

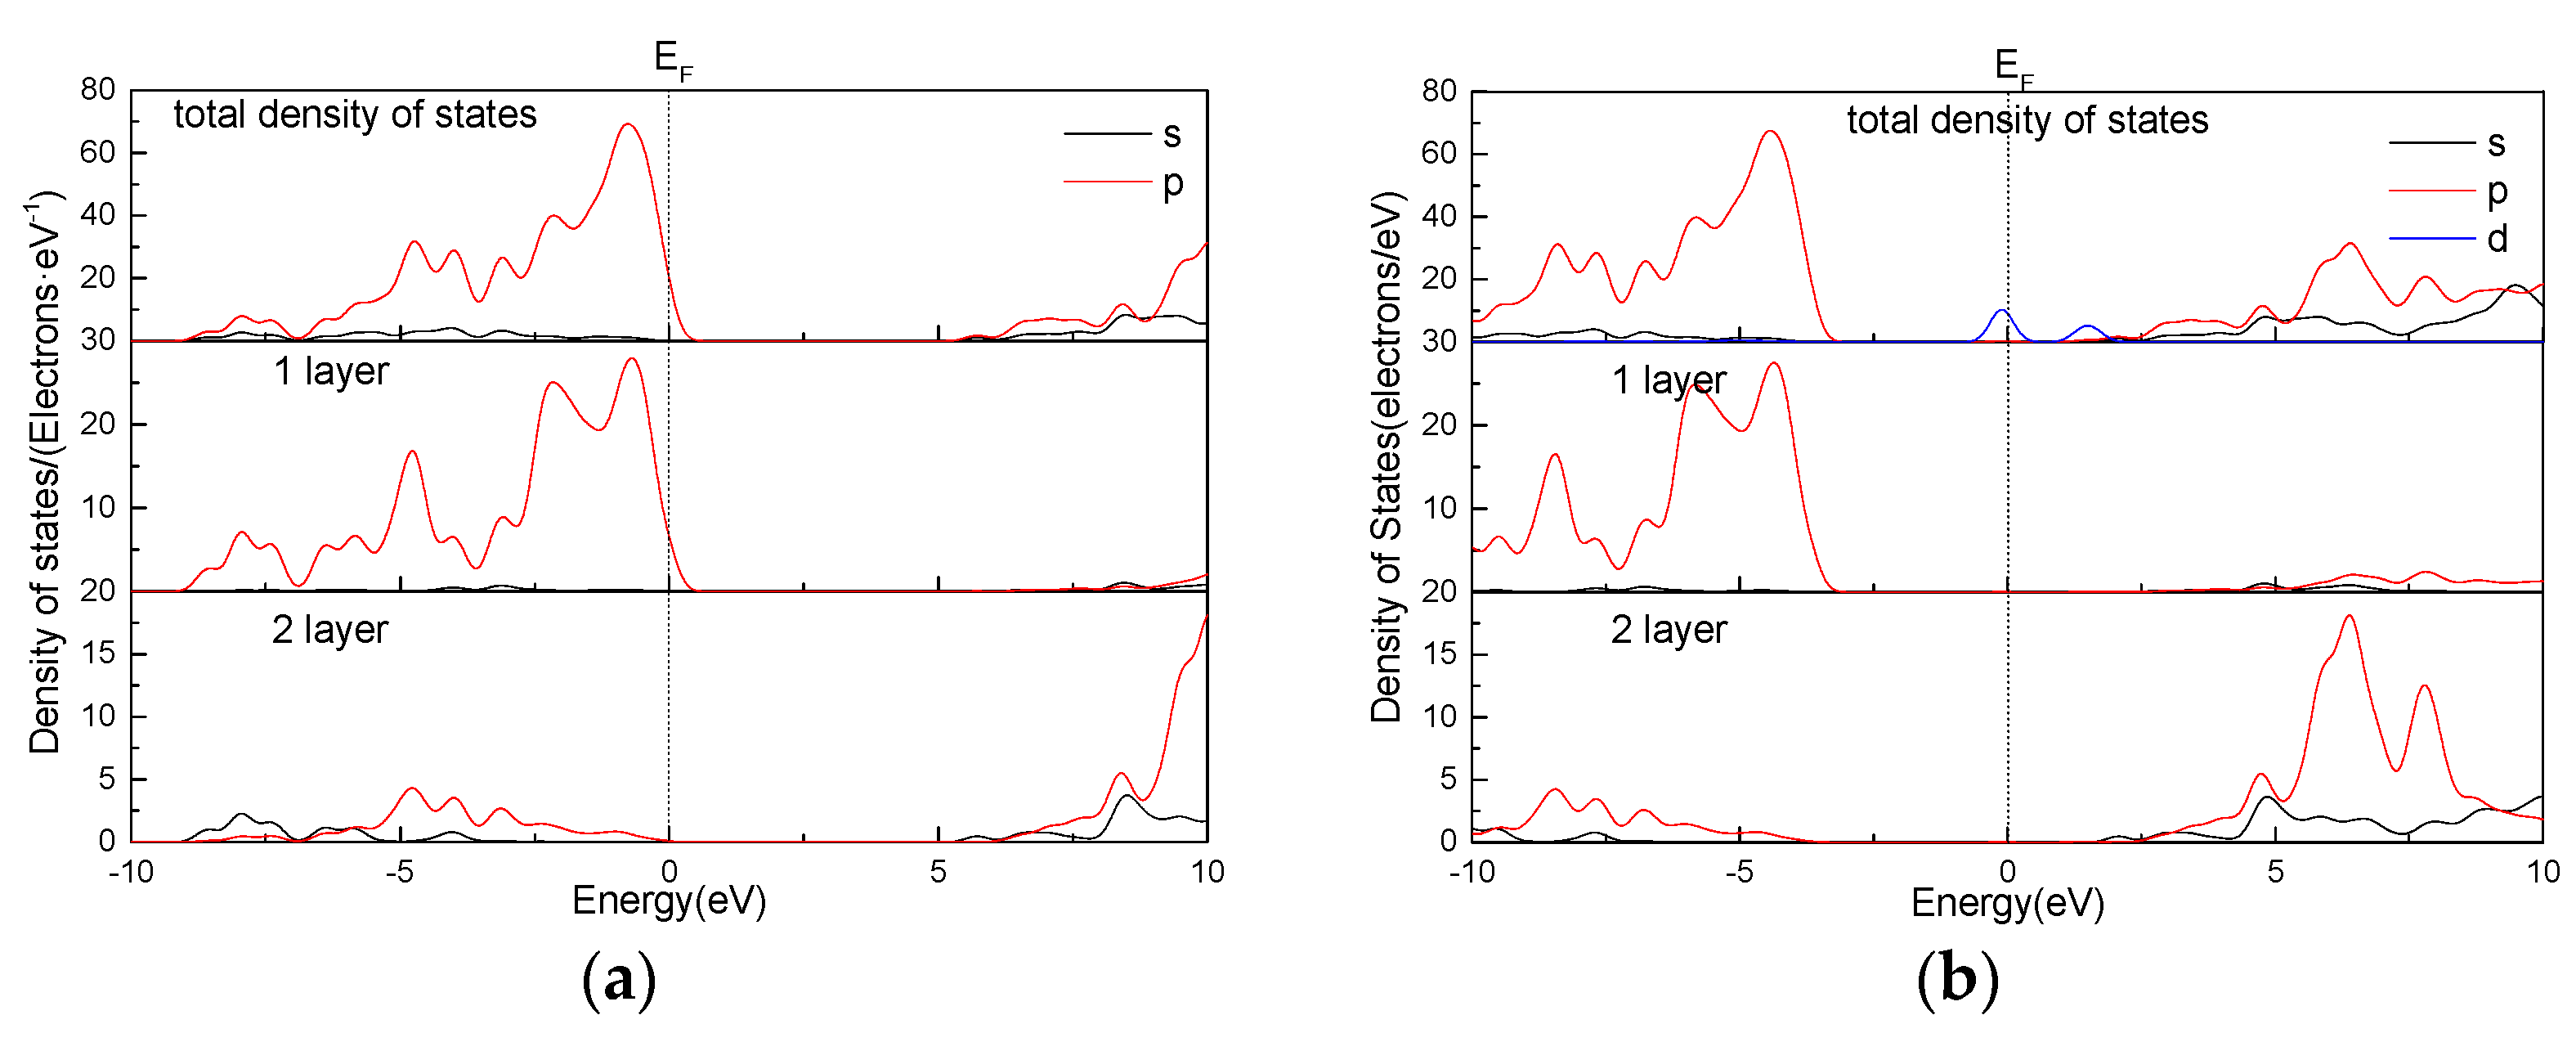
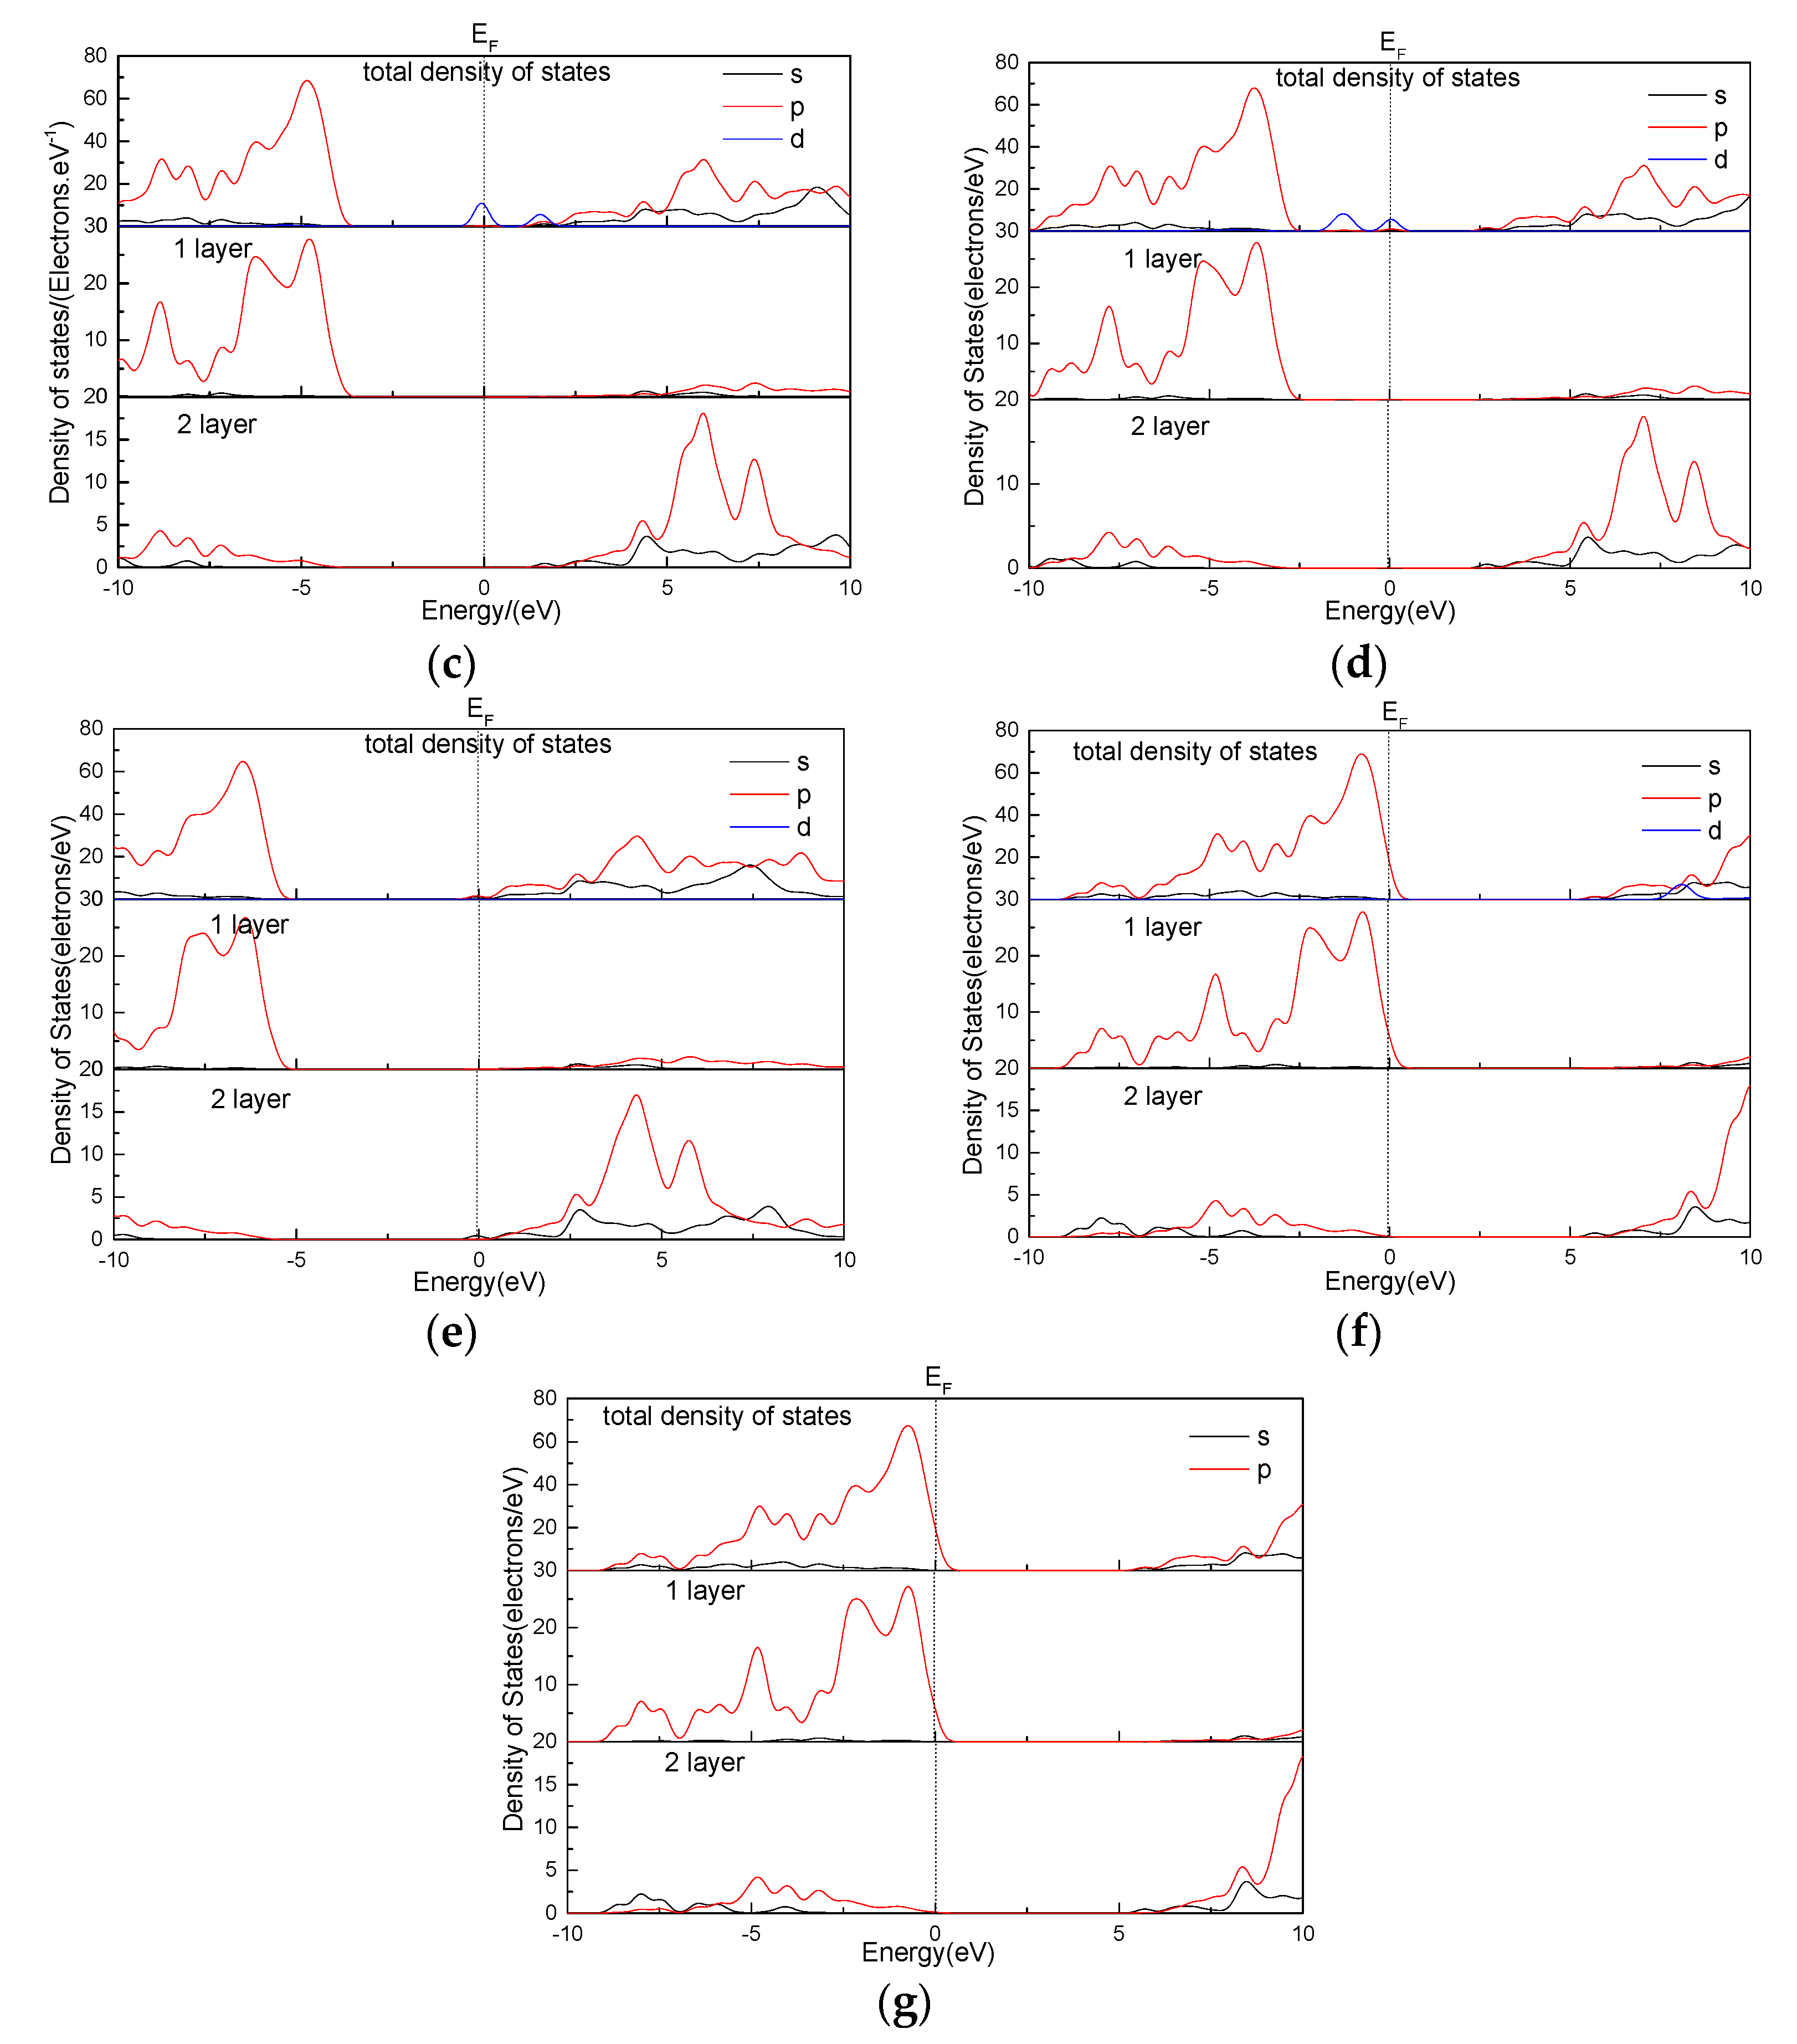
3.6. Effect of Point Defects on Talc State Density

Figure 8 shows the state density diagram of the ideal talc surface and the surface with point defects. It can be seen from the general band structure diagram that the 3d orbits of Fe, Mn, and Ni appear near the Fermi level. Except for Mg vacancy defects and Ca impurity defects, the surface state densities of the other point defects all move to the deeper level.

4. Conclusions

In this paper, the CASTEP module is used to calculate the protocells of talc. Then, the (001) surface point defect model is constructed, and its structure and properties are calcu lated and analyzed.
The calculation and analysis results are as follows:
(1)
After the parameter optimization test, the optimal parameters of cell optimization were obtained. The exchange correlation function was the GGA-PBE (DFT-D modification), and the lattice parameters of talc were obtained as a = 5.33 Å, b = 9.21 Å, and c = 9.46 Å.
(2)
According to the substitution energy data, the order of Mg atoms replaced by impurity atoms is Fe > Ca > Al > Ni > Mn. Through the Mulliken population analysis of atoms, it is found that point defects increase the electron loss of Si atoms on the talc surface. The Mulliken overlapping population analysis of atom bonding on the talc surface shows that the covalency of Si-O bonds above the defects of Fe, Mn, Ni, and Al is weakened and the ionic property is enhanced. The results show that point defects can change the hydrophilic and hydrophobic properties of the talc surface.
(3)
The band gap and state density of the talc surface are analyzed. The results show that the defects of Fe, Mn, and Ni decrease the band gap of the talc surface to below 2 eV, and the gold property of the talc surface is enhanced. This indicates that the point defects have a certain effect on the electrical conductivity of the talc surface.

Author Contributions

Conceptualization, X.M.; Data curation, X.M.; Formal analysis, X.M.; Investigation, H.D.; Software, J.C. and L.L.; Supervision, P.L.; Writing—original draft, X.M.; Writing—review & editing, J.C. and L.L. All authors have read and agreed to the published version of the manuscript.

Funding

National Natural Science Foundation of China: 51464006; Guangxi Biological Polysaccharide Separation, Purification and Modification Research Platform (GKZY18076005).

Data Availability Statement

Data is contained within the article.

Acknowledgments

First of all, I would like to thank Teacher Lihong Lan for her guidance in my calculation process and her valuable suggestions in the process of writing the paper. Then, thank Teacher Jianhua Chen for the computing resources. Finally, I would like to thank Teacher Ping Lan and sister Huicong Du for their help and support.

Conflicts of Interest

The authors declare no conflict of interest.

References

  1. William, F.B.; Roald, H. Orbital Interactions in Phyllosilicates: Perturbations of an Idealized Two-Dimensional, Infinite Silicate Frame. Phys. Chem. Miner. 1988, 15, 398–408. [Google Scholar]
  2. Perdikatsis, B.; Burzlaff, H. Strukturverfeinerung Am Talk Mg3[(OH)2Si4O10]. Z. Krist.-Cryst. Mater. 1981, 156, 3–4. [Google Scholar] [CrossRef]
  3. Lee, J.H.; Guggenheim, S. Single-Crystal X-Ray Refinement of Pyrophyllite-1tc. Am. Mineral. 1981, 66, 350–357. [Google Scholar]
  4. Feng, B.; Lu, Y.P.; Feng, Q.M.; Zhang, M.Y.; Gu, Y.L. Talc–Serpentine Interactions and Implications for Talc Depression. Miner. Eng. 2012, 32, 68–73. [Google Scholar] [CrossRef]
  5. Deer, W.A.; Howie, R.A.; Zussman, J. An Introduction to the Rock-Forming Minerals, 2nd Edition. Longman Sci. Tech. 1992, 385, 617–619. [Google Scholar]
  6. Farrokhpay, S.; Ndlovu, B.; Bulelwa, D.N. Behavior of Talc and Mica in Copper Ore Flotation. Appl. Clay Sci. 2018, 160, 270–275. [Google Scholar] [CrossRef]
  7. Zhang, Q.D.; Yuan, Z.T.; Liu, J.T.; Li, X.L.; Lu, Y.W.; Lu, S.S. Effect of glucan on flotation separation of molybdenite and talc. Chin. J. Nonferrous Met. 2016, 4, 7. [Google Scholar]
  8. Long, T.; Feng, Q.M.; Lu, P.Y.; Zhang, G.F.; Ou, L.M.; Pan, G.C. Depression and dispersion effect of carboxy methyl cellulose on flotation of layered magnesium-silicates. Chin. J. Nonferrous Met. 2011, 21, 1145–1150. [Google Scholar]
  9. Ahmed, M.M.; Galal, A.I.; Mohamed, M.A. Improvement of Egyptian Talc Quality for Industrial Uses by Flotation Process and Leaching. Int. J. Miner. Processing 2007, 83, 132–145. [Google Scholar] [CrossRef]
  10. Burdukova, E.; Van Leerdam, G.C.; Prins, F.E.; Smeink, R.G.; Bradshaw, D.J.; Laskowski, J.S. Effect of Calcium Ions on the Adsorption of Cmc onto the Basal Planes of New York Talc—A Tof-Sims Study. Miner. Eng. 2008, 21, 1020–1025. [Google Scholar] [CrossRef]
  11. Vidal, C.G.; Pawlik, M. Molecular Weight Effects in Interactions of Guar Gum with Talc. Int. J. Miner. Process. 2015, 138, 38–43. [Google Scholar] [CrossRef]
  12. Rayner, J.H.; Brown, G. The Crystal Structure of Talc. Acta Crystallogr. 1969, 25, 163–165. [Google Scholar] [CrossRef]
  13. Yan, H.J.; Luo, X.P.; Zhu, X.W.; Weng, C.J.; Zhang, W.P.; Feng, B. Research Progress on Talc Inhibitors in Sulfide Ore Flotation. Conserv. Util. Miner. Resour. 2020, 40, 138–144. [Google Scholar]
  14. Chen, J.H.; Chen, Y.; Li, Y.Q. Effect of Vacancy Defects on Electronic Properties and Activation of Sphalerite (110) Surface by First-Principles. Trans. Nonferrous Met. Soc. China 2010, 20, 502–506. [Google Scholar] [CrossRef]
  15. Chen, J.H.; Long, X.H.; Zhao, C.H.; Kang, D.; Guo, J. DFT Calculation on Relaxation and Electronic Structure of Sulfide Minerals Surfaces in Presence of H2O Molecule. J. Cent. S. Univ. 2014, 21, 3945–3954. [Google Scholar] [CrossRef]
  16. Zhao, C.H.; Chen, J.H.; Wu, B.Z.; Long, X.H. Density Functional Theory Study on Natural Hydrophobicity of Sulfide Surfaces. Trans. Nonferrous Met. Soc. China 2014, 24, 491–498. [Google Scholar] [CrossRef]
  17. Chen, J.H.; Li, Y.Q.; Lan, L.H.; Guo, J. Interactions of Xanthate with Pyrite and Galena Surfaces in the Presence and Absence of Oxygen. J. Ind. Eng. Chem. 2014, 20, 268–273. [Google Scholar] [CrossRef]
  18. Clark, S.J.; Segallii, M.D.; Pickardii, C.J.; Hasnipiii, P.J.; Probertiv, M.I.J. First Principles Methods Using Castep. Z. Krist.-Cryst. Mater. 2005, 220, 567–570. [Google Scholar] [CrossRef] [Green Version]
  19. Grimme, S. Semiempirical Gga-Type Density Functional Constructed with a Long-Range Dispersion Correction. J. Comput. Chem. 2006, 27, 1787–1799. [Google Scholar] [CrossRef]
  20. Terentjev, A.V.; Constantin, L.A.; Pitarke, J.M. Dispersion-corrected PBEsol exchange-correlation functional. Phys. Rev. B 2018, 98, 21. [Google Scholar] [CrossRef]
  21. Lan, L.H.; Chen, J.H.; Chen, J.H.; Li, Y.Q.; Lan, P.; Yang, Z.; Ai, G.Y. Microthermokinetic Study of Xanthate Adsorption onpurity-Doped Galena. Trans. Nonferrous Met. Soc. China 2016, 26, 272–281. [Google Scholar] [CrossRef]
  22. Kazume, N.; Yoshizawa, M.; Hasegawa, M. Energetics of Mg and B Adsorption on Polar Zinc Oxide Surfaces from First Principles. Phys. Rev. 2008, 77, 35330. [Google Scholar]
Figure 1. Primitive cell structure of talc.
Minerals 12 00069 g001
Figure 2. Emmetropia of the (2 × 2 × 1) supercrystal cell on talc (001) surface under ideal condition.
Minerals 12 00069 g002
Figure 3. Top view of the (2 × 2 × 1) supercrystal cell on talc (001) surface under ideal condition.
Minerals 12 00069 g003
Figure 4. Atomic charge distribution on the point defect talc surface: (a) ideal surface, (b) Fe impurity defect surface, (c) Mn impurity defect surface, (d) Ni impurity defect surface, (e) Al impurity defect surface, (f) Ca impurity defect surface, and (g) Mg vacancy surface.
Minerals 12 00069 g004aMinerals 12 00069 g004bMinerals 12 00069 g004c
Figure 5. Charge density diagram of talc point defect surface: (a) Fe impurity defect surface, (b) Mn impurity defect surface, (c) Ni impurity defect surface, (d) Al impurity defect surface, (e) Ca impurity defect surface, and (f) Mg vacancy surface.
Minerals 12 00069 g005aMinerals 12 00069 g005bMinerals 12 00069 g005cMinerals 12 00069 g005d
Figure 6. Schematic diagram of charge density cutting.
Minerals 12 00069 g006
Figure 7. Energy band structure of the ideal talc surface and the point defect surface: (a) ideal surface, (b) Fe impurity defect surface, (c) Mn impurity defect surface, (d) Ni impurity defect surface, (e) Al impurity defect surface, (f) Ca impurity defect surface, and (g) Mg vacancy defect surface.
Minerals 12 00069 g007aMinerals 12 00069 g007b
Figure 8. State density diagram of the ideal talc surface and the point defect surface: (a) ideal surface (b) Fe impurity defect surface, (c) Mn impurity defect surface, (d) Ni impurity defect surface, (e) Al impurity defect surface, (f) Ca impurity defect surface, and (g) Mg vacancy defect surface.
Minerals 12 00069 g008aMinerals 12 00069 g008b
Table 1. Point defect formation energy.
Point Defect TypePoint Defect Formation Energy (KJ·mol−1)
Fe−162.72
Mn265.77
Ni139.78
Al13.04
Ca−32.84
Mg vacancy1111.68
Table 2. Surface parameters of ideal talc (001) and with point defects.
Type(001) SurfFe
Impurity
Mn
Impurity
Ni
Impurity
Al
Impurity
Ca
Impurity
Mg
Vacancy
Experimental Value
Unitlayer thickness6.626.65 (0.03)6.64 (0.02)6.61 (0.01)6.68 (0.06)6.49 (0.13)6.50 (0.12)6.50
Si-Ob1.631.63 (0.00)1.63 (0.00)1.63 (0.00)1.63 (0.00)1.63 (0.00)1.63 (0.00)1.61
Si-Oa1.631.63 (0.00)1.6 (0.00)1.63 (0.00)1.66 (0.03)1.62 (0.01)1.61 (0.02)1.63
X-Oa2.112.062.102.141.972.25——2.08
X-O(O-H)2.062.012.051.991.902.25——2.05
O-H/Å0.970.98 (0.01)0.98 (0.01)0.98 (0.01)0.98 (0.01)0.97 (0.00)0.97 (0.00)——
Oaup-Oadown/Å2.272.23 (0.04)2.26 (0.01)2.29 (0.02)2.19 (0.08)2.33 (0.06)2.34 (0.07)2.20
a represents reactive oxygen atoms in oxy-silicon tetrahedron; b represents saturated oxygen atoms in the surface layer of oxy-silicon tetrahedron; X represents point defect atoms: values in parentheses represent differences between data of the point defect surface and the ideal surface. —— represents that the data does not exist.
Table 3. Mulliken population analysis of adjacent atoms with impurity defects.
TypeAtomsspdCharge/e
Talc (001)
surface
H (6)0.610.000.000.39
O (33)1.905.240.00−1.14
Mg(12)0.435.990.001.58
O (32)1.915.340.00−1.25
Si (11)0.651.200.002.15
O (28)1.835.310.00−1.14
Fe impurity defect surfaceH (6)0.610.000.000.39
O (33)1.885.130.00−1.01
Fe0.380.546.720.36
O (32)1.885.250.00−1.14
Si (11)0.641.190.002.17
O (28)1.835.310.00−1.14
Mn impurity defect surfaceH (6)0.610.000.000.39
O (33)1.885.130.00−1.01
Mn0.380.455.820.35
O (32)1.885.250.00−1.13
Si (11)0.641.190.002.17
O (28)1.835.310.00−1.14
Ni impurity defect surfaceH (6)0.600.000.000.40
O (33)1.885.120.00−1.00
Ni0.450.598.550.40
O (32)1.895.270.00−1.16
S i(11)0.641.190.002.17
O (28)1.835.320.00−1.15
Al impurity defect surfaceH (6)0.630.000.000.37
O (33)1.875.200.00−1.08
Al0.601.040.001.36
O (32)1.885.300.00−1.18
Si (11)0.651.180.002.16
O (28)1.845.300.00−1.14
Ca impurity defect surfaceH (6)0.600.000.000.40
O (33)1.885.210.00−1.09
Ca2.366.010.690.95
O (32)1.895.320.00−1.21
Si (11)0.641.190.002.18
O (28)1.835.330.00−1.15
Mg vacancy defect surfaceH (6)0.580.000.000.42
O (33)1.915.080.00−0.99
Mg (12)————————
O (32)1.915.240.00−1.16
Si (11)0.631.180.002.19
O (28)1.835.320.00−1.14
Publisher’s Note: MDPI stays neutral with regard to jurisdictional claims in published maps and institutional affiliations.

