Article

Size Effect of the Number of Parallel Joints on Uniaxial Compressive Strength and Characteristic Strength

1
School of Civil Engineering, Shaoxing University, Shaoxing 312000, China
2
Key Laboratory of Rock Mechanics and Geohazards of Zhejiang Province, Shaoxing 312000, China
3
Zhejiang Rock Mechanics and Geological Hazard Laboratory, Shaoxing 312000, China
4
CNACG Ecological Environment Technology Co., Ltd., Beijing 100012, China
*
Author to whom correspondence should be addressed.
Minerals 2022, 12(1), 62; https://doi.org/10.3390/min12010062
Submission received: 28 October 2021 / Revised: 23 December 2021 / Accepted: 1 January 2022 / Published: 3 January 2022
(This article belongs to the Special Issue Petrophysical Characteristics of Naturally Deformed Rocks)

Abstract

:
The number of parallel joints has an impact on the size effect of the uniaxial compressive strength and characteristic strength of a rock; however, the relationships between them are yet to be derived. We studied the influence of the number of joints and rock size on the uniaxial compressive strength of the rock. This study established ten numerical simulation programs using numerical simulations and the RFPA software. Stress–strain curves of different numbers of parallel joints and sizes of rocks were analyzed. Relationships between the uniaxial compressive strength and number of parallel joints and rock size were proposed, and their special functions were obtained. Mathematical models between rock characteristic size, rock characteristic strength and the number of parallel joints were established. Simulations of the verification program confirmed that these relationships are still applicable after the angle of parallel joints changes.

1. Introduction

In the natural environment, under the long-term action of complex geological conditions, large numbers of joints, cracks and faults have accumulated in rocks. One of the most common is joints. The existence of parallel joints greatly weakens the strength of a rock, resulting in great challenges regarding the stability of rock engineering [1]. The size effect is a phenomenon in which the mechanical properties of the rock show a certain change law with the size change, and it is also a universal property of the rock [2].
Compressive strength is one of the mechanical properties of rocks, and the compressive strength has a size effect. Hudson et al. [3] obtained the law wherein the strength of a rock decreases with the increase in the length–diameter ratio through laboratory experiments, and proposed that a rock has a size effect. Fu [4] obtained the size effect of rock compressive strength through uniaxial compression tests with different height-to-diameter ratios. Lu et al. [5] performed uniaxial compression tests on rocks with different height-to-diameter ratios and obtained the size effect of rock strength as well. Zhao et al. [6] studied the size effect of rock strength from the perspective of dynamics by conducting indoor rock burst tests on granites of different heights. The above studies showed that the compressive strength of a rock has a size effect. With the expanding research of scholars, the size effect of rocks has been transformed from qualitative description to quantitative analysis. Liu et al. [7] proposed an empirical formula to describe the size effect of rocks, which was verified in uniaxial compression tests on seven types of rock. The above studies are based on theory or laboratory experiments. The size of the model is mostly below 0.4 m, which limits the study of larger-sized rocks. With the development and application of numerical simulation technology, numerical methods to solve geotechnical engineering problems have gradually become a trend. The most representative one is the Rock Failure Process Analysis System (RFPA), developed by Professor Tang [8]. Numerical simulations are used to study the size effect of the rock, which overcomes the size limitation of the traditional indoor test model. For example, Luo et al. [9], Wu et al. [10], and Wang et al. [11] all used numerical simulations to study the size effect of rock strength, overcoming the size limit of the model. Although scholars have performed a number of studies on the size effect of rock strength, there are relatively few studies on the effect of the number of joints on the size effect of rock strength.
The number of joints affects the compressive strength of the rock. Both Wang et al. [12] and Wang et al. [13] used indoor uniaxial compression tests to study the influence of the number of joints on the compressive strength. Zhao et al. [14] used uniaxial compression experiments to study rock mechanics. Yang et al. [15], Meng et al. [16], Gao et al. [17], and Liu et al. [18] studied the influence of the number of joints on rock strength based on numerical simulations. Patel et al. [19] used compression experiments and numerical simulations to study the influence of stress paths on rock failure. Liu et al. [20] used RFPA2D to simulate the influence of the number of joints on the blasting effect of rock mass. Cao et al. [21] studied the influence of joint density on rock mass by a combination of indoor experiments and numerical simulations. Pan et al. [22] used numerical simulation and a uniaxial compression test to discuss the influence of joint density on rock burst. Whether from the perspective of laboratory tests or numerical simulations, scholars have carried out many studies on the influence of the number of joints on the compressive strength of rocks, but few of them involve the element of rock size effect.
The quantitative description of the size effect of rock strength is characterized by the characteristic size or REV, and the strength of the rock under the characteristic size is called the characteristic strength [23]. The number of joints has an important influence on the characteristic size and strength. Through case analysis, Gasmi et al. [24] proposed two representative characteristic sizes—geometric REV and mechanical REV, and classified REV. Some scholars have adopted different methods to evaluate the characteristic size. For example, Ying et al. [25], based on data collected on-site at the Magi dam site, proposed a method to estimate rock mass REV based on volumetric fracture strength (P32) and statistical tests. Loyola et al. [26] used the Central Limit Theorem (CLT) to evaluate the REV of fractured rock. Scholars have obtained the characteristic size mostly based on field data, theoretical models, and probability statistics. Cui et al. [27] estimated the characteristic size of the rock mass REV to be 50–60 m2, taking the Danba Hydropower Station as an example. Based on the size effect of a jointed rock mass, Chong et al. [28] estimated the REV size of the rock mass as 10 m × 10 m. Ma et al. [29] studied the size effect of rock mass strength by using 3DEC, and obtained the characteristic size of 4 × 4 × 8 m3. Liang et al. [30] studied the size effect of the uniaxial compressive strength (UCS) of a rock mass, and obtained a characteristic size of 14 m × 14 m. The acquisition of these characteristic sizes has particularity. Scholars have theoretically analyzed the factors that affect the characteristic size. For example, Niazmandi et al. [31] studied the impact of different constraints on REV based on the discrete fracture network–discrete element method (DFN-DEM). Chen et al. [32] studied the influence of rock mass (Bz) on REV. Although the above studies have obtained the characteristic sizes of rocks from different methods and theories, they have not studied them from the perspective of mathematical relationships. Few scholars have established mathematical models of the characteristic size and number of parallel joints (NPJ), and few scholars have established mathematical models of the characteristic strength and NPJs.
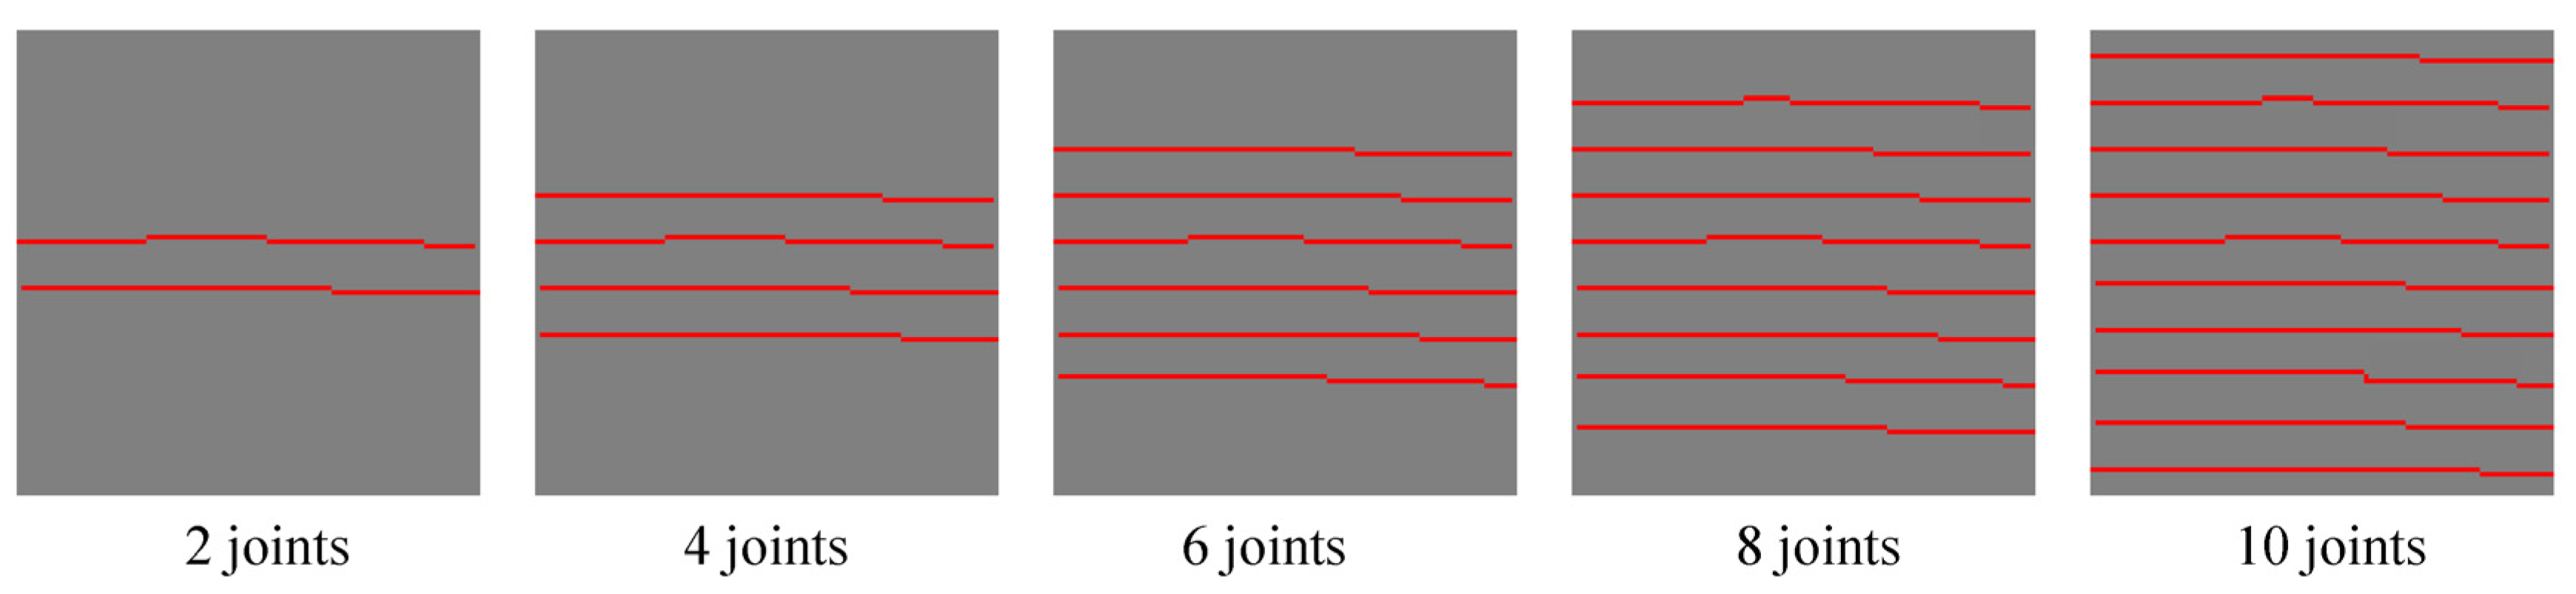
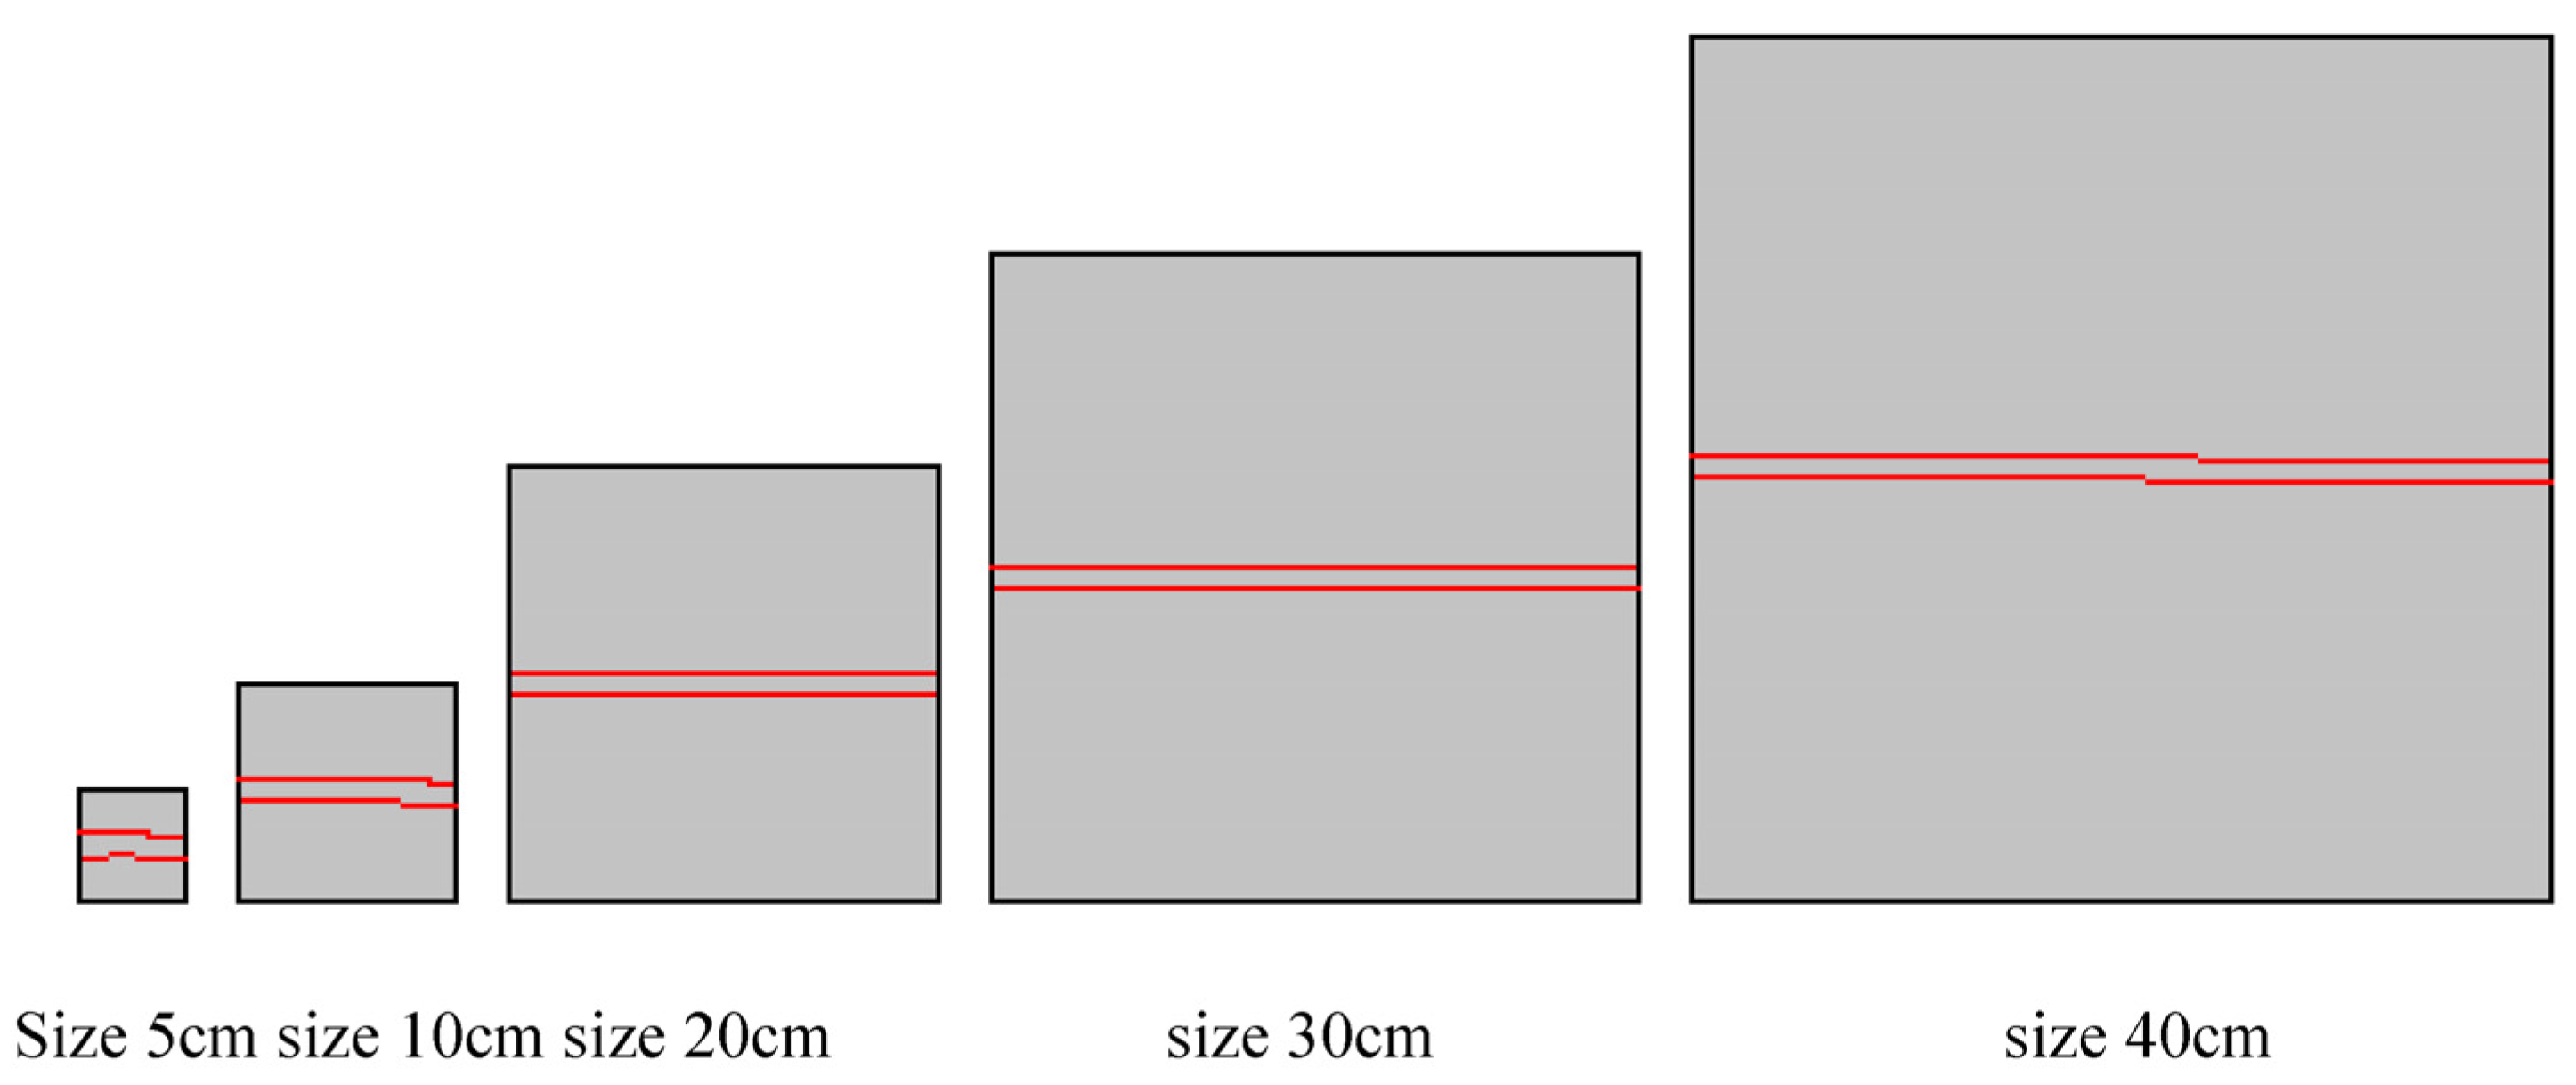
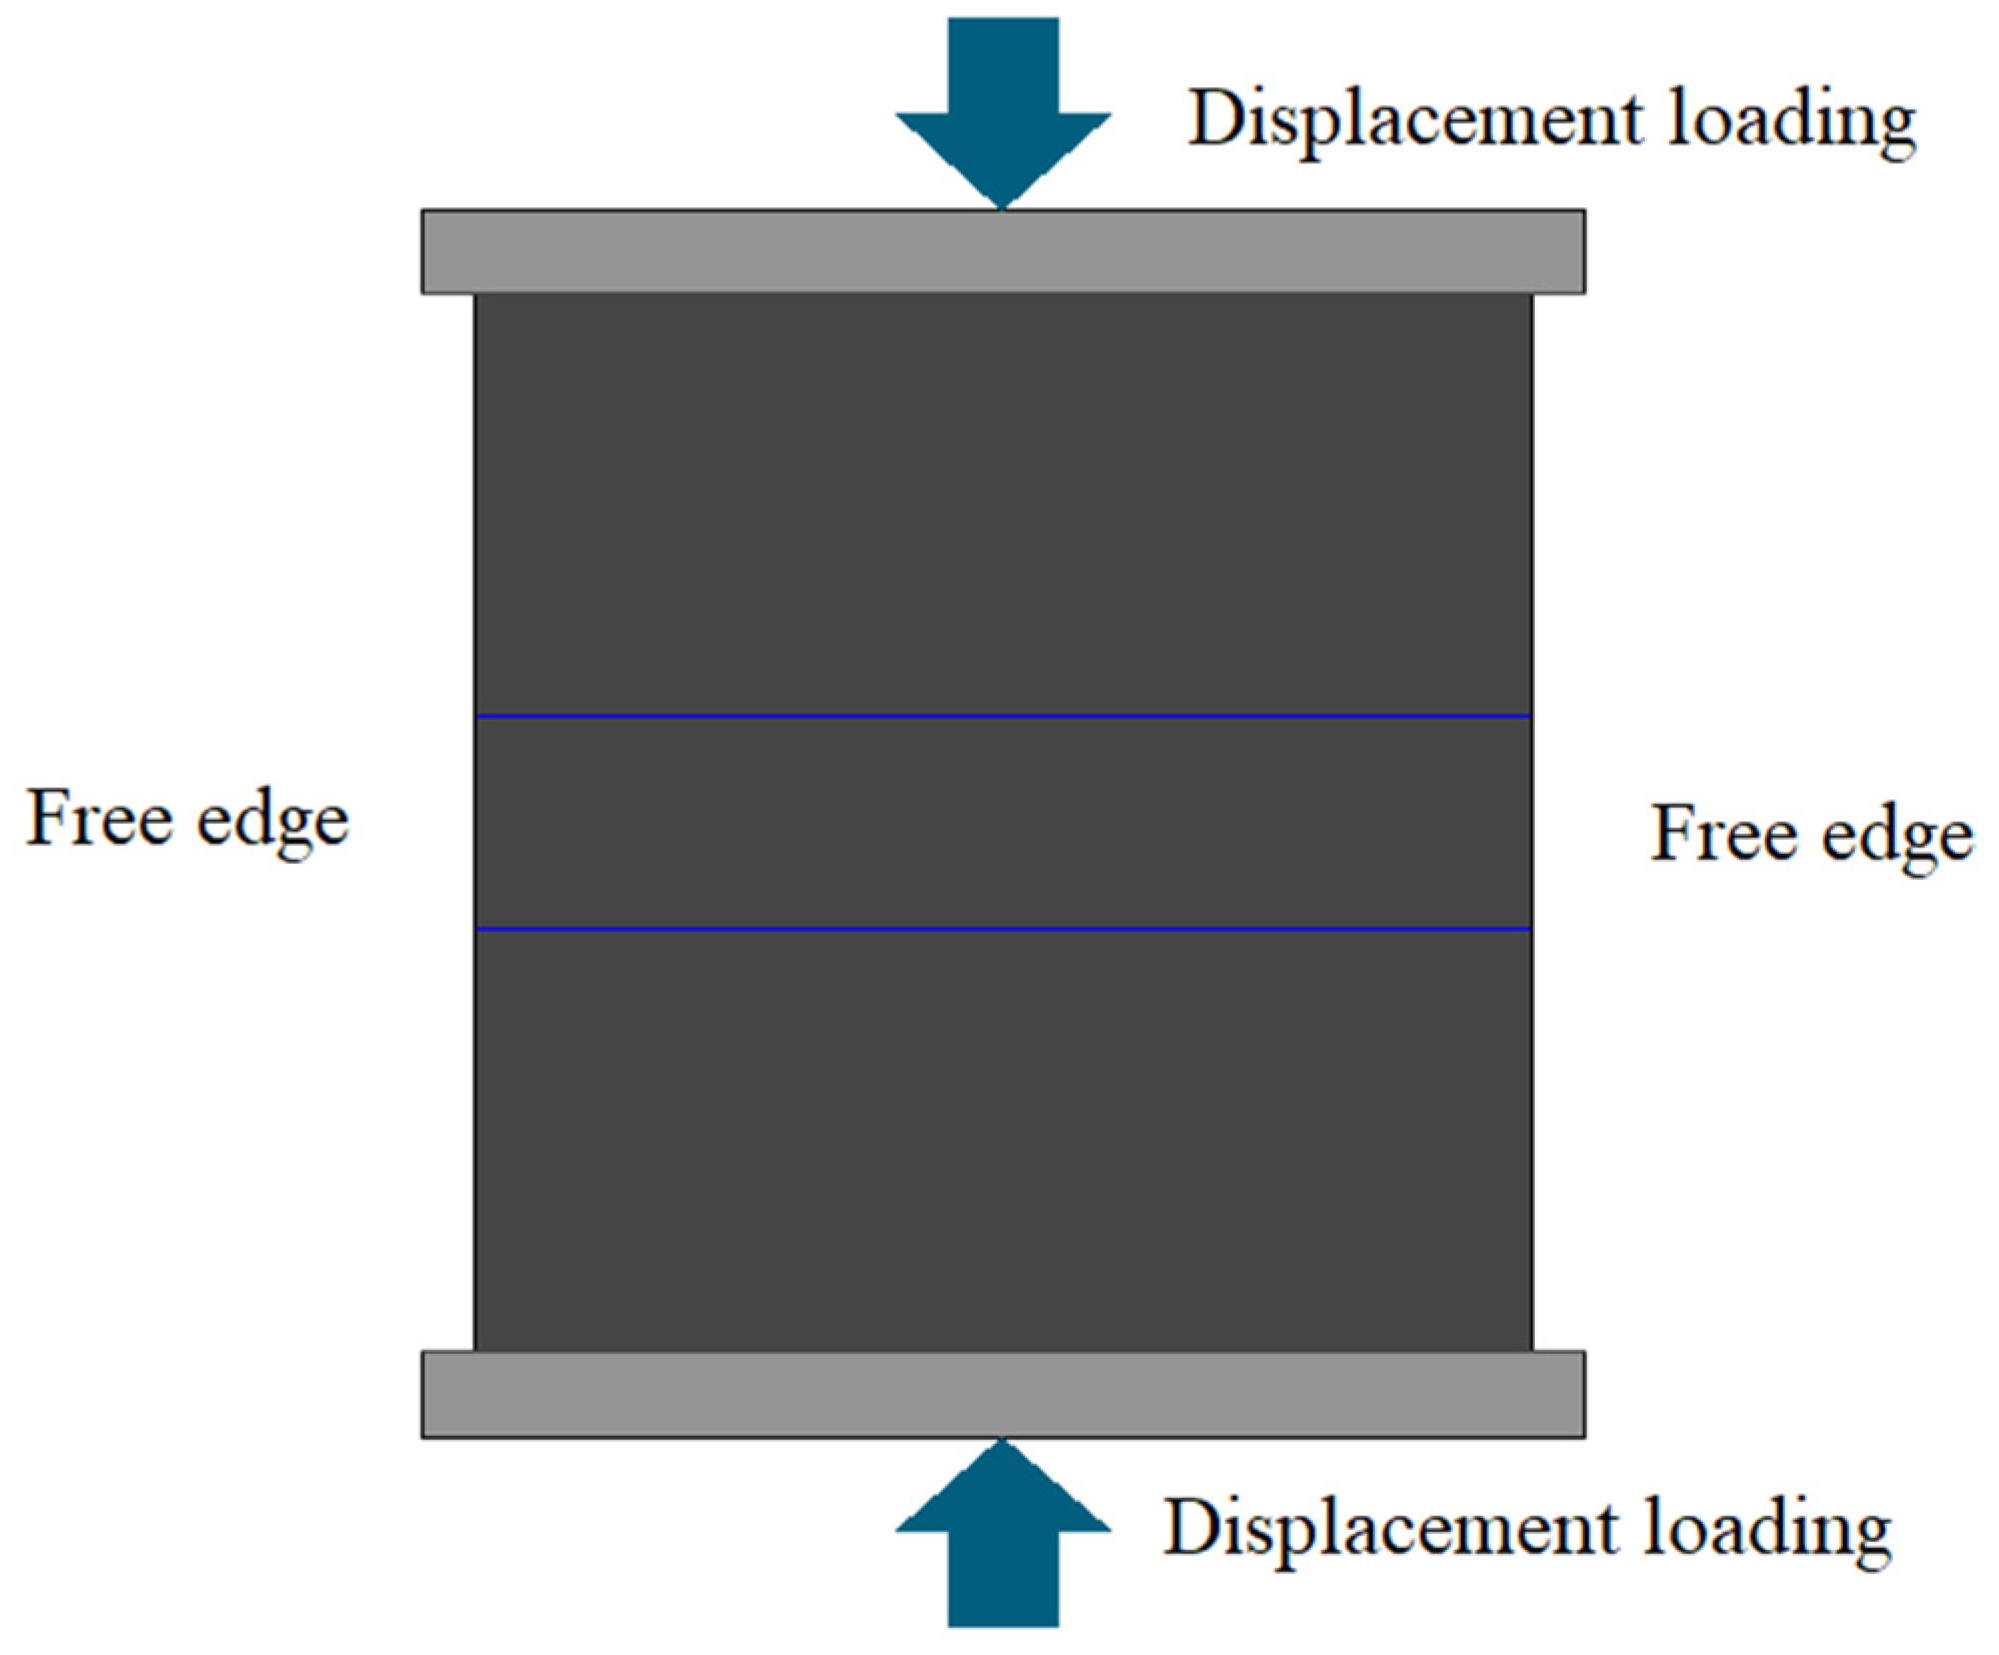
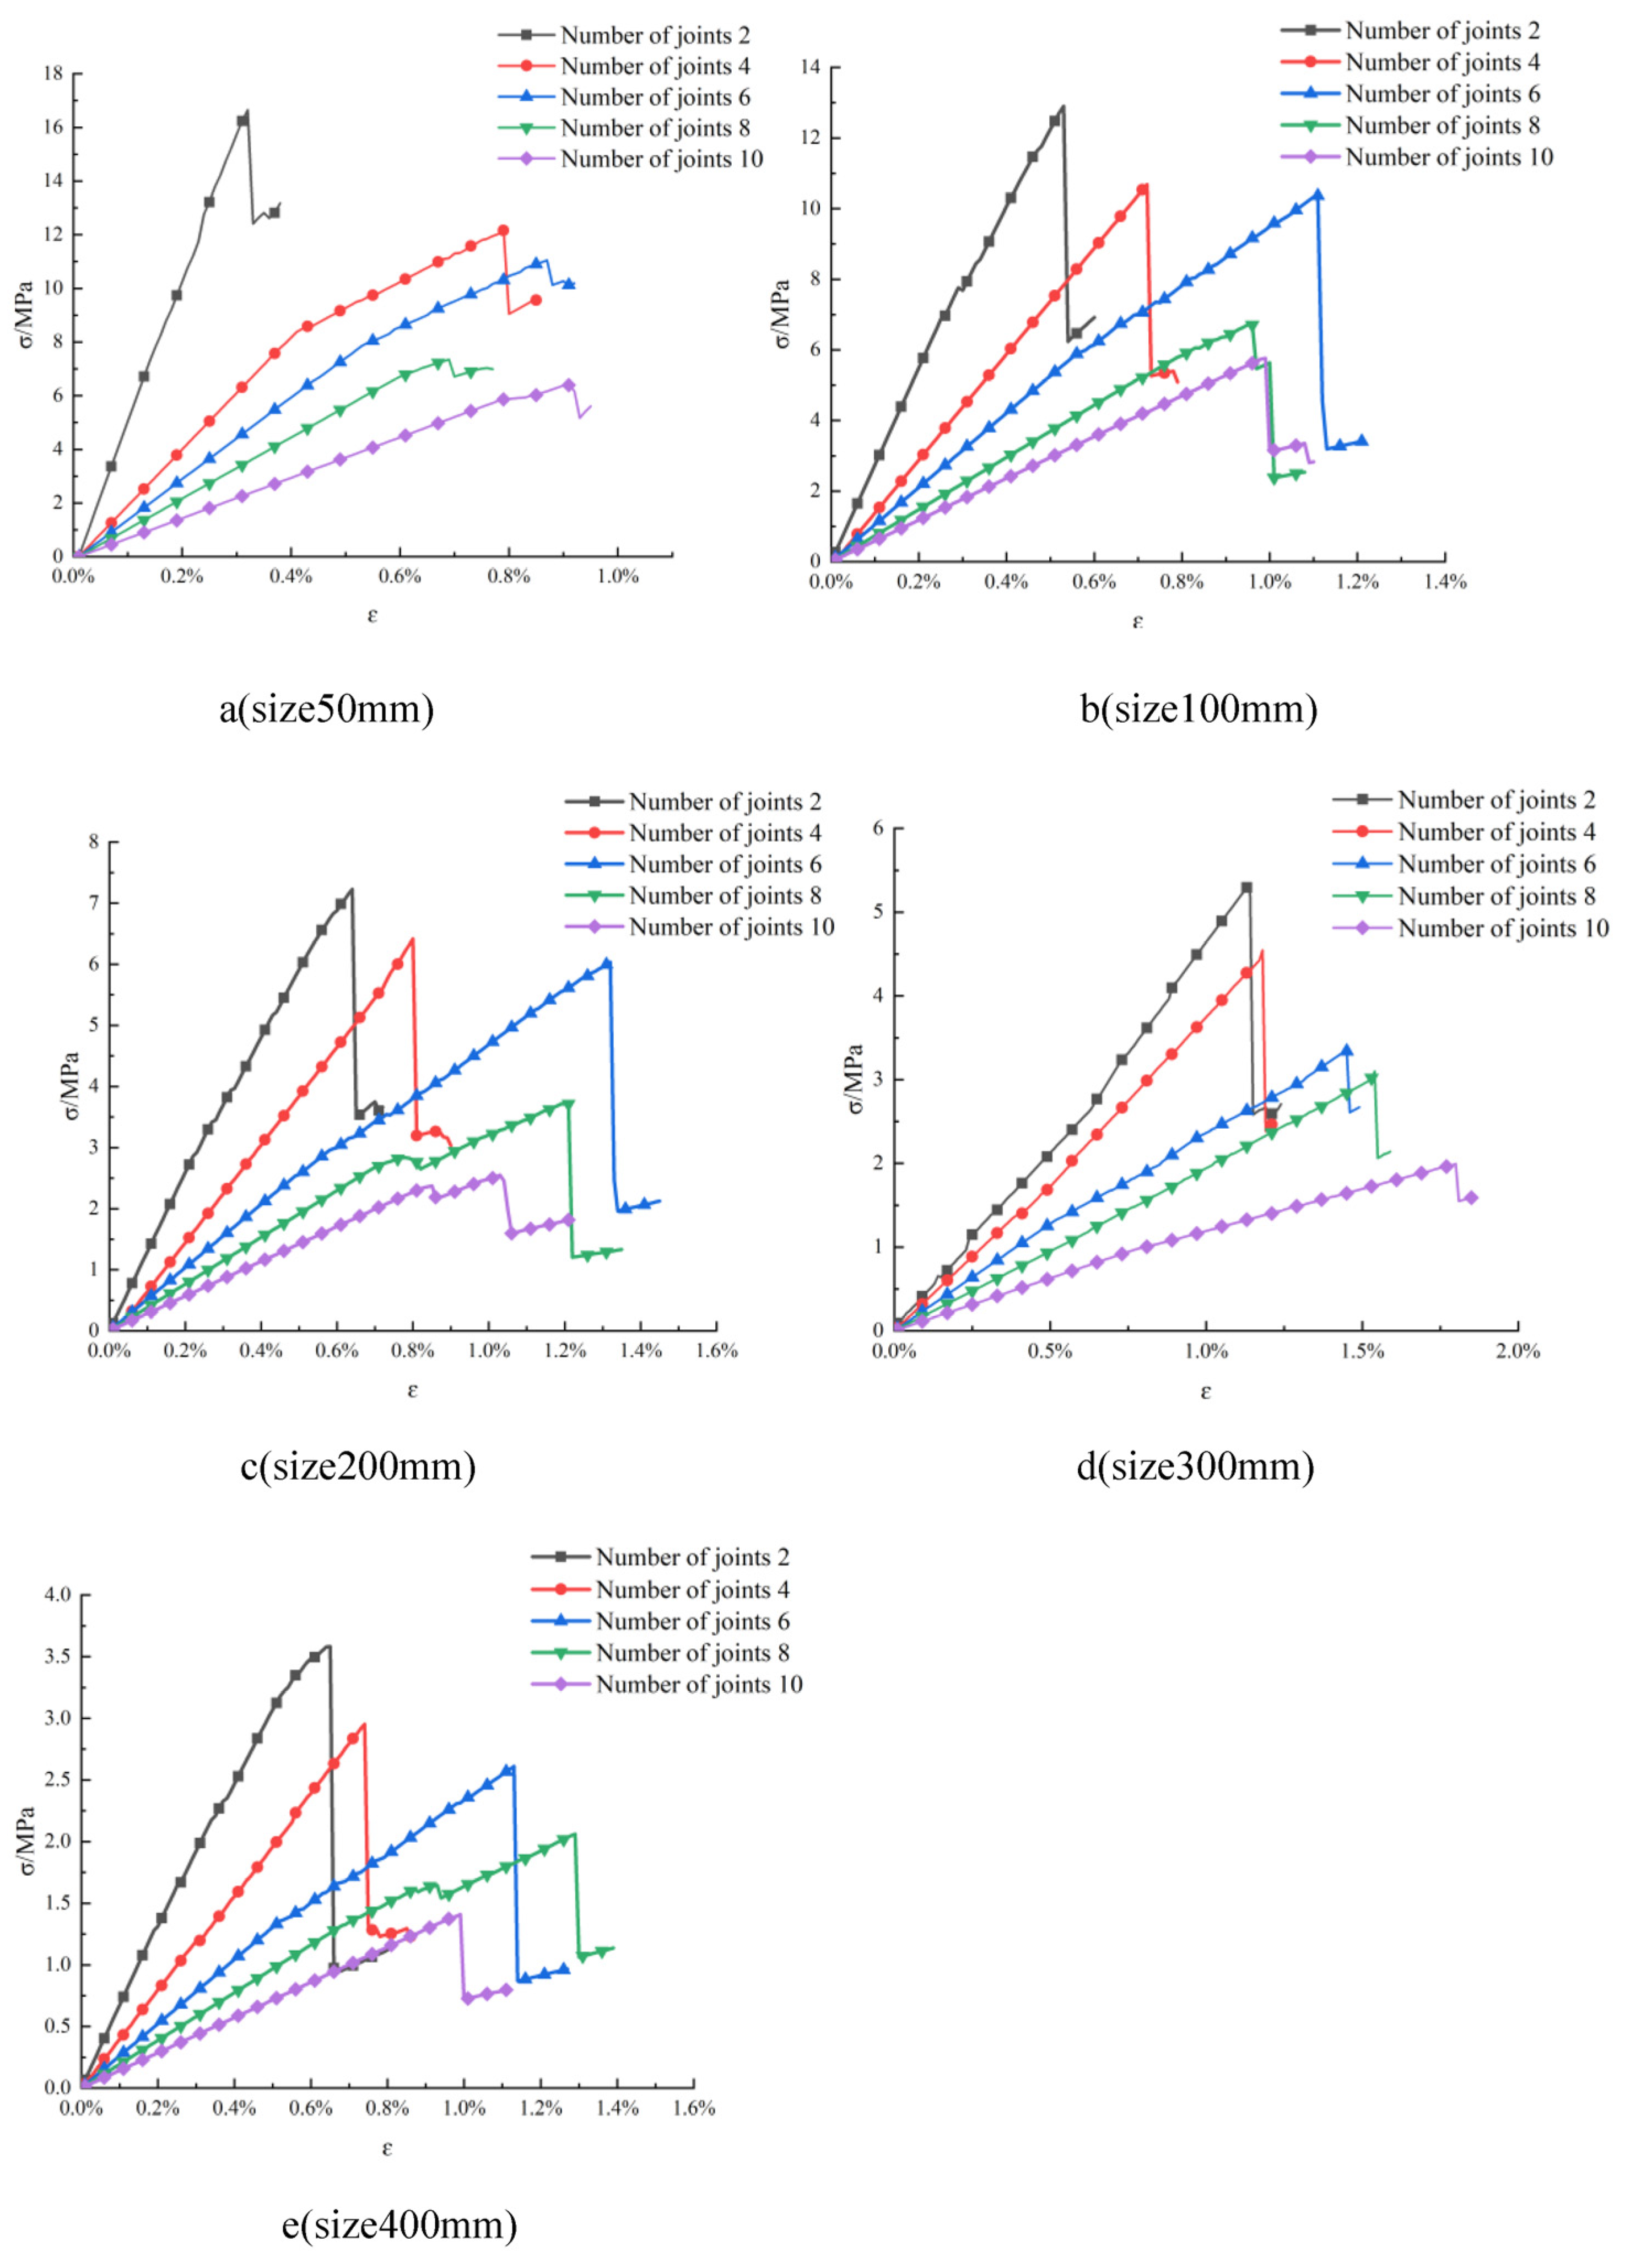
In this paper, numerical simulation methods are used to establish a numerical simulation program with different numbers of parallel joints and rock sizes. The paper studies the influence of the NPJs and rock size on UCS, and establishes a mathematical model of UCS and the NPJs and rock size. The paper establishes mathematical models of the characteristic size and strength of the rock and the NPJs. The paper obtains a method of solving the parameters under each mathematical model, which can provide a theoretical reference for engineering applications.

2. Establishment of Numerical Model

The software used in this simulation is RFPA, which employs a numerical calculation method for simulating inhomogeneous materials that have been developed based on finite element theory and statistical damage theory. The method accounts for the non-uniformity and randomness of materials and incorporates the statistical distribution assumptions of material properties into the finite element method. The mechanical properties of discretized meso-primitives are assumed to obey a certain statistical distribution law. Consequently, the relationship between meso-medium and macro-medium mechanical properties is established. The method is described by the Weibull statistical distribution function given by
φ ( α ) = m α 0 ( α α 0 ) m 1 e ( α α 0 ) m
where α is the basic element mechanical property parameters of the material medium (such as elastic modulus, strength, Poisson’s ratio, and weight, etc.), α0 is the average value of elementary mechanical property parameters, m is the property parameter of the distribution function, and its physical meaning reflects the uniformity of the material medium; φ(α) is the statistical distribution density of the material elementary mechanical properties.

2.1. Numerical Simulation Program and Model Establishment

The numerical simulation contains two research aspects. The first pertains to the influence of the NPJs on the UCS of the rock, and the second relates to the size effect on the UCS of the rock. For the first research aspect, five sets of numerical simulation programs were developed. The model sizes were 50 × 50 mm2, 100 × 100 mm2, 200 × 200 mm2, 300 × 300 mm2, and 400 × 400 mm2. Each set of simulation programs contained 5 types of NPJ conditions; the NPJs were 2, 4, 6, 8 and 10. Uniaxial compression numerical simulations were conducted under each working condition. For the second research aspect, five sets of numerical simulation programs with NPJs of 2, 4, 6, 8, and 10 were developed. Each set of simulation programs contained 5 types of model size working conditions; the model sizes were 50 × 50 mm2, 100 × 100 mm2, 200 × 200 mm2, 300 × 300 mm2, and 400 × 400 mm2. Uniaxial compression numerical simulations were performed under each working condition. The specific numerical simulation programs are summarized in Table 1.
A total of 25 numerical simulation models were formulated in this work. Due to the limited space, only a numerical simulation model (100 mm in size (Figure 1)) and another model with an NPJ of 2 (Figure 2) are presented as examples. Through these examples, the modeling process when the NPJs and size changed were introduced.
In rocks, the angle of parallel joints cannot always be 0°. In order to verify the universality of the formulas obtained, we established two sets of numerical simulation schemes with an angle of 45° as the comparison group, based on the original numerical simulation schemes. Each simulation program included 5 groups of working conditions. When the rock size was 100 mm, the working conditions with the NPJs of 2, 4, 6, 8, and 10 were set, as shown in Table 2. When the NPJ is 2, the rock sizes of 50, 100, 200, 300, and 400 mm were set, as shown in Table 3.

2.2. Boundary Conditions and Rock Parameters

2.2.1. Boundary Conditions and Loading Methods

The theoretical basis of the simulation was the rock uniaxial compression deformation theory. The mechanical model of the simulation test was a plane stress model, and the constraint condition was that the two sides of the model are free surfaces without force, and the upper surfaces of the model bear the load. The adopted loading method was displacement loading on both sides of the model. Numerical simulation adopted the displacement loading method. The displacement on both sides of the model was 0 mm, and the displacement on the upper and lower surfaces of the model was 0.01 mm. The loading method and boundary control are shown in Figure 3.

2.2.2. Rock Mechanical Parameters and Joint Parameter

In this study, the rock mechanical parameters were obtained through a geological survey of the slope rock mass of Zhang’ao Mine, which is in Zhang’ao Village, Shengzhou City, Zhejiang Province, China. The rock on the slope is tuff, with a particle size of 0.5–2 mm (mainly accounting for 80%); it is gray-white, with a vitroclastic texture and massive structure. It contains a small amount of volcanic breccia with a particle size of 2–20 mm, and the cement is volcanic tuff. The composition of the rock is mainly detritus (accounting for approximately 70%, angular shape, no sorting), containing a small amount of crystal fragments (accounting for approximately 20%, mainly feldspar, plate-like, with a small amount of visible quartz) and vitric fragments (accounting for approximately 10%, gray-black, bow-shaped). The pyroclastic tephra has a certain orientation. The rock surface is rough with joint development, and there is slight to moderate weathering. The process of obtaining the parameters of the rock was as follows: first, the rock resilience measurement, structural surface measurement, and rock mass classification of the slope rock were carried out to determine the UCS and rock mass grade. Then, the rock mechanical parameters (e.g., elastic modulus, Poisson’s ratio, friction angle) were evaluated. The elastic modulus of the rock used in the numerical simulation was 4874 MPa, Poisson’s ratio was 0.25, compressive strength was 101.34 MPa, cohesion was 1.2 MPa, friction angle was 48.32°, and density was 2600 g/cm3. The elastic modulus of the joint used in the numerical simulation was 1.1 MPa, Poisson’s ratio was 0.3, compressive strength was 1.5 MPa, friction angle was 30°, and JRC value was 2. The mechanical parameters of the rock and joint are shown in Table 4.

3. Numerical Simulation Results and Analysis

3.1. Influence of NPJs on the UCS

3.1.1. Analysis of Stress–Strain Curve with Different NPJs

For each simulation program of the first research focus, the numerical simulation results under each working condition were output, and the stress–strain curve was drawn; the same coordinate system was used for all curves. Summary diagrams of the stress–strain curves considering different NPJs for each simulation program were obtained, as shown in Figure 4.
According to the stress–strain curve under each working condition, the UCS of the rock was explored, as summarized in Table 5.
Considering that the curves followed the same law, only one of the graphs was selected as an example. The curve with two joints in Figure 4a was selected to analyze the stress–strain law. Figure 4a shows that the stress increases linearly with the increase in strain, and the model is in the elastic compaction stage. When the stress increases to 16.644 MPa, the linear change ends, and the curve value suddenly decreases to 12.412 MPa. Then, as the strain increases, the stress fluctuates around 12.412 MPa. This shows that the failure process of the rock begins with elastic deformation and ends with brittle failure. Although there is still a period of fluctuation after failure, the rock has generally failed.
The analysis of the influence of the NPJ on the UCS of the rock is also based on Figure 4a. Figure 4a and Table 5 show that when the model size is 50 mm, as the number of joints increases from 2 to 10, and the peak strength of the rock gradually decreases from 16.644 to 6.392 MPa. The law that the compressive strength of the rock decreases as NPJ increases is obtained. In the same way, the sizes of 100, 200, 300, and 400 mm also obtain the same law, which shows that the NPJ affects the UCS of the rock. The main reason for this phenomenon is that as the NPJ increases, the failure surface of the rock is gradually superimposed, and the UCS is weakened to varying degrees.
We next analyzed the influence of rock size on the UCS of the rock. Figure 4 and Table 5 show that when the NPJ is 2, as the size of the rock increases from 50 to 400 mm, the peak strength decreases from 16.644 to 3.582 MPa. The law that the strength of the rock decreases with the increase in rock size is obtained. In the same way, the same rule is obtained when the NPJ is 4, 6, 8, and 10. This shows that the size of the rock has an important influence on the UCS, i.e., the UCS has a size effect.
Similarly, when the rock size is the same, the UCS decreases with the increase in the number of joints. When the NPJ is the same, but the rock size increases, the UCS shows a decreasing trend.

3.1.2. Fitting Method of Relationship between UCS and NPJs

The statistics listed in Table 5 show that as the NPJ increases, the UCS gradually decreases. A scatter diagram of the UCS and the NPJ in each numerical simulation program was drawn. Then, according to the scatter diagram, the fitting curve of the UCS and NPJ was drawn, as shown in Figure 5.
The fitting curve in Figure 5 indicates that when the NPJ increases, but the rock size remains the same, the UCS gradually decreases. Moreover, in spite of the different sizes of the rock, the changing law is similar. However, when the size is different, the decrease rate of the UCS is different. The decreasing rates of compressive strength of different sizes are 1.266, 0.912, 0.603, 0.404, and 0.262. This shows that not only is the compressive strength of the rock with joints related to the NPJ, but the size of the rock is also related. In other words, the strength of rocks with different NPJs has a size effect.
Under the same conditions, numerical simulations were performed on rocks with sizes of 100, 200, 300, and 400 mm, and the fitting relationship between the UCS and NPJ was obtained, as shown in Table 6.
The fitting formula in Table 6 indicates that the UCS and NPJs have a satisfactory fit, providing a means for quantitatively analyzing them for engineering practice.

3.1.3. Formulation of a Mathematical Model of UCS and NPJ

Relationship between UCS and NPJ

The function types of formulas were analyzed according to the formulas between rock UCS and the NPJ under different sizes in Table 6; the relationship of UCS and NPJ was proposed as follows:
σ ( n ) = a n + b
where σ(n) is the UCS of the rock when the NPJ is n, units: MPa, n is the NPJ, units: bar, and a and b are parameters to be determined, when n→0, σ(n) = b, which represents the average value of the elementary strength of the rock.
The relationship between the UCS and the NPJ is given by Equation (2), which contains parameters a and b. When a and b have been determined, the number of arbitrary parallel joints and UCS can be obtained.

Solving Method for Parameter a and b

The statistics listed in Table 6 show that the parameter is related to the rock size, and the parameters under each rock size are summarized in Table 7.
Based on the data in Table 7, the rock size and parameter were considered as abscissa and ordinate to plot their scatter diagram. Then, based on this diagram, parameters a, b and the rock size were fitted, as shown in Figure 6 and Figure 7.
According to the fitting curves in Figure 6 and Figure 7, the relationships between parameters a, b and rock size were as follows:
a = 0.163 + 1.488 e 0.0063 l
b = 1.489 + 22.1376 e 0.0053 l
where a and b are parameters, and l is the size of the rock.

Mathematical Model between UCS and NPJ

The mathematical model of parameters and rock size was substituted into the mathematical model of UCS and NPJ. Accordingly, the mathematical model of UCS and NPJ was derived as:
σ ( n ) = ( 22.137 1.488 n e 0.001 l ) e 0.0053 l 0.163 n + 1.489
where σ(n) is the UCS when NPJ is n, units: MPa; n is the NPJ, units: bar; l is the rock size, units: mm.
The derived mathematical model of UCS and rock size can be applied to engineering rocks with parallel joints. It provides guidance and a method to quantitatively analyze the relationship between rock size and UCS for engineering practice.

3.2. Influence of Rock Size on the UCS

3.2.1. Analysis of Stress–Strain Curves Considering Different Rock Sizes

For each simulation program of the second research focus, the numerical simulation results under each working condition were output, and the stress–strain curve was drawn; the same coordinate system was used for all curves. Summary diagrams of the stress–strain curves considering different rock sizes for each simulation program were obtained, as shown in Figure 8.
According to the stress–strain curve under each working condition, the UCS of the rock was explored, as summarized in Table 8.
Considering that the curves followed the same law, only one of the graphs was selected as an example. The curve of the rock size of 50 mm in Figure 8a was selected as an example to analyze the stress–strain law. When the stress is small, the stress–strain curve is approximately a straight line. When the stress continues to increase to 16.644 MPa, the curve suddenly drops to 12.412 MPa, and then, as the strain increases, the stress fluctuates around 12.412 MPa. This shows that a process is required for the failure of the rock. Firstly, compaction occurs inside the rock. Secondly, the rock reaches its peak strength and finally breaks down. When the curve drops to 12.412 MPa, as the strain increases, the strength is basically unchanged. The curves all fluctuate around 12.412 MPa, at which time the rock has failed.
We next analyzed the influence of rock size on the UCS of the rock. Figure 8a and Table 8 show that when the NPJ is 2, as the size of the rock increases from 50 to 400 mm, the peak strength decreases from 16.644 to 3.582 MPa. The law is that the strength of the rock decreases with the increase in rock size. In the same way, the same law is obtained when the NPJ is 4, 6, 8, and 10. This shows that the size of the rock has an important influence on the UCS, and strength of the rock has a size effect.
We next analyzed the influence of the number of joints on the UCS of the rock. Figure 8 and Table 8 show that when the model size is 50 mm, as the number of joints increases from 2 to 10, the peak strength of the rock gradually decreases from 16.644 to 6.392 MPa. The law is that the compressive strength of the rock decreases as the NPJ increases. In the same way, the sizes of 100, 200, 300, and 400 mm also achieve the same law, which shows that the NPJ affects the UCS of the rock.
Similarly, when the number of joints is the same, the UCS decreases with the increase in the size of rock. When the size of the rock is the same, the UCS of the rock tends to decrease as the NPJ increases.

3.2.2. Fitting Method of Relationship between UCS and Rock Size

The statistics listed in Table 8 show that as the size of the rock increases, the UCS gradually decreases. A scatter diagram of the UCS and rock size in each numerical simulation program was drawn. Then, according to the scatter diagram, the fitting curve of the UCS and rock size was drawn, as shown in Figure 9.
The fitting curve in Figure 9 indicates that when the size increases, but the NPJ remains the same, the UCS gradually decreases. Finally, it tends to remain a certain fixed value. Rocks with different NPJs have the same changing law. However, when the number of joints is different, the rate of decrease in the compressive strength of the rock is different. As the NPJ increases, the rate of the decrease in UCS gradually decreases. This shows that the UCS is related not only to the size of the rock, but also the NPJ. In other words, the strength of the rock with different NPJs has a size effect.
Under the same conditions, numerical simulations were performed on the rocks with joint numbers of 4, 6, 8, and 10, and the fitting relationships between the UCS and the size of the rock were obtained, as shown in Table 9.
The fitting formula in Table 9 indicates that the UCS and the rock size have a satisfactory fit, providing a means for quantitatively analyzing them for engineering practice.

3.2.3. Formulation of a Mathematical Model of UCS and Rock Size

Relationship between UCS and Rock Size

The function types of formulas were analyzed according to the formula between UCS and rock size under different NPJs in Table 9. A relationship between UCS and size of rock was proposed as follows:
σ ( l ) = d + f e g l
where σ(l) is the UCS when the rock size is l. units: MPa, l is the rock size, units: mm. d, f, and g are parameters, when l→∞, σ(∞) = d, which represents the characteristic strength of the rock when l→0, σ(0) = d + f, which represents the average value of the elementary strength of the rock.
The relationship between the UCS and rock size is given by Equation (6), which contains parameters d, f, and g. When d, f, and g have been determined, the relationship between rock size is arbitrary and UCS will be obtained.

Solving Method for Parameters d, f, and g

The statistics listed in Table 9 show that the parameter is related to the number of rock joints, and the parameters under each NPJ are summarized in Table 10.
According to the data in Table 10, the number of joints and parameters were taken as the abscissa and ordinate to plot their scatter diagram. Then, based on this diagram, the parameters d, f, and g and the NPJs were fitted, as shown in Figure 10, Figure 11 and Figure 12.
According to the fitting curves in Figure 10, Figure 11 and Figure 12, the relationships between parameters d, f, and g and the NPJs were as follows:
d = 0.149 n + 2.674
f = 1.534 n + 22.520
g = 4.285 × 10 4 n + 0.004
where d, f, and g are parameters, and n is the NPJ.

Mathematical Model between UCS and Rock Size

The mathematical model of the parameters and NPJ was brought into the mathematical model of the UCS and rock size. Accordingly, the mathematical model of the UCS and rock size was obtained:
σ ( l ) = ( 1.534 n + 22.52 ) e ( 4.285 × 10 4 + 0.004 ) l 0.149 n + 2.674
where σ(l) is the UCS when the rock size is l, units: MPa; n is the NPJs, units: bar; l is the rock size, units: mm.
The derived mathematical model of UCS and rock size can be applied to engineering rocks with parallel joints. It provides guidance and a method to quantitatively analyze the relationship between rock size and UCS for engineering practice.

3.3. Formulation of Mathematical Model of Rock Characteristic Size, Characteristic Strength, and NPJs

3.3.1. Derivation of the Formula of Characteristic Size of Rock

In statistics, events with a probability of less than 5% are usually referred to as “impossible events”. Through the method of mathematical significance testing, the rock feature size can be determined more accurately and be applied easily to engineering applications.
The quantitative calculation of characteristic size has been described in detail in the literature [30] based on physical and mechanical experiments and statistical distribution theory of meso-parameters. According to the research ideas in the literature [30], the absolute value of the slope of the curve was obtained by deriving the two sides of Equation (6).
| k | = | g f e ( g l ) |
| k | γ
l ln ( g f ) ln γ g
where γ is the acceptable absolute value of the slope, which can be a very small value. If the approval curve can be close to the level and meet the engineering requirements, it is considered that Equation (13) is the formula for solving the characteristic size.

3.3.2. Formulation of a Mathematical Model of Characteristic Size and the NPJ

According to the F-test and T-test in probability statistics, when the NPJ is 2, 4, 6, 8, 10, the characteristic size of the rock can be obtained by Formula (13), as shown in Table 11.
Table 11 shows that the characteristic size of the rock decreases with the gradual increase in the NPJ. The law qualitatively analyzes the relationship between the NPJ and the characteristic size of the rock.
According to the data in Table 11, the NPJ and characteristic size were taken as the abscissa and ordinate to plot a scatter diagram. The fitting curve of the characteristic size and the NPJ was drawn, as shown in Figure 13.
Figure 13 shows that the characteristic size decreases linearly with the increase in the NPJ. The NPJ has an important influence on the characteristic size. Therefore, when the rock with joints is evaluated, the influence of the NPJ on the rock should be paid special attention. The form of the fitting curve was analyzed, and the relationship between the characteristic size and the NPJ was a linear function. The formula for the characteristic size and the NPJ was derived as follows:
L ( n ) = 63.377 n + 1218.46
where L(n) is the characteristic size of the rock, units: mm; n is the NPJ, units: bar.
Equation (14) provides a quantitative description of the relationship between the characteristic size and NPJ. In engineering, if the NPJ of the rock can be measured, then the characteristic size can be obtained more accurately by Formula (14), which has important practical value in engineering.

3.3.3. Formulation of a Mathematical Model of Characteristic Strength and the NPJ

The statistical data listed in Table 12 show that when the NPJ increases from 2 to 10, the characteristic strength of the rock decreases from 2.38 to 1.12 MPa. The law that the characteristic strength decreases with the increase in the NPJ is obtained. In actual engineering, the characteristic strength is obtained by measuring the NPJ, which is of great significance for guiding engineering design, construction, and operation.
According to the data in Table 12, the NPJ and characteristic strength were taken as the abscissa and ordinate to plot a scatter diagram. The fitting curve of rock characteristic strength and the NPJ was drawn, as shown in Figure 14.
Figure 14 shows that the characteristic strength of the rock shows a decreasing trend with the increase in the NPJ, which shows that the NPJ has an important influence on the characteristic strength. The relationship between the characteristic strength and the NPJ was a linear function. The formula for the characteristic strength and the NPJ was derived as follows:
σ w ( n ) = 0.155 n + 2.79
where σ w ( n ) is the characteristic strength of the rock, units: MPa; n is the NPJ, units: bar.
Equation (15) provides a quantitative description of the relationship between the characteristic strength and NPJ. In engineering, if the NPJ of the rock can be measured, the characteristic strength can be calculated more accurately by Formula (15), which has important value for the investigation and design in the early stage of a project.

3.4. Verification Program

3.4.1. Analysis of Verification Program 1

Equation (2) is the formula when the specific parallel joint angle is 0. When the parallel joint angle changes, in order to verify the general applicability of Equation (2), a set of comparative numerical simulation schemes with the parallel joint angle of 45° is added deliberately to the study. According to the numerical simulation results, the stress–strain curves of rocks with different NPJs were drawn, as shown in Figure 15.
Comparing Figure 15 with Figure 4b, when the angle of parallel joints changes from 0° to 45°, the stress–strain curve with NPJ changes significantly. By analyzing the curve with the NPJ of 2, the stress–strain curve changes from relatively smooth to a greater degree of fluctuation. This shows that the inclination angle of parallel joints influences the compressive strength of the rock.
According to the stress–strain curve in Figure 15, the UCS of the rock under each working condition is solved when the parallel joint angle is 45°. At the same time, in order to facilitate data comparison and analysis, the data values of different NPJs with a rock size of 100 mm in Table 5 were extracted, and they are shown in Table 13. According to the data in Table 13, a scatter plot of the UCS and the NPJs were drawn, and their fitting curves were drawn, as shown in Figure 16.
Figure 16 and Table 13 show that when the parallel joint angle is 0°, as the NPJ increases from 2 to 10, the UCS gradually decreases from 12.897 to 5.759 MPa. Similarly, when the parallel joint angle is 45°, as the NPJ increases from 2 to 10, the UCS gradually decreases from 8.122 to 2.248 MPa. These two sets of data manifest the law wherein as the NPJ increases, the UCS gradually decreases.
The difference between the two fitting curves in Figure 16 is that when the parallel joint angle changes from 0° to 45°, the UCS decreases. This shows that the parallel joint angle has an obvious influence on the UCS, and different NPJs obey this rule. Figure 16 also shows that when the parallel joint angle is 45°, the slope of the straight line is 0.692, which is significantly lower than the straight line slope of 0.912 when the parallel joint angle is 0°. This shows that the law of the influence of different joint angles on the UCS and the NPJ is consistent.
Figure 16 also shows the relationship between the rock UCS and the NPJ when the parallel joint angle is 45°:
σ ( n ) = 0.692 n + 9.718
The function type of Formula (16) conforms to the mathematical model proposed in Formula (2). Therefore, when the angle of parallel joints changes, Formula (2) is still applicable. This shows that the mathematical model proposed in Formula (2) is applicable to the UCS with different angles of parallel joints

3.4.2. Analysis of Verification Program 2

Equation (6) is the formula when the specific parallel joint angle is 0. When the parallel joint angle changes, in order to verify the general applicability of Formula (6), a set of comparative numerical simulation schemes with the parallel joint angle of 45° was added deliberately in the study. According to the numerical simulation results, the stress–strain curves of different sizes of rocks were drawn, as shown in Figure 17.
Comparing Figure 17 with Figure 8b, when the angle of parallel joints changes from 0° to 45°, the stress–strain curve law of different rock sizes changes greatly. By analyzing the curve with a rock size of 100 mm, it is found that when the parallel joint angle is 45°, the peak failure position of the stress–strain curve of the rock becomes gentle. This shows that the inclination angle of parallel joints has a great influence on the compressive strength of the rock.
According to the stress–strain curve in Figure 17, the UCS under each working condition is solved when the parallel joint angle is 45°. In order to facilitate data comparison and analysis, the data values of different rock sizes when the NPJ is 2 were extracted from Table 8, and they are shown in Table 14. Based on the data in Table 14, a scatter plot of UCS and rock size was drawn, and their fitting curves were drawn, as shown in Figure 18.
Figure 18 and Table 14 show that when the parallel joint angle is 0°, as the size of the rock increases from 50 to 400 mm, the peak strength of the rock gradually decreases from 16.644 to 3.582 MPa. Similarly, when the parallel joint angle is 45°, as the size of the rock increases, the peak strength of the rock gradually decreases from 10.728 to 1.241 MPa. These two sets of data demonstrate the law wherein the UCS decreases with the increase in rock size. This law does not change with the angle change. However, the parallel joint angle changes from 0° to 45°, and the strength of the rock is obviously weakened.
The difference between the two fitting curves in Figure 18 is that when the parallel joint angle changes from 0° to 45°, the UCS decreases. This shows that the parallel joint angle of different rock sizes has an obvious influence on the UCS, and rocks of different sizes obey this rule. Figure 18 also shows that when the parallel joint angle is 45°, as the size of the rock increases, the UCS decreases in a negative exponential function. The same conclusion is obtained when the parallel joint angle is 0°. This shows that different parallel joint angles have the same influence on the rock UCS. However, the curve when the parallel joint angle is 45° is significantly lower than the curve when the parallel joint angle is 0°. This shows that the parallel joint angle weakens the UCS of the rock.
Figure 18 also shows the relationship between the UCS and rock size when the parallel joint angle is 45°:
σ ( l ) = 1.57 + 24.521 e 0.0198 l
The function type of Formula (17) conforms to the mathematical model proposed in Formula (6). Therefore, when the angle of parallel joints changes, Formula (6) is still applicable. This shows that the mathematical model proposed in Formula (6) is applicable to the UCS with different angles of parallel joints.

4. Discussion

The NPJ and rock size have an impact on the UCS, characteristic size, and characteristic strength of the rock; however, this relationship is yet to be obtained. This paper establishes four mathematical relationships: (i) UCS and NPJ, (ii) UCS and rock size, (iii) rock characteristic size and NPJ, (iv) rock characteristic strength and NPJ. Through the establishment of four mathematical models, the relationships between the UCS and rock size and NPJ were quantified. The relationships between the characteristic size, characteristic strength, and the NPJ were quantified. The results obtained have important scientific significance in engineering. When the NPJ or rock size at the engineering site are obtained, the UCS, characteristic size, and characteristic strength of the rock can be quickly obtained, which has significance for engineering applications. Below, we list the differences between them and consider the existing research from the perspective of mathematical relationships.
(i)
The relationship between UCS and NPJ
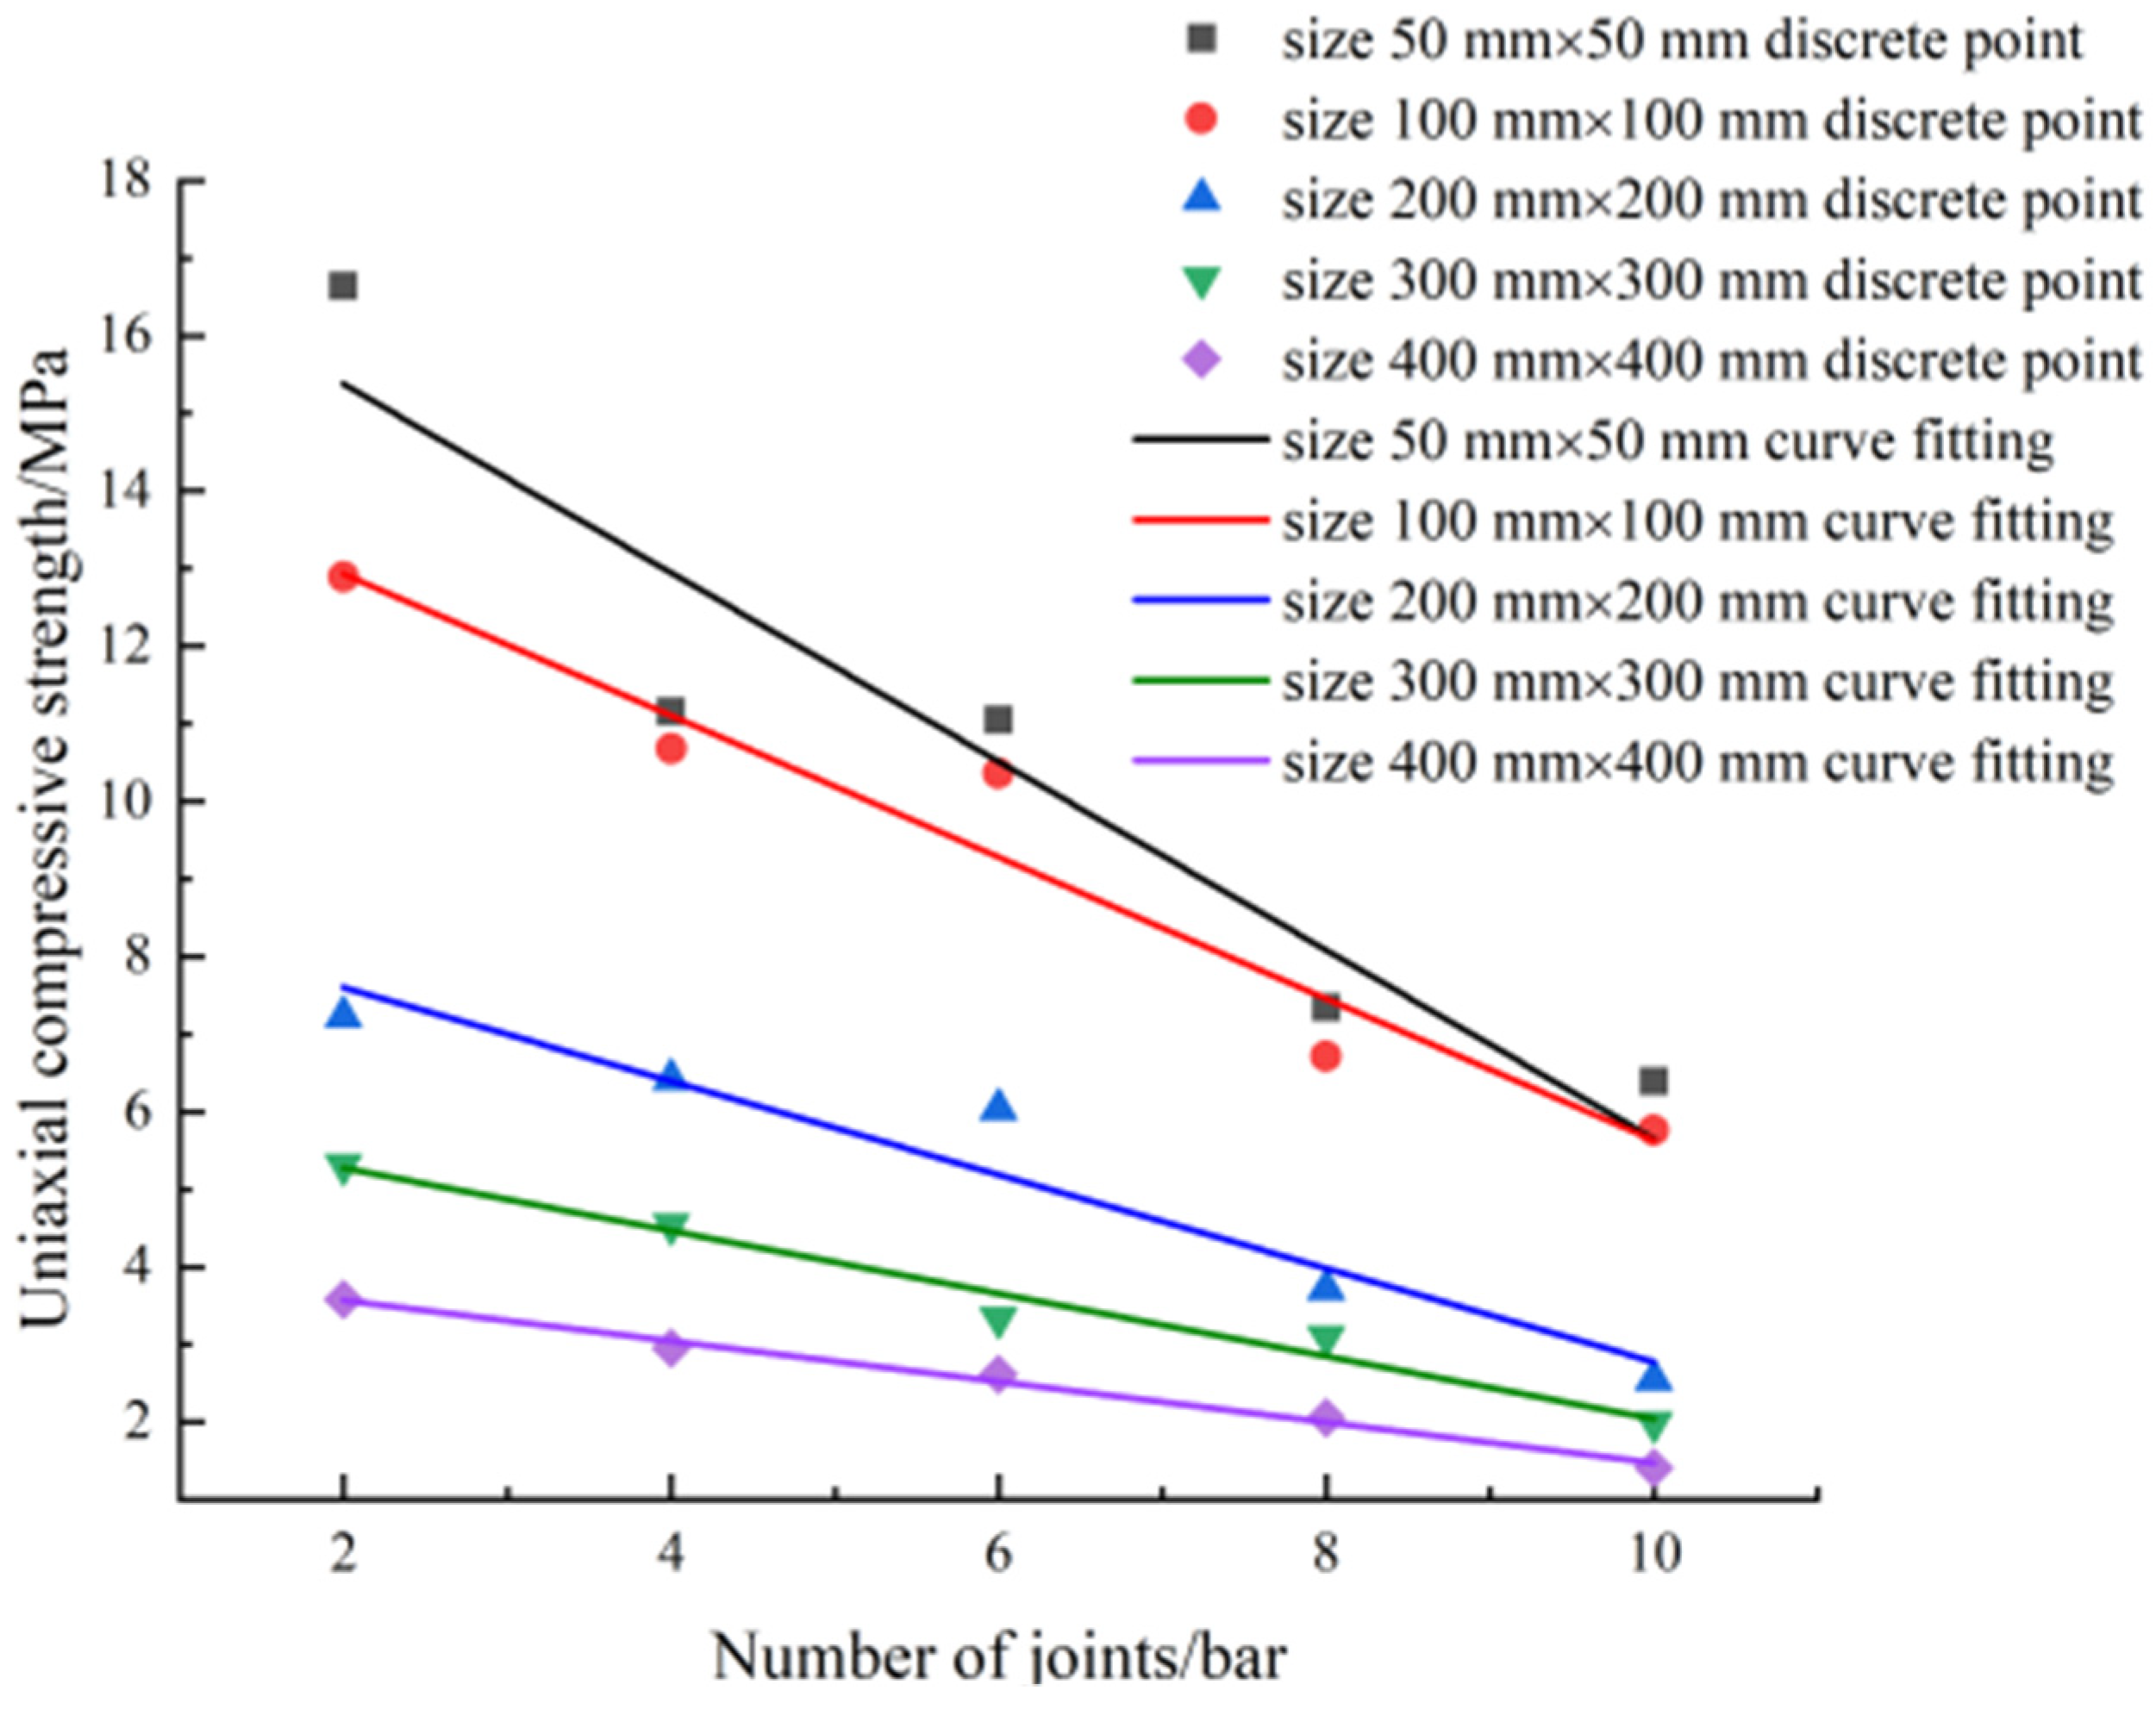
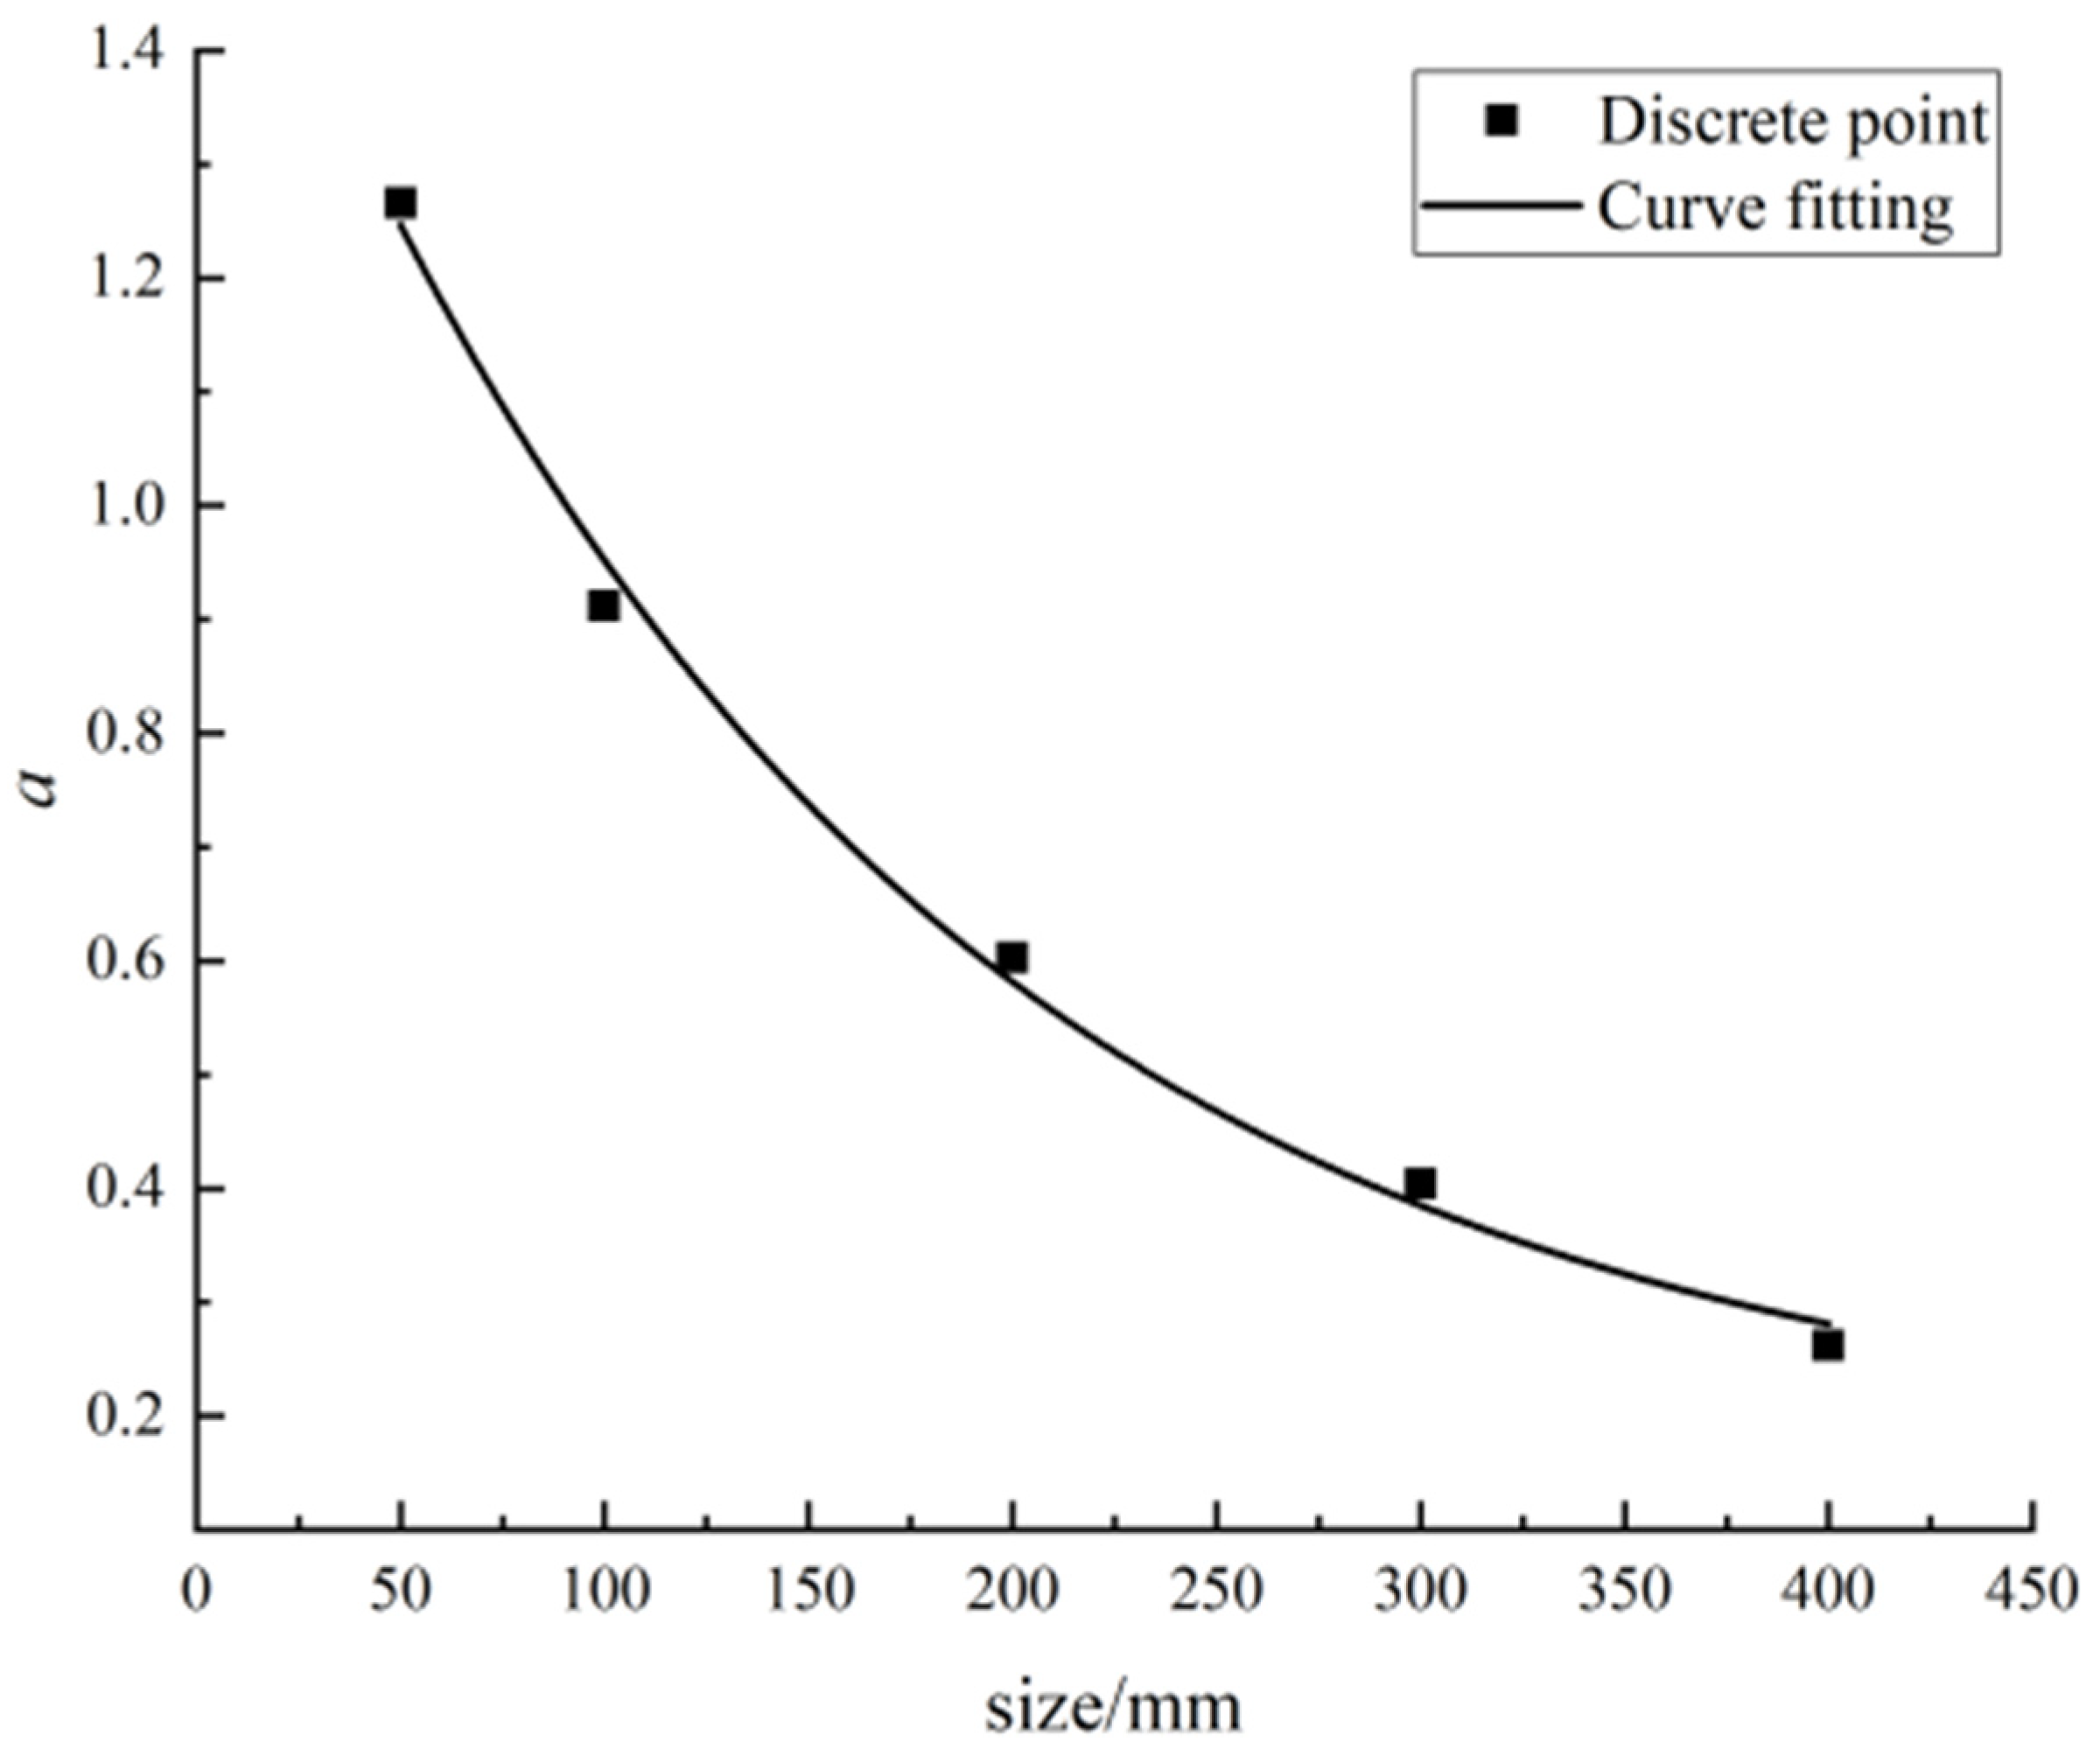
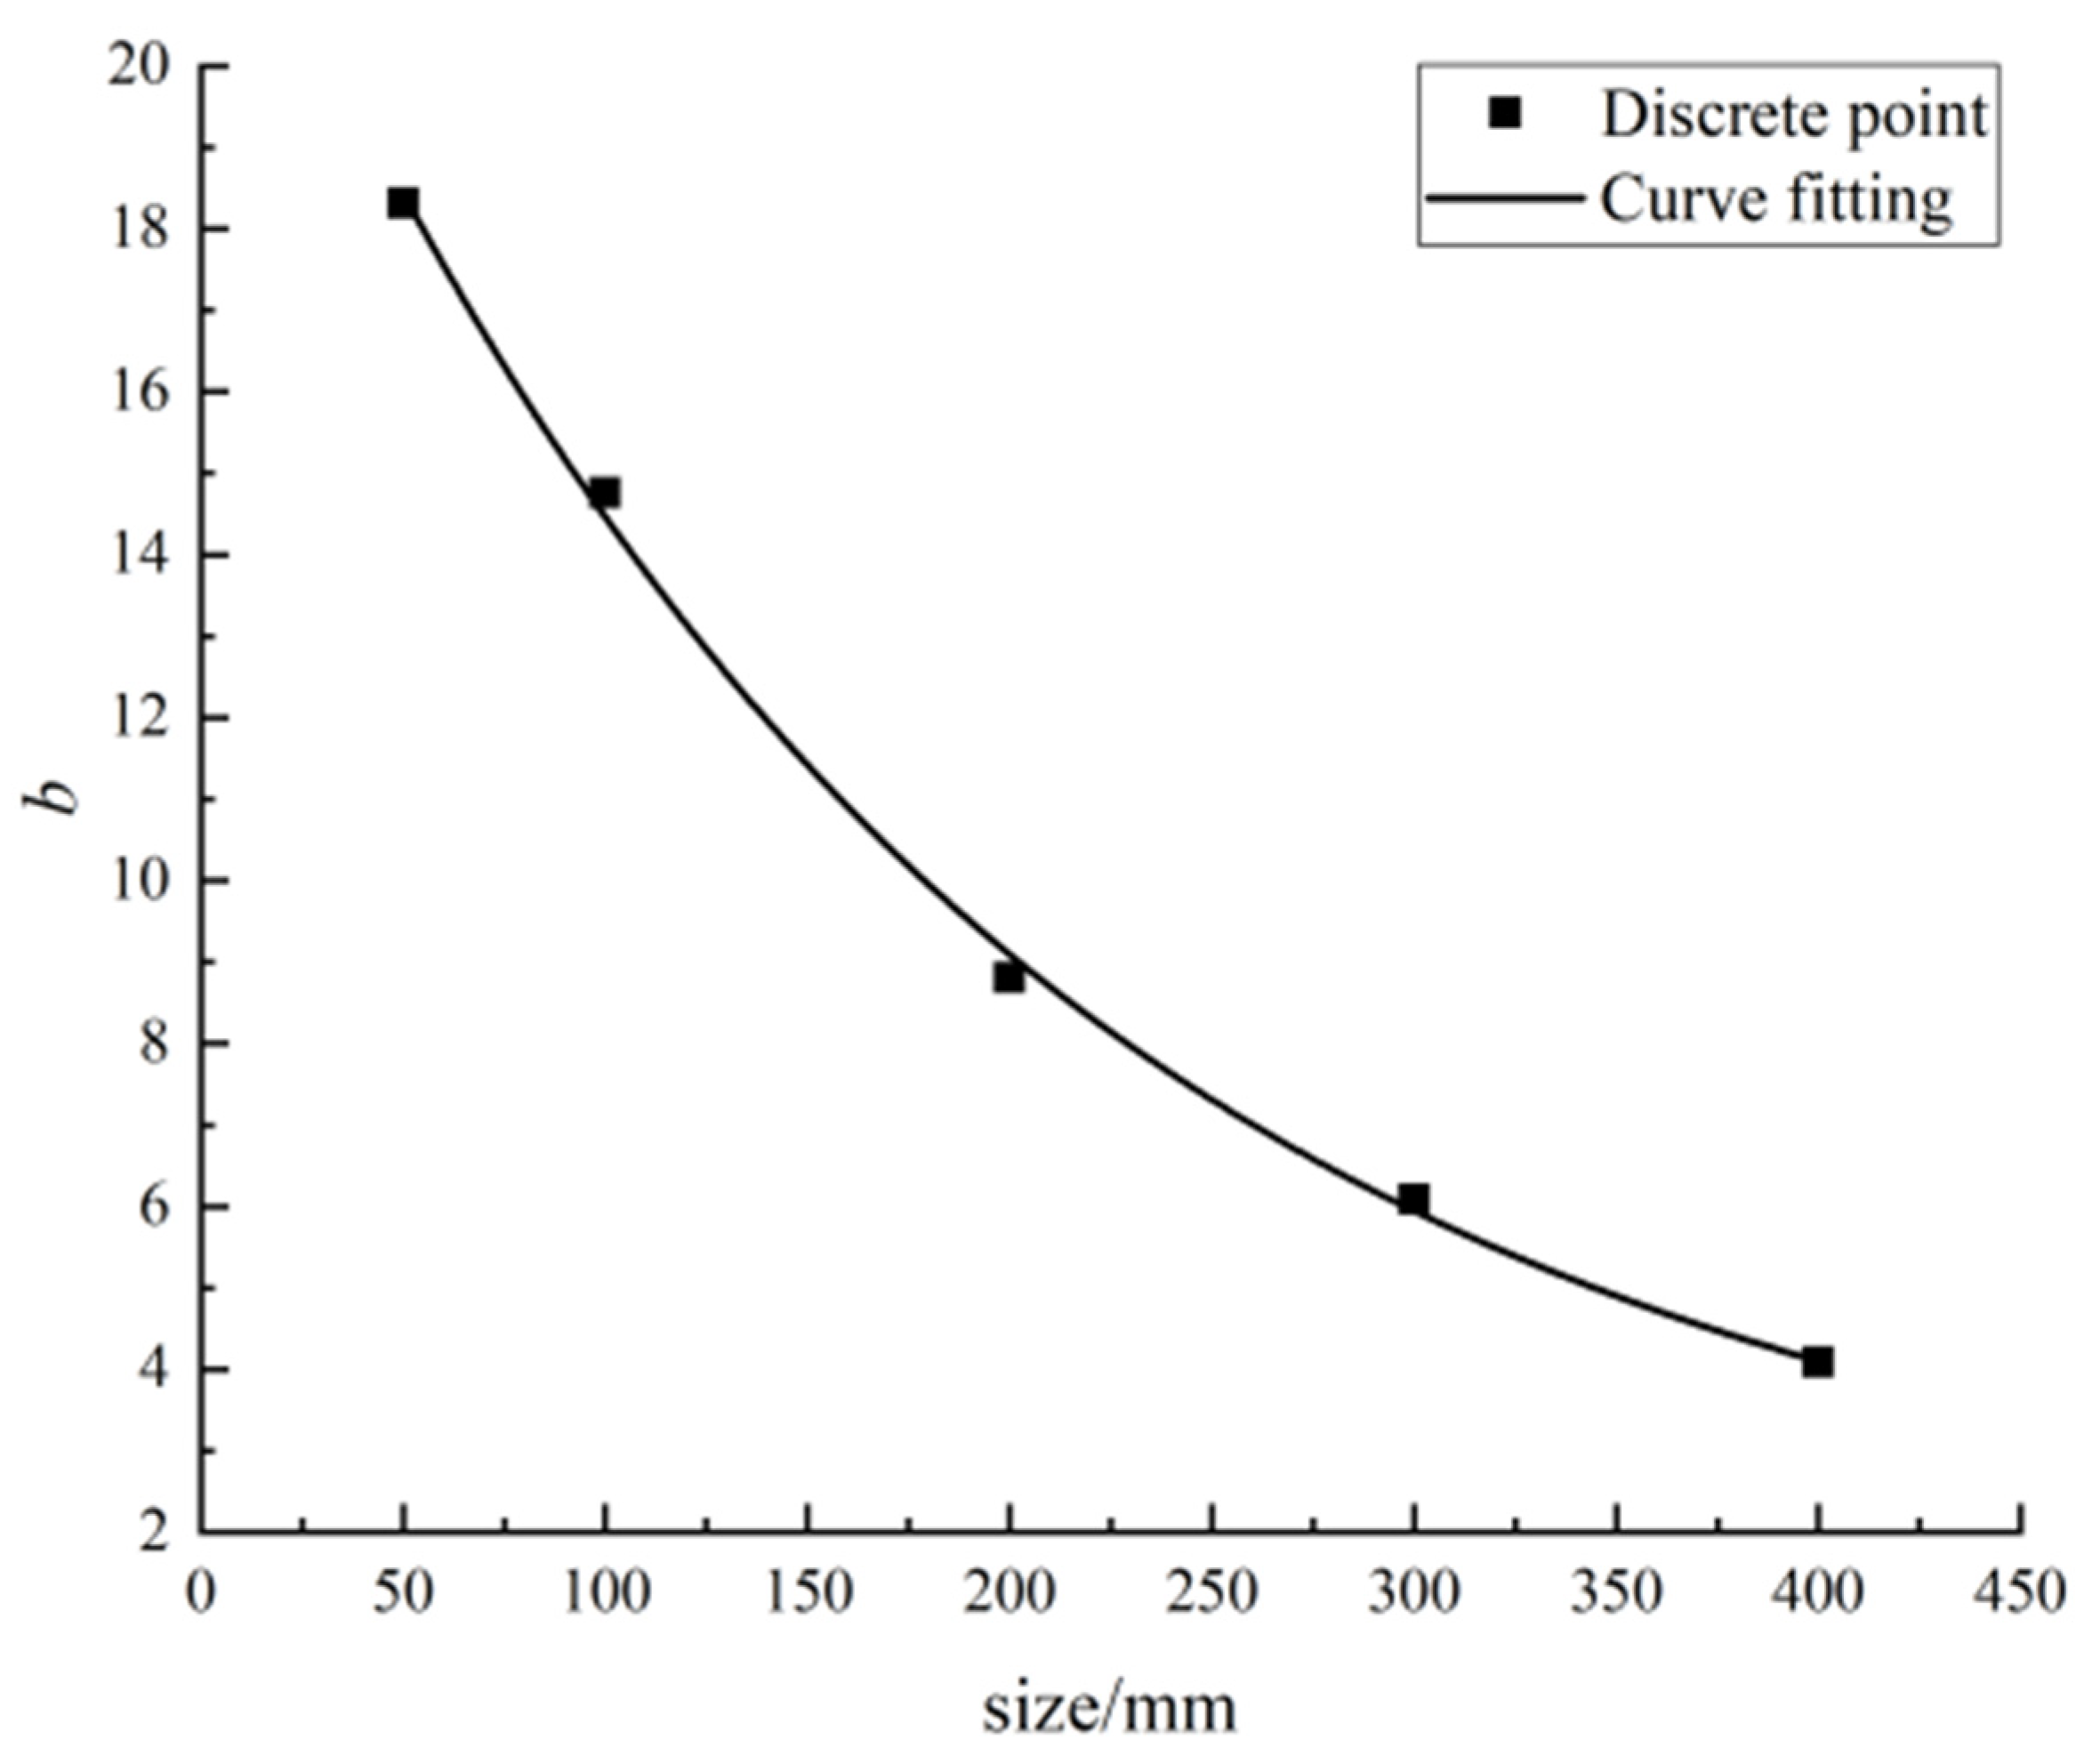
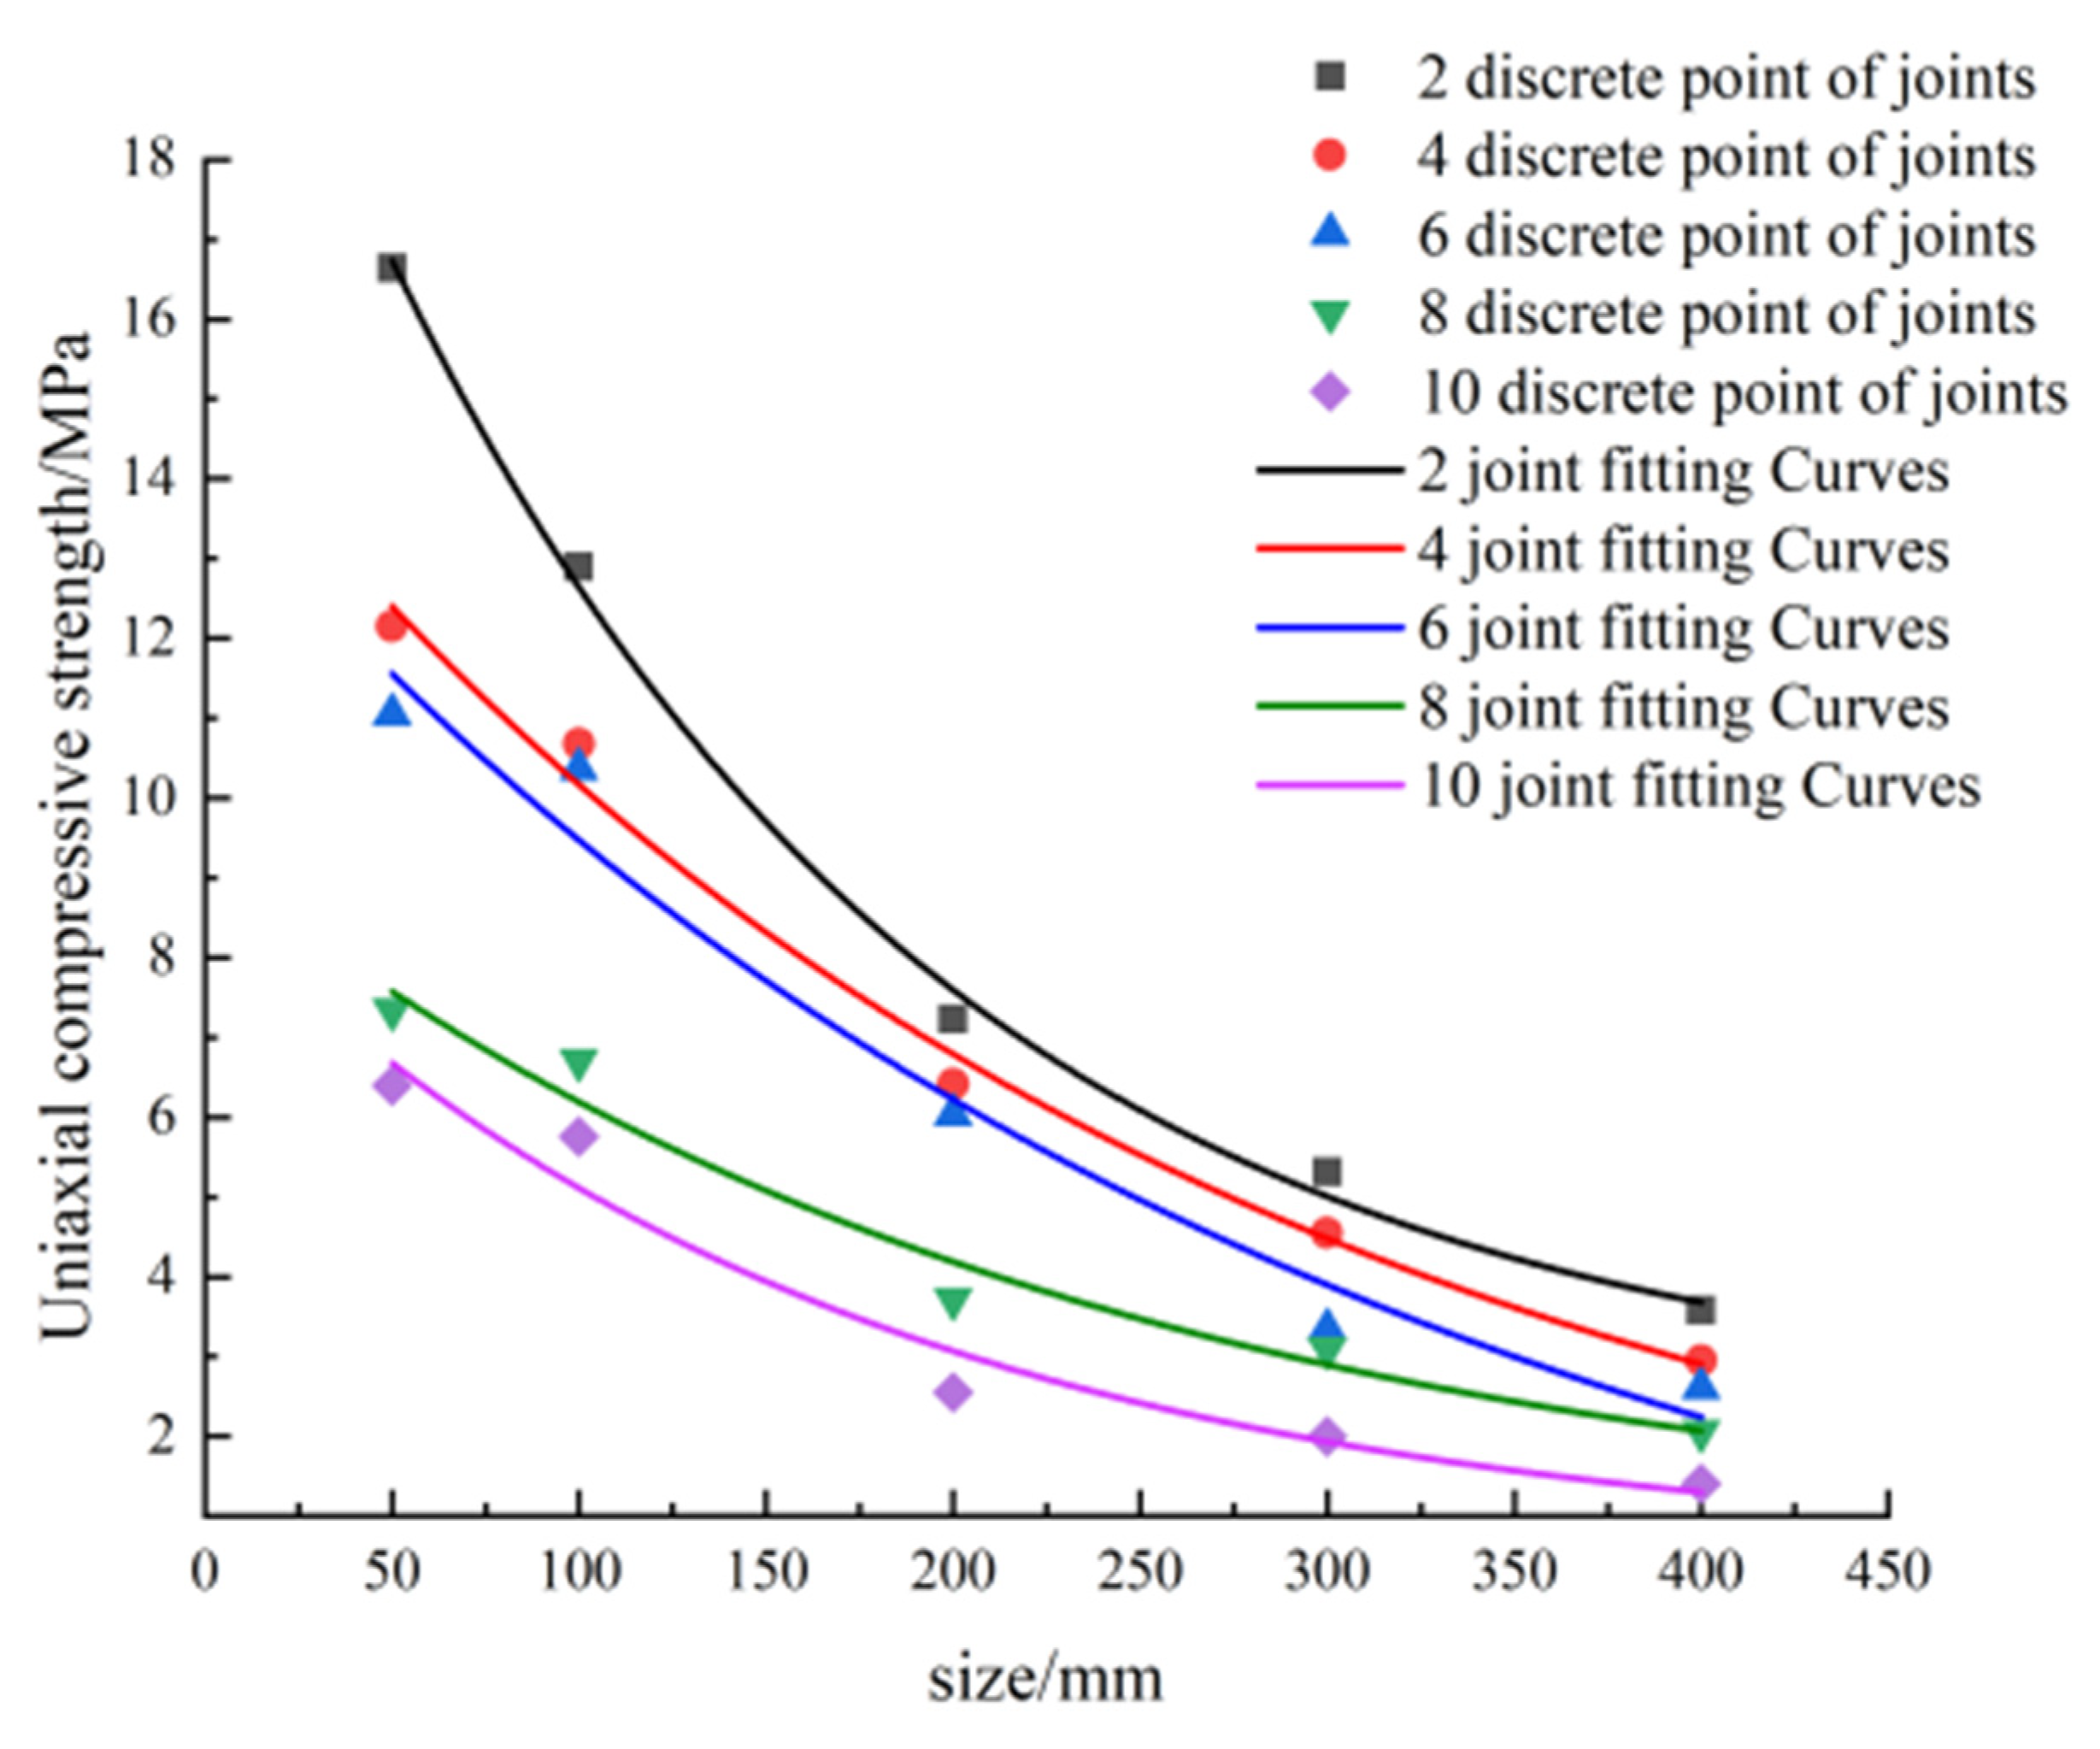
First, the general form of the mathematical relationship is given by considering different rock sizes and NPJs. Then, combined with the size of the rock, the specific form of the mathematical relationship is given. In existing research, scholars rarely consider the role of size in discussing the influence of NPJ on UCS. The relationship among UCS, NPJ, and rock size has not yet been established.
(ii)
The relationship between UCS and rock size
First, the general form of the mathematical relationship is given by considering the NPJs and rock sizes. Then, combined with the NPJs, the specific form of the mathematical relationship is given. In the existing research on the size effect of UCS, few scholars consider the influence of NPJ on it. The relationship among UCS, rock size, and NPJ has not yet been established.
(iii)
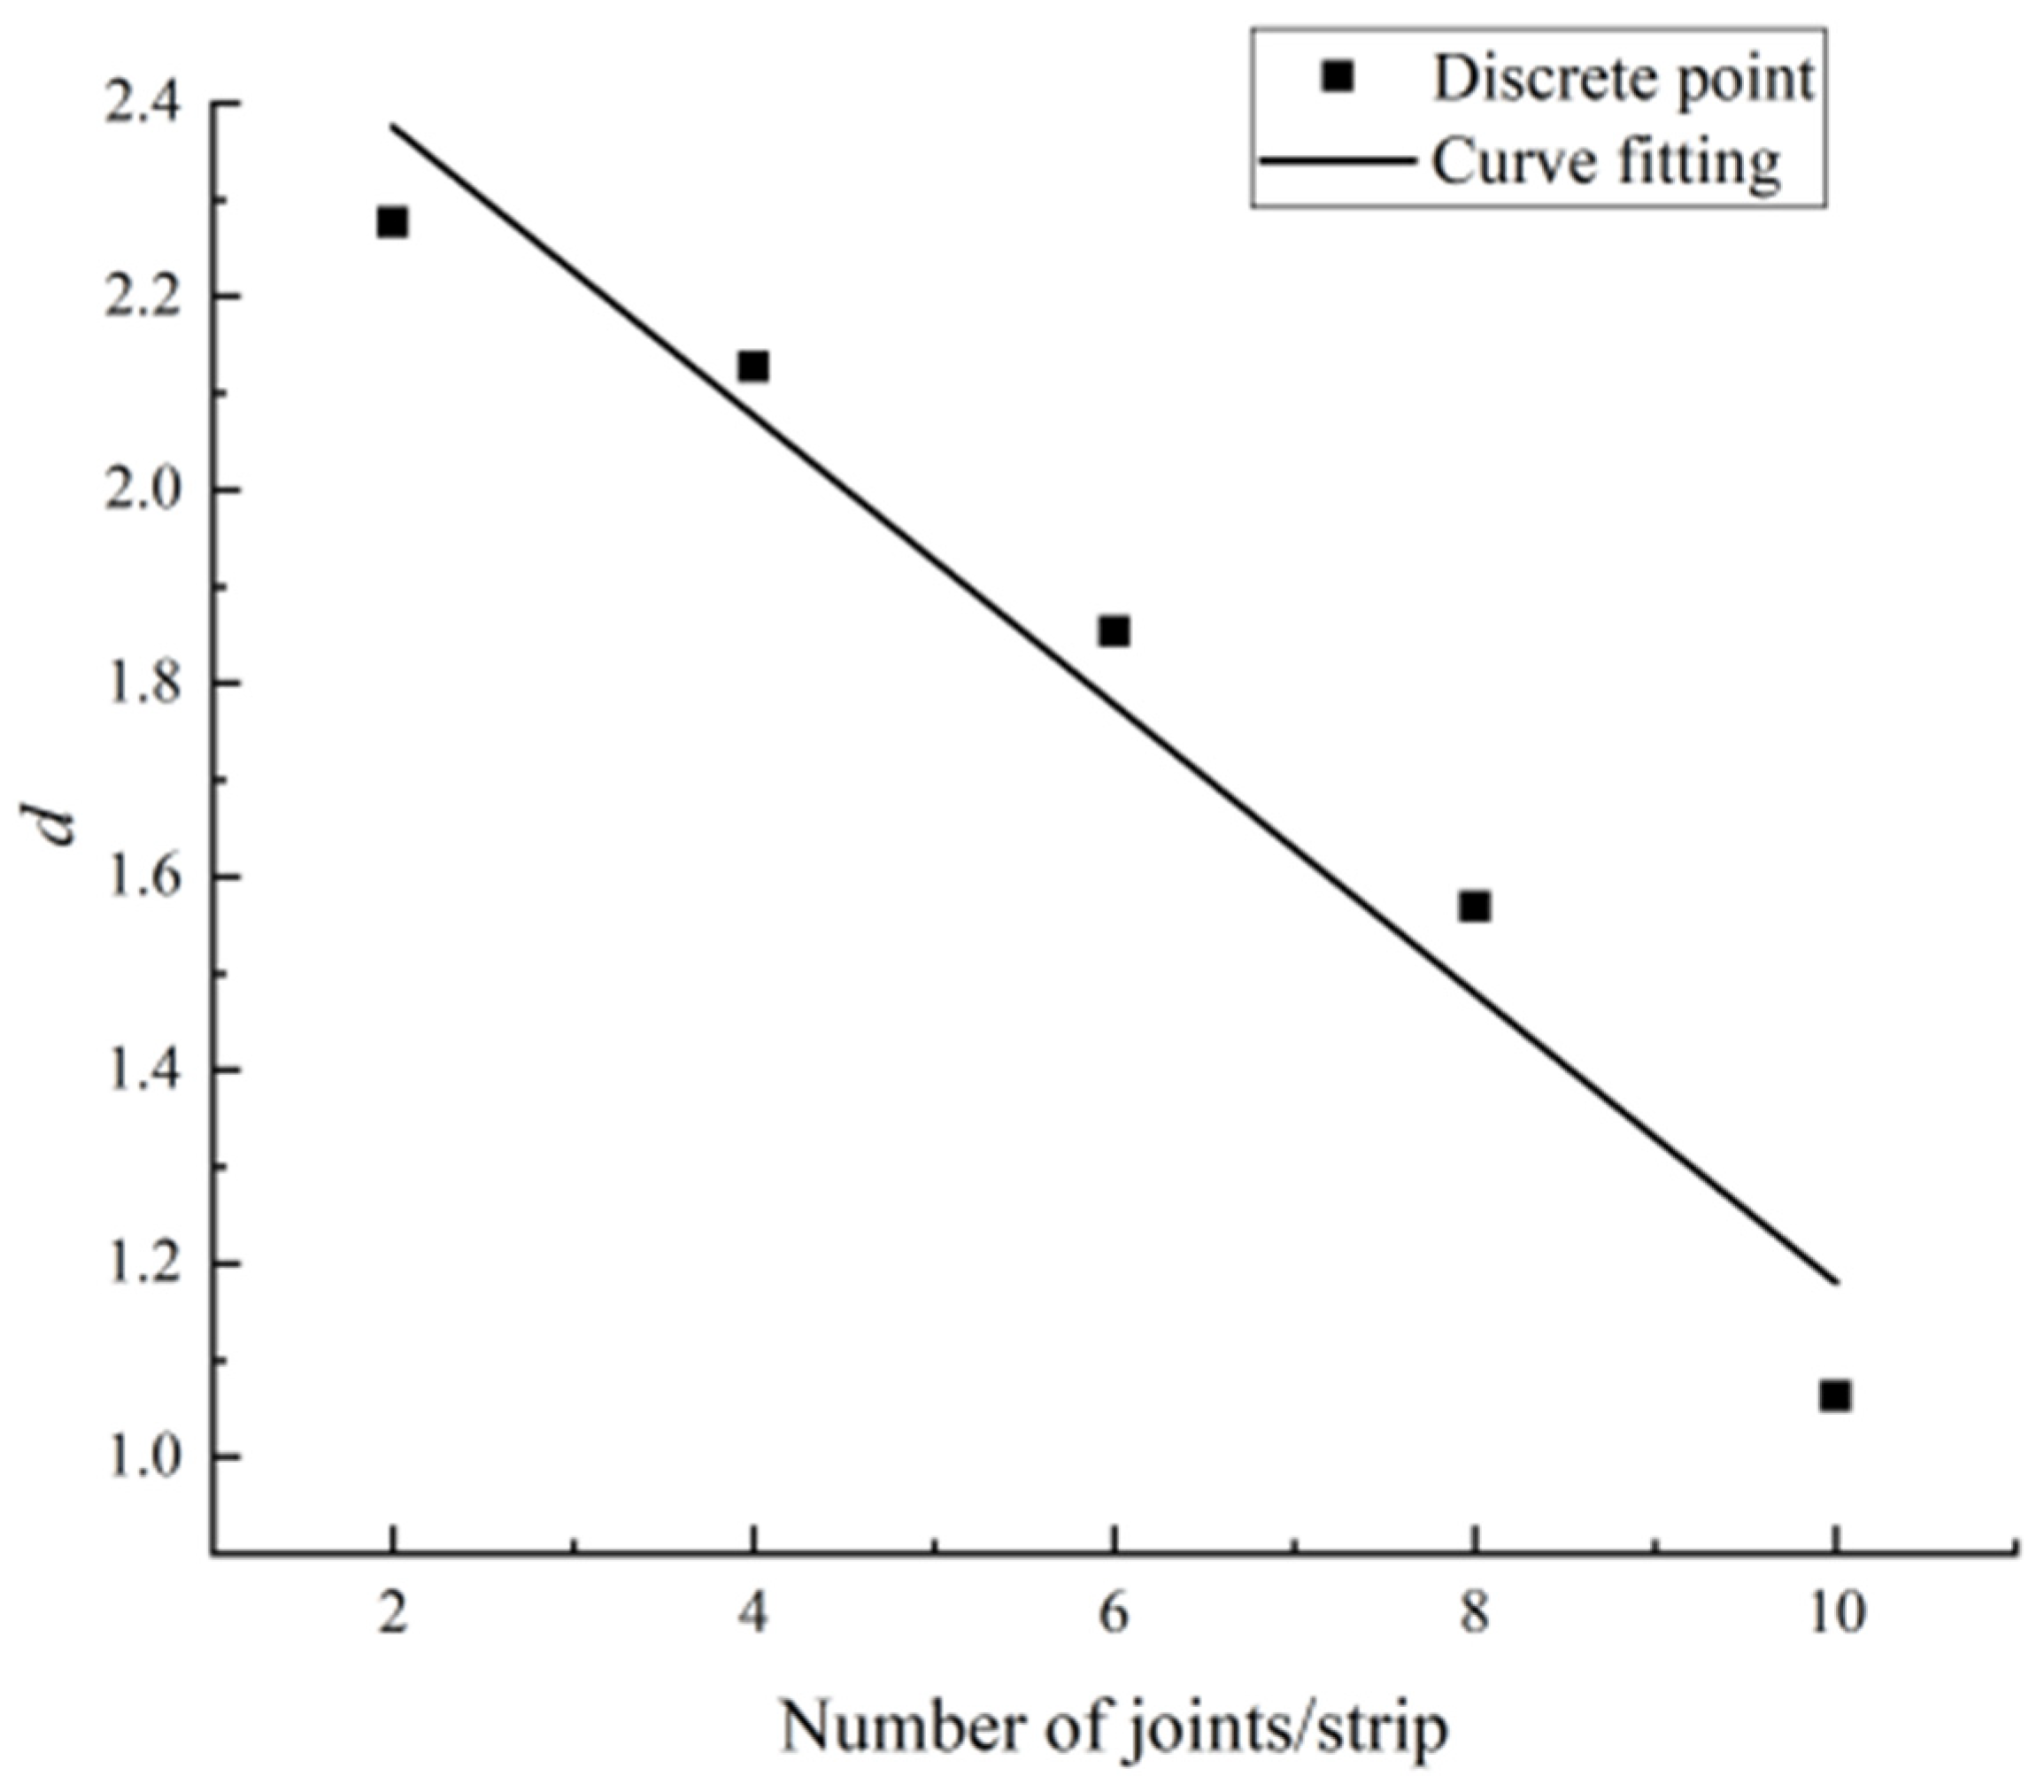
The relationship between rock characteristic size and NPJ
The establishment of the relationship is based on relationship (i). In the existing research, no scholar has established the relationship between rock characteristic size and NPJ.
(iv)
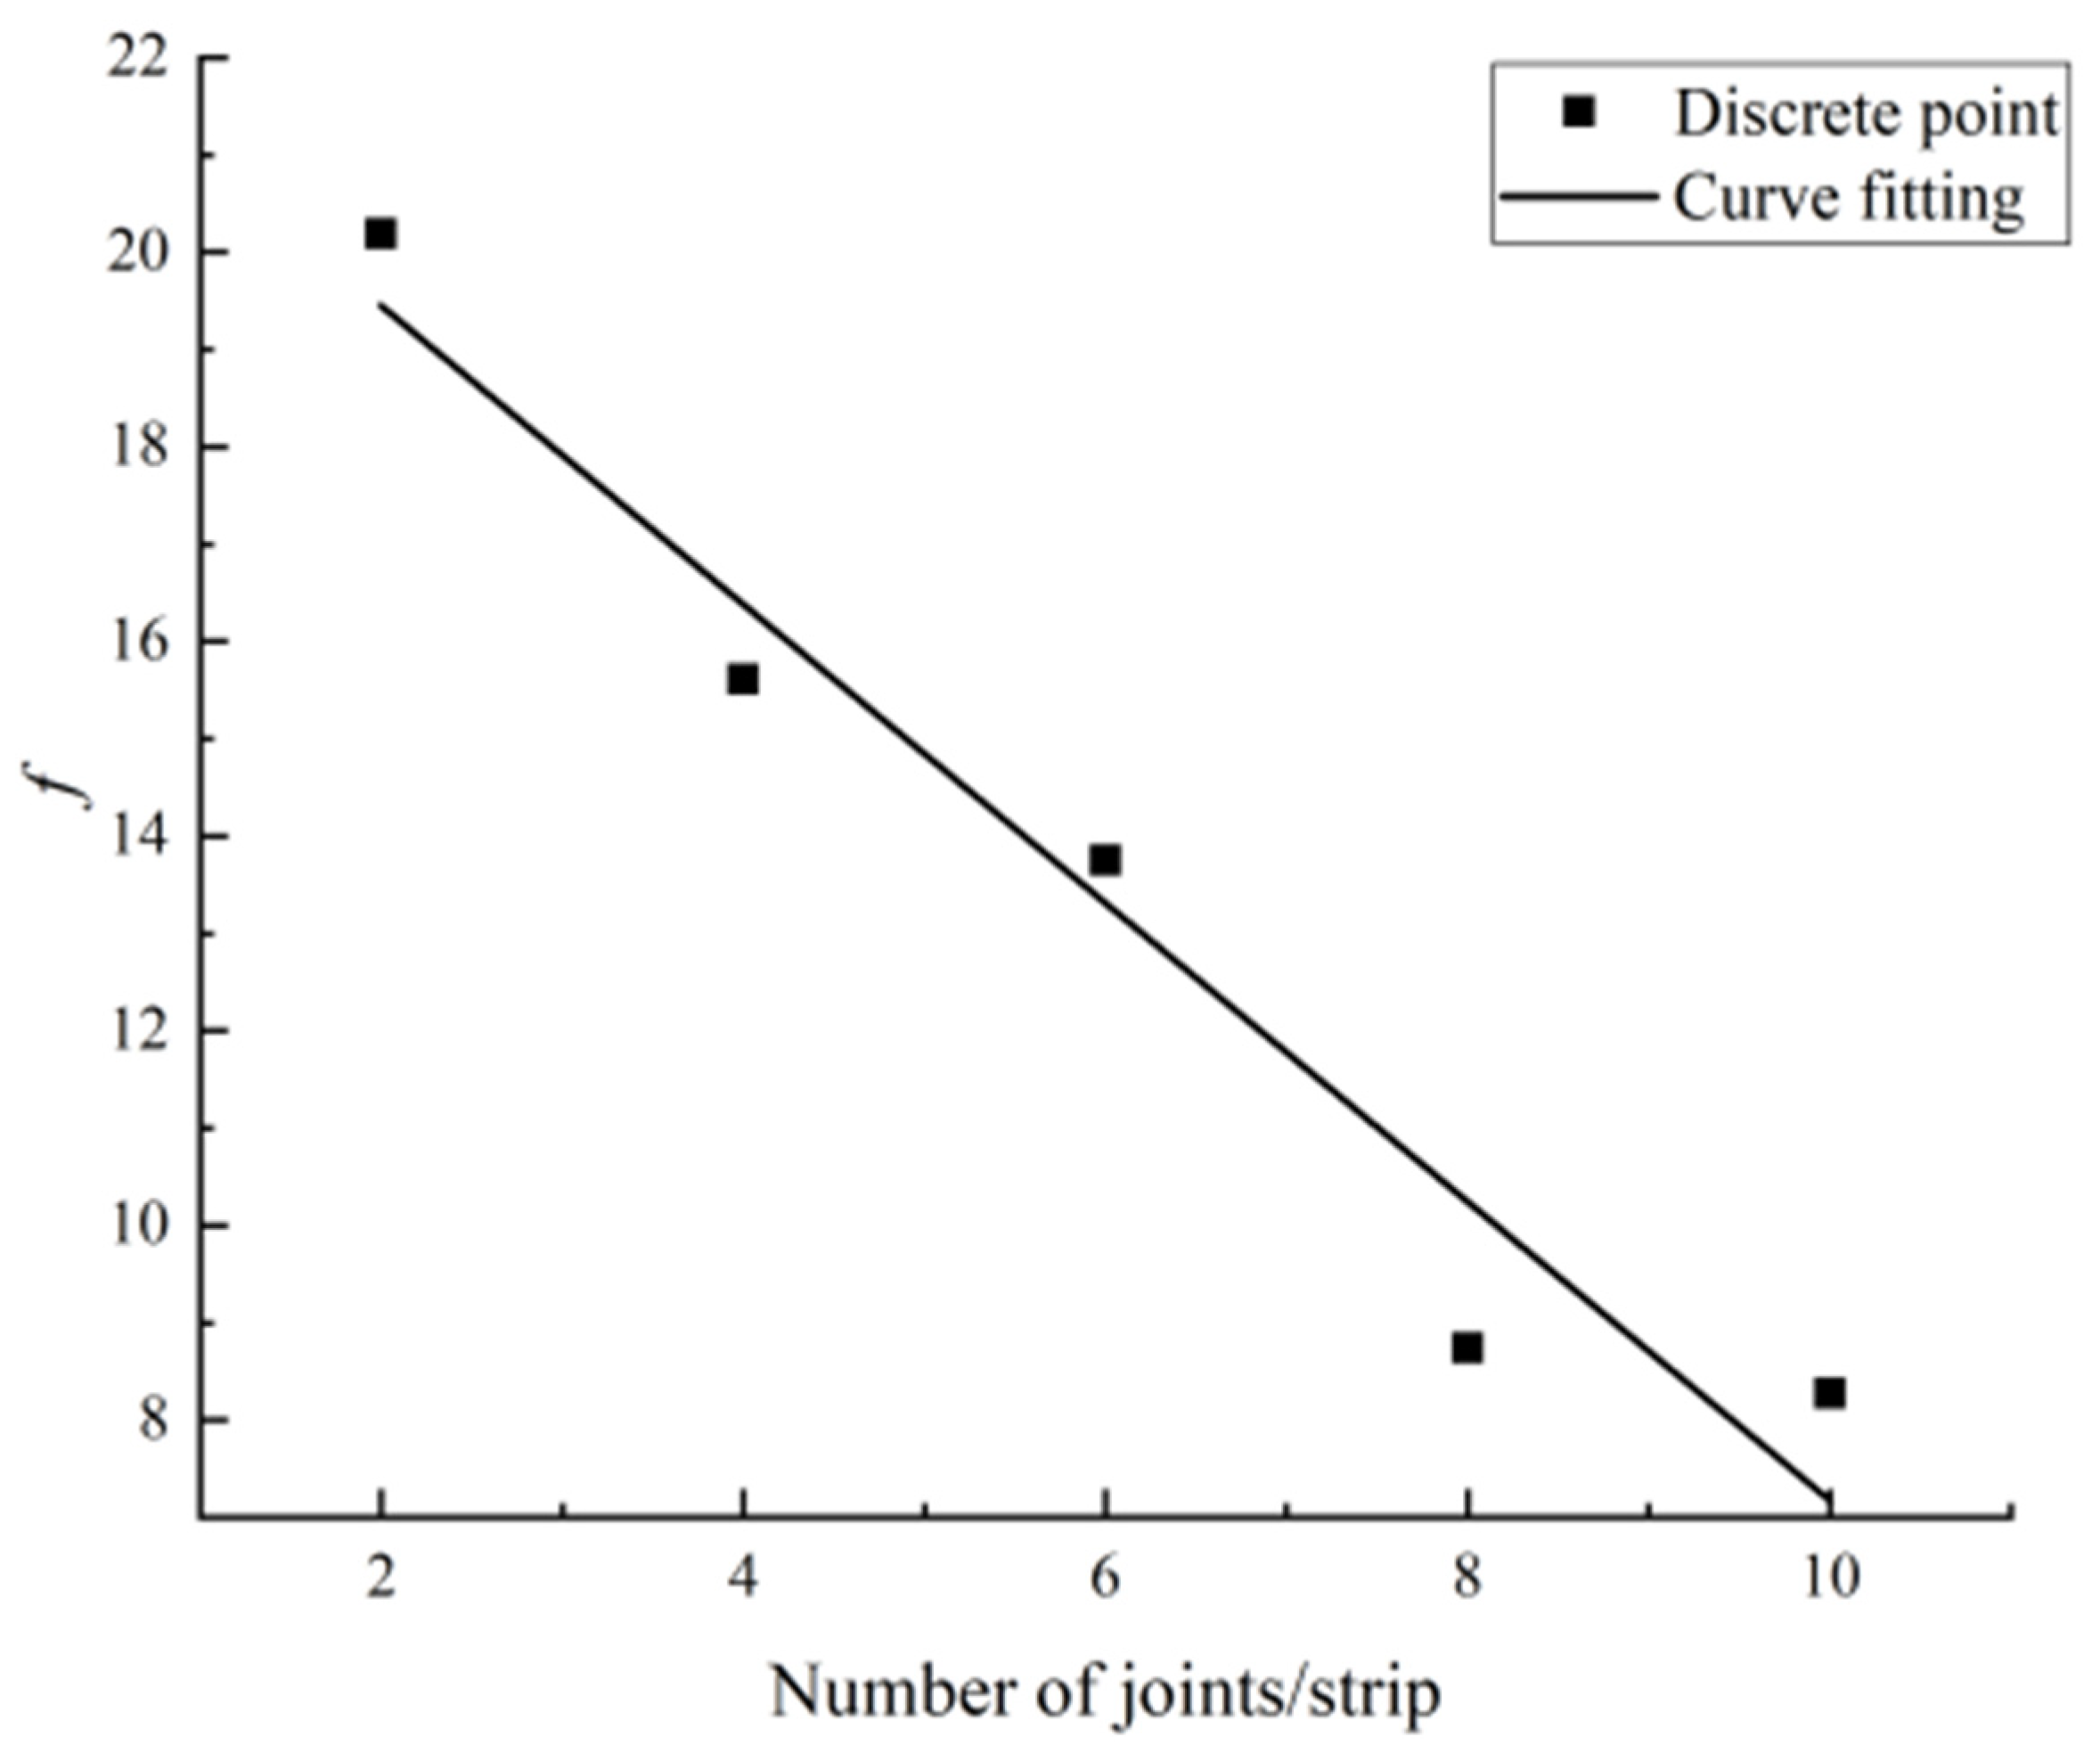
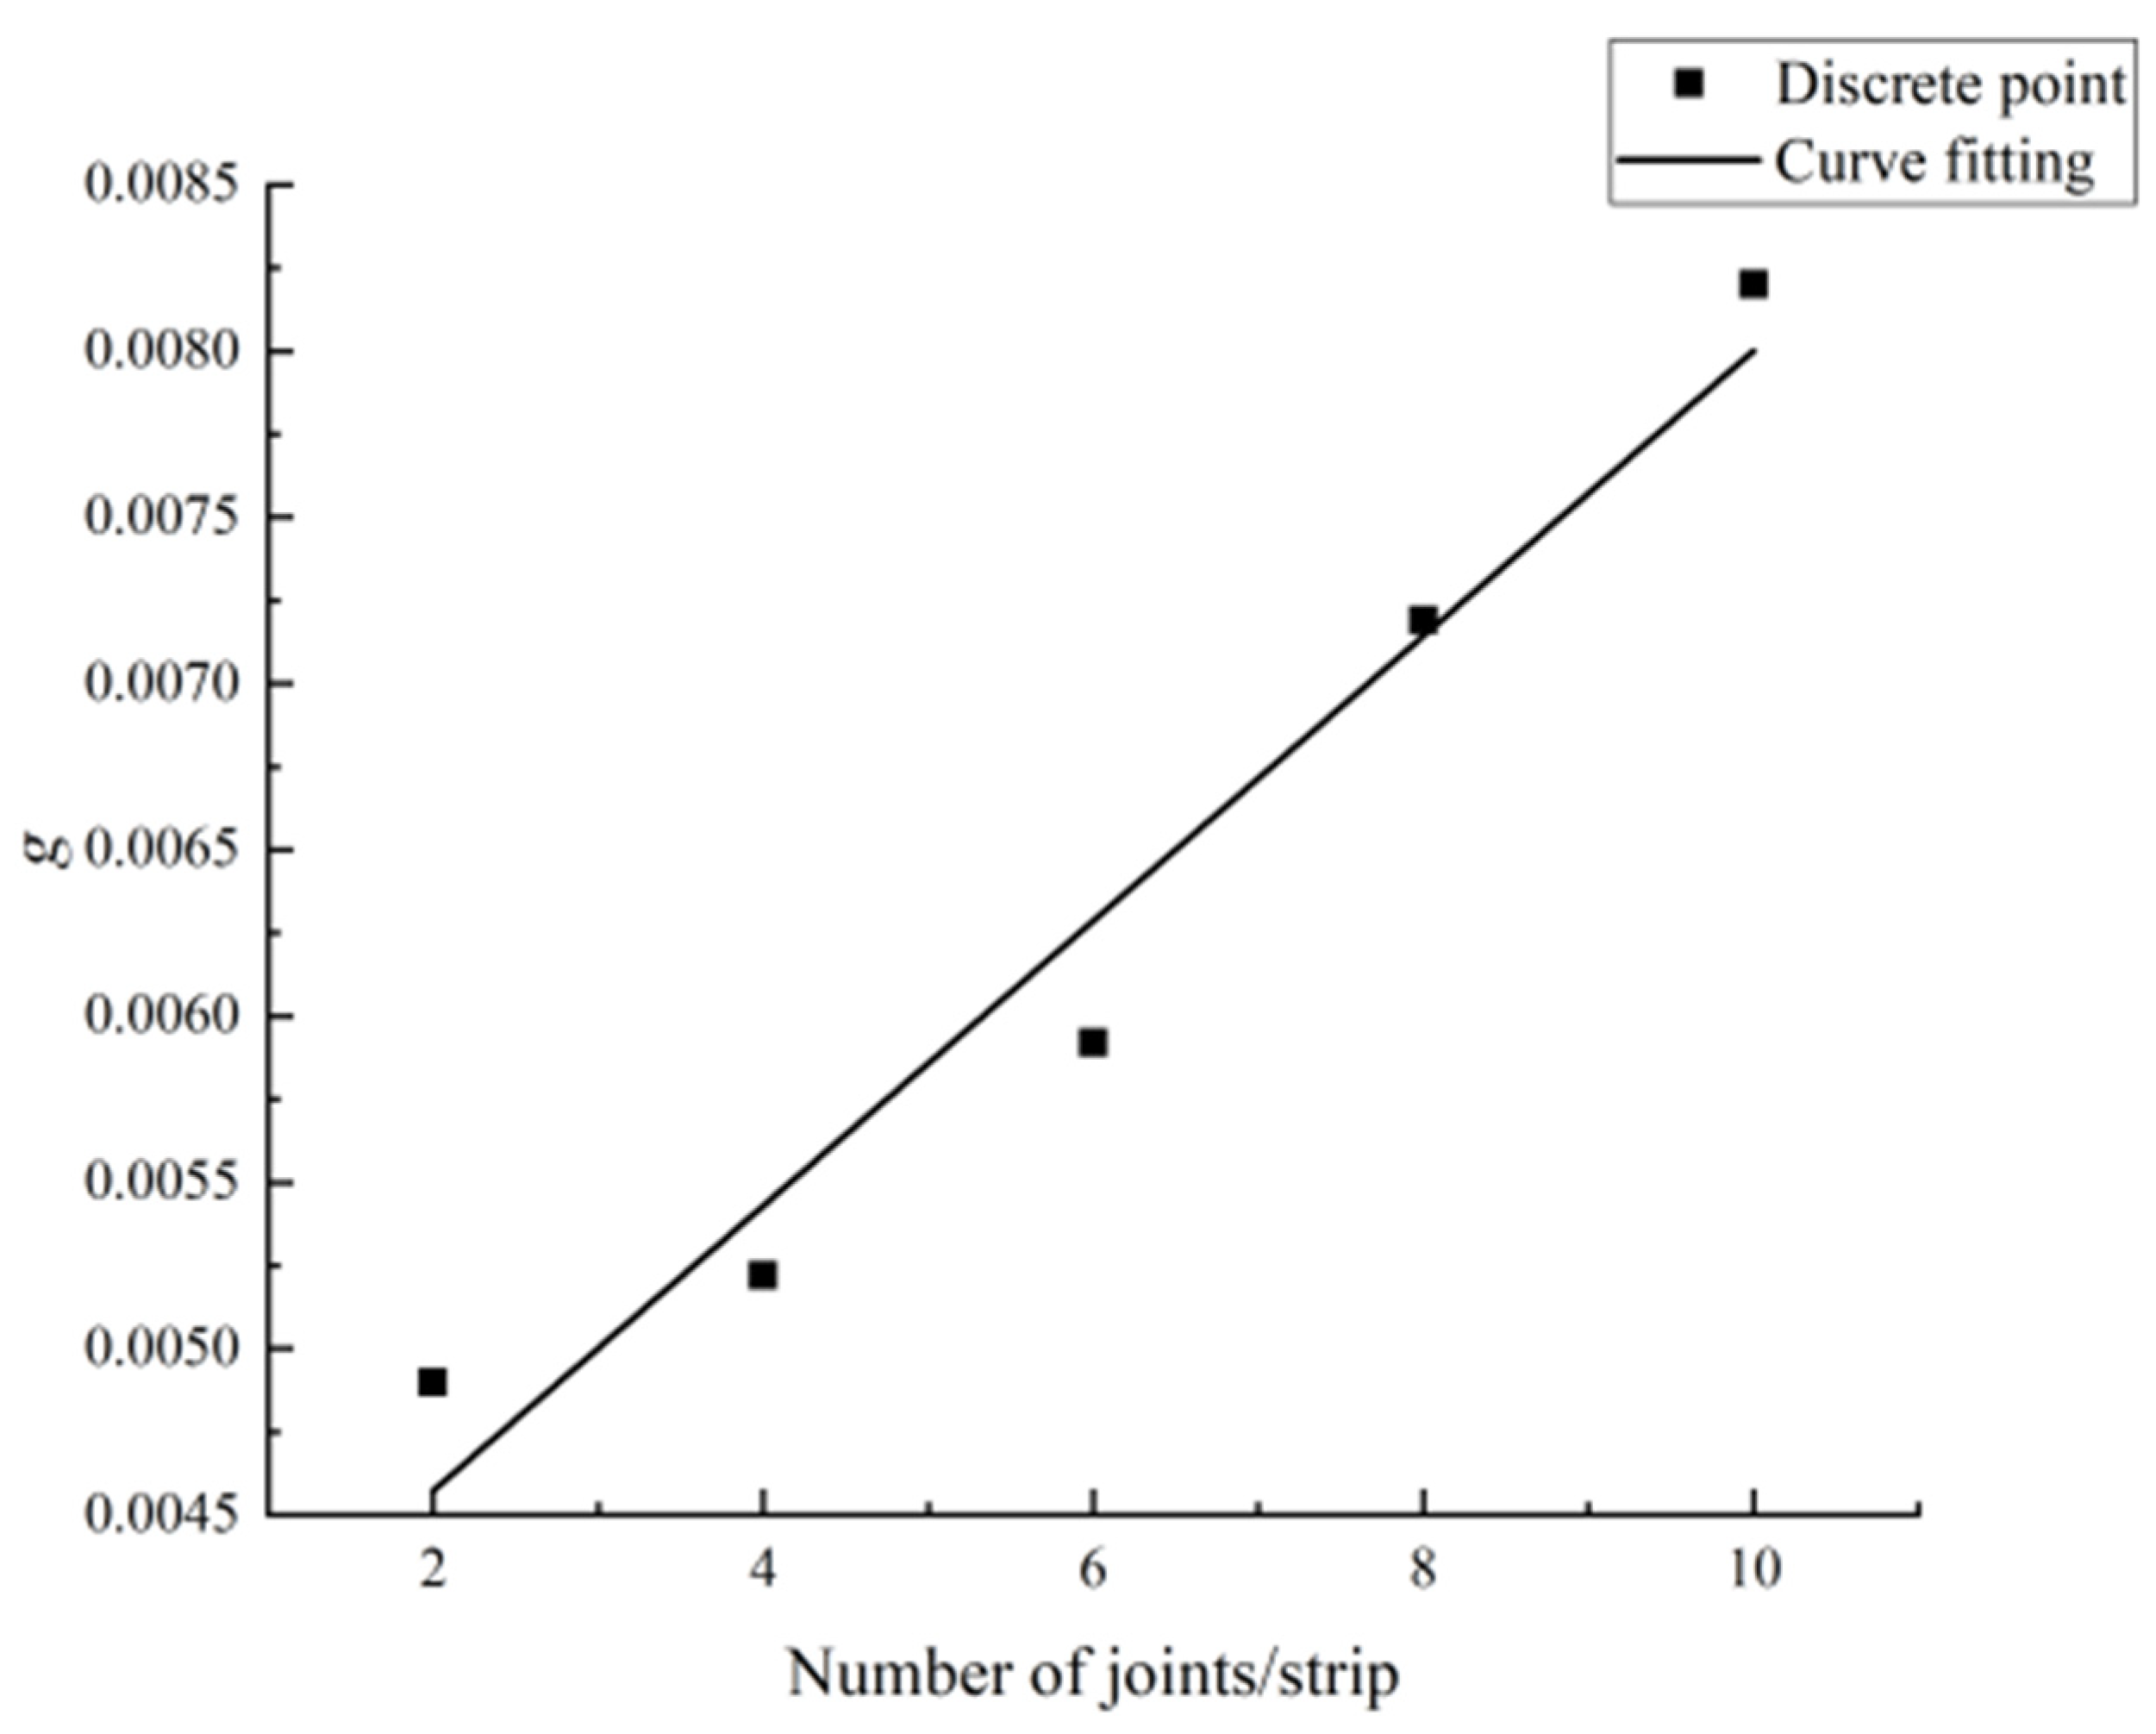
The relationship between rock characteristic strength and NPJ
The establishment of this relationship is based on relationships (i) and (iii). In the existing research, no scholar has established the relationship between rock characteristic strength and NPJ.
The relationship obtained in this paper applies to a specific rock type. The obtained mathematical formulas have a good effect in analyzing the relationships between the UCS, rock size, and NPJ of similar rocks. At the same time, this article also provides an analysis method. When the content of mineral petrology changes, the properties of rocks will change. According to the research ideas and methods presented in this article, any rock can be analyzed and the mathematical relationships between them can be obtained.
The rationality of the research is discussed below.
In RFPA, the rock medium model is discretized into a numerical model composed of meso-elements. It is assumed that the mechanical properties of the discretized meso-elements obey a certain statistical distribution law (Weibull distribution). This establishes the relationship between mesoscopic and macroscopic media mechanical properties. Based on this idea, the RFPA software realizes the characterization of rock heterogeneity. Whether it is 2D or 3D, the mechanical properties of the meso-primitives in the numerical model established by RFPA are different, which well reflects the non-uniformity of the rock.
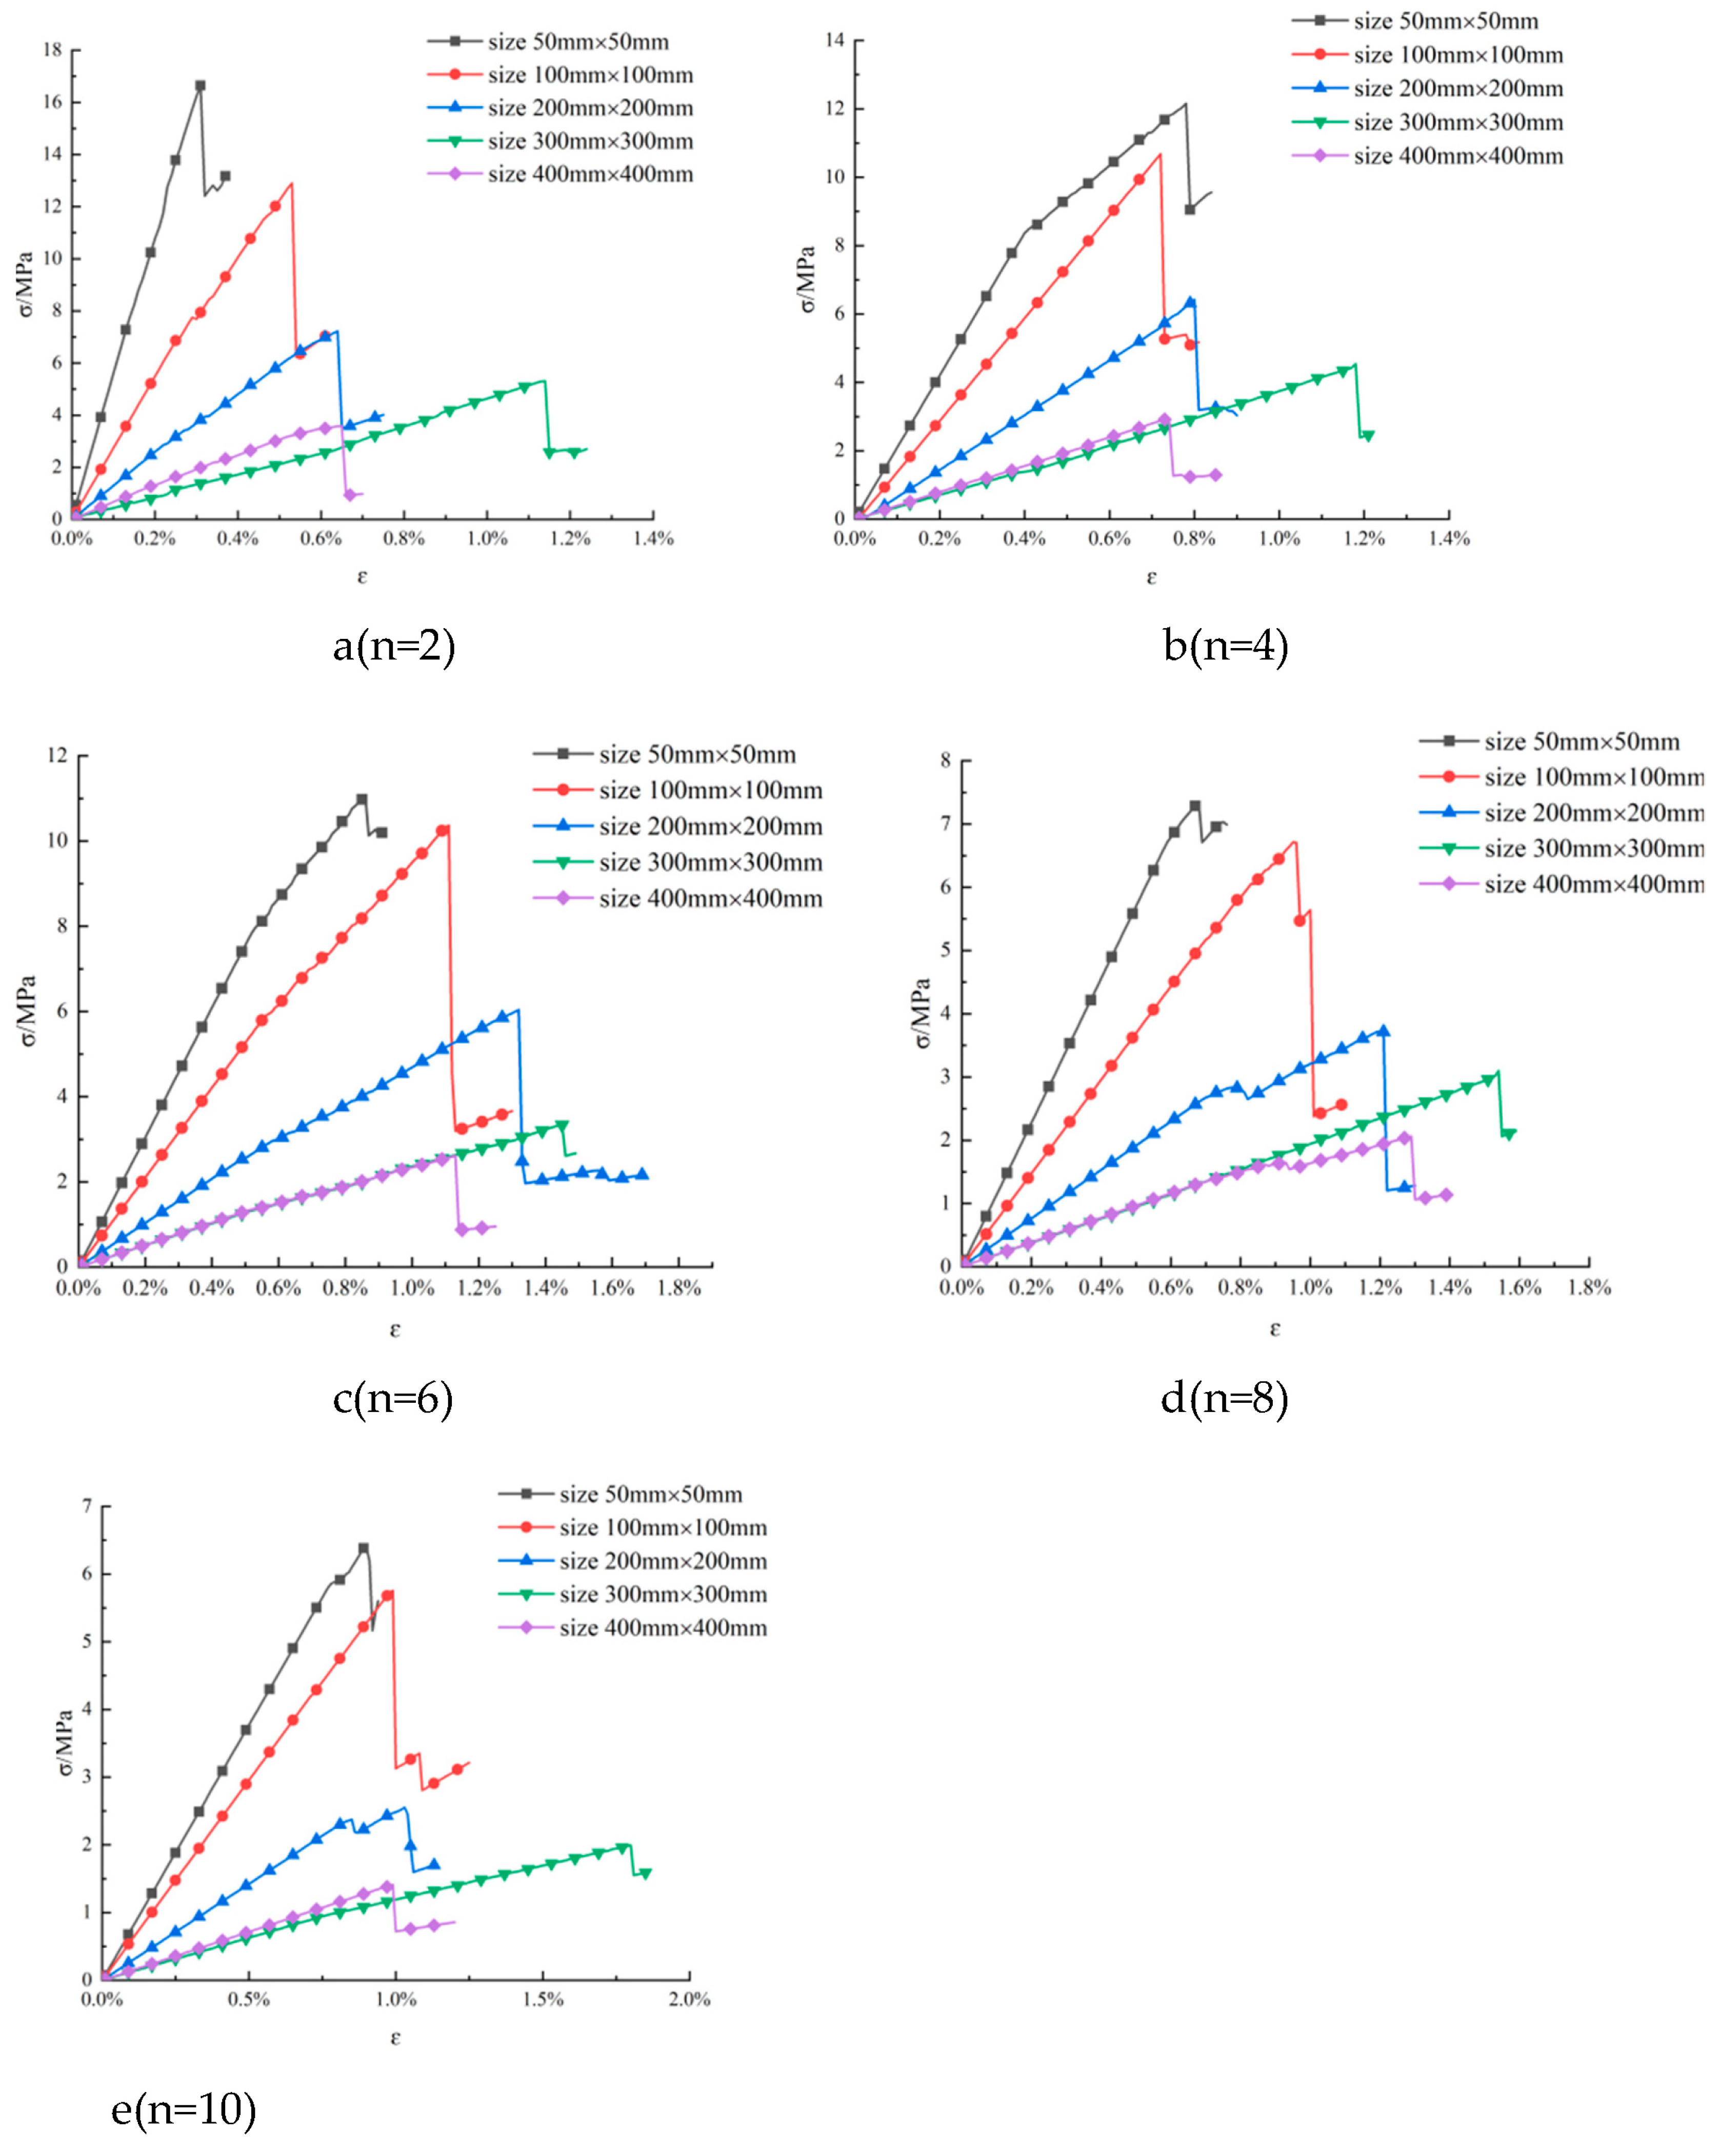
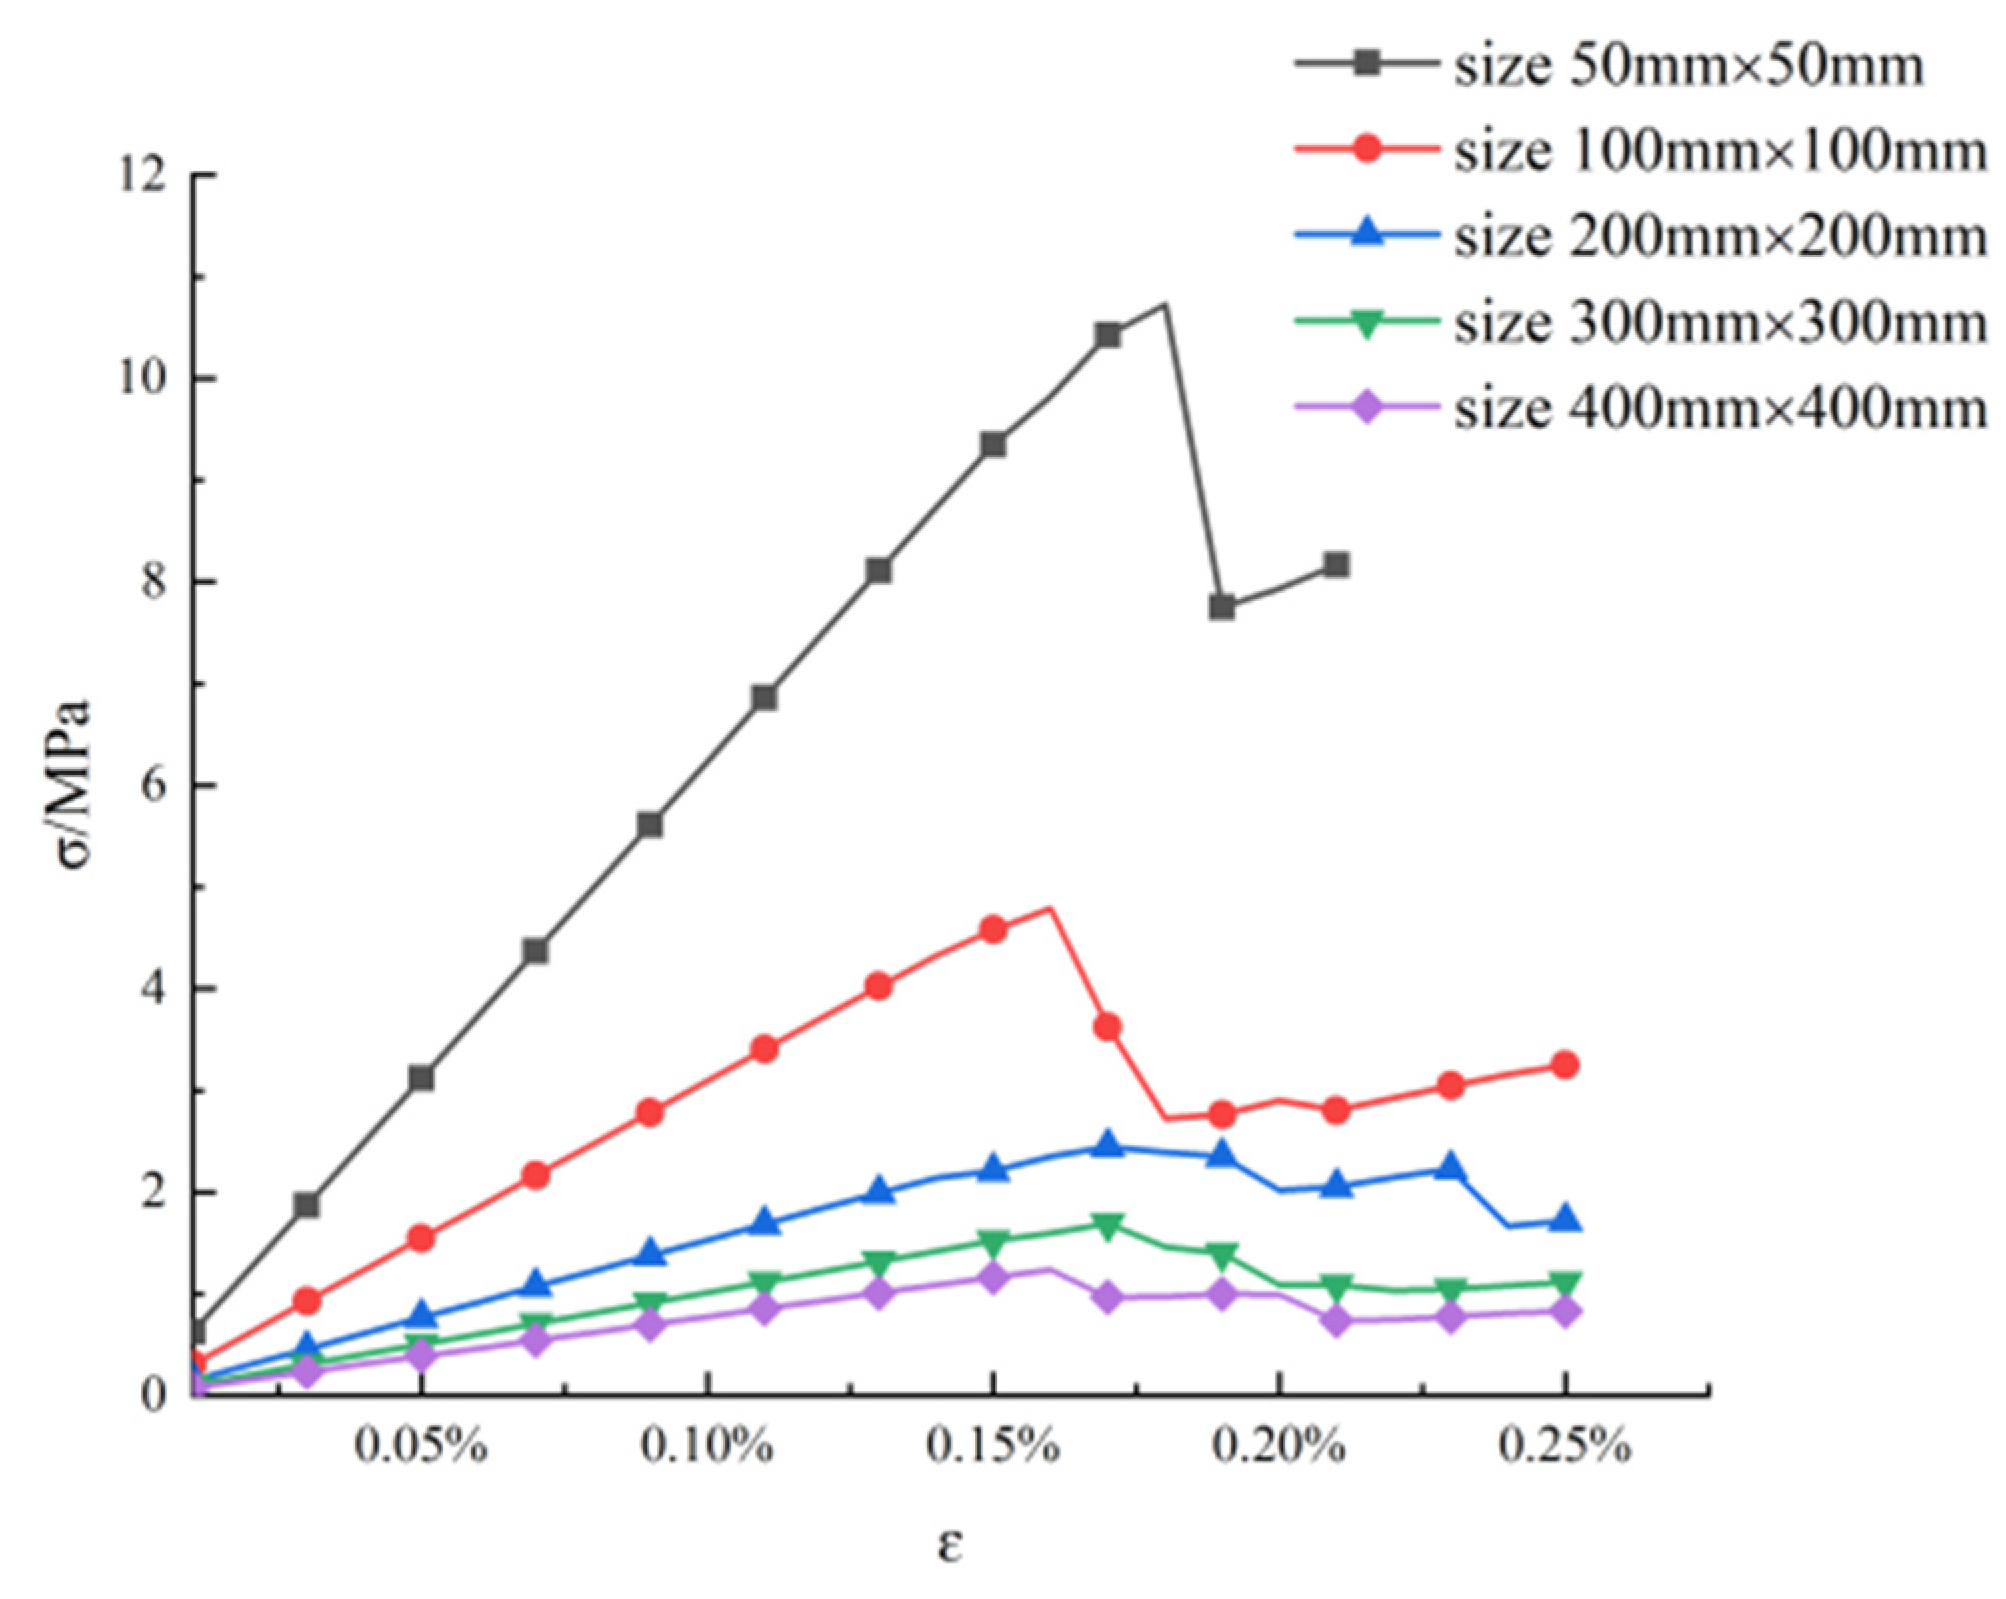
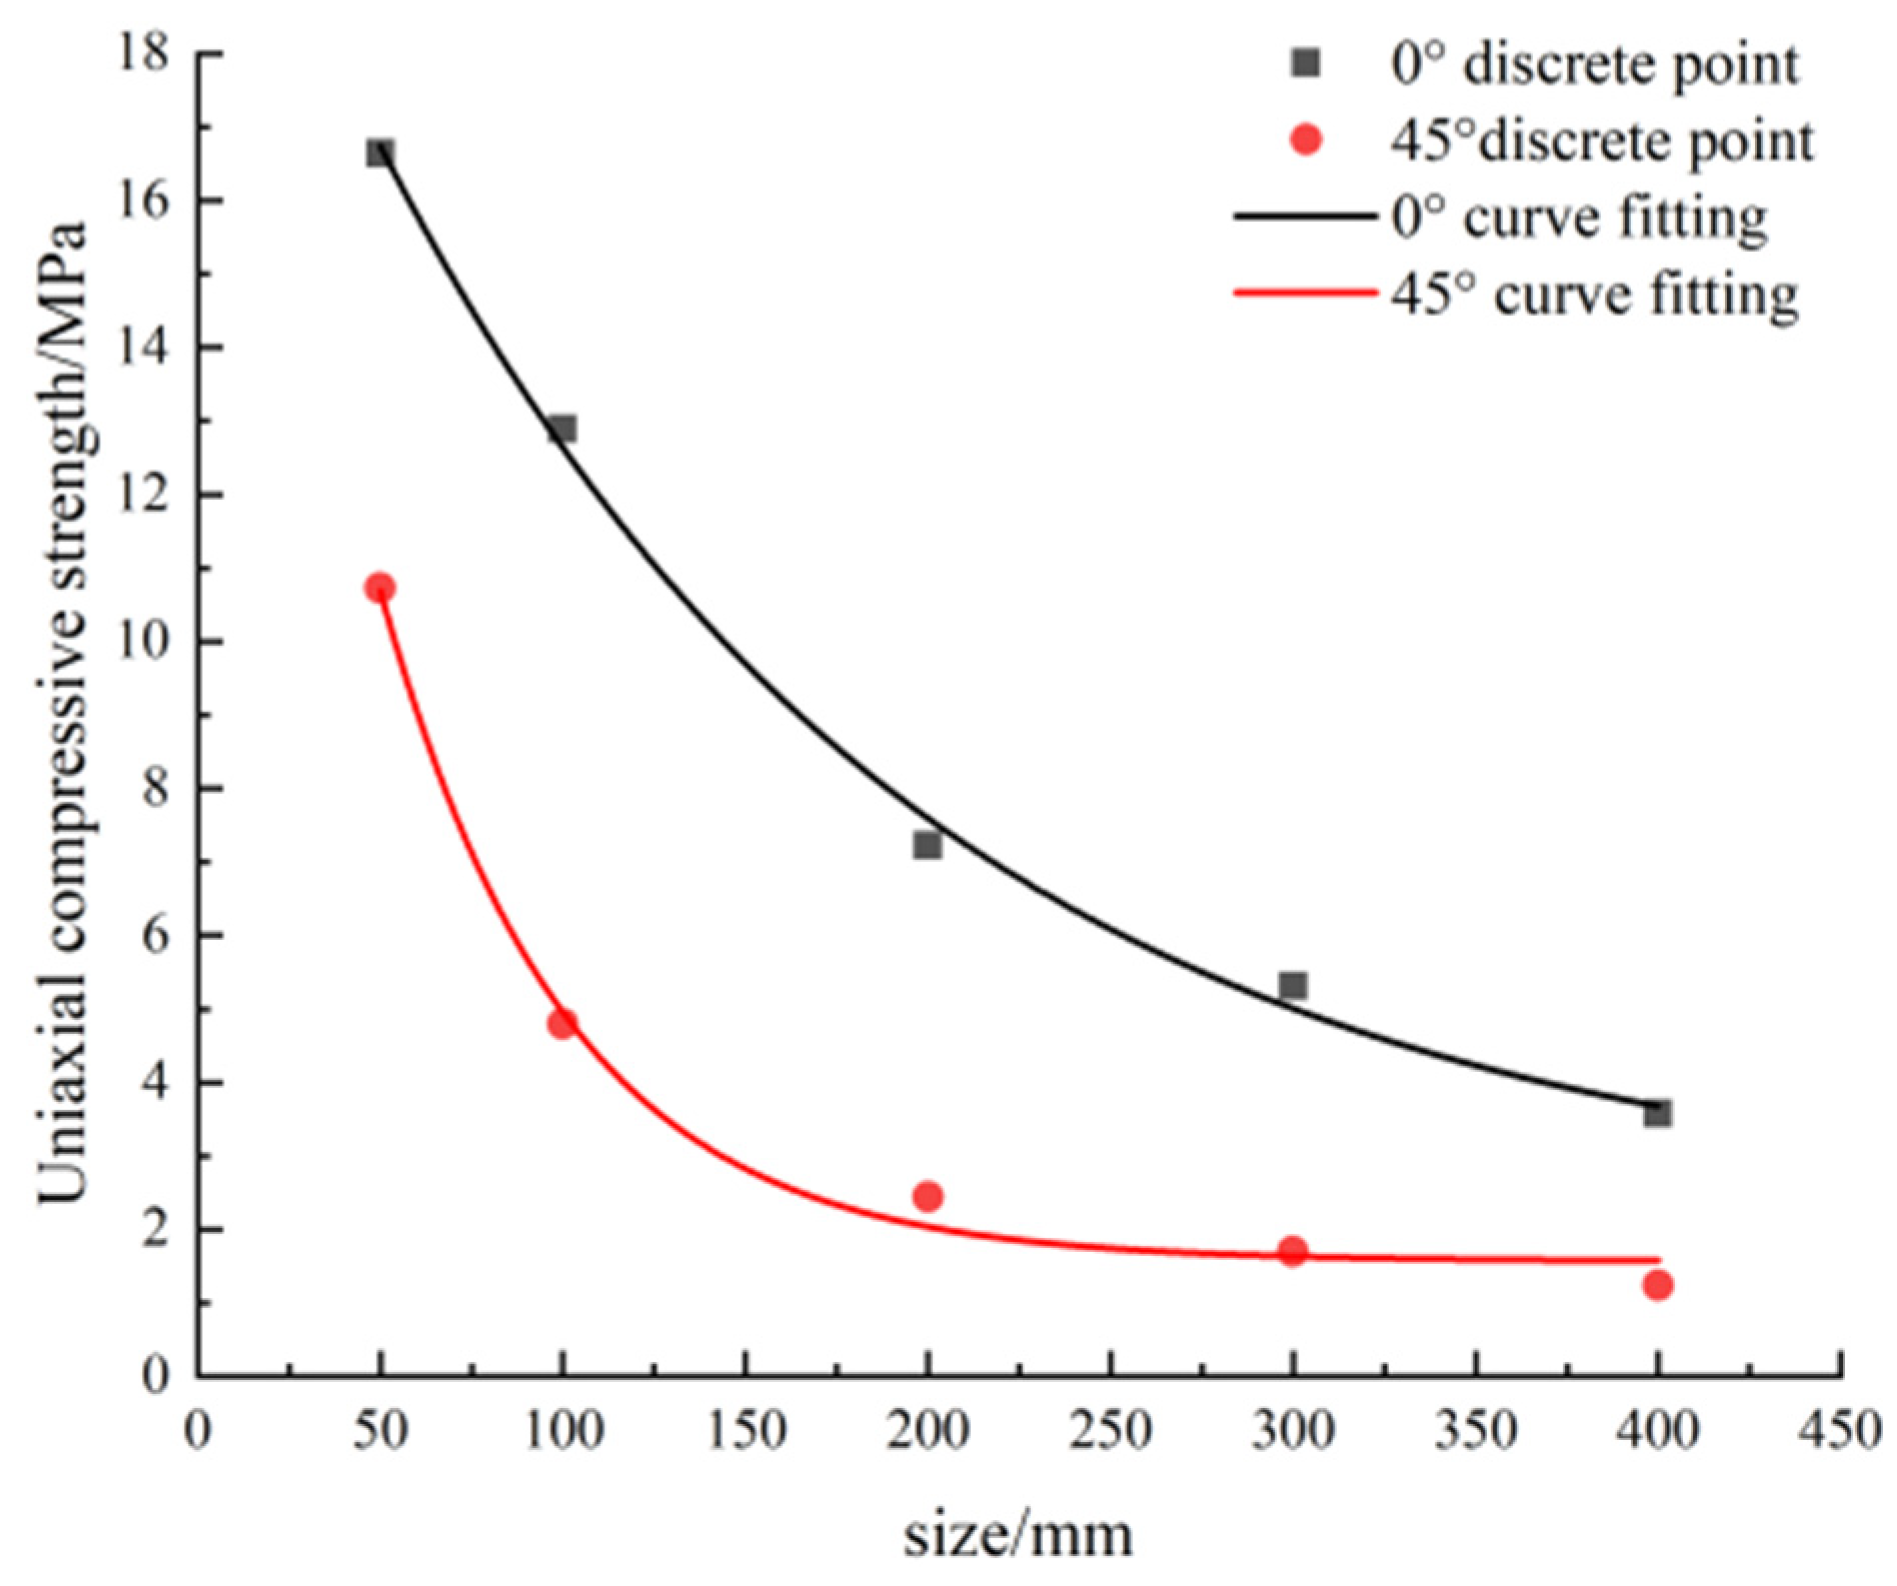
Structural surfaces such as joints and cracks in the rock, as well as geological conditions such as pores, constitute the anisotropic characteristics of the rock. The mechanical properties of rocks in different directions and angles are different. In the process of numerical simulation modeling, the influence of some minor factors is often ignored, and only the major factors are considered for research. In this paper, the influence of the NPJ and rock size on the UCS is studied. Therefore, in the modeling process, the changes in these two are mainly considered. In the process of numerical simulation, the selection of 2D and 3D models is a crucial matter. Due to the non-uniformity and anisotropy of the rock, it is a very good choice to use a 3D model to build the real internal structure of the rock without any simplification, which is also where the 3D model is superior to the 2D model. However, when the influence of some insignificant factors is ignored, the advantages of the 3D model over the 2D model will become less obvious. In the research, the stress–strain curves of different sizes of rocks after compression were analyzed. The 2D model can perfectly reflect the deformation and failure characteristics of the rock. On the contrary, if a 3D model is used, in the analysis process, it may be necessary to intercept the corresponding 2D section for analysis, which will complicate simple problems. In consideration of these issues, we chose a 2D model to study.
In this article, numerical simulation is used to verify the anisotropic characteristics of rocks. The parallel joints cannot always be horizontal. When the angle of the parallel joints changes, the article verifies that the obtained relational formula is still applicable. This verification proves that the relationship obtained in the article is reasonable and applicable to anisotropic rocks.
However, this article still has some shortcomings. Because this paper simplifies the secondary factors in rocks when studying the number and size of parallel joints in the rock, the relationship obtained in this article is suitable for analyzing on-site rocks with parallel joints. At the same time, this article gives less consideration to indoor tests. In follow-up studies, comparative analyses including indoor tests will be performed.

5. Conclusions

This paper studied the influence of the NPJ and rock size on the UCS of rocks. The size effect of UCS was analyzed through the stress–strain curves. According to these numerical simulations, the following conclusions were obtained.
(1)
A mathematical model of UCS and the NPJ was proposed as
σ ( n ) = a n + b .
Methods to solve the parameters a and b were given, and a mathematical model of UCS and the NPJ was obtained as
σ ( n ) = ( 22.137 1.488 n e 0.001 l ) e 0.0053 l 0.163 n + 1.489 .
The verification program proved that the proposed mathematical model is still applicable after the angle of the parallel joints changes.
(2)
A mathematical model of UCS and rock size was proposed as
σ ( l ) = d + f e g l
Methods to solve the parameters d, f, and g were given, and a mathematical model of the UCS and rock size was obtained as
σ ( l ) = ( 1.534 n + 22.52 ) e ( 4.285 × 10 4 + 0.004 ) l 0.149 n + 2.674 .
The verification program proved that the proposed mathematical model is still applicable after the angle of the parallel joints changes.
(3)
The relationship between the characteristic size of the rock and the NPJ was studied, and a mathematical model of the characteristic size and the NPJ was obtained as
L ( n ) = 63.377 n + 1218.46 .
(4)
The relationship between the characteristic strength of the rock and the NPJ was studied, and a mathematical model of the characteristic strength and the NPJ was obtained as
σ w ( n ) = 0.155 n + 2.79 .

Author Contributions

G.H.: Conceptualization, Methodology, Writing—Original Draft Preparation, Writing—Review and Editing. G.M.: Software, Investigation, Writing—Original Draft Preparation. J.L.: Investigation, Data Curation. K.Q.: Writing—Review and Editing. All authors have read and agreed to the published version of the manuscript.

Funding

The authors appreciate the support of the Zhejiang Collaborative Innovation Center for Prevention and Control of Mountain Geological Hazards (PCMGH-2017-Y-05) and the Key Laboratory of Rock Mechanics and Geohazards of Zhejiang Province (ZGRMG-2019-07).

Data Availability Statement

The data presented in this study are available on request from the corresponding author.

Conflicts of Interest

The authors declare that there are no conflict of interest regarding the publication of this paper.

References

  1. Xia, C.; Sun, Z. Engineering Mechanics of Rock Joints; Tongji University Press: Shanghai, China, 2002; pp. 1–5. [Google Scholar]
  2. Du, S. Engineering Properties of Rock Discontinuities; Earthquake Press: Beijing, China, 1999. [Google Scholar]
  3. Hudson, J.A.; Crouch, S. Soft, Stiff and servo-controlled testing machines. Eng. Geol. 1972, 6, 155–189. [Google Scholar] [CrossRef]
  4. Fu, W. Experimental Study on Size Effect of Uniaxial Compressive Strength of Rock with Different Height-diameter Ratio. Resour. Environ. Eng. 2019, 2, 232–234. [Google Scholar]
  5. Lv, L.; Song, L.; Liao, H.; Li, H.; Zhang, T. Size Effect Study of Red Soft Rock Based on Grey Relating Analysis Theory. Chin. J. Undergr. Space Eng. 2018, 14, 1571–1576. [Google Scholar]
  6. Zhao, F.; Wang, H.J.; He, M.C.; Yuan, G.-X.; Lou, Y.-W. Acoustic emission characteristics of granite specimens with different heights in rockburst tests. Rock Soil Mech. 2019, 40, 135–146. [Google Scholar]
  7. Liu, B.; Zhang, J.; Du, Q.; Tu, J. A study of size effect for compression strength of rock. Chin. J. Rock Mech. Eng. 1998, 17, 611–614. [Google Scholar]
  8. Tang, C.A. Numerical simulation of rock failure and associated seismicity. Int. J. Rock Mech. Min. Sci. 1997, 34, 249–262. [Google Scholar] [CrossRef]
  9. Luo, Z.; Chen, C.; Zou, B.; Tao, Y. Numerical Simulation of Rock Strength Size Effect under Different Boundary Conditions. Bull. Sci. Technol. 2019, 35, 13–18. [Google Scholar]
  10. Wu, J.; Feng, M.; Xu, J.; Qiu, P.; Wang, Y.; Han, G. Particle Size Distribution of Cemented Rockfill Effects on Strata Stability in Filling Mining. Minerals 2018, 8, 407. [Google Scholar] [CrossRef] [Green Version]
  11. Wang, C.Y.; Du, X.Y. Comparative analysis of rock size effect test and RFPA~(3D) numerical simulation. Ind. Miner. Process. 2018, 47, 28–30. [Google Scholar]
  12. Wang, P.X.; Cao, P.; Pu, C.Z.; Fan, X.; Wang, C.C. Effect of the density and inclination of joints on the strength and deformation properties of rock-like specimens under uniaxial compression. Chin. J. Eng. 2017, 39, 494–501. [Google Scholar]
  13. Wang, Y.; Tang, J.; Dai, Z.; Yi, T. Experimental study on mechanical properties and failure modes of low-strength rock samples containing different fissures under uniaxial compression. Eng. Fract. Mech. 2018, 197, 1–20. [Google Scholar]
  14. Zhao, S.; Wang, Y.; Li, Y.; Li, H.; Xu, Z.; Gong, X. Geochemistry and Mineralogy of Lower Paleozoic Heituao Shale from Tadong Low Uplift of Tarim Basin, China: Implication for Shale Gas Development. Minerals 2021, 11, 635. [Google Scholar]
  15. Yang, Z.; Gao, Y.; Wu, S.C.; Cheng, Z.Q.; Jin, A.B. Study of the influence of joint parameters on rock mass strength based on equivalent rock mass technology. J. China Univ. Min. Technol. 2018, 47, 979986. [Google Scholar]
  16. Meng, Q.; Wang, H.; Xu, W.; Chen, Y. Numerical homogenization study on the effects of columnar jointed structure on the mechanical properties of rock mass. Int. J. Rock Mech. Min. Sci. 2019, 124, 104–127. [Google Scholar] [CrossRef]
  17. Gao, G.; Meguid, M.A.; Chouinard, L.E. On the role of pre-existing discontinuities on the micromechanical behavior of confined rock samples: A numerical study. Acta Geotech. 2020, 15, 3483–3510. [Google Scholar] [CrossRef]
  18. Liu, S.; MA, F.; Zhao, H.; Liu, G.; Guo, J.; Sun, Q. RJM based numerical study of strength and failure modes of rock mass with discontinuous joints. J. Eng. Geol. 2018, 26, 1342–1350. [Google Scholar]
  19. Patel, S.; Martin, C.D. Effect of Stress Path on the Failure Envelope of Intact Crystalline Rock at Low Confining Stress. Minerals 2020, 10, 1119. [Google Scholar] [CrossRef]
  20. Liu, C.; Yang, M.; Han, H.; Yue, W. Numerical simulation of fracture characteristics of jointed rock masses under blasting load. Eng. Comput. 2019, 36, 1835–1851. [Google Scholar] [CrossRef]
  21. Cao, R.H.; Cao, P.; Lin, H.; Pu, C.; Ou, K. Mechanical Behavior of Brittle Rock-Like Specimens with Pre-existing Fissures Under Uniaxial Loading: Experimental Studies and Particle Mechanics Approach. Rock Mech. Rock Eng. 2016, 49, 763–783. [Google Scholar] [CrossRef]
  22. Pan, J.; Ren, F.; Cai, M. Effect of Joint Density on Rockburst Proneness of the Elastic-Brittle-Plastic Rock Mass. Shock Vib. 2021, 2021, 5574325. [Google Scholar] [CrossRef]
  23. Liang, Z.; Zhang, Y.; Tang, S.; Li, L.; Tang, C. Size effect of rock masses and associated representative element properties. Chin. J. Rock Mech. Eng. 2013, 32, 1157–1166. [Google Scholar]
  24. Gasmi, H.; Touahmia, M.; Torchani, A.; Hamdi, E.; Boundjemline, A. Determination of Fractured Rock’s Representative Elementary Volume by a Numerical Simulation Method. Eng. Technol. Appl. Sci. Res. 2019, 9, 4448–4451. [Google Scholar] [CrossRef]
  25. Liu, Y.; Wang, Q.; Chen, J.; Song, S.; Zhan, J.; Han, X. Determination of Geometrical REVs Based on Volumetric Fracture Intensity and Statistical Tests. Appl. Sci. 2018, 8, 800. [Google Scholar] [CrossRef] [Green Version]
  26. Loyola, A.C.; Pereira, J.M.; Neto, M. General Statistics-Based Methodology for the Determination of the Geometrical and Mechanical Representative Elementary Volumes of Fractured Media. Rock Mech. Rock Eng. 2021, 54, 1841–1861. [Google Scholar] [CrossRef]
  27. Cui, Z.; Chen, P.Z.; Sheng, Q. Estimation of REV for Danba schist based on 3D synthetic rock mass technique. IOP Conf. Ser. Earth Environ. Sci. 2020, 570, 032001. [Google Scholar]
  28. Chong, Z.; Yao, Q.; Li, X.; Shivakumar, K. Acoustic emission investigation on scale effect and anisotropy of jointed rock mass by the discrete element method. Arab. J. Geosci. 2020, 13, 324. [Google Scholar] [CrossRef]
  29. Ma, C.; Yao, W.M.; Yao, Y.; Li, J. Simulating Strength Parameters and Size Effect of Stochastic Jointed Rock Mass using DEM Method. KSCE J. Civ. Eng. 2018, 22, 4872–4881. [Google Scholar] [CrossRef]
  30. Liang, Z.; Wu, N.; Li, Y.; Li, H.; Li, W. Numerical Study on Anisotropy of the Representative Elementary Volume of Strength and Deformability of Jointed Rock Masses. Rock Mech. Rock Eng. 2019, 52, 4387–4402. [Google Scholar] [CrossRef]
  31. Niazmandi, M.M.; Binesh, S.M. A DFN–DEM Approach to Study the Influence of Confinement on the REV Size of Fractured Rock Masses. Iran. J. Sci. Technol. Trans. Civ. Eng. 2020, 44, 587–601. [Google Scholar] [CrossRef]
  32. Chen, Q.; Yin, T.; Niu, W.; Zheng, W.; Liu, J. Study of the geometrical size effect of a fractured rock mass based on the modified blockiness evaluation method. Arab. J. Geosci. 2018, 11, 286. [Google Scholar] [CrossRef]
Figure 1. Rock model with different NPJs when size is 100 × 100 mm.
Minerals 12 00062 g001
Figure 2. Rock model of different sizes when the NPJ is 2.
Minerals 12 00062 g002
Figure 3. The loading method and boundary control diagram.
Minerals 12 00062 g003
Figure 4. Stress–strain curves with different NPJs and sizes.
Minerals 12 00062 g004
Figure 5. Fitting curves of UCS with different NPJs.
Minerals 12 00062 g005
Figure 6. Fitting curve of parameter a and size.
Minerals 12 00062 g006
Figure 7. Fitting curve of parameter b and size.
Minerals 12 00062 g007
Figure 8. Stress–strain curves with different sizes and NPJs.
Minerals 12 00062 g008
Figure 9. Fitting curves of UCS with different rock sizes.
Minerals 12 00062 g009
Figure 10. Fitting curve of parameter d.
Minerals 12 00062 g010
Figure 11. Fitting curve of parameter f.
Minerals 12 00062 g011
Figure 12. Fitting curve of parameter g.
Minerals 12 00062 g012
Figure 13. Fitting curve between the characteristic size and NPJ.
Minerals 12 00062 g013
Figure 14. Fitting curve between the characteristic strength and NPJ.
Minerals 12 00062 g014
Figure 15. The stress–strain curve with different NPJs when joint angle is 45°.
Minerals 12 00062 g015
Figure 16. Fitting curve of UCS with different NPJs when parallel joint angles are 0° and 45°.
Minerals 12 00062 g016
Figure 17. The stress–strain curve of different rock sizes when the parallel joint angle is 45°.
Minerals 12 00062 g017
Figure 18. Fitting curve of UCS with differently sized rocks at parallel joint angles of 0° and 45°.
Minerals 12 00062 g018
Table 1. Summary of research plans and working conditions.
Numerical SimulationNumber of Joints (Bar)Summary of Research Plans and Working Conditions
Program 1Program 2Program 3Program 4Program 5
Size 50 mmSize 100 mmSize 200 mmSize 300 mmSize 400 mm
Program 622 × 502 × 1002 × 2002 × 3002 × 400
Program 744 × 504 × 1004 × 2004 × 3004 × 400
Program 866 × 506 × 1006 × 2006 × 3006 × 400
Program 988 × 508 × 1008 × 2008 × 3008 × 400
Program 101010 × 5010 × 10010 × 20010 × 30010 × 400
Table 2. Verification program 1.
Verification ProgramRock Size (mm)Parallel Joint Angle (°)Number of Joints (Bar)
110045246810
Table 3. Verification program 2.
Verification ProgramNumber of Joints (Bar)Parallel Joint Angle (°)Rock Size (mm)
224550100200300400
Table 4. Mechanical parameters of rock.
MaterialModulus of Elasticity (MPa)Uniaxial Compressive Strength (MPa)Poisson’s
Ratio
Internal Friction
Angle (°)
Rock4874101.340.2548.32
Joint1.11.50.3030
Table 5. Peak strength of rocks with different numbers of parallel joints.
Numerical SimulationRock Size (mm)Peak Strength of Rocks with Different Numbers of Parallel Joints (MPa)
Program 6Program 7Program 8Program 9Program 10
2 Joints4 Joints6 Joints8 Joints10 Joints
Program 15016.64412.15611.0487.3446.392
Program 210012.89710.68110.3646.7125.759
Program 32007.2296.4186.0373.7152.55
Program 43005.3144.5453.3393.0981.995
Program 54003.5822.9522.612.061.41
Table 6. Fitting relationship between rock UCS and the number of joints.
Rock Size (mm)Fitting FormulaFitting Coefficient (R2)
50 σ ( n ) = 1.266 n + 18.312 0.951
100 σ ( n ) = 0.912 n + 14.756 0.945
200 σ ( n ) = 0.603 n + 8.808 0.937
300 σ ( n ) = 0.404 n + 6.084 0.974
400 σ ( n ) = 0.262 n + 4.094 0.991
In the list, σ(n) is the UCS, units: MPa; n is the NPJ, units: bar.
Table 7. Values of parameters a and b.
ParameterRock Size
50 mm100 mm200 mm300 mm400 mm
a1.2660.9120.6030.4040.262
b18.31214.7568.8086.0844.094
Table 8. Peak strength with differently sized rocks.
Numerical SimulationNumber of Joints (Bar)Peak Strength with Differently Sized Rocks (MPa)
Program 1Program 2Program 3Program 4Program 5
50 mm100 mm200 mm300 mm400 mm
Program 6216.64412.8977.2295.3143.582
Program 7412.15610.6816.4184.5452.952
Program 8611.04810.3646.0373.3392.61
Program 987.3446.7123.7153.0982.06
Program 10106.3925.7592.551.9951.41
Table 9. Fitting relationship between UCS and rock size.
Number of Joints (Bar)Fitting FormulaFitting Coefficient (R2)
2 σ ( l ) = 2.277 + 20.186 e 0.0049 l 0.997
4 σ ( l ) = 2.127 + 15.614 e 0.0052 l 0.992
6 σ ( l ) = 1.854 + 13.751 e 0.0059 l 0.975
8 σ ( l ) = 1.570 + 8.743 e 0.0072 l 0.973
10 σ ( l ) = 1.063 + 8.280 e 0.0082 l 0.962
where σ(l) is the UCS of the rock, units: MPa; l is rock size, units: mm.
Table 10. Values of parameters d, f, and g.
ParameterValues of Parameters with Different NPJs
246810
d2.2772.1271.8541.5701.063
f20.18615.61413.7518.7438.28
g0.00490.00520.00590.00720.0082
Table 11. The relationship between the characteristic size and NPJ.
NPJ (Bar)246810
Characteristic size (mm)1079.06978.84862.58671.59598.92
Table 12. The relationship between the characteristic strength and NPJ.
NPJ (Bar)246810
Characteristic strength (MPa)2.382.221.941.641.12
Table 13. UCS with different NPJs at joint angles of 0° and 45°.
Parallel Joint Angle (°)UCS with Different NPJs at Joint Angles of 0° and 45° (MPa)
2 Joints4 Joints6 Joints8 Joints10 Joints
012.89710.68110.3646.7125.759
458.1226.9565.6424.872.248
Table 14. Compressive strength with different rock sizes at joint angles of 0° and 45°.
Parallel Joint Angle (°)Compressive Strength with Different Rock Sizes at Joint Angles of 0° and 45°(MPa)
50 mm100 mm200 mm300 mm400 mm
016.64412.8977.2295.3143.582
4510.7284.7922.4441.6941.241
Publisher’s Note: MDPI stays neutral with regard to jurisdictional claims in published maps and institutional affiliations.

