
Characteristics of Acoustic Emission Waveforms Induced by Hydraulic Fracturing of Coal under True Triaxial Stress in a Laboratory-Scale Experiment

 ,
,
Abstract
:1. Introduction
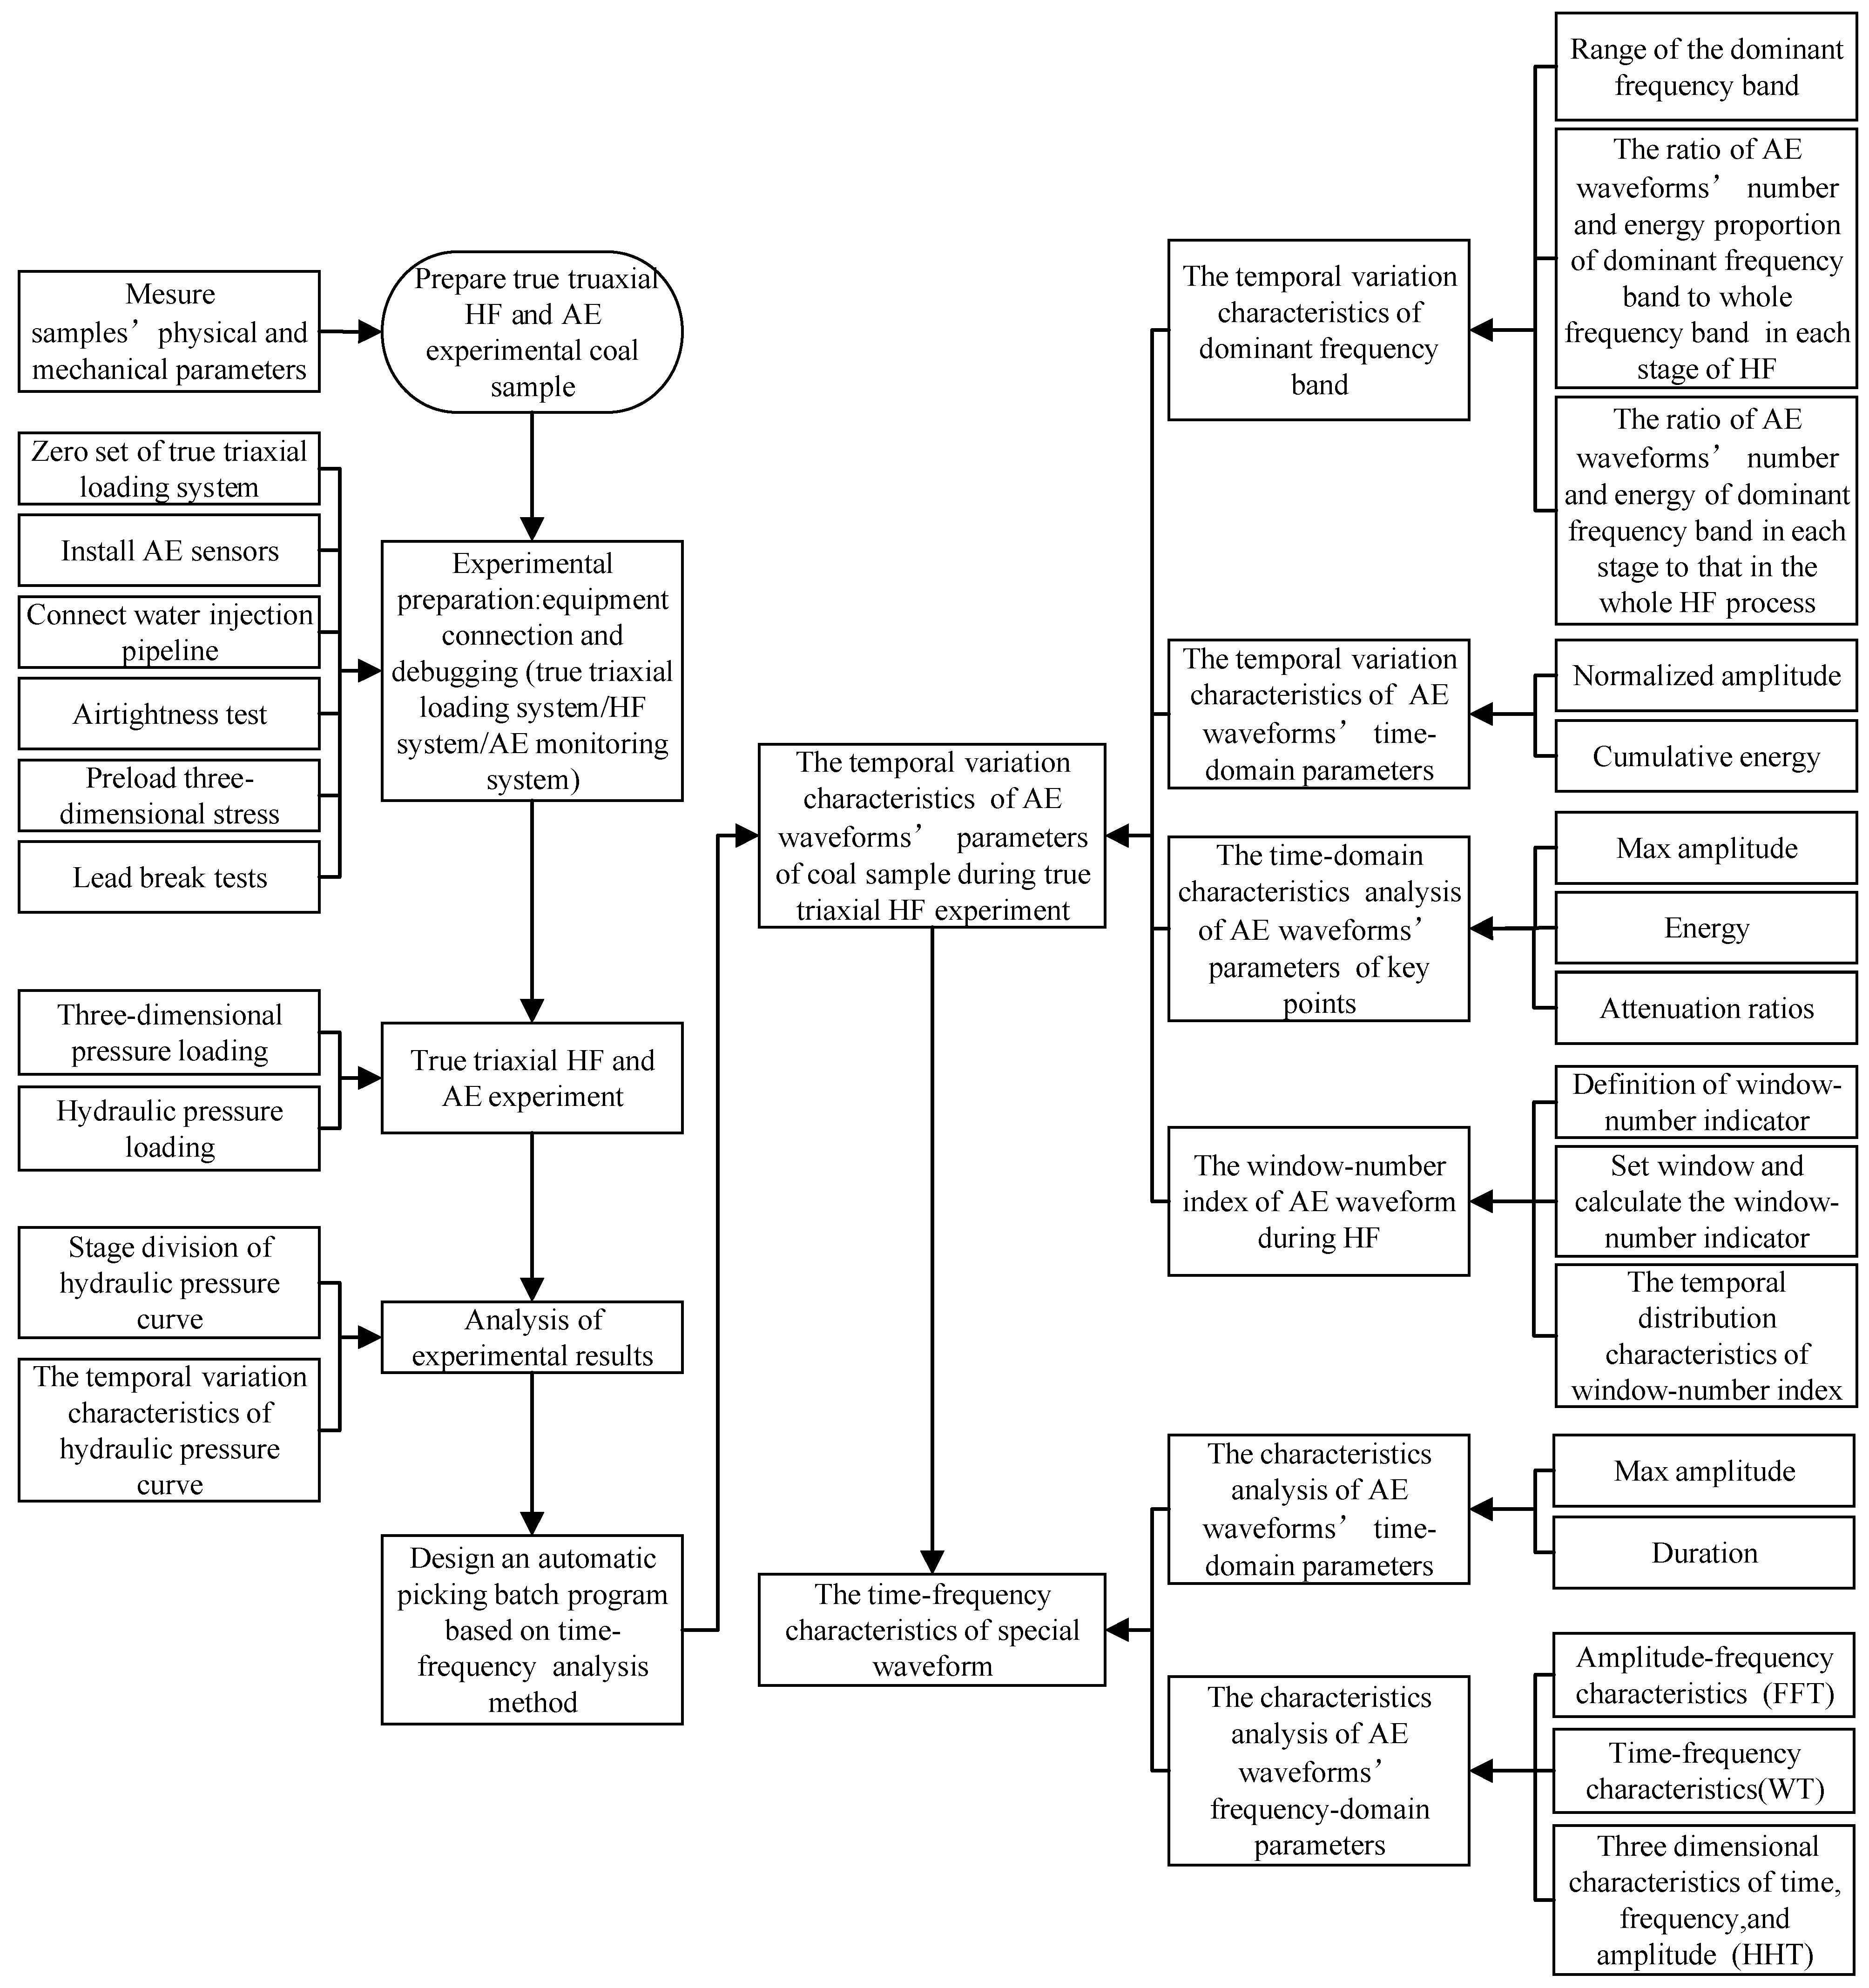
2. Experimental Program
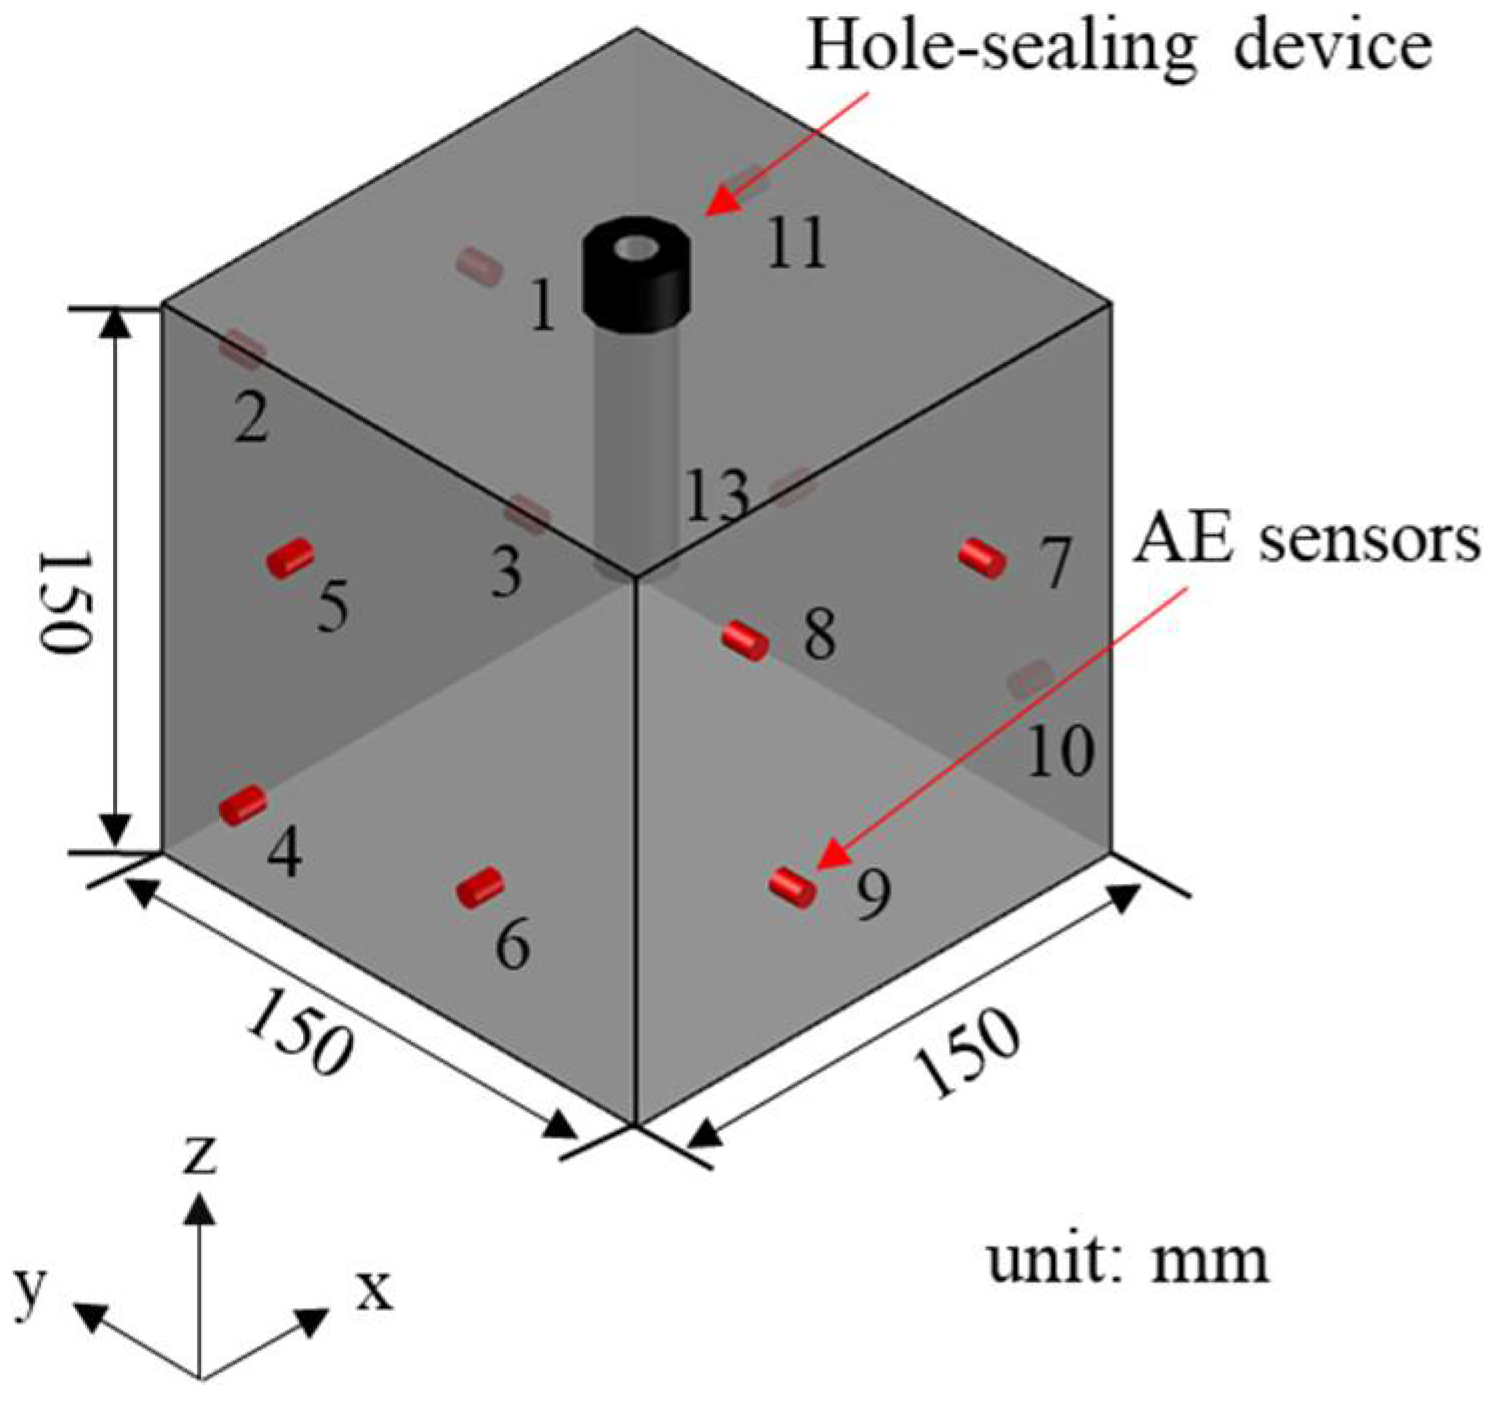
2.1. Coal Sample Preparation
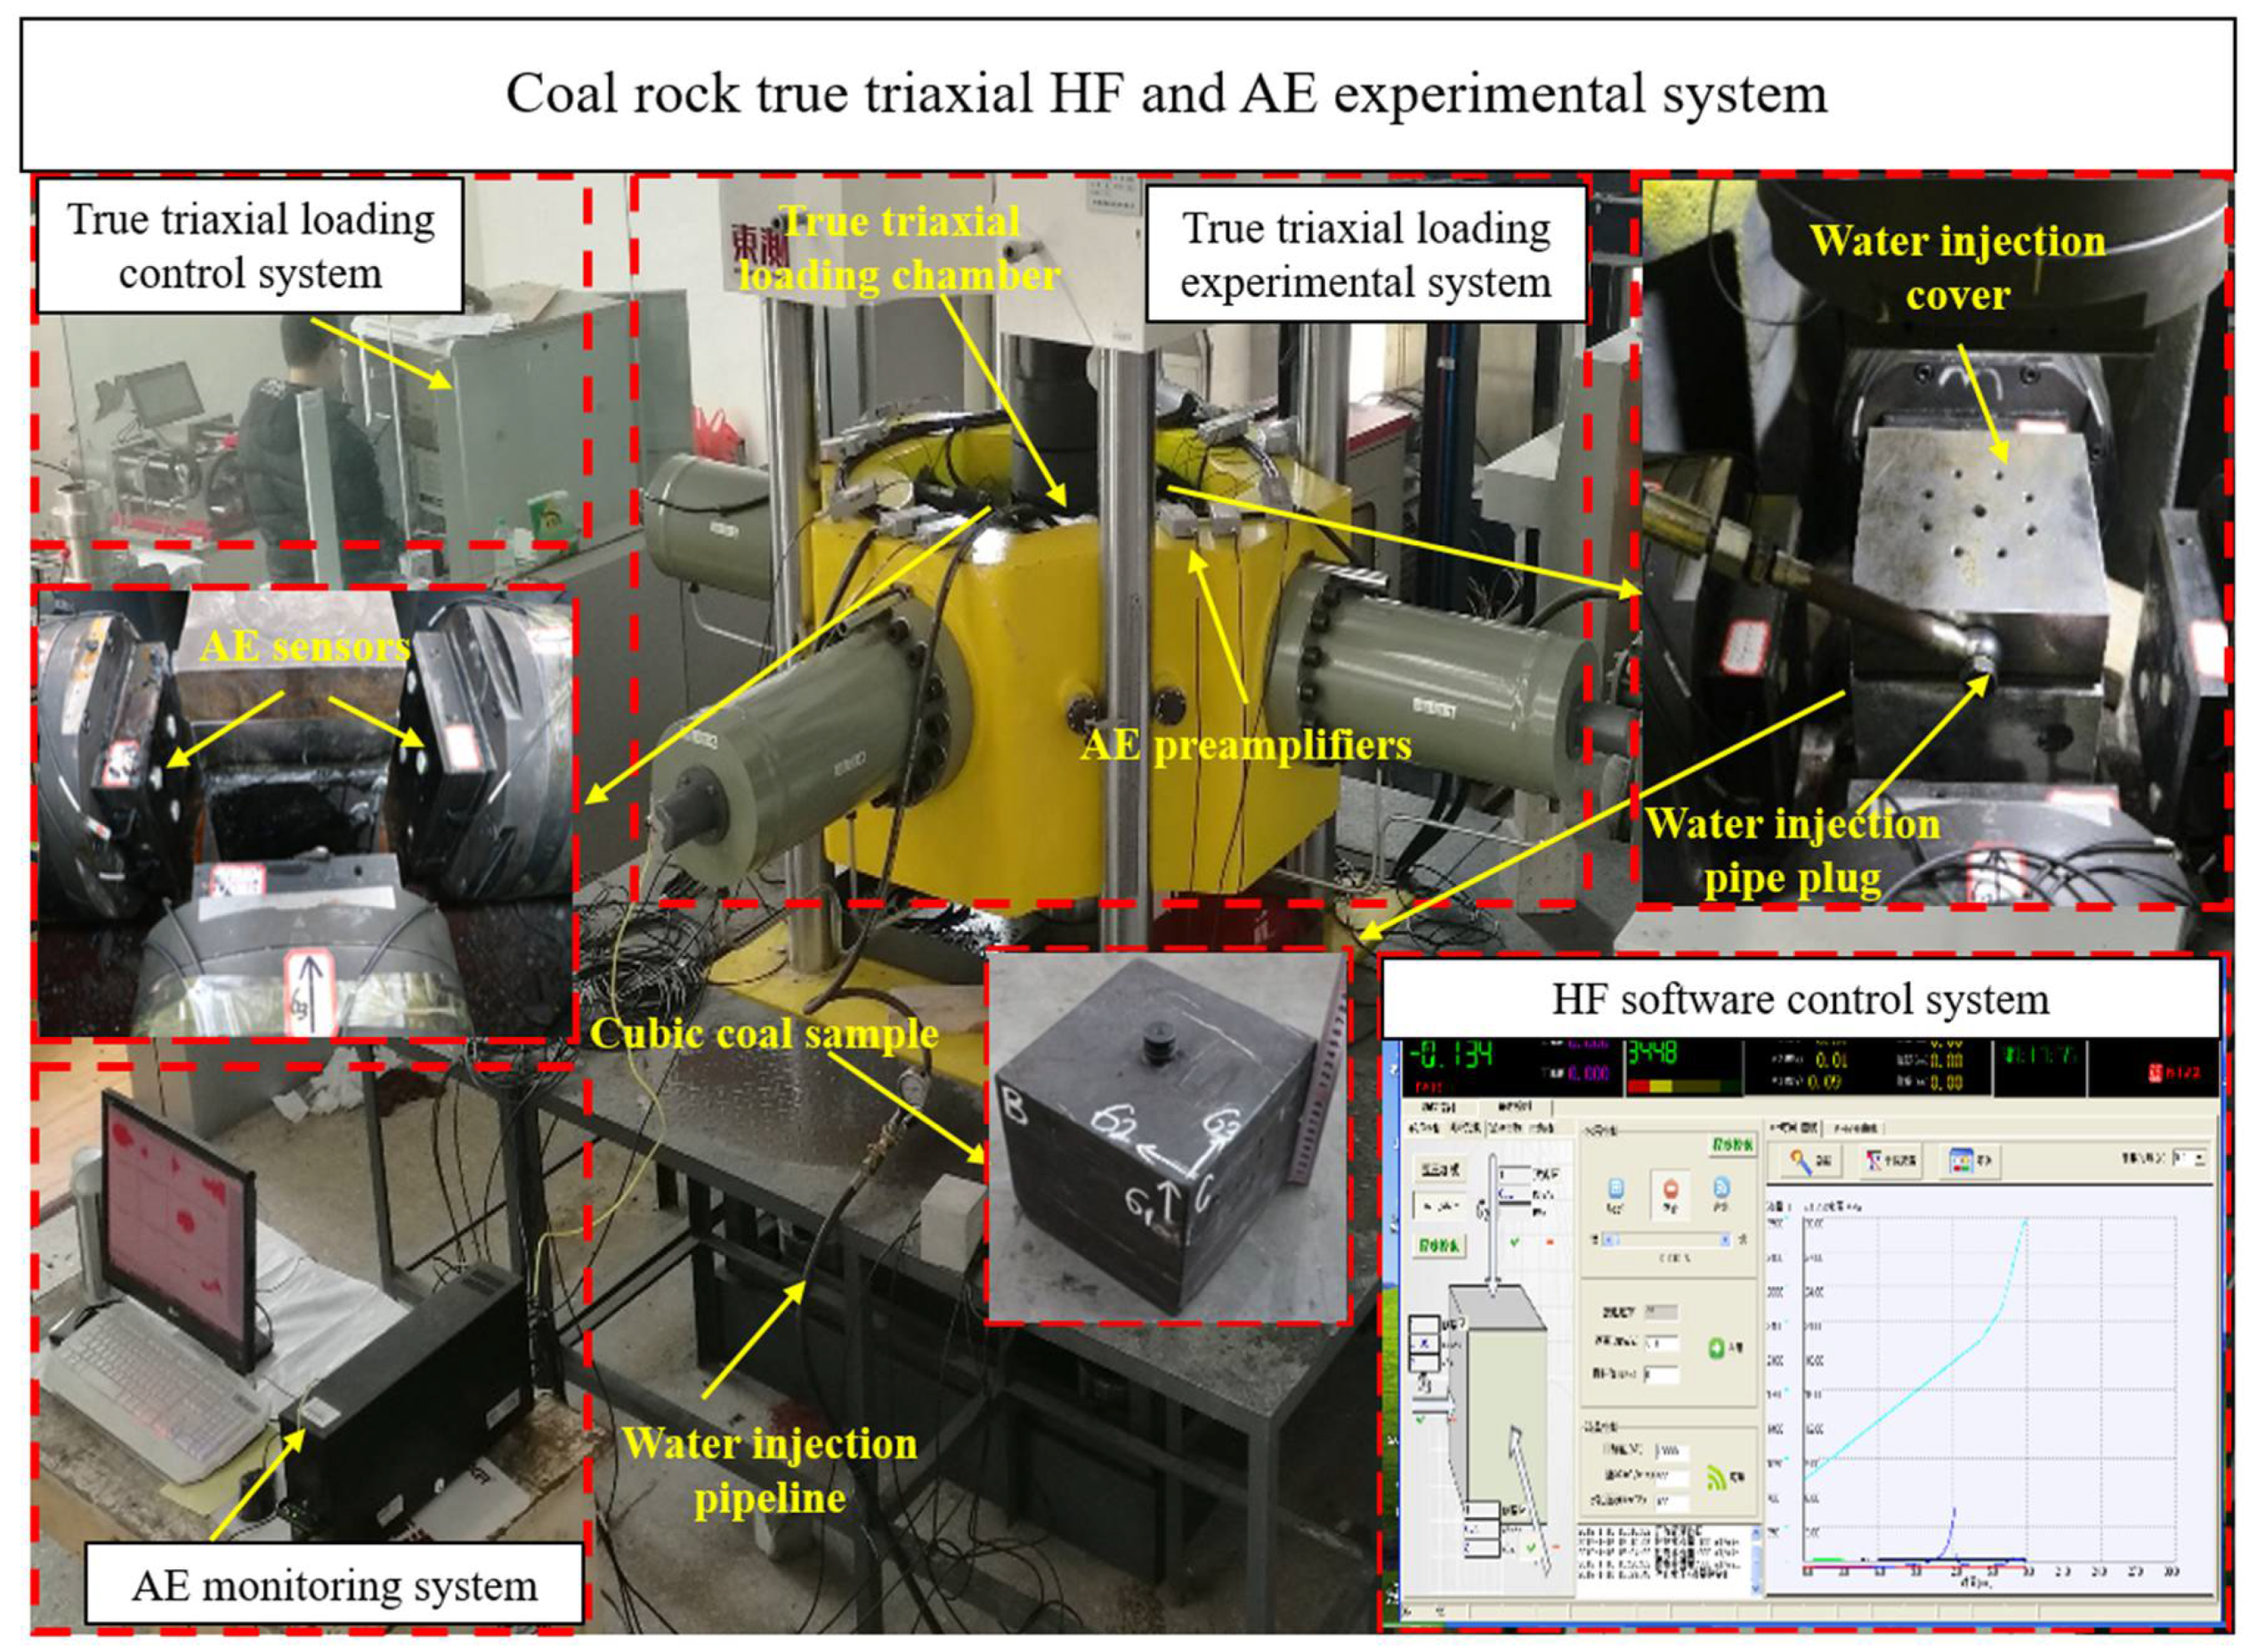
2.2. Laboratory Equipment
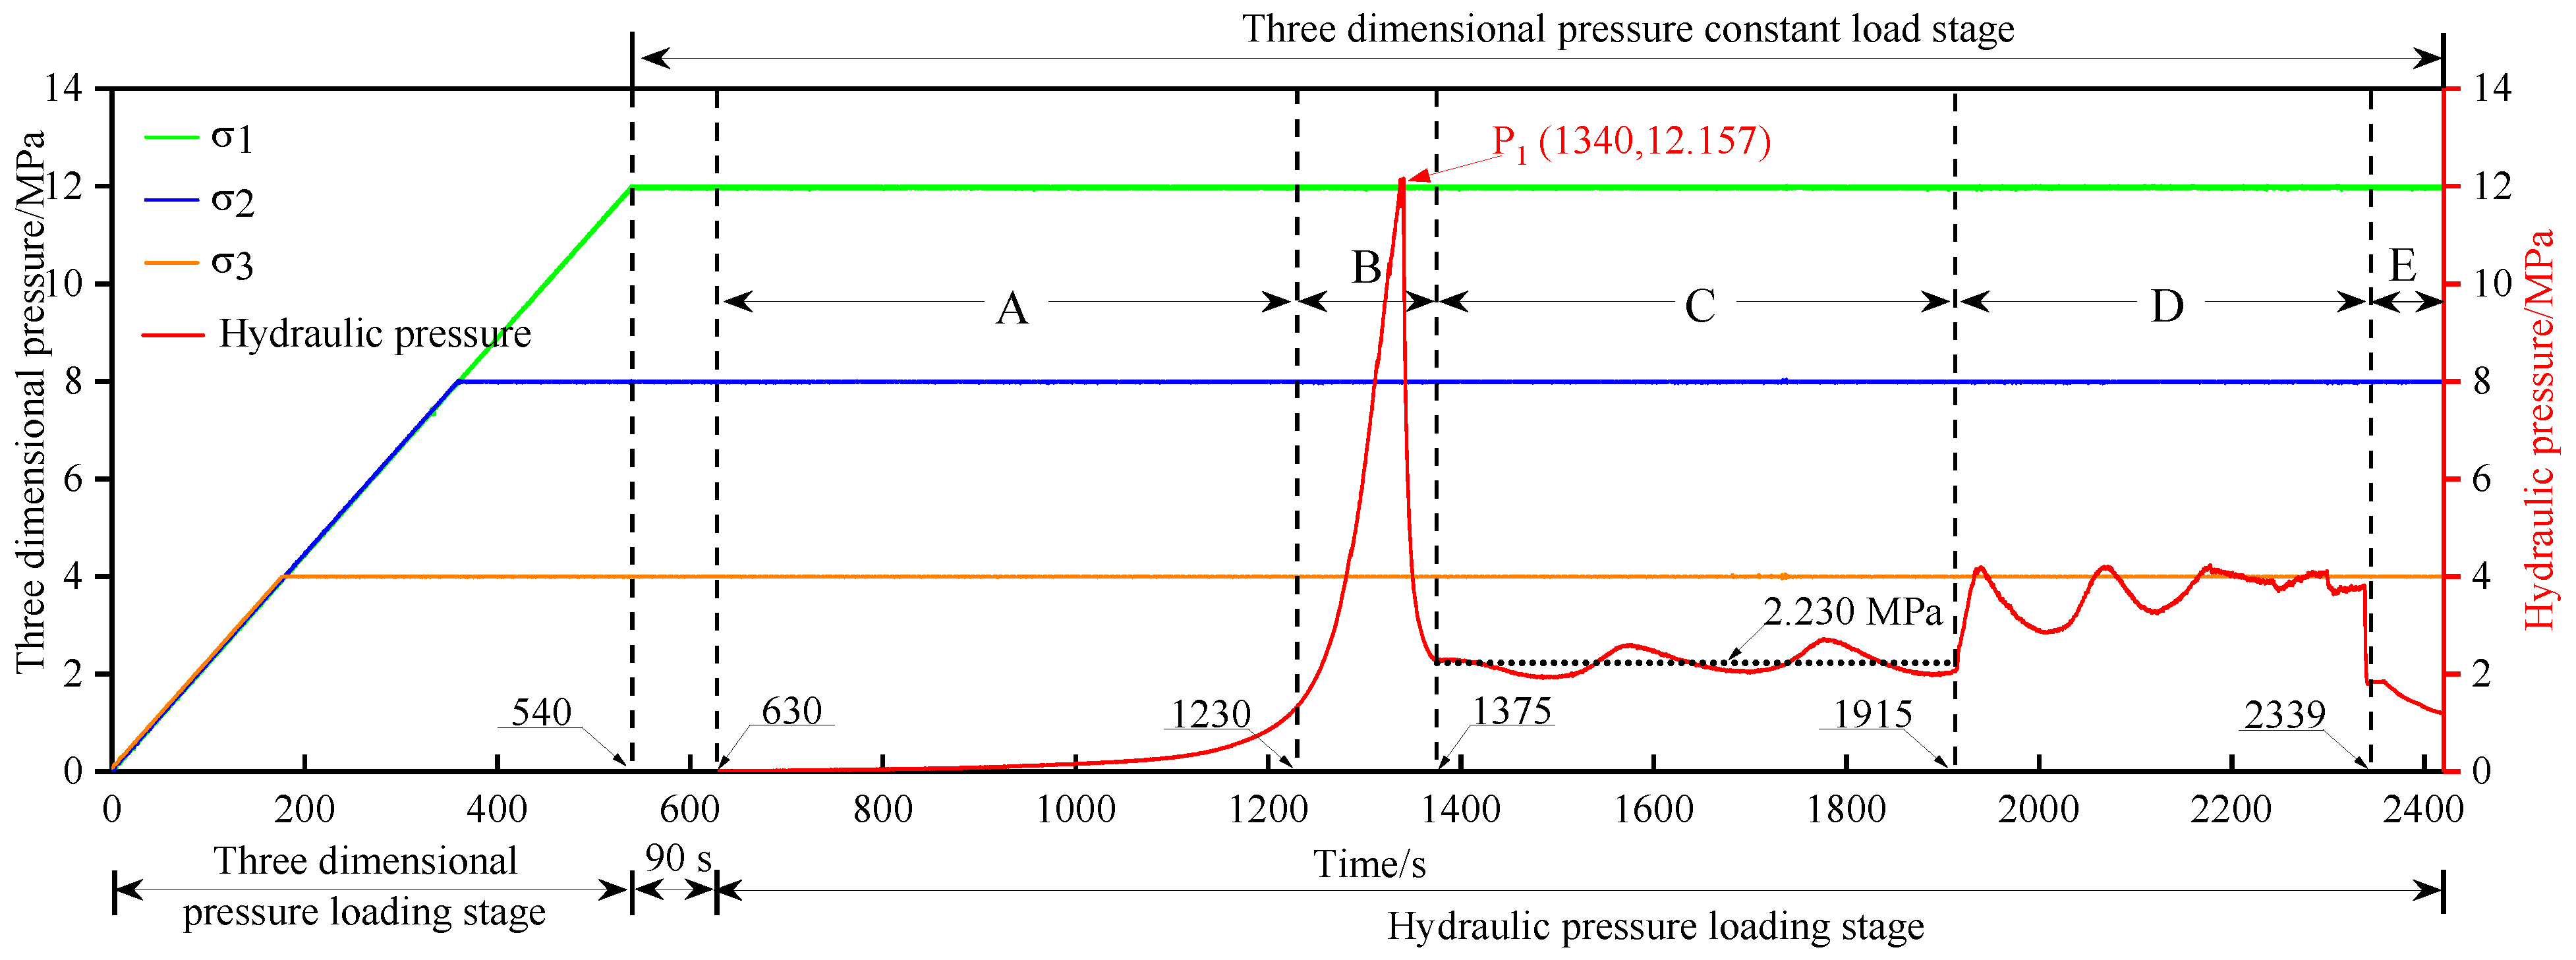
2.3. Experiment Process
3. Experimental Results and Analysis of True Triaxial HF
4. Temporal Variation Characteristics of AE Waveforms’ Parameters
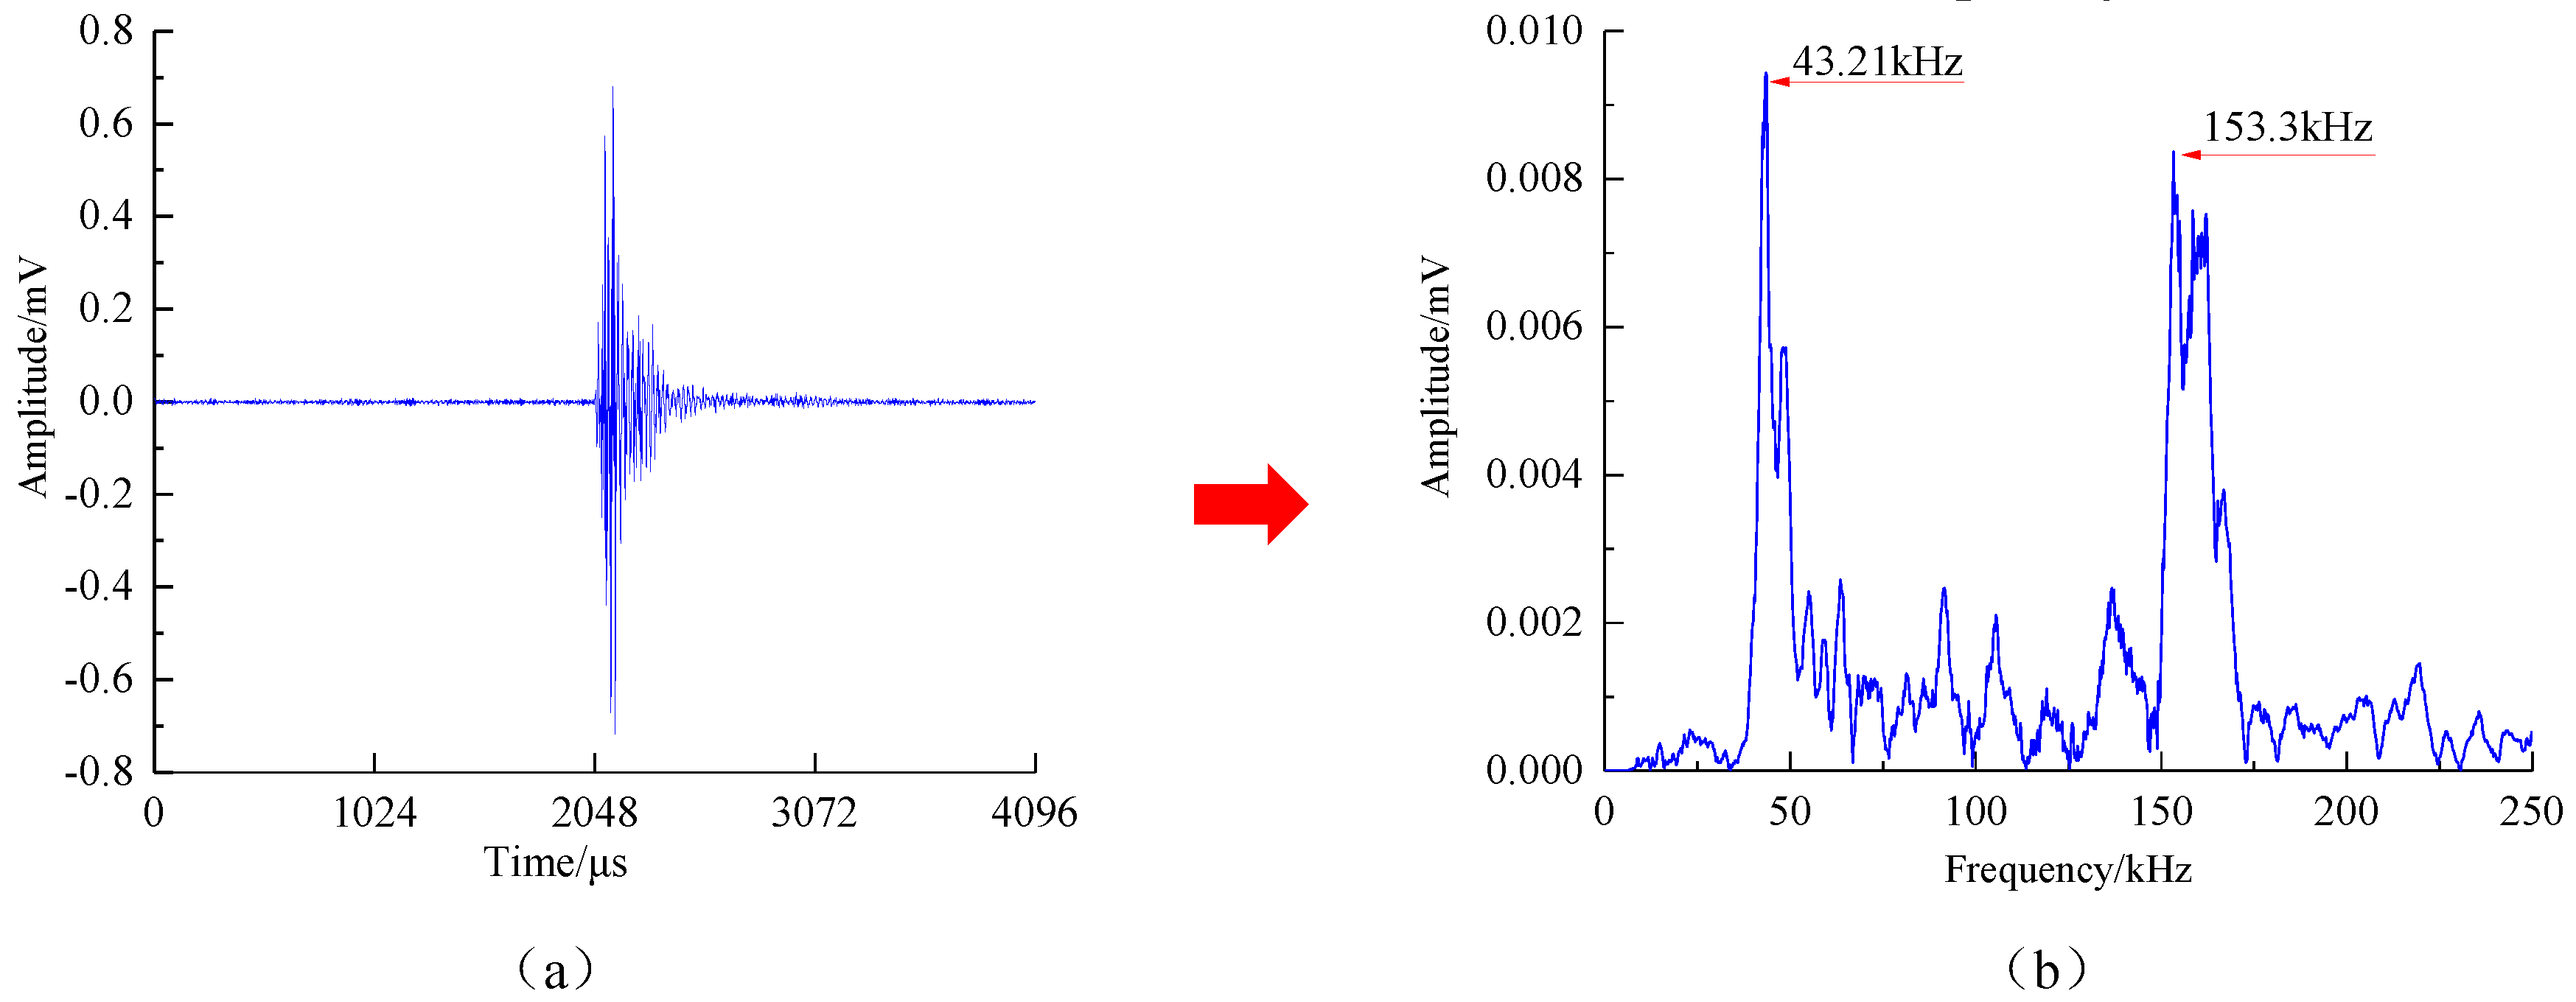
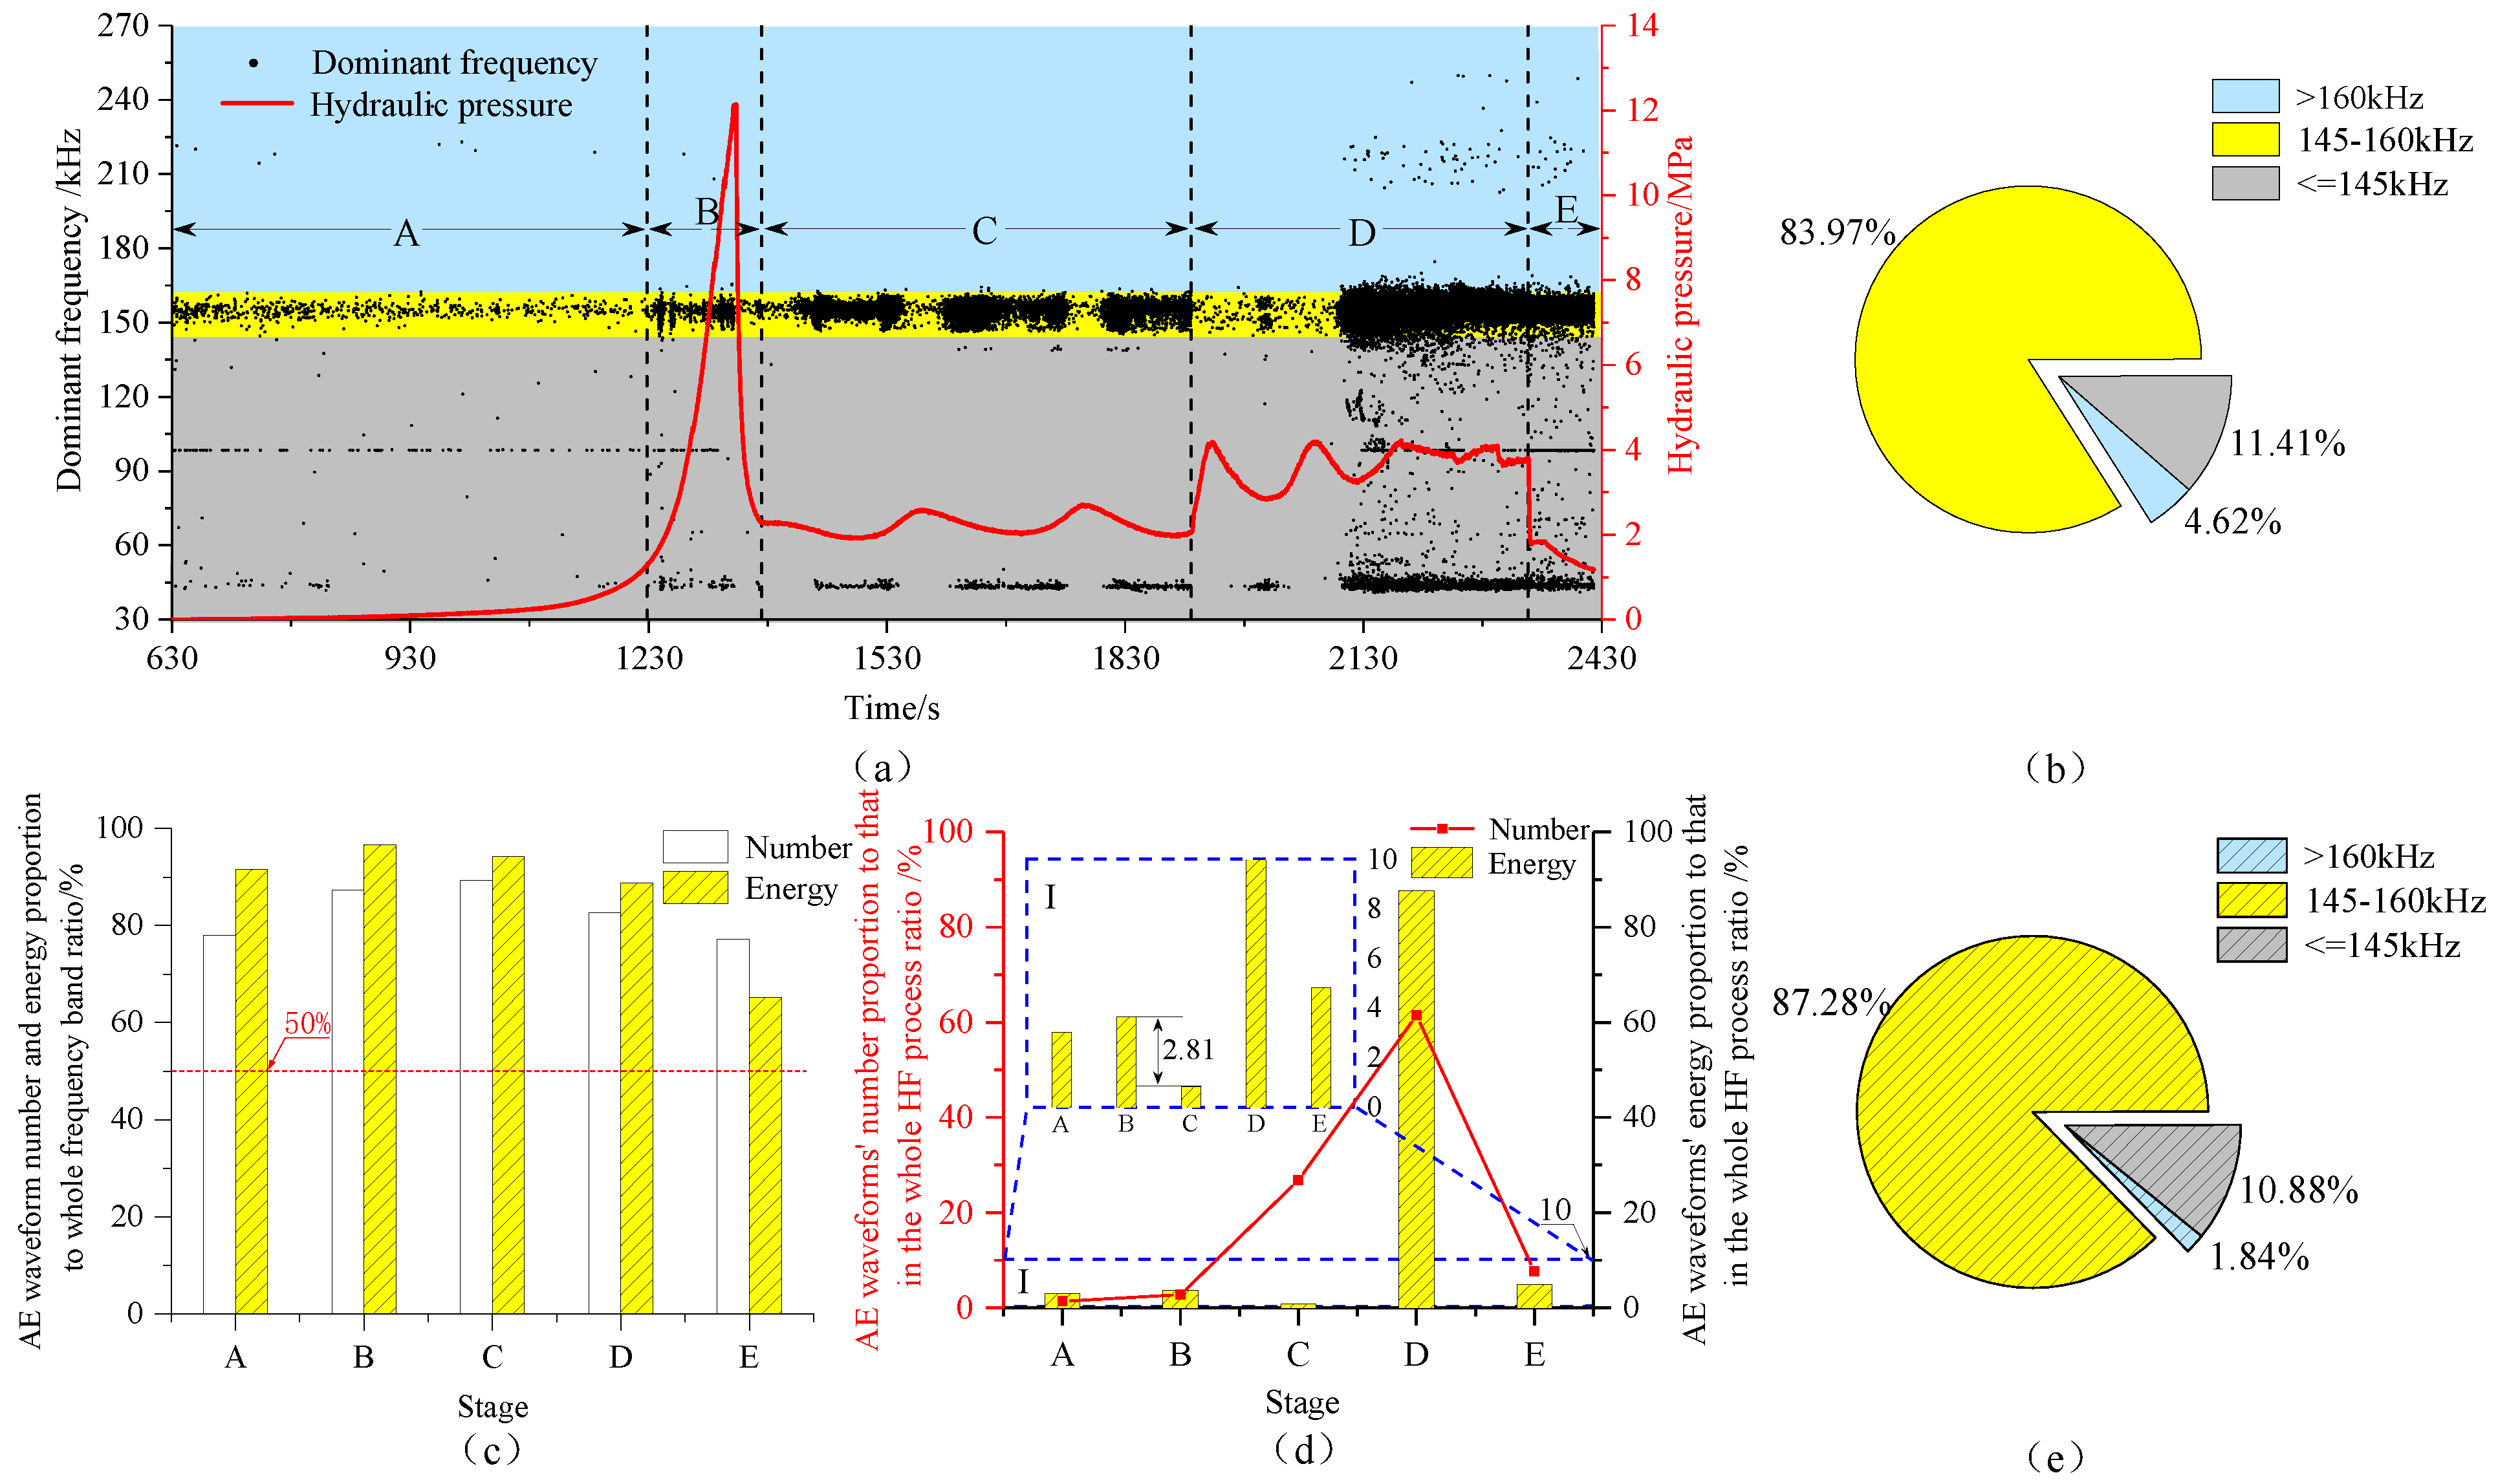
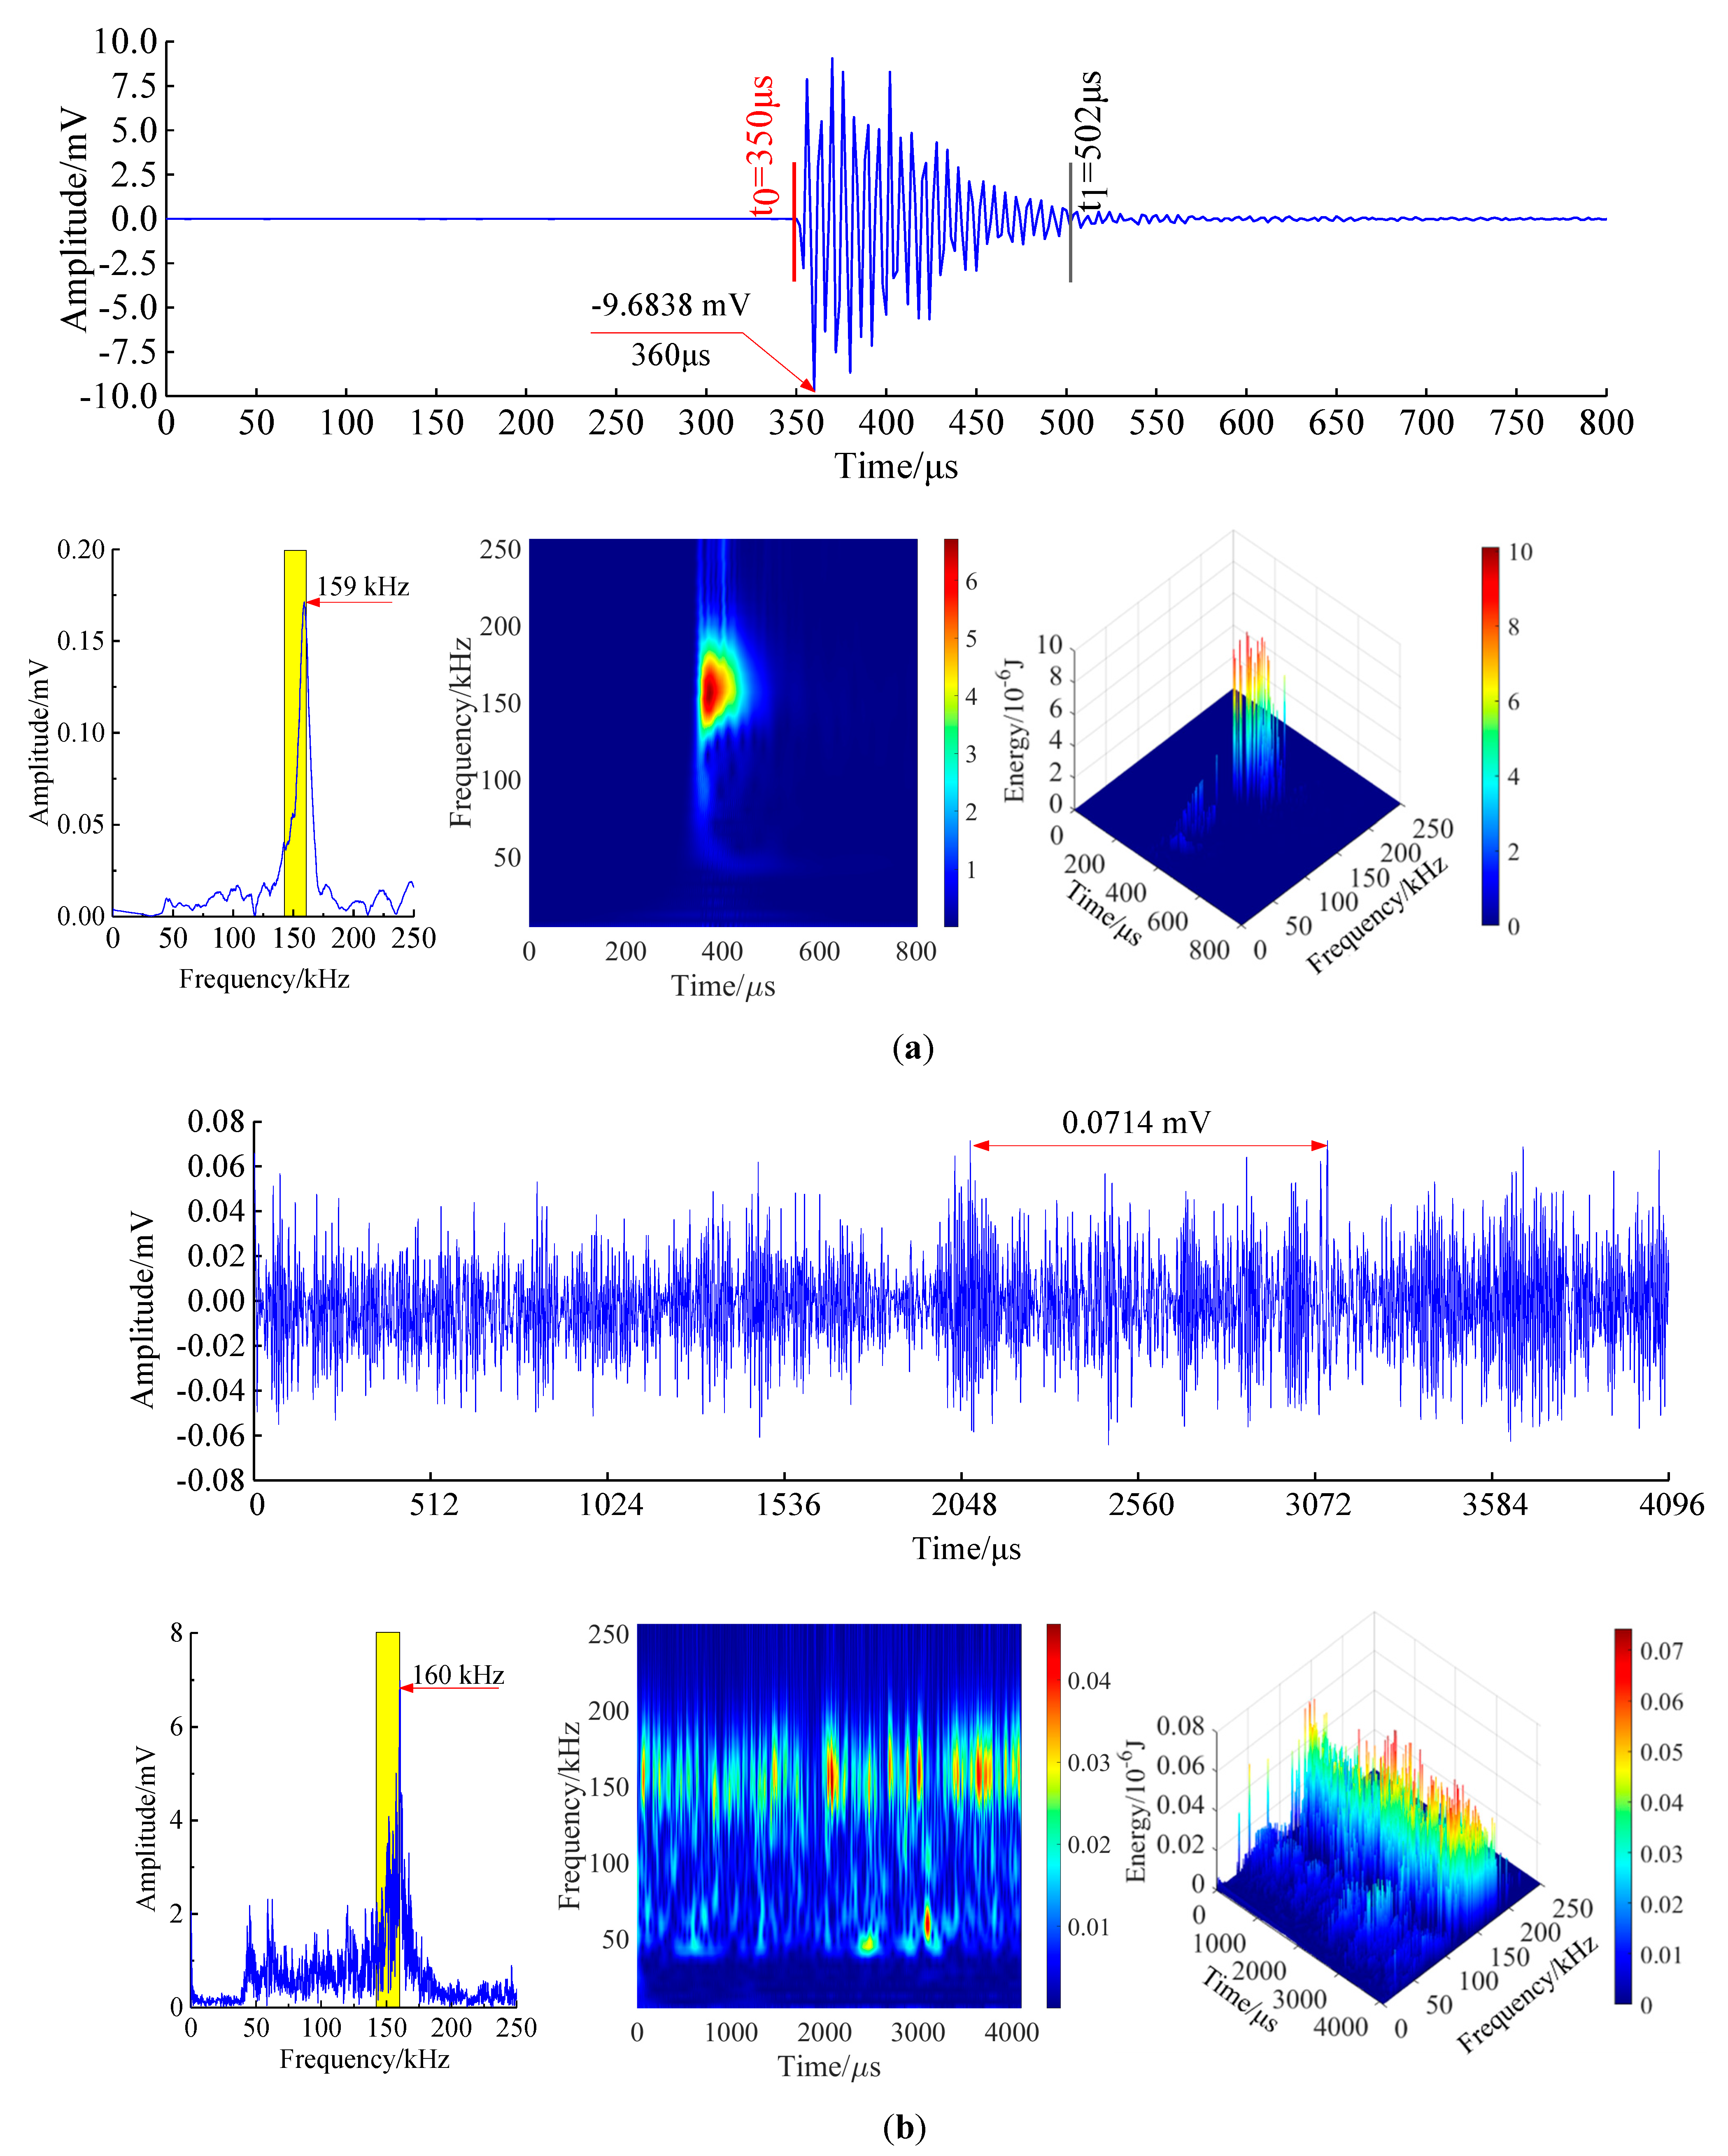
4.1. The Temporal Vatiation Characteristics of AE Waveforms’ Dominant Frequency and Energy
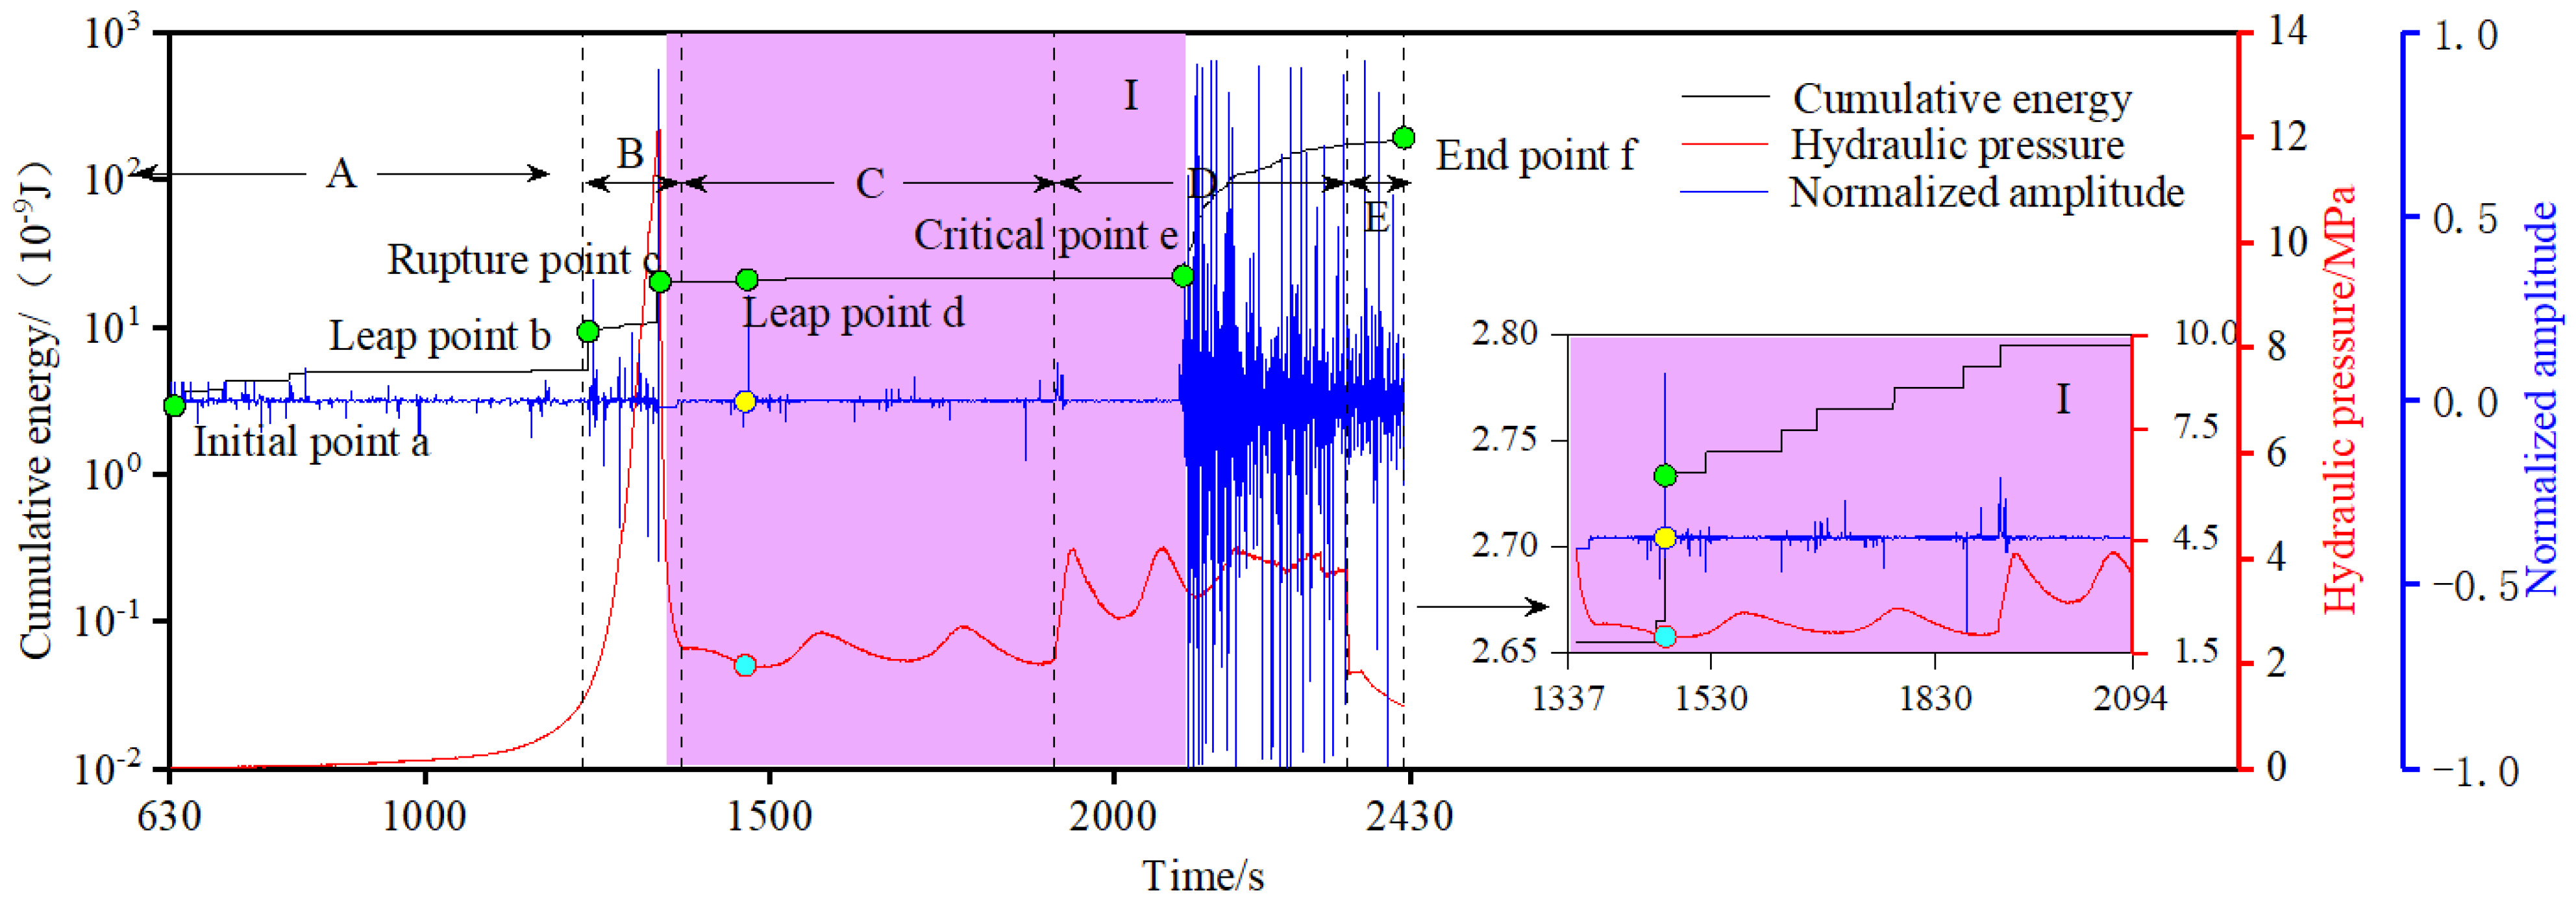
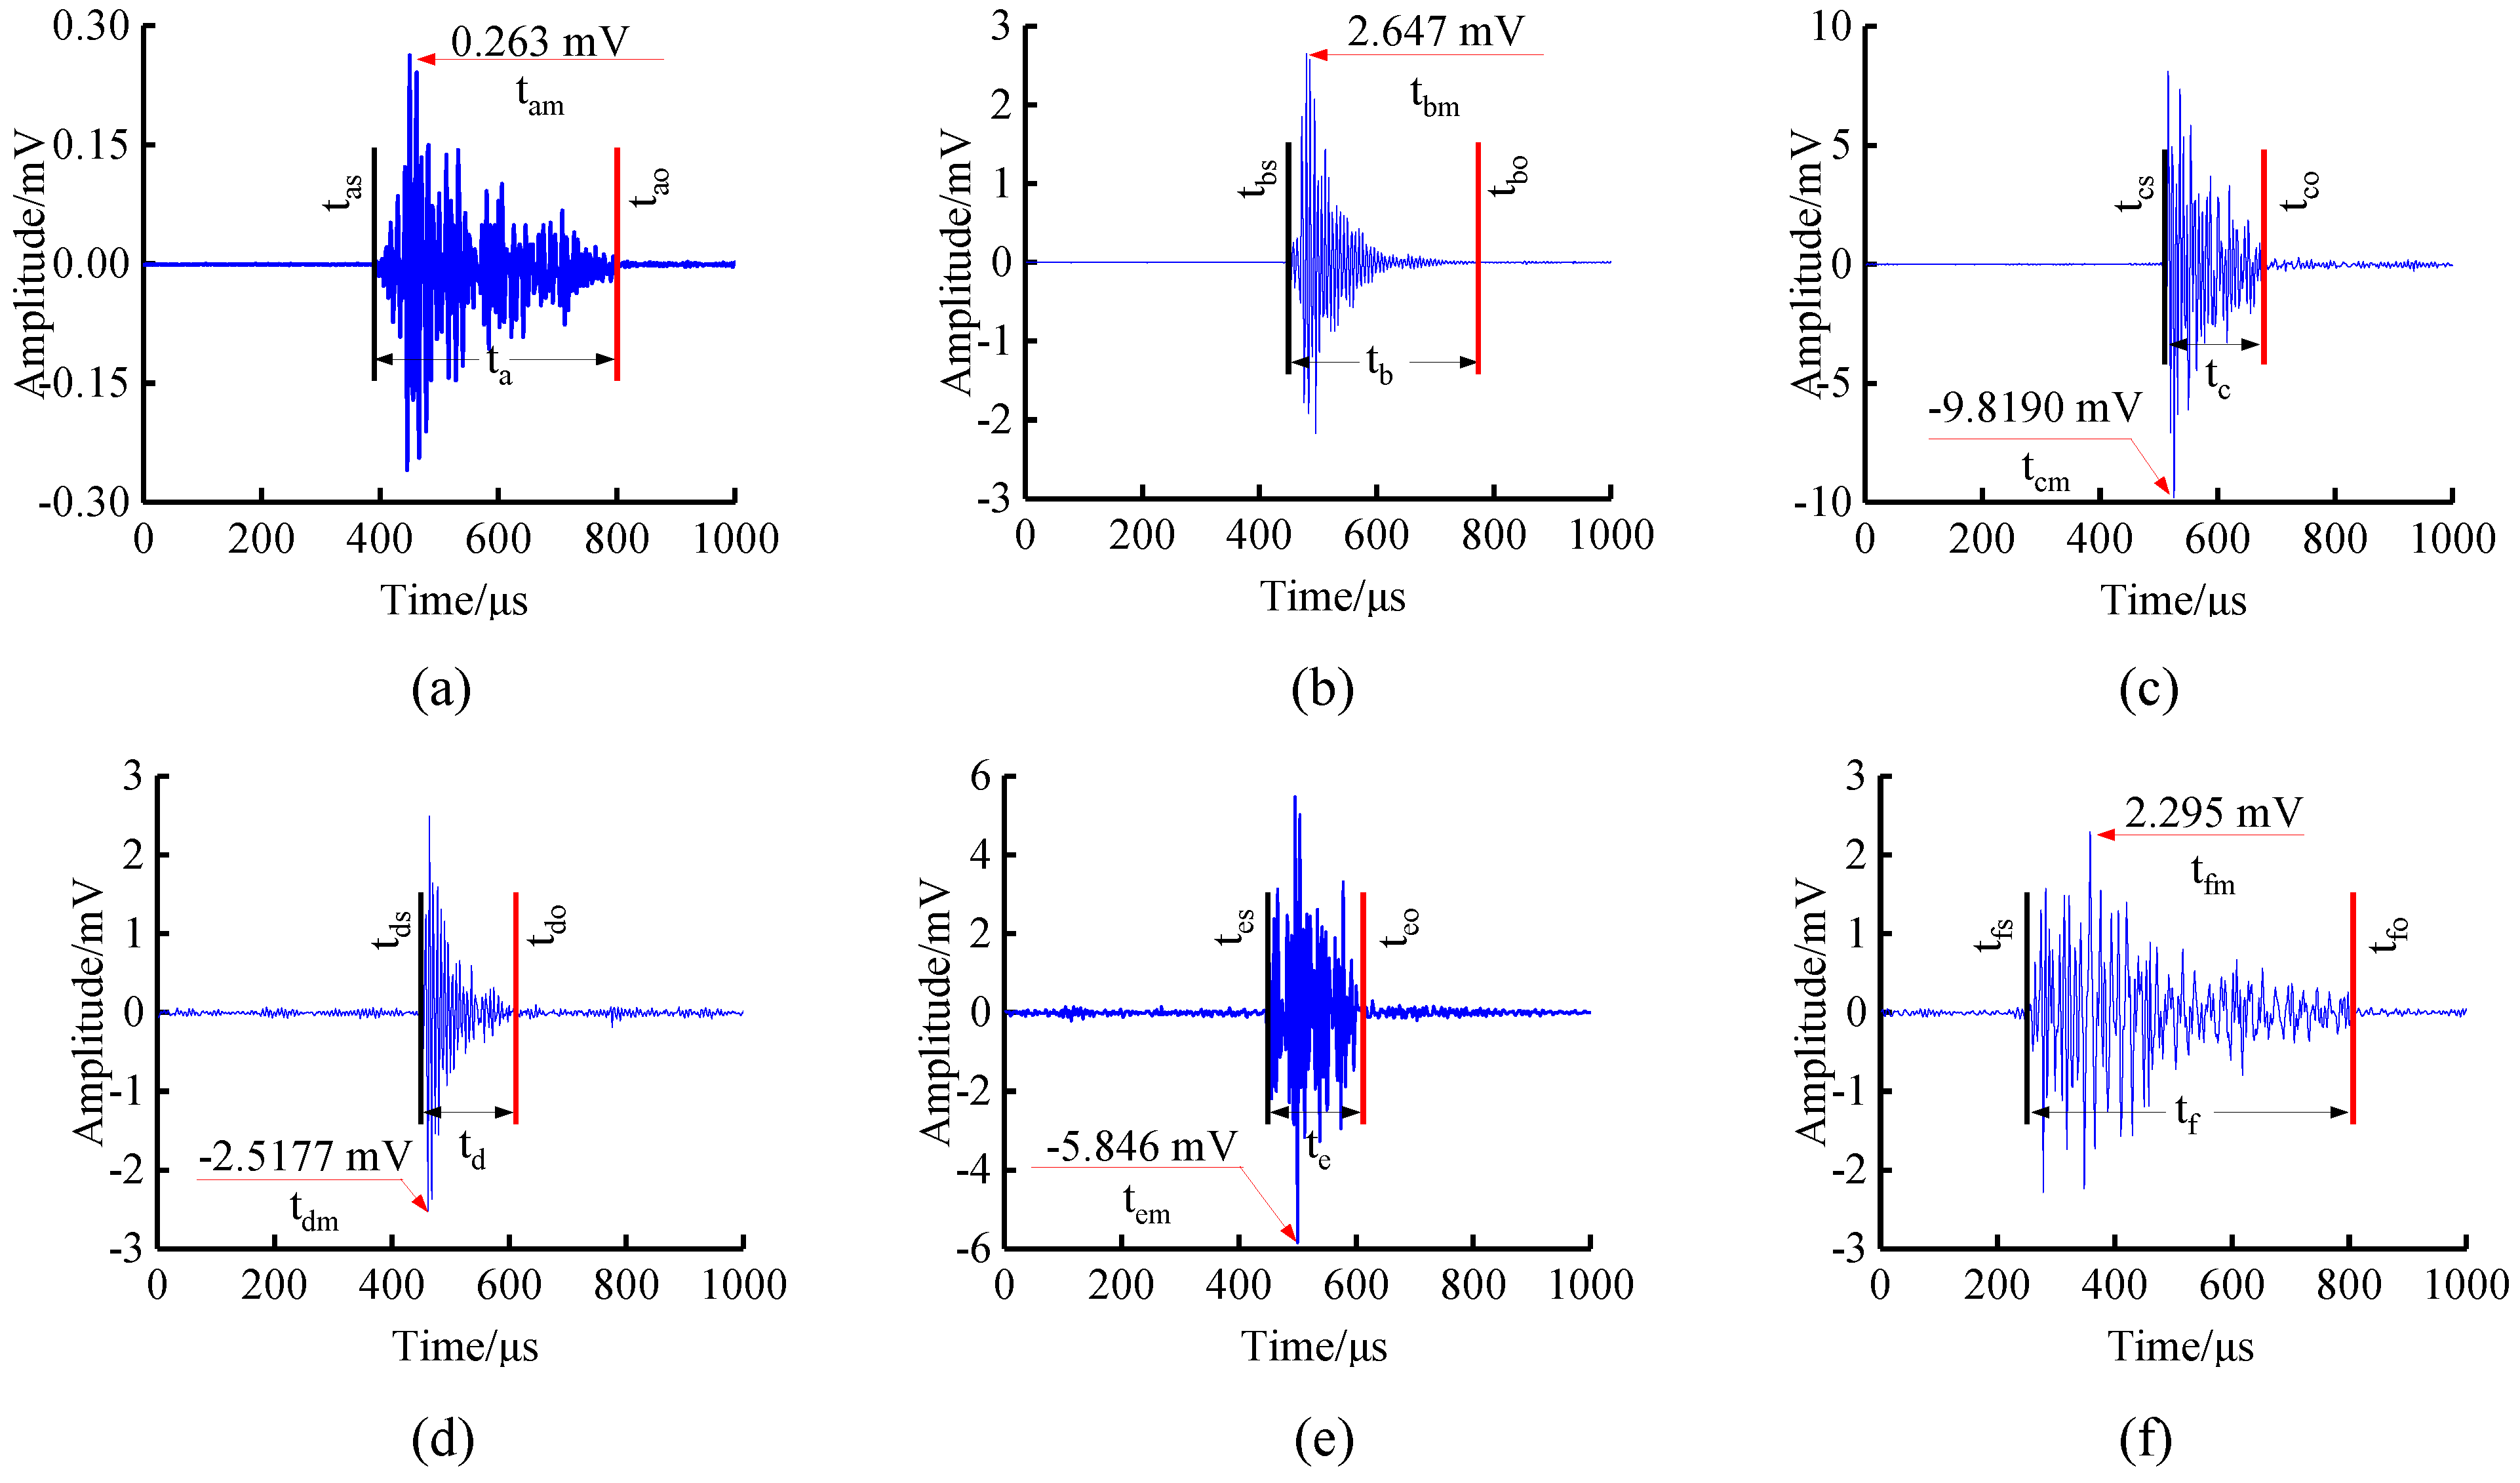
4.2. The Temporal Vatiation Characteristics of AE Waveforms’ Amplitude and Cumulative Energy
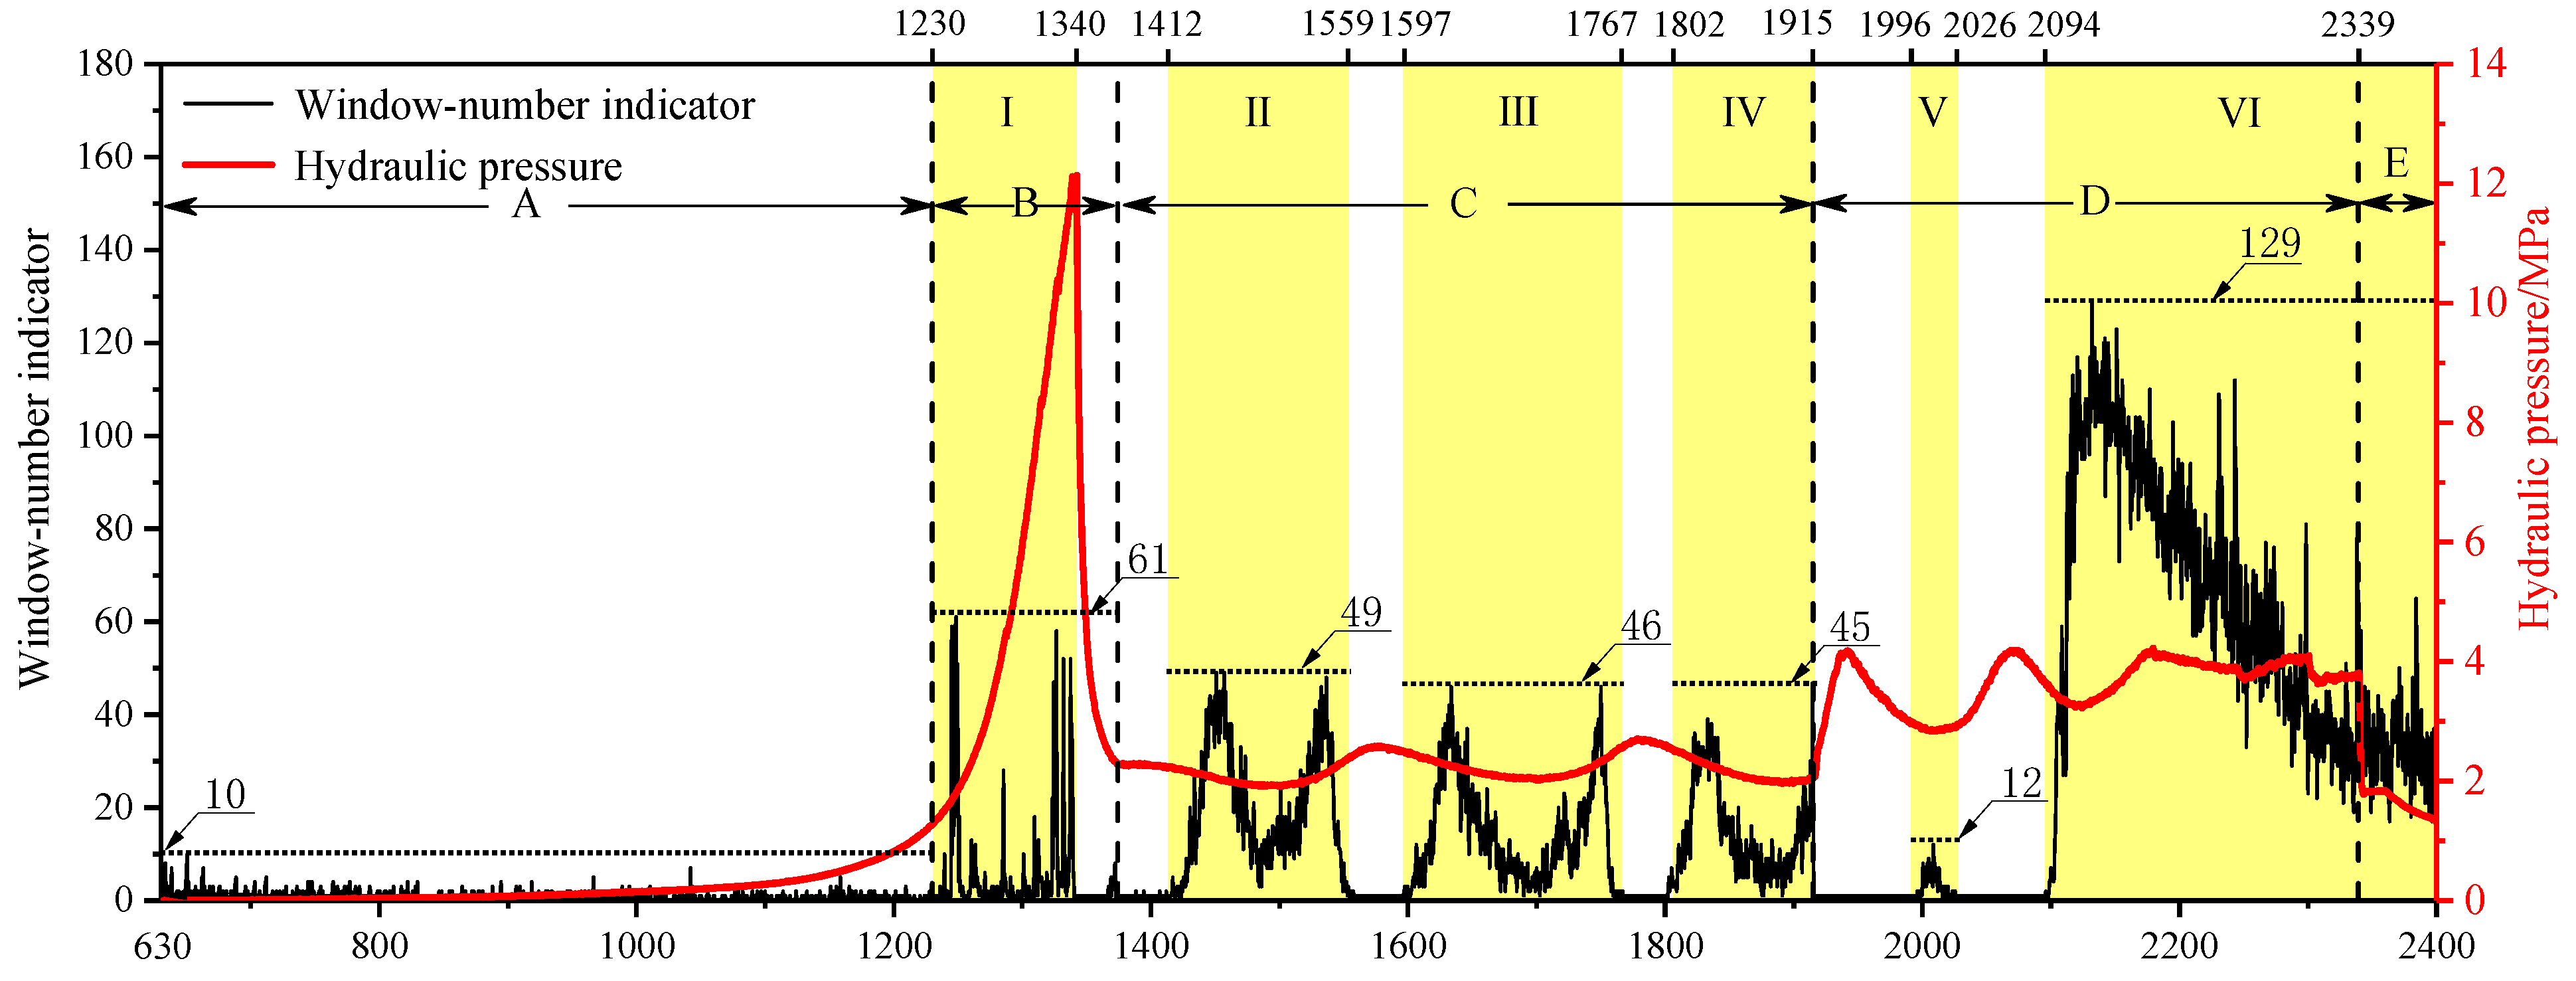
4.3. The Window-Number Indicator of AE Waveform during True Triaxial HF Experiment
5. Discussion
6. Conclusions
Author Contributions
Funding
Institutional Review Board Statement
Informed Consent Statement
Data Availability Statement
Acknowledgments
Conflicts of Interest
Glossary
| tis | arrival time of the waveform, s |
| tio | end time of the waveform, s |
| tim | maximum amplitude time of the waveform, s |
| ti | duration time of the waveform, s |
| ATi | attenuation ratio indicator |
References
- Economides, M.; Martin, T. Modern Fracturing: Enhancing Natural Gas Production; Energy Tribune Publishing Inc.: Houston, TX, USA, 2007. [Google Scholar]
- Tang, Y.; Tang, X.; Wang, G.Y.; Zhang, Q. Summary of hydraulic fracturing technology in shale gas development. Geol. Bull. China 2011, 30, 393–399. [Google Scholar]
- Hou, M.X.; Ge, X.R.; Wang, S.L. Discussion on application of hydraulic fracturing method to geostress measurement. Rock Soil Mech. 2003, 24, 840–844. [Google Scholar]
- Huang, B.X. Hydraulic Fracturing Theory of Coal-Rock Mass and Its Application; China University of Mining and Technology Press: Xuzhou, China, 2012. [Google Scholar]
- Wang, Y.F.; He, X.Q.; Wang, E.Y.; Li, Y.Z. Research progress and development tendency of the hydraulic technology for increasing the permeability of coal seams. J. China Coal Soc. 2014, 39, 1945–1955. [Google Scholar]
- Kang, H.P.; Feng, Y.J. Monitoring of stress change in coal seam caused by directional hydraulic fracturing in working face with strong roof and its evolution. J. China Soc. 2012, 37, 1953–1959. [Google Scholar]
- Hardy, R. Acoustic Emission/Microseismic Activity: Volume 1: Principles, Techniques and Geotechnical Application; A.A. Balkema Publishers: De Wallen, Amsterdam, 2003. [Google Scholar]
- Li, N.; Wang, E.Y.; Ge, M.C. Microseismic monitoring technique and its applications at coal mines: Present status and future prospects. J. China Coal Soc. 2017, 42, 83–96. [Google Scholar]
- Ishida, T.; Labuz, J.F.; Manthei, G.; Meredith, P.G.; Nasseri, M.H.B.; Shin, K.; Yokoyama, T.; Zang, A. ISRM Suggested method for laboratory acoustic emission monitoring. Rock Mech. Rock Eng. 2017, 50, 665–674. [Google Scholar] [CrossRef]
- Jiang, R.C.; Dai, F.; Liu, Y.; Li, A.; Feng, P. Frequency characteristics of acoustic emissions induced by crack propagation in rock tensile fracture. Rock Mech. Rock Eng. 2021, 54, 2054–2065. [Google Scholar] [CrossRef]
- Petružálek, M.; Lokajíček, T.; Svitek, T.; Jechumtálová, Z.; Kolář, P.; Šílený, J. Fracturing of migmatite monitored by acoustic emission and ultrasonic sounding. Rock Mech. Rock Eng. 2019, 52, 47–59. [Google Scholar] [CrossRef]
- He, M.C.; Miao, J.L.; Feng, J.L. Rock burst process of limestone and its acoustic emission characteristics under true-triaxial unloading conditions. Int. J. Rock Mech. Minging Sci. 2010, 47, 286–298. [Google Scholar] [CrossRef]
- Lei, X.L.; Kusunose, K.; Rao, M.V.M.S.; Nishizawa, O.; Satoh, T. Quasi-static fault growth and cracking in homogeneous brittle rock under triaxial compression using acoustic emission monitoring. J. Geophys. Res. 2000, 105, 6127–6139. [Google Scholar] [CrossRef]
- Meng, Q.B.; Zhang, M.W.; Han, L.J.; Pu, H.; Chen, Y.L. Acoustic emission characteristics of red sandstone specimens under uniaxial cyclic loading and unloading compression. Rock Mech. Rock Eng. 2018, 51, 969–988. [Google Scholar] [CrossRef]
- Li, D.X.; Wang, E.Y.; Kong, X.G.; Ali, M.; Wang, D.M. Mechanical behaviors and acoustic emission fractal characteristics of coal specimens with a pre-existing flaw of various inclinations under uniaxial compression. Int. J. Rock Mech. Min. Sci. 2019, 116, 38–51. [Google Scholar] [CrossRef]
- Du, K.; Li, X.F.; Tao, M.; Wang, S.F. Experimental study on acoustic emission (AE) characteristics and crack classification during rock fracture in several basic lab tests. Int. J. Rock Mech. Min. Sci. 2020, 133, 104411. [Google Scholar] [CrossRef]
- Zhang, R.; Xie, H.P.; Liu, J.F.; Deng, J.H.; Peng, Q. Experimental study on acoustic emission characteristics of rock failure under uniaxial multilevel loadings. Chin. J. Rock Mech. Eng. 2006, 25, 2584–2588. [Google Scholar]
- Zhao, X.D.; Li, Y.H.; Liu, J.P.; Zhang, J.Y.; Zhu, W.C. Study on rock failure process based on acoustic emission and its location technique. Chin. J. Rock Mech. Eng. 2008, 27, 990–995. [Google Scholar]
- Li, N.; Wang, E.Y.; Zhao, E.L.; Ma, Y.K.; Xu, F.L.; Qian, W.H. Experiment on acoustic emission of rock damage and fracture under cyclic loading and multi-stage loading. J. China Coal Soc. 2010, 35, 1099–1103. [Google Scholar]
- Liu, S.M.; Li, X.L.; Li, Z.H.; Chen, P.; Yang, X.L.; Liu, Y.J. Energy distribution and fractal characterization of acoustic emission (AE) during coal deformation and fracturing. Measurement 2019, 136, 122–131. [Google Scholar] [CrossRef]
- Li, J.; Yue, J.H.; Yang, Y.; Zhan, X.Z.; Li, Z. Multi-Resolution Feature Fusion model for coal rock burst hazard recognition based on Acoustic Emission data. Measurement 2017, 100, 329–336. [Google Scholar] [CrossRef]
- Li, H.R.; Yang, C.H.; Li, B.L.; Yin, X.Y. Damage evolution and characteristics of ultrasonic velocity and acoustic emission for salt rock under triaxial multilevel loading test. Chin. J. Rock Mech. Eng. 2016, 35, 682–691. [Google Scholar]
- Wu, S.C.; Huang, X.Q.; Chen, F.; Chai, J.F.; Wu, H.Y. Moment tensor inversion of rock failure and its application. Rock Soil Mech. 2016, 37, 1–18. [Google Scholar]
- Petružálek, M.; Jechumtálová, Z.; Kolář, P.; Adamová, P.; Svitek, T.; Šílený, J.; Lokajíček, T. Acoustic Emission in a Laboratory: Mechanism of Microearthquakes Using Alternative Source Models. J. Geophys. Res. Solid Earth 2018, 123, 4965–4982. [Google Scholar] [CrossRef]
- Li, S.L.; Zhou, M.J.; Gao, Z.P.; Chen, D.X.; Zhang, J.L.; Hu, J.Y. Experimental study on acoustic emission characteristics before the peak strength of rocks under incrementally cyclic loading-unloading methods. Chin. J. Rock Mech. Eng. 2019, 38, 724–735. [Google Scholar]
- Wang, X.R.; Li, N.; Wang, E.Y.; Liu, X.F. Microcracking mechanisms of sandstone from acoustic emission source inversion. Chin. J. Geophys. 2020, 63, 2627–2643. [Google Scholar]
- Wang, C.Y.; Chang, X.K.; Du, X.Y. Analysis on Dominant-frequency Characteristics of Acoustic Emission in Sandstone Uniaxial Compression Failure. Chin. J. Undergr. Space Eng. 2020, 16, 451–462. [Google Scholar]
- Wang, C.Y.; Chang, X.K.; Liu, Y.L.; Guo, W.B. Spectrum evolution characteristics of acoustic emission during the rupture process of marble under uniaxial compression condition. Rock Soil Mech. 2020, 41, 51–62. [Google Scholar]
- Zeng PLiu, Y.J.; Ji, H.G.; Li, C.J. Coupling criteria and precursor identification characteristics of multi-band acoustic emission of gritstone fracture under uniaxial compression. Chin. J. Geotech. Eng. 2017, 39, 509–517. [Google Scholar]
- Wang, Q.; Zhou, Y.Y.; Li, Y.H.; Zhang, F.P. Experimental study on deformation and strength characteristics of diabase containing natural weak plane by acoustic emission. Chin. J. Rock Mech. Eng. 2019, 38, 3646–3653. [Google Scholar]
- Zhang, Y.B.; Liang, P.; Tian, B.Z.; Yao, X.L.; Sun, L.; Liu, X.X. Multi parameter coupling analysis of acoustic emission signals of granite disaster and the precursor characteristics of the main rupture. Chin. J. Rock Mech. Eng. 2016, 35, 2248–2258. [Google Scholar]
- Ji, H.G.; Lu, X. Characteristics of acoustic emission and rock fracture precursors of granite under conventional triaxial compression. Chin. J. Rock Mech. Eng. 2015, 34, 2248–2258. [Google Scholar]
- Zhang, Y.B.; Zhang, H.; Liang, P.; Chen, S.J.; Sun, L.; Yao, X.L.; Liu, X.X.; Liang, J.L. Experimental research on time-frequency characteristics of AE P-wave and S-wave of granite under failure process. Chin. J. Rock Mech. Eng. 2019, 38, 3554–3564. [Google Scholar]
- Yang, Y.J.; Ma, D.P.; Zhou, Y. Experimental research on spectrum signature eigen of acoustic emission of coal and sandstone damage under triaxial unloading confining pressure. J. Min. Saf. Eng. 2019, 36, 1002–1008. [Google Scholar]
- Zhang, L.M.; Wang, Z.Q.; Shi, L.; Kong, L. Acoustic emission characteristics of marble during failure process under different stress paths. Chin. J. Rock Mech. Eng. 2012, 31, 1230–1236. [Google Scholar]
- Zhang, N.B.; Qi, Q.X.; OuYang, Z.H.; Li, H.Y.; Zhao, S.K.; Xu, Z.J. Experimental on acoustic emission characteristics of marble with different stress paths. J. China Coal Soceity 2014, 39, 389–394. [Google Scholar]
- Pei, X.J.; Zhu, L.; Cui, S.H.; Liang, Y.F. Experimental study on acoustic emission characteristic of rocks with vein mass. Chin. J. Rock Mech. Eng. 2020, 39, 2602–2611. [Google Scholar]
- Li, Z.L.; He, X.Q.; Dou, L.M.; Wang, G.F.; Song, D.Z.; Lou, Q. Bursting failure behavior of coal and response of acoustic and electromagnetic emissions. Chin. J. Rock Mech. Eng. 2019, 38, 2057–2068. [Google Scholar]
- Zhang, Y.B.; Yu, G.Y.; Tian, B.Z.; Liu, X.X.; Liang, P.; Wang, Y.D. Experimental study of acoustic emission signal dominant-frequency characteristics of rockburst in a granite tunnel. Rock Soil Mech. 2017, 38, 1258–1266. [Google Scholar]
- Hou, B.; Chen, M.; Tan, P.; Li, D.D. Monitoring of hydraulic fracture network by acoustic emission method in simulated tri-axial fracturing system of shale gas reservoirs. J. China Univ. Pet. 2015, 39, 66–71. [Google Scholar]
- Chong, Z.H.; Li, X.H.; Hou, P.; Chen, X.Y.; Wu, Y.C. Moment tensor analysis of transversely isotropic shale based on the discrete element method. Int. J. Min. Sci. Technol. 2017, 27, 507–515. [Google Scholar] [CrossRef]
- Patel, S.M.; Sondergeld, C.H.; Rai, C.S. Laboratory studies of hydraulic fracturing by cyclic injection. Int. J. Rock Mech. Min. Sci. 2017, 95, 8–15. [Google Scholar] [CrossRef]
- Ishida, T.; Fujito, W.; Yamashita, H.; Naoi, M.; Fuji, H.; Suzuki, K.; Matsui, H. Crack Expansion and Fracturing Mode of Hydraulic Refracturing from Acoustic Emission Monitoring in a Small-Scale Field Experiment. Rock Mech. Rock Eng. 2019, 52, 543–553. [Google Scholar] [CrossRef]
- Fan, M.; Jin, Y.; Fu, W.N.; Chen, M.; Han, H.F.; Zhou, X.J. Experimental study on fracture propagation behavior based on acoustic emission characteristics. Chin. J. Rock Mech. Eng. 2018, 37, 3834–3841. [Google Scholar]
- Hampton, J.; Gutierrez, M.; Matzar, L.; Hu, D.D.; Frash, L. Acoustic emission characterization of microcracking in laboratory-scale hydraulic fracturing tests. J. Rock Mech. Geotech. Eng. 2018, 10, 805–817. [Google Scholar] [CrossRef]
- Naoi, M.; Chen, Y.; Nishihara, K.; Yamamoto, K.; Yano, S.; Watanabe, S.; Morishige, Y.; Kawakata, H.; Akai, T.; Kurosawa, I.; et al. Monitoring hydraulically-induced fractures in the laboratory using acoustic emissions and the fluorescent method. Int. J. Rock Mech. Min. Sci. 2018, 104, 53–63. [Google Scholar] [CrossRef]
- Gao, L.; Gao, F.; Zhang, Z.Z.; Xing, Y. Research on the energy evolution characteristics and the failure intensity of rocks. Int. J. Min. Sci. Technol. 2020, 30, 705–713. [Google Scholar] [CrossRef]
- Zhao, Z.J.; Liu, D.A.; Cui, Z.D.; Tang, T.W.; Han, W.G. Cyclic progressive pressure on the fracturing effect of shale. Chin. J. Rock Mech. Eng. 2019, 38, 2779–2789. [Google Scholar]
- Hu, L.B.; Ghassemi, A.; Pritchett, J.; Garg, S. Characterization of laboratory-scale hydraulic fracturing for EGS. Geothermics 2020, 83, 101706. [Google Scholar] [CrossRef]
- Li, N.; Zhang, S.; Zou, Y.; Ma, X.; Zhang, Z.; Li, S.; Chen, M.; Sun, Y. Acoustic Emission Response of Laboratory Hydraulic Fracturing in Layered Shale. Rock Mech. Rock Eng. 2018, 51, 3395–3406. [Google Scholar] [CrossRef]
- Bingxiang, H. Research on Theroy and Application of Hydraulic Fracture Weaking For Coal-Rock Mass. J. China Coal Soc. 2010, 35, 1765–1766. [Google Scholar]
- Ding, H. Law of Hydraulic Fracturing Crack Initiation in the Multi-layered Coal Seams. MA Diss. Chongqing Univ. 2014. [Google Scholar]
- Jiang, Y.L.; Liang, W.G.; Li, Z.G.; Lian, H.J.; Wu, P.F.; Geng, Y.D. Experimental study on fracturing across coal-rock interfaces and the acoustic emission response characteristics. Chin. J. Rock Mech. Eng. 2019, 38, 875–887. [Google Scholar]
- Li, N.; Sun, W.C.; Huang, B.X.; Chen, D.; Zhang, S.H.; Yan, M.Y. Acoustic emission source location monitoring of laboratory-scale hydraulic fracturing of coal under true triaxial stress. Nat. Resour. Res. 2021, 30, 2297–2315. [Google Scholar] [CrossRef]
- Zhang, Y.B.; Liang, P.; Sun, L.; Tian, B.Z.; Yao, X.L.; Liu, X.X. Spectral characteristics of AE in the process of saturated granite fracture under uniaxial compression. Rock Soil Mech. 2019, 40, 2497–2506. [Google Scholar]
- He, M.C.; Zhao, F.; Zhang, Y.; Du, S.; Guan, L. Feature evolution of dominant frequency components in acoustic emissions of instantaneous strain-type granitic rockburst simulation tests. Rock Soil Mech. 2015, 36, 1–8,33. [Google Scholar]
- Pu, X.J.; Wen, J.F.; Lin, R.R.; Wang, Y.Q.; Zhang, L.Q. Long-Term Monitoring Plan for Potential Magma Reservoir and Microseismic Observation of Datun Volcano Group; China Geophysics Society: Taiwan, China, 2006. [Google Scholar]
- Li, N.; Huang, B.X.; Zhang, X.; Tan, Y.Y.; Li, B.L. Characteristics of microseismic waveforms induced by hydraulic fracturing in coal seam for coal rock dynamic disasters prevention. Saf. Sci. 2019, 115, 188–198. [Google Scholar] [CrossRef]
- Li, N.; Li, B.; Chen, D.; Wang, E.; Tan, Y.; Qian, J.; Jia, H. Waveform Characteristics of Earthquakes Induced by Hydraulic Fracturing and Mining Activities: Comparison with Those of Natural Earthquakes. Nat. Resour. Res. 2020, 29, 3653–3674. [Google Scholar] [CrossRef]
- Tang, J.P.; Lu, J.W.; Xu, P.; Ding, J.H.; Qi, T. Experimental study on time-frequency characteristics of hydraulic fracturing acoustic emission in coal shale. China Saf. Sci. J. 2017, 27, 87–92. [Google Scholar]
- Liang, T.C.; Fu, H.F.; Liu, Y.Z.; Xiu, N.L.; Yan, Y.Z. On the determination method of rupture mechanism in acoustic emission used in hydraulic fracturing fracture propagation. J. Exp. Mech. 2019, 34, 358–364. [Google Scholar]
- Niu, Y.; Zhou, X.P.; Berto, F. Temporal dominant frequency evolution characteristics during the fracture process of flawed red sandstone. Theor. Appl. Fract. Mech. 2020, 110, 102838. [Google Scholar] [CrossRef]
- Li, B.L.; Li, N.; Wang, E.Y.; Li, X.L.; Niu, Y.; Zhang, X. Characteristics of coal mining microseismic and blasting signals at Qianqiu coal mine. Environ. Earth Sci. 2017, 76, 722. [Google Scholar] [CrossRef]
- Wang, C.Y.; Chang, X.K.; Liu, Y.L.; Chen, S.J. Mechanistic characteristics of double dominant frequencies of acoustic emission signals in the entire fracture process of fine sandstone. Energies 2019, 12, 3959. [Google Scholar] [CrossRef] [Green Version]
- Li, B.L.; Li, N.; Wang, E.Y.; Li, X.L.; Zhang, Z.B.; Zhang, X.; Niu, Y. Discriminant model of coal mining microseismic and blasting signals based on waveform characteristics. Shock. Vib. Deep. Min. Sci. 2017, 2017, 6059239. [Google Scholar] [CrossRef] [Green Version]
- Jia, X.N. Experimental Study on Acoustic Emission Eigen-Frequency Spectrum Features of Strain Bursts; University of Mining and Technology: Beijing, China, 2013. [Google Scholar]
- Torres, M.E.; Colominas, M.A.; Schlotthauer, G.; Flandrin, P. A complete Ensemble Empirical Mode decomposition with adaptive noise. In Proceedings of the IEEE International Conference on Acoustics, Speech and Signal Processing (ICASSP), Prague, Czech Republic, 22–27 May 2011; pp. 4144–4147. [Google Scholar]


| Three-Dimensional Pressure σ1/σ2/σ3 | Duration/s | Hydraulic Pressure Duration/s | Final Constant Load Time of Three-Dimensional Pressure /s | Peak Time of Hydraulic Pressure /s | Peak Hydraulic Pressure/MPa |
|---|---|---|---|---|---|
| 12/8/4 | 2420 | 1790 | 540 | 1340 | 12.157 |
| Dominant Frequency Band to Whole Frequency Band Ratio/% | Each Stage of HF | A | B | C | D | E |
| Number | 78.58 | 87.54 | 89.36 | 84.01 | 78.12 | |
| Energy | 91.55 | 96.59 | 94.29 | 88.82 | 65.26 |
| Each Stage to Whole HF Ratio/% | Each Stage of HF | A | B | C | D | E | Total |
| Number | 1.37 | 2.74 | 26.79 | 61.49 | 7.61 | 100 | |
| Energy | 3.03 | 3.67 | 0.86 | 87.60 | 4.84 | 100 |
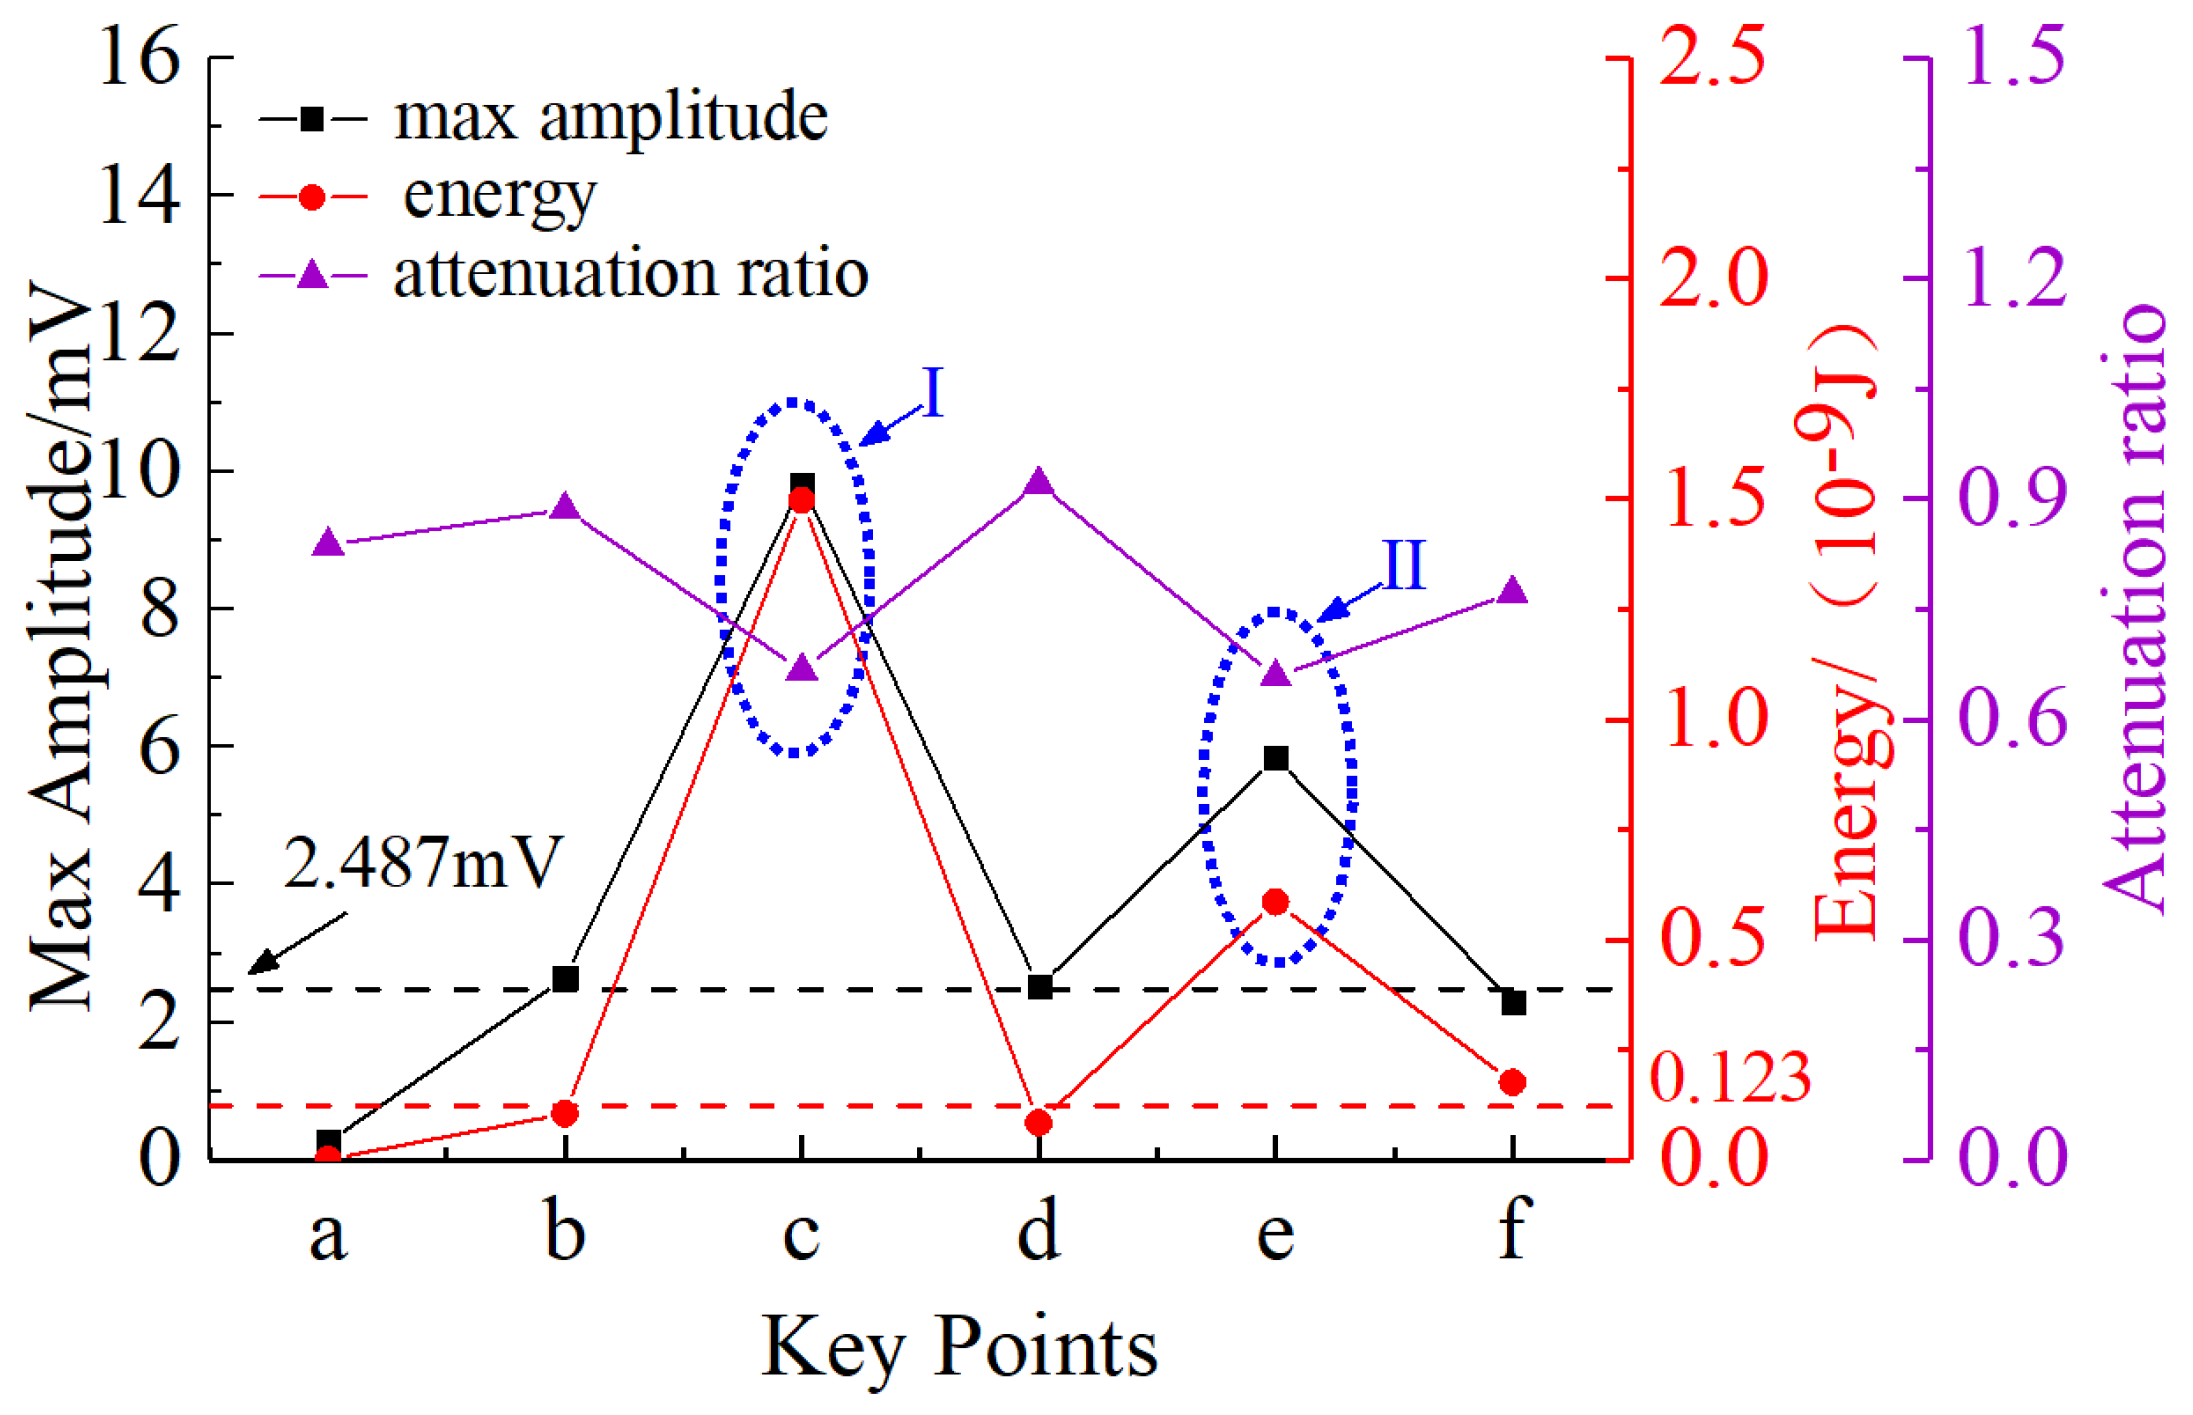
| Characteristics Parameters | Maximum Amplitude /mV | Energy/(10−9 J) | Attenuation Ratio | |
|---|---|---|---|---|
| Key Points | ||||
| Initial point a | 0.263 | 0.002 | 0.837 | |
| Leap point b | 2.647 | 0.106 | 0.886 | |
| Rupture point c | −9.819 | 1.497 | 0.667 | |
| Leap point d | 2.518 | 0.085 | 0.921 | |
| Critical point e | −5.846 | 0.586 | 0.658 | |
| End point f | 2.295 | 0.177 | 0.772 | |
| Regions | Stages | Time/s | Duration/s | Waveform Number | Maximum Window-Number Indicator | Mean Window-Number Indicator |
|---|---|---|---|---|---|---|
| Ⅰ | B | 1230–1340 | 110 | 1352 | 61 | 6 |
| Ⅱ | C | 1412–1559 | 147 | 5556 | 49 | 19 |
| Ⅲ | C | 1597–1767 | 170 | 4786 | 46 | 14 |
| Ⅳ | C | 1802–1915 | 113 | 3192 | 45 | 14 |
| Ⅴ | D | 1996–2026 | 30 | 199 | 12 | 3 |
| Ⅵ | D,E | 2094–2420 | 326 | 37,958 | 129 | 58 |
Publisher’s Note: MDPI stays neutral with regard to jurisdictional claims in published maps and institutional affiliations. |
© 2022 by the authors. Licensee MDPI, Basel, Switzerland. This article is an open access article distributed under the terms and conditions of the Creative Commons Attribution (CC BY) license (https://creativecommons.org/licenses/by/4.0/).
Share and Cite
Li, N.; Fang, L.; Huang, B.; Chen, P.; Cai, C.; Zhang, Y.; Liu, X.; Li, Z.; Wen, Y.; Qin, Y. Characteristics of Acoustic Emission Waveforms Induced by Hydraulic Fracturing of Coal under True Triaxial Stress in a Laboratory-Scale Experiment. Minerals 2022, 12, 104. https://doi.org/10.3390/min12010104
Li N, Fang L, Huang B, Chen P, Cai C, Zhang Y, Liu X, Li Z, Wen Y, Qin Y. Characteristics of Acoustic Emission Waveforms Induced by Hydraulic Fracturing of Coal under True Triaxial Stress in a Laboratory-Scale Experiment. Minerals. 2022; 12(1):104. https://doi.org/10.3390/min12010104
Chicago/Turabian StyleLi, Nan, Liulin Fang, Bingxiang Huang, Peng Chen, Chao Cai, Yunpeng Zhang, Xuan Liu, Zhihuai Li, Yaolin Wen, and Yanli Qin. 2022. "Characteristics of Acoustic Emission Waveforms Induced by Hydraulic Fracturing of Coal under True Triaxial Stress in a Laboratory-Scale Experiment" Minerals 12, no. 1: 104. https://doi.org/10.3390/min12010104