Article

Evolution of the Reaction and Alteration of Mudstone with Ordinary Portland Cement Leachates: Sequential Flow Experiments and Reactive-Transport Modelling

1
Nuclear Fuel Cycle Engineering Laboratories, Japan Atomic Energy Agency, Tokai 319-1194, Ibaraki, Japan
2
QJ Science, 8-1 Sakaecho, Yokohama 221-0052, Kanagawa, Japan
3
Wilson Scientific Ltd., Birchwood, Warrington WA3 6TR, UK
*
Author to whom correspondence should be addressed.
Minerals 2021, 11(9), 1026; https://doi.org/10.3390/min11091026
Submission received: 9 August 2021 / Revised: 10 September 2021 / Accepted: 16 September 2021 / Published: 21 September 2021

Abstract

:
The construction of a repository for geological disposal of radioactive waste will include the use of cement-based materials. Following closure, groundwater will saturate the repository and the extensive use of cement will result in the development of a highly alkaline porewater, pH > 12.5; this fluid will migrate into and react with the host rock. The chemistry of the fluid will evolve over time, initially high [Na] and [K], evolving to a Ca-rich fluid, and finally returning to the groundwater composition. This evolving chemistry will affect the long-term performance of the repository, altering the physical and chemical properties, including radionuclide behaviour. Understanding these changes forms the basis for predicting the long-term evolution of the repository. This study focused on the determination of the nature and extent of the chemical reaction, as well as the formation and persistence of secondary mineral phases within a mudstone, comparing data from sequential flow experiments with the results of reactive transport modelling. The reaction of the mudstone with the cement leachates resulted in small changes in pH with the precipitation of calcium aluminium silicate hydrate (C-(A-)S-H) phases of varying compositions. As the system evolves, secondary C-(A-)S-H phases re-dissolve and are replaced by secondary carbonates. This general sequence was successfully simulated using reactive transport modelling.

1. Introduction

The construction of a repository for geological disposal of radioactive waste will include the use of cement-based materials [1,2,3,4]. Following closure, groundwater will saturate the repository and the use of cement will result in the development of a highly alkaline porewater, pH > 12.5, in the case of ordinary Portland cement (OPC) [5,6]. The fluid will migrate into and react with the host rock. The chemistry of the migrating fluid will evolve over time, initially being high in Na and K with high pH ~13.5 (Stage I), evolving to a Ca rich fluid with pH ~12.5 (Stage II), followed by C-S-H buffering (Stage III), and finally returning to the groundwater composition [7]. This evolving fluid chemistry will affect the long-term performance of the repository, altering the physical and chemical properties of the host rock, including radionuclide behaviour ([7] and references within). Understanding these changes forms the basis for modelling the long-term evolution of the repository.
Flow-through or column experiments [8] are a useful technique with which to obtain experimental data on the spatial and temporal changes as the chemistry of the migrating fluid evolves. However, many previous studies have used only a single fluid at a time [9,10,11], and although the reactions of different OPC leachates (representing Stages I and II) have sometimes been examined, these studies generally compared the reaction of unaltered solids (either single minerals, synthetic mineral assemblages, or real rocks) and a single leachate.
It is known, for example, that the Ca/Si ratios of the secondary calcium silicate hydrate (C-S-H) and calcium aluminium silicate hydrate (C-A-S-H) phases may change by re-dissolution and precipitation as the chemistry of the reacting fluid evolves, i.e., reduction in Na and K and increases in Ca concentration [12,13,14,15]. Indeed, this has been observed in laboratory column experiments [15] in which early-formed C-S-H and C-A-S-H gels were replaced by ones with a lower Ca/Si ratio during successive reaction with fluids representing the evolution of a cement leachate over time. The initial Na-K-Ca-OH fluid [15] was followed by a Ca(OH)2-saturated fluid and, finally, a Ca-HCO3-type fluid (neutral pH), representing eventual re-saturation of by background bicarbonate groundwater [15]. However, this work [15] only used a ‘generic’ crystalline rock.
Some previous modelling studies [16,17,18] have been undertaken to consider the fluid evolution impacts on the host and secondary mineralogy, but without experimental data with which to validate the predictions. In addition, most of these modelling studies used a single input fluid and tracked evolution of this fluid’s chemistry and change in mineralogy with time and/or distance. An understanding of how the evolution in chemistry of the migrating cement pore fluids from the repository and subsequent interaction with the altered the host rock is critical for the prediction of the long-term evolution of the mineralogy, and will be part of the safety assessment for radioactive waste disposal repository.
This study focused on the sequence of alteration owing to the evolution of OPC-type leachate chemistry on argillaceous mudstone from the Horonobe Underground Research Laboratory (URL), Hokkaido, Japan [19]. This study describes the use of sequential fluids to represent the evolution of the cement leachate fluid chemistry with time and how it interacts with the host rock, which has been identified as a key area of uncertainty, particularly with the modelling of such systems [7]. This was performed by setting up a series of identical flow experiments to provide (at least in a laboratory time frame) information on the sequence of reaction. The first flow experiment was stopped after the reaction with a fluid representative of an early OPC cement leachate. In the remaining experiments, the reactant fluid was then changed to one representative of an evolved leachate. Again, after a period of reaction, one of the experiments was terminated and the reactant fluid changed to a natural groundwater for the final stage of reaction. Fluid chemistry was monitored throughout the experiments, providing a near continuous record of the evolution of the reacted fluid chemistry, and with the three different fluid types, ‘snapshots’ of the mineralogical variations could be determined. The specific aim of this work was the determination of the nature and extent of the chemical reaction as well as the formation and persistence of secondary mineral phases within the mudstone, as the fluid chemistry evolved, by the comparison of experimental data with geochemical reactive transport modelling.

2. Materials and Methods

2.1. Horonobe Mudstone

Samples of mudstone, for use in this study, were collected from the Horonobe URL site, Hokkaido, Japan [19]. The samples were taken from gallery walls located in the Koetoi formation, which is a massive and lithologically homogeneous, diatomaceous mudstone that contains amorphous silica (40–50 wt%), clay (17–25 wt%), quartz (7–10 wt%), feldspar (5–10 wt%), and pyrite (<2 wt%) [20,21]. The mudstone samples were crushed to <500 µm prior to being used in the experiments. The use of crushed materials increases the surface area available for reaction and encourages a greater degree of reaction within the time constraints of a laboratory study. However, it is recognised that the crushing process could also result in the generation of highly reactive ‘fines‘, resulting in experimental artefacts, i.e., increased initial dissolution.

2.2. Description of Fluids

Cement pore fluids representative of the alkaline leachates expected from a cementitious repository [22,23] were used for these sequential experiments. The first fluid represented a ‘young’ OPC leachate pH ~13.4 with high [Na] and [K]. A second fluid, an ‘evolved’ OPC leachate, was Ca-rich and saturated with respect to portlandite, pH ~12.5. The OPC leachates were prepared from analytical grade reagents; Na and K were added as hydroxides and Ca as CaO. The third fluid was Horonobe groundwater (HGW) collected from the 07-V140-M03 borehole (depth 140 m, sampled on 22 July 2020), located in the Koetoi Formation, which was stored in stainless-steel containers under nitrogen before use. Details of the initial concentrations of ions in the fluids are given in Table 1.
Upon sub-sampling the fluid from the reservoir used in the flow experiment, it was noted that the pH of the HGW (pH ~8.65) had increased from that of the original HGW (pH ~7.93, Table 1) as sampled from the stainless-steel container. This was accompanied by a corresponding decrease in [HCO3] to ~1900 mg/L (from ~2200 mg/L), indicating that there had been some degassing of the HGW during the set-up of the experiment. Typically, HGW from the same borehole [24] has a ~pH 7.4~7.8 and a [HCO3] ranging from 2700–3100 mg/L, suggesting that, even in the stainless-steel container, there had been some degassing of the HGW.

2.3. Description of the Flow Experiments

A small flow cell (SFC) as used in previous studies, examining differences in alteration of Horonobe mudstone with ordinary Portland and low alkali cement leachates [14], was used to conduct the experiments. A schematic of the small flow cell set-up is shown in Figure 1. The SFC was constructed from three pieces of acrylic plastic, sealed by a combination of ‘O-rings’ and bolts (Figure 1). Both inlet and outlet sides for the cell were fitted with filters and porous polypropylene disks, which, on the inlet side, aided the distribution the incoming fluid across the whole face of the mudstone sample. Polypropylene fluid reservoirs and sample collection bottles were used, with flow through the cell controlled by a Cole-Parmer MASTERFLEX® peristaltic pump (Cole-Parmer, Vernon Hills, IL, USA) [14]. The dry density of the packed mudstone could be controlled during the initial set-up. The experiments conducted here used a dry density of 1 g/cm3 (corresponding to a solid mass ~3.14 g); this was achieved using a small stainless-steel hand-press to mould the mudstone sample. The experiments were conducted inside a glove box continuously flushed with N2. The primary aim of this flushing was to prevent carbonation of the alkaline leachates by atmospheric carbon dioxide.
On completion of the experiments, the SFC was partly dismantled and the mudstone sample was vacuum dried, while still being held in the central section, before being carefully extruded and sectioned into ~1.5 mm thick slices, using a thin blade, before subsequent mineralogical analysis.
A series of three flow experiments were conducted to examine the sequential reaction of Horonobe mudstone with OPC leachates and groundwater. This was achieved by reacting mudstone samples with successive fluids starting with the ‘young’ OPC leachate (SFC-1), followed by the ‘evolved’ OPC leachate (SFC-2), and finally HGW (SFC-3). Figure 2 gives details of the experiments conducted, together with the reaction duration with each fluid.

2.4. Fluid Sampling and Analysis

Sampling of the fluids was performed within the protective N2 atmosphere of the glove box. All collected fluids were filtered using 0.2 µm syringe filters and then sub-sampled for determination of cations, and anions. Typically, a 4 mL sample of the fluid was diluted two-fold with 18 MΩ cm demineralised water (Millipore Simplicity® ultrapure water system) and then acidified with concentrated HNO3 (1% v/v), in order to preserve the sample. This sample was used for the analysis of major cations, by a combination of ICP-OES (inductively coupled plasma—optical emission spectrometry) using a Shimadzu ICPE-9800 (Shimadzu Corporation, Kyoto, Japan), and ICP-MS (inductively coupled plasma—mass spectrometry) using a Perkin-Elmer NexION 300× (PerkinElmer, Inc., Waltham, MA, USA), both calibrated using matrix matched standards. A second subsample was taken for determination of major anions by IC (ion chromatography) using a Dionex ICS-5000 Ion Chromatograph system (Thermo Fisher Scientific, Waltham, MA, USA), calibrated using mixed anion standard solution (Kanto Chemical Co., Inc, Tokyo, Japan). All fluid samples were stored in a refrigerator at <5 °C until required for analysis. Considering instrumental and sample preparation errors (e.g., sample dilution), a total 5% error was assumed.
The pH of the experimental fluids was determined immediately upon sampling using a DKK-TOA corp., model HM-30P meter and combination electrode calibrated using DKK-TOA corp., buffers at 4.01, 6.86, and 9.18 pH (Japanese standard), pH accurate to ±0.02 pH.

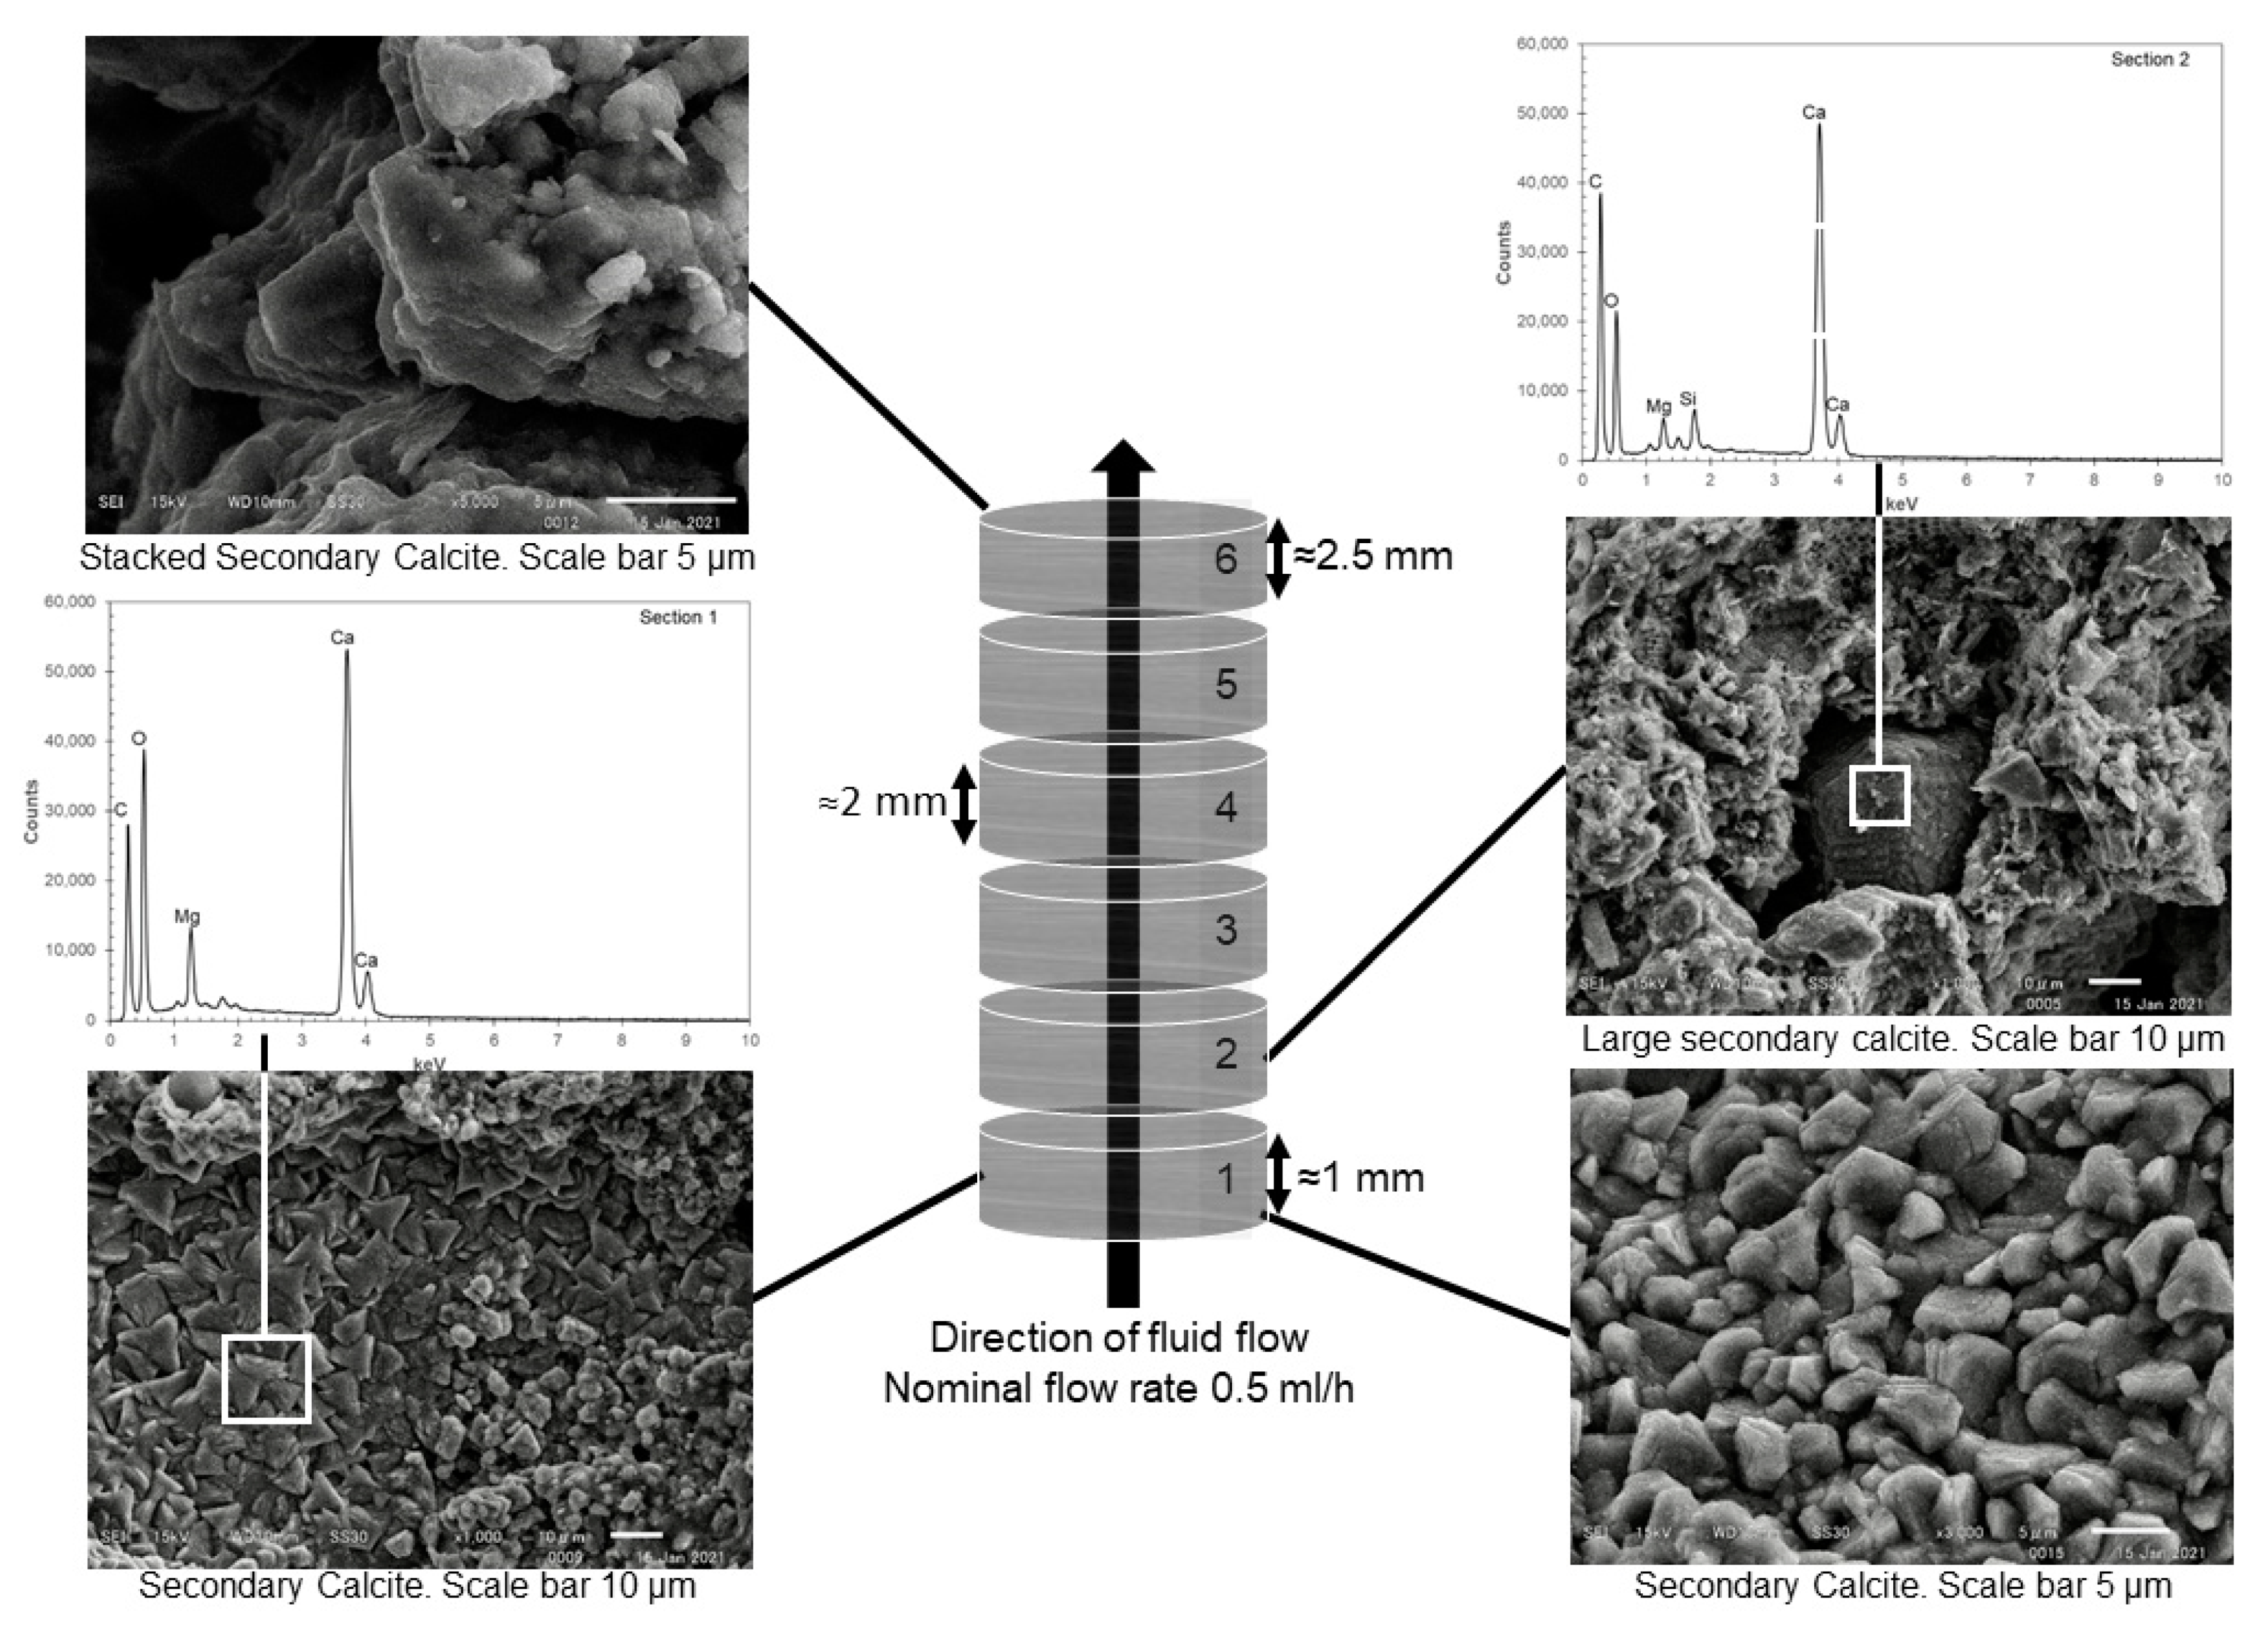
2.5. Solids’ Sampling and Analysis

On completion of the experiments, the mudstone samples were cut into ~1.5 mm thick slices, using a thin blade, with SEM stubs and powdered samples for XRD being prepared for subsequent mineralogical characterisation. Petrographic analysis of the solid samples was performed using a combination of both scanning electron microscopy (SEM) (JEOL JSM-6510 Series SEM, JEOL Ltd., Tokyo, Japan) and X-ray diffraction (XRD) analysis (RigaKu SmartLab XRD, Rigaku Corporation, Tokyo, Japan) with a 9 kW X-ray source. Sub-samples for SEM analysis were prepared as carbon coated, random mount stub samples. Techniques used included SEM using secondary electron imaging (SE) and backscattered electron (BSE) imaging and element distribution analysis using with energy-dispersive X-ray spectroscopy (EDS). Samples for XRD were prepared for analysis by taking a representative sub-sample and grinding to a fine powder

2.6. Mineral Saturation State Calculations

The saturation indices (SI = log (IAP/Ks)—where IAP: ion activity product and Ks: solubility constant) of the primary and potential secondary minerals—in the reacted fluids were calculated using the PHREEQC v3.6.3 geochemical code [25]. Calculations were performed using the JAEA thermodynamic database (JAEA-TDB) [26]. JAEA-TDB version PHREEQC20.dat (v1.2, 11 March 2021) was used for the calculations, being the latest version available at the time.

2.7. Reactive-Transport Modelling

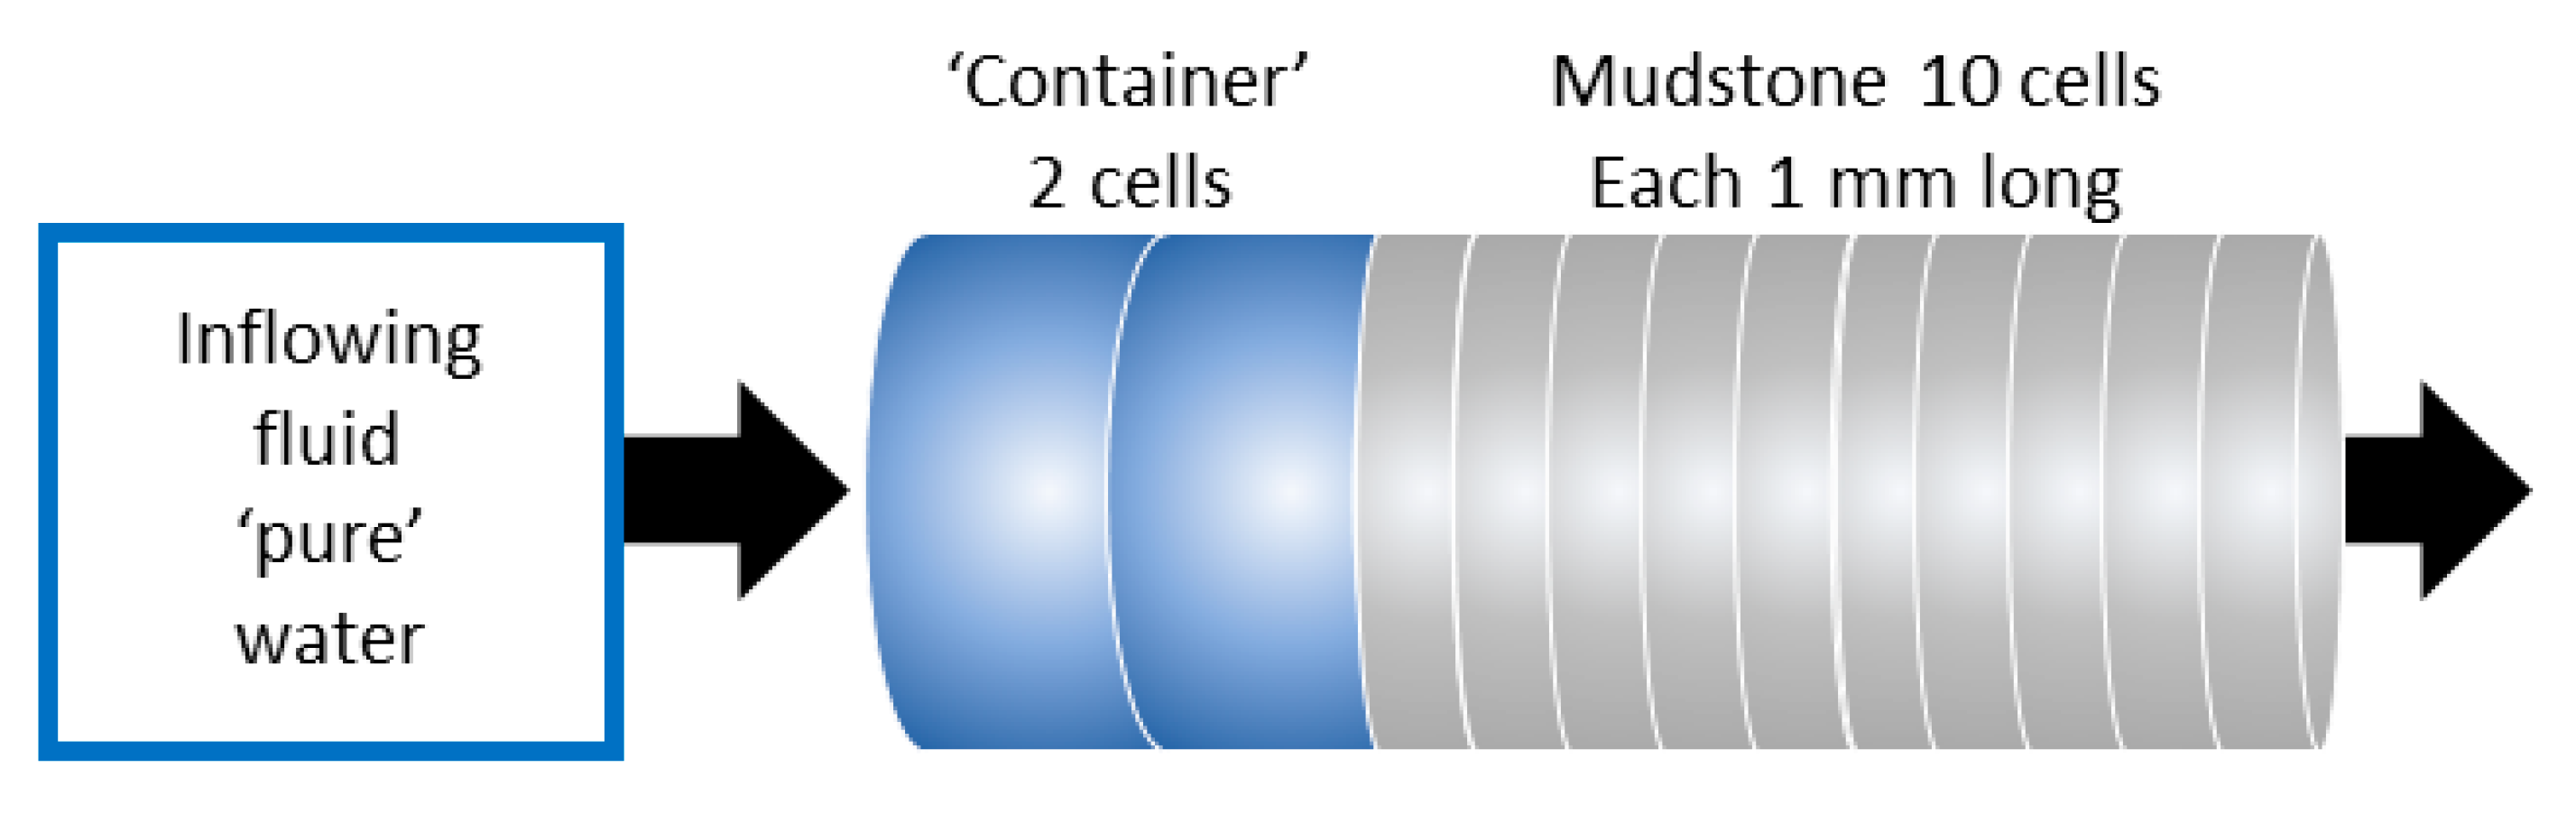
2.7.1. CABARET Model Concept

Fully-coupled 1D reactive transport models were constructed using the ‘CABARET’ (Cement And Bentonite Alteration due to REactive Transport) computer modelling code (Quintessa Limited, Henley-on-Thames, UK). CABARET was chosen for the modelling in preference to codes such as PHREEQC, as it allows coupling of porosity evolution (as minerals dissolve and/or precipitate) with diffusive and advective transport. CABARET uses the underlying QPAC Code, which has been used in previous reactive transport modelling studies [27,28]. CABARET uses an adaptive time-stepper to maximise the solver efficiency, which reduces the size of the time-step in response to external events (e.g., time-dependent inputs) or ‘emergent events’ (e.g., precipitation of secondary minerals or total dissolution of pre-existing minerals) and increases the time-step when the system is evolving less rapidly.
Supporting calculations (e.g., aqueous chemical speciation) were undertaken using PHREEQCv3 to generate the initial fluid compositions and to identify the key aqueous species specified in the CABARET models. The same JAEA-TDB [26] version was used for the CABARET calculations as used for the PHREEQC mineral saturation state calculations.

2.7.2. CABARET Model Setup and Parameters

Figure 3 shows the geometry of the experimental set-up as represented in CABARET. As CABARET was designed to work with a single input fluid type, it was necessary to generate the fluids ‘in situ’, effectively reproducing the fluid reservoir used in the experimental set up. This reservoir contained defined ‘hypothetical minerals’ (Tables S1–S3) which, when reacted with the inflowing fluid (i.e., pure water), replicated the three different successive reacting fluids. The resulting chemistry matched the fluid compositions given in Table 1.
Although CABARET is an efficient model, as with other complex simulations, it is still desirable to minimise the number of active components (i.e., chemical species and minerals) in the system in order to obtain results in a reasonable computational time.
The choice of minerals considered in the model was determined by the analysis of the Horonobe mudstone and precipitates observed in this study together with information from previous studies of the Horonobe mudstone mineralogy [18,20,29]. In addition, previous geochemical modelling studies on various clayrock–cement fluid reactions were used to inform the choice of likely active minerals [15,30,31]. The active minerals are given in Table 2. Ten aqueous basis species (H2O, Al+++, Ca++, Cl, H+, HCO3, K+, Mg++, Na+, Si(OH)4(aq), SO4--) were active in the model, together with 35 related aqueous complex species. A full list of the active chemical species is available in Table S4. The choice of chemical species included was based on the chemical analysis of the reacted fluids and the compositions of the minerals included in the model.
Thermodynamic data (equilibrium constants and standard molal volume for minerals) were taken from the JAEA-TDB [26] version PHREEQC20.dat (v1.2, 11 March 2021). Kinetic rates for primary minerals were taken from [32,33] and the references within, those for montmorillonite from [34] and C-S-H from [35]. Data for surface areas were from [34,36]. Ion exchange of Na, K, and Ca from the reactant fluids with the clays in the mudstone was included, and the ion exchange parameters for montmorillonite were taken from [37].
In terms of the description of diffusion, including the effect of tortuosity, within CABARET, this was derived from [38] with dispersion and advection as described in [39].

3. Results

3.1. Aqueous Chemistry

The chemical evolution of the three flow-through experiments was nearly identical when comparing the same fluid type. That is, the fluid analytical data for the ‘young’ OPC leachate were the same for SFC-1, -2, and -3 experiments, and the data for the ‘evolved’ OPC leachate from the SFC-2 and 3 experiments were identical. The results of the SFC experiments with the ‘young’ OPC leachate have previously been discussed in detail in [14].

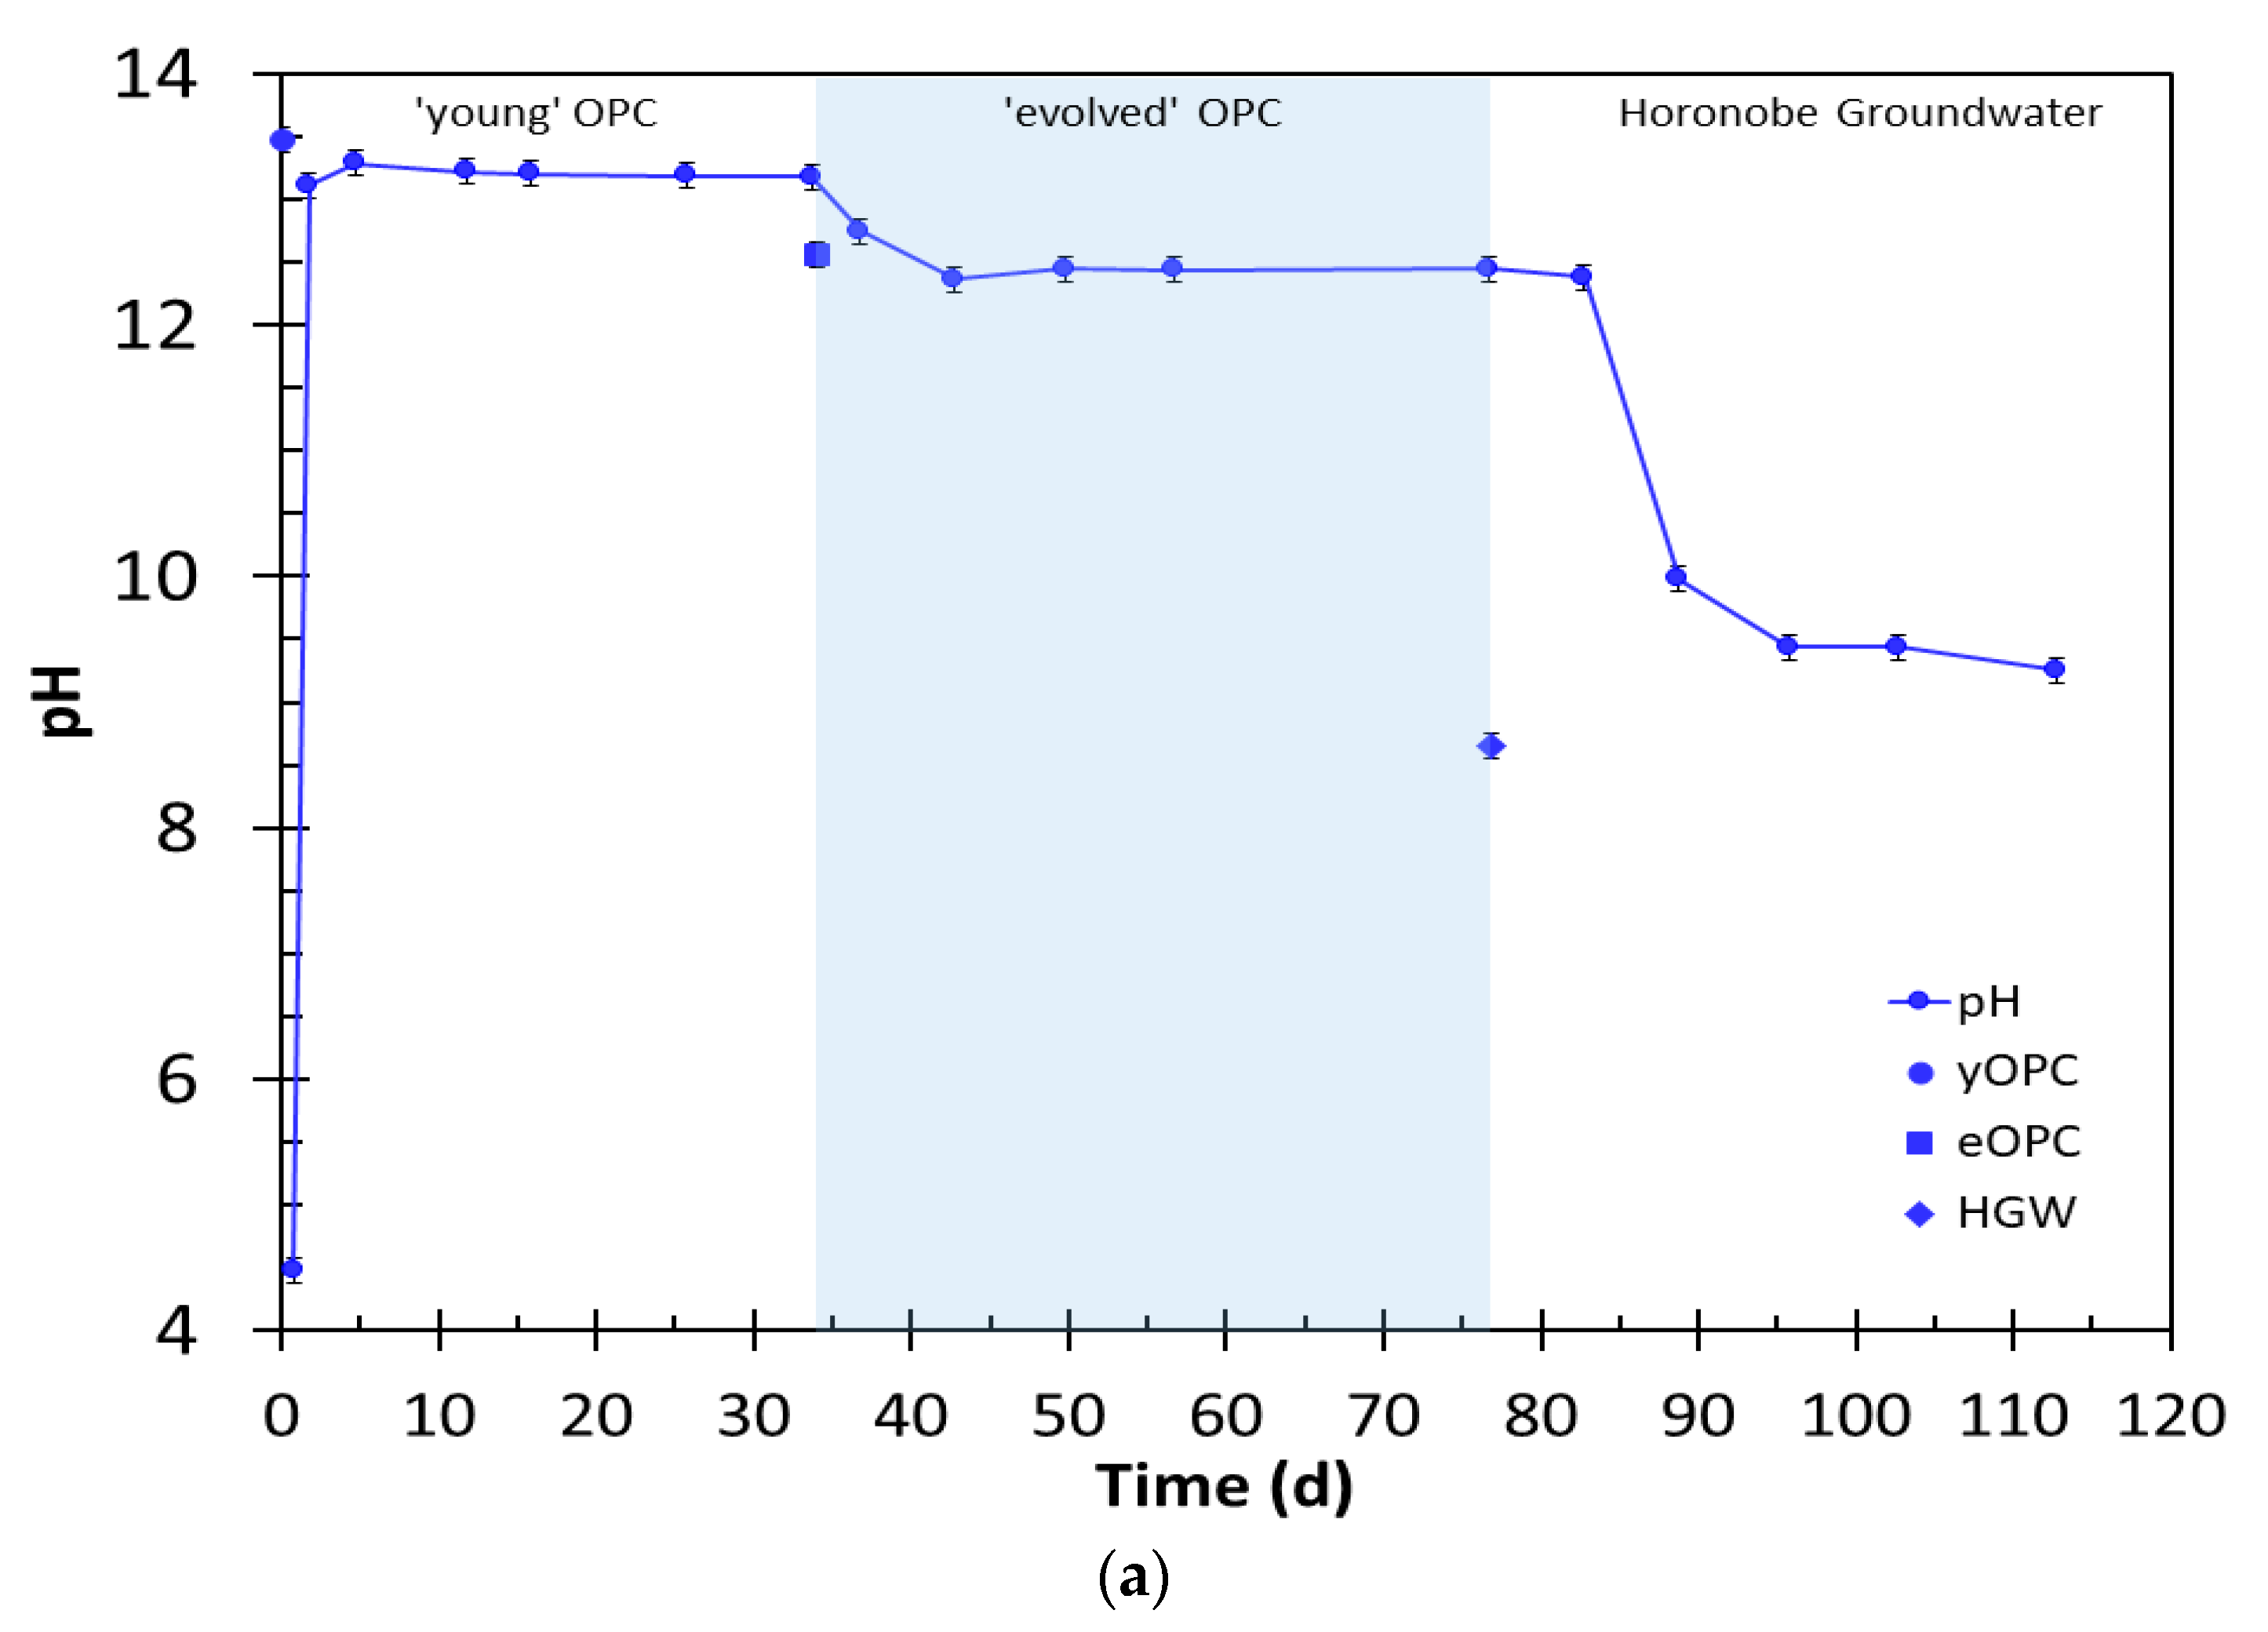
3.1.1. Changes in pH

Figure 4a shows the evolution of pH with time for the experiment with the ‘young’ OPC leachate, followed by the ‘evolved’ OPC leachate and then HGW (SFC-3). In all three experiments, there was an initial decrease to pH ~4 due to the presence of dissolution of sulphate phases, the discussion of which can be found in [14]. The pH recovered from the low values within the first 24 h to pH ~13.2. The pH reduction with the ‘young’ OPC leachate was ~0.2 pH units lower than the original leachate, and a similar drop was seen with the ‘evolved’ OPC leachate (pH ~12.4). With the change to HGW, the pH decreased, but even after ~36 d of reaction, the measured pH ~9.25 was still higher than that of the inflowing groundwater (pH ~8.6).

3.1.2. Changes in Na Concentration

The changes in Na concentrations in the reacted fluids are shown in Figure 4b. In all three experiments, [Na] decreased from the concentration in ‘young’ OPC leachate to ~1300 mg/L and remained at close to this value until the inflowing fluid was changed to the ‘evolved’ OPC leachate (Figure 4b and Figure S1) when, as expected, [Na], reflecting the lack of Na in the ‘evolved’ OPC leachate, decreased to ~10 mg/L (analytical detection limit) (Figure 4b and Figure S2). With the change to HGW, [Na] slowly rose over the next 25 days (Figure 4b) to close to that of the HGW (~2600 mg/L). This time to match the incoming fluid concentration was slower than the time taken for [Na] to reach steady state with the change from the ‘young’ to the ‘evolved’ OPC leachate, which was only ~10 d.

3.1.3. Changes in K Concentration

With the ‘young’ OPC leachate, [K] initially decreased to ~4100 mg/L, possibly owing to ion exchange reactions with the clays in the mudstone [14], before increasing to ~5700 mg/L (Figure 4b and Figure S1) and remained, within analytical error, at this concentration until the fluid was changed to the ‘evolved’ OPC leachate (SFC-2 and -3) when the [K] dropped to <40 mg/L (Figure 4b and Figure S2). As with [Na], with the change to HGW (SFC-3), [K] recovered to close to the concentration present in the groundwater.

3.1.4. Changes in Ca Concentration

With both of the OPC leachate types, [Ca] in the reacted fluids was significantly lower than of the original OPC leachates (<25 mg/L for the ‘young’ OPC leachate and ~640 mg/L for the ‘evolved’ OPC leachate (Figure 4b, Figures S1 and S2)). When HGW replaced the OPC leachate, [Ca] decreased over the next 25 days to <5 mg/L, mirroring the changes seen in [Na], and remained at this value for the remaining duration of the experiment (Figure 4b).

3.1.5. Changes in Silica Concentration

In all the experiments (Figure 4b, Figures S1 and S2), the silica concentrations increased rapidly in the first 6 days of the reaction to high levels ~1000 mg/L, and then slowly decreased to ~500 mg/L at the time of the change to the evolved’ OPC leachate (~40 d). With the ‘evolved’ OPC leachate, silica decreased further, so that, after 7 d of flow with the evolved’ OPC leachate, silica concentrations were <3 mg/L (Figure 4b and Figure S2). When the inflowing fluid was changed to HGW, silica concentrations in the reacted fluids increased over 14 d to approximately twice that of the HGW, i.e., ~130 mg/L.

3.1.6. Changes in Other Ions

With the exception of Rb and Sr, which tracked the concentrations of Na and Ca, respectively, the concentrations of the remaining cations analysed (e.g., Al, Ba, Cs, Cu, Fe, Li, Mg, Mn) showed no significant change from the concentrations in original fluids.
In general, the concentrations of anions (Br, NO2, NO3, and F) reflected the respective concentrations present in the OPC leachates and groundwater. With the ‘young’ OPC leachate, sulphate concentrations in the first fluid samples collected showed an early large peak (up to ~800 mg/L), but, after 7 d, sulphate concentrations were <5 mg/L and showed no significant change during the subsequent reaction with neither the ‘evolved’ OPC leachate nor HGW.
In all three experiments, phosphate showed a small peak (~10 days reaction) before decreasing to <1 mg/L. Previous studies [29] reported rare apatite in some samples of Horonobe mudstone, the dissolution of which may have been the source of this phosphate peak.
The behaviour of Cl (Figure 4b) with the change to HGW was similar to that of Na, and took ~25 d to reach the concentration of the original HGW (~2900 mg/L).
Bicarbonate concentrations in the collected fluids from the reaction with both OPC leachates were below detection, but once the fluid was changed to HGW, [HCO3] increased to ~1300 mg/L over 14 d, but did not reach the concentration of the HGW (~1900 mg/L).

3.2. Mineralogical Analysis

3.2.1. ‘Young’ OPC Leachate Experiment (SFC-1)

A summary of the evolution of the mineralogy for the SFC-1 is shown in Figure 5 and discussed in greater detail in [14]. In the first section (~0–1.5 mm), there was evidence for the dissolution of the primary material, and no secondary phases were observed. However, in the next section, ~1.5–3 mm, a wide variety of secondary C-S-H and C-A-S-H phases were observed (Figure 5 and [14]). By section 3, ~3–5 mm, there was no further evidence for additional secondary phase precipitation, and mineral surfaces showed little sign of reaction.

3.2.2. ‘Young’ and Then ‘Evolved’ OPC Leachate Experiment (SFC-2)

A summary of the evolution of the mineralogy for the experiment with ‘young’ OPC leachate, followed by the ‘evolved’ OPC leachate (SFC-2), is shown in Figure 6. Again, the mudstone samples were cut into ~1.5 mm thick slices before being prepared for subsequent mineralogical characterisation.
In the first section (~0–1.5 mm), a variety of C-(A)-S-H phases were observed (Figure 6), identified by semi-quantitative SEM-EDS analysis. These phases varied in Ca/Si, Al content, and morphology. By section 3 (~3–4.5 mm), as with section 1, a variety of C-(A)-S-H phases were observed, but also present were ‘needle-like’ crystals. SEM-EDS analysis (Figure 6) suggested that they had a high S content, possibly representing an ettringite or monosulphate-like composition. Both ettringite and monosulphate are often found in hydrated Portland cement pastes [40]. XRD analysis (Figure S2) proved inclusive as to which phase(s) was present, but the SEM-EDS analysis suggested Si was also present. Ettringite has been shown to be able to accept the replacement of up to half of its Al by Si [41], which suggests ettringite as the likely phase, though monosulphate is still a possibility if the Si detected was due to the presence of the underlying primary mineral. An examination of section 6 (~8.5–10 mm) by SEM again showed the presence of a needle-like sulphur bearing phase and a variety of C-S-H and C-A-S-H phases (Figure 6).
PHREEQC was used to calculate mineral SI in the reacted fluids based on the analysed fluid chemistry (Figure S3). The calculations showed that, for most primary mineral phases, the degree of undersaturation increased in the ‘evolved’ OPC leachate, suggesting more dissolution compared with the ‘young’ OPC leachate. In addition, the modelling suggested that, as well as C-S-H phases being saturated or close to saturation, both ettringite and monosulphate would also be saturated in the collected fluids (Figure S3) when reacted with the ‘evolved’ OPC leachate.

3.2.3. OPC Leachates Then HGW (SFC-3)

A summary of the evolution of the mineralogy for the experiment with the ‘young’ OPC and then the ‘evolved’ OPC leachate followed by HGW (SFC-3) is shown in Figure 7. Unlike the experiments with the OPC leachates (SFC-1,2), it was difficult, owing to partial cementation of the sample, to prepare equally sliced samples for mineralogical characterisation.
In the first section (~0–1.0 mm), many surfaces showed signs of significant secondary precipitation. SEM-EDS analysis (Figure 7) of these precipitates showed them to be aragonite/calcite, sometimes containing small amounts of Mg, of varying morphologies. Most of these crystals were small, ranging from around ~2 to ~10 µm, suggesting fairly rapid formation. As the HGW contained significant carbonate and the mudstone was saturated with the ‘evolved’ OPC leachate, it was expected that carbonate precipitation would occur, especially as, in the HGW itself, calcite was close to saturation. Indeed, calculation of mineral states, using PHREEQC, indicated that carbonates were close to saturation (Figure 8) in the collected reacted fluids. Apart from aragonite/calcite (Figure 7 and Figure S4), no other secondary phases were found, and where visible, the primary mineral surfaces appeared to be clean of ‘fines’. The secondary C-S-H phases, and ettringite/monosulphate, observed in the experiments with the OPC leachates (SFC-2) appeared to have re-dissolved in this section.
In Section 2 (~1.0–2.5 mm), again, ‘clean’ diatoms were visible. Secondary precipitates of differing compositions were also found. SEM-EDS analysis of these precipitates was sometimes inconclusive, with some rare precipitates having compositions that could be attributed to high Ca/Si, C-S-H phases, and/or calcite overlying primary silicate minerals. The examination of the saturation state of various C-S-H phases in the reacted fluids suggested that all C-S-H phases were undersaturated (Figure 8), and thus should have re-dissolved. Elsewhere in this section, secondary calcites of different morphologies, sometimes containing Mg, were found. Some larger carbonate crystals (Figure 7) with diameters of 40–50 µm were also observed, suggesting that these had formed more slowly than those observed in the first section of the SFC.
By section 6 (~7.5–10 mm), ‘stacked’ carbonate grains (calcite) were frequently observed; again, some of these crystals were large (typical diameters of 30–40 µm), suggesting slow sustained growth. Although zeolites were identified as possible secondary minerals from the calculations for the mineral saturation states (Figure 8), no evidence was found for their formation, though it should be noted that the available thermodynamic data for many zeolites remain poorly known [17]. However, given the much faster precipitation rate of both aragonite and calcite relative to zeolites, carbonates would be highly favoured over zeolites as secondary phases over experimental timescales. In addition, other studies have suggested that higher temperatures (>60 °C) may be required for zeolite formation [42].

4. Results of Reactive Transport Modelling

To further examine the reaction sequence seen in these experiments and to extend the timescale beyond that possible in the laboratory experiments, coupled 1D reactive transport models were constructed using the ‘CABARET’ software.

Model Predictions vs. Experimental Data

Figure 9 shows the comparison of the results of the CABARET model compared with the experimental data for the major aqueous components. The model predictions for the evolution of pH (Figure 9a) were a good match for the experimental data. Both Na and K predicted concentrations were also a good match, especially for the OPC leachates (Figure 9a). However, Na with the HGW was predicted to increase faster to the concentration of the HGW than the experimental data. Calcium concentrations (Figure 9b) were also a reasonable match to the experimental data for the OPC leachates, although predicted [Ca] with the ‘evolved’ OPC leachate were slightly lower than in the experiments.
Silica concentrations were more difficult to match with the experimental data (Figure 9b). Although an initial increase in silica concentration was predicted by the CABARET model, this was significantly lower than the concentration observed in the experiments; the reason(s) for this mismatch are not clear, but one possible explanation could be that, in the experiments, the crushing process produced many highly reactive ‘fines’ that would have reacted before the bulk of the mudstone.
In addition, with the HGW, silica concentrations in the CABARET model initially rose to ~1200 mg/L (~2 × 10⁻² mol/kg) compared with ~140 mg/L (~2.3 × 10⁻³) in the experiments, before decreasing after 100 d to ~63 mg/L (~7.65 × 10⁻⁴ mol/kg), which was about half the concentration observed in the experiments.
Chloride concentrations with the HGW (Figure 9b) showed an almost immediate increase from <1 to ≈3200 mg/L in the model rather than the delayed increase seen in the SFC-3 experiment, showing a similar behaviour to sodium.
Comparison of the saturation indices (SI) for selected C-S-H and zeolite phases derived from the fluid chemistry (see Figure 8) and CABARET are shown in Figure 9c,d. Although the absolute numerical values for the mineral SI are often different, the trend in the model is a reasonable match for the experiment derived SI data, with the major difference being that, in the experiments, zeolites were oversaturated compared with CABARET model predictions.
Figure 10 shows the predicted variation of porosity and selected minerals with distance, at defined time steps. The variation in porosity with time and distance (Figure 10a) predicts that, for the ‘young’ OPC leachate (0 to 20 d) from 0 to 2.5 mm, the porosity would increase, i.e., dissolution of the primary minerals after 3 mm, the porosity decreases, indicating formation of a secondary phases(s). From ~7 to 10 mm, the porosity remains close to but slightly higher than the starting value (56.4%), suggesting continued partial dissolution of the mudstone minerals.
The predicted changes in porosity mirrored the prediction of C-S-H phase precipitation (Figure 10b), which was predicted at time step of 40.2 (d), i.e., the change from ‘young’ OPC to ‘evolved’ OPC to be the greatest, ~3–4.5 mm, which matches well with the mineralogical observations from the flow experiment with the ‘young’ OPC leachate (SFC-1) (Figure 5).
With the ‘evolved’ OPC leachate, the model suggests continued dissolution of the mudstone and increased precipitation of C-S-H phases (Figure 10a,b; time steps of 40.2, 58.4, and 76.7 (d)) with C-S-H phase precipitation extending throughout the flow cell (Figure 6), but still with its maximum between 2.5 and 4.5 mm.
With the change to HGW (Figure 10a; time steps of 94.9 and 113.2 (d)), the porosity close to the inlet (0–1 mm) decreases in direct response to the predicted formation of secondary calcite (Figure 10c), and because calcite is predicted to form throughout the cell, porosity is also reduced along the whole flow path. Again, this was in good agreement with the experimental observations of calcite precipitation (Figure 7). Also shown in Figure 10 are exemplar data for the primary minerals, which show continued dissolution with time and distance (Figure 10d,e).
Figure 11 shows summary plots of the changes in composition of modelled mineral assemblage for the unreacted mudstone and after reaction with each fluid (i.e., time 0, ~40, ~80, ~120 d). This illustrates the variation in the relative proportions of the primary and secondary minerals with time and distance. The increase in volume of C-S-H phases precipitated with the ‘evolved’ OPC leachate compared with the ‘young’ leachate is evident, as is the complete removal of C-S-H phases and replacement by calcite following reaction with HGW, which is the same sequence observed in the experiments (see Figure 5, Figure 6 and Figure 7). In addition, primary minerals, though showing slight dissolution, dominate the mineral assemblage throughout.
Zeolites were predicted to form, but, as noted above (Section 3.2.3), carbonates would be favoured over zeolites as potential secondary phases.

5. Discussion

In summary, the experimental data obtained from this study on the reaction of mudstone with highly alkaline fluids are consistent with previous modelling and experimental studies on other host rocks [9,10,11,15,39], although the Horonobe mudstone is less reactive than some of the mineral assemblages previously investigated, i.e., Borrowdale Volcanic Group; Äspö Granite; Wellenberg marl [10], Opalinus Shale [11]; and a generic crystalline rock [15].

5.1. Chemistry and Mineralogy

The pH with the OPC leachates was buffered to <0.2 pH units below that of the unreacted leachates, and similar changes in pH have been observed in other studies with OPC leachates [9,10,11,14,15]. However, with the change to Horonobe groundwater, the pH of the reacted fluids did not, within the timeframe of this study, return to that of the HGW (pH~8.6), but remined slightly higher at pH~9.4 (Figure 4a), suggesting that there was some longer-term buffering of the pH by the remnant secondary mineral assemblage present after reaction with the successive OPC leachates, i.e., the presence of C-(A-)S-H phases.
It was also noticeable that, for [Na] and [Cl] (Figure 4b), there was a delay before the dissolved concentrations increased towards the levels present in the HGW (Figure 4b). As chloride is normally considered to be a conservative species, this suggests that the lag in the experiments is due to a physical/transport process rather than a chemical one. A possible explanation for this is that there was a slow mixing of the HGW with OPC leachate(s) trapped within the pore spaces by the precipitated C-(A-)S-H phases that continued until the phases completely dissolved, thereby releasing the trapped fluid; this would also result in a slightly higher pH than expected with the HGW. Previously, it has been reported that the presence of C-A-S-H phases caused fluid stagnation and poor flow in some pores/voids, resulting in some cases in the persistence of secondary precipitates [15]. The model included porosity in solute transport processes, but did not consider heterogeneity in the porosity distribution.
The sequential reaction of the mudstone with the OPC leachates was dominated by the initial precipitation of C-(A-)S-H phases of varying compositions (SEM-EDS, semi-quantitate analysis), with accompanying variations in the concentration of Ca and Si in the reacted fluids. This general sequence was also predicted by the modelling, allowing direct comparison of the experimental system evolution with the reactive transport simulations. With the change to the groundwater and the consequent reduction in pH, the secondary C-(A-)S-H phases re-dissolved, confirming model predictions that they would dissolve, owing to the lower pH of the groundwater, and be replaced by secondary carbonates.
In the experiments, [Ca] remained below that of the HGW owing to the formation of these carbonate minerals, and [Si] increased as the C-(A-)S-H phases dissolved. However, the simulated magnitude of the [Si] increase and the subsequent decrease was greater than that seen in the experiments, suggesting that there was either a kinetic inhibition to the dissolution of C-(A-)S-H phase(s) in the experiments or that a physical mechanism [15] not simulated by the model, as discussed above for [Na] and [Cl], was controlling the dissolution, and hence [Ca] and [Si]. This clearly illustrates the importance of being able to compare model predictions with analytical data.

5.2. Extent of Reaction

While, with the ‘young’ OPC leachate, the extent of reaction in the experiments was limited to only the first few millimetres (Figure 5), there was greater reaction with the ‘evolved’ OPC leachate, and thus greater secondary C-(A-)S-H precipitation (Figure 6), reflecting the higher [Ca] of that leachate. Although observed throughout, the secondary C-(A-)S-H phases were still, at least subjectivity, most prevalent in the first few millimetres. The model simulations showed a similar trend with regard to both the extent and degree of reaction (precipitation) to the experimental data.
In a previous study working with Opalinus clay (OPA) and a similar ‘young’ OPC leachate as used in this study [11], it was found that, even after 18 months, the precipitation zone within the OPA was limited to <2 cm, with C-A-S-H phases together with Ca-carbonate, portlandite, and brucite identified. Similarly, it has been previously observed during the reaction of Na-montmorillonite with simulated OPC and OPA porewaters [43] that porosity changes were limited to ~2 mm penetration into the clay, and comparable observations have also been made in related studies [43,44,45,46]. In a review of cement-clay modelling with high pH fluids [47], it was noted that many reactive transport models predicted limited zones of alteration similar to the extent seen in the experiments undertaken in this study.
However, the higher than expected pH in the reacted fluids and the trend in Ca and silica concentrations following the change to groundwater suggest that some C-(A-)S-H phases may persist for a longer time than predicted by the modelling as a result of a physical mechanism. A probable explanation for this is that the secondary phases will have formed in the pore spaces, blocking some fluid flow paths, thus reducing the impact of the inflowing groundwater, and furthermore that formation in voids will reduce the reactive surface area of the secondary phases, further slowing their dissolution [15]. Again, this illustrates the importance of having analytical data with which to validate model predictions.
The experiments provided mineralogical data only at four time steps (i.e., at the start and at ~40, ~80, and ~120 d) and the outflow fluid chemistry was only sampled intermittently. As the CABARET model predictions were in general agreement with the experimental data at these time steps, the model can then be used to examine how the chemical and spatial changes may have evolved between these data points, as well as to explore the changes in fluid chemistry within the flow cell, which are difficult (at least at the millimetre scale of the flow cell used here) to determine experimentally.

5.3. Recommendations for Model Improvements and Validation

The CABARET reactive transport model has been demonstrated to be in general agreement with the experimental data, which gives greater confidence in the potential use of this code to make predictions at greater scale. However, common with other reactive transport models, e.g., PHREEQC [25] and TOUGHREACT [48] and others, there is scope for improving the agreement with experimental data.
For example, in CABARET, the surface area for each mineral is assigned a fixed value in the initial set-up file, and this does not subsequently vary with dissolution or precipitation. Reactive-transport models are able to couple diffusive and advective flow to porosity, but processes such as heterogenous pore occlusion and secondary minerals coating primary solids are not considered, with only bulk porosity being able to evolve in each model cell.
The timing of the sequence of host rock alteration resulting in the formation of C-(A-)S-H phases, which later re-dissolve with the change to groundwater and the release of any sorbed radionuclides, requires further investigation, as the experimental data from this study suggest that this process may occur over a somewhat longer time than predicted by the reactive transport modelling.
To fully understand the temporal and spatial extent of the reactions on mineral evolution (precipitation and dissolution) and the subsequent effect on radionuclide migration requires longer duration experiments with intact samples, under carefully controlled laboratory conditions, and more realistic ‘in situ’ experiments to provide data for model validation. Further improvements to the available simulation software are also required to analyse and extend the results from such experimental programmes to repository scales.

Supplementary Materials

The following are available online at https://www.mdpi.com/article/10.3390/min11091026/s1, Figure S1: Major changes in fluid chemistry with time. Horonobe mudstone with ‘young’ OPC leachate (SFC-1) and Horonobe mudstone with ‘young’ OPC, and then ‘evolved OPC leachate (SFC-2). Figure S2: XRD analysis of unreacted and reacted mudstone samples experiment with ‘young’ OPC, and then the ‘evolved OPC leachate (SFC-2). Figure S3: Selected primary mineral and C-S-H phase saturation states in reacted fluids, experiment with ‘young’ OPC, and then the ‘evolved OPC leachate (SFC-2). Figure S4: XRD analysis of unreacted and reacted mudstone samples experiment with ‘young’ OPC, and then the ‘evolved OPC leachate, followed by HGW (SFC-3). Table S1: Calculated Log K for the hypothetical minerals; ‘young’ OPC leachate. Table S2: Calculated Log K for the hypothetical minerals; ‘evolved’ OPC leachate. Table S3: Calculated Log K (for the hypothetical minerals); Horonobe groundwater. Table S4: Details of the dissolved chemical species included in the CABARET reactive transport model.

Author Contributions

The individual contributions to this paper are as follows: Conceptualization and methodology, K.B., Y.A., Y.T., Y.H., M.K., J.W. and T.S.; validation, K.B., S.M., M.K. and Y.O.; investigation and formal analysis, K.B., S.M., Y.H., M.K., J.W., T.S. and Y.O.; resources, Y.T. and Y.A.; data curation, K.B., S.M., Y.H., J.W., T.S. and Y.O.; writing—original draft preparation, K.B.; writing—review and editing, all authors. All authors have read and agreed to the published version of the manuscript.

Funding

This study was partly performed as a part of “The project for validating near-field assessment methodology in geological disposal (FY2020)” supported by the Ministry of Economy, Trade, and Industry of Japan.

Data Availability Statement

The data used in this study are available from the authors upon request.

Acknowledgments

We thank Hikari Beppu and Takashi Endo for assistance with fluid chemical analysis. This study was supported by the JAEA Horonobe Underground Research Center, Hokkaido, Japan, providing the rock samples and background information.

Conflicts of Interest

The authors declare no conflict of interest.

References

  1. JNC. H12: Project to Establish the Scientific and Technical Basis for HLW Disposal in Japan, Project Overview Report and three Supporting Reports. JNC TN1410 2000–001~004. 2000. Available online: https://jopss.jaea.go.jp/pdfdata/JNC-TN1410-2000-003.pdf (accessed on 30 July 2021).
  2. Baker, A.J.; Bateman, K.; Hyslop, E.K.; Ilett, D.J.; Linklater, C.M.; Milodowski, A.E.; Noy, D.J.; Rochelle, C.A.; Tweed, C.J. Research on the Alkaline Disturbed Zone Resulting from Cement–Water–Rock Reactions around a Cementitious Repository; UK Nirex Ltd.: Harwell, UK, 2002. [Google Scholar]
  3. JAEA. Second Progress Report on Research and Development for TRU Waste Disposal in Japan; Repository Design, Safety Assessment and Means of Implementation in the Generic Phase (TRU–2). JAEA–Review 2007–010, 2007/03. 2007. Available online: https://www.jaea.go.jp/04/be/documents/doc_02.html (accessed on 30 July 2021).
  4. Falck, W.E.; Nilsson, K.-F. Geological Disposal of Radioactive Waste–Moving Towards Implementation. In JRC Reference Reports, JRC45385 (EUR 23925 E); European Commission: Brussels, Belgium, 2009; Available online: http://ec.europa.eu/dgs/jrc/downloads/jrc_reference_report_2009_10_geol_disposal.pdf (accessed on 30 July 2021).
  5. Atkinson, A. The time dependence of pH within a repository for radioactive waste disposal. UKAEA Report AERE–R 11777; UKAEA: Harwell, UK, 1985. [Google Scholar]
  6. Berner, U. Evolution of pore water chemistry during degradation of cement in a radioactive waste repository environment. Waste Manag. 1992, 12, 201–219. [Google Scholar] [CrossRef]
  7. Wilson, J.; Bateman, K.; Tachi, Y. The impact of cement on argillaceous rocks in radioactive waste disposal systems: A review focusing on key processes and remaining issues. Appl. Geochem. 2021, 130, 104979. [Google Scholar] [CrossRef]
  8. Levenspiel, O. Chemical Reaction Engineering, 3rd ed.; Wiley: Hoboken, NJ, USA, 1998; ISBN 978-0-471-25424-9. [Google Scholar]
  9. Bateman, K.; Coombs, P.; Pearce, J.M.; Wetton, P.D. Nagra/Nirex/SKB Column Experiments; Fluid Chemical and Mineralogical Studies. In British Geological Survey Report WE/95/26; British Geological Survey: Nottingham, UK, 2001. [Google Scholar]
  10. Bateman, K.; Coombs, P.; Pearce, J.M.; Noy, D.J.; Wetton, P.D. Fluid Rock Interactions in the Disturbed Zone: Nagra/Nirex/SKB Column Experiments—Phase II. In British Geological Survey Report WE/99/5; British Geological Survey: Nottingham, UK, 2001. [Google Scholar]
  11. Taubald, H.; Bauer, A.; Schafer, T.; Geckeis, H.; Satir, M.; Kim, J.I. Experimental investigation of the effect of high–pH solutions on the Opalinus Shale and the Hammerschmiede Smectite. Clay Miner. 2000, 35, 515–524. [Google Scholar] [CrossRef]
  12. Ochs, M.; Mallants, D.; Wang, L. Radionuclide and Metal Sorption on Cement and Concrete; Springer International Publishing: Cham, Switzerland, 2016. [Google Scholar]
  13. Rochelle, C.A.; Milodowski, A.E.; Bateman, K.; Moyce, E.B.A. A long–term experimental study of the reactivity of basement rock with highly alkaline cement waters: Reactions over the first 15 months. Mineral. Mag. 2016, 80, 1089–1113. [Google Scholar] [CrossRef] [Green Version]
  14. Bateman, K.; Amano, Y.; Kubota, M.; Ohuchi, Y.; Tachi, Y. Reaction and Alteration of Mudstone with Ordinary Portland Cement and Low Alkali Cement Pore Fluids. Minerals 2021, 11, 588. [Google Scholar] [CrossRef]
  15. Small, J.S.; Byran, N.; Lloyd, J.R.; Milodowski, A.E.; Shaw, S.; Morris, K. Summary of the BIGRAD project and its implications for a geological disposal facility. In Report NNL; Radioactive Waste Management: Didcot OX11GD, UK, 2016. Available online: https://rwm.nda.gov.uk/publication/summary-of-the-bigrad-project-and-its-implications-for-a-geological-disposal-facility/ (accessed on 30 July 2021).
  16. Marty, N.; Bildstein, O.; Blanc, P.; Claret, F.; Cochepin, B.; Gaucher, E.C.; Jacques, D.; Lartigue, J.E.; Liu, S.; Mayer, K.U.; et al. Benchmarks for multicomponent reactive transport across a cement/clay interface. Comput. Geosci. 2015, 19, 635–653. [Google Scholar] [CrossRef]
  17. Savage, D.; Noy, D.; Mihara, M. Modelling the Interaction of Bentonite with Hyperalkaline Fluids. Appl. Geochem. 2002, 17, 207–223. [Google Scholar] [CrossRef]
  18. Watson, C.; Hane, K.; Savage, D.; Benbow, S.; Cuevas, J.; Fernandez, R. Reaction and diffusion of cementitious water in bentonite: Results of ‘blind’ modelling. Appl. Clay Sci. 2009, 45, 54–69. [Google Scholar] [CrossRef]
  19. Hama, K.; Kunimaru, T.; Metcalfe, R.; Martin, A.J. The hydrogeochemistry of argillaceous rocks formations at the Horonobe URL site, Japan. Phys. Chem. Earth 2007, 32, 170–180. [Google Scholar] [CrossRef]
  20. Mazurek, M.; Eggenberger, U. Mineralogical analysis of core samples from the Horonobe area. In RWI Technical Report 05–01; Institute of Geological Sciences, University of Bern: Bern, Switzerland, 2005. [Google Scholar]
  21. Hiraga, N.; Ishii, E. Mineral and chemical composition of rock core and surface gas composition in Horonobe Underground Research Laboratory Project (Phase 1). In JAEA Technical Report JAEA–Data/Code 2007–022; Japan Atomic Energy Agency: Tokai–Mura, Japan, 2008; Available online: https://jopss.jaea.go.jp/pdfdata/JAEA-Data-Code-2007-022.pdf (accessed on 30 July 2021).
  22. Savage, D.; Hughes, C.R.; Milodowski, A.E.; Bateman, K.; Pearce, J.; Rae, E.; Rochelle, C.A. The evaluation of chemical mass transfer in the disturbed zone of a deep geological disposal facility for radioactive wastes. I. Reaction of silicates with Calcium hydroxide fluids. In Nirex Report NSS/R244; UK Nirex Ltd.: Harwell, UK, 1998. [Google Scholar]
  23. Savage, D.; Bateman, K.; Hill, P.; Hughes, C.R.; Milodowski, A.E.; Pearce, J.; Rochelle, C.A. The evaluation of chemical mass transfer in the disturbed zone of a deep geological disposal facility for radioactive wastes. II. Reaction of silicates with Na–K–Ca– hydroxide fluids. In Nirex Report NSS/R283; UK Nirex Ltd.: Harwell, UK, 1998. [Google Scholar]
  24. Miyakawa, K.; Mezawa, T.; Mochizuki, A.; Sasamoto, H. Data of groundwater chemistry obtained in the Horonobe Underground Research Laboratory Project (FY2014-2016). In JAEA Technical Report JAEA-Data/Code 2017-012; Japan Atomic Energy Agency: Tokai, Japan, 2017; Available online: https://jopss.jaea.go.jp/pdfdata/JAEA-Data-Code-2017-012.pdf. (accessed on 30 July 2021).
  25. Parkhurst, D.L.; Appelo, C.A.J. Description of Input and Examples for PHREEQC Version 3–A Computer Program for Speciation, Batch–Reaction, One–Dimensional Transport, and Inverse Geochemical Calculations. 2013. Available online: https://pubs.usgs.gov/tm/06/a43/ (accessed on 30 July 2021).
  26. JAEA. The Project for Validating Assessment Methodology in Geological Disposal System; Annual Report for JFY2016, JAEA Technical Report; Japan Atomic Energy Agency (JAEA): Tokai, Ibaraki, Japan, 2017. (In Japanese) [Google Scholar]
  27. Savage, D.; Wilson, J.; Benbow, S.; Sasamoto, H.; Oda, C.; Walker, C.; Kawama, D.; Tachi, Y. Using natural systems evidence to test models of transformation of montmorillonite. Appl. Clay Sci. 2020, 195, 105741. [Google Scholar] [CrossRef]
  28. Wilson, J.; Benbow, S.; Metcalfe, R. Reactive transport modelling of a cement backfill for radioactive waste disposal. Cem. Concr. Res. 2018, 111, 81–93. [Google Scholar] [CrossRef]
  29. Kemp, S.J.; Cave, M.R.; Hodgkinson, E.; Milodowski, A.E.; Kunimaru, T. Mineralogical Observations and Interpretation of Porewater Chemistry from the Horonobe Deep Boreholes HDB-1 and HDB-2, Hokkaido, Japan. In British Geological Survey Report; British Geological Survey: Nottingham, UK, 2002. [Google Scholar]
  30. Bernard, E.; Jenni, A.; Fisch, M.; Grolimund, D.; Mäder, U. Micro-X-ray diffraction and chemical mapping of aged interfaces between cement pastes and Opalinus Clay. Appl. Geochem. 2020, 115, 104538. [Google Scholar] [CrossRef]
  31. Dauzeres, A.; Le Bescop, P.; Sardini, P.; Cau Dit Coumes, C.; Brunet, F.; Bourbon, X.; Timonen, J.; Voutilainen, M.; Chomat, L.; Sardini, P. On the physico–chemical evolution of low–pH and CEM I cement pastes interacting with Callovo–Oxfordian pore water under its in situ CO2 partial pressure. Cem. Concr. Res. 2014, 58, 76–88. [Google Scholar] [CrossRef]
  32. JAEA 2014: H25 Project for Technical Study on Geological Disposal of High-Level Radioactive Waste. In Report on Development of Advanced Cement Material Impact Assessment Technology; Japan Atomic Energy Agency (JAEA): Tokai, Ibaraki, Japan, (In Japanese). Available online: https://www.enecho.meti.go.jp/category/electricity_and_gas/nuclear/rw/library/2013/25-13-1.pdf. (accessed on 7 September 2021).
  33. JAEA 2019: H29 Project for Geological Disposal of High-Level Radioactive Waste. Technology Development Project for Geological Disposal of High-Level Radioactive Waste. Development of Technology for Confirmation of Evaluation of Disposal System. (In Japanese). Available online: https://www.enecho.meti.go.jp/category/electricity_and_gas/nuclear/rw/library/2017/29fy_hyoukakakushou.pdf (accessed on 7 September 2021).
  34. Oda, C.; Walker, C.; Chino, D.; Ichige, S.; Honda, A.; Sato, T.; Yoneda, T. Na-montmorillonite dissolution rate determined by varying the Gibbs free energy of reaction in a dispersed system and its application to a coagulated system in 0.3M NaOH solution at 70 °C. Appl. Clay Sci. 2014, 93–94, 62–71. [Google Scholar] [CrossRef]
  35. Trapote-Barreira, A.; Cama, J.; Soler, J.M. Dissolution kinetics of C-S-H gel: Flow-through experiments. Phys. Chem. Earth Parts A/B/C 2014, 70–71, 17–31. [Google Scholar] [CrossRef]
  36. Steefel, C.I.; Lichtner, P.C. 1998 Multicomponent reactive transport in discrete fractures: II: Infiltration of hyperalkaline groundwater at Maqarin, Jordan, a natural analogue site. J. Hydrol. 1998, 209, 200–224. [Google Scholar] [CrossRef]
  37. Tachi, Y.; Shibutani, T.; Sato, H.; Yui, M. Experimental and modeling studies on sorption and diffusion of radium in bentonite. J. Contam. Hydrol. 2001, 47, 171–186. [Google Scholar] [CrossRef]
  38. Mihara, M.; Sasaki, R. RAdio-nuclides Migration DAtasets (RAMDA) on Cement, Bentonite and Rock for TRU Waste Repository in Japan. JNC TN1410 2000-001~004. 2005. Available online: https://jopss.jaea.go.jp/pdfdata/JNC-TN8400-2005-027.pdf (accessed on 7 September 2021).
  39. Benbow, S.J.; Watson, C.E. 2014 QPAC Reactive Transport Module: Theory and Testing. Quintessa Report QRS-QPAC-RTM-2 v1.1.
  40. Baur, I.; Keller, P.; Mavrocordatos, D.; Wehrli, B.; Johnson, C.A. Dissolution-precipitation behaviour of ettringite, monosulfate, and calcium silicate hydrate. Cem. Concr. Res. 2004, 34, 341–348. [Google Scholar] [CrossRef]
  41. Barnett, S.J.; Adam, C.D.; Jackson, A.R.W. Solid solutions between ettringite, Ca6Al2(SO4)3(OH)12·26H2O, and thaumasite, Ca3SiSO4CO3(OH)6·12H2O. J. Mater. Sci. 2000, 35, 4109–4114. [Google Scholar] [CrossRef]
  42. Lalan, P.; Dauzères, A.; De Windt, L.; Bartier, D.; Sammaljärvi, J.; Barnichon, J.-D.; Techer, I.; Detilleux, V. Impact of a 70°C temperature on an ordinary Portland cement paste/claystone interface: An in situ experiment. Cem. Concr. Res. 2016, 83, 164–178. [Google Scholar] [CrossRef] [Green Version]
  43. Shafizadeh, A.; Gimmi, T.; Van Loon, L.R.; Kaestner, A.P.; Mäder, U.K.; Churakov, S.V. Time-resolved porosity changes at cement-clay interfaces derived from neutron imaging. Cem. Concr. Res. 2020, 127, 105924. [Google Scholar] [CrossRef]
  44. Read, D.; Glasser, F.P.; Ayora, C.; Guardiola, M.T.; Sneyers, A. Mineralogical and microstructural changes accompanying the interaction of Boom Clay with ordinary Portland cement. Adv. Cem. Res. 2001, 13, 175–183. [Google Scholar] [CrossRef]
  45. Bartier, D.; Techer, I.; Dauzères, A.; Boulvais, P.; Blanc-Valleron, M.-M.; Cabrera, J. In situ investigations and reactive transport modelling of cement paste/argillite interactions in a saturated context and outside an excavated disturbed zone. Appl. Geochem. 2013, 31, 94–108. [Google Scholar] [CrossRef]
  46. Gaboreau, S.; Prèt, D.; Tinseau, E.; Claret, F.; Pellegrine, D.; Stammose, D. 15 Years of in situ cement–argillite interaction from Tournemire URL characterisation of the multi-scale spatial heterogeneities of pore space evolution. Appl. Geochem. 2011, 26, 2159–2171. [Google Scholar] [CrossRef]
  47. Savage, D.; Cloet, V. A Review of Cement-Clay Modelling; Nagra Report NAB 18–24; National Cooperative for the Disposal of Radioactive Waste: Wettingen, Switzerland, 2018. [Google Scholar] [CrossRef]
  48. Xu, T.; Sonnenthal, E.; Spycher, N.; Pruess, K. TOUGHREACT User’s Guide: A Simulation Program for Non-Isothermal Multiphase Reactive Geochemical Transport in Variably Saturated Geologic Media (No. LBNL-55460); Lawrence Berkeley National Lab. (LBNL): Berkeley, CA, USA, 2004. [Google Scholar] [CrossRef] [Green Version]
Figure 1. (a) Schematic (after [14]) and photograph (b) of small flow cell (SFC).
Minerals 11 01026 g001
Figure 2. Details of the experiments, with interval and total times for the sequential experiments with the Horonobe mudstone reacting with OPC leachates and then ground water.
Minerals 11 01026 g002
Figure 3. Geometry of the experimental set-up as represented in CABARET. ‘Container’ represents the fluid reservoir, with the mudstone divided into 10 sections, each 1 mm long and 20 mm in diameter (note: not to scale).
Minerals 11 01026 g003
Figure 4. Major changes in fluid chemistry with time. Horonobe mudstone with ‘young’ OPC, and then the ‘evolved OPC leachate followed by HGW. (a) pH; (b) [Na], [K], [Ca], [SiO2], and [Cl]. Legend text: yOPC—‘young’ OPC leachate; eOPC—‘evolved’ OPC leachate; HGW—Horonobe groundwater. Lines indicate concentrations in reacted samples; single points the original concentration in the reacting fluids.
Minerals 11 01026 g004aMinerals 11 01026 g004b
Figure 5. Summary of mineralogy of Horonobe mudstone with ‘young’ OPC leachate. All SEM photos are secondary electron (SE) images. The white square in the SEM image from Section 2 indicates the area used for SEM-EDS analysis of C(A)–S–H phases (reproduced from [14]).
Minerals 11 01026 g005
Figure 6. Summary of mineralogy of Horonobe mudstone with ‘young’ OPC (Na-K-Ca-OH) and then ‘evolved OPC leachate (Ca(OH)2) (SFC-2). All SEM photos are secondary electron (SE) images. The white square in the SEM images from Section 1 and Section 3 indicate the areas used for SEM-EDS analysis of the secondary phases.
Minerals 11 01026 g006
Figure 7. Summary of mineralogy of Horonobe mudstone with ‘young’ OPC (Na-K-Ca-OH), then ‘evolved OPC leachate (Ca(OH)2), and then HGW (SFC-3). Except where indicated, each section was ~1.5 mm. All SEM photos are secondary electron (SE) images. The white square in the SEM images from Section 1 and Section 2 indicate the areas used for SEM-EDS analysis of the secondary carbonates.
Minerals 11 01026 g007
Figure 8. Selected secondary mineral saturation states in reacted fluids, experiment with ‘young’ OPC (Na-K-Ca-OH), and then the ‘evolved OPC leachate (Ca(OH)2), followed by HGW; all data from SFC-3. Representative C-S-H phases in blue; zeolites in red; and S-bearing cement phases in green.
Minerals 11 01026 g008
Figure 9. Summary of the model predictions compared with the experiment data (a) pH, [Na], and [K]; (b) [Ca], [SiO2], and [Cl]; (c) selected C-S-H saturation indices; (d) zeolite saturation indices.
Minerals 11 01026 g009
Figure 10. Legend for all plots, except porosity; (a) time step (days), selected model data showing variation along the length of SFC with time; (a) porosity, red dashed line indicates initial porosity; (b) total C-S-H present; (c) calcite; (d) albite (as representative of the feldspars); (e) total montmorillonite; and (f) amorphous silica. Time step of 40.2, (d) change from ‘young’ to ‘evolved’ OPC leachate; time step of 80.3, (d) change from ‘‘evolved’ OPC leachate to HGW.
Minerals 11 01026 g010aMinerals 11 01026 g010b
Figure 11. Legend for all plots. Summary of the composition of modelled mineral assemblage: (a) Horonobe mudstone before reaction; (b) after reaction with young for 40 d; (c) after successive reaction with both OPC leachates; and (d) after successive reaction with both OPC leachates and Horonobe groundwater.
Minerals 11 01026 g011
Table 1. Initial concentrations of major ions in the OPC leachates and Horonobe groundwater.
LeachatepH @ 24 °CComponents (mg/L)
‘young’ OPC leachate NaKCaSiO2MgClHCO3
(Na-K-Ca-OH)13.41500730060----
‘evolved’ OPC leachate CaSiO2MgClHCO3
(saturated Ca(OH)2)12.5 800----
Horonobe groundwater NaKCaSiO2MgClHCO3
07-V140-M03
(sampled 22 July 2020)
7.9325807469689729002200
Table 2. Details of the ‘model’ Horonobe mudstone composition and potentially active minerals.
Vol %Formula in Thermodynamic Database (JAEA TDB, [26])
Porosity56.4
SiO2(am)27.5SiO2
Montmor4.18Montmor_Ca Ca0.165(Mg0.33Al1.67)(Si4)O10(OH)2
Montmor_K K0.33(Mg0.33Al1.67)(Si4)O10(OH)2
Montmor_Mg Mg0.165(Mg0.33Al1.67)(Si4)O10(OH)2
Montmor_Na Na0.33(Mg0.33Al1.67)(Si4)O10(OH)2
Quartz4.15SiO2
Illite3.63K0.6(Mg0.25Al1.8)(Al0.5Si3.5)O10(OH)2
Albite1.91NaAlSi3O8
K_Feldspar1.17KAlSi3O8
Anorthite1.09CaAl2Si2O8
Portlandite Ca(OH)2
CSH055
to
CSH165
(CaO)1.65(SiO2)(H2O)2.1167, (CaO)1.55(SiO2)(H2O)2.0167, (CaO)1.45(SiO2)(H2O)1.9167,
(CaO)1.35(SiO2)(H2O)1.8167, (CaO)1.25(SiO2)(H2O)1.7167, (CaO)1.15(SiO2)(H2O)1.6167
(CaO)1.05(SiO2)(H2O)1.5167, (CaO)1.00(SiO2)(H2O)1.4667,(CaO)0.95(SiO2)(H2O)1.4167, (CaO)0.90(SiO2)(H2O)1.3667, (CaO)0.85((SiO2)(H2O)1.3167, (CaO)0.80(SiO2)(H2O)1.248,
(CaO)0.75(SiO2)(H2O)1.17, (CaO)0.65(SiO2)(H2O)1.014, (CaO)0.55(SiO2)(H2O)0.858
Stratlingite_Al (Ca2Al(OH)6)(AlSiO2(OH)4)(H2O)3
Analcime
(Analcite)
NaAlSi2O6(H2O)
Clinoptilolite_alk,
Clinoptilolite_Ca
Clinoptilolite_K
Clinoptilolite_Na
K2.3Na1.7Ca1.4(Al6.8Si29.2O72)(H2O)26
Ca3(Al6Si30O72)(H2O)20
K6(Al6Si30O72)(H2O)20
Na6(Al6Si30O72)(H2O)20
Phillipsite_alk
Phillipsite_Ca
Phillipsite_K
Phillipsite_Na
K1.4Na1.6Ca0.4(Al3.8Si12.2O32)(H2O)12
Ca3(Al6Si10O32)(H2O)12
K6(Al6Si10O32)(H2O)12
Na6(Al6Si10O32)(H2O)12
Brucite Mg(OH)2
MSH06
to
MSH15
(MgO)0.6(SiO2)(H2O)1.08, (MgO)0.7(SiO2)(H2O)1.2, (MgO)0.8(SiO2)(H2O)1.32
(MgO)0.9(SiO2)(H2O)1.44, (MgO)1(SiO2)(H2O)1.56, (MgO)1.1(SiO2)(H2O)1.68
(MgO)1.2(SiO2)(H2O)1.8, (MgO)1.3(SiO2)(H2O)1.92, (MgO)1.4(SiO2)(H2O)2.04
(MgO)1.5(SiO2)(H2O)2.16
Monocarbonate_Al (Ca2Al(OH)6)2(CO3)(H2O)5
Monosulfate_Al (Ca2Al(OH)6)2(SO4)(H2O)8
Magnesite MgCO3
Thaumasite Ca3Si(OH)6(SO4)(CO3)(H2O)12
Calcite Ca(CO3)2
Dolomite CaMg(CO3)2
Gypsum CaSO4(H2O)2
Ettringite_Al Ca6(Al(OH)6)2(SO4)3(H2O)26
Friedel_Salt_Al (Ca2Al(OH)6)2(Cl)2(H2O)4
Kuzel_Salt_Al (Ca2Al(OH)6)2((SO4)0.5Cl)(H2O)6
Publisher’s Note: MDPI stays neutral with regard to jurisdictional claims in published maps and institutional affiliations.

