
Development of a Physical Separation Route for the Concentration of Base Metals from Old Wasted Printed Circuit Boards

 , , and
Abstract
:1. Introduction
2. Materials and Methods
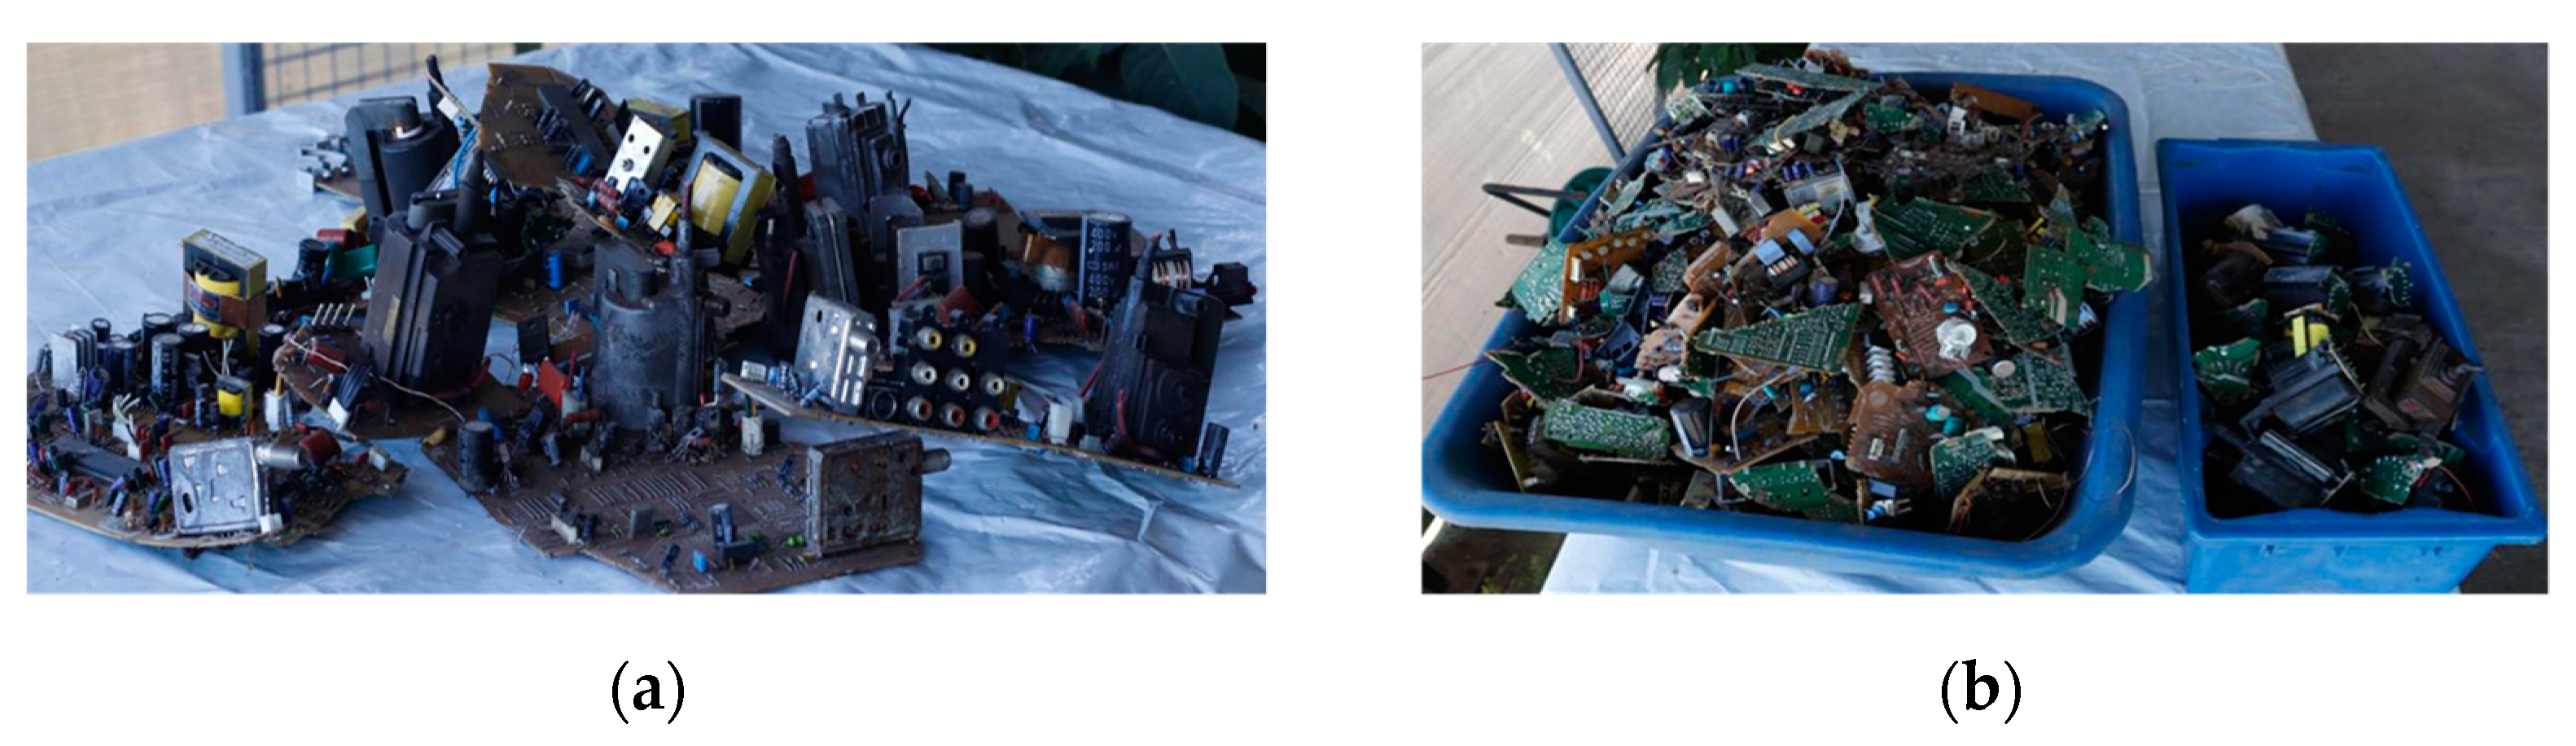
2.1. Materials
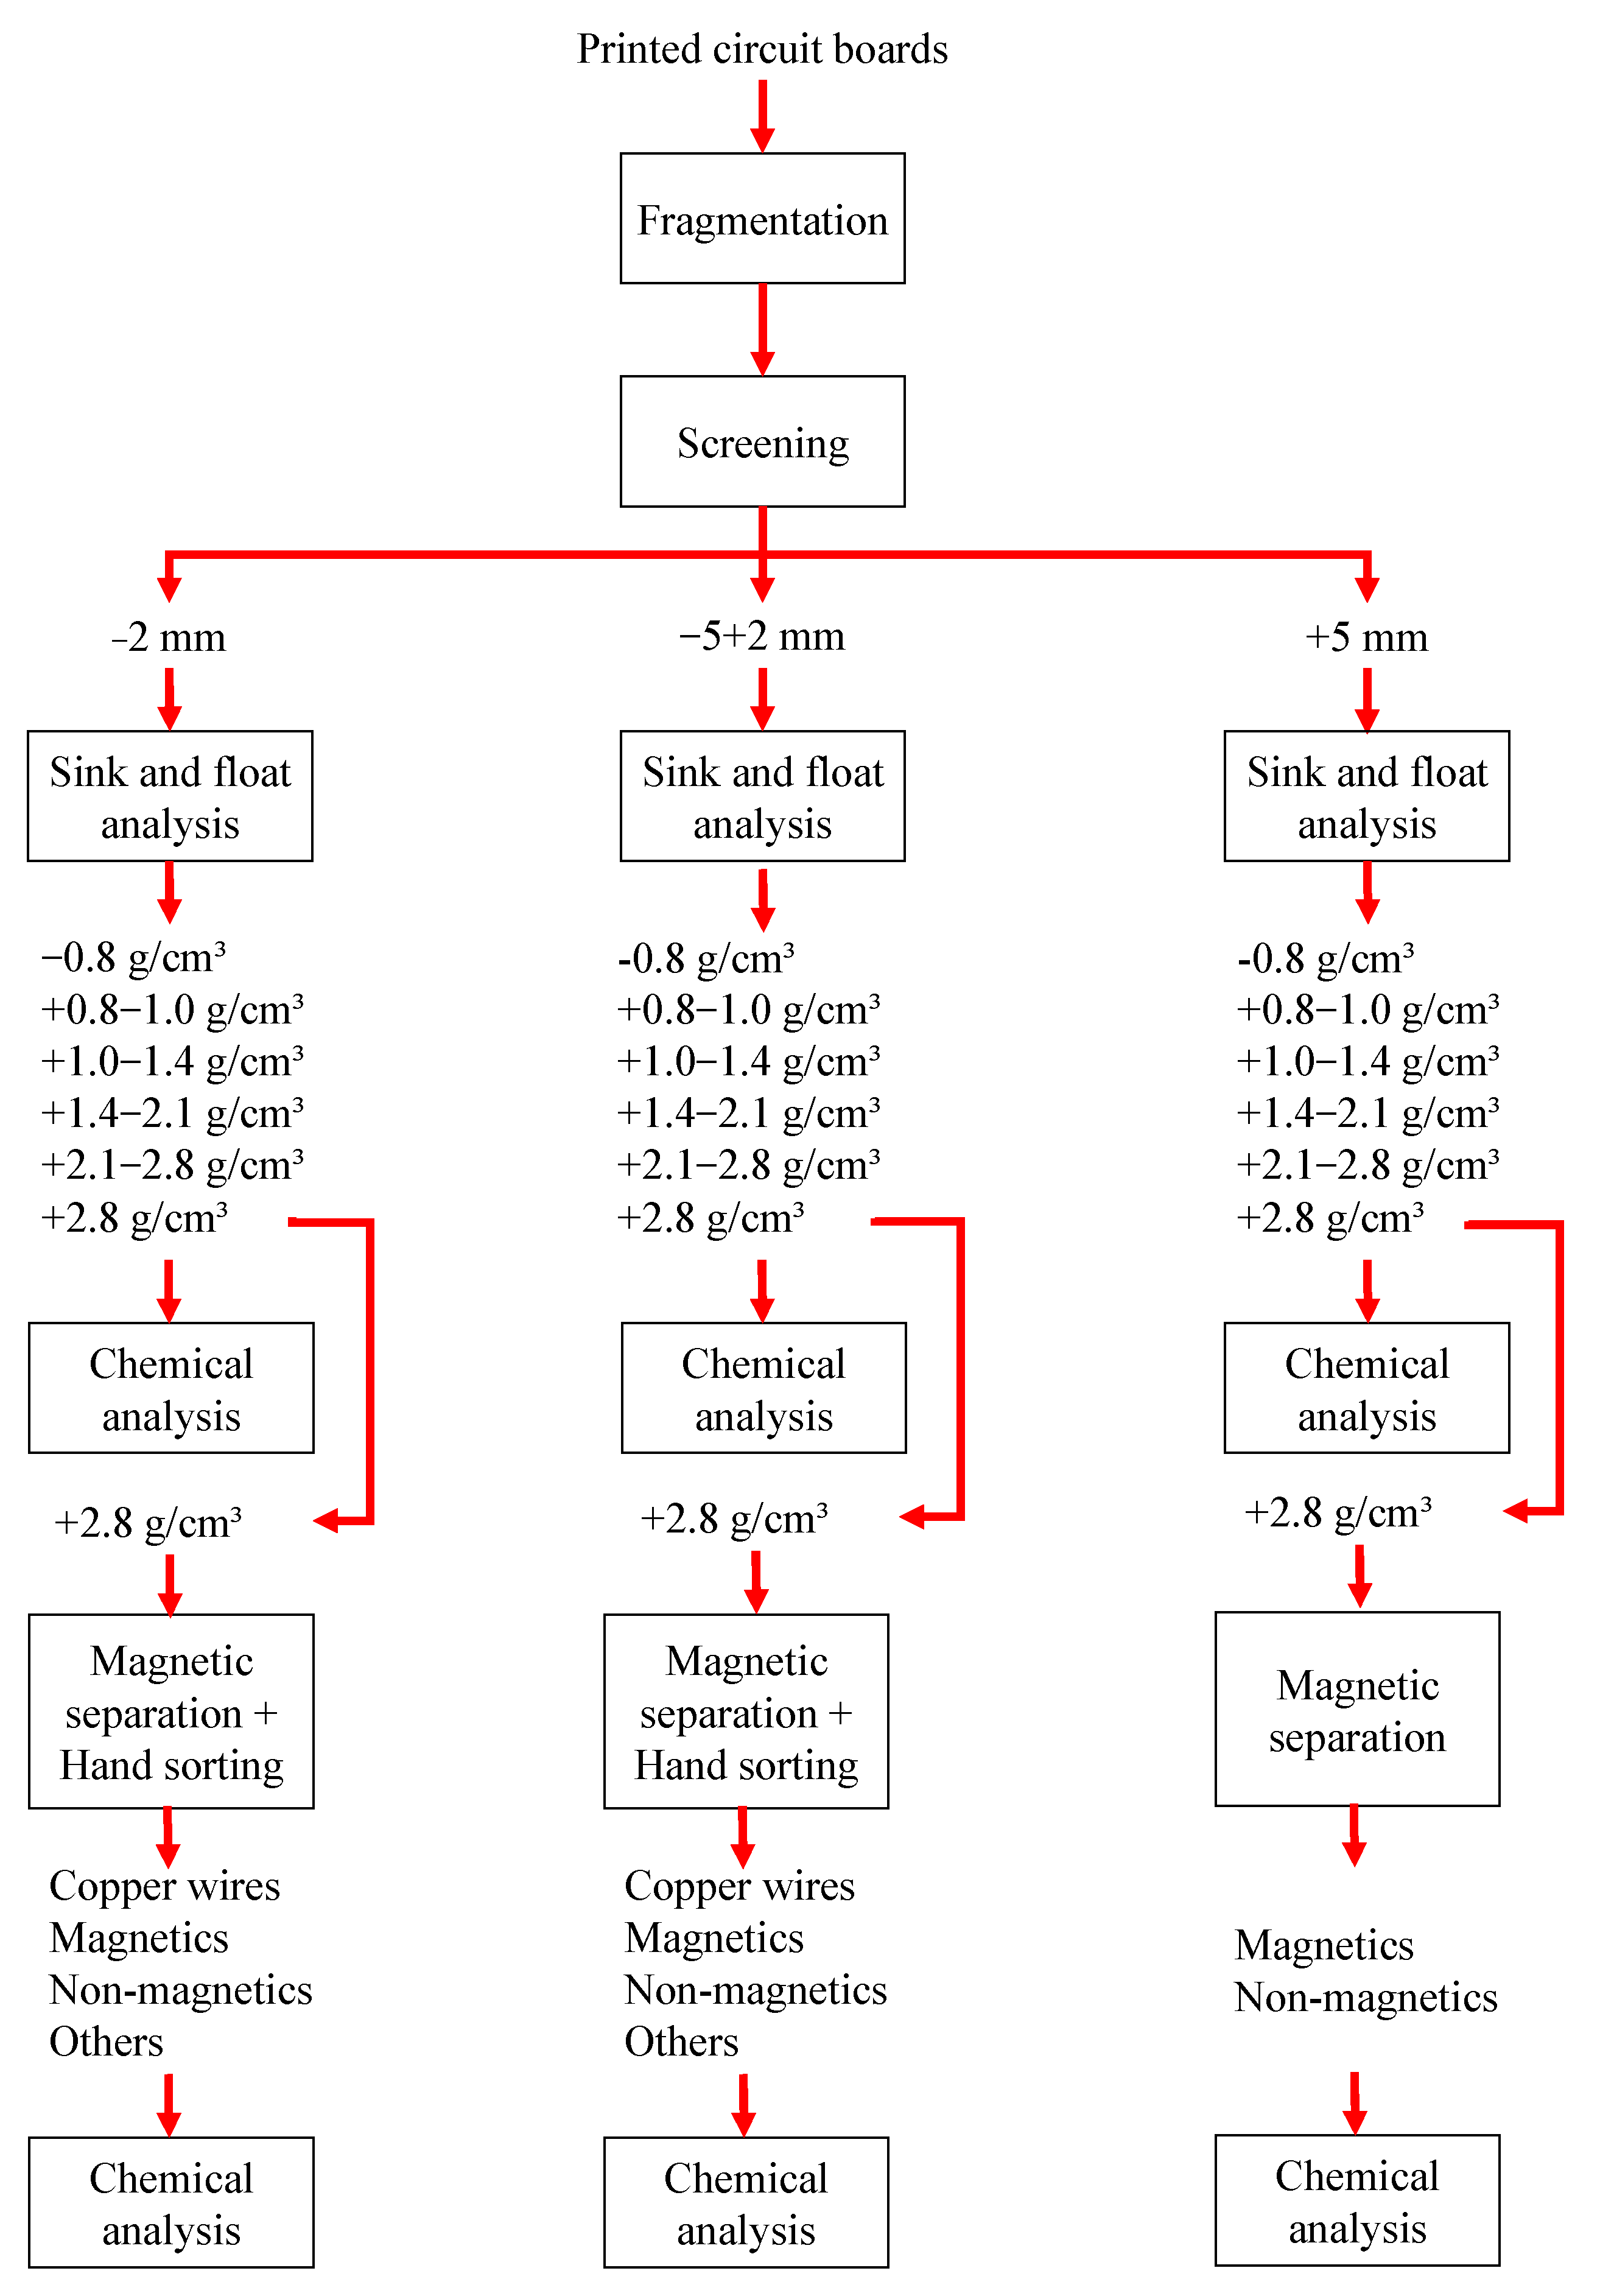
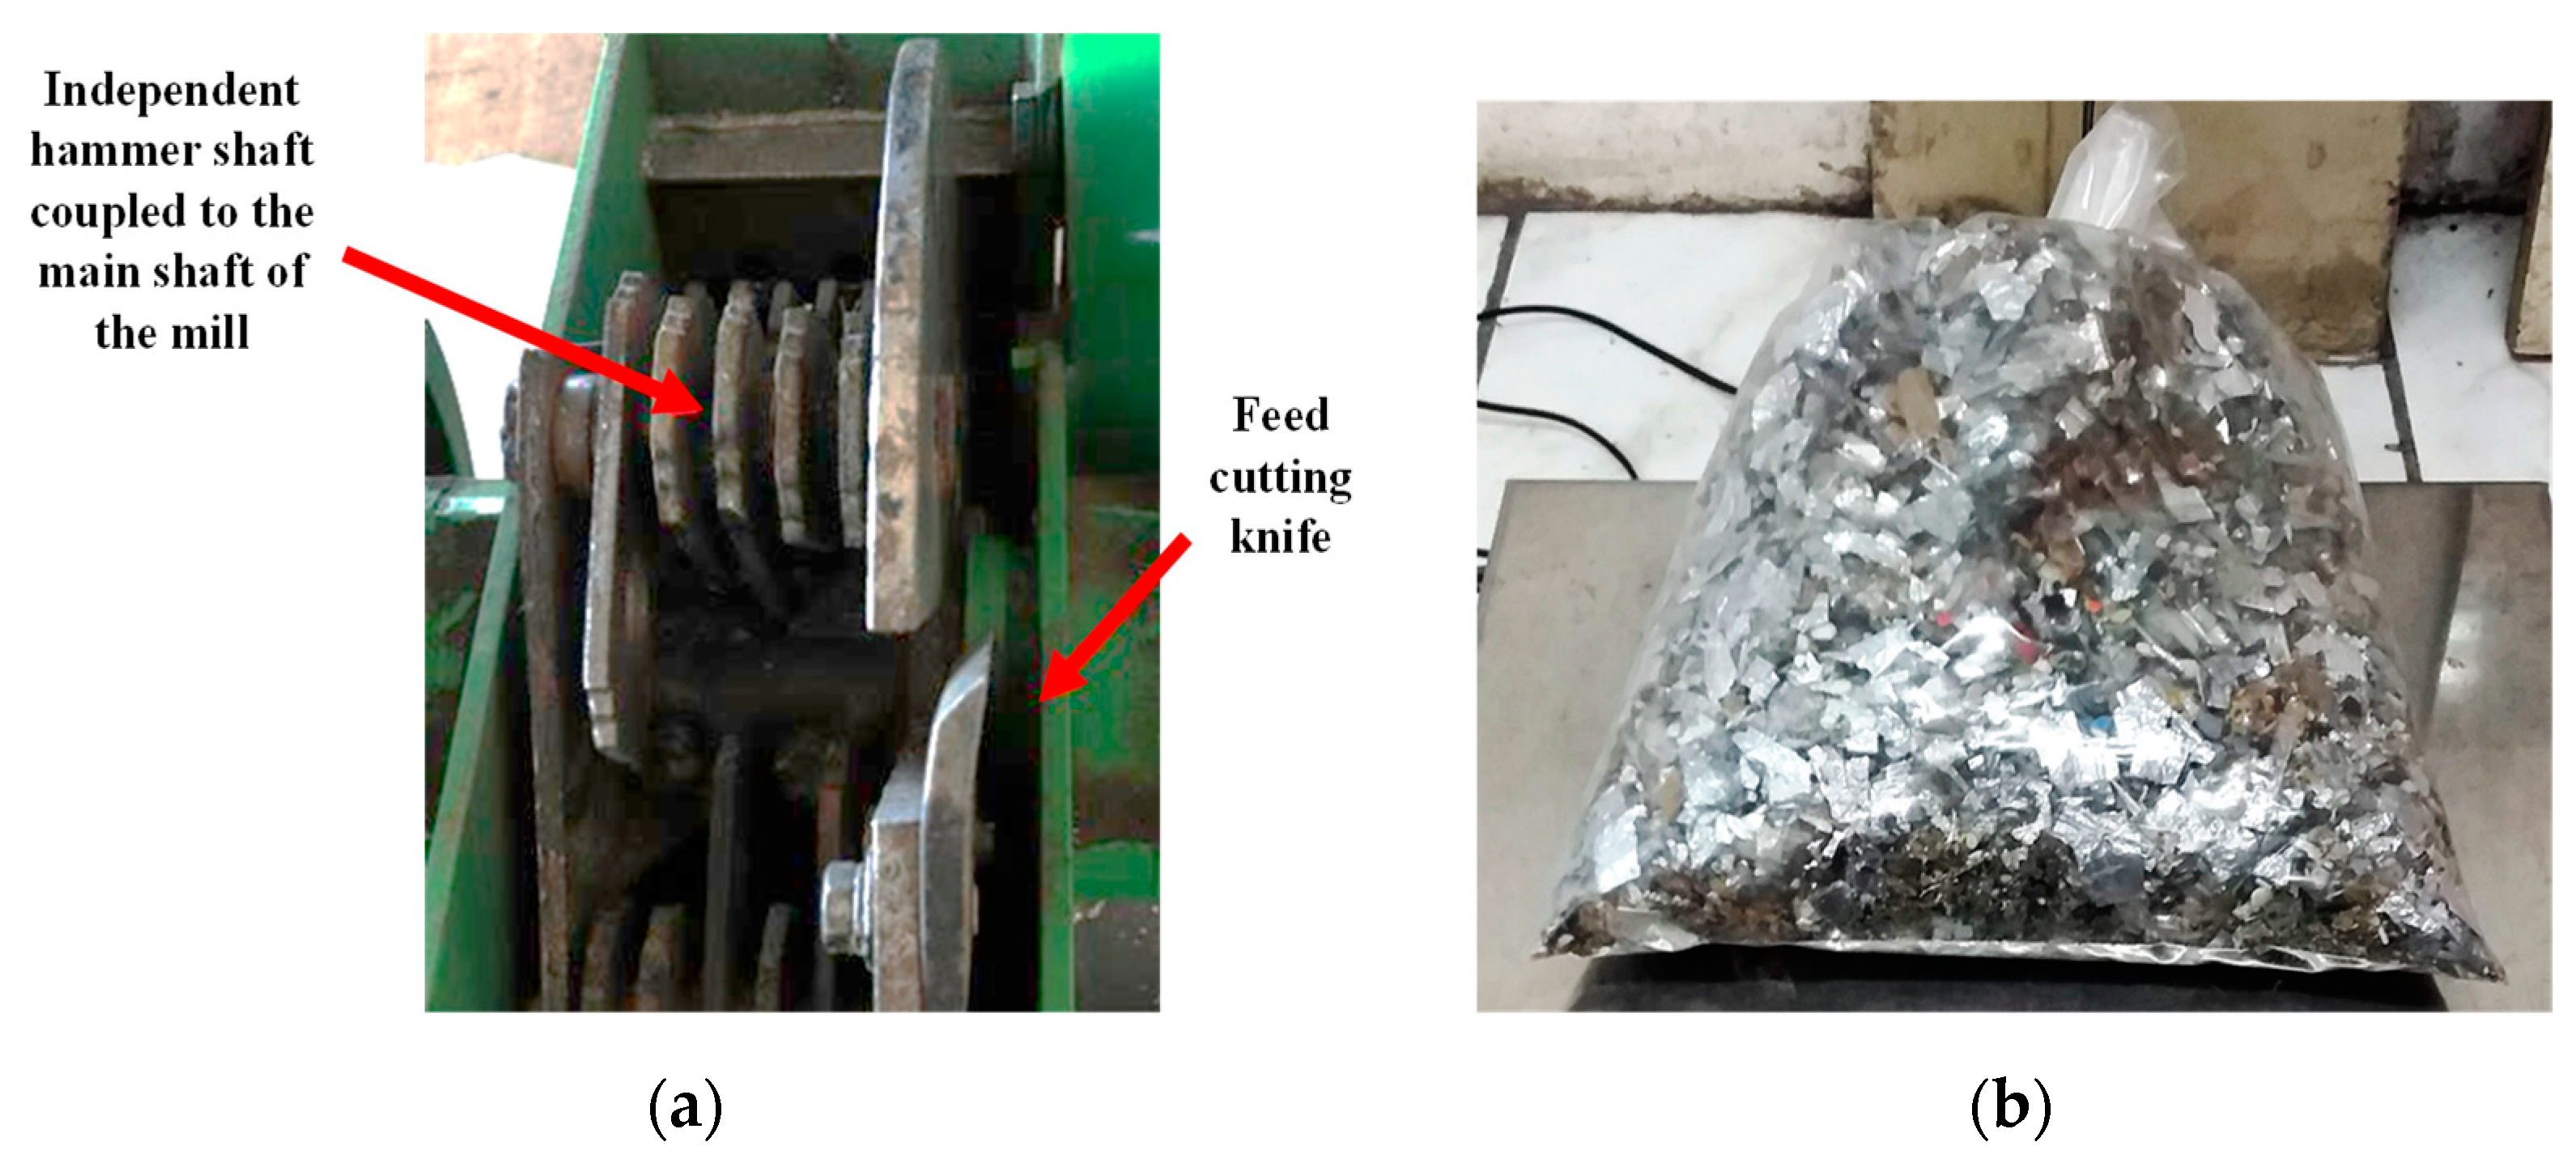
2.2. Samples Preparation
2.3. Chemical Characterization
3. Results
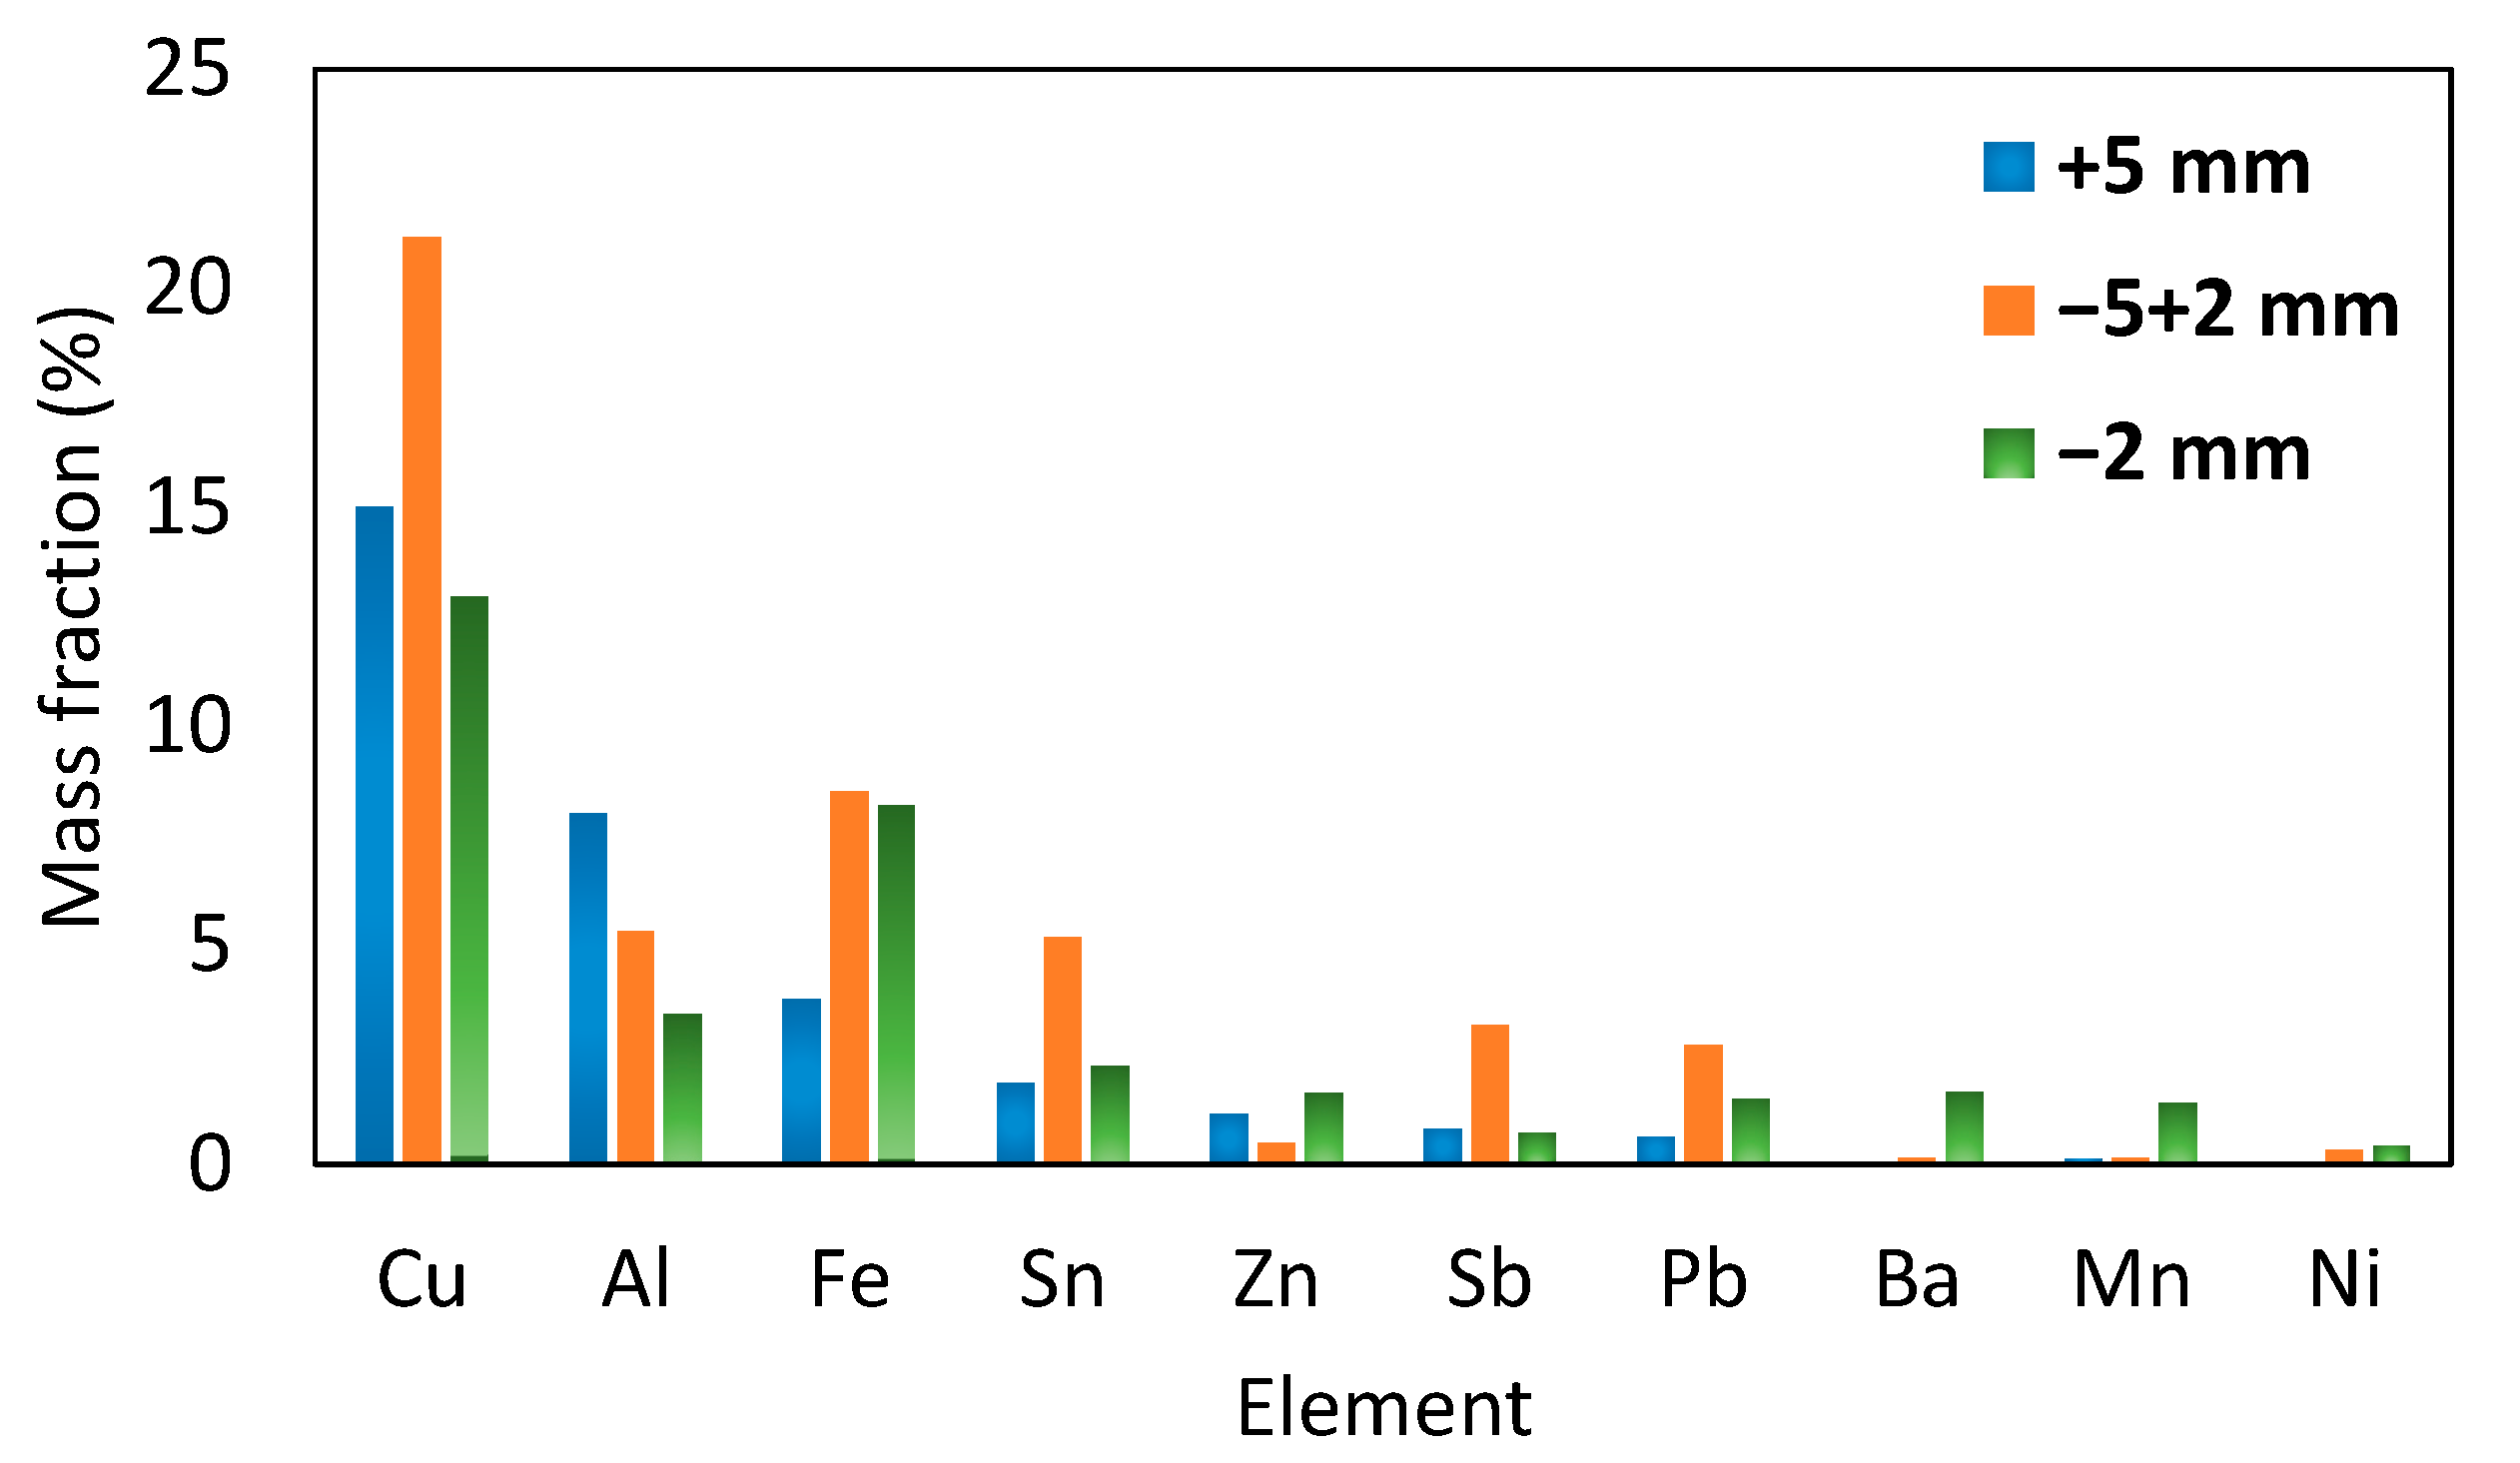
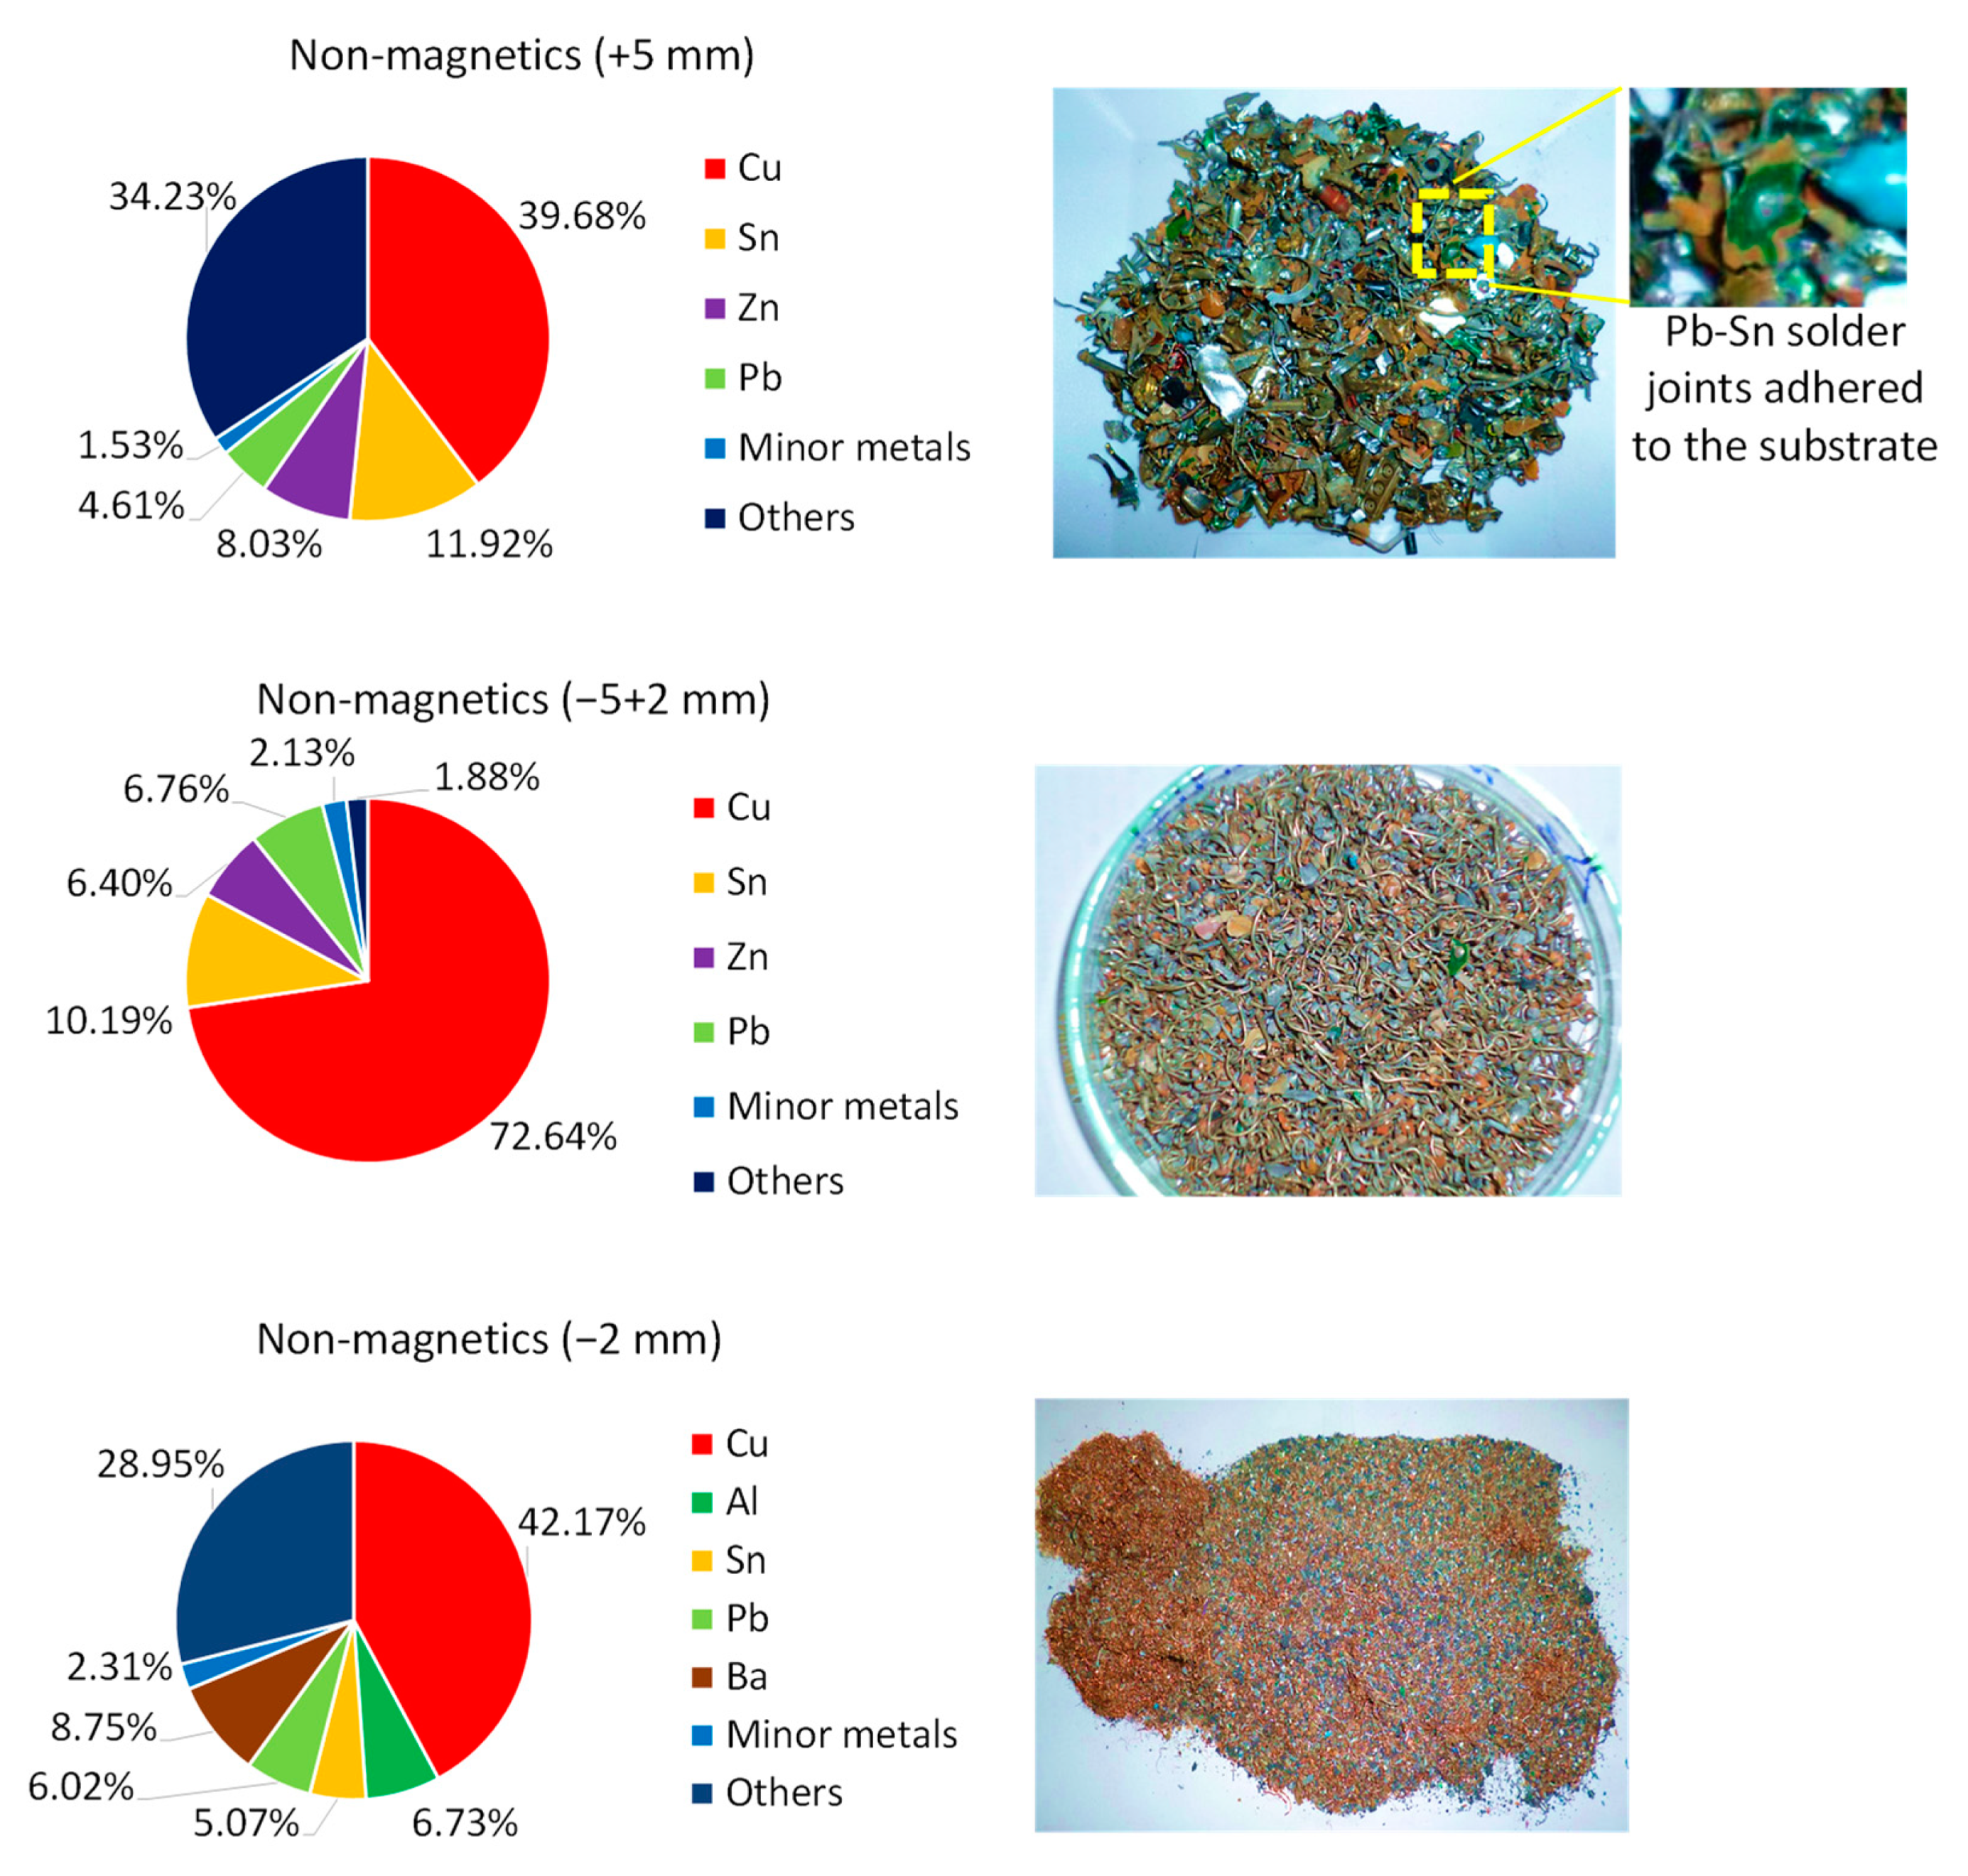
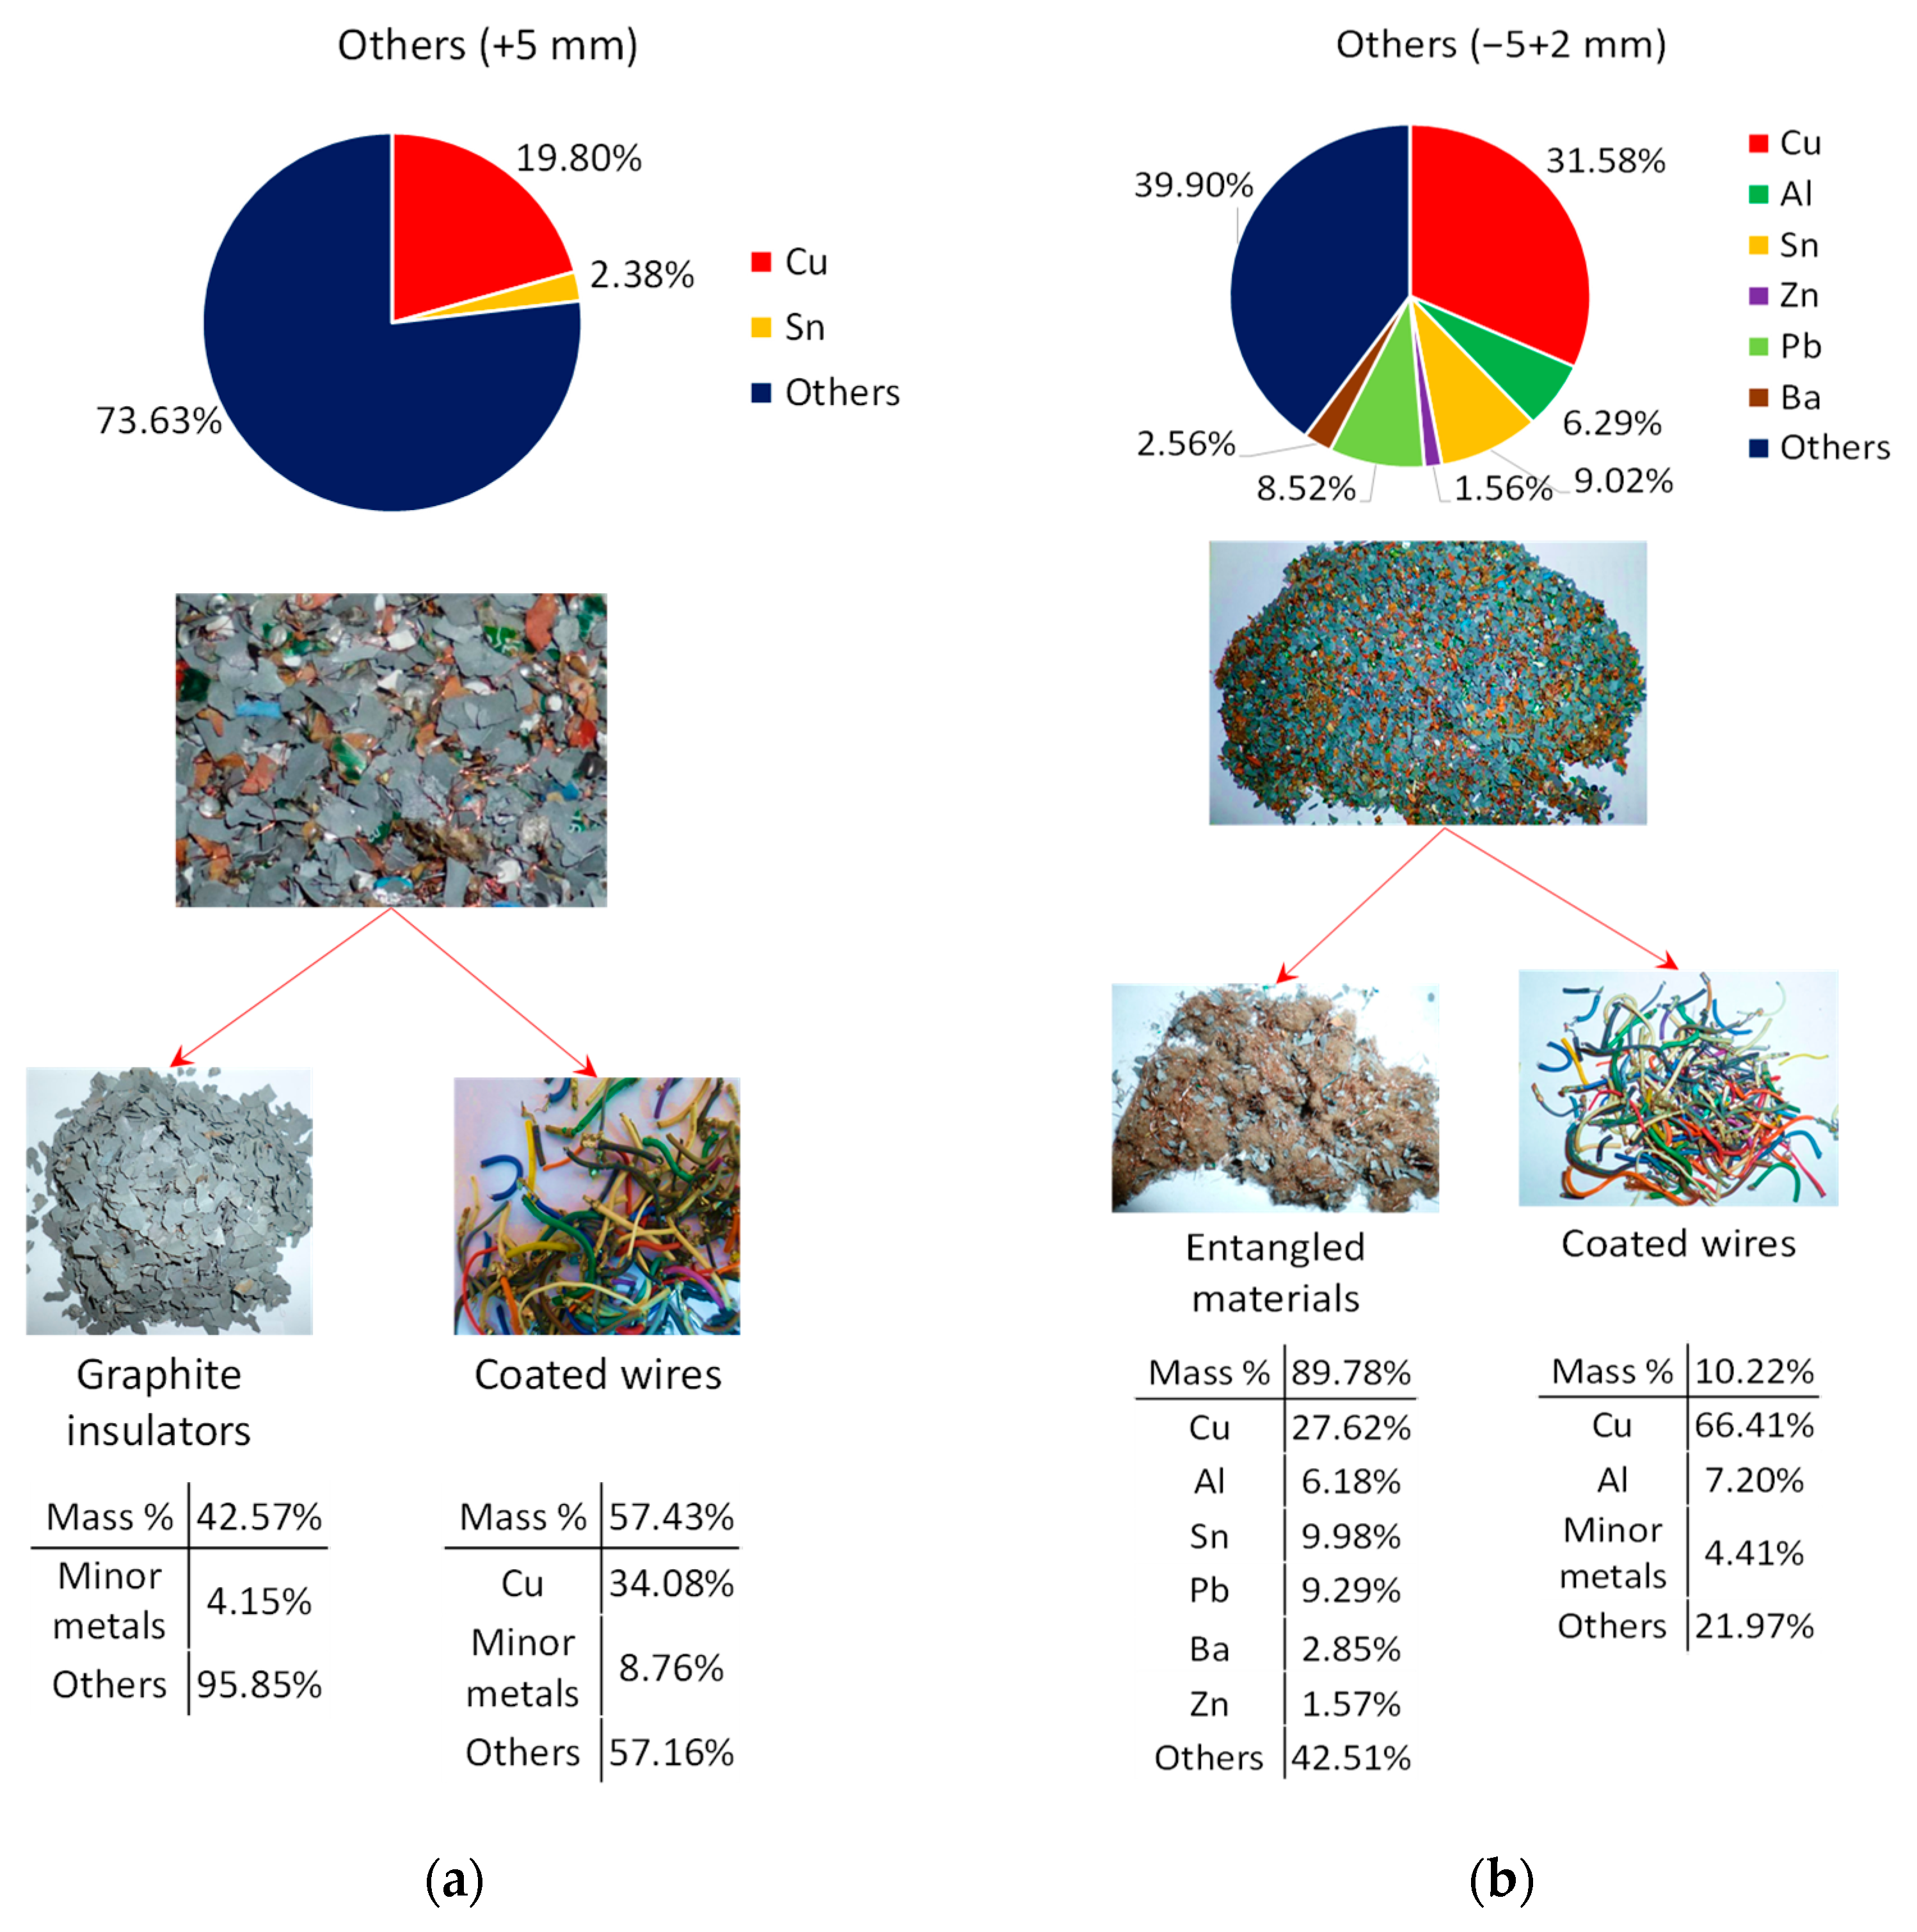
3.1. General Characterization
3.2. Composition Analysis of +2.8 g/cm³ Fraction
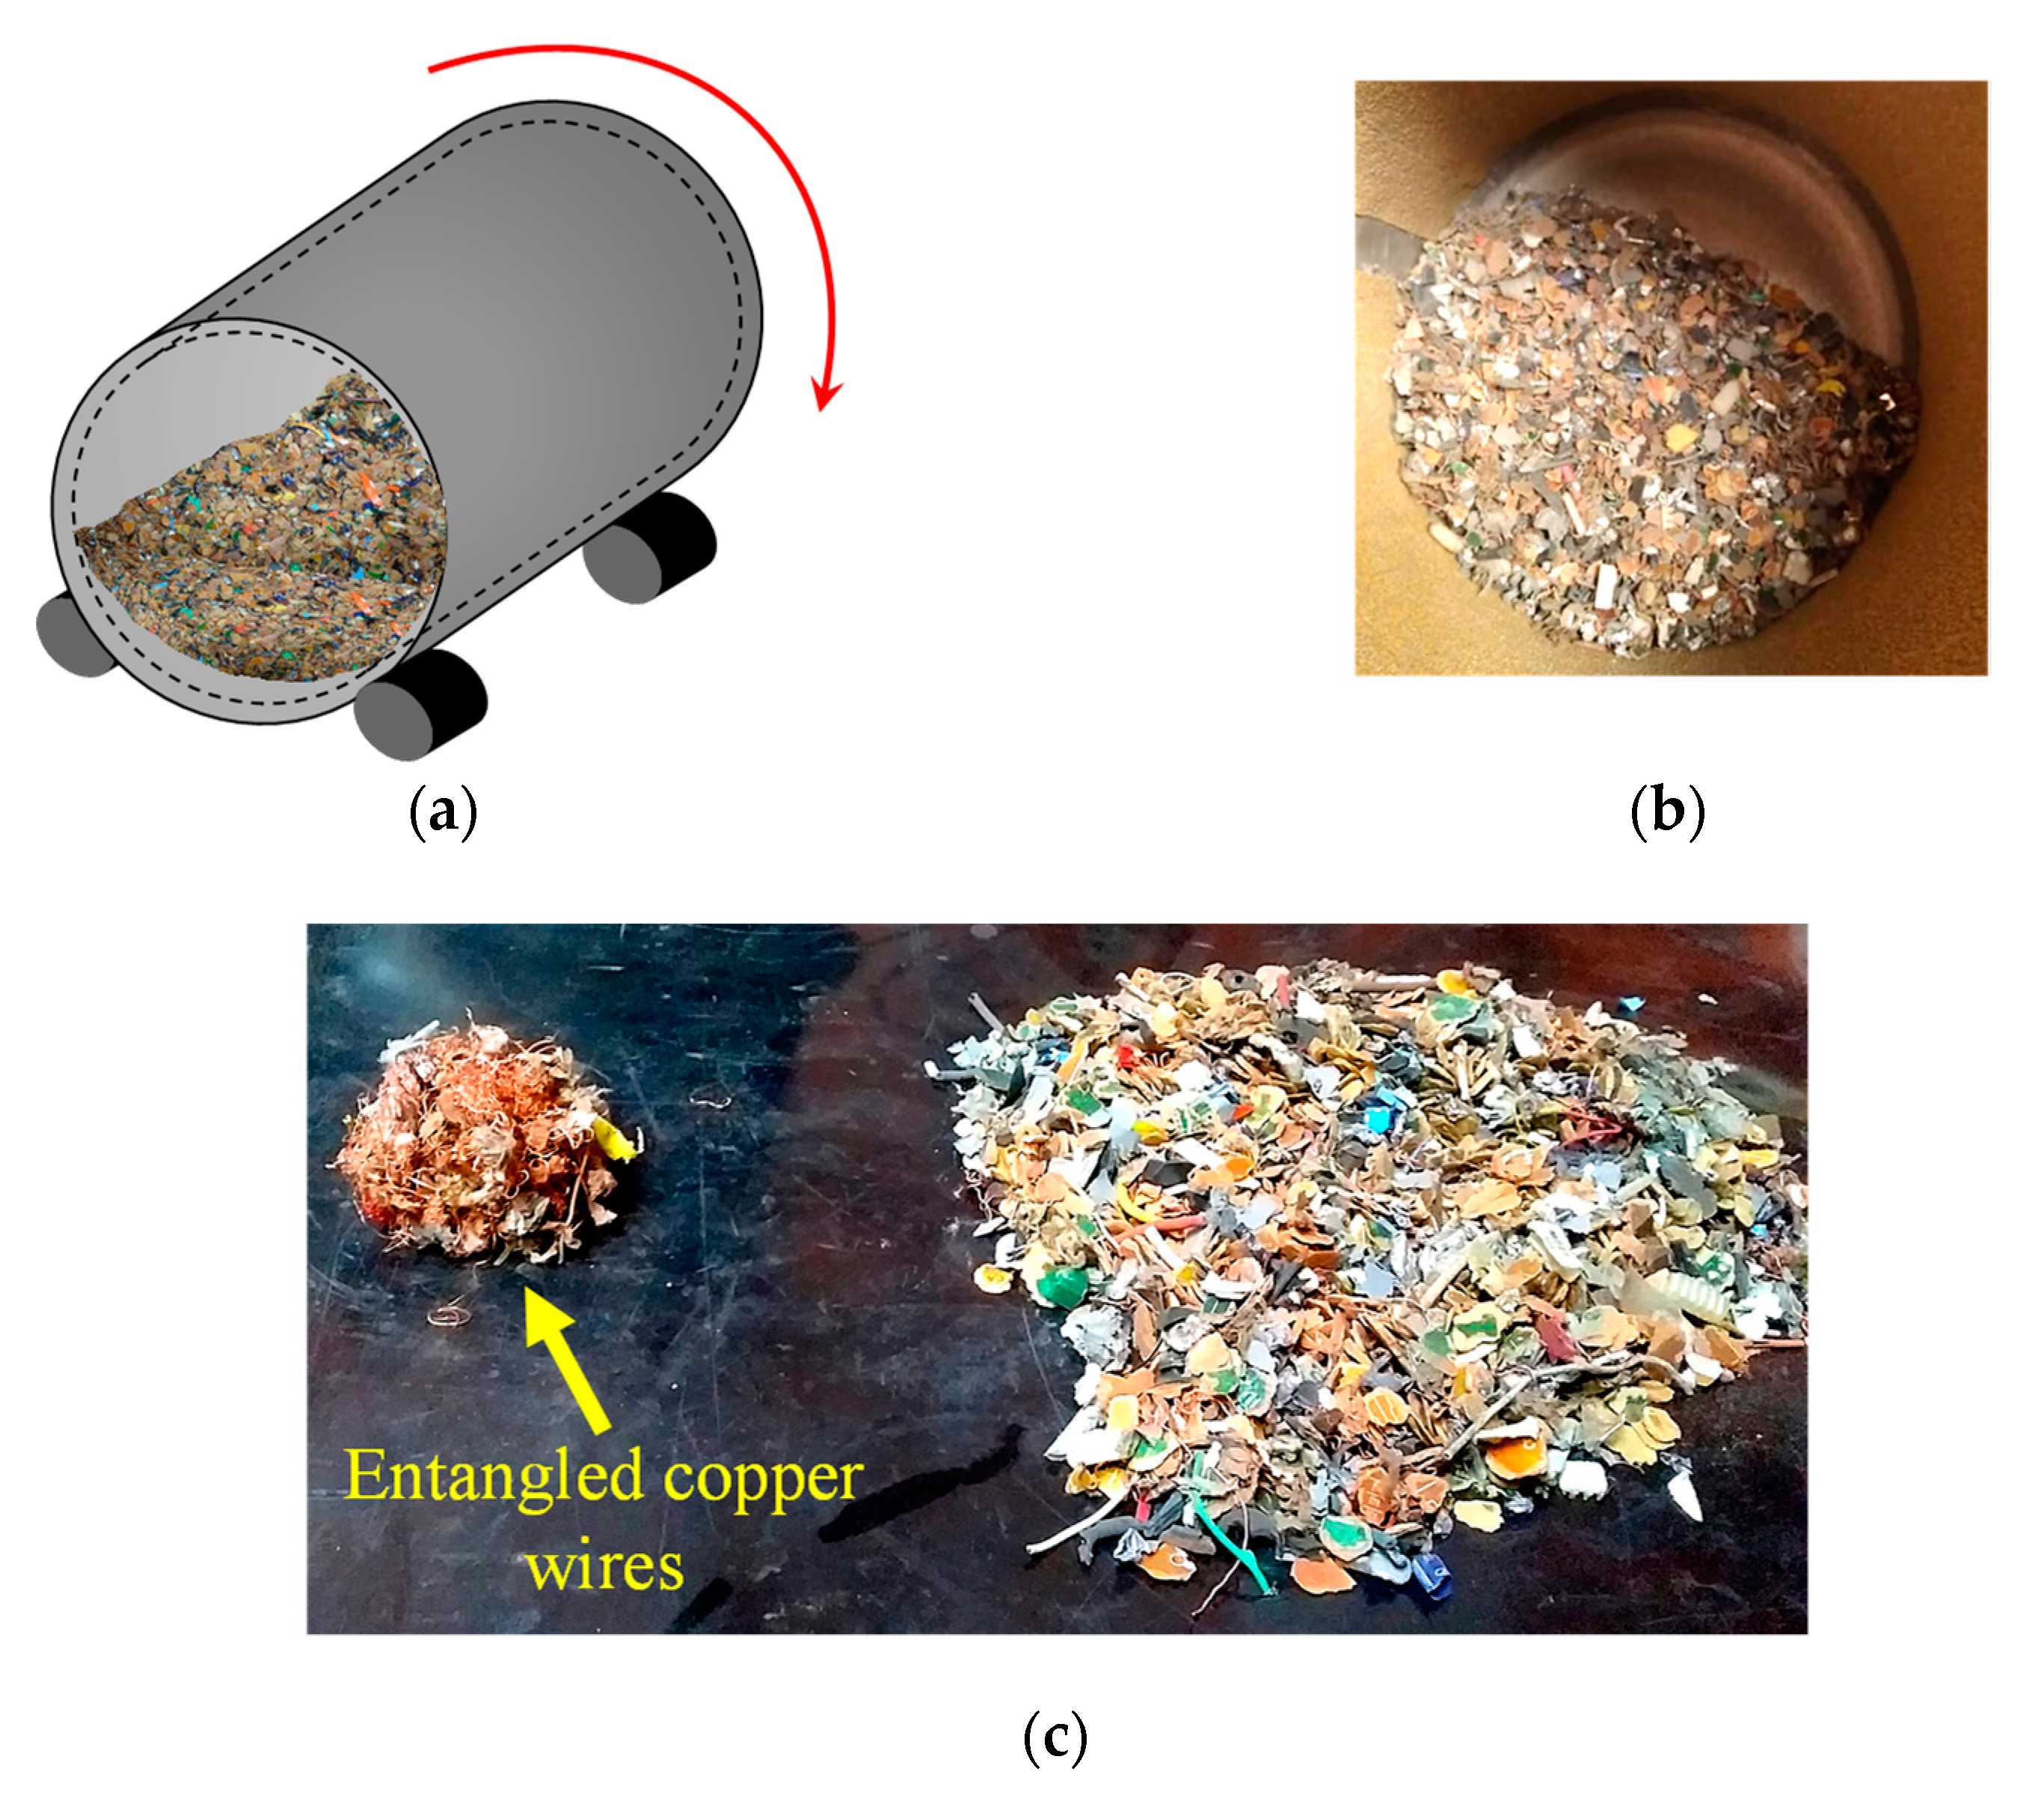
3.3. Induced Entanglement of Copper Wires
4. Discussion
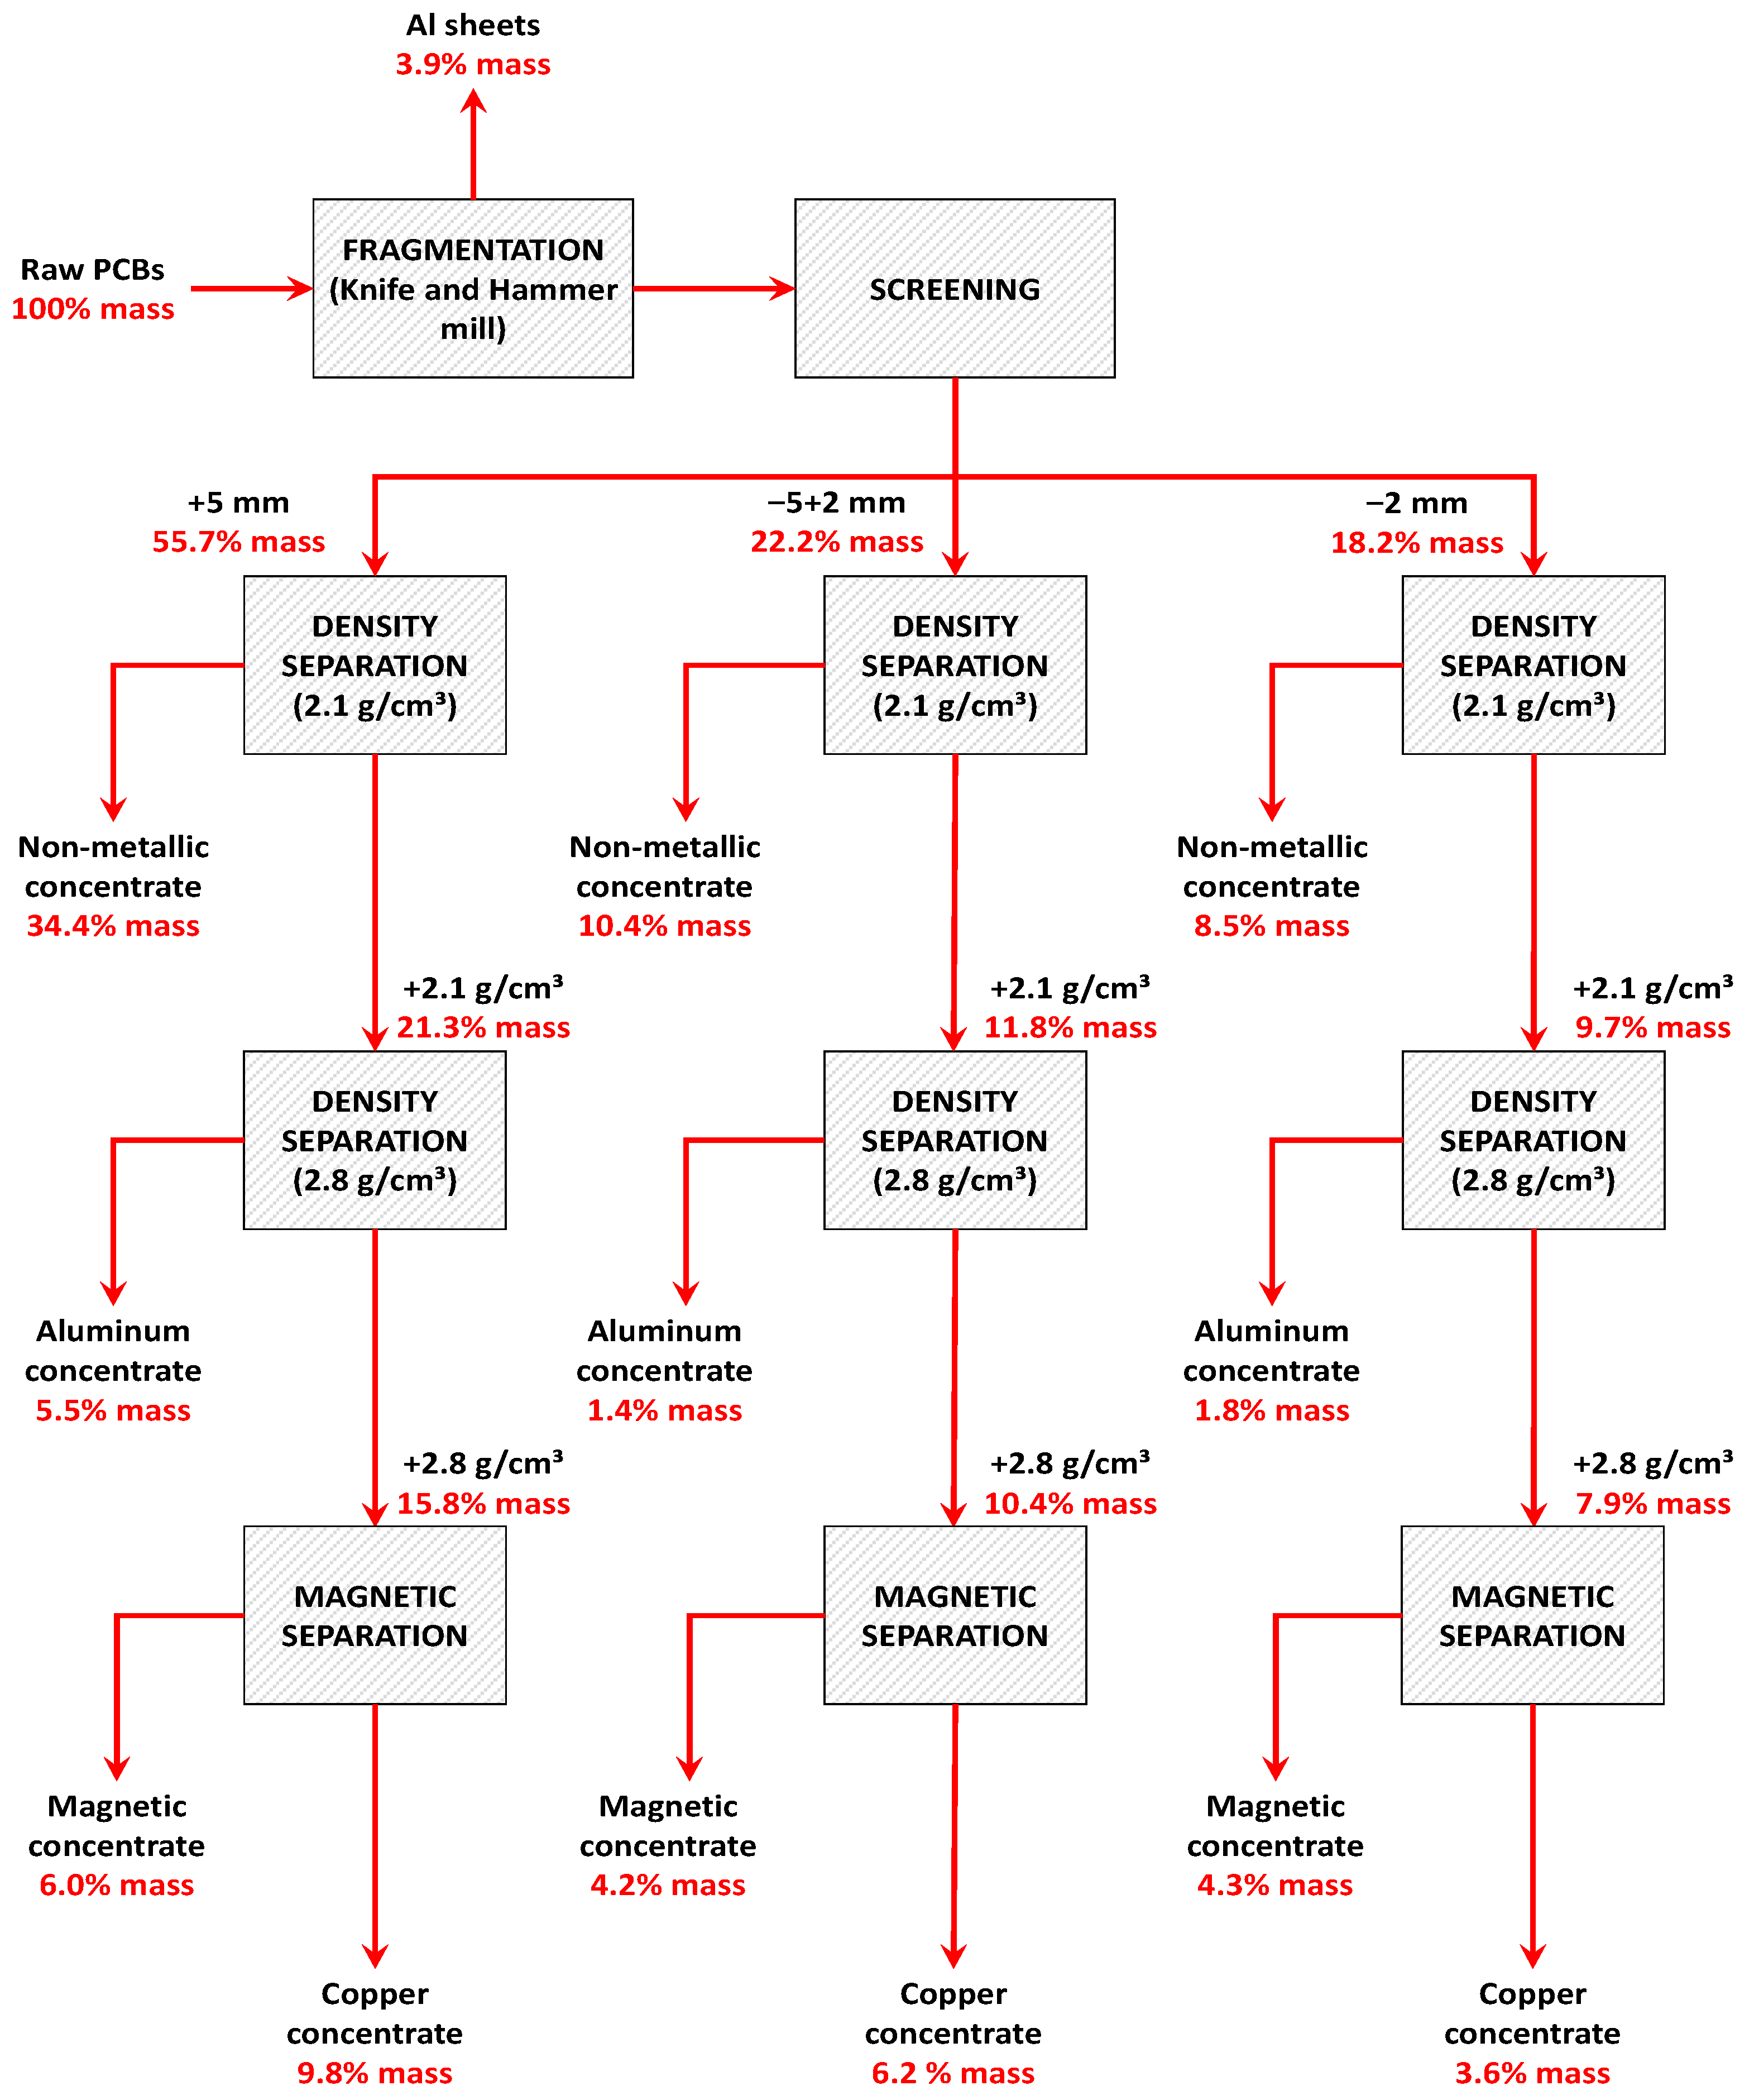
Processing Route
5. Conclusions
Author Contributions
Funding
Conflicts of Interest
References
- Nakamura, T.; Halada, K. Urban Mining Systems; Springer: Berlin/Heidelberg, Germany, 2015. [Google Scholar]
- Cucchiella, F.; D’Adamo, I.; Koh, S.L.; Rosa, P. Recycling of WEEEs: An economic assessment of present and future e-waste streams. Renew. Sustain. Energy Rev. 2015, 51, 263–272. [Google Scholar] [CrossRef] [Green Version]
- Wieszczycka, K.; Tylkowski, B.; Staszak, K. Metals in Wastes; De Gruyter: Berlin, Germany, 2018. [Google Scholar]
- Echegaray, F.; Hansstein, F.V. Assessing the intention-behavior gap in electronic waste recycling: The case of Brazil. J. Clean. Prod. 2017, 142, 180–190. [Google Scholar] [CrossRef]
- Duan, H.; Hou, K.; Li, J.; Zhu, X. Examining the technology acceptance for dismantling of waste printed circuit boards in light of recycling and environmental concerns. J. Environ. Manag. 2011, 92, 392–399. [Google Scholar] [CrossRef] [PubMed]
- Kaya, M. Recovery of metals and nonmetals from electronic waste by physical and chemical recycling processes. Waste Manag. 2016, 57, 64–90. [Google Scholar] [CrossRef]
- Montero, R.; Guevara, A.; dela Torre, E. Recovery of gold, silver, copper and niobium from printed circuit boards using leaching column technique. J. Earth Sci. Eng. 2012, 2, 590. [Google Scholar]
- Cui, J.; Forssberg, E. Mechanical recycling of waste electric and electronic equipment: A review. J. Hazard. Mater. 2003, 99, 243–263. [Google Scholar] [CrossRef]
- Hao, J.; Wang, Y.; Wu, Y.; Guo, F. Metal recovery from waste printed circuit boards: A review for current status and perspectives. Resour. Conserv. Recycl. 2020, 157, 104787. [Google Scholar] [CrossRef]
- Nithya, R.; Sivasankari, C.; Thirunavukkarasu, A. Electronic waste generation, regulation and metal recovery: A review. Environ. Chem. Lett. 2020, 19, 1347–1368. [Google Scholar] [CrossRef]
- Aurubis. Recycling Technology. Available online: https://www.aurubis.com/en/products--services/recycling/technology (accessed on 19 July 2021).
- Glencore. Recycling Operations. Available online: https://www.glencore.com/what-we-do/recycling/operations (accessed on 19 July 2021).
- Umicore. Recycling Process. Available online: https://pmr.umicore.com/en/about-us/process/ (accessed on 19 July 2021).
- Huang, Y.-F.; Pan, M.-W.; Lo, S.-L. Hydrometallurgical metal recovery from waste printed circuit boards pretreated by microwave pyrolysis. Resour. Conserv. Recycl. 2020, 163, 105090. [Google Scholar] [CrossRef]
- Wang, J.; Huang, Z.; Yang, D.; Zeng, X.; Chen, M.; Shu, J.; Sun, Z.; Sun, S.; Xiao, Z. A semi-scaled experiment for metals separating and recovering from waste printed circuit boards by slurry electrolysis. Process. Saf. Environ. Prot. 2021, 147, 37–44. [Google Scholar] [CrossRef]
- Qiu, R.; Lin, M.; Ruan, J.; Fu, Y.; Hu, J.; Deng, M.; Tang, Y.; Qiu, R. Recovering full metallic resources from waste printed circuit boards: A refined review. J. Clean. Prod. 2020, 244, 118690. [Google Scholar] [CrossRef]
- Srivastava, R.R.; Ilyas, S.; Kim, H.; Choi, S.; Trinh, H.B.; Ghauri, M.A.; Ilyas, N. Biotechnological recycling of critical metals from waste printed circuit boards. J. Chem. Technol. Biotechnol. 2020, 95, 2796–2810. [Google Scholar] [CrossRef]
- Dey, S.K.; Ari, V.; Das, A. Processing of electronic waste in a counter current teeter-bed separator. J. Environ. Manag. 2012, 107, 45–51. [Google Scholar] [CrossRef] [PubMed]
- Meng, L.; Gao, J.; Zhong, Y.; Wang, Z.; Chen, K.; Guo, Z. Supergravity separation for recovering Pb and Sn from electronic waste. Sep. Purif. Technol. 2018, 191, 375–383. [Google Scholar] [CrossRef]
- Phengsaart, T.; Ito, M.; Hamaya, N.; Tabelin, C.B.; Hiroyoshi, N. Improvement of jig efficiency by shape separation, and a novel method to estimate the separation efficiency of metal wires in crushed electronic wastes using bending behavior and “entanglement factor”. Miner. Eng. 2018, 129, 54–62. [Google Scholar] [CrossRef]
- Dias, P.; Schmidt, L.; Gomes, L.B.; Bettanin, A.; Veit, H.; Bernardes, A.M. Recycling waste crystalline silicon photovoltaic modules by electrostatic separation. J. Sustain. Metall. 2018, 4, 176–186. [Google Scholar] [CrossRef]
- Xue, M.; Yan, G.; Li, J.; Xu, Z. Electrostatic separation for recycling conductors, semiconductors, and nonconductors from electronic waste. Environ. Sci. Technol. 2012, 46, 10556–10563. [Google Scholar] [CrossRef]
- Jeon, S.; Ito, M.; Tabelin, C.B.; Pongsumrankul, R.; Tanaka, S.; Kitajima, N.; Saito, A.; Park, I.; Hiroyoshi, N. A physical separation scheme to improve ammonium thiosulfate leaching of gold by separation of base metals in crushed mobile phones. Miner. Eng. 2019, 138, 168–177. [Google Scholar] [CrossRef]
- Zhu, X.-N.; Nie, C.-C.; Zhang, H.; Lyu, X.-J.; Qiu, J.; Li, L. Recovery of metals in waste printed circuit boards by flotation technology with soap collector prepared by waste oil through saponification. Waste Manag. 2019, 89, 21–26. [Google Scholar] [CrossRef]
- Zhu, X.-N.; Zhang, Y.-K.; Zhang, Y.-Q.; Yan, Z.-Q.; Nie, C.-C.; Lyu, X.-J.; Tao, Y.-J.; Qiu, J.; Li, L. Flotation dynamics of metal and non-metal components in waste printed circuit boards. J. Hazard. Mater. 2020, 392, 122322. [Google Scholar] [CrossRef]
- Hsu, E.; Barmak, K.; West, A.C.; Park, A.-H.A. Advancements in the treatment and processing of electronic waste with sustainability: A review of metal extraction and recovery technologies. Green Chem. 2019, 21, 919–936. [Google Scholar] [CrossRef]
- Perkins, D.N.; Drisse, M.-N.B.; Nxele, T.; Sly, P.D. E-waste: A global hazard. Ann. Glob. Health 2014, 80, 286–295. [Google Scholar] [CrossRef]
- Zhu, X.-N.; Nie, C.-C.; Wang, S.-S.; Xie, Y.; Zhang, H.; Lyu, X.-J.; Qiu, J.; Li, L. Cleaner approach to the recycling of metals in waste printed circuit boards by magnetic and gravity separation. J. Clean. Prod. 2020, 248, 119235. [Google Scholar] [CrossRef]
- Speight, J.G. Handbook of Coal Analysis; John Wiley & Sons: Hoboken, NJ, USA, 2015. [Google Scholar]
- Wills, B.A.; Finch, J. Wills’ Mineral Processing Technology: An Introduction to the Practical Aspects of Ore Treatment and Mineral Recovery; Butterworth-Heinemann: Burlington, MA, USA, 2015. [Google Scholar]
- Mitra, S. Sample Preparation Techniques in Analytical Chemistry; John Wiley & Sons: Hoboken, NJ, USA, 2004; Volume 237. [Google Scholar]
- de Buzin, P.J.W.K.; Heck, N.C. Electrolytic recovery of tin from electronic component industrial waste. In Proceedings of the 67th ABM International Congress, Rio de Janeiro, Brazil, 31 July–3 August 2012. [Google Scholar]
- Vergés, M.A.; Martinez, M.; Matijevié, E. Synthesis and characterization of zinc ferrite particles prepared by hydrothermal decomposition of zinc chelate solutions. J. Mater. Res. 1993, 8, 2916–2920. [Google Scholar] [CrossRef]
- Kresse, R.; Baudis, U.; Jäger, P.; Riechers, H.H.; Wagner, H.; Winkler, J.; Wolf, H.U. Barium and barium compounds. Ullmann’s Encycl. Ind. Chem. 2000. [Google Scholar] [CrossRef] [Green Version]
- Oskarsson, A.B. Handbook on the Toxicology of Metals; Elsevier: Amsterdam, The Netherlands, 2015; pp. 625–634. [Google Scholar]
- Phengsaart, T.; Ito, M.; Azuma, A.; Tabelin, C.B.; Hiroyoshi, N. Jig separation of crushed plastics: The effects of particle geometry on separation efficiency. J. Mater. Cycles Waste Manag. 2020, 22, 787–800. [Google Scholar] [CrossRef]
- Phengsaart, T.; Ito, M.; Kimura, S.; Azuma, A.; Hori, K.; Tanno, H.; Jeon, S.; Park, I.; Tabelin, C.B.; Hiroyoshi, N. Development of a restraining wall and screw-extractor discharge system for continuous jig separation of mixed plastics. Miner. Eng. 2021, 168, 106918. [Google Scholar] [CrossRef]
- Devasahayam, S.; Raju, G.B.; Hussain, C.M. Utilization and recycling of end of life plastics for sustainable and clean industrial processes including the iron and steel industry. Mater. Sci. Energy Technol. 2019, 2, 634–646. [Google Scholar] [CrossRef]
- Schlesinger, M.E. Aluminum Recycling; CRC press: Boca Raton, FL, USA, 2006. [Google Scholar]
- Dutta, S.K.; Lodhari, D.R. Extraction of Nuclear and Non-Ferrous Metals; Springer: Berlin/Heidelberg, Germany, 2018. [Google Scholar]
- Vignes, A. Extractive Metallurgy 2: Metallurgical Reaction Processes; John Wiley & Sons: Hoboken, NJ, USA, 2013. [Google Scholar]


| Size/Class | Mass (g) | Mass (%) |
|---|---|---|
| +5 mm | 9428 | 55.7% |
| −5 + 2 mm | 3760 | 22.2% |
| −2 mm | 3078 | 18.2% |
| Thin Al sheets | 652 | 3.9% |
| Σ | 16,918 | 100% |
| Size/Class | Material Class (Mass%) | |||
|---|---|---|---|---|
| Copper Wires | Magnetics | Non-Magnetics | Residues | |
| +5 mm | 22.50% | 37.90% | 29.50% | 10.10% |
| −5 + 2 mm | 9.60% | 40.30% | 22.70% | 27.40% |
| −2 mm | - | 45.70% | 54.30% | - |
| Mass% | Drumming Time (min) | |||
|---|---|---|---|---|
| 15 | 30 | |||
| Test 1 | Test 2 | Test 1 | Test 2 | |
| Yield | 0.80% | 0.74% | 0.89% | 0.97% |
| Cu recovery | 5.08% | 4.69% | 5.65% | 6.15% |
| +5 mm | |||||||
|---|---|---|---|---|---|---|---|
| Stream | Cu | Al | Fe | Sn | Zn | Pb | Bal |
| Feed | 15.00 | 8.00 | 3.77 | 1.86 | 1.14 | 0.63 | 69.60 |
| Non-metallic | 3.49 | 3.71 | 0.32 | 0.94 | 0.00 | 0.00 | 91.54 |
| Aluminum | 14.47 | 54.72 | 1.91 | 1.26 | 1.01 | 0.91 | 25.72 |
| Magnetic | 9.15 | 2.06 | 32.27 | 3.53 | 0.92 | 0.85 | 51.22 |
| Copper | 59.39 | 0.32 | 0.00 | 4.41 | 5.35 | 2.53 | 28.00 |
| −5 + 2 mm | |||||||
| Stream | Cu | Al | Fe | Sn | Zn | Pb | Bal |
| Feed | 21.16 | 5.31 | 8.51 | 5.19 | 0.48 | 2.72 | 56.64 |
| Non-metallic | 3.05 | 2.90 | 0.46 | 0.99 | 0.02 | 0.11 | 92.47 |
| Aluminum | 9.05 | 42.08 | 1.52 | 2.02 | 0.16 | 1.44 | 43.72 |
| Magnetic | 16.43 | 1.23 | 43.47 | 5.53 | 2.45 | 3.55 | 27.36 |
| Copper | 57.75 | 3.54 | 0.13 | 12.77 | 0.00 | 6.85 | 18.97 |
| −2 mm | |||||||
| Stream | Cu | Al | Fe | Sn | Zn | Pb | Bal |
| Feed | 12.96 | 3.42 | 8.18 | 2.24 | 1.62 | 1.49 | 70.10 |
| Non-metallic | 3.87 | 2.27 | 1.26 | 1.63 | 0.28 | 0.35 | 90.34 |
| Aluminum | 3.29 | 9.87 | 0.58 | 0.70 | 0.14 | 0.19 | 85.23 |
| Magnetic | 2.58 | 0.44 | 31.88 | 0.00 | 5.57 | 0.30 | 59.22 |
| Copper | 51.97 | 6.43 | 0.44 | 7.12 | 0.91 | 6.29 | 26.83 |
| Element | Index/Size Range | |||||
|---|---|---|---|---|---|---|
| Enrichment | Yield | |||||
| +5 mm | −5 + 2 mm | −2 mm | +5 mm | −5 + 2 mm | −2 mm | |
| Cu | 3.96 | 2.73 | 4.01 | 69.51% | 75.89% | 78.75% |
| Al | 6.84 | 7.92 | 2.89 | 67.90% | 51.53% | 28.83% |
| Fe | 8.56 | 5.11 | 3.90 | 91.71% | 95.86% | 90.95% |
| Sn | 2.37 | 2.46 | 3.19 | 41.64% | 68.47% | 62.55% |
| Zn | 4.70 | 5.12 | 3.43 | 82.53% | 96.04% | 80.10% |
| Pb | 4.04 | 2.52 | 4.23 | 70.99% | 70.17% | 83.08% |
Publisher’s Note: MDPI stays neutral with regard to jurisdictional claims in published maps and institutional affiliations. |
© 2021 by the authors. Licensee MDPI, Basel, Switzerland. This article is an open access article distributed under the terms and conditions of the Creative Commons Attribution (CC BY) license (https://creativecommons.org/licenses/by/4.0/).
Share and Cite
de Buzin, P.J.W.K.; Ambrós, W.M.; de Brum, I.A.S.; Tubino, R.M.C.; Hoffmann Sampaio, C.; Oliva Moncunill, J. Development of a Physical Separation Route for the Concentration of Base Metals from Old Wasted Printed Circuit Boards. Minerals 2021, 11, 1014. https://doi.org/10.3390/min11091014
de Buzin PJWK, Ambrós WM, de Brum IAS, Tubino RMC, Hoffmann Sampaio C, Oliva Moncunill J. Development of a Physical Separation Route for the Concentration of Base Metals from Old Wasted Printed Circuit Boards. Minerals. 2021; 11(9):1014. https://doi.org/10.3390/min11091014
Chicago/Turabian Stylede Buzin, Pedro Jorge Walburga Keglevich, Weslei Monteiro Ambrós, Irineu Antônio Schadach de Brum, Rejane Maria Candiota Tubino, Carlos Hoffmann Sampaio, and Josep Oliva Moncunill. 2021. "Development of a Physical Separation Route for the Concentration of Base Metals from Old Wasted Printed Circuit Boards" Minerals 11, no. 9: 1014. https://doi.org/10.3390/min11091014