
Mineralogy and Geochemistry of Seabed Sediments of the Chiloé–Taitao Area, Southern Chile, and Implications for Ore Deposits


Abstract
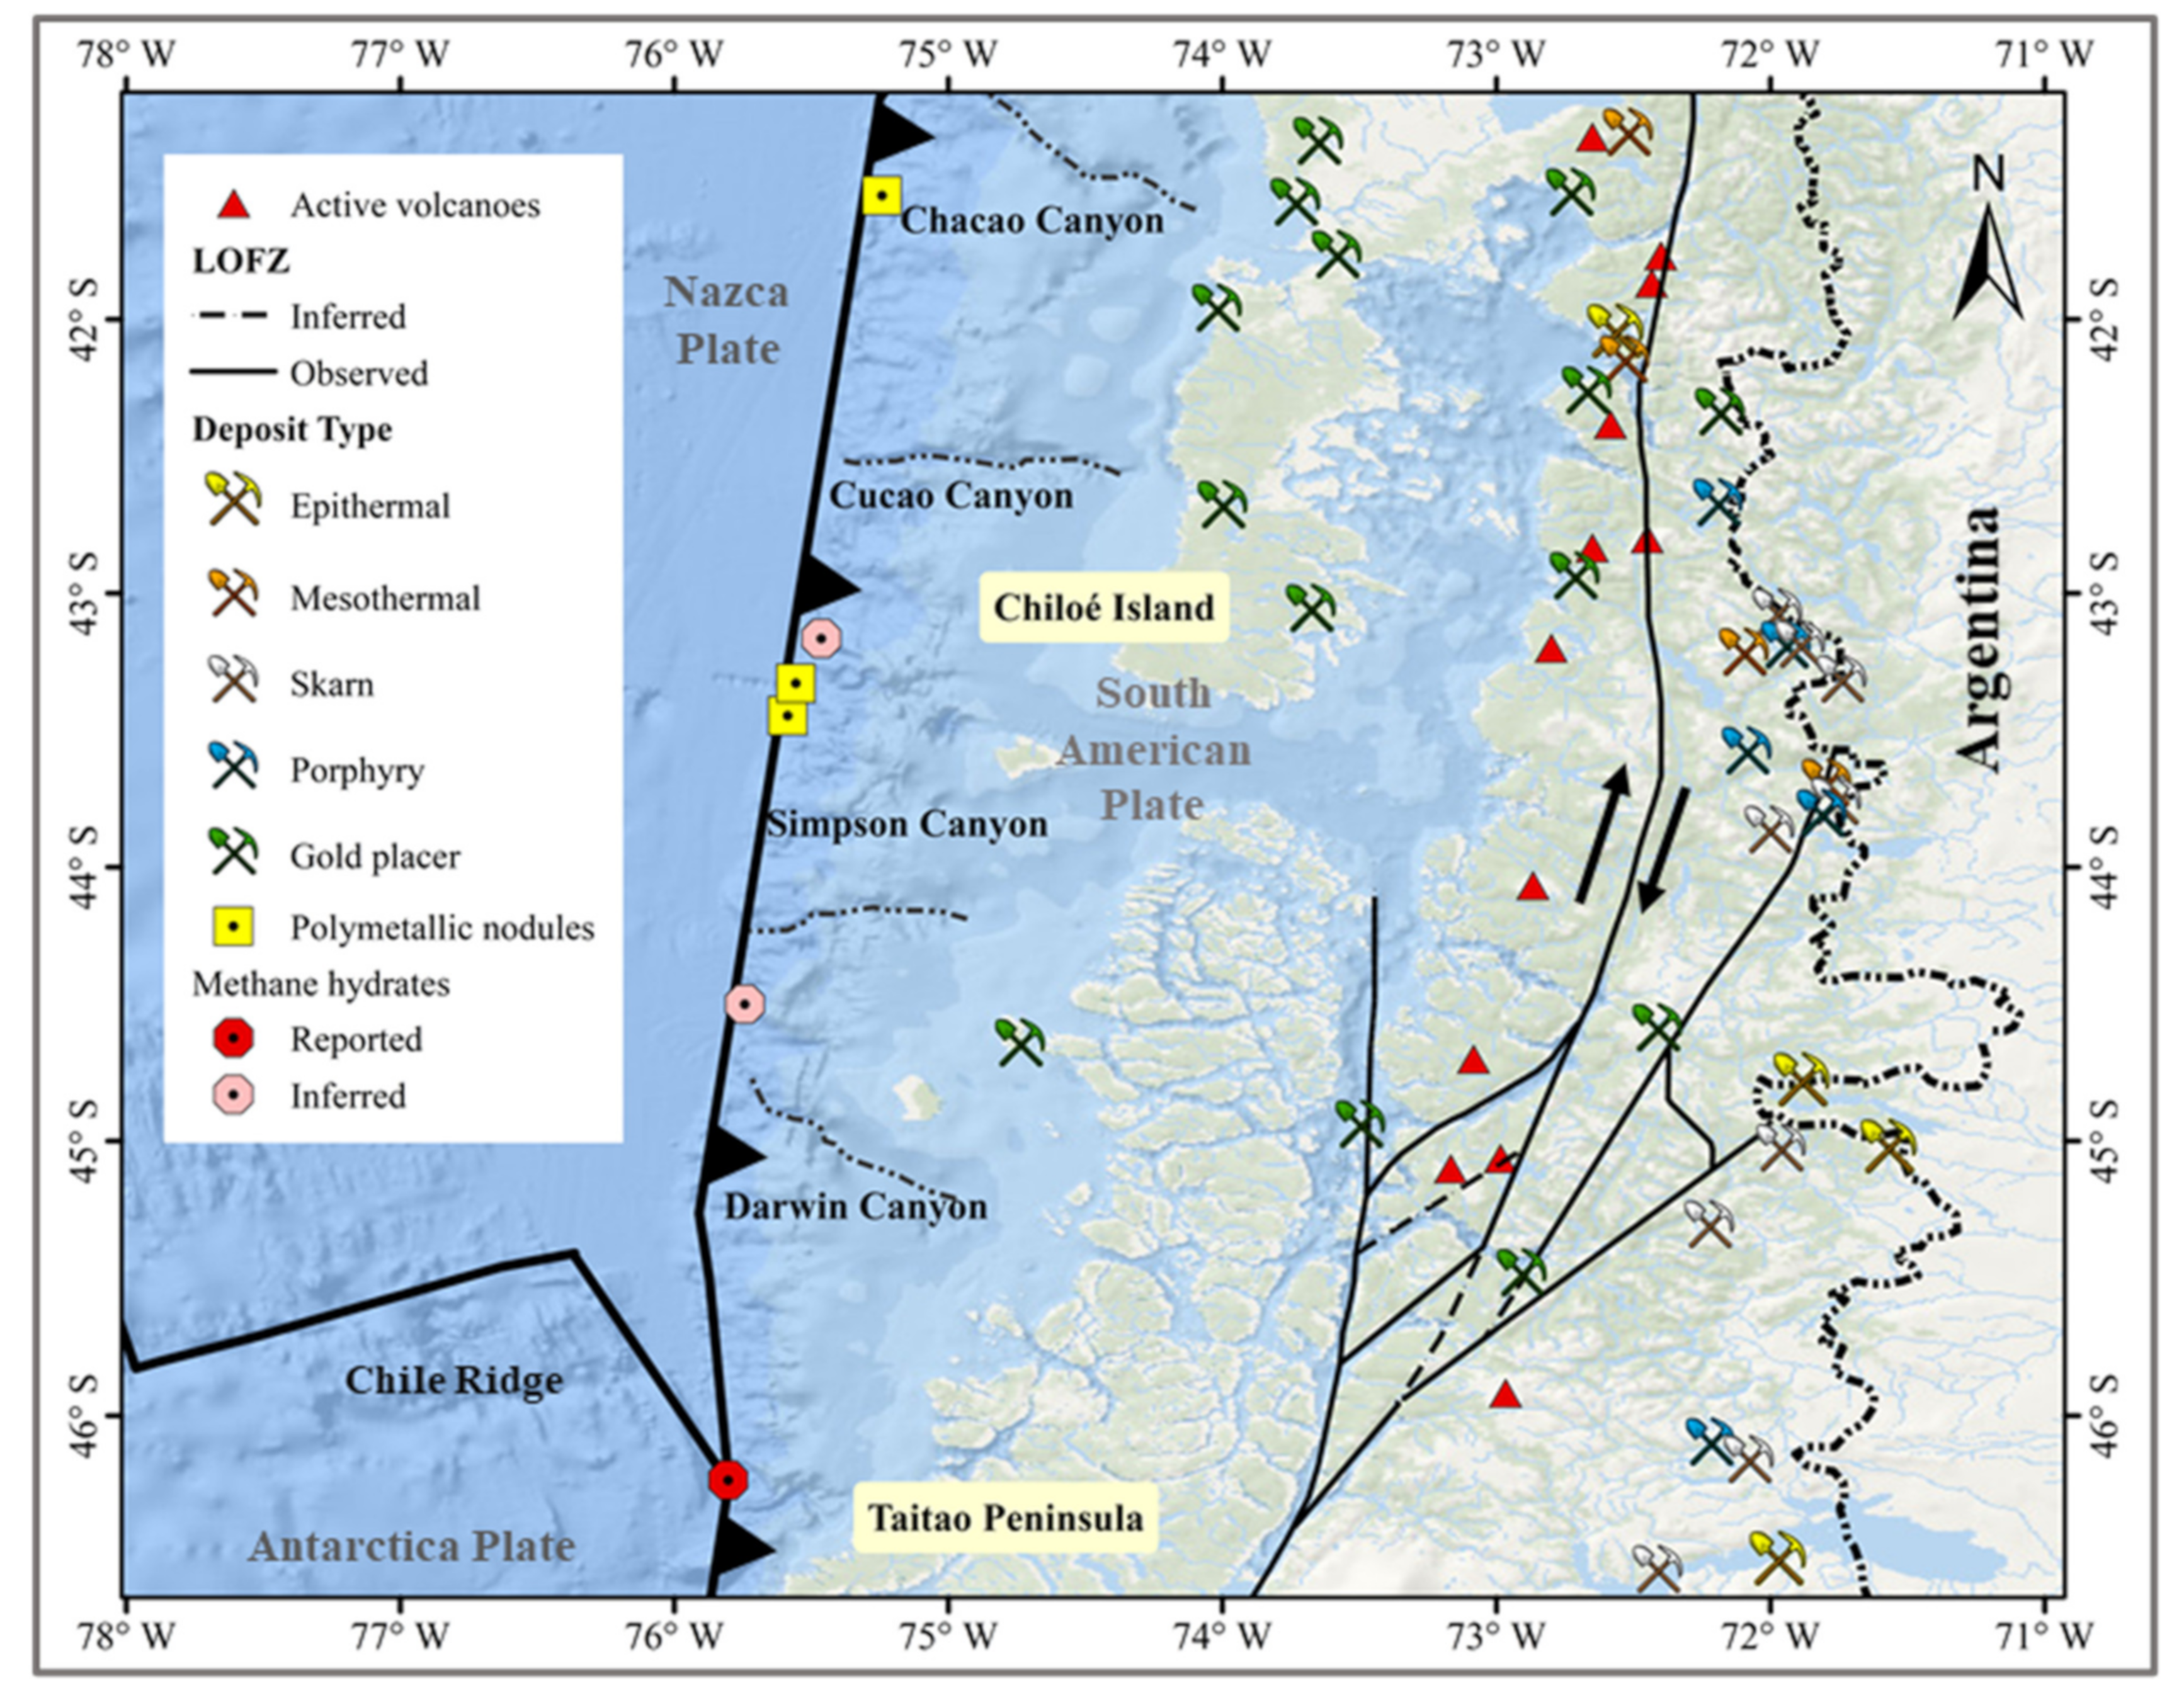
:1. Introduction
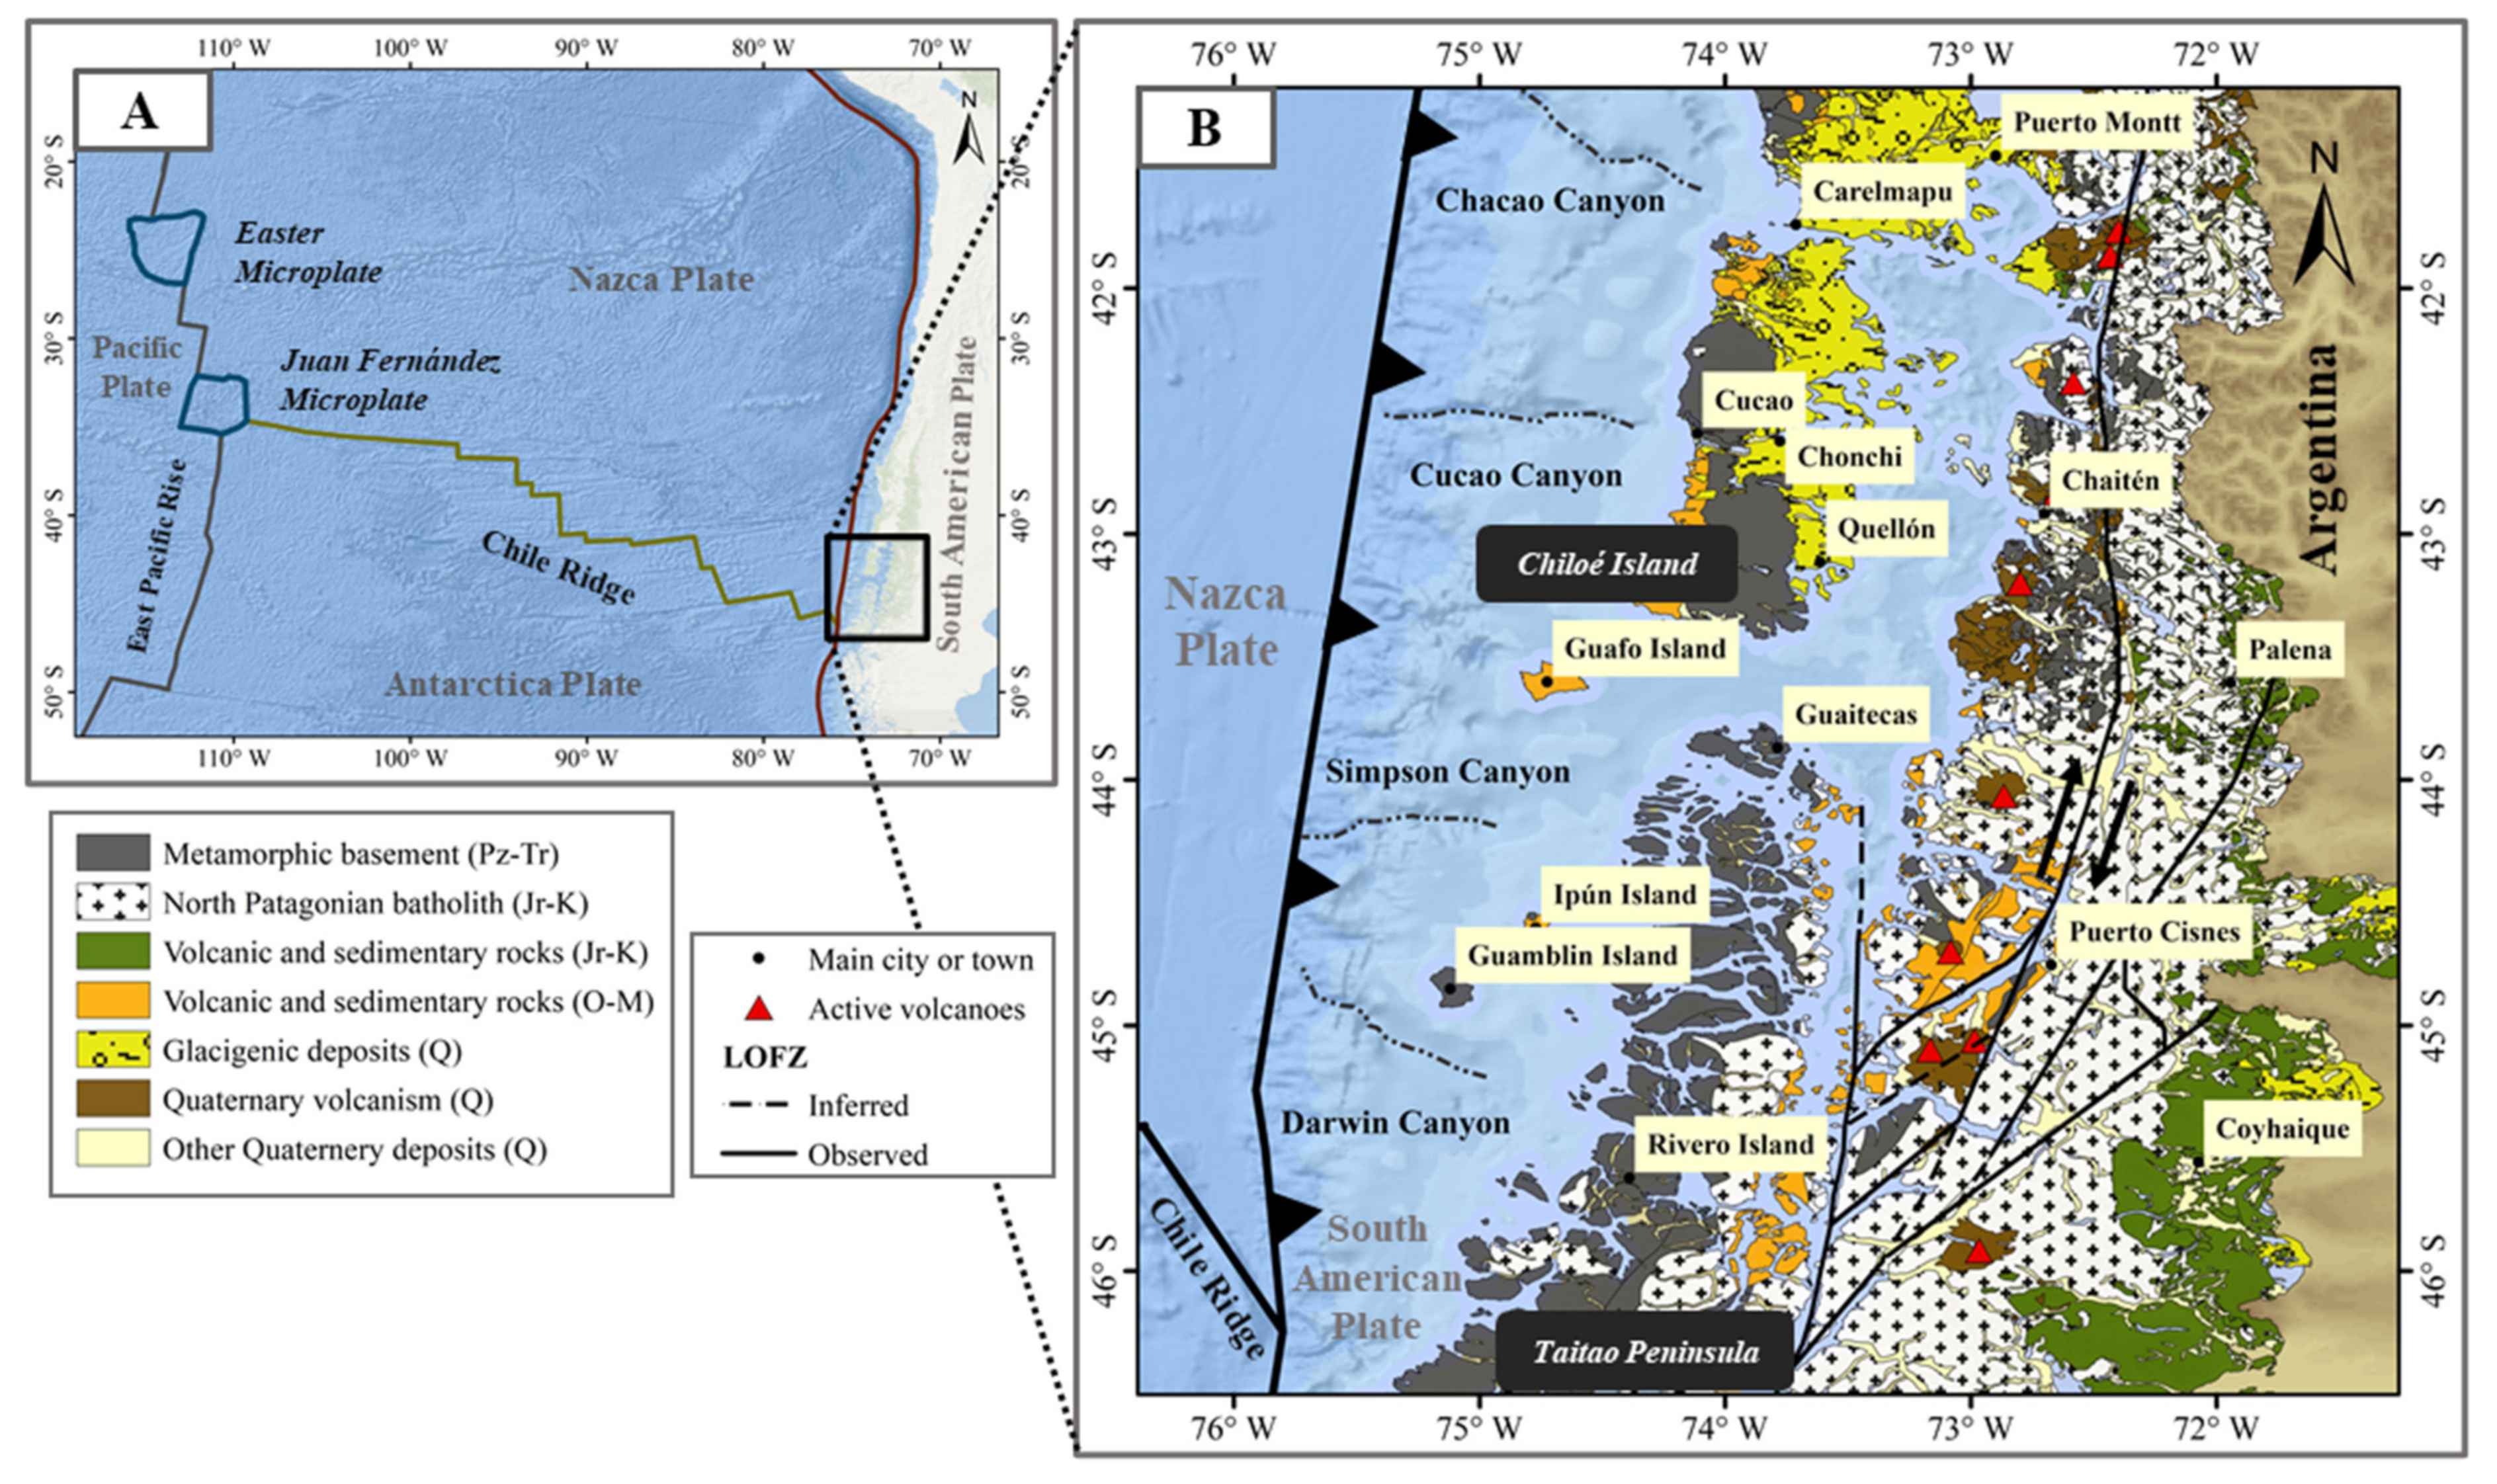
2. Geological Setting
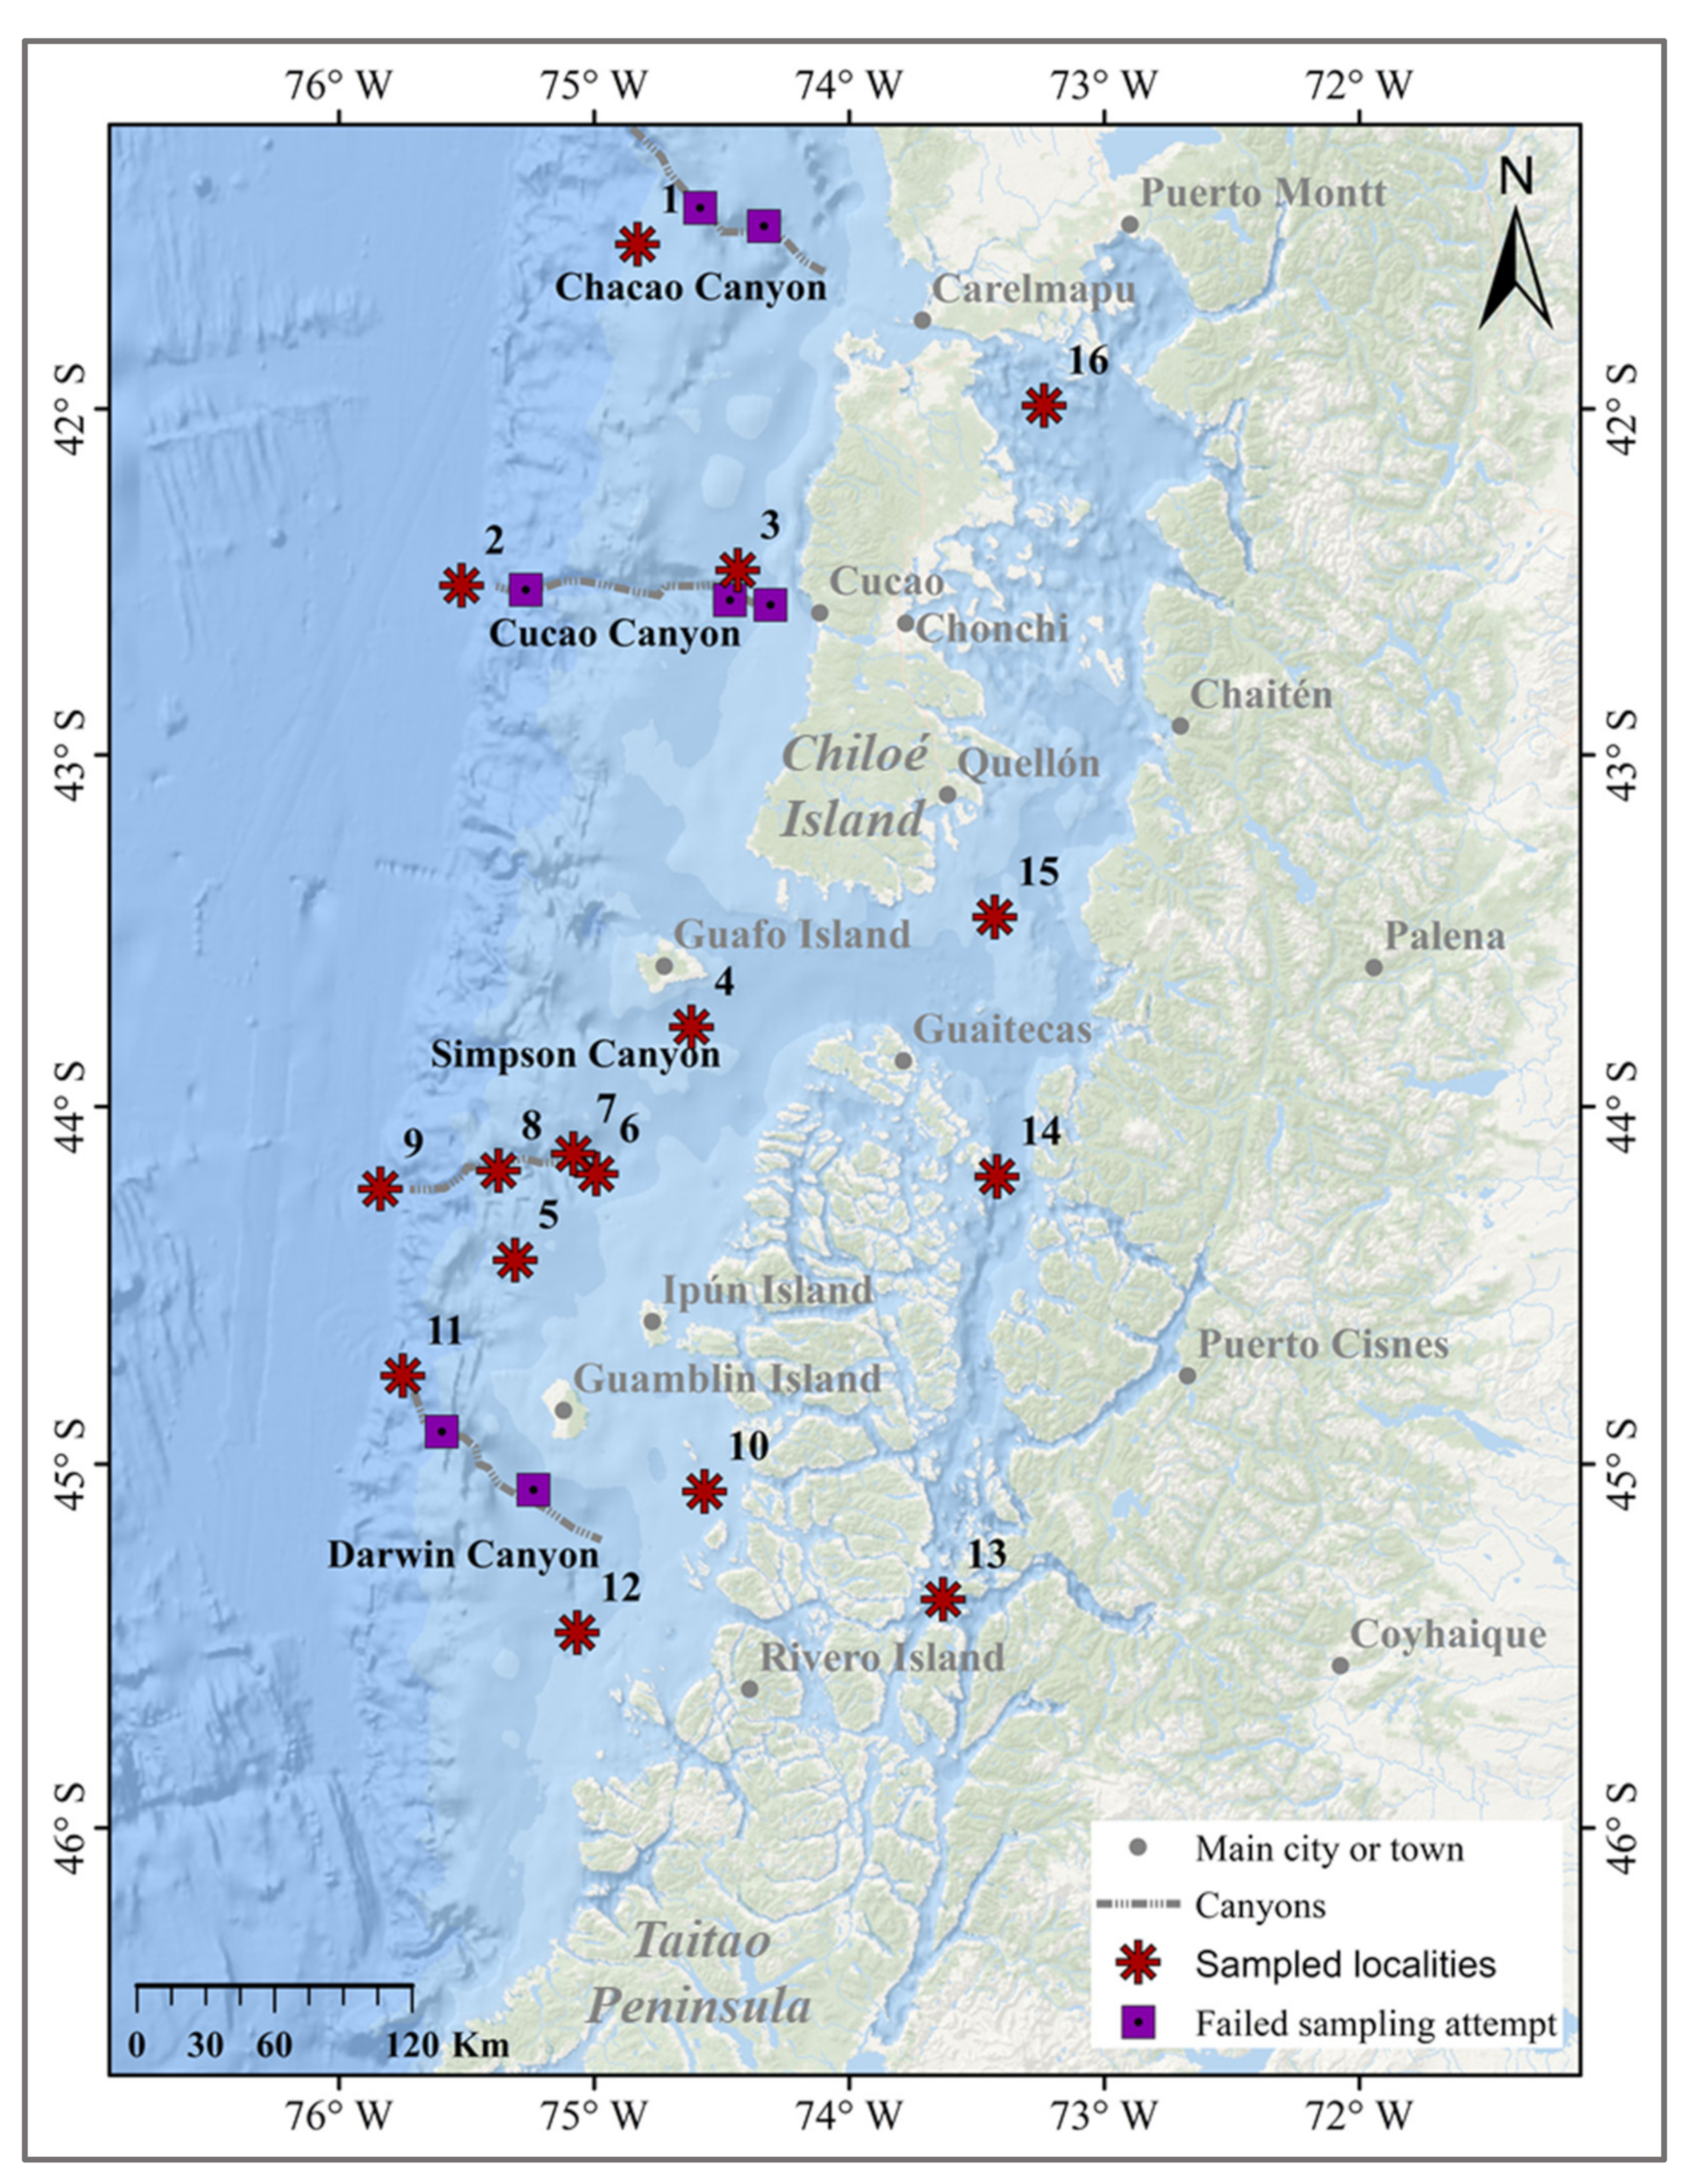
3. Materials and Methods
4. Results
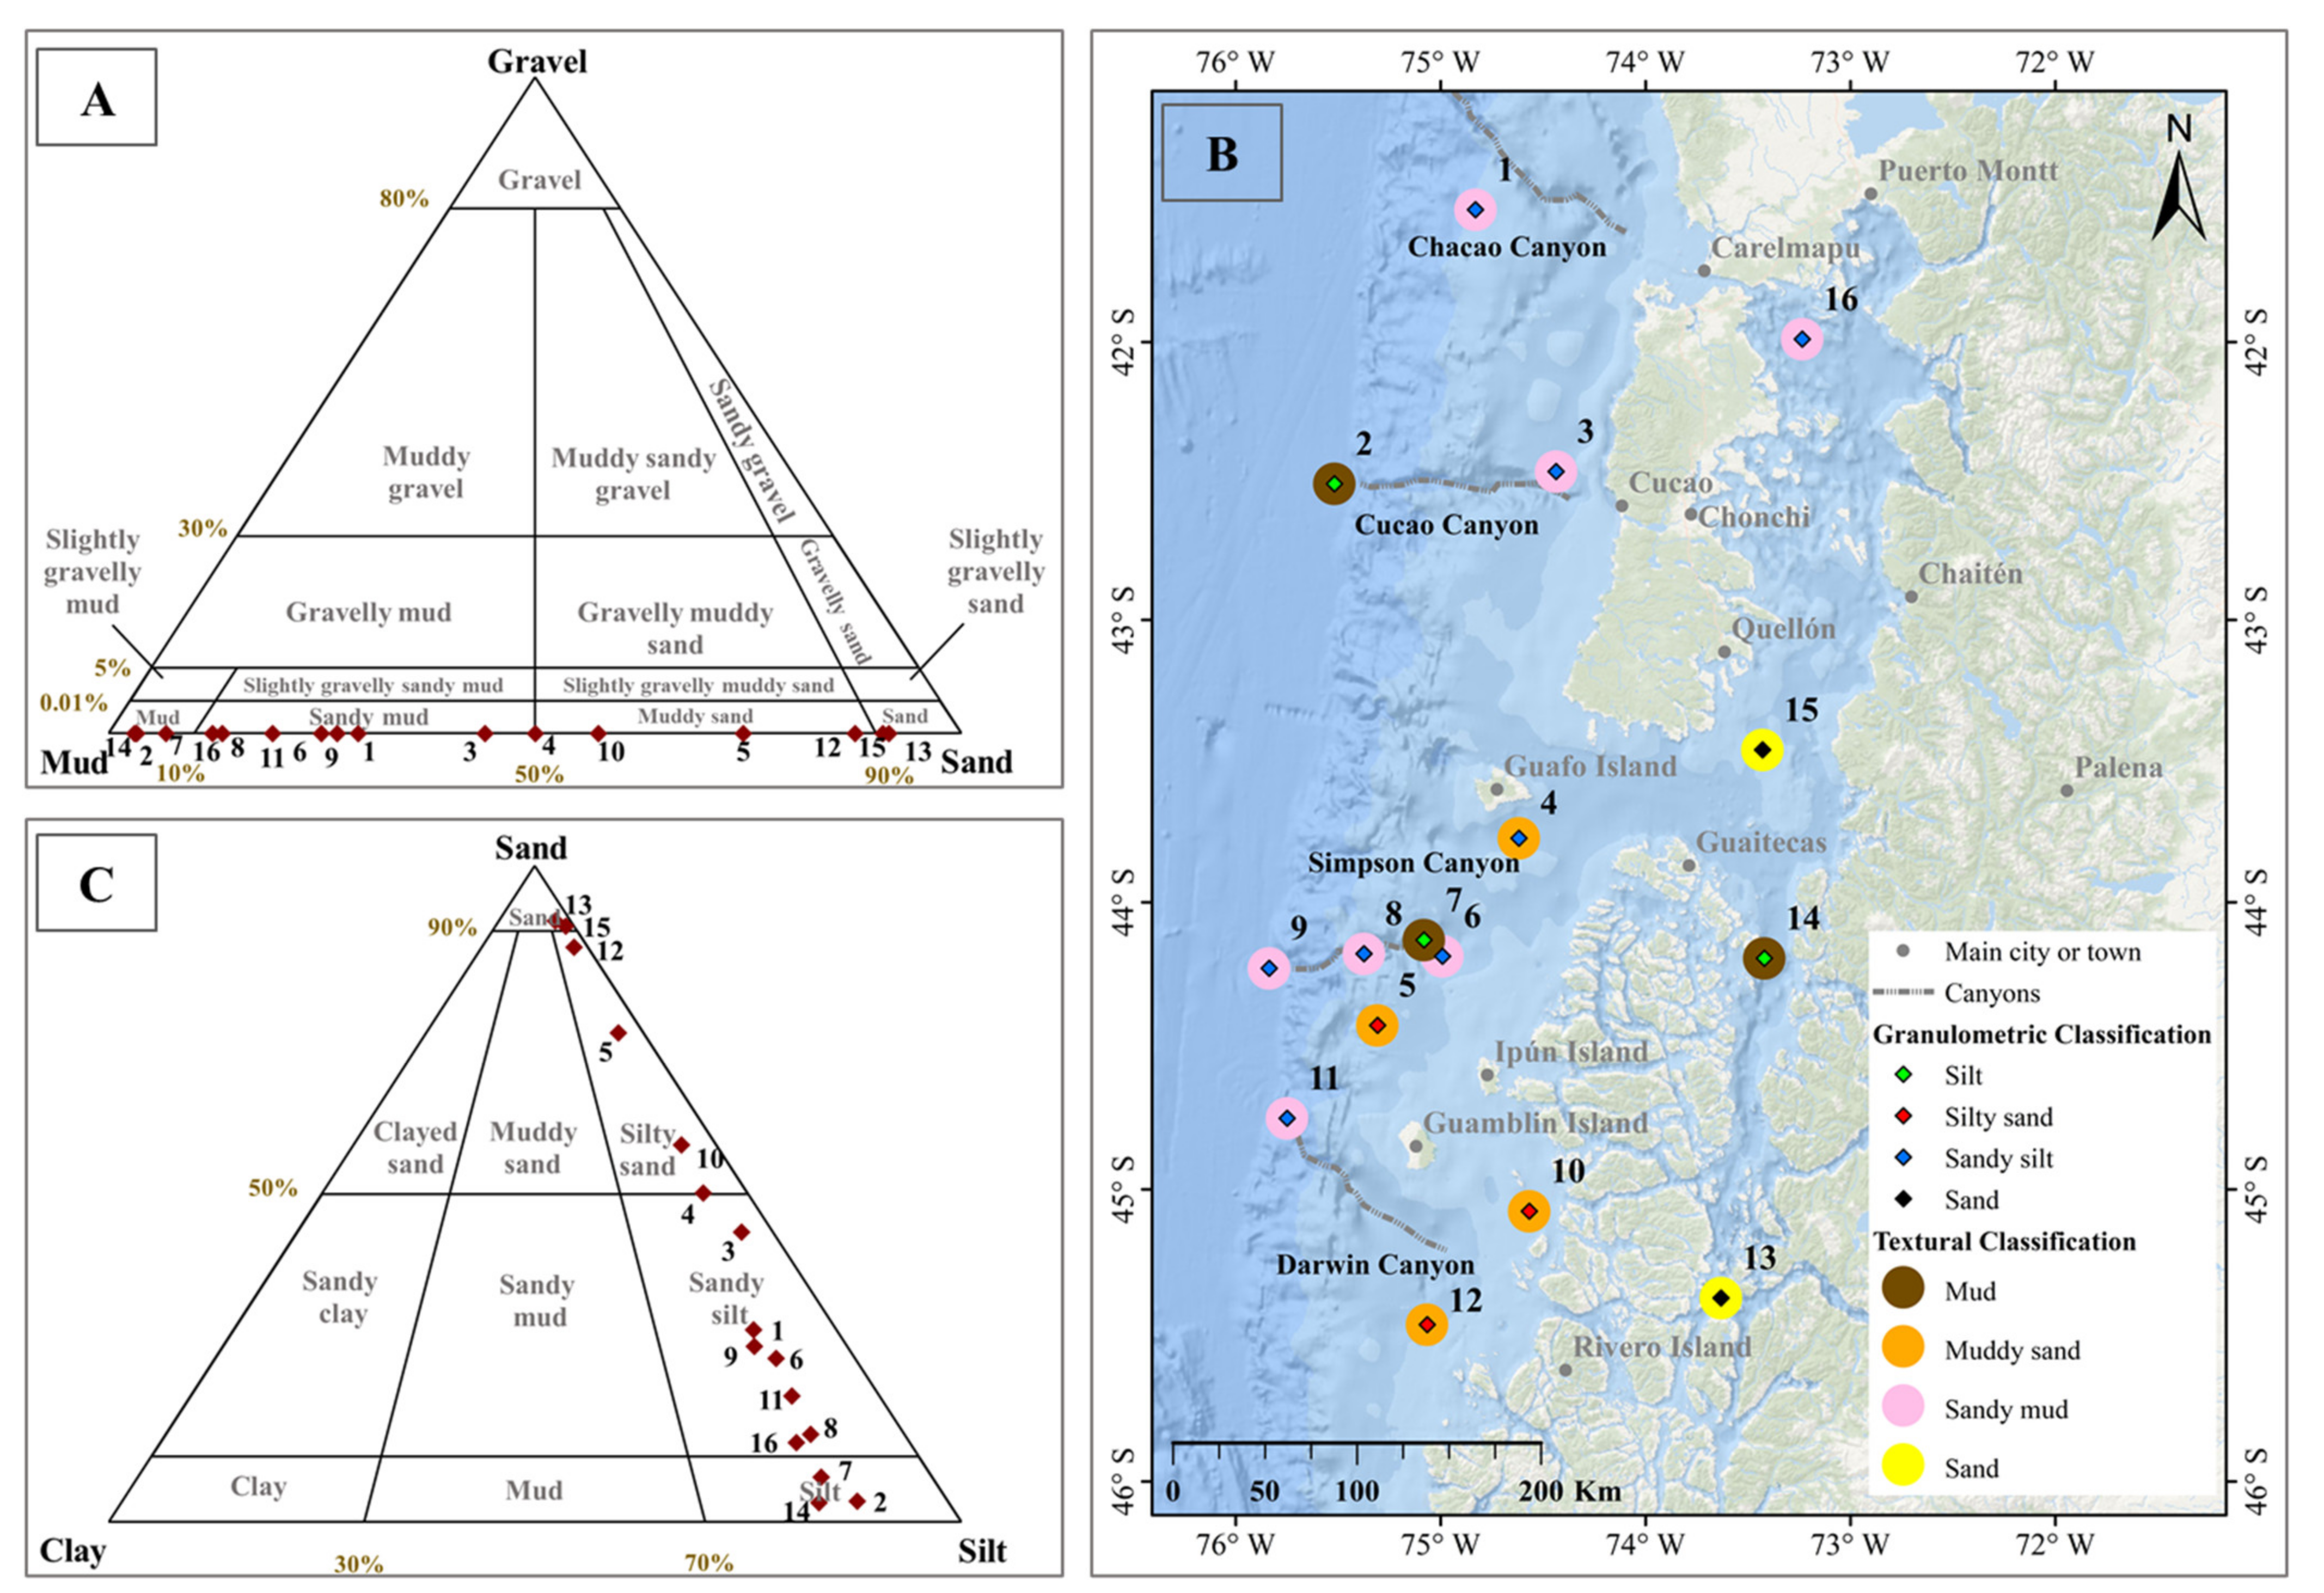
4.1. Granulometry
4.2. Mineralogy
4.2.1. Fractions Larger Than 75 μm
4.2.2. Fractions Smaller Than 75 μm
4.3. Geochemistry
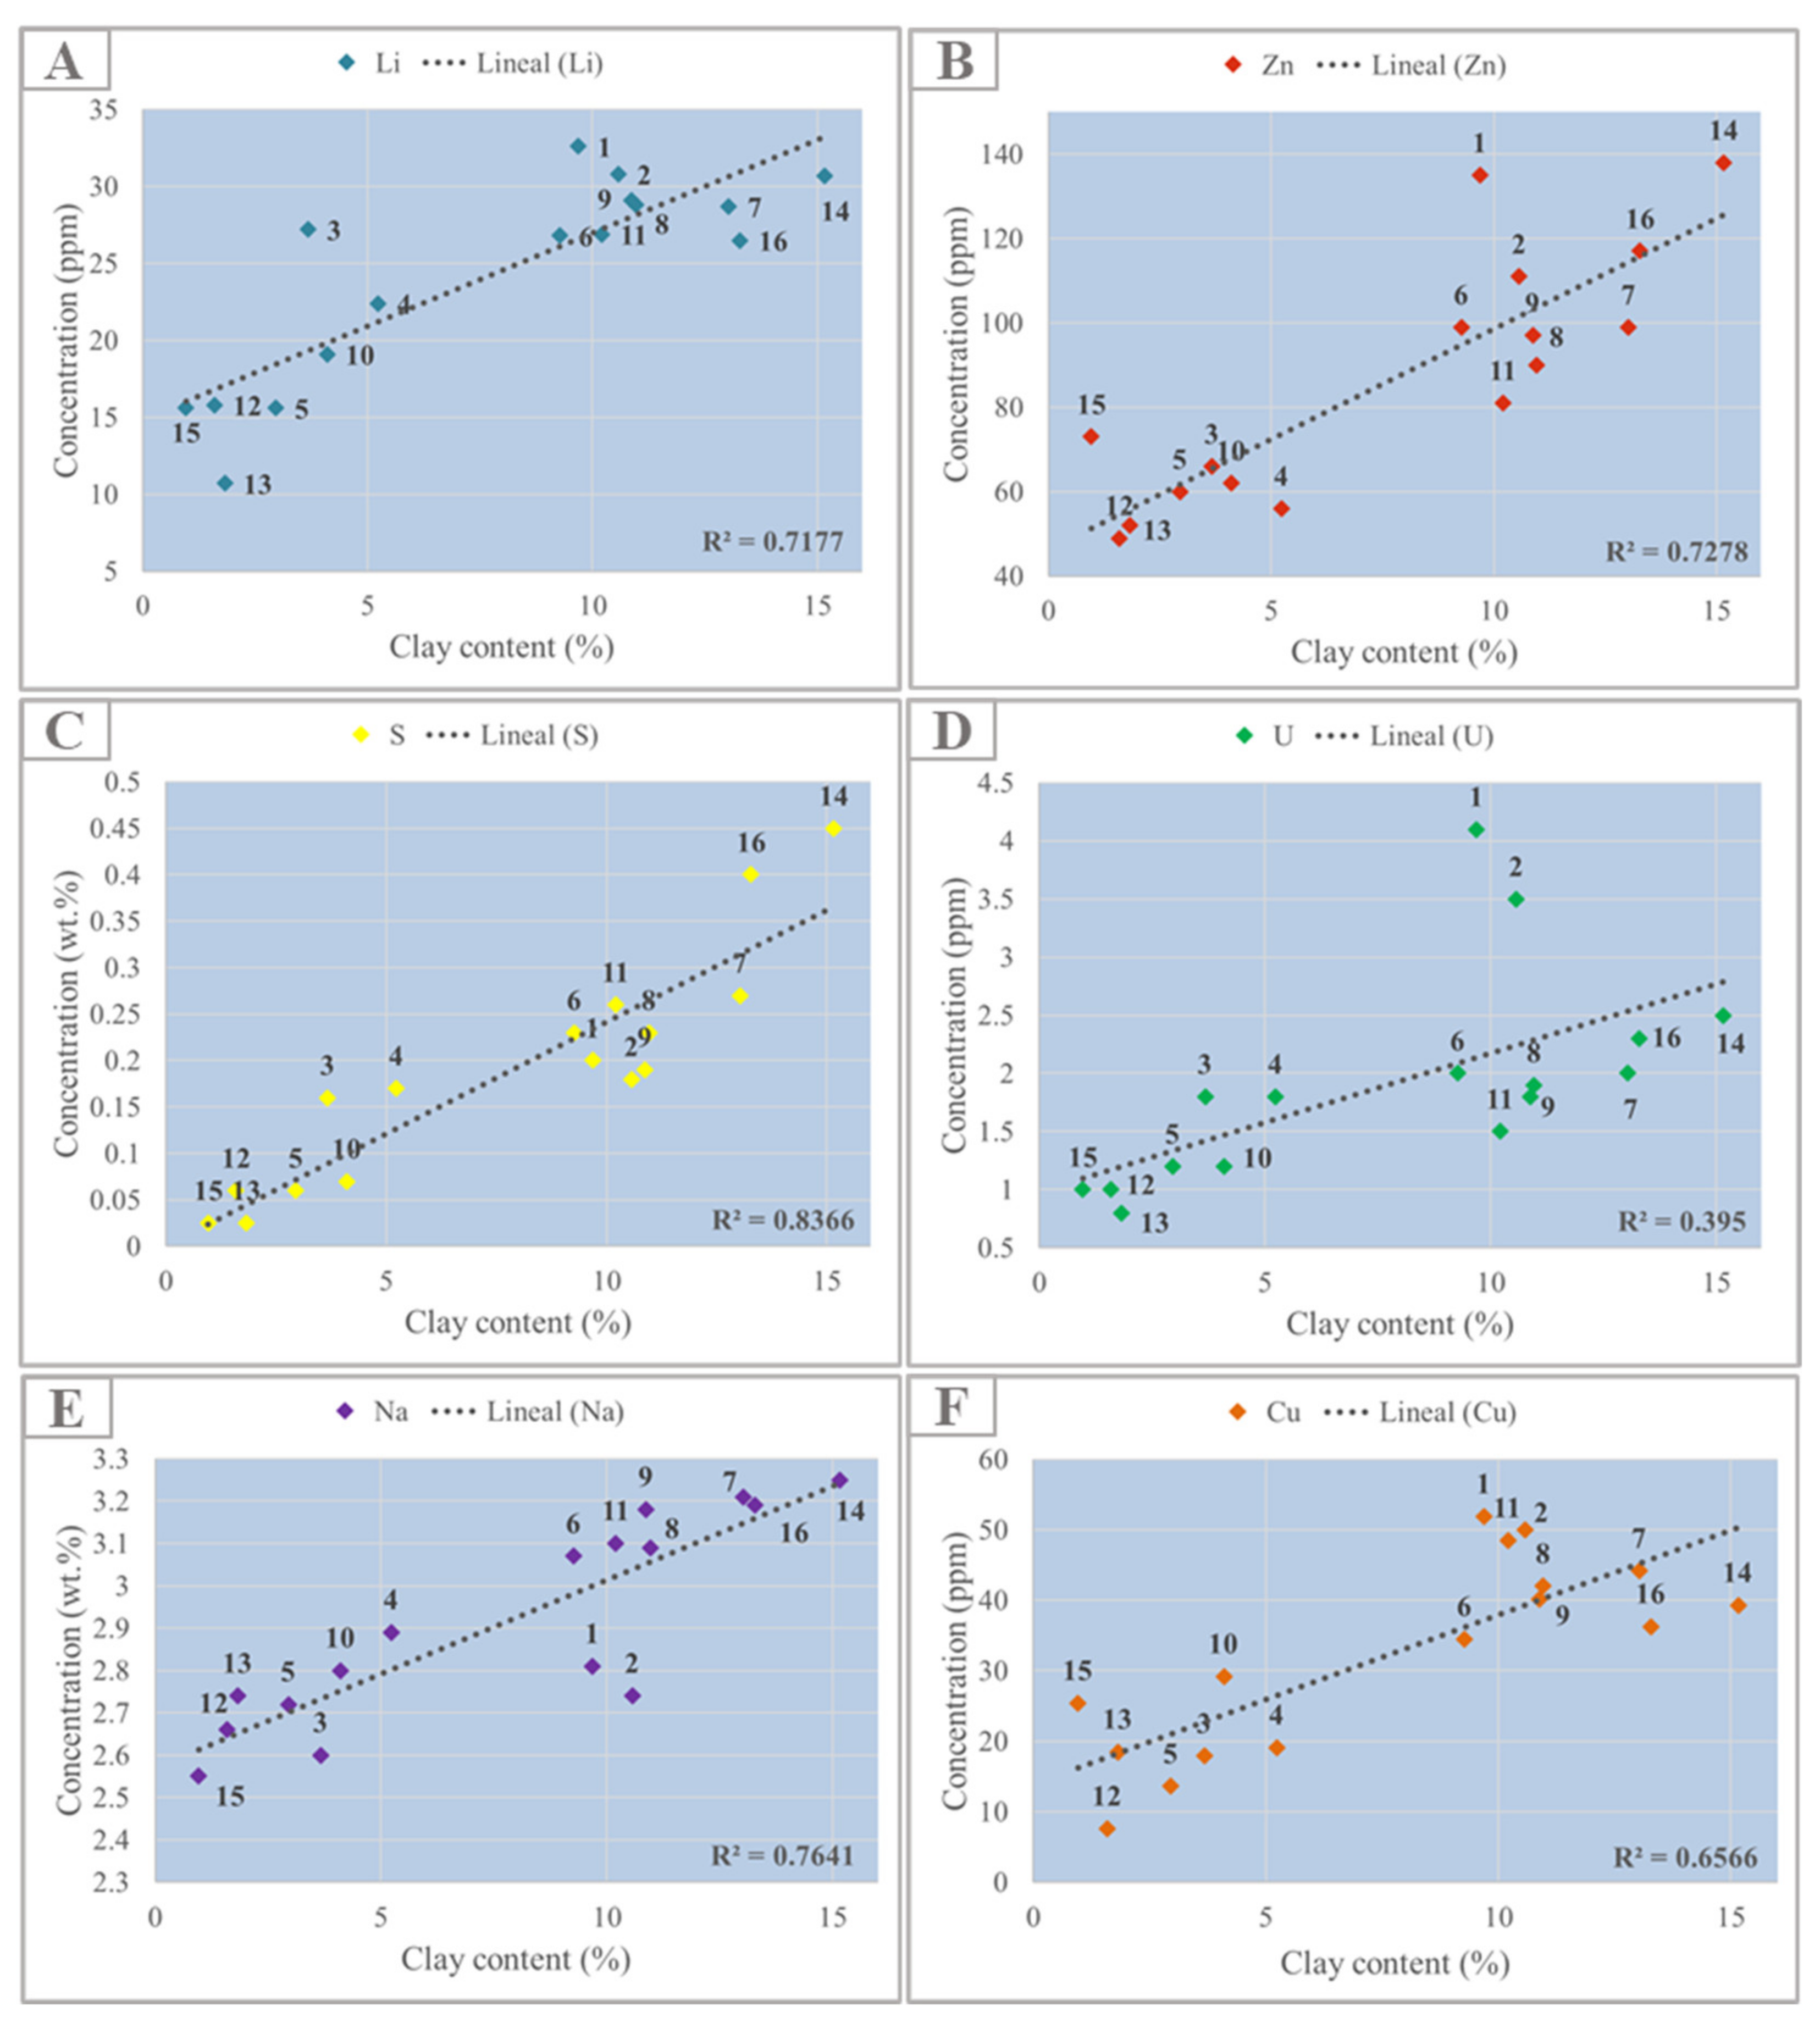
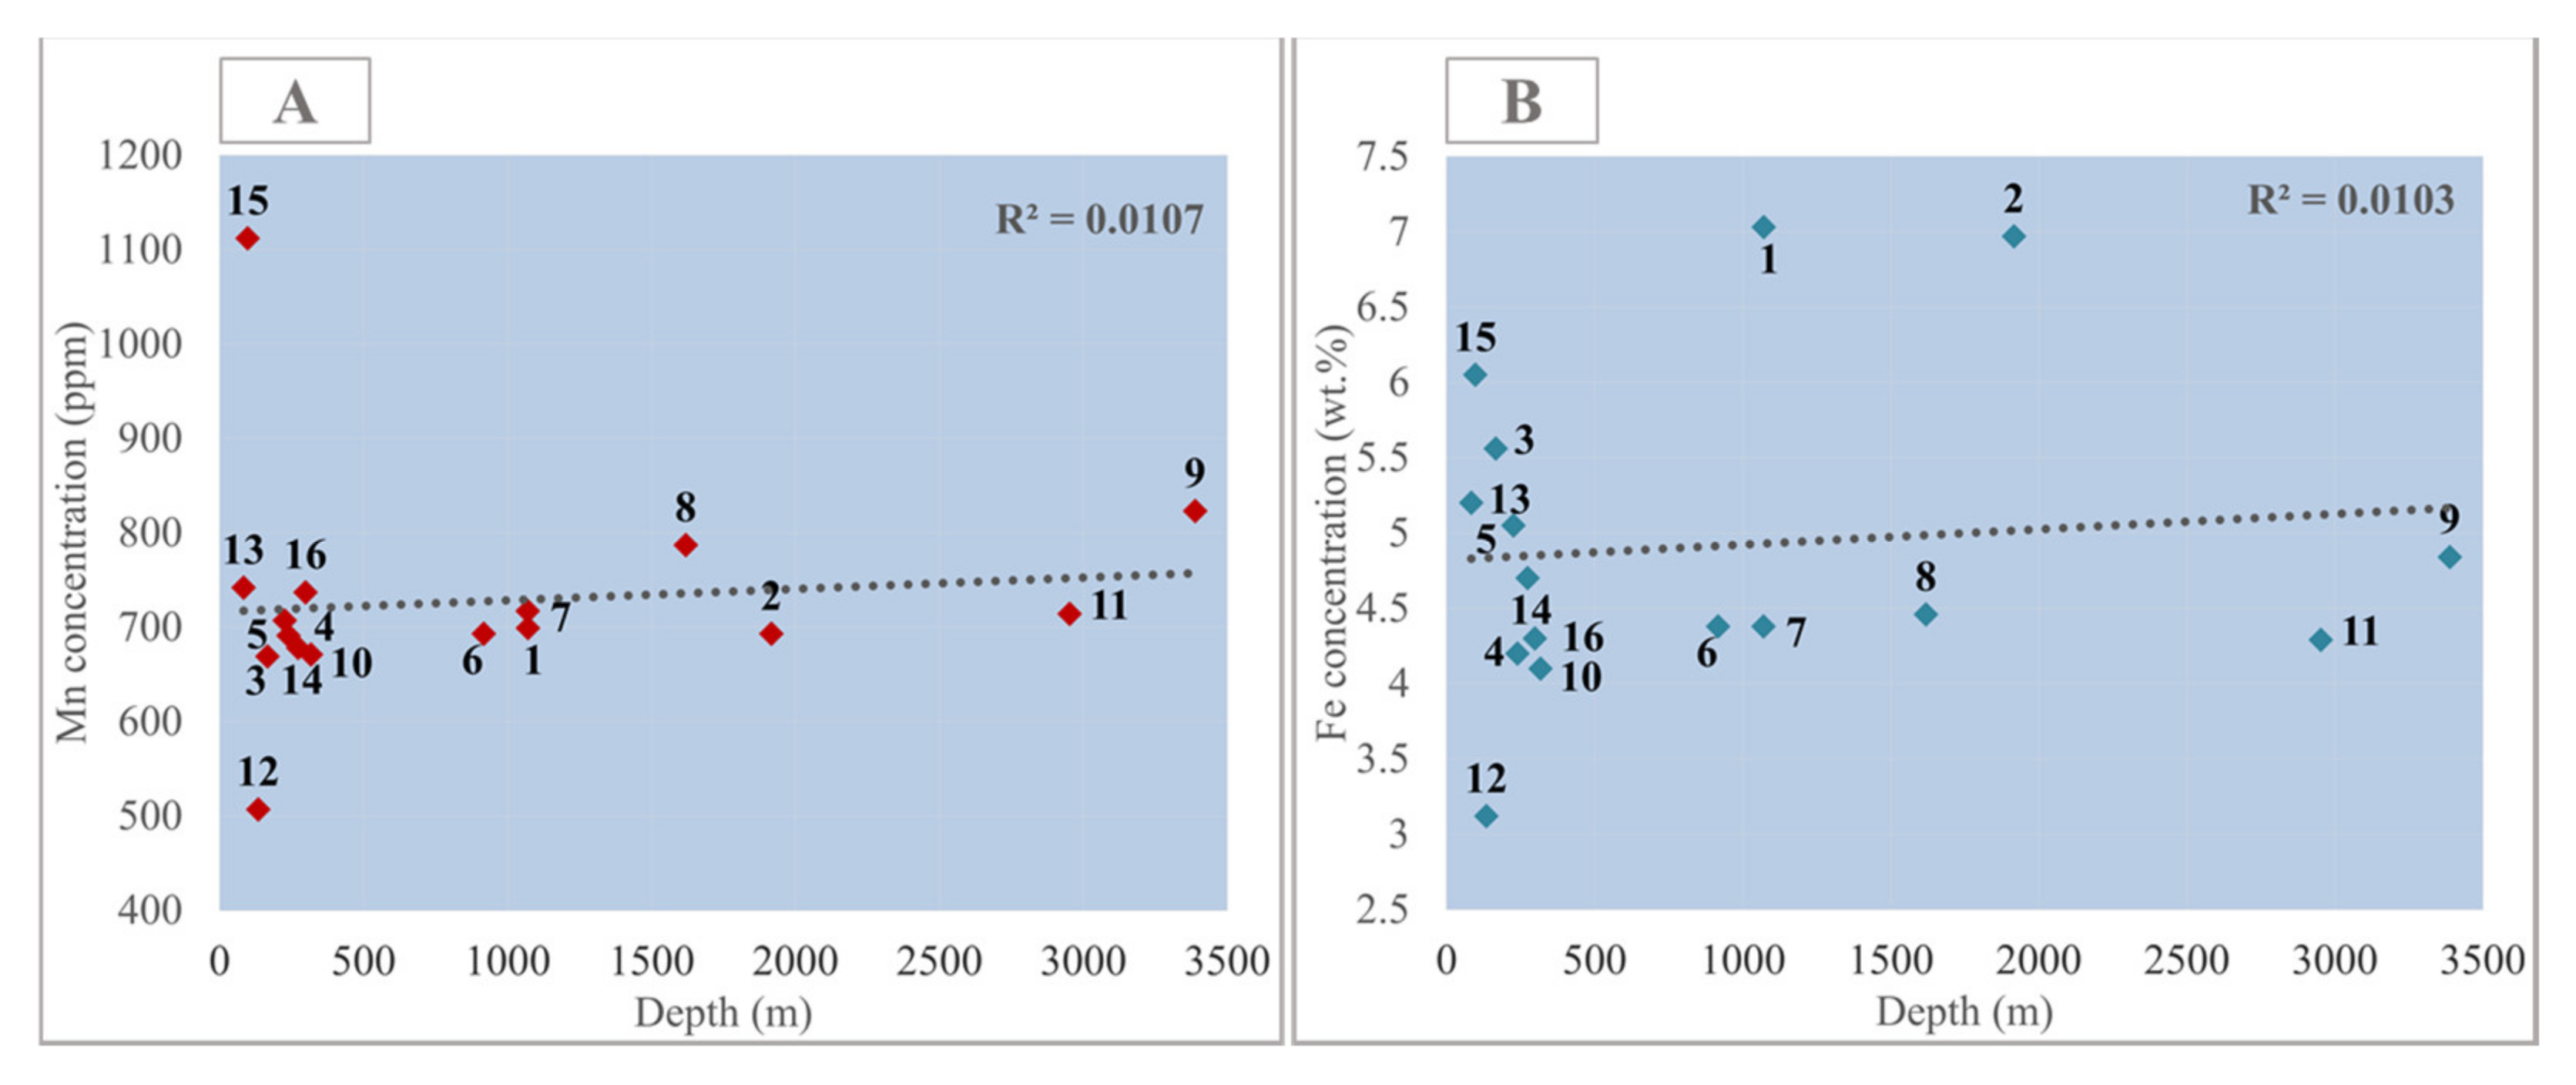
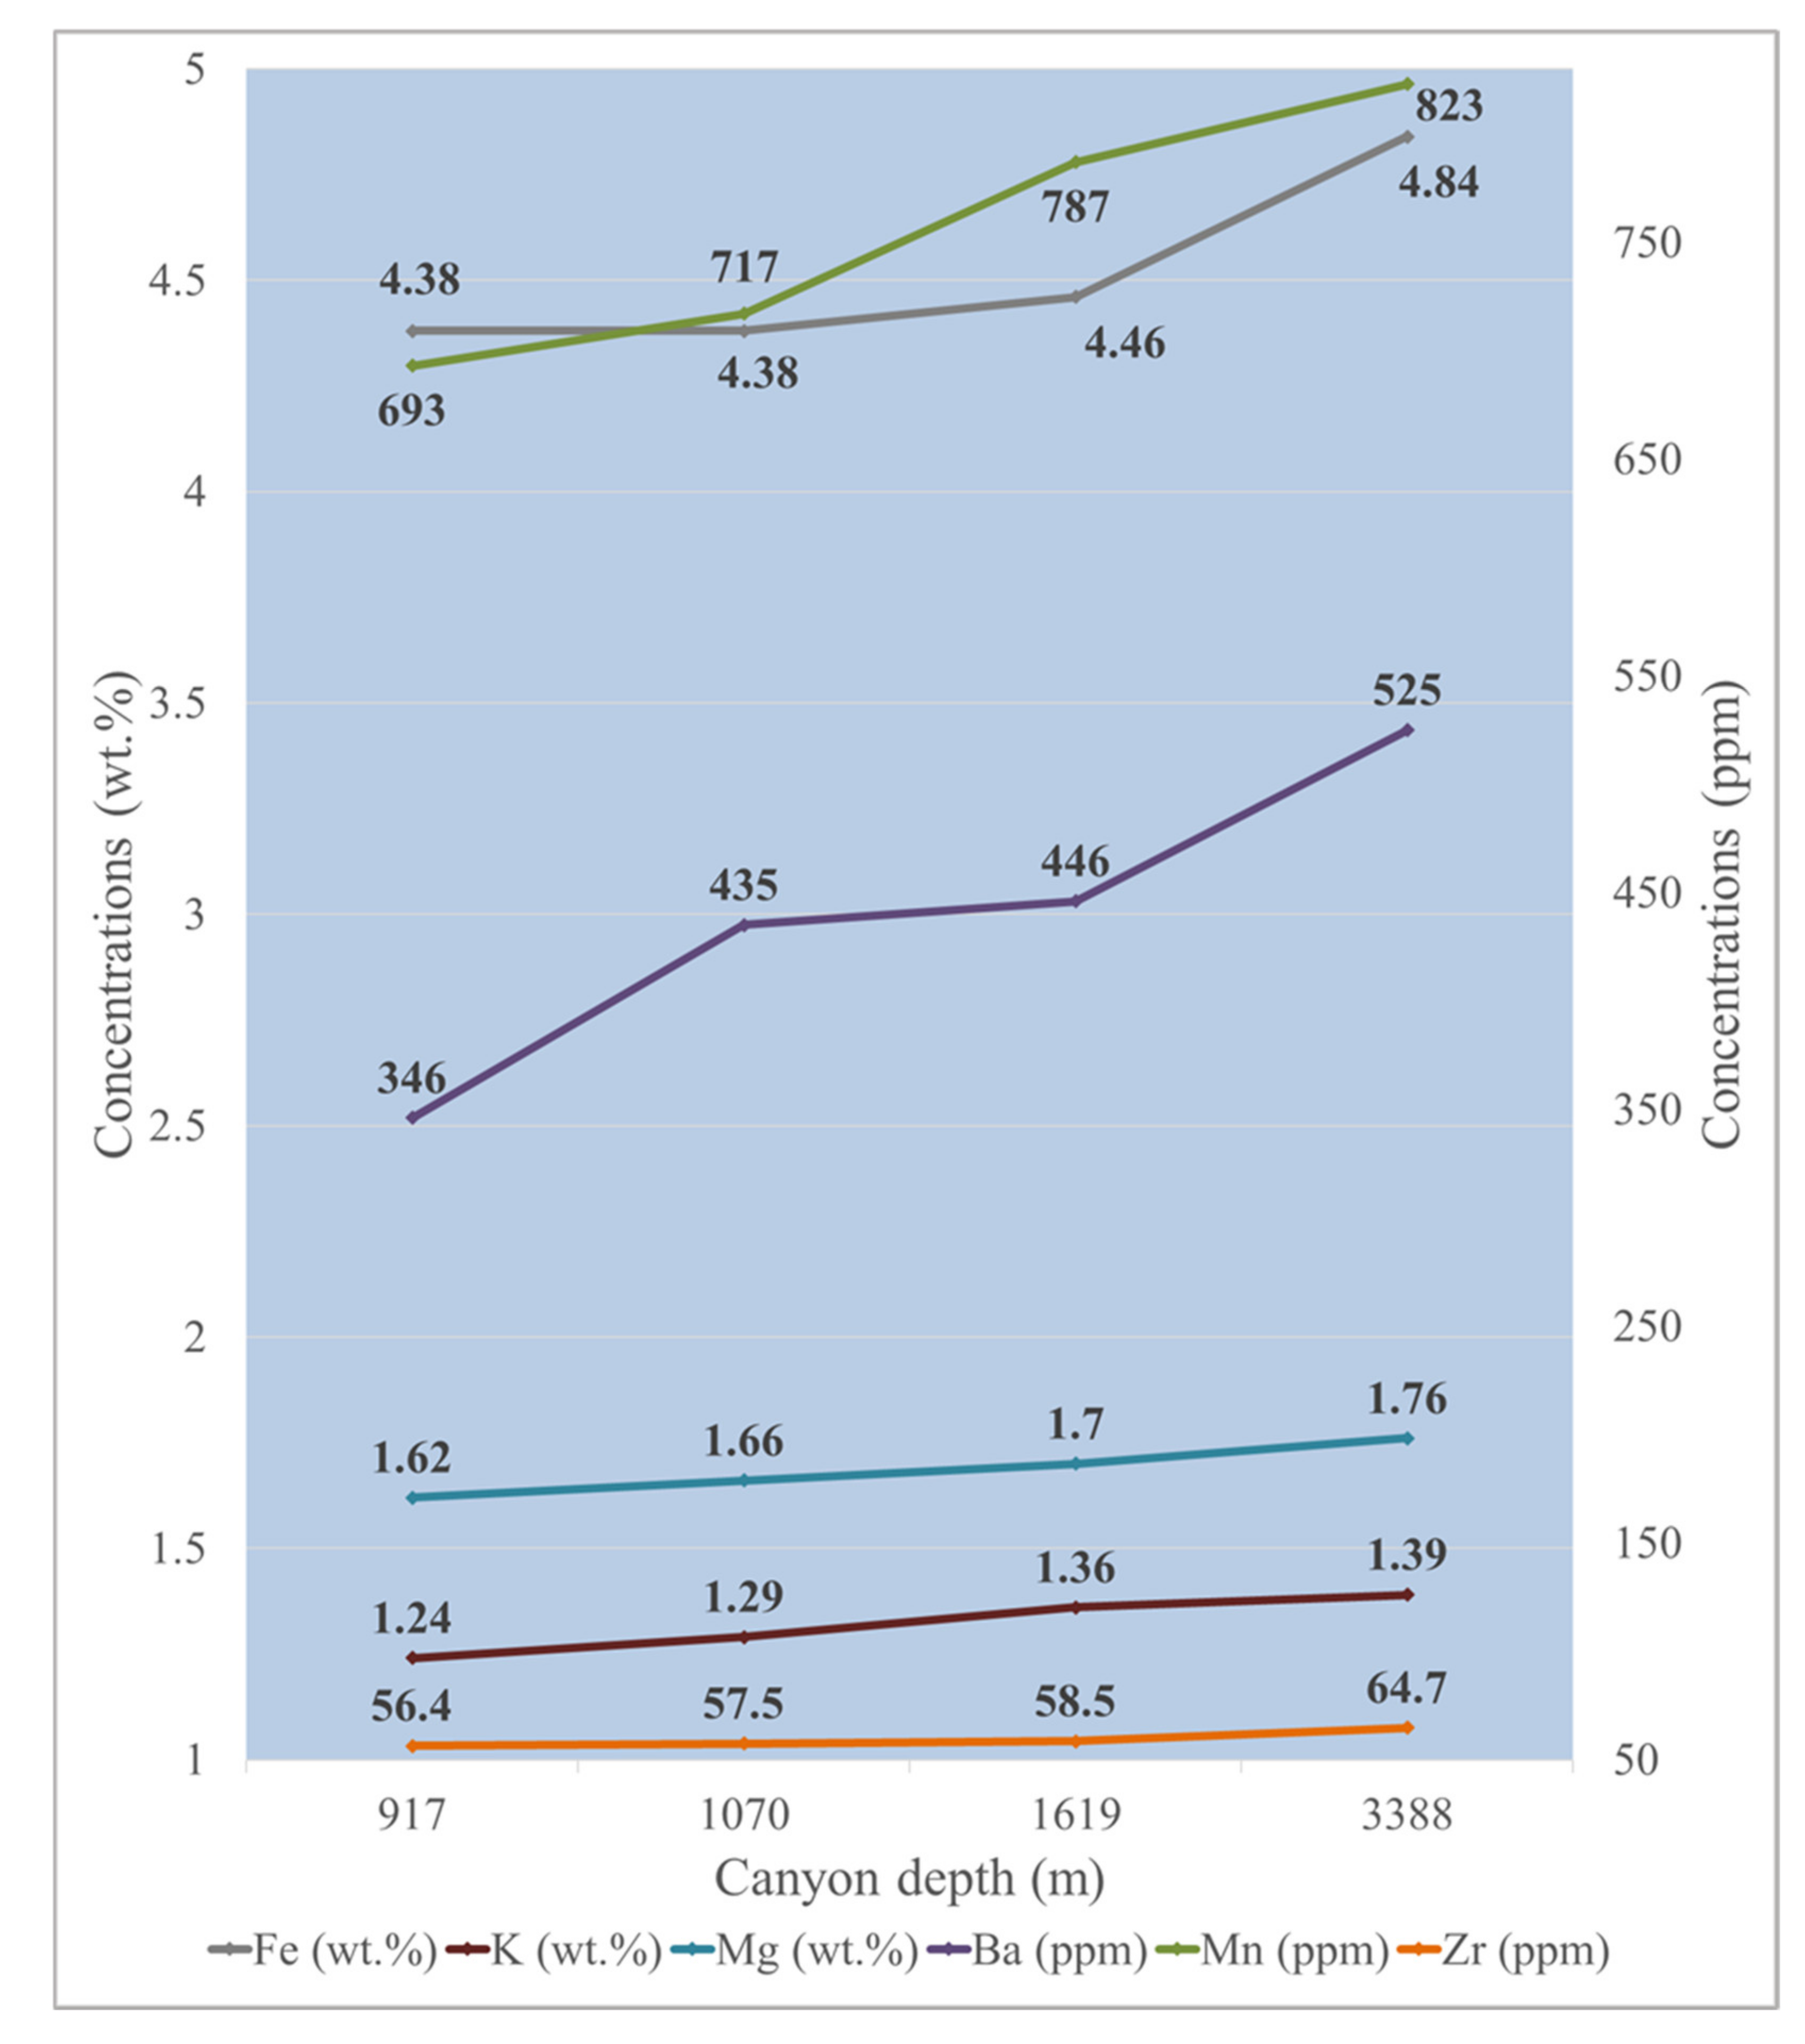
4.3.1. Univariate Analysis
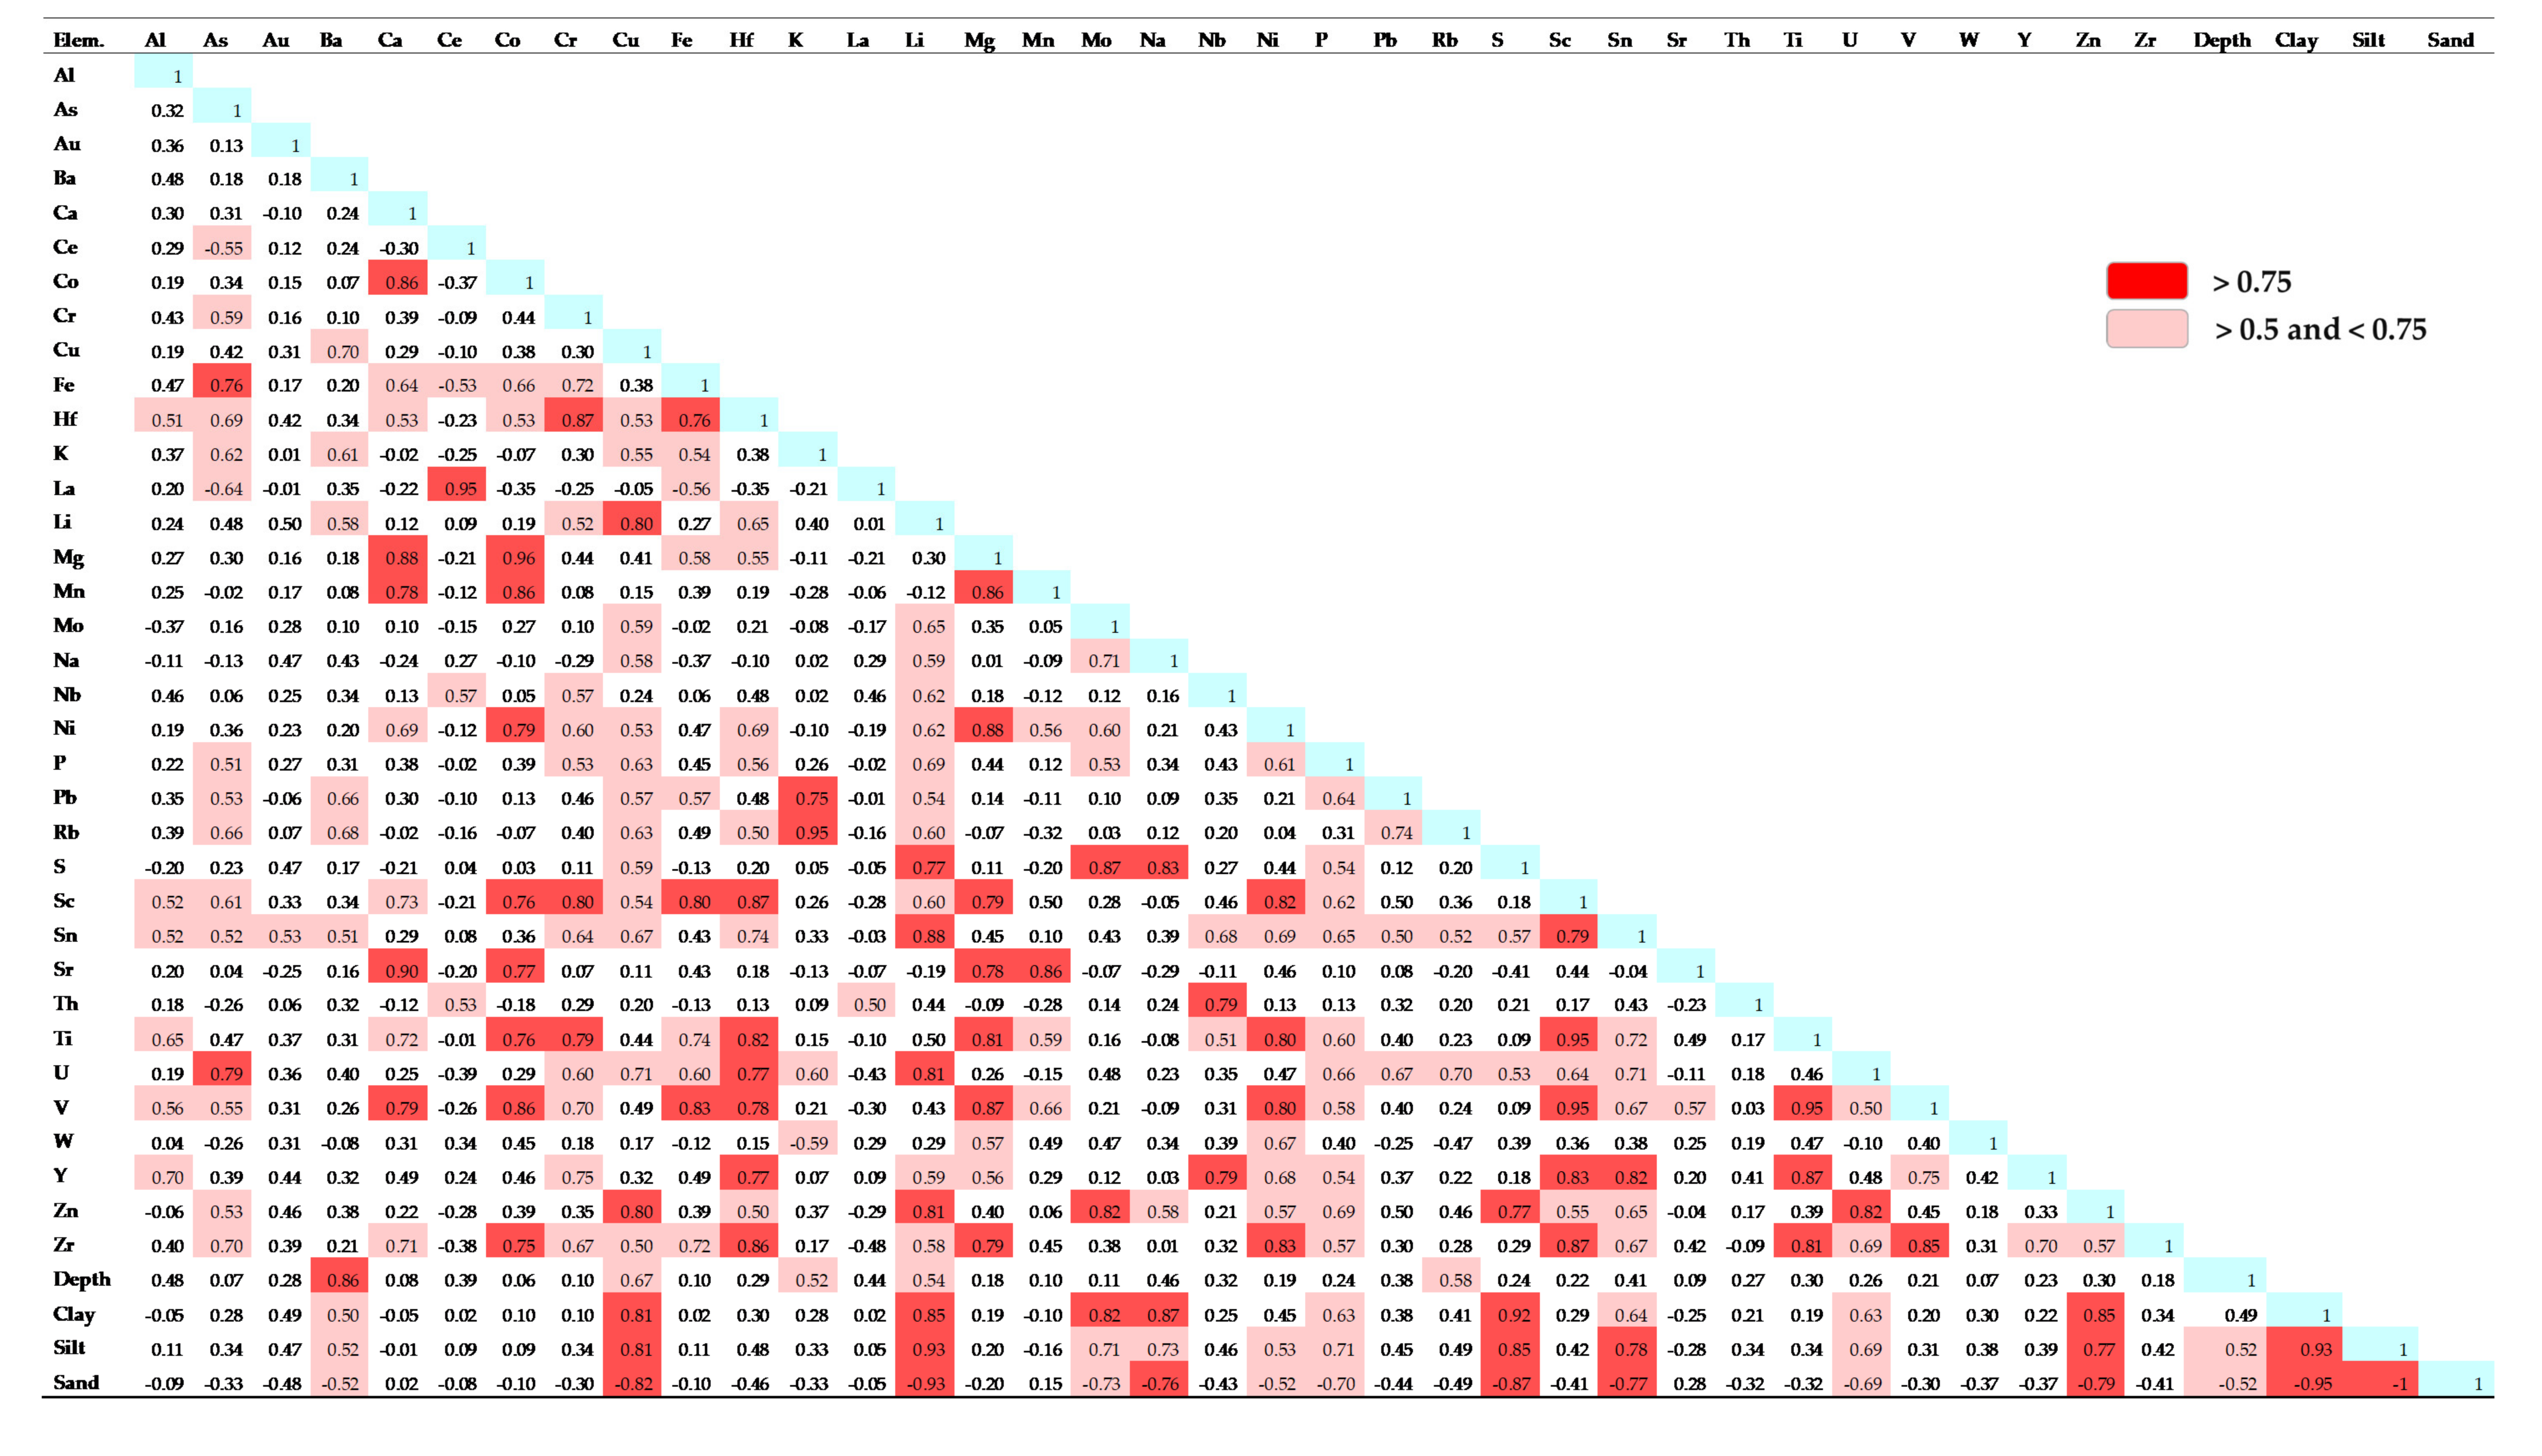
4.3.2. Multivariate Analysis
5. Discussion
6. Conclusions
Supplementary Materials
Author Contributions
Funding
Data Availability Statement
Acknowledgments
Conflicts of Interest
References
- Cronan, D.S. Handbook of Marine Mineral Deposits; CRC Press: Boca Raton, FL, USA, 2000. [Google Scholar]
- Rona, P.A. The Changing Vision of Marine Minerals. Ore Geol. Rev. 2008, 33, 618–666. [Google Scholar] [CrossRef]
- Hein, J.R.; Mizell, K.; Koschinsky, A.; Conrad, T.A. Deep-Ocean Mineral Deposits as a Source of Critical Metals for High- and Green-Technology Applications: Comparison with Land-Based Resources. Ore Geol. Rev. 2013, 51, 1–14. [Google Scholar] [CrossRef]
- Lusty, P.A.J.; Murton, B.J. Deep-Ocean Mineral Deposits: Metal Resources and Windows into Earth Processes. Elements 2018, 14, 301–306. [Google Scholar] [CrossRef] [Green Version]
- Kret, K.; Tsuji, T.; Chhun, C.; Takano, O. Distributions of Gas Hydrate and Free Gas Accumulations Associated with Upward Fluid Flow in the Sanriku-Oki Forearc Basin, Northeast Japan. Mar. Pet. Geol. 2020, 116, 104305. [Google Scholar] [CrossRef]
- Glasby, G.P.; Stoffers, P.; Sioulas, A.; Thijssen, T.; Friedrich, G. Manganese Nodule Formation in the Pacific Ocean: A General Theory. Geo-Marine 1982, 2, 47–53. [Google Scholar] [CrossRef]
- Li, Y.-H.; Schoonmaker, J.E. Chemical Composition and Mineralogy of Marine Sediments. In Treatise on Geochemistry; Elsevier Science: Oxford, UK, 2003; Volume 7, pp. 1–35. [Google Scholar]
- García, M.; Correa, J.; Maksaev, V.; Townley, B. Potential Mineral Resources of the Chilean Offshore: An Overview. Andean Geol. 2020, 47, 1–13. [Google Scholar] [CrossRef]
- Rosato, V.J.; Kulm, L.D.; Derks, P.S. Surface Sediments of the Nazca Plate. Pac. Sci. 1975, 29, 117–130. [Google Scholar]
- Valenzuela, E.; Mpodozis, C.; Morales, E.; Parra, J.C.; Ugarte, G.; Tello, A.R.; Quiñones, C. Anteproyecto Para La Evaluación Del Potencial Minero Del Fondo Oceánico Del Mar de Chile; Departamento de Geología Universidad de Chile: Santiago, Chile, 1984. [Google Scholar]
- Bangs, N.L.B.; Sawyer, D.S.; Golovchenko, X. Free Gas at the Base of the Gas Hydrate Zone in the Vicinity of the Chile Triple Junction. Geology 1993, 21, 905–908. [Google Scholar] [CrossRef]
- Froelich, P.N.; Kvenvolden, K.A.; Torres, M.E.; Waseda, A.; Didyk, B.M.; Lorenson, T.D. Geochemical Evidence for Gas Hydrate in Sediment near the Chile Triple Junction. Proc. Ocean. Drill. Progr. Sci. Results 1995, 141, 276–286. [Google Scholar]
- Coffin, R.; Pohlman, J.; Gardner, J.; Downer, R.; Wood, W.; Hamdan, L.; Walker, S.; Plummer, R.; Gettrust, J.; Diaz, J. Methane Hydrate Exploration on the Mid Chilean Coast: A Geochemical and Geophysical Survey. J. Pet. Sci. Eng. 2007, 56, 32–41. [Google Scholar] [CrossRef]
- Vargas-Cordero, I.; Tinivella, U.; Accaino, F.; Loreto, M.F.; Fanucci, F. Thermal State and Concentration of Gas Hydrate and Free Gas of Coyhaique, Chilean Margin (44°30′ S). Mar. Pet. Geol. 2010, 27, 1148–1156. [Google Scholar] [CrossRef]
- Vargas-Cordero, I. de la C.; Tinivella, U.; Villar-Muñoz, L.; Giustiniani, M. Gas Hydrate and Free Gas Estimation from Seismic Analysis Offshore Chiloé Island (Chile). Andean Geol. 2016, 43, 263–274. [Google Scholar] [CrossRef]
- Pineda, V.; Contardo, X.; Alfaro, G.; Helle, S. Textural Mineralogical and Geochemical of Sediments of the Beagle Channel and Nassau Bay, XII Magallanes Region, Chile. Cienc. Tecnol. Mar. 2002, 25, 5–21. [Google Scholar]
- Greiner, G. Características y Distribución de Los Placeres Auríferos de Chile. In Empresa Nacional de Minería; ENAMI: Santiago, Chile, 1991. [Google Scholar]
- Portigliati, C. Los Placeres Auríferos de Chile; Servicio Nacional de Geología y Minería: Santiago, Chile, 1999; Volume 99, pp. 1–131.
- Ordoñez, A. Oro Detrítico En La Región de Los Lagos (39–42°): Mecanismos de Transporte y Proveniencia. Serv. Nac. Geol. Min. 2000, 56, 1–40. [Google Scholar]
- Mordojovich, C. Sedimentary Basins of Chilean Pacific Offshore, in Energy Resources of the Pacific Region. Am. Assoc. Pet. Geol. Stud. Geol. 1981, 12, 63–68. [Google Scholar]
- Tsandev, I.; Rabouille, C.; Slomp, C.P.; van Cappellen, P. Shelf Erosion and Submarine River Canyons: Implications for Deep-Sea Oxygenation and Ocean Productivity during Glaciation. Biogeosciences 2010, 7, 1973–1982. [Google Scholar] [CrossRef] [Green Version]
- Townley, B.K.; Palacios, C.M. Ore Deposits and Metallogenesis of Mainland Patagonia, Aysen, Chile. Explor. Min. Geol. 1999, 8, 91–108. [Google Scholar]
- Townley, B.K.; Maksaev, V.J.; Palacios, C.M.; Lahsen, A.A.; Parada, M.A.R. Base and Precious Metals Geochemistry of Rock Units of the Mainland Aysén Region, Chilean Patagonia. J. Geochem. Explor. 2000, 68, 21–46. [Google Scholar] [CrossRef]
- Duhart, P.; Crignola, G.; Ordóñez, B.A.; Muñoz, J. Franjas Metalogénicas En Chiloé Continental (41°–44° S). In Proceedings of the IX Congreso Geológico Chileno, Puerto Varas, Chile, 31 July–4 August 2000; pp. 201–205. [Google Scholar]
- Zapata, R. Estudio Batimétrico Del Margen Chileno. Master’s Thesis, Universidad de Chile, Santiago, Chile, 2001. [Google Scholar]
- Díaz-Naveas, J.; Frutos, J. Geología Marina de Chile; Comité Oceanográfico Nacional de Chile, Pontificia Universidad Católica de Valparaíso, Servicio Nacional de Geología y Minería de Chile: Santiago, Chile, 2010; pp. 60–65.
- Bird, P. An Updated Digital Model of Plate Boundaries. Geochem. Geophys. Geosyst. 2003, 4. [Google Scholar] [CrossRef]
- Herron, E.M.; Hayes, D.E. A Geophysical Study of the Chile Ridge. Earth Planet. Sci. Lett. 1969, 6, 77–83. [Google Scholar] [CrossRef]
- Anma, R.; Armstrong, R.; Danhara, T.; Orihashi, Y.; Iwano, H. Zircon Sensitive High Mass-Resolution Ion Microprobe U-Pb and Fission-Track Ages for Gabbros and Sheeted Dykes of the Taitao Ophiolite, Southern Chile, and Their Tectonic Implications. Isl. Arc 2006, 15, 130–142. [Google Scholar] [CrossRef]
- Larson, R.; Searle, R.; Kleinrock, M.; Schouten, H.; Bird, R.; Naar, D.; Rusby, R.; Hooft, E.; Lasthiotakis, H. Roller-Bearing Tectonic Evolution of the Juan Fernandez Microplate. Nature 1992, 356, 571–576. [Google Scholar] [CrossRef]
- Tebbens, S.F.; Cande, S.C.; Kovacs, L.; Parra, J.C.; LaBrecque, J.L.; Vergara, H. The Chile Ridge: A Tectonic Framework. J. Geophys. Res. B Solid Earth 1997, 102, 12035–12059. [Google Scholar] [CrossRef]
- Richter, A.; Ivins, E.; Lange, H.; Mendoza, L.; Schröder, L.; Hormaechea, J.L.; Casassa, G.; Marderwald, E.; Fritsche, M.; Perdomo, R.; et al. Crustal Deformation across the Southern Patagonian Icefield Observed by GNSS. Earth Planet. Sci. Lett. 2016, 452, 206–215. [Google Scholar] [CrossRef]
- Duhart, P.; Martin, M.; Muñoz, J.; Crignola, P.; McDonough, M. Acerca de La Edad Del Protolito Del Basamento Metamórfico de La Cordillera de La Costa de La Xa Región: Edades Preliminares 207Pb/206Pb En Circones Detríticos. In Proceedings of the VIII Congreso Geológico Chileno, Antofagasta, Chile, 13–17 October 1997; pp. 1267–1270. [Google Scholar]
- Antinao, J.L.; Duhart, P.; Clayton, J.; Elgueta, S.; McDonough, M. Área de Ancud-Maullín, Región de Los Lagos, Escala 1:100.000; Servicio Nacional de Geología y Minería Mapas Geológicos: No. 17; SERNAGEOMIN: Santiago, Chile, 2000.
- Duhart, P.; McDonough, M.; Muñoz, J.; Martin, M.; Villeneuve, M. El Complejo Metamórfico Bahía Mansa En La Cordillera de La Costa Del Centro-Sur de Chile (39°30′–42°00′ S): Geocronología K-Ar, 40Ar/39Ar y U-Pb e Implicancias En La Evolución Del Margen Sur-Occidental de Gondwana. Rev. Geológica De Chile 2001, 28, 179–208. [Google Scholar] [CrossRef]
- Quiroz, D.; Duhart, O.; Crignola, P. Geología Del Área Chonchi-Cucao, Región de Los Lagos, Escala 1:100.000; Carta Geológica de Chile, Serie Geología Básica, No. 86, SERNAGEOMIN: Santiago, Chile, 2004; 31 p. [Google Scholar]
- Pankhurst, R.J.; Weaver, S.D.; Hervé, F.; Larrondo, P. Mesozoic-Cenozoic Evolution of the North Patagonian Batholith in Aysén, Southern Chile. J. Geol. Soc. 1999, 156, 673–694. [Google Scholar] [CrossRef]
- Hervé, F.; Fanning, C.M. Late Triassic Detrital Zircons in Meta-Turbidites of the Chonos Metamorphic Complex, Southern Chile. Rev. Geológica Chile 2001, 28, 91–104. [Google Scholar] [CrossRef]
- Heim, A. Geological Observations in the Patagonian Cordillera (Preliminary Report). Eclogae Geol. Helv. 1940, 33, 25–51. [Google Scholar]
- Niemeyer, H. Geología Regional Del Territorio Comprendido Entre El Lago General Carrera y El Río Chacabuco, Provincia de Aysén. Bachelor’s Thesis, Universidad de Chile, Santiago, Chile, 1975. [Google Scholar]
- Haller, M.; Lapido, O. El Mesozoico de La Cordillera Patagónica Central. Rev. De La Asoc. Geológica Argent. 1980, 35, 230–247. [Google Scholar]
- De la Cruz, R.; Cortés, J. Geología Del Área Oriental de La Hoja Puerto Cisnes, Región de Aysén de General Carlos Ibáñez Del Campo, Escala 1.250.000; Servicio Nacional de Geología y Minería Mapas Geológicos, No. 127; SERNAGEOMIN: Santiago, Chile, 2011.
- Hervé, F.; Pankhurst, R.J.; Fanning, C.M.; Calderón, M.; Yaxley, G.M. The South Patagonian Batholith: 150 My of Granite Magmatism on a Plate Margin. Lithos 2007, 97, 373–394. [Google Scholar] [CrossRef]
- Valenzuela, E. Estratigrafía de La Boca Occidental Del Canal de Chacao, X Región, Chile. In Proceedings of the III Congreso Geológico Chileno, Concepción, Chile, 8–14 November 1982; pp. 343–376. [Google Scholar]
- Hervé, F.; Greene, F.; Pankhurst, R.J. Metamorphosed Fragments of Oceanic Crust in the Upper Paleozoic Chonos Accretionary Complex, Southern Chile. J. South Amwicm Earth Sci. 1994, 7, 263–270. [Google Scholar] [CrossRef]
- Quiroz, D.; Duhart, P. Geología Del Área Quellón-Isla San Pedro, Región de Los Lagos, Escala 1:100.000Servicio Nacional de Geología y Minería Mapas Geológicos, No. 94SERNAGEOMIN: Santiago, Chile, 2006; Volume 94, pp. 1–20.
- Hervé, M. Estudio Geológico de La Falla Liquiñe-Reloncaví En El Área de Liquiñe: Antecedentes de Un Movimiento Transcurrente (Provincia de Valdivia). In Proceedings of the I Congreso Geológico Chileno; Santiago, Chile, 2–7 August 1976; pp. 39–56. [Google Scholar]
- Hervé, F.; Pankhurst, R.J.; Drake, R.; Beck, M.E. Pillow Metabasalts in a Mid-Tertiary Extensional Basin Adjacent to the Liquifie-Ofqui Fault Zone: The Isla Magdalena Area, Aysbn, Chile. J. South Amwicm Earth Sci. 1995, 8, 33–46. [Google Scholar] [CrossRef]
- Cembrano, J.; Hervé, F.; Lavenu, A. The Liquiñe Ofqui Fault Zone: A Long-Lived Intra-Arc Fault System in Southern Chile. Tectonophysics 1996, 259, 55–66. [Google Scholar] [CrossRef]
- Vargas, G.; Rebolledo, S.; Sepúlveda, S.A.; Lahsen, A.; Thiele, R.; Townley, B.; Padilla, C.; Rauld, R.; Herrera, M.J.; Lara, M. Ruptura Sísmica Submarina, Tectónica y Volcanismo Activo a Lo Largo de La Falla Liquiñe-Ofqui e Implicancias Para El Peligro Sísmico En Los Andes Patagónicos. Andean Geol. 2013, 40, 141–171. [Google Scholar] [CrossRef] [Green Version]
- Palacios, C.; Lahsen, A.; Parada, M. Metallogenic Belts in the Chilean Patagonia, between 44° and 48° S. In Proceedings of the International Simposium on Andean Geodynamics, Saint Malo, France, 17–19 September 1996; Volume 9, pp. 691–694. [Google Scholar]
- Brass, G.W.; Raman, C.V. Clay Mineralogy of Sediments from the Bengal Fan. Proc. Ocean Drill. Progr. Sci. Results 1990, 116, 35–41. [Google Scholar]
- Nicolo, M.J.; Dickens, G.R. Data Report: Terrigenous Grain-Size Distributions at Sites 1263 and 1267: Testing the Applicability of Leg 208 Sediments for Eolian Analysis. Proc. Ocean Drill. Progr. Sci. Results 2006, 1–13. [Google Scholar] [CrossRef]
- Folk, R.L. Petrology of Sedimentary Rocks; Hemphill’s Bookstore: Austin, TX, USA, 1974. [Google Scholar]
- Reimann, C.; Filzmoser, P.; Garrett, R.; Dutter, R. Statistical Data Analysis Explained: Applied Environmental Statistics with R; Wiley, J., Ed.; British Library: Chichester, UK, 2008; ISBN 978-0-470-98581-6. [Google Scholar]
- Mann, A.; de Caritat, P.; Sylvester, G. Degree of Geochemical Similarity (DOGS): A Simple Statistical Method to Quantify and Map Affinity between Samples from Multi-Element Geochemical Data Sets. Aust. J. Earth Sci. 2016, 63. [Google Scholar] [CrossRef]
- Taylor, S.R. Abundance of Chemical Elements in the Continental Crust: A New Table. Geochim. Cosmochim. 1964, 28, 1273–1285. [Google Scholar] [CrossRef]
- Andrews-Jones, D. The Application of Geochemical Techniques to Mineral Exploration. Colo. Sch. Mines Miner. Ind. Bull. 1968, 11, 1–31. [Google Scholar]
- Glover, E.D. Characterization of a Marine Birnessite. Am. Mineral. 1977, 62, 278–285. [Google Scholar]
- Lonsdale, P.; Burns, V.M.; Fisk, M. Nodules of Hydrothermal Birnessite in the Caldera of a Young Seamount. J. Geol. 1980, 88, 611–618. [Google Scholar] [CrossRef]
- Stoffers, P.; Glasby, G.P.; Frenzel, G. Comparison of the Characteristics of Manganese Micronodules from the Equatorial and South-West Pacific. Tschermaks Min. Petr. Mitt 1984, 33, 1–23. [Google Scholar] [CrossRef]
- De Carlo, E.H.; Fraley, C.M. Chemistry and mineralogy of ferromanganese deposits from the equatorial Pacific Ocean. In Geology and Offshore Mineral Resources of the Central Pacific Basin; Circum-Pacific Council for Energy and Mineral Resources Earth Science Series; Keating, B.H., Bolton, B.R., Eds.; Springer-Verlag: New York, NY, USA, 1992; Volume 14, pp. 247–260. [Google Scholar]
- Post, J.E. Manganese Oxide Minerals: Crystal Structures and Economic and environmental Significance. Proc. Natl. Acad. Sci. USA 1999, 96, 3447–3454. [Google Scholar] [CrossRef] [Green Version]
- Corliss, J.B.; Lyle, M.; Dymond, J.; Crane, K. The Chemistry of Hydrothermal Mounds near the Galapagos Rift. Earth Planet. Sci. Lett. 1978, 40, 12–24. [Google Scholar] [CrossRef]
- Mukhopadhyay, R.; Ghosh, A.K.; Iyer, S.D. The Indian Ocean Nodule Field, 2nd ed.; Elsevier: Amsterdam, The Netherlands, 2018. [Google Scholar]
- Marienfeld, P.; Marchig, V. Indications of Hydrothermal Activity at the Chile Ridge Spreading Centre. Mar. Geol. 1992, 105, 241–252. [Google Scholar] [CrossRef]
- Banakar, V.K.; Pattan, J.N.; Mudholkar, A.V. Palaeoceanographic Conditions during the Formation of a Ferromanganese Crust from the Afanasiy-Nikitin Seamount, North Central Indian Ocean: Geochemical Evidence. Mar. Geol. 1997, 136, 299–315. [Google Scholar] [CrossRef]
- ISA International Seabed Authority. A Geological Model of Polymetallic Nodule Deposits in the Clarion–Clipperton Fracture Zone; ISA Technical Study; ISA: Kingston, Jamaica, 2010; Volume 6, pp. 1–75.
- Peckmann, J.; Thiel, V. Carbon Cycling at Ancient Methane-Seeps. Chem. Geol. 2004, 205, 443–467. [Google Scholar] [CrossRef]
- Mazzini, A.; Aloisi, G.; Akhmanov, G.G.; Parnell, J.; Cronin, B.T.; Murphy, P. Integrated Petrographic and Geochemical Record of Hydrocarbon Seepage on the Vøring Plateau. J. Geol. Soc. 2005, 162, 815–827. [Google Scholar] [CrossRef]
- Merinero, R. Procesos Mineralógicos y Geoquímicos En Chimeneas Submarinas de Carbonatos Metanógenos Del Golfo de Cádiz: Biogeomarcadores Framboidales de Sulfuros y Oxihidróxidos de Hierro. Ph.D. Thesis, Universidad Complutense de Madrid, Madrid, Spain, 2008. [Google Scholar]
- Buffett, B.; Archer, D. Global Inventory of Methane Clathrate: Sensitivity to Changes in the Deep Ocean. Earth Planet. Sci. Lett. 2004, 227, 185–199. [Google Scholar] [CrossRef]
- Merinero, R.; Lunar, R.; Martínez, J. Carbonatos Metanógenos y Pirita Framboidal Autigénica: Geomarcadores de La Actividad de Organismos Quimiosintéticos En El Golfo de Cádiz. Rev. Soc. Española Miner. 2010, 12, 29–37. [Google Scholar]
- Palacios, C.M.; Bertens, A.; Ruz, L. Polymetallic Skarn Mineralization at El Toqui, Aysén Province, Southern Chile. Zbl. Geol. Palaeontol. 1994, 1, 723–737. [Google Scholar]
- Nagle, F.; Fink, L.K.; Boström, K.; Stipp, J.J. Copper in Pillow Basalts from La Desirade, Lesser Antilles Island Arc. Earth Planet. Sci. Lett. 1973, 19, 193–197. [Google Scholar] [CrossRef]
- Abrajano, T.A.; Pasteris, J.D. Zambales Ophiolite, Philippines, I. Geology and Petrology of the Critical Zone of the Acoje Massif. Tectonophysics 1989, 168, 65–100. [Google Scholar] [CrossRef]
- Puchelt, H.; Prichard, H.; Berner, Z.; Maynard, J. Sulfide Mineralogy, Sulfur Content and Sulfur Isotope Composition of Mafic and Ultramafic Rocks from Leg 147. Proc. Ocean Drill. Progr. Sci. Results 1996, 147, 91–101. [Google Scholar]
- Dekov, V.M.; Rouxel, O.; Asael, D.; Hålenius, U.; Munnik, F. Native Cu from the Oceanic Crust: Isotopic Insights into Native Metal Origin. Chem. Geol. 2013, 359, 136–149. [Google Scholar] [CrossRef] [Green Version]
- Jenkyns, H.C. Sediments and Sedimentary History of the Manihiki Plateau, South Pacific Ocean. Initial Rep. DSDP 1976, 34, 873–890. [Google Scholar]
- Knox, R.W.O. Note on the Occurrence of Native Copper in Tertiary Nannofossil Oozes from the Goban Spur (Hole 550). Initial Rep. DSDP 1985, 80, 851–852. [Google Scholar]
- Marchig, V.; Erzinger, J.; Heinze, P.-M. Sediment in the Black Smoker Area of the East Pacific Rise (18.5° S). Earth Planet. Sci. Lett. 1986, 79, 93–106. [Google Scholar] [CrossRef]
- Dekov, V.M.; Damyanov, Z.K.; Kamenov, G.D.; Bonev, I.K.; Bogdanov, K.B. Native Copper and A-Copper-Zinc in Sediments from the TAG Hydrothermal Field (Mid-Atlantic Ridge, 26° N): Nature and Origin. Mar. Geol. 1999, 161, 229–245. [Google Scholar] [CrossRef]
- Kamran, A.; Schneider, D.; Roddatis, V.; Thiel, V.; Hoppert, M. Formation of Siderite in Microbial Microcosms Derived from a Marine Sediment. Geomicrobiol. J. 2020, 37, 475–485. [Google Scholar] [CrossRef]
- Yang, X.; Zhang, Z.; Santosh, M.; Duan, S.; Liang, T. Anoxic to Suboxic Mesoproterozoic Ocean: Evidence from Iron Isotope and Geochemistry of Siderite in the Banded Iron Formations from North Qilian, NW China. Precambrian Res. 2018, 307, 115–124. [Google Scholar] [CrossRef]
- Ordoñez, A.; Crignola, P. Anomalías Geoquímicas En La Isla de Chiloé, Chile (42–43°30′ S). In Proceedings of the X Congreso Geológico Chileno, Concepción, Chile, 6–10 October 2003. [Google Scholar]


| Analyses | Granulometry (Laser) | Optical MICROSCOPE (>75 μm) | SEM-EDS | XRD (<75 μm) | ICP-ES/MS | Fire Assay |
|---|---|---|---|---|---|---|
| Subsample type | Whole sediment (FBM) | Whole sediment (FBM) | Heavy mineral concentrate (>75 μm) | Whole sediment (FBM) | Whole sediment | Whole sediment |
| Heavy mineral concentrate | Heavy mineral concentrate |
| Sample | Geomorphology | Depth (m) | Lat. S (°) | Lat. S (′) | Long.W (°) | Long.W (′) | Weight (kg) | pH | T° (°C) | Redox (mV) |
|---|---|---|---|---|---|---|---|---|---|---|
| 1 | Continental slope | 1071 | 41.00 | 31.06 | 74.00 | 49.86 | 23.7 | 7.89 | 8.50 | −42.37 |
| 2 | Cucao canyon mouth | 1916 | 42.00 | 30.72 | 75.00 | 31.12 | 15.5 | 7.79 | 7.27 | −131.37 |
| 3 | External continental shelf | 166 | 42.00 | 28.08 | 74.00 | 26.23 | 23.4 | 7.71 | 10.0 | −52.61 |
| 4 | External continental shelf | 239 | 43.00 | 46.50 | 74.00 | 37.08 | 21.5 | 7.57 | 9.17 | −107.67 |
| 5 | External continental shelf | 226 | 44.00 | 25.87 | 75.00 | 18.51 | 7.10 | 7.69 | 8.83 | −31.03 |
| 6 | Simpson canyon bed | 917 | 44.00 | 11.36 | 74.00 | 59.50 | 18.5 | 7.66 | 7.10 | −72.10 |
| 7 | Simpson canyon bed | 1070 | 44.00 | 7.96 | 75.00 | 4.89 | 23.5 | 7.73 | 5.80 | −112.77 |
| 8 | Simpson canyon bed | 1619 | 44.00 | 10.82 | 75.00 | 22.48 | 25.6 | 7.83 | 4.30 | −115.87 |
| 9 | Simpson canyon mouth | 3388 | 44.00 | 13.89 | 75.00 | 50.24 | 32.1 | 7.77 | 7.30 | −55.13 |
| 10 | External continental shelf | 317 | 45.00 | 4.53 | 74.00 | 34.04 | 12.5 | 7.52 | 8.00 | 42.67 |
| 11 | Darwin canyon mouth | 2952 | 44.00 | 45.25 | 75.00 | 44.98 | 31.6 | * | * | * |
| 12 | External continental shelf | 134 | 45.00 | 27.93 | 75.00 | 3.98 | 9.9 | 7.43 | 9.63 | 147.47 |
| 13 | Internal continental shelf | 83 | 45.00 | 22.43 | 73.00 | 37.92 | 30.2 | 7.63 | 10.2 | 186.70 |
| 14 | Internal continental shelf | 273 | 44.00 | 11.81 | 73.00 | 25.24 | 20.3 | 7.56 | 10.03 | −133.20 |
| 15 | Internal continental shelf | 97 | 43.00 | 27.75 | 73.00 | 25.76 | 10.8 | 7.86 | 10.13 | −9.37 |
| 16 | Internal continental shelf | 298 | 41.00 | 59.36 | 73.00 | 14.13 | 20.8 | 7.46 | 10.50 | −80.53 |
| Samples | Depth (m) | Gravel (%) | Sand (%) | Silt (%) | Clay (%) | Textural Classification | Granulometric Classification |
|---|---|---|---|---|---|---|---|
| 01 | 1071 | 0.0001 | 29.3 | 61.0 | 9.7 | Sandy Mud | Sandy Silt |
| 02 | 1916 | 0 | 3.2 | 86.2 | 10.6 | Mud | Silt |
| 03 | 166 | 0 | 44.2 | 52.2 | 3.7 | Sandy Mud | Sandy Silt |
| 04 | 239 | 0 | 50.1 | 44.7 | 5.2 | Muddy Sand | Silty Sand |
| 05 | 226 | 0 | 74.5 | 22.6 | 3.0 | Muddy Sand | Silty Sand |
| 06 | 917 | 0 | 24.9 | 65.8 | 9.3 | Sandy Mud | Sandy Silt |
| 07 | 1070 | 0 | 6.7 | 80.2 | 13.0 | Mud | Silt |
| 08 | 1619 | 0 | 13.3 | 75.8 | 11.0 | Sandy Mud | Sandy Silt |
| 09 | 3388 | 0 | 26.8 | 62.3 | 10.9 | Sandy Mud | Sandy Silt |
| 10 | 317 | 0 | 57.5 | 38.5 | 4.1 | Muddy Sand | Silty Sand |
| 11 | 2952 | 0 | 19.2 | 70.6 | 10.2 | Sandy Mud | Sandy Silt |
| 12 | 134 | 0 | 87.5 | 10.9 | 1.6 | Muddy Sand | Silty Sand |
| 13 | 83 | 0.00001 | 91.6 | 6.6 | 1.8 | Sand | Sand |
| 14 | 273 | 0 | 3.0 | 81.9 | 15.2 | Mud | Silt |
| 15 | 97 | 0.01 | 90.8 | 8.2 | 1.0 | Sand | Sand |
| 16 | 298 | 0 | 12.1 | 74.6 | 13.3 | Sandy Mud | Sandy Silt |
| Sample | 1 | 2 | 3 | 4 | 5 | 6 | 7 | 8 | 9 | 10 | 11 | 12 | 13 | 14 | 15 | 16 |
|---|---|---|---|---|---|---|---|---|---|---|---|---|---|---|---|---|
| Quartz | 16.3 | 16.2 | 34.6 | 27.5 | 28.5 | 15.8 | 23.1 | 17.4 | 21.2 | 40.5 | 24.6 | 27.1 | 20.1 | 15.4 | 16.8 | 10.0 |
| Albite | 16.5 | 21.3 | 30.5 | 24.6 | 22.7 | 25.6 | 1.2 | 27.7 | 8.8 | 18.2 | 22.7 | 35.1 | 23.7 | 24.7 | 23.9 | 15.7 |
| Andesine | 20.4 | 11.1 | 15.8 | 9.9 | 13.6 | 12.4 | 21.7 | 7.4 | 21.5 | 11.0 | 11.7 | 14.0 | 12.7 | 17.7 | 17.9 | 10.2 |
| Anorthite | 6.9 | 15.9 | D | 18.9 | D | 5.0 | 18.7 | 13.8 | 6.4 | 6.4 | D | 5.5 | 12.8 | D | 13.5 | 13.6 |
| K-feldspar | 5.1 | 6.0 | D | D | 8.3 | 8.9 | 6.0 | 9.5 | 5.2 | 9.8 | D | D | 10.0 | 6.4 | 7.1 | 12.3 |
| Muscovite | D | D | D | D | D | D | D | 6.1 | D | D | D | D | D | D | D | D |
| Biotite | D | D | D | D | D | D | D | D | D | D | D | D | D | D | D | D |
| Chlorite | ---- | ---- | D | ---- | ---- | ---- | ---- | D | ---- | ---- | ---- | ---- | ---- | ---- | ---- | D |
| Montmorill. | D | D | D | D | D | D | D | ---- | D | D | D | D | ---- | D | D | D |
| Hornblende | D | D | D | D | 7.5 | 9.3 | D | D | 5.7 | ---- | D | 6.8 | D | D | D | 8.1 |
| Actinolite | D | D | D | D | D | D | D | D | D | D | D | D | D | D | D | D |
| Pyroxene | 6.9 | 10.6 | D | D | D | D | 7.5 | D | 13.0 | 7.3 | 6.8 | D | 6.1 | 10.4 | D | 8.7 |
| Epidote | 7.0 | D | ---- | ---- | ---- | 6.5 | 5.3 | D | ---- | ---- | 6.4 | ---- | D | 7.4 | D | 10.7 |
| Cordierite | D | D | ---- | D | D | D | D | D | D | D | D | D | D | D | D | D |
| Titanite | 9.8 | D | D | 6.7 | 5.1 | 5.3 | 3.8 | D | D | D | D | D | D | D | D | D |
| Apatite | D | D | ---- | ---- | D | D | D | D | ---- | ---- | D | ---- | D | D | D | D |
| Zircon | D | D | ---- | ---- | ---- | D | D | D | D | ---- | ---- | ---- | ---- | D | D | D |
| Rutile | ---- | D | ---- | D | ---- | D | ---- | ---- | ---- | ---- | ---- | ---- | ---- | ---- | ---- | ---- |
| Birnessite | D | D | D | D | D | D | D | D | D | D | D | D | ---- | D | ---- | D |
| Sample | 3 | 5 | 8 | 9 | 10 | 11 | 12 | 13 |
|---|---|---|---|---|---|---|---|---|
| Pyroxene | 67.3 | 18.2 | 20.1 | 36.2 | 25.9 | 28.5 | 33.3 | 26.8 |
| Hornblende | D | 37.7 | 33.9 | 6.8 | 21.2 | 38.4 | 12.3 | 28.8 |
| Actinolite | 8.0 | 6.4 | 12.5 | 27.3 | 6.4 | 5.4 | 8.9 | D |
| Biotite | D | D | D | ---- | D | ---- | ---- | ---- |
| Olivine | ---- | ---- | ---- | D | D | D | 5.6 | ---- |
| Epidote | 5.1 | 20.3 | 16.3 | 5.6 | 21.4 | 9.2 | 18 | 15.6 |
| Garnet | D | D | ---- | D | D | D | D | ---- |
| Titanite | D | 6.3 | D | D | 9.8 | D | D | 7.1 |
| Apatite | D | 7.9 | ---- | 5.1 | D | D | D | ---- |
| Zircon | D | D | D | D | D | D | D | D |
| Rutile | ---- | D | ---- | D | D | D | D | D |
| Birnessite | D | D | D | D | D | D | D | ---- |
| Tellurobismuthite | D | D | D | D | D | D | D | D |
| Dolomite | D | D | D | D | D | D | D | D |
| Siderite | D | D | D | D | D | D | D | 5.4 |
| Rhodochrosite | D | D | D | D | D | D | D | D |
| Hematite | ---- | ---- | ---- | ---- | ---- | D | D | ---- |
| Goethite | ---- | ---- | D | ---- | D | ---- | D | ---- |
| Ilmenite | ---- | ---- | ---- | D | D | D | D | D |
| Pyrite | ---- | ---- | ---- | D | ---- | D | D | ---- |
| Chalcopyrite | D | ---- | ---- | ---- | ---- | D | D | ---- |
| Tennantite | D | D | D | D | D | D | D | D |
| Sphalerite | D | D | D | 6.4 | D | D | D | D |
| Tenorite | ---- | D | D | D | D | D | D | ---- |
| Enargite | ---- | ---- | ---- | ---- | ---- | ---- | D | ---- |
| Elements | Minimum | Maximum | Mean Value (m) | Standard Deviation (σ) | Standard Deviation of Mean (σm) | Threshold (m + 2 × σm) | Continental Crust Abundances | Pelagic Sediments Abundances |
|---|---|---|---|---|---|---|---|---|
| Al (wt.%) | 6.58 | 8.27 | 7.47 | 0.44 | 0.11 | 7.69 | 8.23 | 8.4 |
| As (ppm) | 2.5 | 17 | 8.1 | 4.12 | 1.0 | 10.1 | 1.8 | 20 |
| Au (ppb) | 3 | 7 | 4.9 | 1.22 | 0.3 | 5.5 | 4 | 2 |
| Ba (ppm) | 217 | 525 | 326 | 96.55 | 24.1 | 374 | 425 | 2300 |
| Ca (wt.%) | 2.37 | 8.29 | 4.31 | 1.39 | 0.3 | 5.01 | 4.15 | 1 |
| Ce (ppm) | 28 | 38 | 32.8 | 3.04 | 0.8 | 34.3 | 60 | 101 |
| Co (ppm) | 7 | 25 | 14.4 | 3.72 | 0.9 | 16.2 | 25 | 74 |
| Cr (ppm) | 34 | 91 | 57.0 | 14.61 | 3.7 | 64.3 | 100 | 90 |
| Cu (ppm) | 7.6 | 51.9 | 32.4 | 13.94 | 3.5 | 39.4 | 55 | 250 |
| Fe (wt.%) | 3.12 | 7.03 | 4.91 | 1.05 | 0.3 | 5.44 | 5.63 | 6.5 |
| Hf (ppm) | 1.1 | 2.6 | 1.8 | 0.42 | 0.1 | 2.0 | 3 | 4.1 |
| K (wt.%) | 0.96 | 1.74 | 1.31 | 0.21 | 0.1 | 1.42 | 2.09 | 2.5 |
| La (ppm) | 13.3 | 18.6 | 15.8 | 1.77 | 0.4 | 16.7 | 30 | 42 |
| Li (ppm) | 10.7 | 32.6 | 24.2 | 6.73 | 1.7 | 27.6 | 20 | 57 |
| Mg (wt.%) | 0.91 | 2.58 | 1.61 | 0.35 | 0.1 | 1.79 | 2.33 | 2.1 |
| Mn (ppm) | 507 | 1112 | 728 | 122.13 | 30.5 | 789 | 950 | 6700 |
| Mo (ppm) | 0.25 | 2.4 | 1.0 | 0.58 | 0.1 | 1.3 | 1.5 | 27 |
| Na (wt.%) | 2.55 | 3.25 | 2.91 | 0.24 | 0.1 | 3.03 | 2.36 | 2.8 |
| Nb (ppm) | 3 | 5.7 | 4.7 | 0.64 | 0.2 | 5.0 | 20 | 14 |
| Ni (ppm) | 12.6 | 40.1 | 27.1 | 7.64 | 1.9 | 30.9 | 75 | 230 |
| P (wt.%) | 0.07 | 0.11 | 0.09 | 0.01 | 0.003 | 0.098 | 0.105 | 0.15 |
| Pb (ppm) | 8.9 | 14.1 | 11.2 | 1.51 | 0.4 | 11.9 | 12.5 | 80 |
| Rb (ppm) | 29 | 62.1 | 44.5 | 8.53 | 2.1 | 48.7 | 90 | 110 |
| S (wt.%) | 0.025 | 0.45 | 0.19 | 0.12 | 0.0 | 0.25 | 0.026 | 0.2 |
| Sc (ppm) | 11 | 21 | 16.9 | 2.63 | 0.7 | 18.2 | 22 | 19 |
| Sn (ppm) | 0.25 | 1.4 | 1.0 | 0.34 | 0.1 | 1.1 | 2 | 4 |
| Sr (ppm) | 241 | 574 | 336 | 71.98 | 18.0 | 372 | 375 | 180 |
| Th (ppm) | 3.5 | 7.3 | 5.0 | 0.95 | 0.2 | 5.5 | 9.6 | 13 |
| Ti (wt.%) | 0.327 | 0.539 | 0.464 | 0.05 | 0.0 | 0.491 | 0.57 | 0.46 |
| U (ppm) | 0.8 | 4.1 | 1.9 | 0.89 | 0.2 | 2.3 | 2.7 | 2.6 |
| V (ppm) | 77 | 168 | 134 | 20.84 | 5.2 | 144 | 135 | 120 |
| W (ppm) | 0.25 | 0.8 | 0.6 | 0.17 | 0.0 | 0.7 | 1.5 | 4 |
| Y (ppm) | 13.4 | 21.5 | 17.8 | 2.13 | 0.5 | 18.9 | 33 | 40 |
| Zn (ppm) | 49 | 138 | 87 | 28.79 | 7.2 | 101 | 70 | 170 |
| Zr (ppm) | 36.3 | 80.8 | 60.7 | 13.77 | 3.4 | 67.6 | 165 | 150 |
| Elemental Associations |
|---|
| Ca-Co-Mg-Sc-Sr-Ti-V |
| Co-Mn-Ni-Sc-Ti-Zr-Co-Mg-V |
| Cr-Hf-Sc-Ti-Y |
| Cu-Sn-Zn |
| Fe-Sc-Ti-V |
| Hf-Ni-Sc-Sn-Ti-U-V-Y-Zr |
| Li-Mo-S-Sn-U-Zn |
| Mg-Mn-Ni-Sc-Ti-Zr-V |
| Nb-Th-Y |
| Sn-Ti-U-V-Y-Zr |
| Correlation | Ore Deposit, Mineral, and Rock |
|---|---|
| Zn-Cu | Skarn and epithermal deposits |
| Cu-Mo | Porphyry Cu-Mo deposits |
| Ti-V-Sc | Mafic rocks |
| Mn-Ti-V | Epidote |
| Sn-Zr-Hf-U-Ti | Granitic rocks and zircon |
| Ti-Mn-Ni-V | Amphiboles and pyroxenes |
| Ti-Ca-V-Sr-Co | Biotite |
| Ti-Al-Cr-V | Magnetite |
| Mn-Co-Ni-V | Mn oxides |
Publisher’s Note: MDPI stays neutral with regard to jurisdictional claims in published maps and institutional affiliations. |
© 2021 by the authors. Licensee MDPI, Basel, Switzerland. This article is an open access article distributed under the terms and conditions of the Creative Commons Attribution (CC BY) license (https://creativecommons.org/licenses/by/4.0/).
Share and Cite
Pérez, M.; García, M.; Townley, B.; Deckart, K. Mineralogy and Geochemistry of Seabed Sediments of the Chiloé–Taitao Area, Southern Chile, and Implications for Ore Deposits. Minerals 2021, 11, 903. https://doi.org/10.3390/min11080903
Pérez M, García M, Townley B, Deckart K. Mineralogy and Geochemistry of Seabed Sediments of the Chiloé–Taitao Area, Southern Chile, and Implications for Ore Deposits. Minerals. 2021; 11(8):903. https://doi.org/10.3390/min11080903
Chicago/Turabian StylePérez, Marisol, Marcelo García, Brian Townley, and Katja Deckart. 2021. "Mineralogy and Geochemistry of Seabed Sediments of the Chiloé–Taitao Area, Southern Chile, and Implications for Ore Deposits" Minerals 11, no. 8: 903. https://doi.org/10.3390/min11080903