Article

Evaluation of Dispersion of Lead-Bearing Mine Wastes in Kabwe District, Zambia

1
Division of Sustainable Resources Engineering, Graduate School of Engineering, Hokkaido University, Sapporo 060-8628, Japan
2
International Cooperation Department, Japan Space Systems, Tokyo 105-0011, Japan
3
Division of Sustainable Resources Engineering, Faculty of Engineering, Hokkaido University, Sapporo 060-8628, Japan
4
Research Faculty of Agriculture, Hokkaido University, Sapporo 060-8589, Japan
5
IWRM Centre/Geology Department, School of Mines, The University of Zambia, Lusaka 32379, Zambia
6
Faculty of Veterinary Medicine, Hokkaido University, Kita 18, Nishi 9, Kita-ku, Sapporo 060-0818, Japan
*
Author to whom correspondence should be addressed.
Minerals 2021, 11(8), 901; https://doi.org/10.3390/min11080901
Submission received: 13 July 2021 / Revised: 15 August 2021 / Accepted: 17 August 2021 / Published: 20 August 2021
(This article belongs to the Section Environmental Mineralogy and Biogeochemistry)

Abstract

:
Dispersion of lead (Pb) in mine wastes was simulated for reproducing Pb contamination of soil in Kabwe District, Zambia. Local weather data of year 2019 were monitored in situ and used for the simulations. The plume model, weak puff model, and no puff model were adopted for calculation of Pb dispersion under different wind conditions. The results showed that Pb dispersion from the Kabwe mine was directly affected by wind directions and speeds in the dry season, although it was not appreciably affected in the rainy season. This may be because the source strength is lower in the rainy season due to higher water content of the surface. This indicates that Pb dispersion patterns depend on the season. In addition, the distribution of the amount of deposited Pb-bearing soils around the mine corresponded to the distribution of Pb contents in soils. These results suggest that Pb contamination in soils primarily results from dispersion of fine mine wastes.

1. Introduction

Heavy metals and metalloids from mining and smelting activities have huge impacts on environmental pollution [1,2]. Environmental as well as human health issues are increased by heavy metal contaminations from such activities [3]. The impacts of the pollution appear for the workers of mine companies and people living around the mines through incidental dust ingestion and inhalation [4]. In particular, soil pollution by heavy metals from mine areas in arid countries is one of the serious issues to be solved.
Mining is the key industry in Zambia. Mineral resources, such as lead (Pb), zinc (Zn), cobalt (Co) and copper (Cu) had been mined and smelted for over 90 years between 1902 and 1994 in Kabwe, Zambia [5]. Unrefined mining wastes have been dumped at the mine like a hill, and they have been exposed to the environment until today. For this reason, Kabwe was ranked as one of the worst polluted areas in the world [6]. The dumping site in Kabwe is thought to be the source of contamination, and the waste is dispersed by winds around the mine. Thus, the heavy metals contained in the wastes directly induce environmental and health problems. Nakayama et al. [7] indicated that soil samples from roadsides in Kabwe had higher concentrations of Pb than benchmark values. Results of spectral measurements and satellite data around the dumping site indicated high Pb contents (>1000 mg/kg as total) in the soils within 2 km from the site [8]. The mean blood Pb levels of the population in Kabwe were estimated at 11.9 µg/dL (11.6–12.1 µg/dL) by blood sampling from volunteers with backgrounds with geographic, demographic, and socioeconomic information [9]. Moreover, Pb contamination has influenced children’s health: about 50% of children took in an intolerable daily intake [10]. For mitigation and remediation of this environmental issue, immobilization techniques by dolomite, calcined dolomite, and magnesium oxide were performed [11], and concurrent dissolution and cementation methods were proposed [12]. Although Pb contamination and its impacts on the environment and human health have been unveiled and mitigated by multilateral approaches in Kabwe, the mechanisms of heavy metal dispersion from the mine are not quantitatively evaluated.
The purpose of this study is to understand Pb dispersion mechanism and to quantify Pb contamination of soil in Kabwe, Zambia by simulating dispersion of Pb contained in the mine wastes with local weather data of year 2019, and then comparing the simulated results with measured Pb content in soils. Lead was selected as a target material for the simulation because Pb seriously affects the health of children in Kabwe and the solubility of Pb is lower than the other heavy metals like Zn and Cu. Mufalo et al. [13] characterized surface soils at eight playgrounds in Kabwe, and the measured results were compared with the simulated results of Pb dispersion in this study to verify the simulation model.

2. Materials and Methods
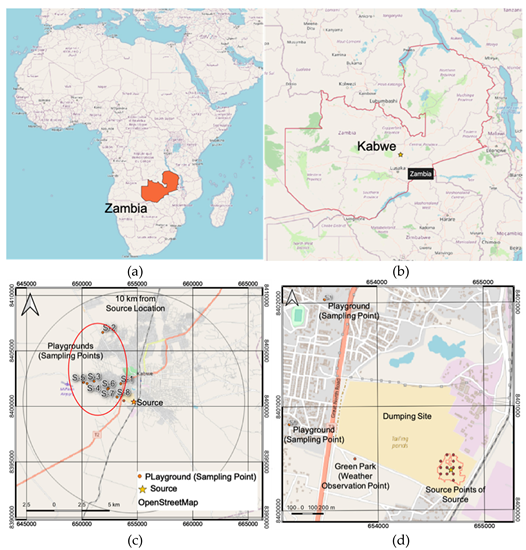
2.1. Study Site

A dumping site of Pb-Zn mine wastes in Kabwe, Zambia (Figure 1) was selected as the source of contaminants for simulating Pb dispersion because the wastes are stacked as a small hill, named Black Mountain, and causes fine waste particles to be swirled up by winds [14]. The height of the source was estimated at the same height of the slag hill, and it was calculated with shuttle radar topography model (SRTM) with 30 m spatial resolution. Although a single point, such as the location of a chimney in industrial factories, was used for the simulation [15], the source was adopted as a bundle of point sources in this study. The area of the source was estimated at 46,110 m2. Twelve points were selected as Pb source in the mine based on the topographical condition. Pb dispersion was calculated and compared with the results of Pb content in surrounding surface soils. The collected soils were located in the northwest of the dumping site by considering the wind direction.

2.2. Lead Dispersion Simulation Models

Dispersion of soils and mine wastes depends on particle size. Mufalo et al. [13] measured the particle size distribution of collected soils and Zn leaching residue, and they showed that 50% of the collected soils had a diameter less than 50 µm. On the other hand, the dumping site that is the source of Pb dispersion simulation is covered by slags. The slag samples located at Black Mountain were also collected, and the particle size of the slags was measured. The results showed that 6% of the slag was less than 150 µm. Figure 2 shows the particle size distribution of the slag. Sieves with different pore sizes were used for the particles larger than 0.15 mm whereas the particle size less than 0.15 mm was measured by the particle size analyzer based on laser diffraction. Siciliano et al. [16] suggest that slags less than 45 µm have risks of oral bioaccessibility in human beings. The particle size less than 10 µm is regarded as an air pollution source and the formula of dispersion depends on wind speed [17,18]. Thus, the target particle sizes of soils/mine wastes were classified into 10, 15, 20, 25, 30, 35, 40, 45, and 50 µm.
Three models of Pb dispersion and a model of redispersion, depending on wind directions and speeds, were constructed in this study. The plume model was used in the case of wind speed over 1.0 m/s. The weak puff model was used in the case of wind speed lower than 1.0 m/s and higher than 0.4 m/s. The no puff model was used in the case of wind speed lower than 0.4 m/s [19,20,21,22]. The models are expressed by the following equations.
Plume model:
C = Q 2 π ( π / 8 ) R σ z u { e x p [ ( z H e ) 2 σ z 2 2 ] + e x p [ ( z + H e ) 2 σ z 2 2 ] } ,
where,
C: Concentration (mg/m2)
Q: Source strength (estimated at 0.025 m3/s and 0.0025 m3/s for the dry and rainy seasons, respectively)
R: Distance from source (= (x2 + y2 + z2)1/2)
x: Downwind distance along wind direction (m)
y: Horizontal distance perpendicular to x (m)
z: Elevation at simulating point (m)
σz: Diffusion width (m)
u: Wind speed (m/s)
He: Elevation of source (m)
Weak puff model:
C = Q 2 π ( π / 8 ) γ { 1 η 2 e x p [ u 2 ( z H e ) 2 2 α 2 η 2 ] + 1 η + 2 e x p [ u 2 ( z + H e ) 2 2 α 2 η + 2 ] } ,
In this equation
η2 = x2 + y2 + (α2/γ2) × (zHe)2
η+2 = x2 + y2 + (α2/γ2) × (z + He)2
where
α: Dispersivity with respect to horizontal direction
γ: Dispersivity with respect to vertical direction
No puff model:
C = Q 2 π ( π / 8 ) R γ { 1 η 2 + 1 η + 2 } ,
R = (x2 + y2)1/2.
η2 = x2 + y2 + (α2/γ2) × (zHe)2.
η+2 = x2 + y2 + (α2/γ2) × (z + He)2.
The source strength (Q) is a key parameter to simulate Pb dispersion and redispersion. Here, a total of 1 m3 of the slag per one second was assumed to be dispersed. However, only finer particles (<50 µm) are transported to a further distance. Thus, the finer fraction of 2.5% of the slag was assumed to be dispersed (0.025 m3/s) as a source strength for the dry season. Rain is another factor to restrain soil dispersion by winds. For the rainy season, the source strength of Pb dispersion by each model was set at 0.0025 m3/s, 1/10 of the value of the dry season, because the higher water content of the surface restricts the dispersion.
The dispersion of the slag with less than 50 µm was simulated every hour, and the accumulated amount of precipitated slag with Pb was calculated by considering the particle sizes and weather conditions. The amounts of deposition of slag depending on the particle size at each playground were summed up in the rainy and dry seasons in 2019 and throughout the year 2019.
Redispersion is related to particle sizes of soils and slags and wind speed at the deposited locations. Target particle sizes were between 10 µm and 50 µm in this study. So, these particle sizes are similar to the size of cedar pollen (mean diameter: 30 µm). Nakatani and Nakane [23] developed and simulated pollen retransport behavior. By applying the following model, particles of soils and slags on the ground have five forces: gravity, static friction force, drag force, Saffman lift force, and adhesion force. The particles are able to be retransported when the drag force is larger than the friction force and Saffman lift force is larger than the gravity plus vertical adhesion forces. Therefore, redispersion at the deposited locations was calculated by Equation (4).
Redispersion:
R = P R × C 1 × [ F D F f + F s g ] ,
where,
R: Redispersion (mg)
PR: Percentage of redispersion
C1: Amount of dispersed soils/mine wastes (mg/m2)
FD: Drag force (=  1 2 ρ a u 2 C D π d 2 4 )
ρa: Fluid density (1.2250 kg/m3, standard atmospheric density)
u: Wind speed (m/s)
CD: Drag coefficient (= 0.6, particle was estimated at elliptical pillar)
d: Particle size (µm)
Ff: Friction force (= μ × N)
µ: Friction coefficient (estimated at 0.52)
N: Normal force (= density of slag (3.45, the average values between 3.3 and 3.6) × volume of particle)
FS: Saffman lift (= 6.46 × ( d 2 ) 2 u ρ a μ )
g: Gravity (= density of slag (3.45, the average values between 3.3 and 3.6) × volume of particle)
Value of drag coefficient (CD) for estimating drag force for the redispersion calculation depends on the shape of the particle. The target soils and slags have various shapes: sphere, angled cube, cylinder, etc. Here, a spheroid shape with the value of 0.6 between sphere and angled cube was selected.
At the playgrounds, various particle sizes and minerals of soils are mixed, and various conditions, such as human activities and weather, change every moment throughout the year. By referring to the previous studies [24,25], the friction coefficient (µ) was set at 0.52 with considerations of the environmental conditions under which soils were easily swirled and dispersed Pb-bearing soils were redispersed by winds and flushed by rains after depositing immediately.

2.3. Weather Data Collection

Weather information for year 2019 was used to simulate Pb dispersion at and around the mine because all required data were collected in situ or in Lusaka. The weather information consists of six items as Pb dispersion parameters: wind direction, wind speed, solar radiation, barometric pressure, humidity, and air temperature [26]. However, due to machine troubles and errors of the data collection system, the data of August 2019 were not collected.
Wind direction and wind speed were collected at Green Park, which is located at the southwest of the mine about 900 m away from the source, and it was prepared for monitoring heavy metals absorbed by plants (Figure 1). In addition, a small-sized meteorological instrument named POTEKA (Meisei Electric Co., Ltd., Tokyo, Japan) collected hourly data. Thus, wind speed and direction data have been monitored at Green Park.
Solar radiation, barometric pressure, humidity, and air temperature data were collected at the test site of the University of Zambia, Lusaka. Although Lusaka, the capital city of Zambia, is about 100 km south of Kabwe, the measured solar radiation, barometric pressure, humidity, and air temperature were collected and applied to the simulation. Thus, the weather data obtained at the two cities were used for simulation.
Values of wind speed and direction were used as parameters of Pb dispersion and redispersion simulation directly. Solar radiation, barometric pressure, humidity, and air temperature were used to determine coefficients of horizontal and vertical dispersivities for the plume, weak puff, and no puff models.

2.4. Comparison with Field Survey Results

Results of Pb dispersion simulations were compared with results of measured Pb contents by Mufalo et al. [13] (Table 1). They collected samples at eight playgrounds within 10 km radius from the dumping site. They took topsoil samples (5 cm depth) by mixing 3–4 soils for each sample and analyzing the total contents of Pb in the soils. Their data are appropriate for comparison with the simulated deposition of Pb because the playground is not influenced by change in land use.

3. Results

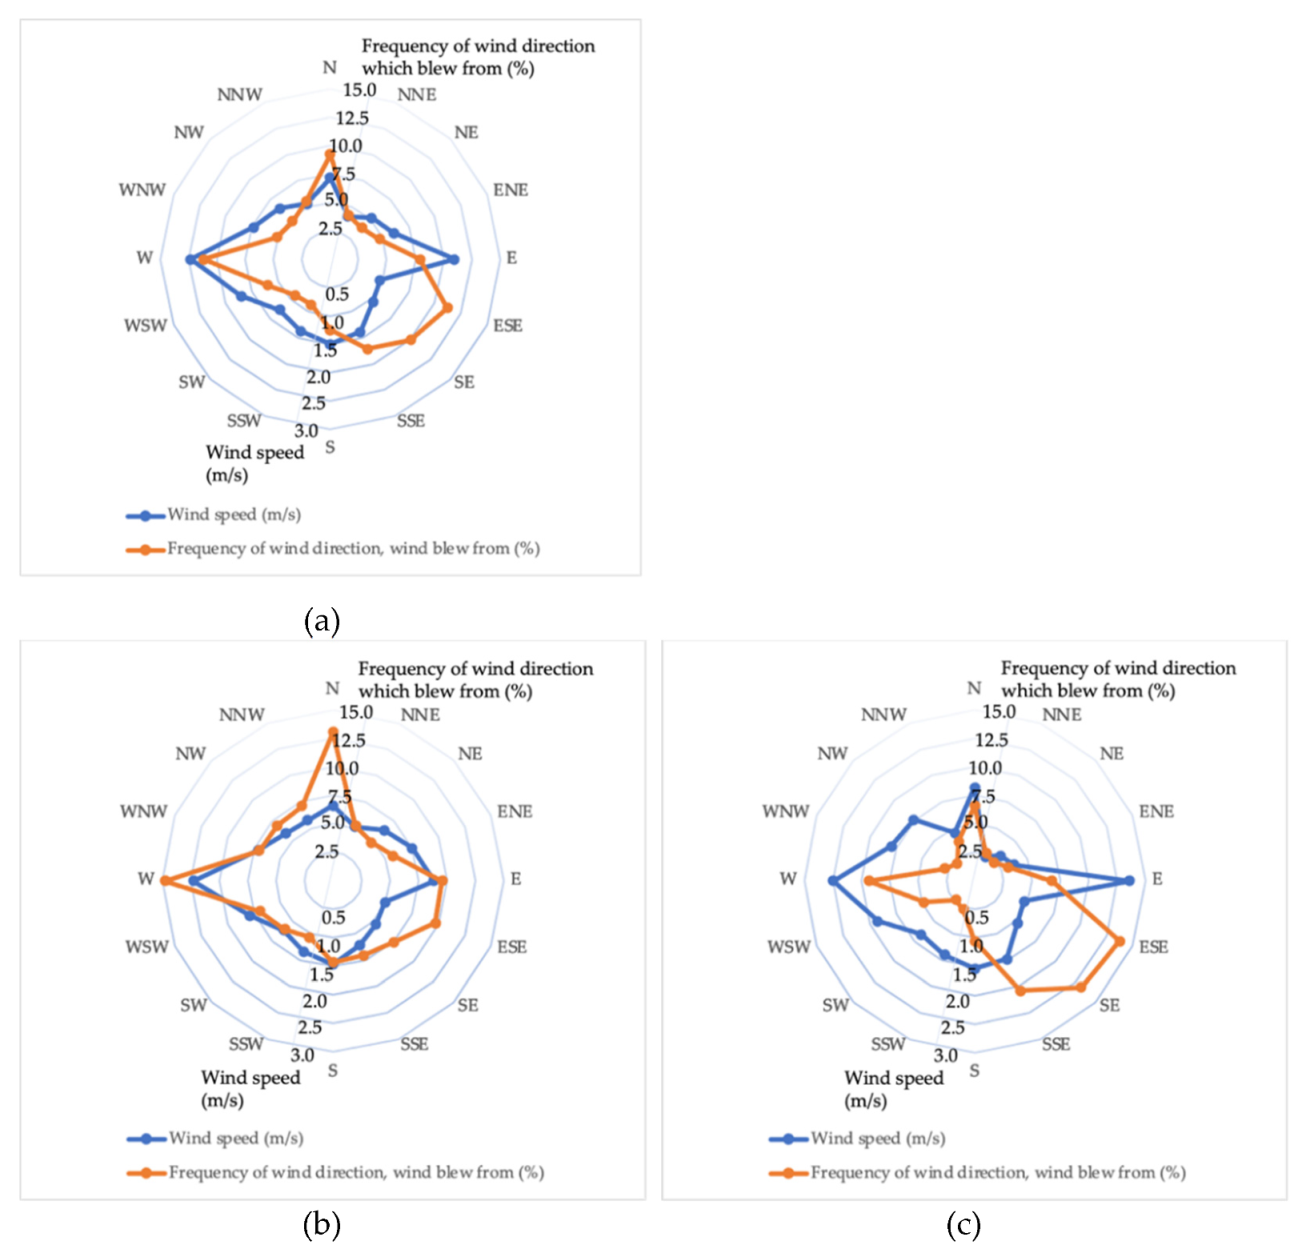
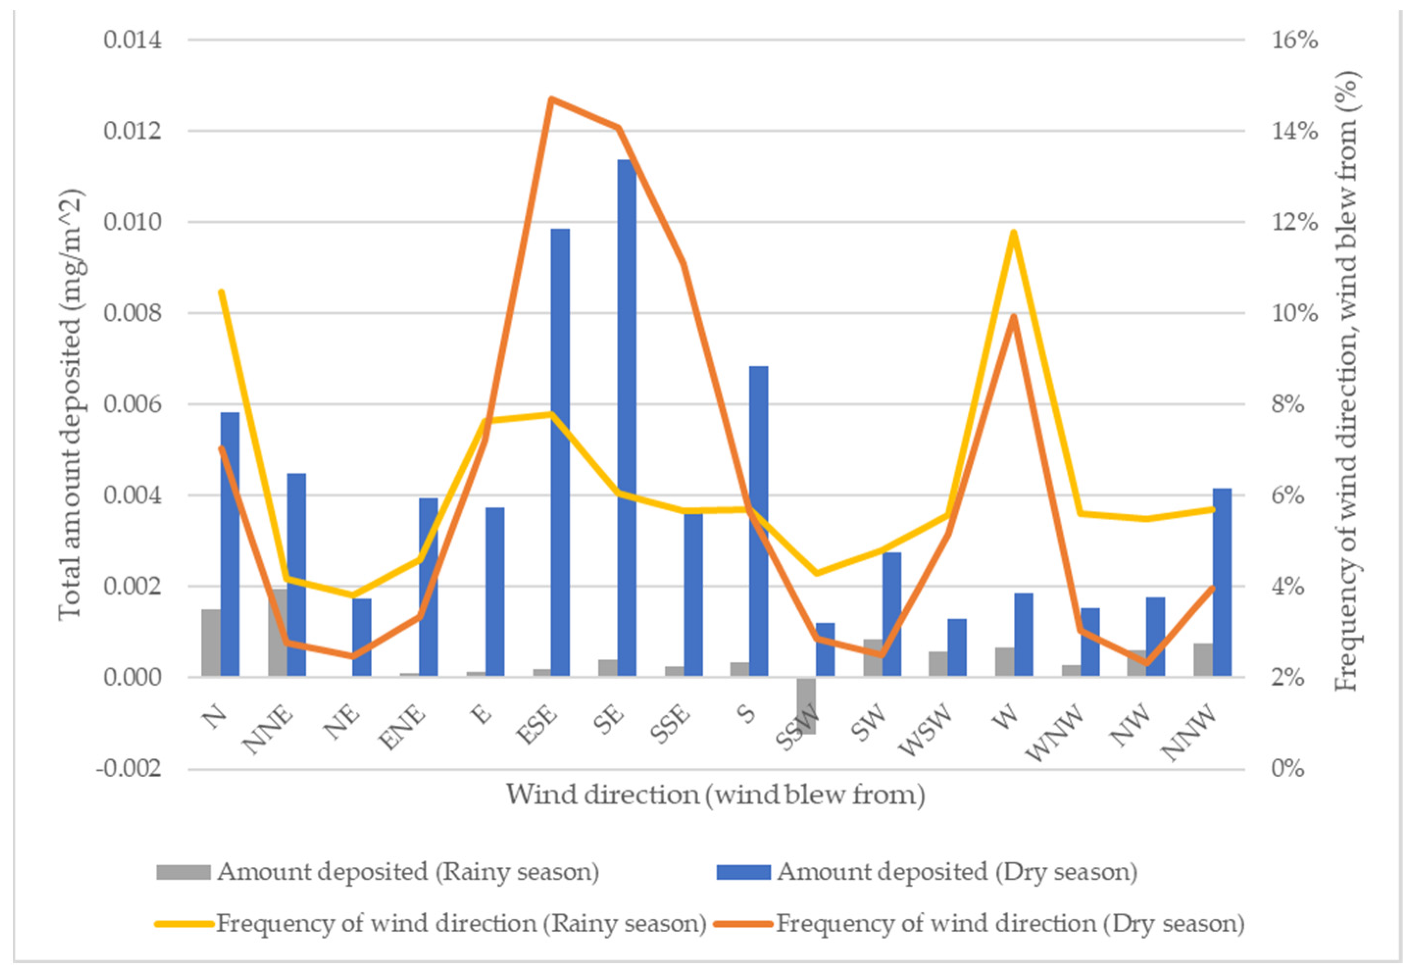
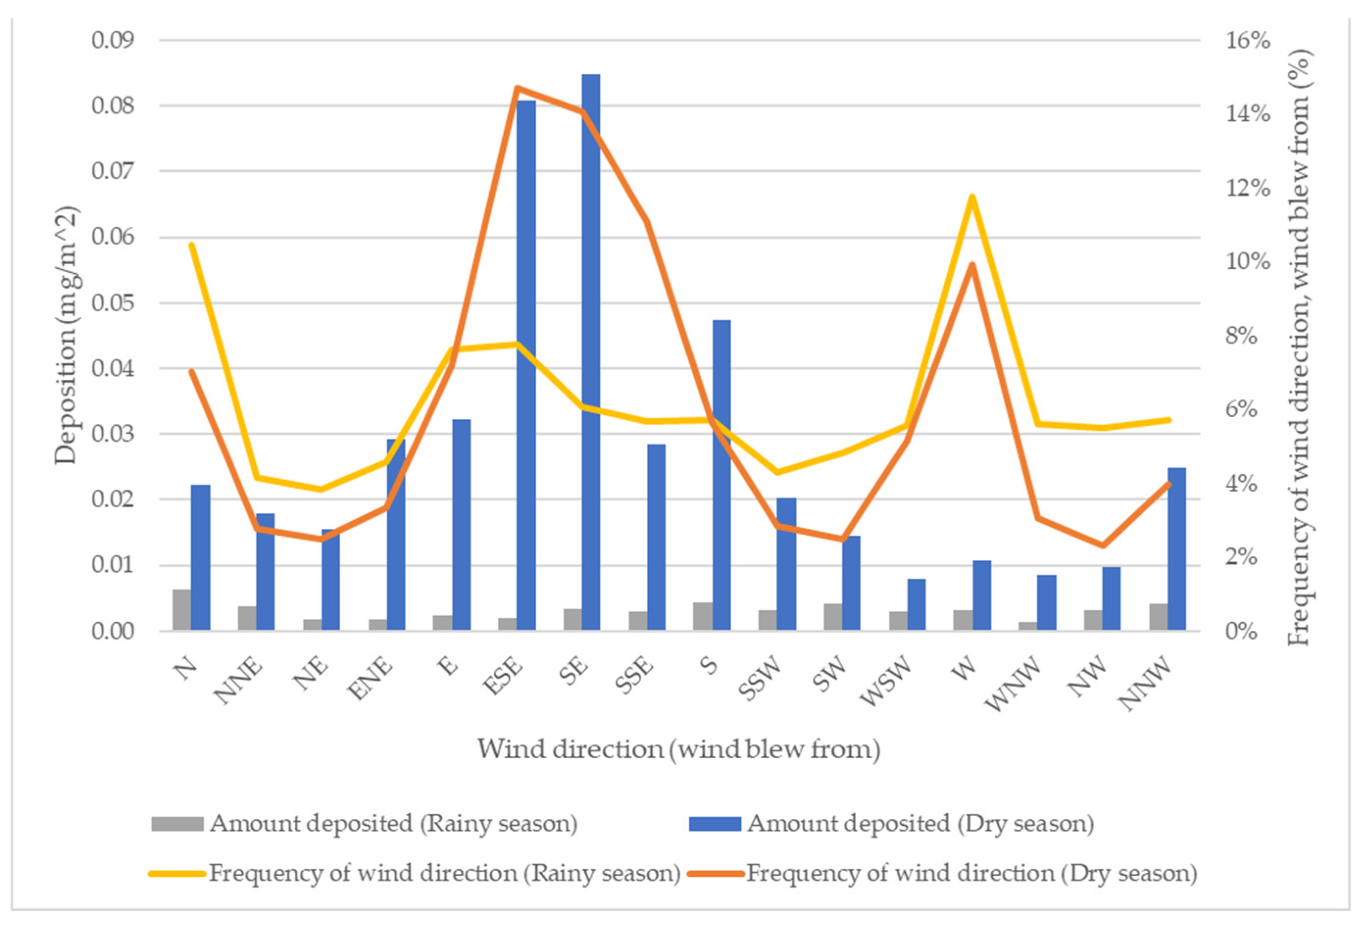
3.1. Results of Weather Data Collection

Weather condition sensitively affects Pb dispersion. Winds in Kabwe tended to blow from the east-southeast side (annual frequency was 10.95%) (Figure 3). The frequency of wind from the west was 10.94%, and from the southeast was 9.78% throughout the year of 2019. On the other hand, the wind speed was 2.47 m/s from the west whereas 2.19 m/s and 1.50 m/s of winds blew from the east and the south, respectively. The annual average of solar radiation was 0.20 kW/m2, the annual average of barometric pressure was 874.99 hPa, the annual average of humidity was 58.07%, and the annual average of temperature was 21.83 °C.
During the rainy season (January to April and November to December) in Kabwe, the frequent wind directions were from the west (11.79%), the north (10.45%), and the east-southeast (7.78%). Strong winds came from the west (2.45 m/s), the east (1.77 m/s), and the west-southwest (1.59 m/s). The average of solar radiation was 0.22 kW/m2, the average of barometric pressure was 872.62 hPa, the average of humidity was 68.65%, and the average of temperature was 23.08 °C.
During the dry season (May to October, August not included) in Kabwe, the frequent wind directions were from the east-southeast (14.71%), the southeast (14.08%), and the south-southeast (11.08%). Strong winds blew from the east (2.72 m/s), the west (2.49 m/s), and the south-southwest (1.85 m/s). The average of solar radiation was 0.19 kW/m2, the average of barometric pressure was 877.79 hPa, the average of humidity was 45.54%, and the average of temperature was 20.34 °C.

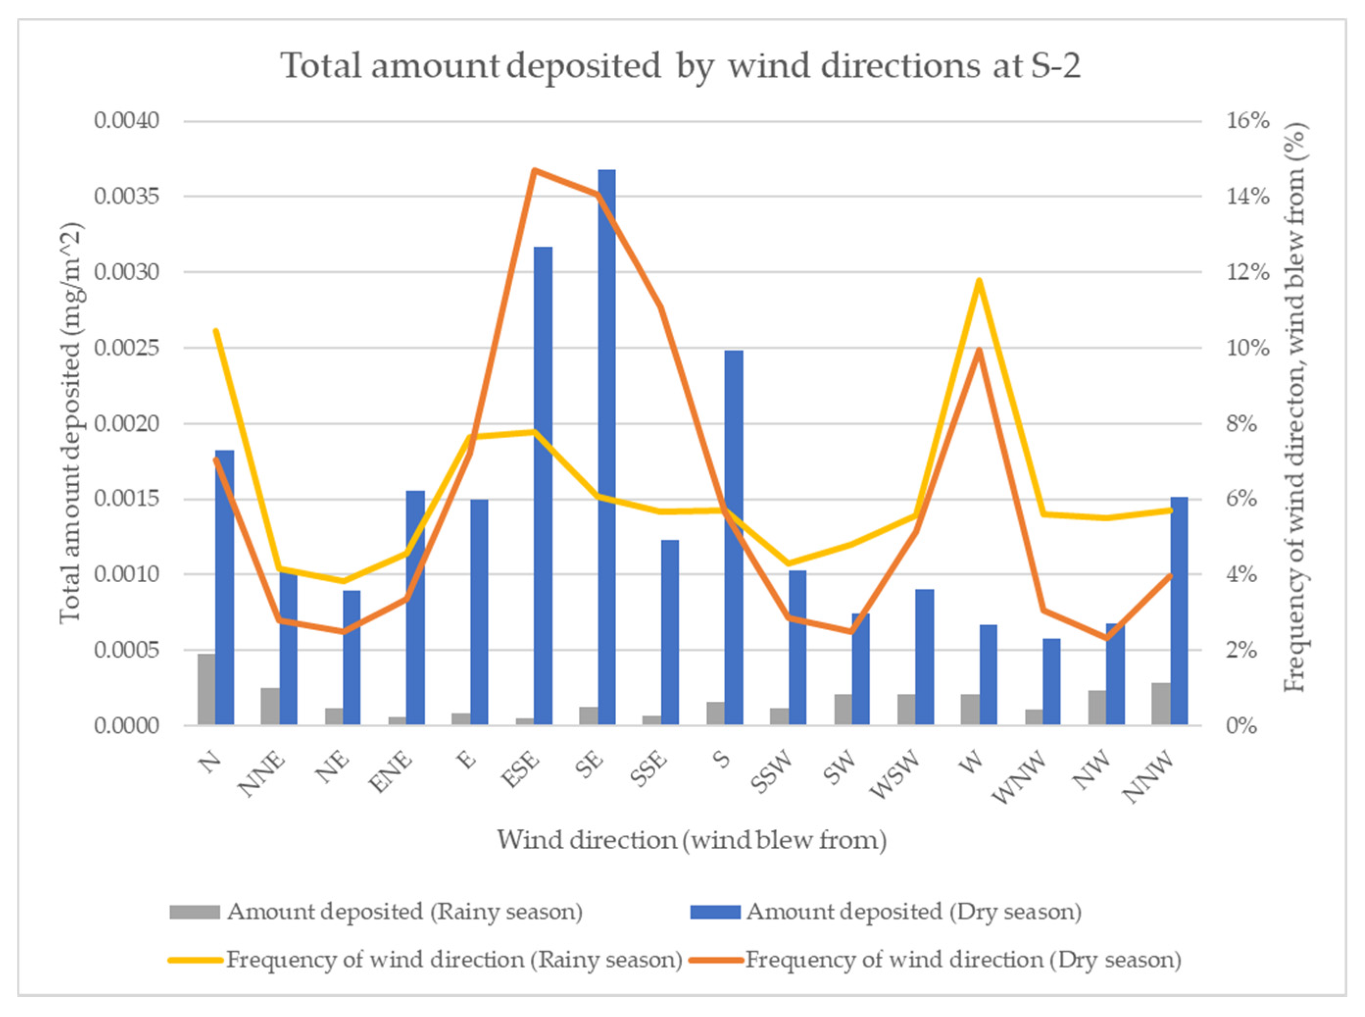
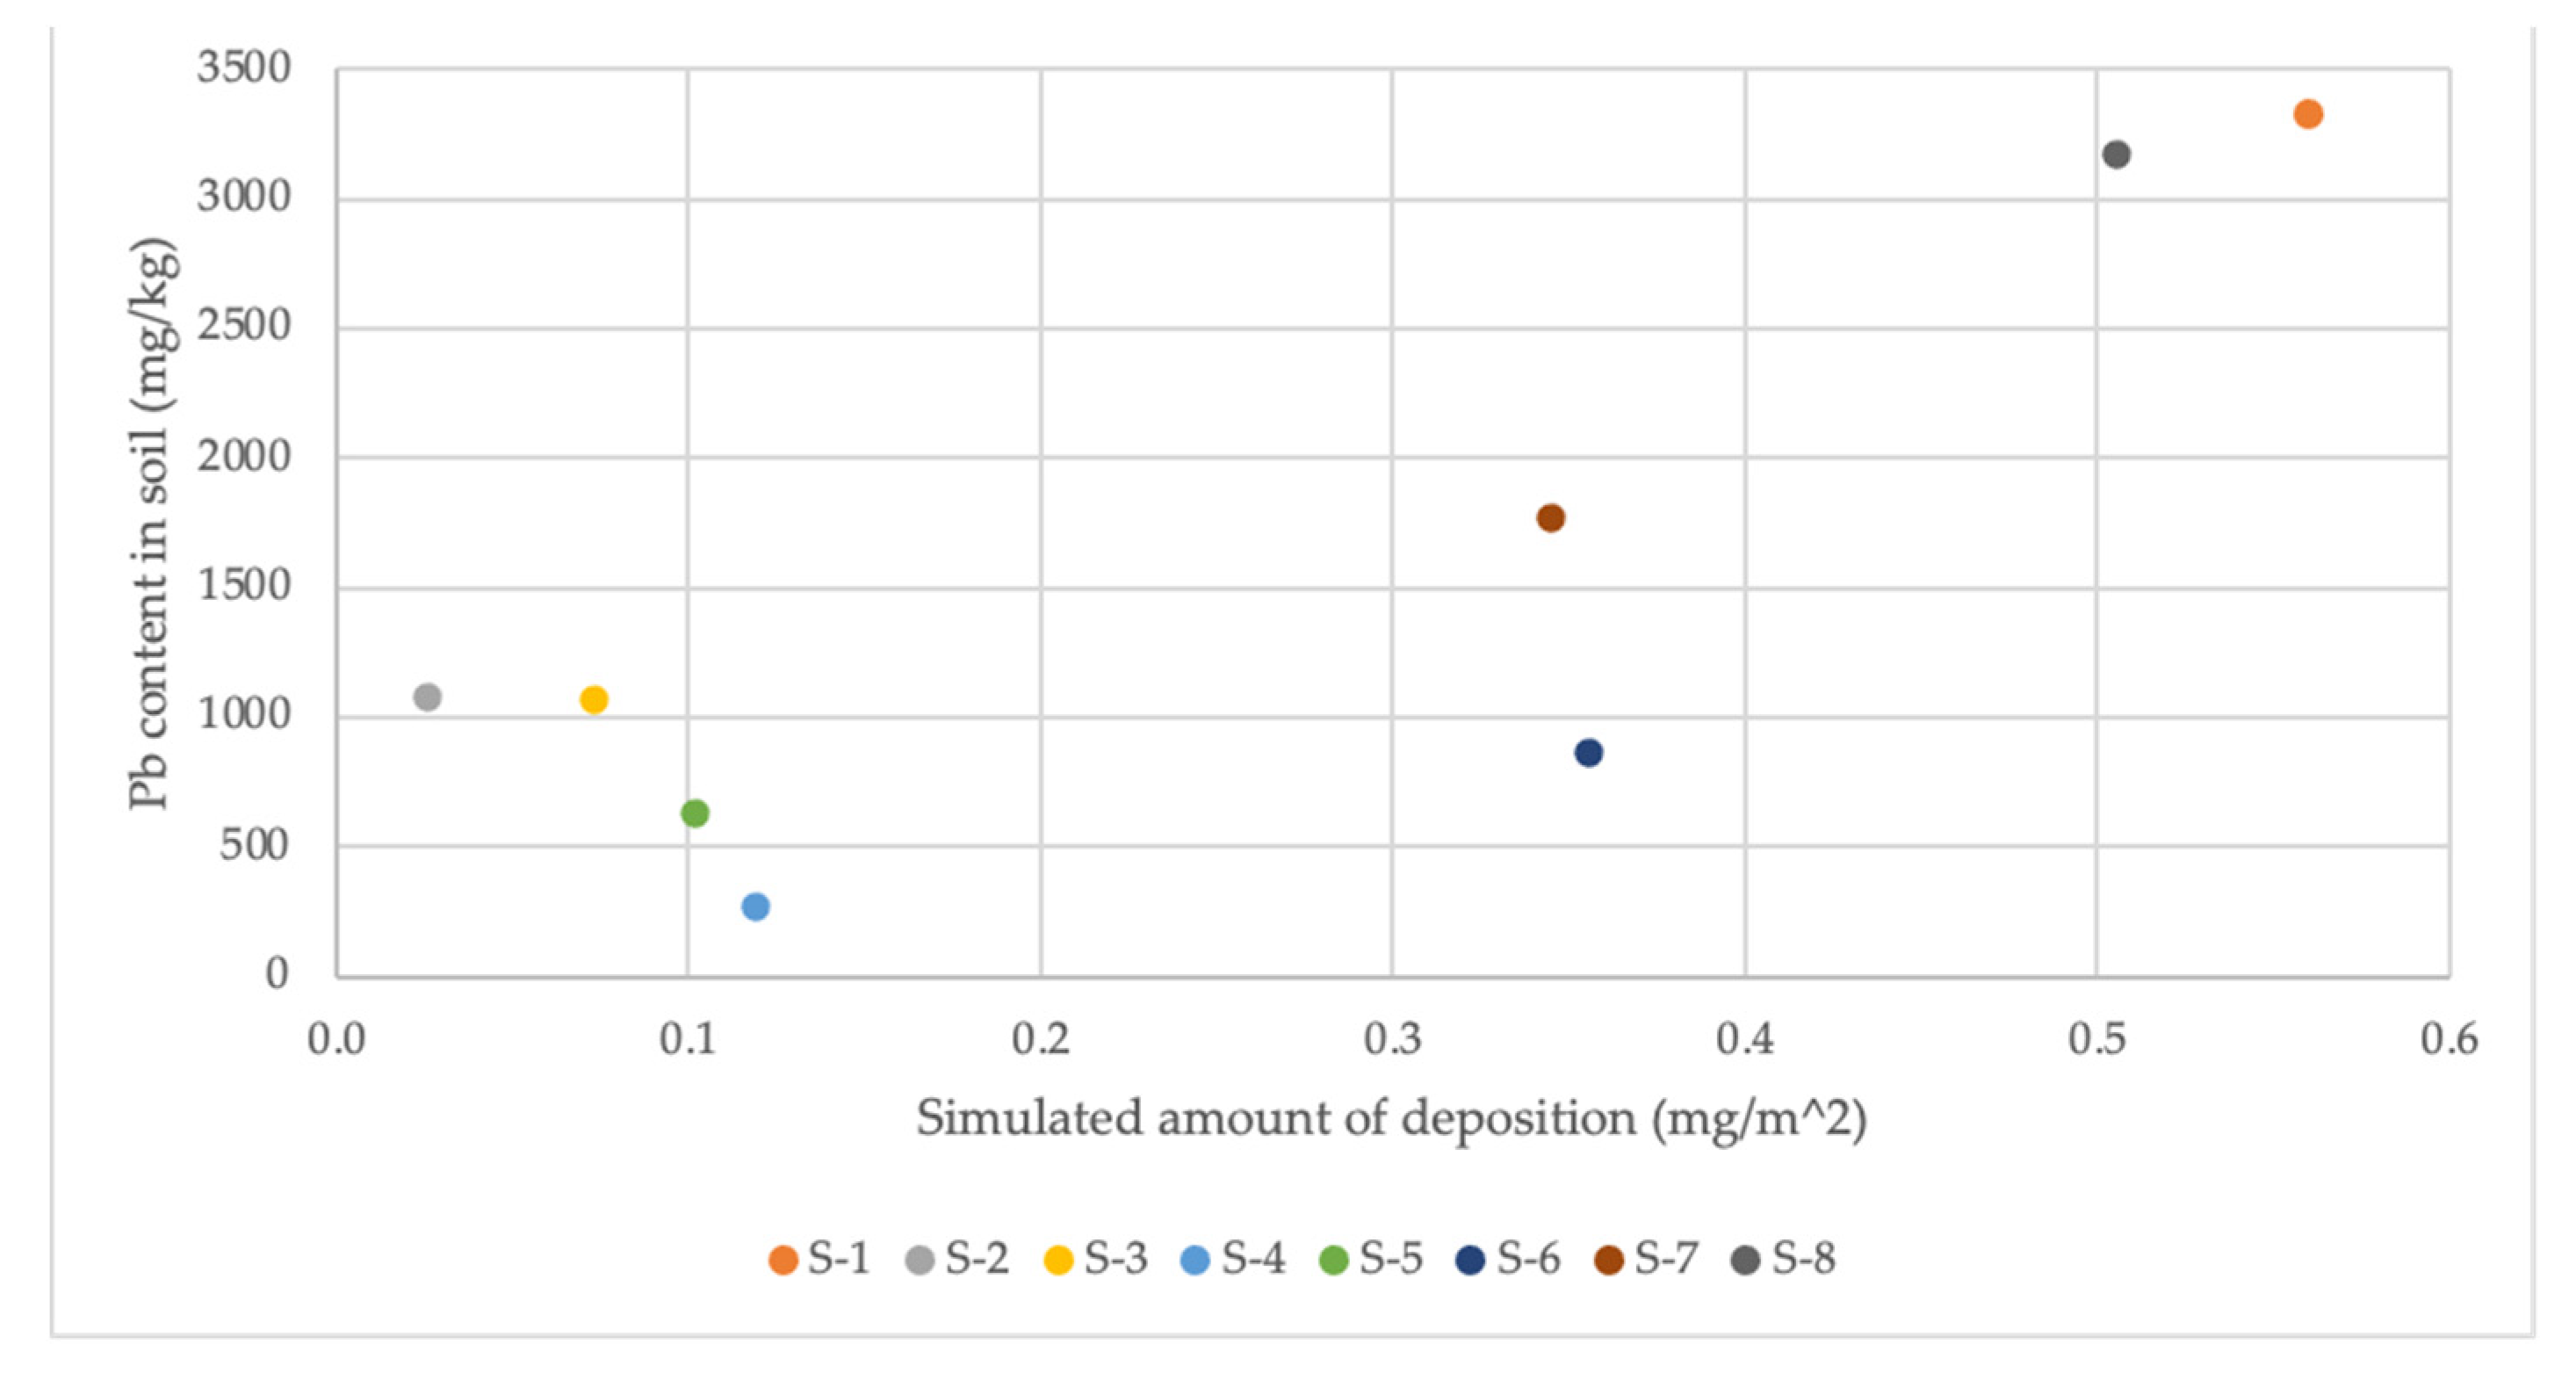
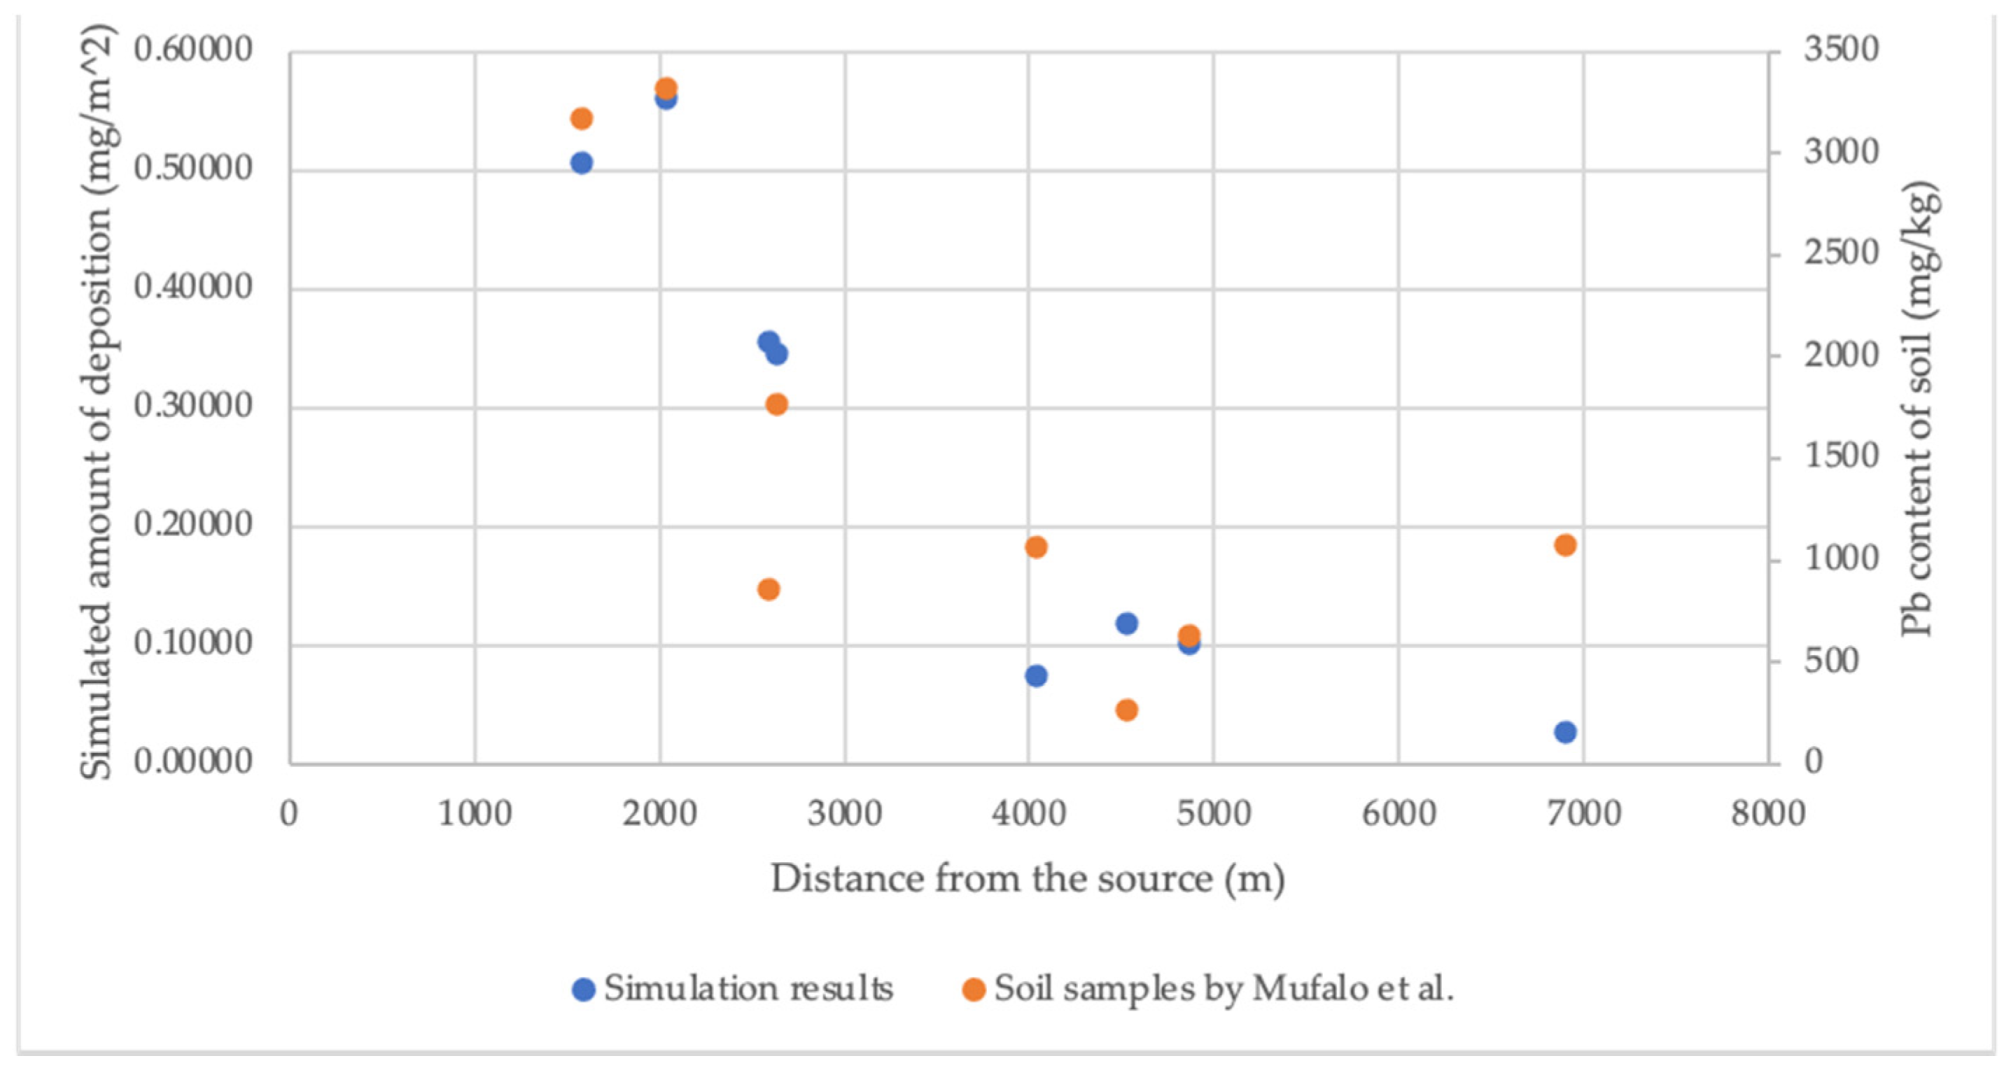
3.2. Results of Lead Dispersion Simulations

The deposition of Pb-bearing mine wastes at eight playgrounds from the dumping site by dispersion was calculated seasonally; during the rainy season (January to April and November to December), during the dry season (May to October, August not included), and throughout the year (January to December, but August not included). Calculated seasonal deposition rates at each playground were accumulated. The results for S-2, located 6904.1 m away from the dumping site (the farthest distance), S-3, located 4042.2 m (the middle distance), and S-8, located 1577.4 m (the nearest distance) were compared. The accumulated deposition rates throughout the year by simulation were compared with results of Pb content in soil samples by Mufalo et al. [13].
Figure 4 shows the simulated results of the accumulated amount deposited at S-2 located on the north-northwest direction (335.05°) and 6904.1 m from the source. In the rainy season, the accumulated amount deposited was lower when the winds blew from the east side compared to the winds from the west. The dispersion in the rainy season was not significantly affected by winds from the east even though S-2 is in the north-northwest direction from the source. The total amount deposited by winds from the east and the east-southeast was 0.00014 mg/m2. The total amount deposited by winds from the northwest, the north-northwest, and the north was 0.00100 mg/m2. These results indicate that the amount deposited was affected by the lower wind speed from the east-southeast to the south-southeast directions at S-2. In the dry season, the accumulated amount deposited was higher when the winds blew from the east and the south compared to the winds from the west. The total amount deposited by winds from the east-southeast and the southeast was 0.00684 mg/m2. The total amount deposited by winds from the west was 0.00067 mg/m2. Dispersion simulations indicate that deposition was affected by the frequency of winds from the east-southeast and the southeast because of low humidity and ignorance of the effects of rain.
Figure 5 shows the simulated results of the accumulated amount deposited at S-3 located on the west-northwest direction (296.64°) and 4042.2 m from the source. In the rainy season, the accumulated amount deposited was lower when the winds blew from the east compared to the winds from the west. The dispersion in the rainy season was not affected by winds from the east even though S-3 is on the north-northwest direction from the source. The total amount deposited by winds from the east and the east-southeast was 0.00034 mg/m2 whereas the total amount deposited by winds from the west was 0.00066 mg/m2. The amount deposited was negative (−0.00123 mg/m2) when the winds blew from the west-southwest. This is due to the net effects of deposition and redispersion by winds from the west-southwest. In the dry season, the accumulated amount deposited was higher when the winds blew from the east and the south compared to the winds from the west. The amount deposited was affected by winds from the east-southeast and the southeast. The total amount deposited by winds from the east-southeast and the southeast was 0.02124 mg/m2 whereas the total amount deposited by winds from the west was 0.00188 mg/m2. The results indicate that deposition was affected by the winds from the east-southeast and the southeast because of low humidity and no rain.
Figure 6 shows the simulated results of the accumulated amount deposited at S-8 located on the west-northwest direction (285.89°) and 1577.4 m from the source. In the rainy season, the accumulated amount deposited was lower when the winds blew from the east compared to the winds from the west. The results indicate that dispersion in the rainy season was not affected by winds, and that humidity and rain might flush the deposits at the location. The total amount deposited by winds from the east and the east-southeast was 0.00423 mg/m2. The total amount deposited by winds from the west was 0.00306 mg/m2. In the dry season, the amount deposited was higher when the winds blew from the east and the south compared to the winds from the west. These results indicate that the amount deposited was affected by the winds from the east-northeast and the south because of low humidity and almost no rain. The total amount deposited by winds from the east-southeast and the southeast was 0.16561 mg/m2. The total amount deposited by winds from the west was 0.01075 mg/m2.

4. Discussion

In the rainy season, the amount deposited was affected by higher humidity and rain, and the correlation between winds and the amount deposited was not clearly observed at each playground. On the other hand, in the dry season, the amount deposited at each playground was affected by winds from the east-southeast and the southeast, and winds were found to be a sensitive factor of Pb dispersion from the source.
Simulated results for amounts deposited of mine wastes containing Pb were compared with Pb contents in playground soils for their verification. Figure 7 shows the relationship between measured Pb content in soil and simulated amount of deposition. The contents of Pb generally increased with the amount deposited. However, when the amount deposited was lower than 0.1 mg/m2, the Pb content decreased with the amount deposited. This indicates that not only dispersion by wind but also other factors affect the distribution of Pb.
Figure 8 shows the simulated amount of deposition and Pb content in soil vs. distance from the source. Both the Pb content and the simulated amount of deposition decreased with distance from the source. This indicates that the dispersion model used here can well express the dispersion of mine wastes from the dumping site. This means that Pb dispersion is mainly caused by dispersion by winds from the dumping site.
Figure 9 shows the simulated amount of dispersion depending on particle sizes of Pb-bearing soil at S-2, S-3, and S-8 throughout the year 2019. Although the simulated amount of dispersion decreased with distance, the particles are dispersed within a restricted distance whereas the finer particles are dispersed for a longer distance. In addition, the finer particles are easily redistributed because the fraction of finer particles decreased at any location.
The dispersion model of fine particles of mine wastes explained the measured results of Pb contents in soils and qualitatively expressed the dependency of particle size on dispersion. Thus, the obtained results imply that the model used in this study may be applicable to the phenomenon of aerial dispersion of contaminants. However, the applicability of this model should be evaluated by using data of the other year and other sites.

5. Conclusions

Lead dispersion simulations using terrain data and local weather data of year 2019 were conducted and compared with the Pb contents in soils around the dumping site of Kabwe, Zambia. The following results were found.
  • Wind direction and speed and humidity, including rain, sensitively affected dispersion of soils/mine wastes containing Pb.
  • The simulated amount deposition decreased with distance from the source and agreed with the calculation of Pb contents of soils.
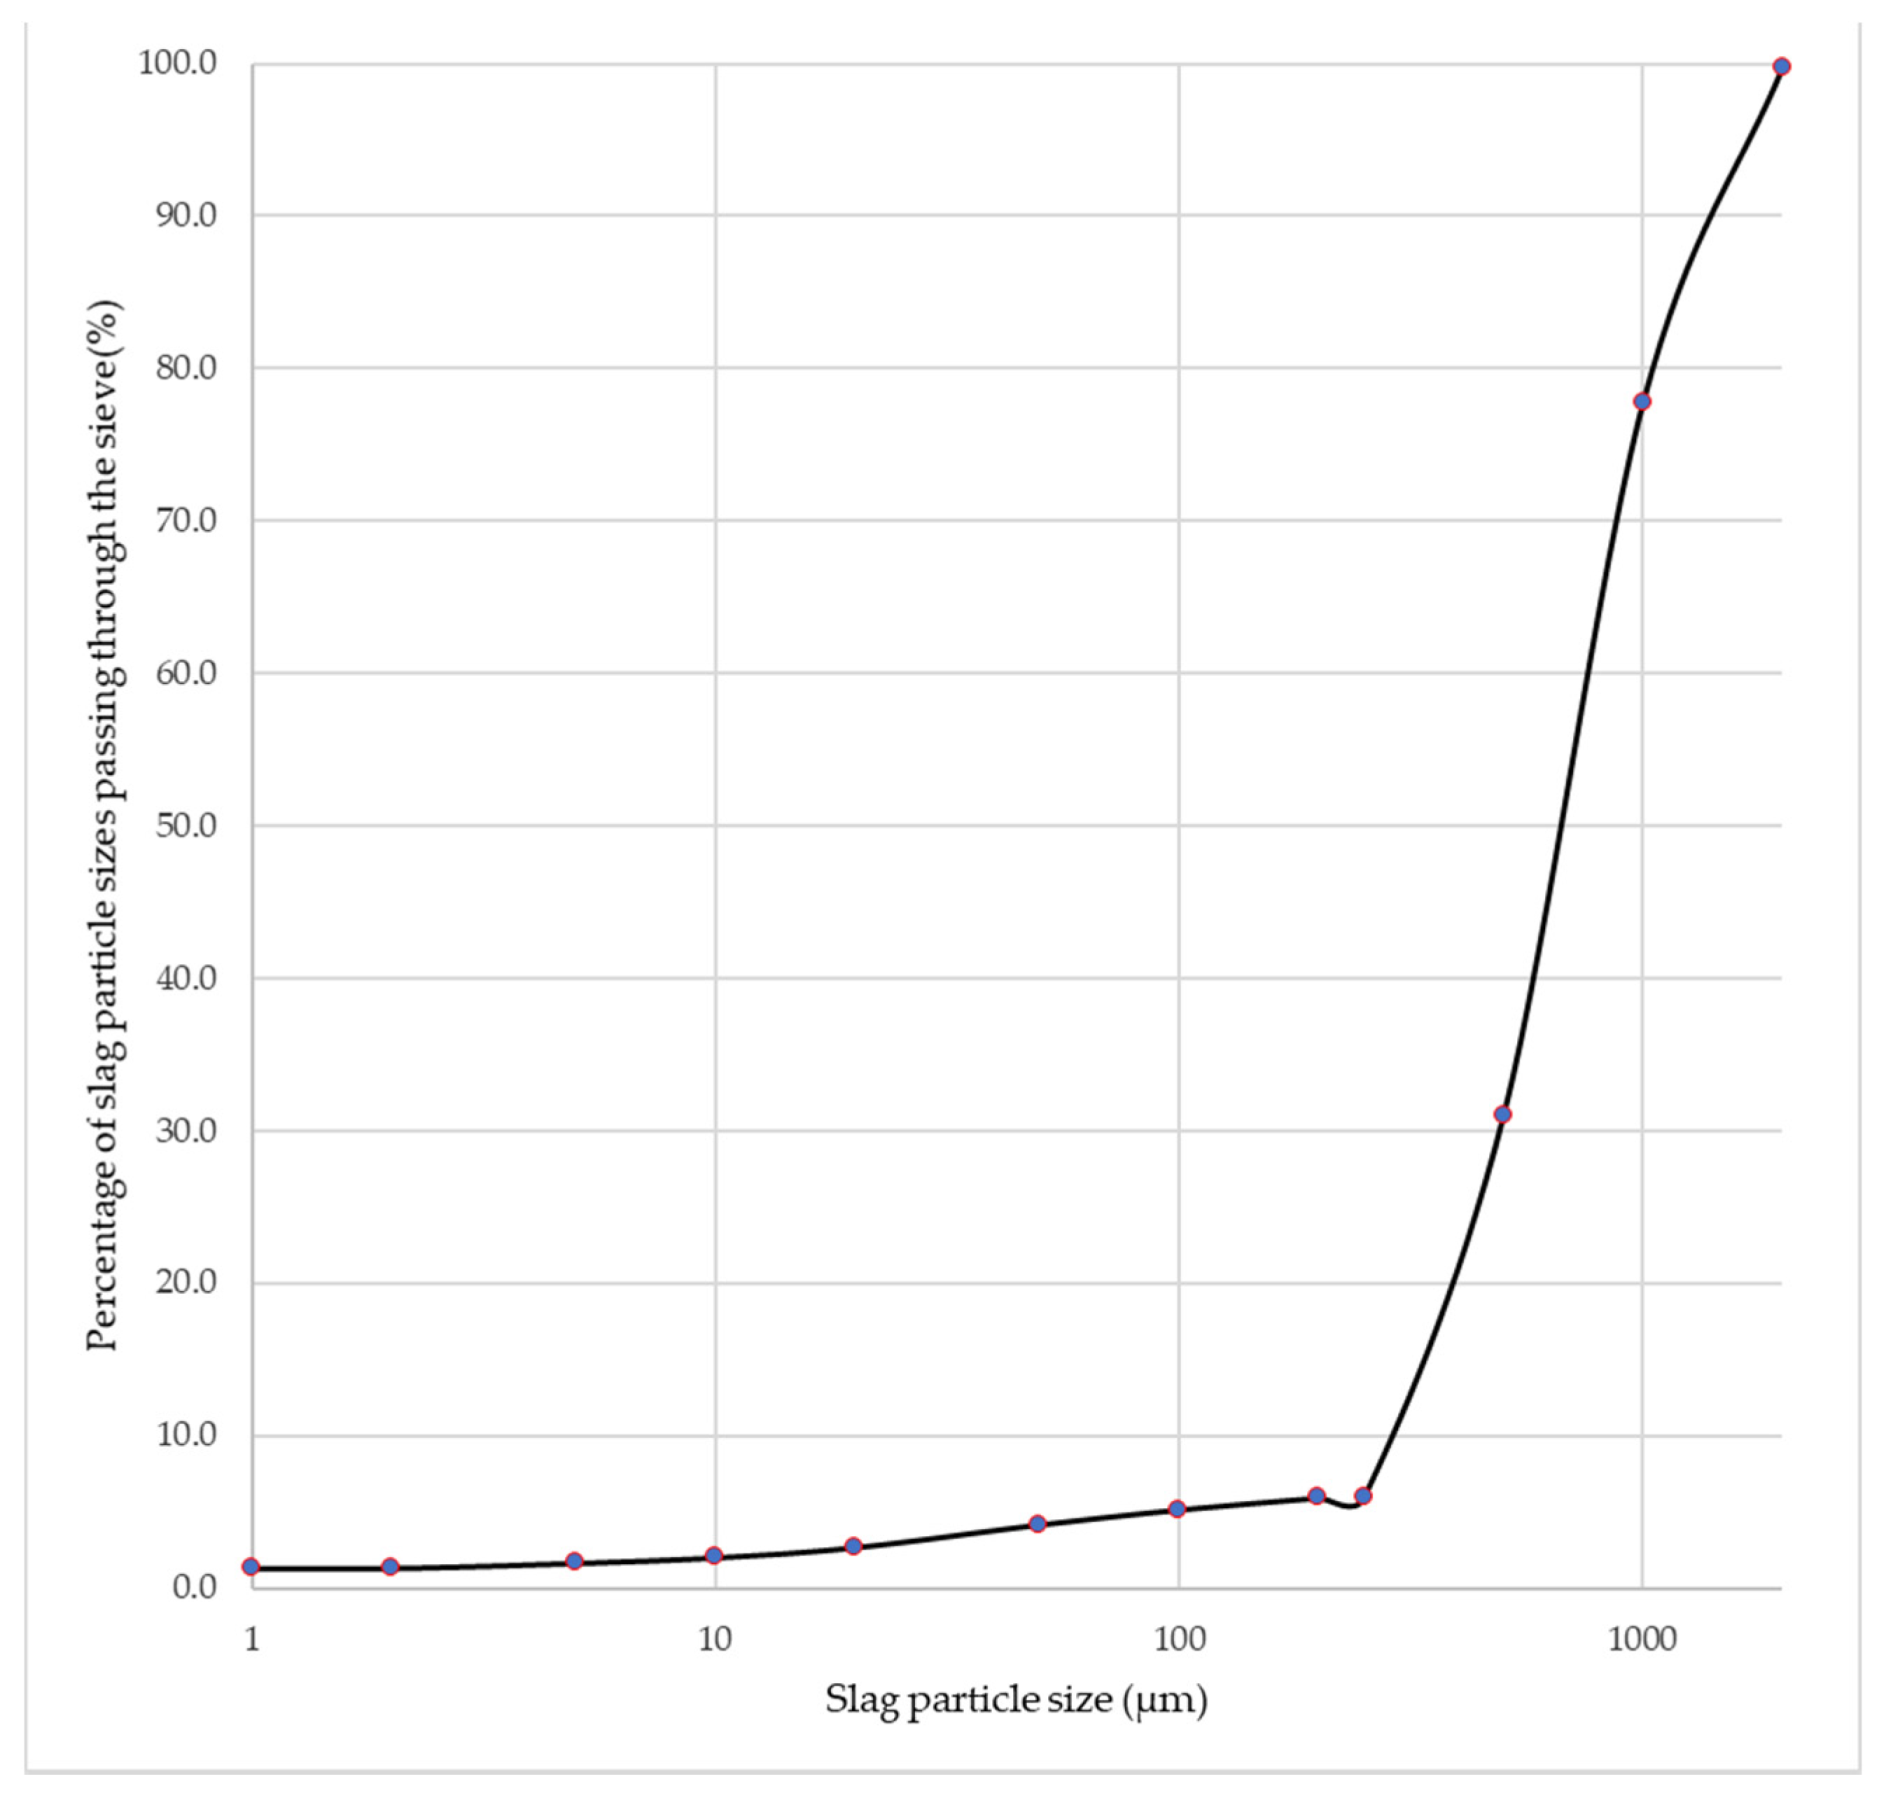
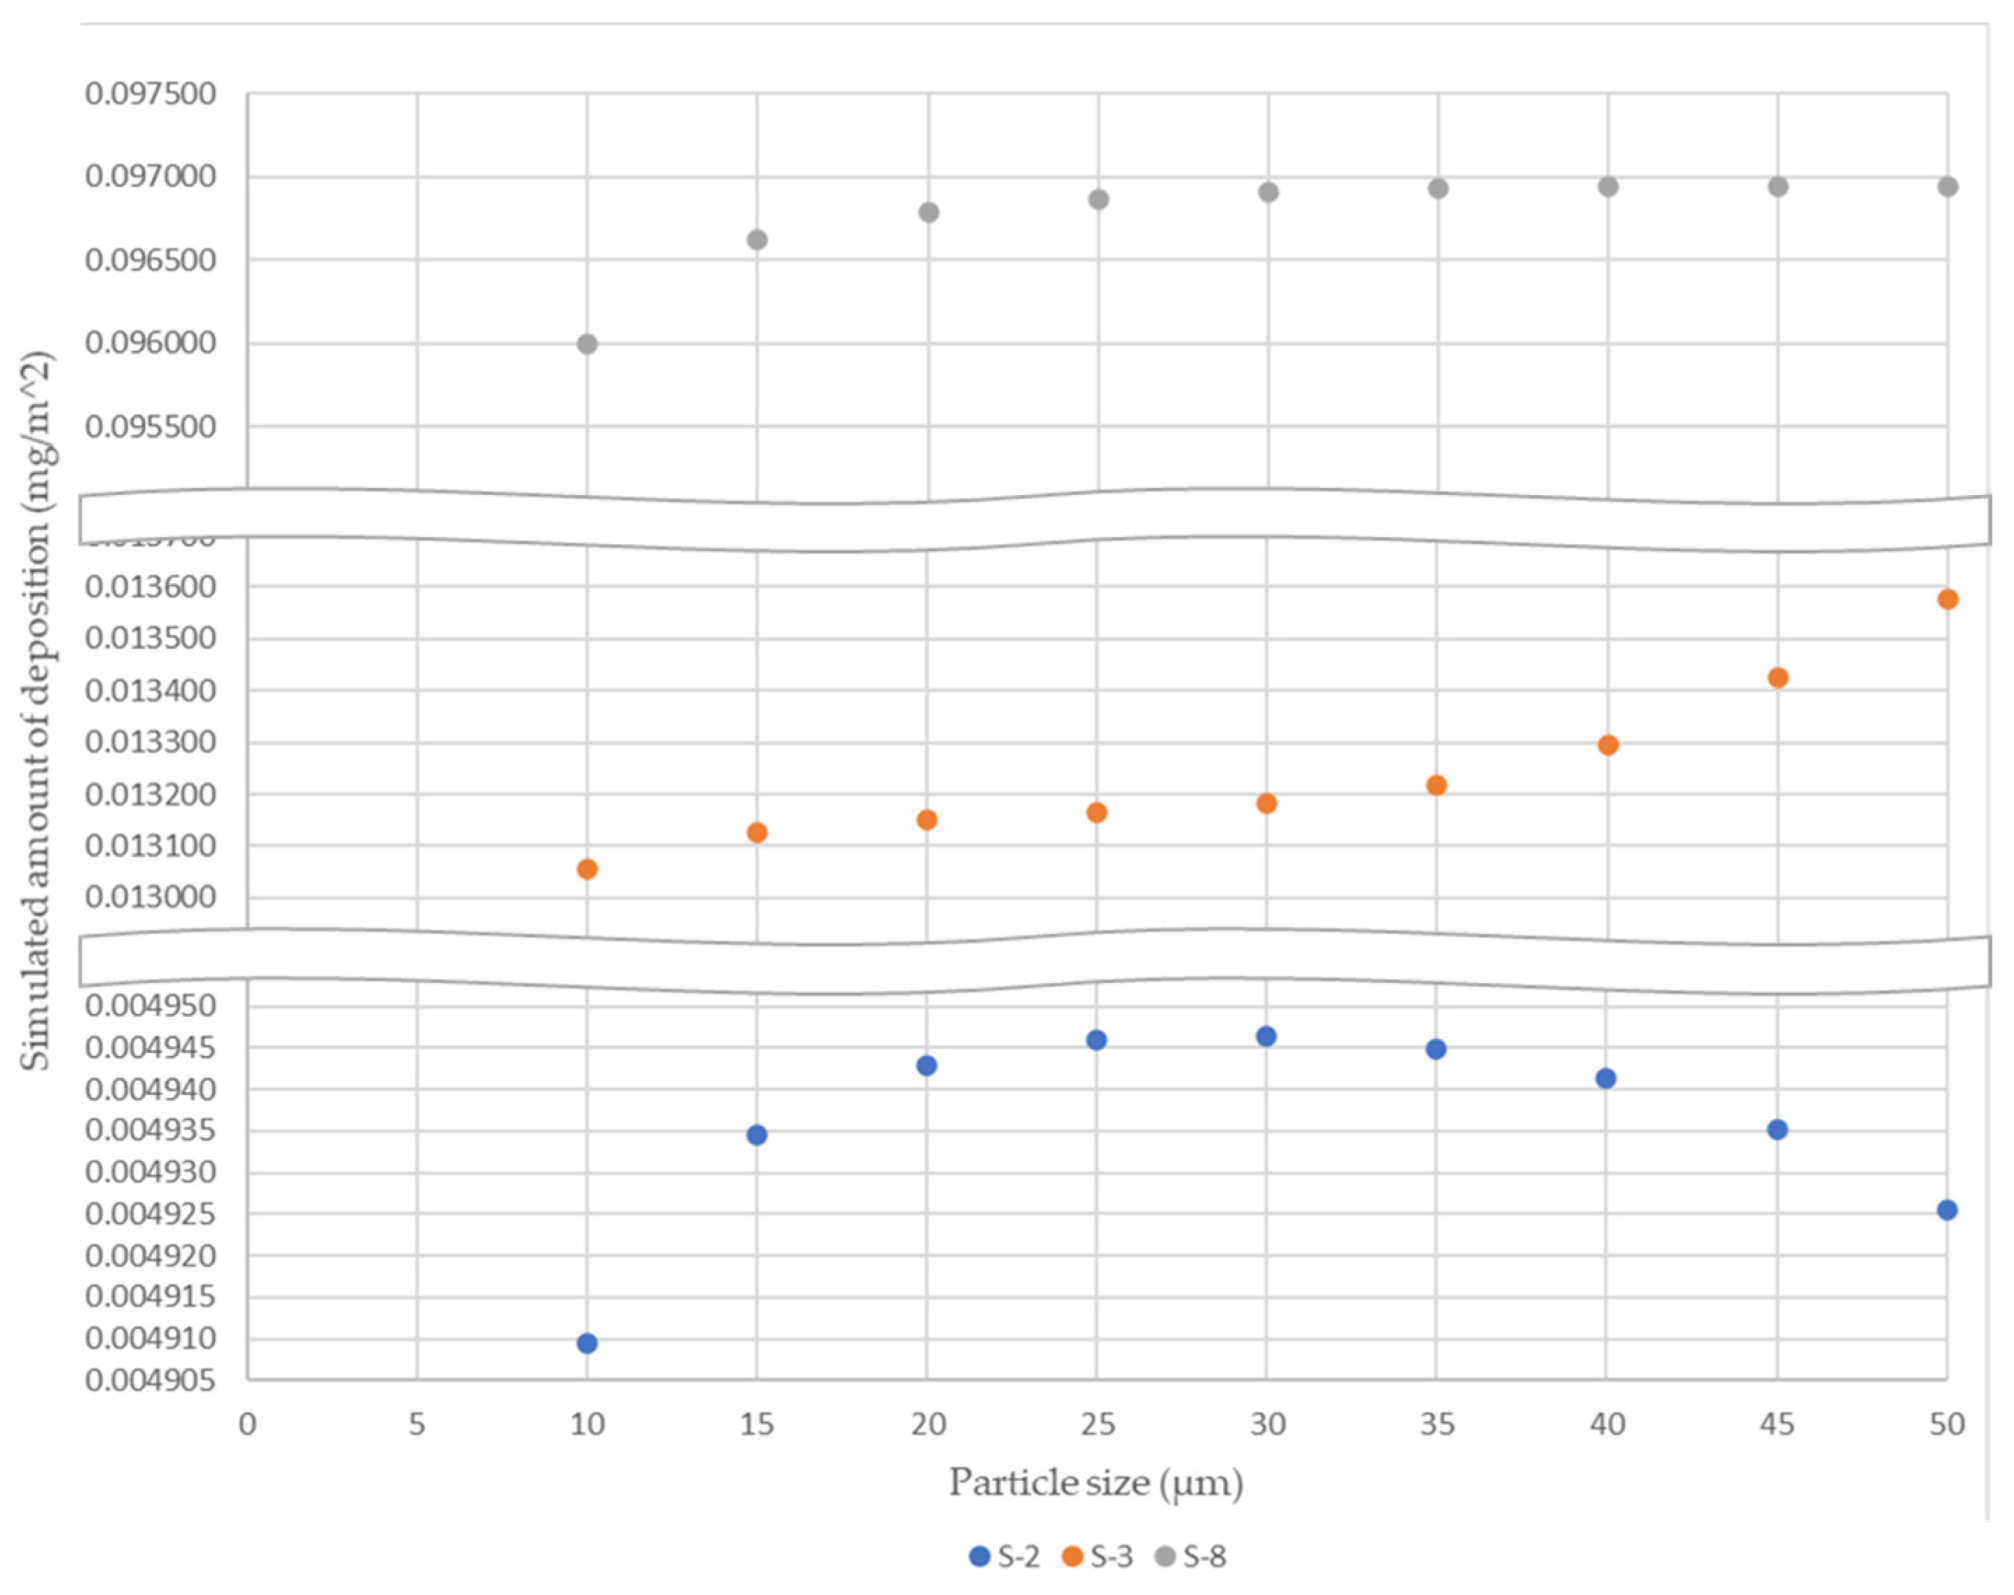
  • Winds dispersed the smaller sizes of particles farther and dispersed the larger sizes near the source, and easily redispersed the smaller sizes, according to the dispersion simulation, depending on particle sizes.
  • The above results indicate that Pb content in soils is significantly affected by dispersion of mine wastes. In other words, Pb contamination of soils is primarily caused by dispersion of mine wastes by winds.
Based on the obtained results, effective countermeasures against Pb dispersion and remediation of soil contamination should be proposed by considering Pb dispersion calculations after remediation of the dumping site and surrounding ground surfaces.

Author Contributions

Conceptualization, S.N. (Shinsaku Nakamura); methodology, S.N. (Shinsaku Nakamura), and T.I.; formal analysis, S.N. (Shinsaku Nakamura) and T.I.; writing—original draft preparation, S.N. (Shinsaku Nakamura); writing—review and editing, S.N. (Shinsaku Nakamura), T.I., Y.U., M.I. (Mayumi Ito), K.H., T.S., W.M., M.C., and I.N.; supervision, S.N. (Shinsaku Nakamura) and T.I.; project administration, M.I. (Mayumi Ishizuka), S.N. (Shouta Nakayama), and H.N.; funding acquisition, M.I. (Mayumi Ishizuka), S.N. (Shouta Nakayama), and H.N. All authors have read and agreed to the published version of the manuscript.

Funding

The research was supported by JST/JICA SATREPS (Science and Technology Research Partnership for Sustainable Development; No. JPMJSA1501) and aXis (Accelerating Social Implementation for SDGs Achievement: No. JPMJAS2001).

Data Availability Statement

Data are available on request to the authors.

Acknowledgments

The authors would like to acknowledge JST/JICA SATREPS (Science and Technology Research Partnership for Sustainable Development; No. JPMJSA1501) and aXis (Accelerating Social Implementation for SDGs Achievement; No. JPMJAS2001) funded by JST for the financial support.

Conflicts of Interest

The authors declare no conflict of interest.

References

  1. Etter, V. Soil contamination near non-ferrous metal smelters: A review. Appl. Geochem. 2016, 64, 56–74. [Google Scholar] [CrossRef] [Green Version]
  2. Nriagu, J.O. A History of Global Metal Pollution. Science 1996, 272, 223. [Google Scholar] [CrossRef]
  3. Tchounwou, P.B.; Yedjou, C.G.; Patlolla, A.K.; Sutton, D.J. Heavy Metal Toxicity and the Environment. Mol. Clin. Environ. Toxicol. 2012, 101, 133–164. [Google Scholar] [CrossRef] [Green Version]
  4. Ettler, V.; Vítková, M.; Mihaljevič, M.; Šebek, O.; Klementová, M.; Veselovský, F.; Vybíral, P.; Kříbek, B. Dust from Zambian smelters: Mineralogy and contaminant bioaccessibility. Environ. Geochem. Health 2014, 36, 919–933. [Google Scholar] [CrossRef] [PubMed]
  5. Entwistle, J.A.; Hursthouse, A.S.; Reis, P.A.M.; Stewart, A.G. Metalliferous Mine Dust: Human Health Impacts and the Potential Determinants of Disease in Mining Communities. Curr. Pollut. Rep. 2019, 5, 67–83. [Google Scholar] [CrossRef] [Green Version]
  6. Ettler, V.; Štěpánek, D.; Mihaljevič, M.; Drahota, P.; Jedlicka, R.; Kříbek, B.; Vaněk, A.; Penížek, V.; Sracek, O.; Nyambe, I. Slag dusts from Kabwe (Zambia): Contaminant mineralogy and oral bioaccessibility. Chemosphere 2020, 260, 127642. [Google Scholar] [CrossRef]
  7. Nakayama, S.M.; Ikenaka, Y.; Hamada, K.; Muzandu, K.; Choongo, K.; Teraoka, H.; Mizuno, N.; Ishizuka, M. Metal and metalloid contamination in roadside soil and wild rats around a Pb–Zn mine in Kabwe, Zambia. Environ. Pollut. 2011, 159, 175–181. [Google Scholar] [CrossRef] [PubMed] [Green Version]
  8. Uchida, Y.; Banda, K.; Nyambe, I.; Hamamoto, T.; Yoshii, Y.; Munthali, K.; Mwansa, M.; Mukuka, M.; Mutale, M.; Yabe, J.; et al. Multidisciplinary field research in Kabwe, Zambia, towards better understanding of lead contamination of the city—A short report from a field survey. bioRxiv 2017. Available online: https://www.biorxiv.org/content/10.1101/096164v2.full.pdf (accessed on 28 October 2020).
  9. Yamada, D.; Hiwatari, M.; Hangoma, P.; Narita, D.; Mphuka, C.; Chitah, B.; Yabe, J.; Nakayama, S.M.M.; Nakata, H.; Choongo, K.; et al. Assessing the population-wide exposure to lead pollution in Kabwe, Zambia: An econometric estimation based on survey data. Sci. Rep. 2020, 10, 1–11. [Google Scholar] [CrossRef]
  10. Kříbek, B.; Nyambe, I.; Majer, V.; Knésl, I.; Mihaljevic, M.; Ettler, V.; Vanek, A.; Penížek, V.; Sracek, O. Soil contamination near the Kabwe Pb-Zn smelter in Zambia: Environmental impacts and remediation measures proposal. J. Geochem. Explor. 2018, 197, 159–173. [Google Scholar] [CrossRef]
  11. Tangviroon, P.; Noto, K.; Igarashi, T.; Kawashima, T.; Ito, M.; Sato, T.; Mufalo, W.; Chirwa, M.; Nyambe, I.; Nakata, H.; et al. Immobilization of Lead and Zinc Leached from Mining Residual Materials in Kabwe, Zambia: Possibility of Chemical Immobilization by Dolomite, Calcined Dolomite, and Magnesium Oxide. Minerals 2020, 10, 763. [Google Scholar] [CrossRef]
  12. Silwamba, M.; Ito, M.; Hiroyoshi, N.; Tabelin, C.B.; Hashizume, R.; Fukushima, T.; Park, I.; Jeon, S.; Igarashi, T.; Sato, T.; et al. Recovery of Lead and Zinc from Zinc Plant Leach Residues by Concurrent Dissolution-Cementation Using Zero-Valent Aluminum in Chloride Medium. Metals 2020, 10, 531. [Google Scholar] [CrossRef] [Green Version]
  13. Mufalo, W.; Tangviroon, P.; Igarashi, T.; Ito, M.; Sato, T.; Chirwa, M.; Nyambe, I.; Nakata, H.; Nakayama, S.; Ishizuka, M. Characterization and leaching behavior of playground soils in Kabwe, Zambia. In Proceedings of the International Symposium on Earth Science and Technology, Fukuoka, Japan, 26–27 November 2020; pp. 154–157. [Google Scholar]
  14. Kataoka, H.; Tabata, Y. Numerical Prediction Method for Snowdrift Dust Dispersion; Report of Obayashi Corporation Technical Research Institute: Tokyo, Japan, 2010; Volume 74. [Google Scholar]
  15. Japan Environmental Management Association for Industry; Ministry of Economy, Trade and Industry. Low Rise Industrial Source Dispersion MODEL. 2021. Available online: http://www.jemai.or.jp/tech/meti-lis/detailobj-6117-attachment.pdf (accessed on 28 October 2020).
  16. Siciliano, S.D.; James, K.; Zhang, G.; Schafer, A.N.; Peak, J.D. Adhesion and Enrichment of Metals on Human Hands from Contaminated Soil at an Arctic Urban Brownfield. Environ. Sci. Technol. 2009, 43, 6385–6390. [Google Scholar] [CrossRef] [PubMed]
  17. Tada, K.; Hazama, H.; Kobayashi, K.; Okamoto, S. Development and evaluation of a diffusion model for particle matter—Application to Kashima area. J. Japan Soc. Air Pollut. 1989, 24, 64–73. [Google Scholar]
  18. Matsusaka, S.; Masuda, H. Reentrainment Phenomena of Fine Particles. J. Soc. Powder Technol. Jpn. 1992, 29, 530–538. [Google Scholar] [CrossRef] [Green Version]
  19. Sherman, C.A. A Mass-Consistent Model for Wind Fields over Complex Terrain. J. Appl. Meteorol. 1978, 17, 312–319. [Google Scholar] [CrossRef] [Green Version]
  20. Fukuyama, T.; Izumi, K.; Utiyama, M. Dry deposition of atmospheric aerosols—A browse on recent papers. J. Aerosol Res. 2004, 19, 245–253. [Google Scholar]
  21. Ministry of Economy, Trade and Industry of Japan. Technical Manual of Ministry of Economy, Trade and Industry Low rise Industrial Source dispersion model (METI-LIS) ver. 3.02, March 2012. Available online: https://www.jemai.or.jp/tech/meti-lis/detailobj-6117-attachment.pdf (accessed on 30 May 2019).
  22. Luhar, A.K. Analytical puff modelling of light-wind dispersion in stable and unstable conditions. Atmos. Environ. 2011, 45, 357–368. [Google Scholar] [CrossRef]
  23. Nakatani, N.; Nakane, I. A study of pollen re-transportation in urban environment by using physical model and numerical simulation. Jpn. Soc. Comput. Methods Eng. 2017, 17, 171215. [Google Scholar]
  24. Fuller, D.D. Coefficient of Friction; Columbia University: New York, NY, USA; pp. 2-42–2-48. Available online: https://web.mit.edu/8.13/8.13c/references-fall/aip/aip-handbook-section2d.pdf (accessed on 6 May 2020).
  25. Nabeel, M.; Karasev, A.; Jönsson, P.G. Friction Forces and Mechanical Dust Generation in an Iron Ore Pellet Bed Subjected to Varied Applied Loads. ISIJ Int. 2017, 57, 656–664. [Google Scholar] [CrossRef] [Green Version]
  26. Klingmuller, K.; Metzger, S.; Abdelkader, M.; Karydis, V.A.; Stenchikkov, G.L.; Pozzer, A.; Lelievbeld, J. Revised mineral dust emission in the atmospheric chemistry-climate model EMAC (MESSy 2.52 DU_Astithal KKDU2017 patch). Geosci. Model Dev. 2018, 11, 989–1008. [Google Scholar] [CrossRef] [Green Version]
Figure 1. Source location and sampling points in Kabwe, Zambia: (a) territory of Zambia; (b) location of Kabwe; (c) locations of dumping site (source) and playgrounds (sampling points; S-1 to S-8); (d) source location and Green Park where weather data were collected.
Minerals 11 00901 g001
Figure 2. Measured particle-size distribution of the slag sample.
Minerals 11 00901 g002
Figure 3. Results of the measured wind conditions in Kabwe in 2019: (a) wind condition throughout the year; (b) wind condition in the rainy season; (c) wind condition in the dry season. Orange plots in these charts show frequencies of wind directions from which wind blew, and the axis was set at 15.0%, 12.5%, 10.0%, 7.5%, 5.0%, and 2.5% from outside to inside, respectively. Blue plots in these charts show wind speeds, and the axis was set at 3.0, 2.5, 2.0, 1.5, 1.0, and 0.5 m/s from outside to inside, respectively.
Minerals 11 00901 g003
Figure 4. Total amount deposited by the wind directions at S-2: gray and blue bars show total amount deposited by wind directions from which wind blew in the rainy and dry seasons, respectively. Yellow and orange lines show frequencies of wind directions from which wind blew in the rainy and dry seasons, respectively.
Minerals 11 00901 g004
Figure 5. Total amount deposited by wind directions at S-3: gray and blue bars show total amount deposited by wind directions from which wind blew in the rainy and dry seasons, respectively. Yellow and orange lines show frequencies of wind directions from which wind blew in the rainy and dry seasons, respectively.
Minerals 11 00901 g005
Figure 6. Total amount deposited by wind directions at S-8: gray and blue bars show total amount deposited by wind directions from which wind blew in the rainy and dry seasons, respectively. Yellow and orange lines show frequencies of wind directions from which wind blew in the rainy and dry seasons, respectively.
Minerals 11 00901 g006
Figure 7. Relationship between measured Pb content in soil and simulated amount of deposition.
Minerals 11 00901 g007
Figure 8. Simulated amount of deposition and Pb content in soil vs. distance from the source.
Minerals 11 00901 g008
Figure 9. Simulated amount of deposition depending on particle sizes of Pb-bearing soil at S-2, S-3, and S-8.
Minerals 11 00901 g009
Table 1. Pb contents of soil samples (XRF-chemical composition) by Mufalo et al. [13].
PlaygroundPb (mg/kg)
S-13320
S-21080
S-31070
S-4265
S-5633
S-6863
S-71770
S-83170
Publisher’s Note: MDPI stays neutral with regard to jurisdictional claims in published maps and institutional affiliations.

