Author Contributions
Conceptualization, N.A., S.K., E.F.N., Z.Z. and A.A.-S.; methodology, N.A., S.K., E.F.N., Z.Z. and A.A.-S.; software, N.A., S.K. and E.F.N.; validation, N.A., S.K., E.F.N., Z.Z. and A.A.-S.; formal analysis, N.A., S.K., E.F.N. and A.A.-S.; investigation, N.A., S.K. and A.A.-S.; resources, N.A., S.K. and A.A.-S.; data curation, N.A., S.K. and A.A.-S.; writing—original draft preparation, N.A., S.K., E.F.N., Z.Z. and A.A.-S.; writing—review and editing, N.A., S.K. and A.A.-S.; visualization, N.A., S.K., E.F.N., Z.Z. and A.A.-S. All authors have read and agreed to the published version of the manuscript.
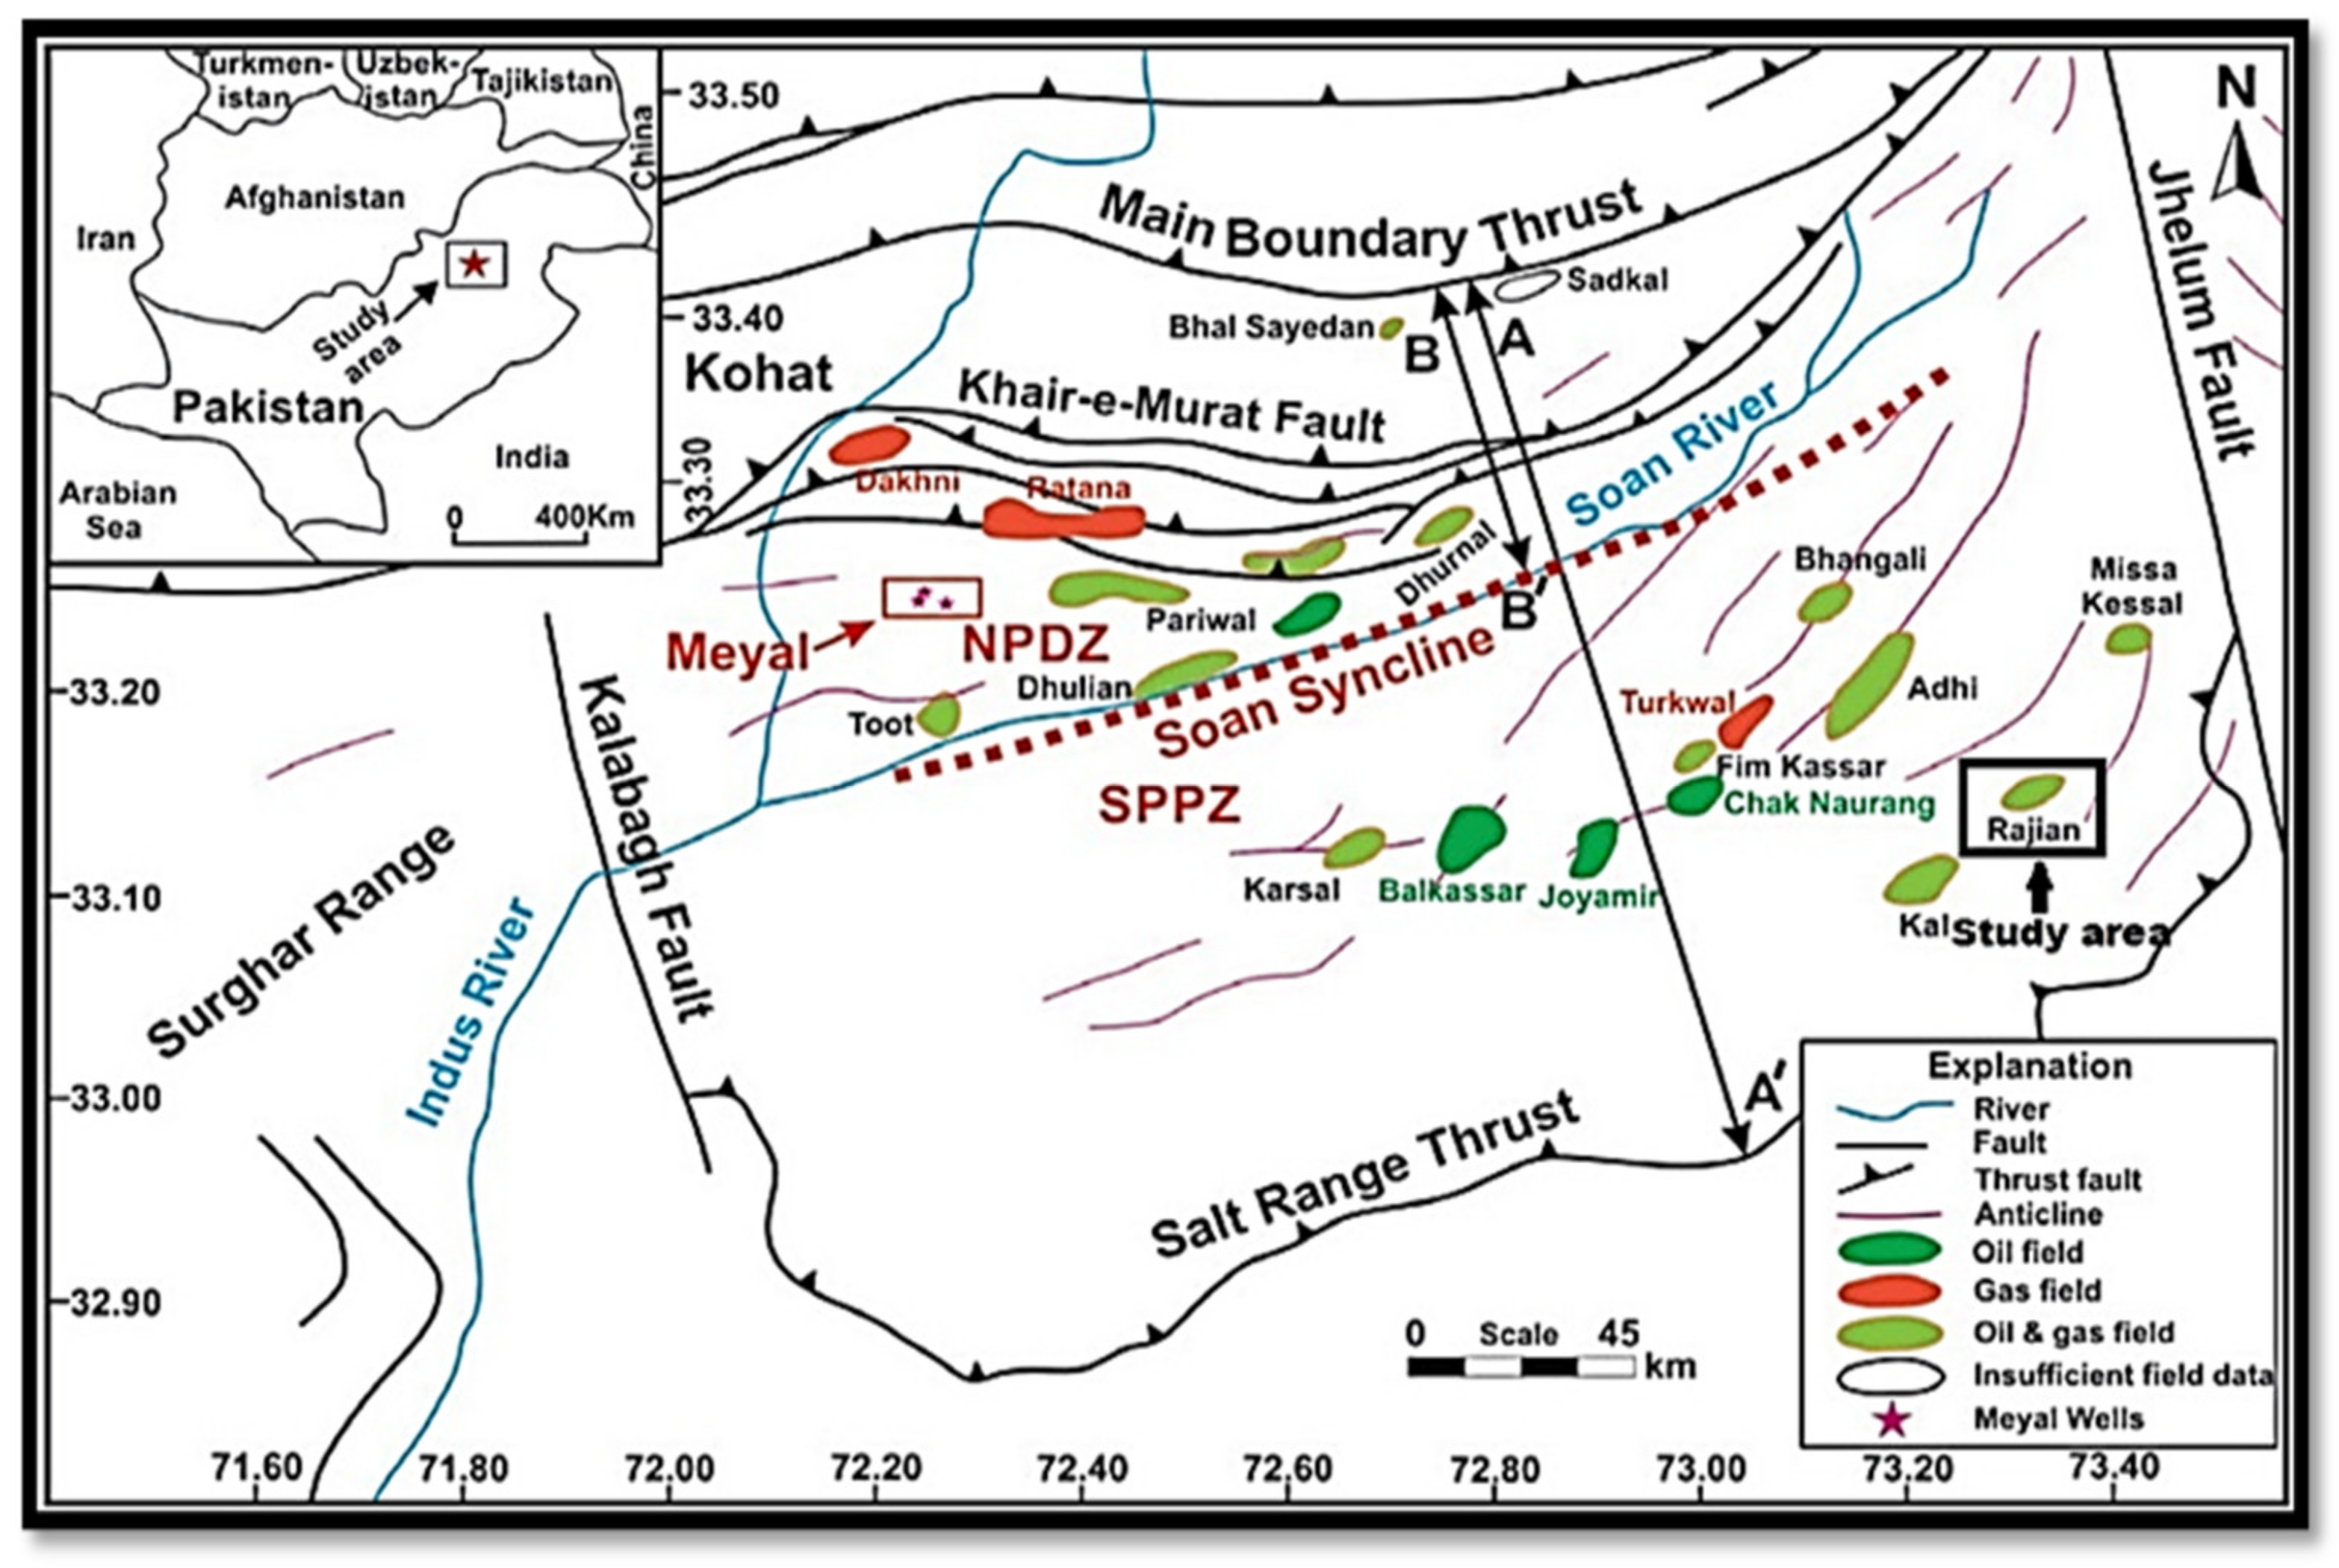
Figure 1.
Regional tectonic setting of Rajian area [
19].
Figure 1.
Regional tectonic setting of Rajian area [
19].
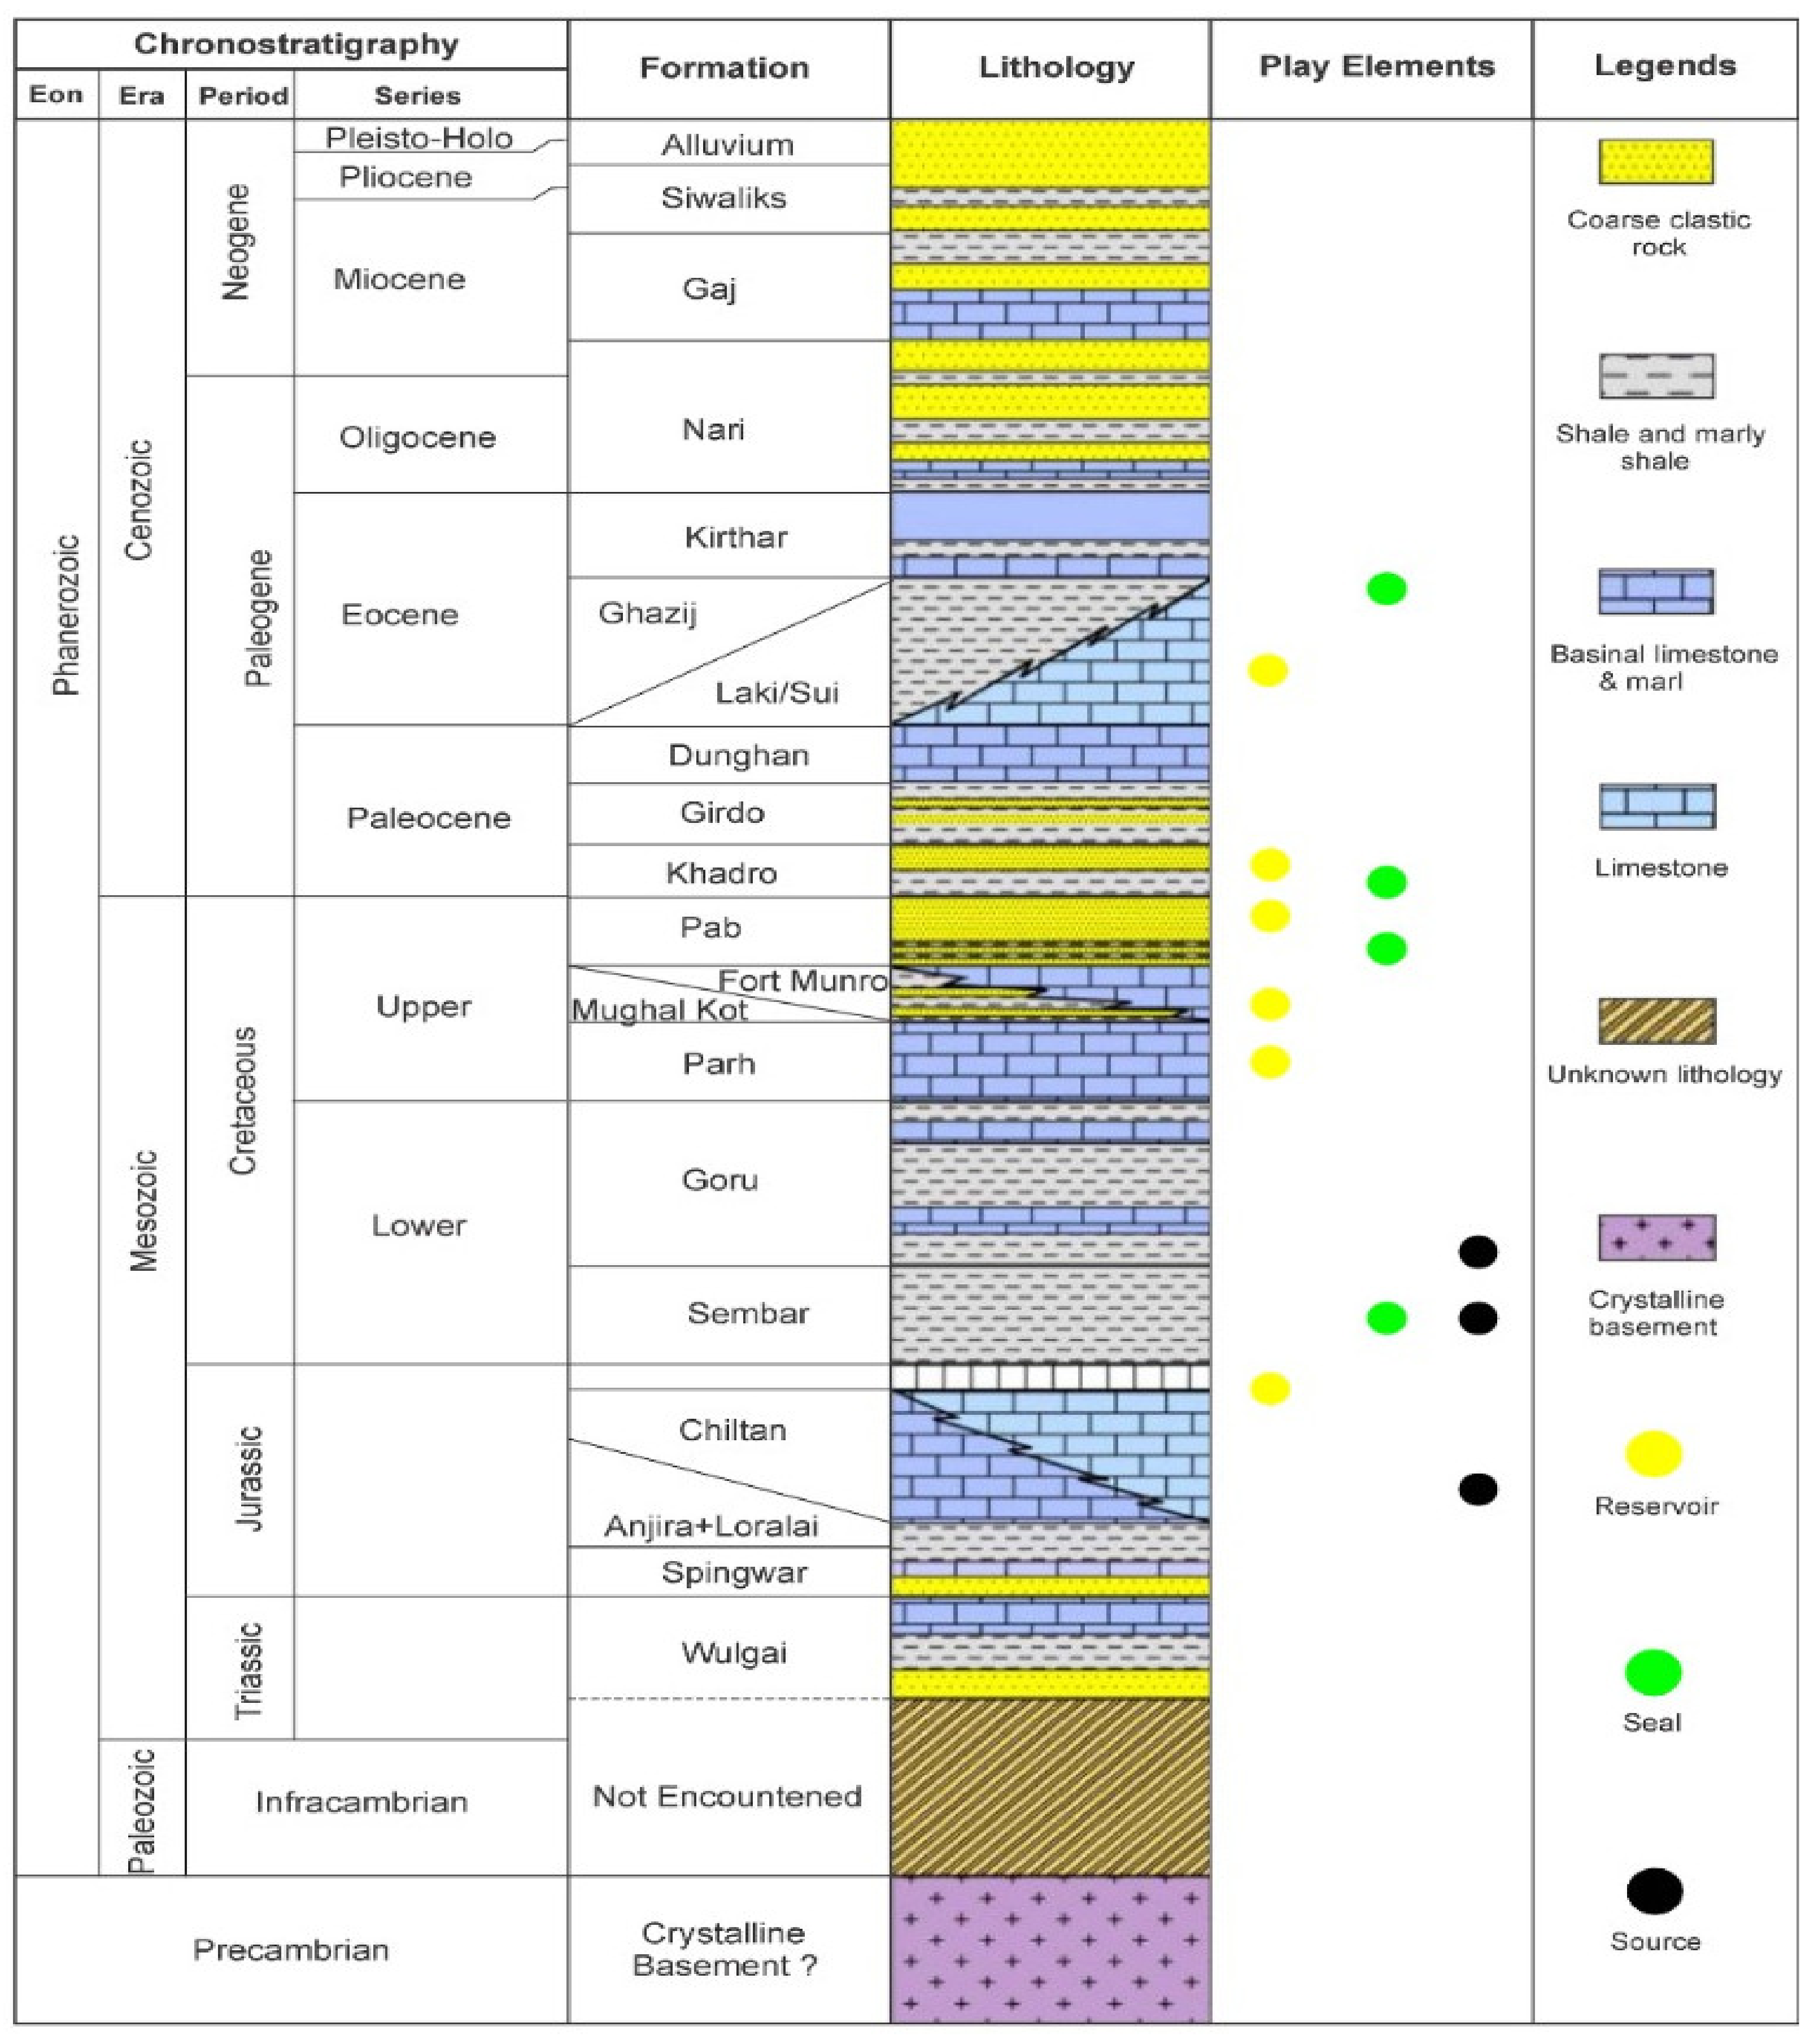
Figure 2.
Stratigraphic column of eastern Potwar [
22].
Figure 2.
Stratigraphic column of eastern Potwar [
22].
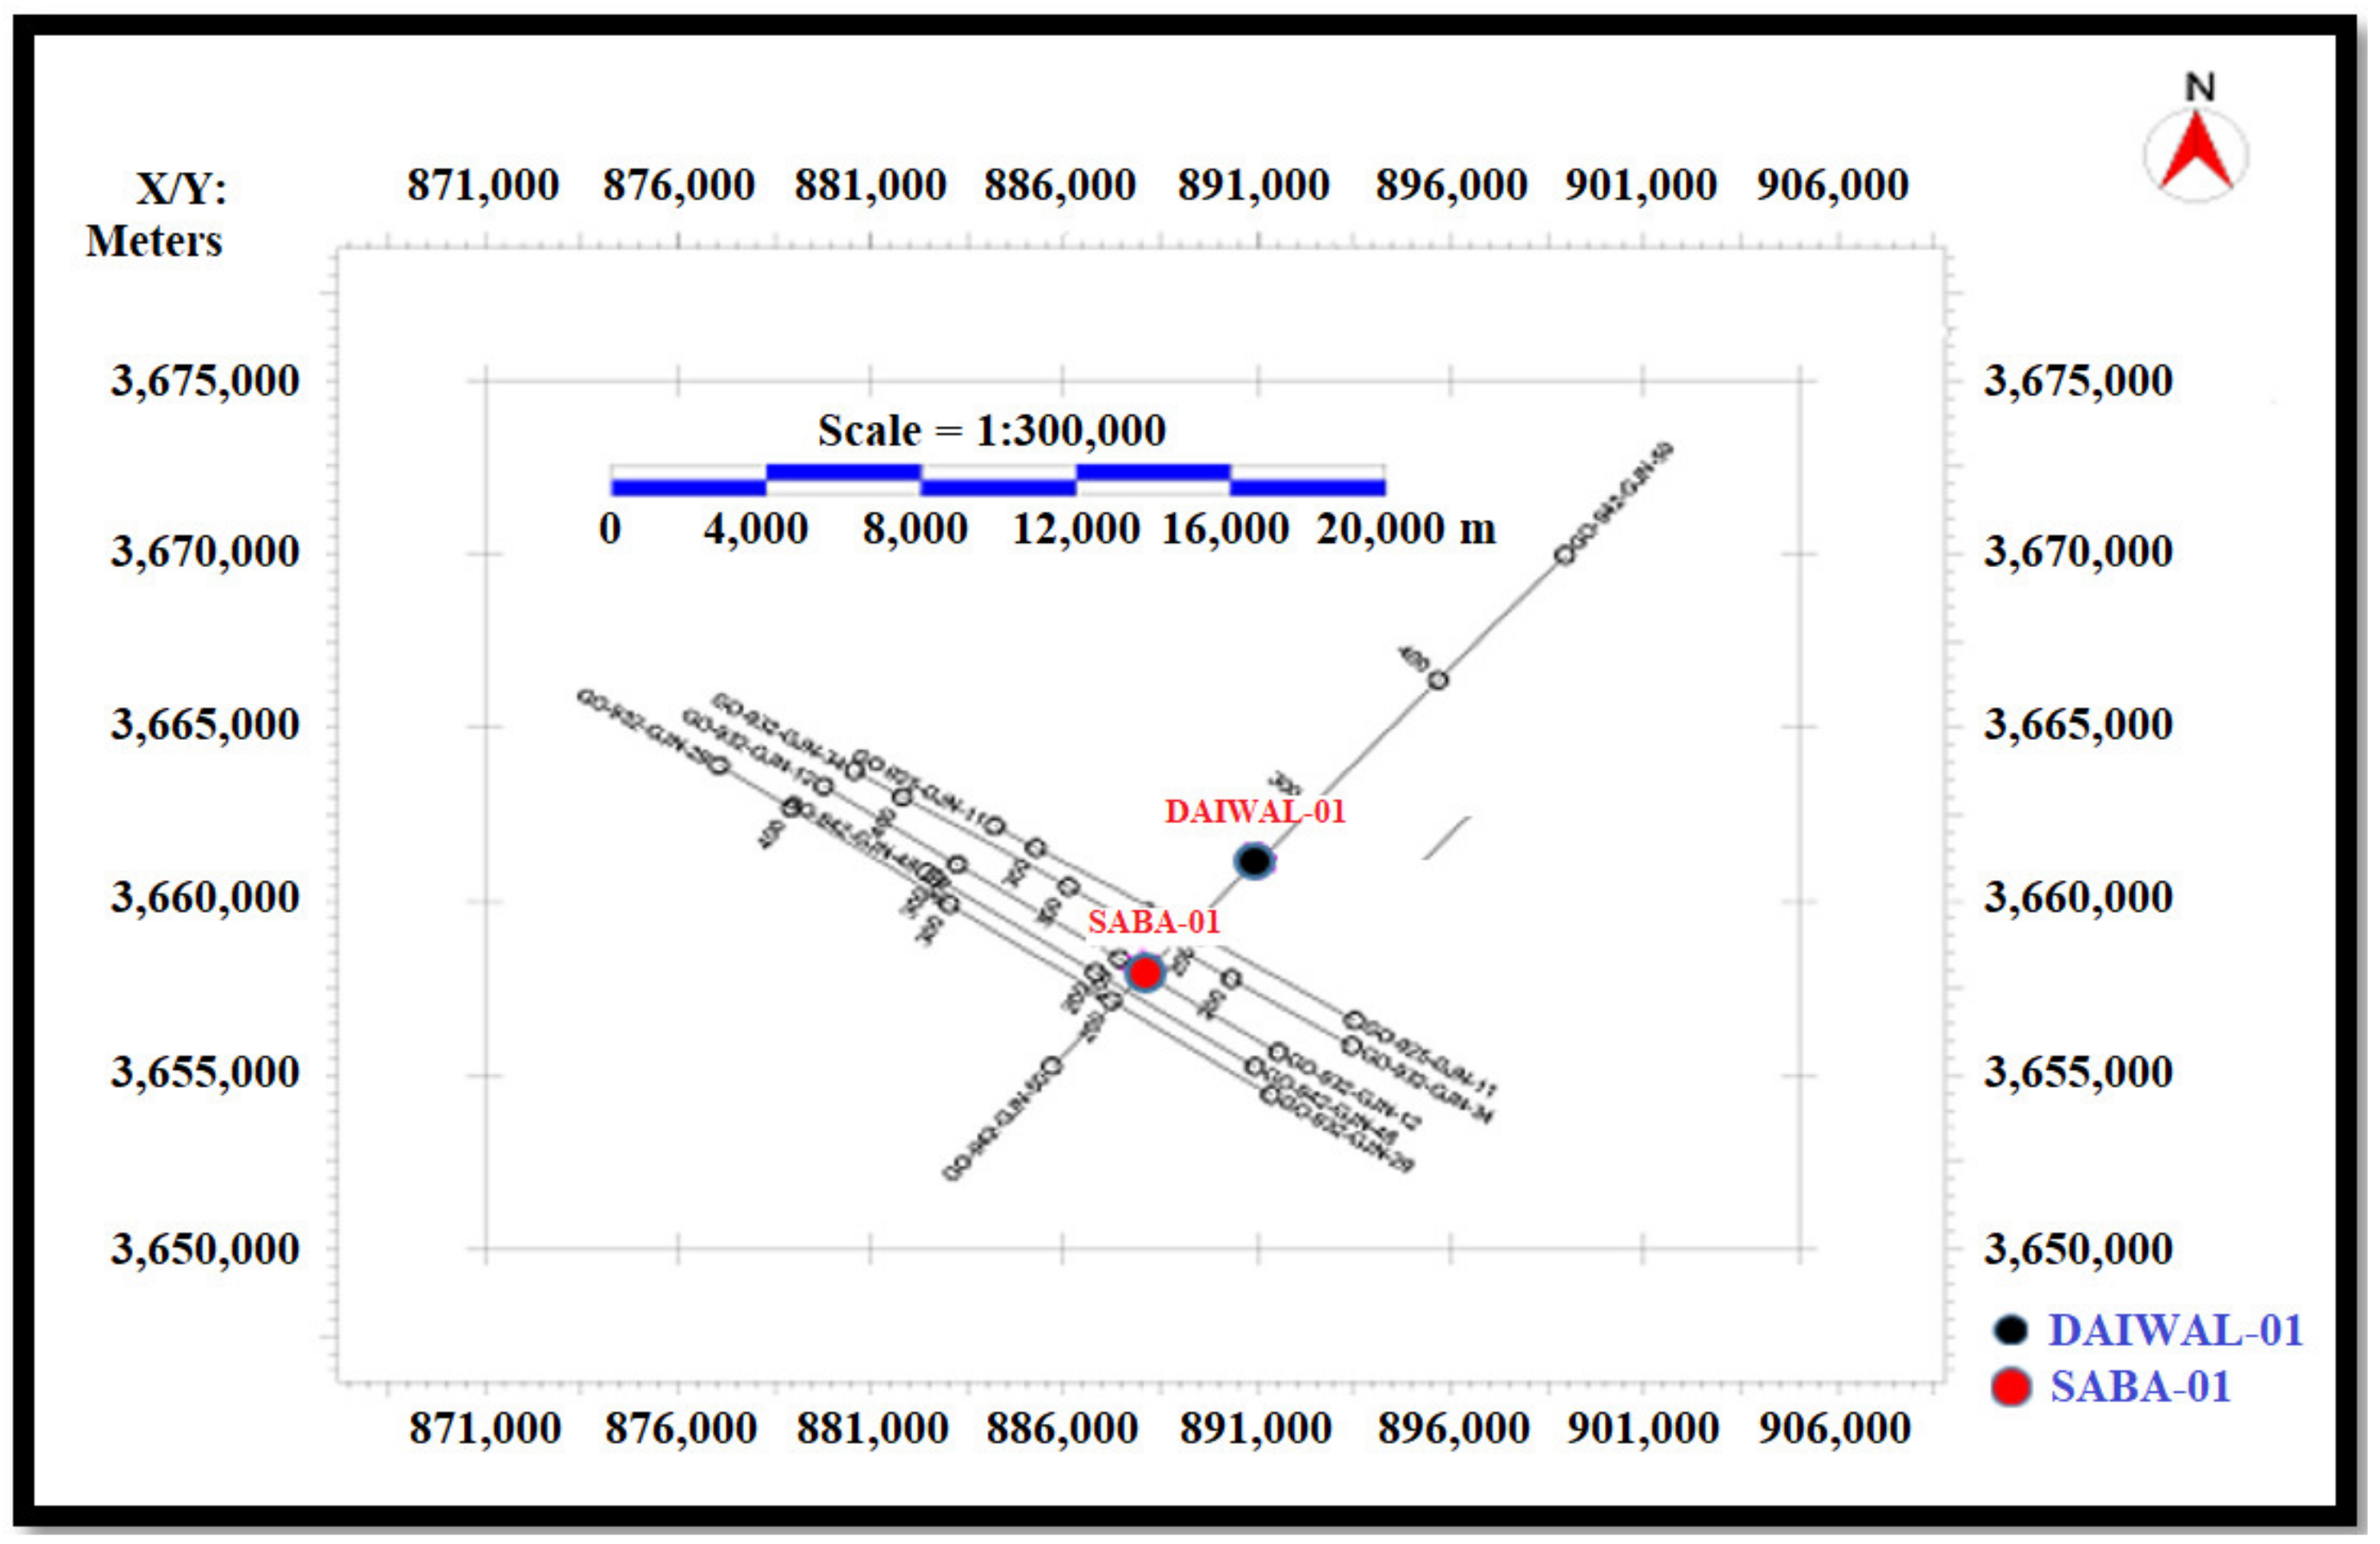
Figure 3.
Base map of the Rajian area showing Saba-01 and Daiwal-01 wells.
Figure 3.
Base map of the Rajian area showing Saba-01 and Daiwal-01 wells.
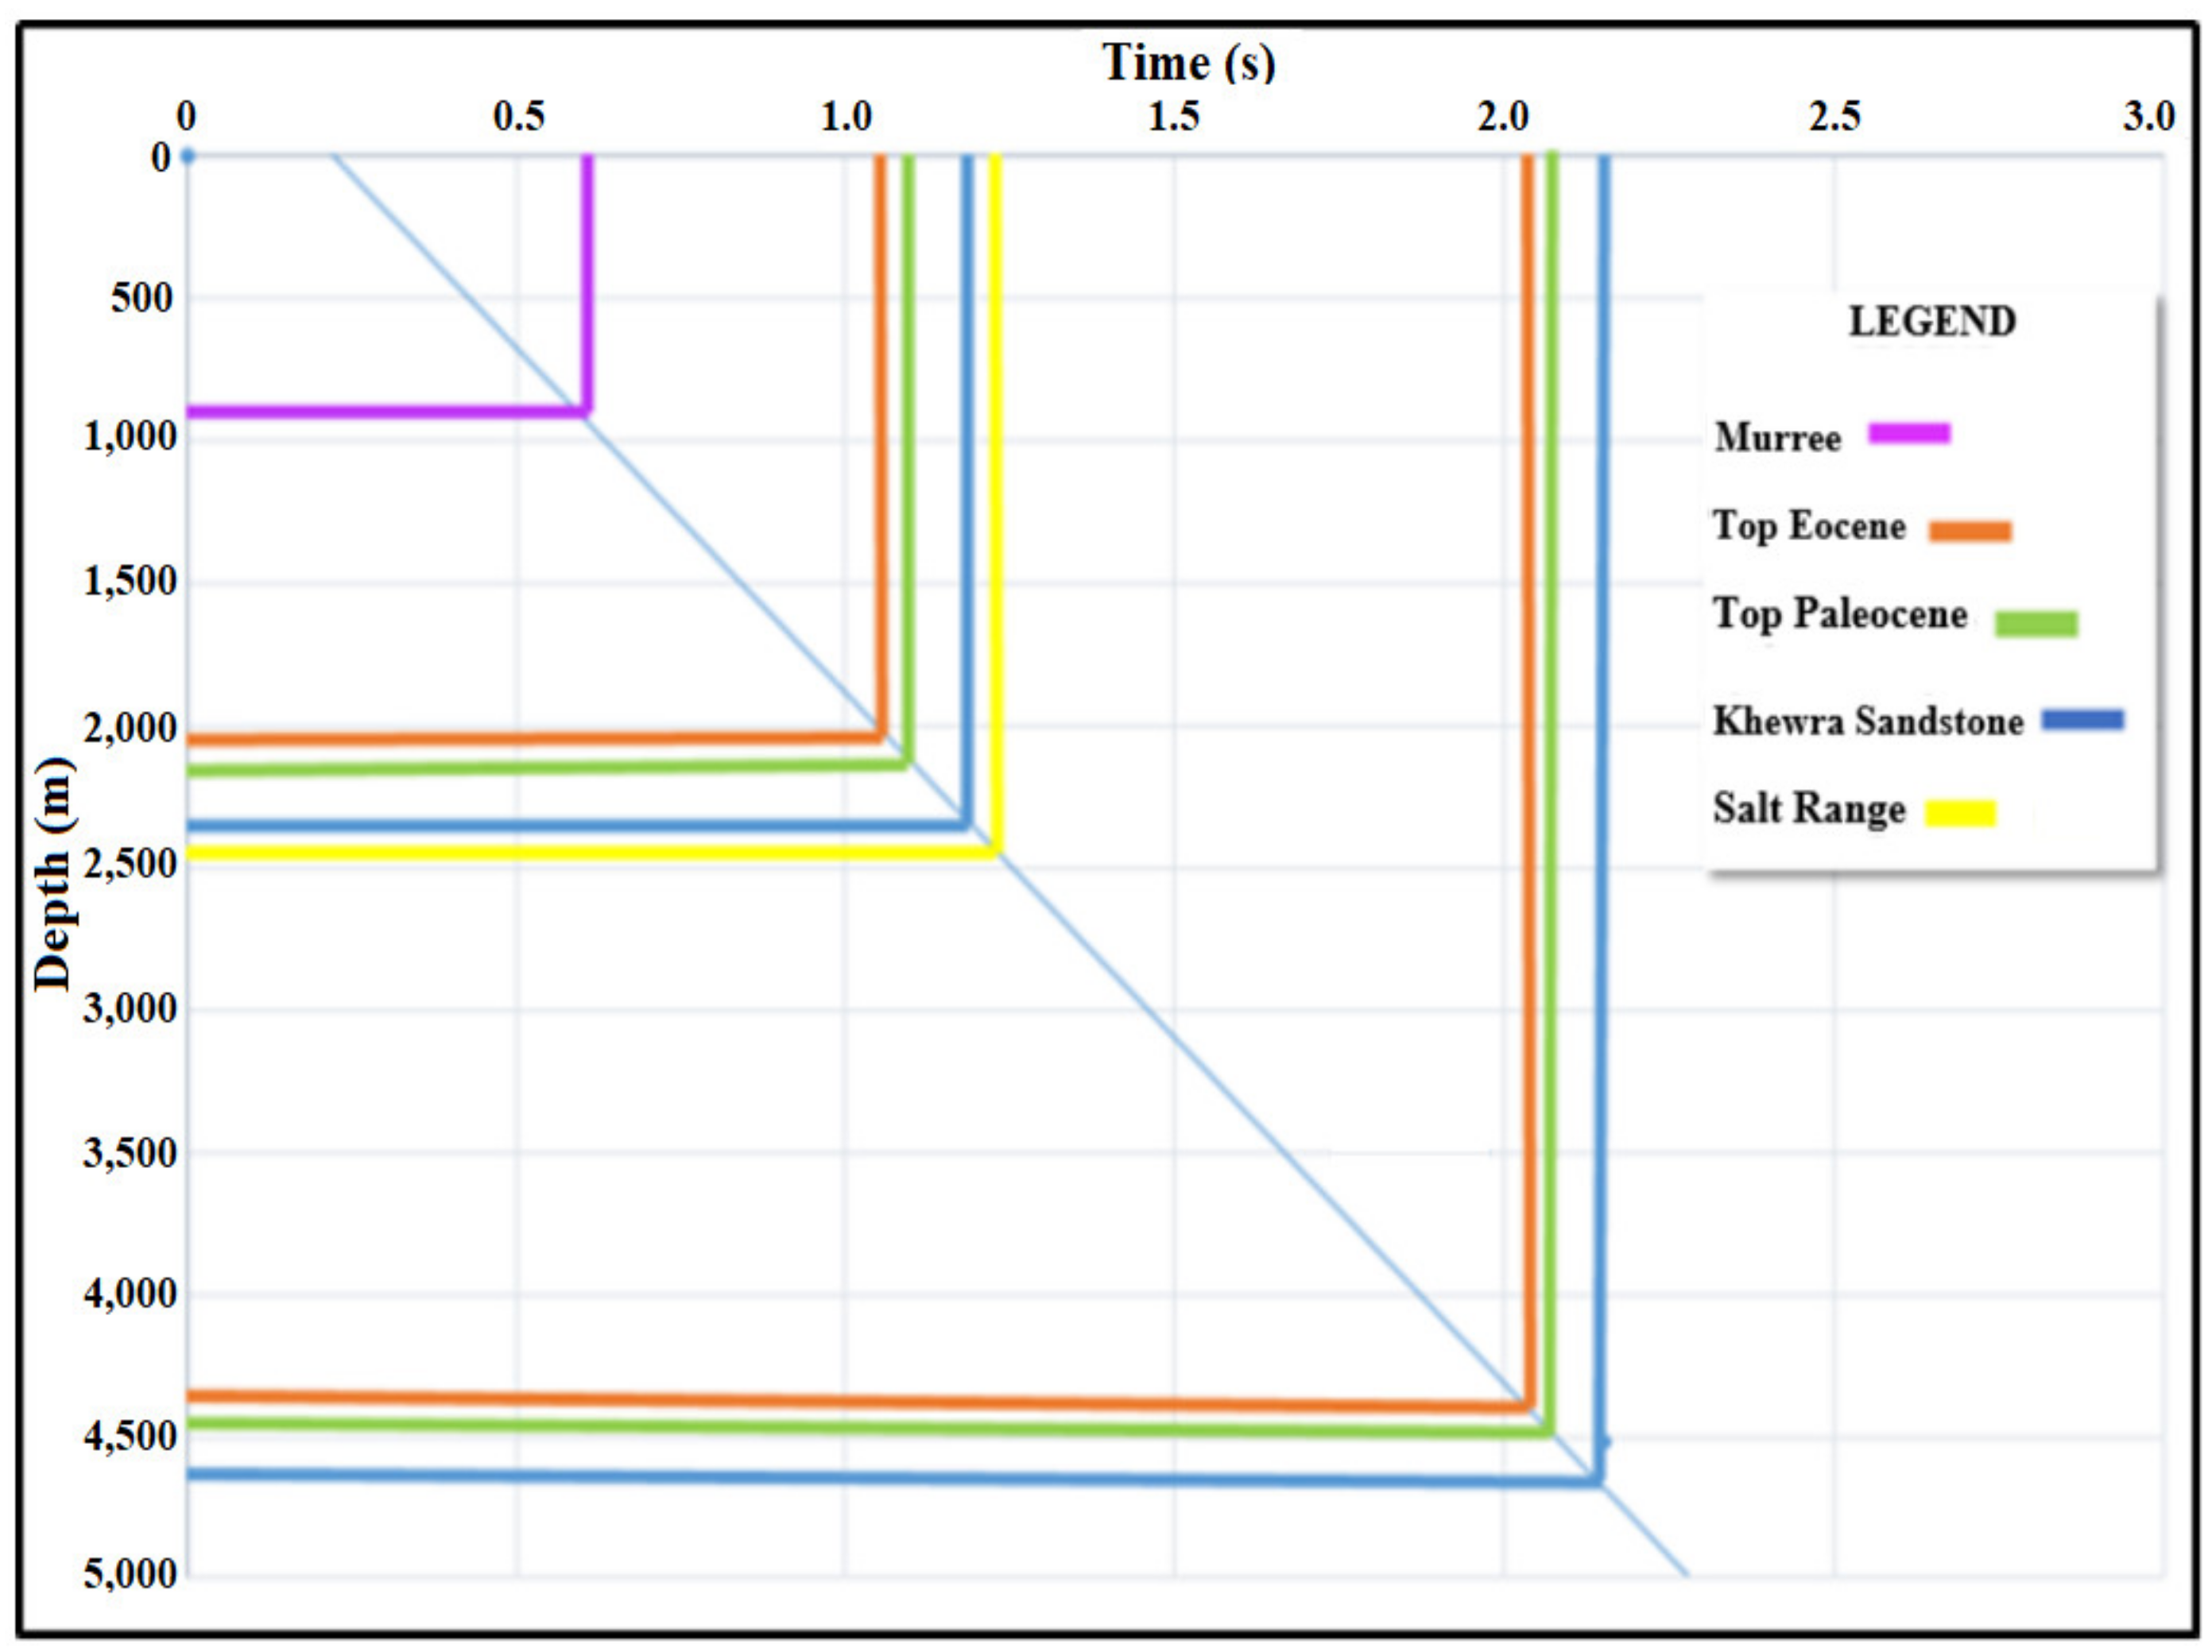
Figure 4.
Time depth (TD) chart.
Figure 4.
Time depth (TD) chart.
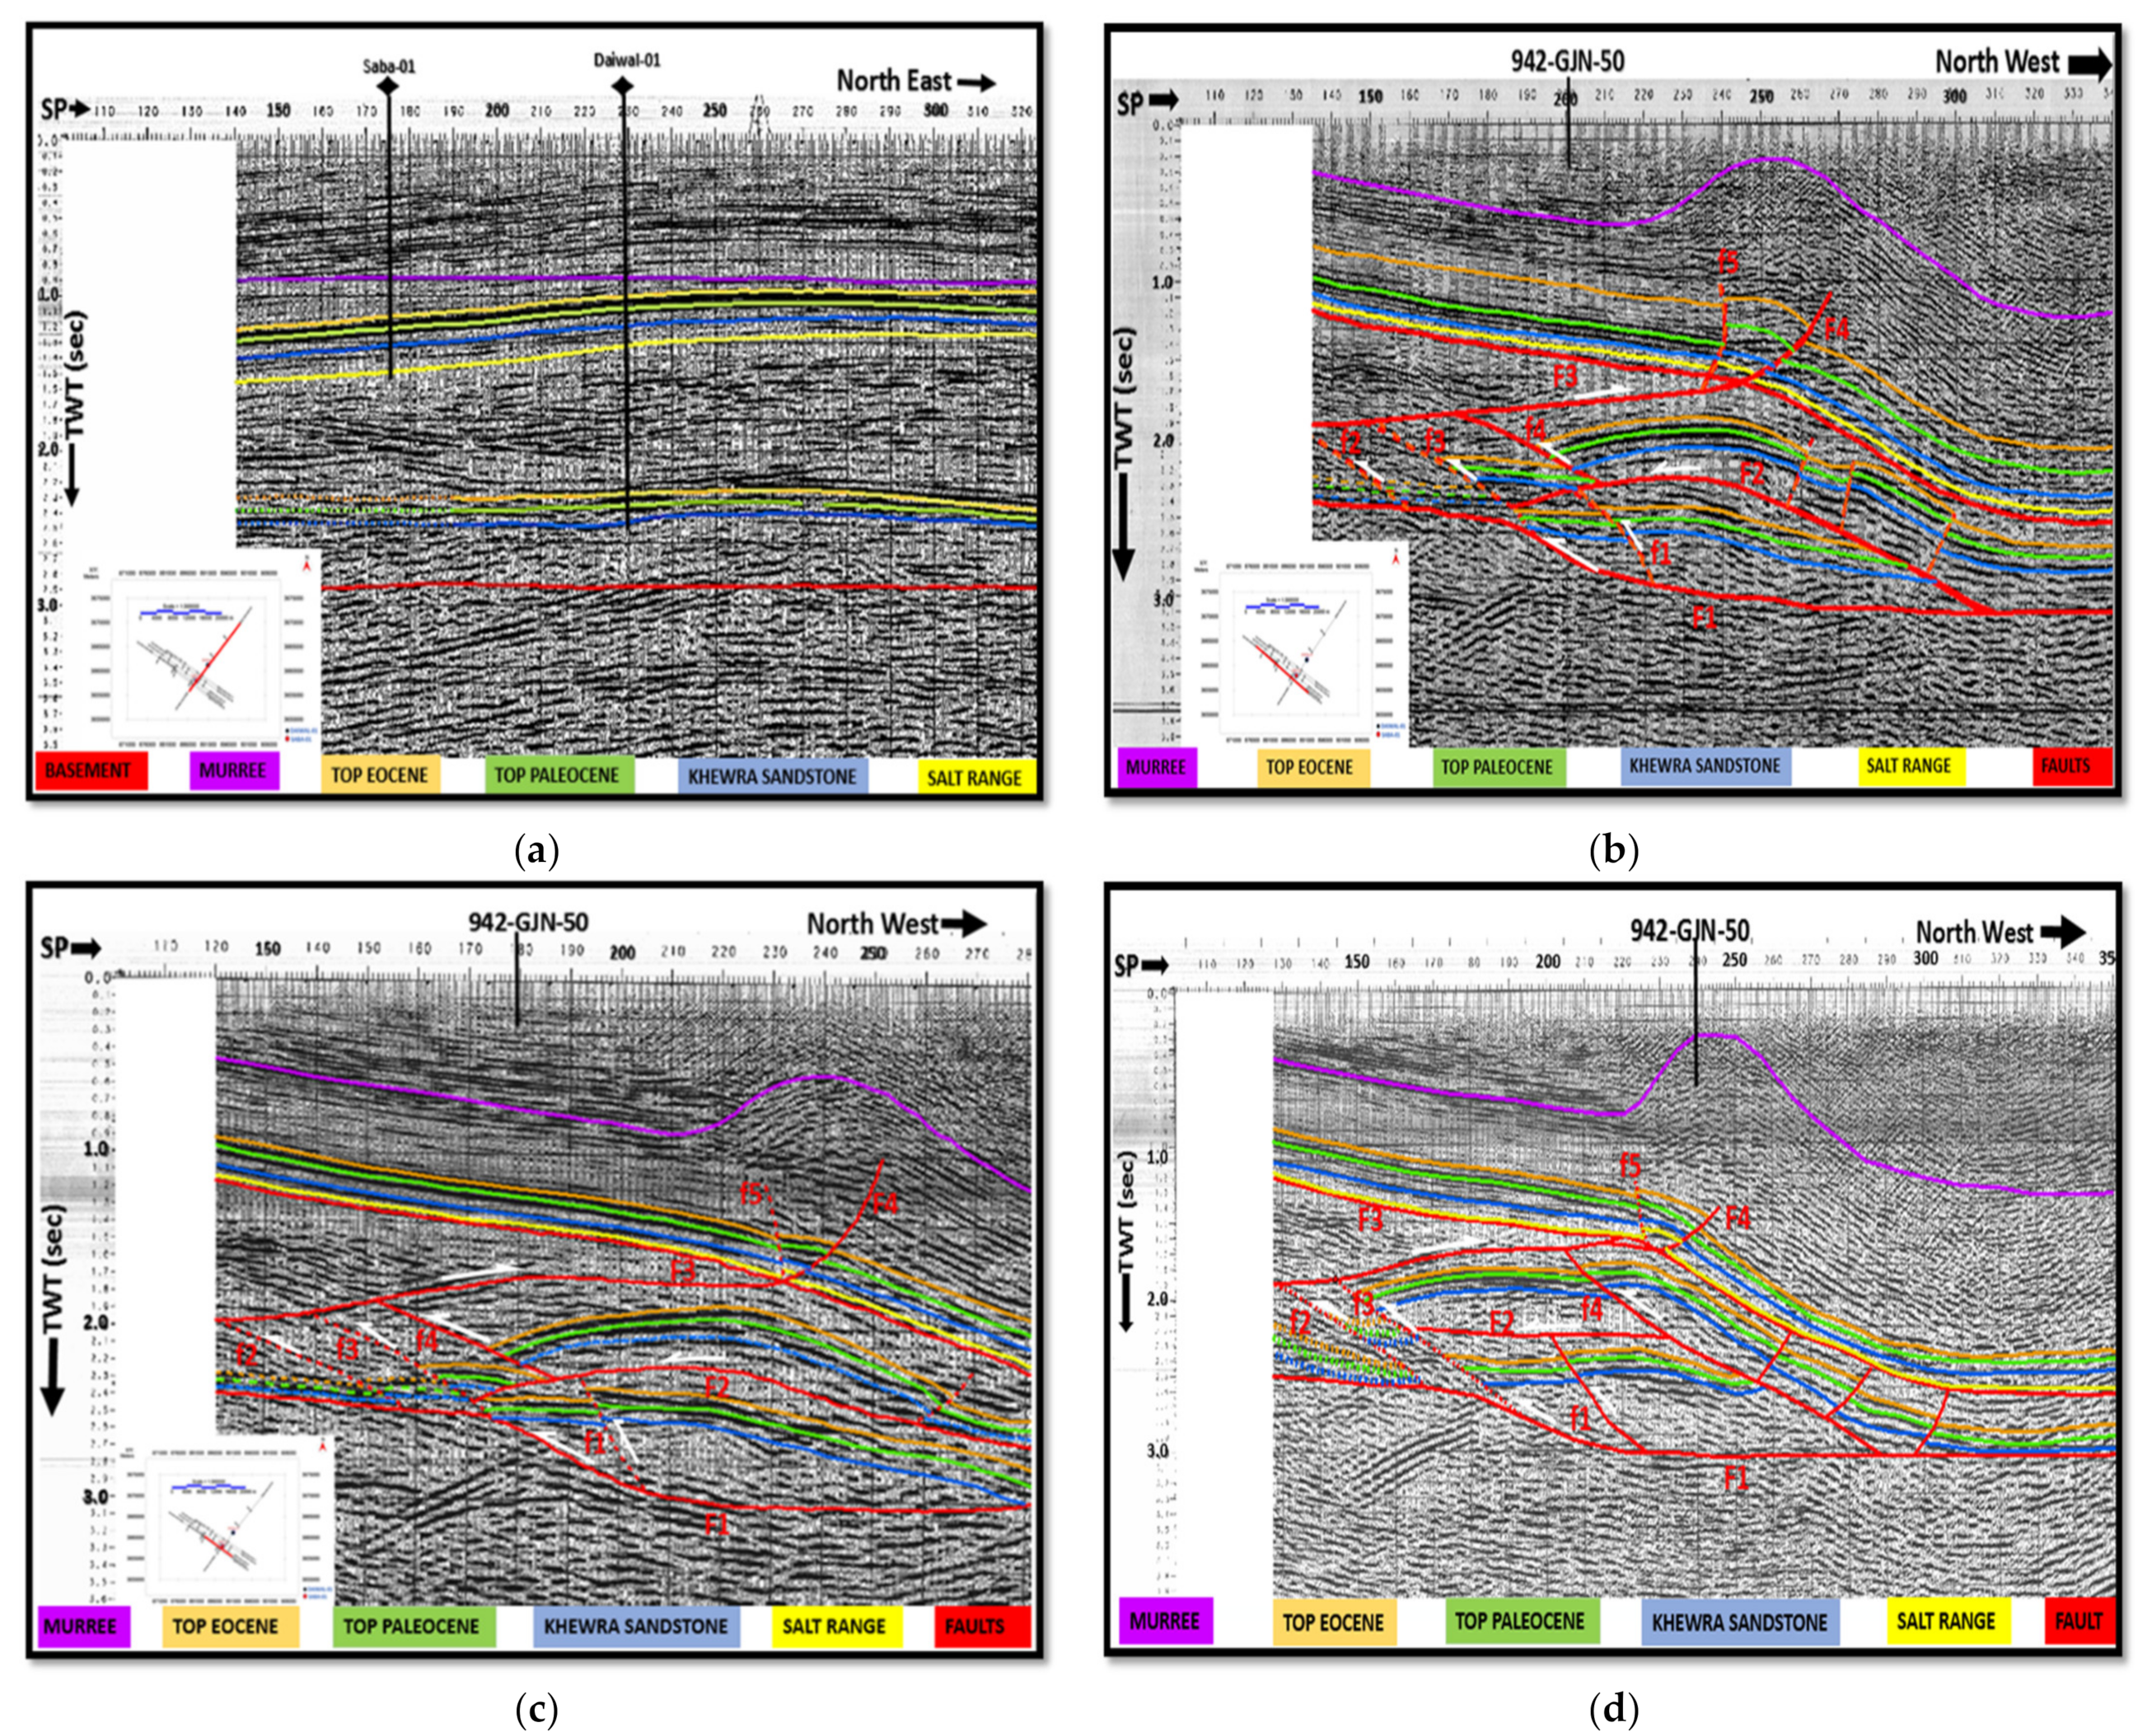
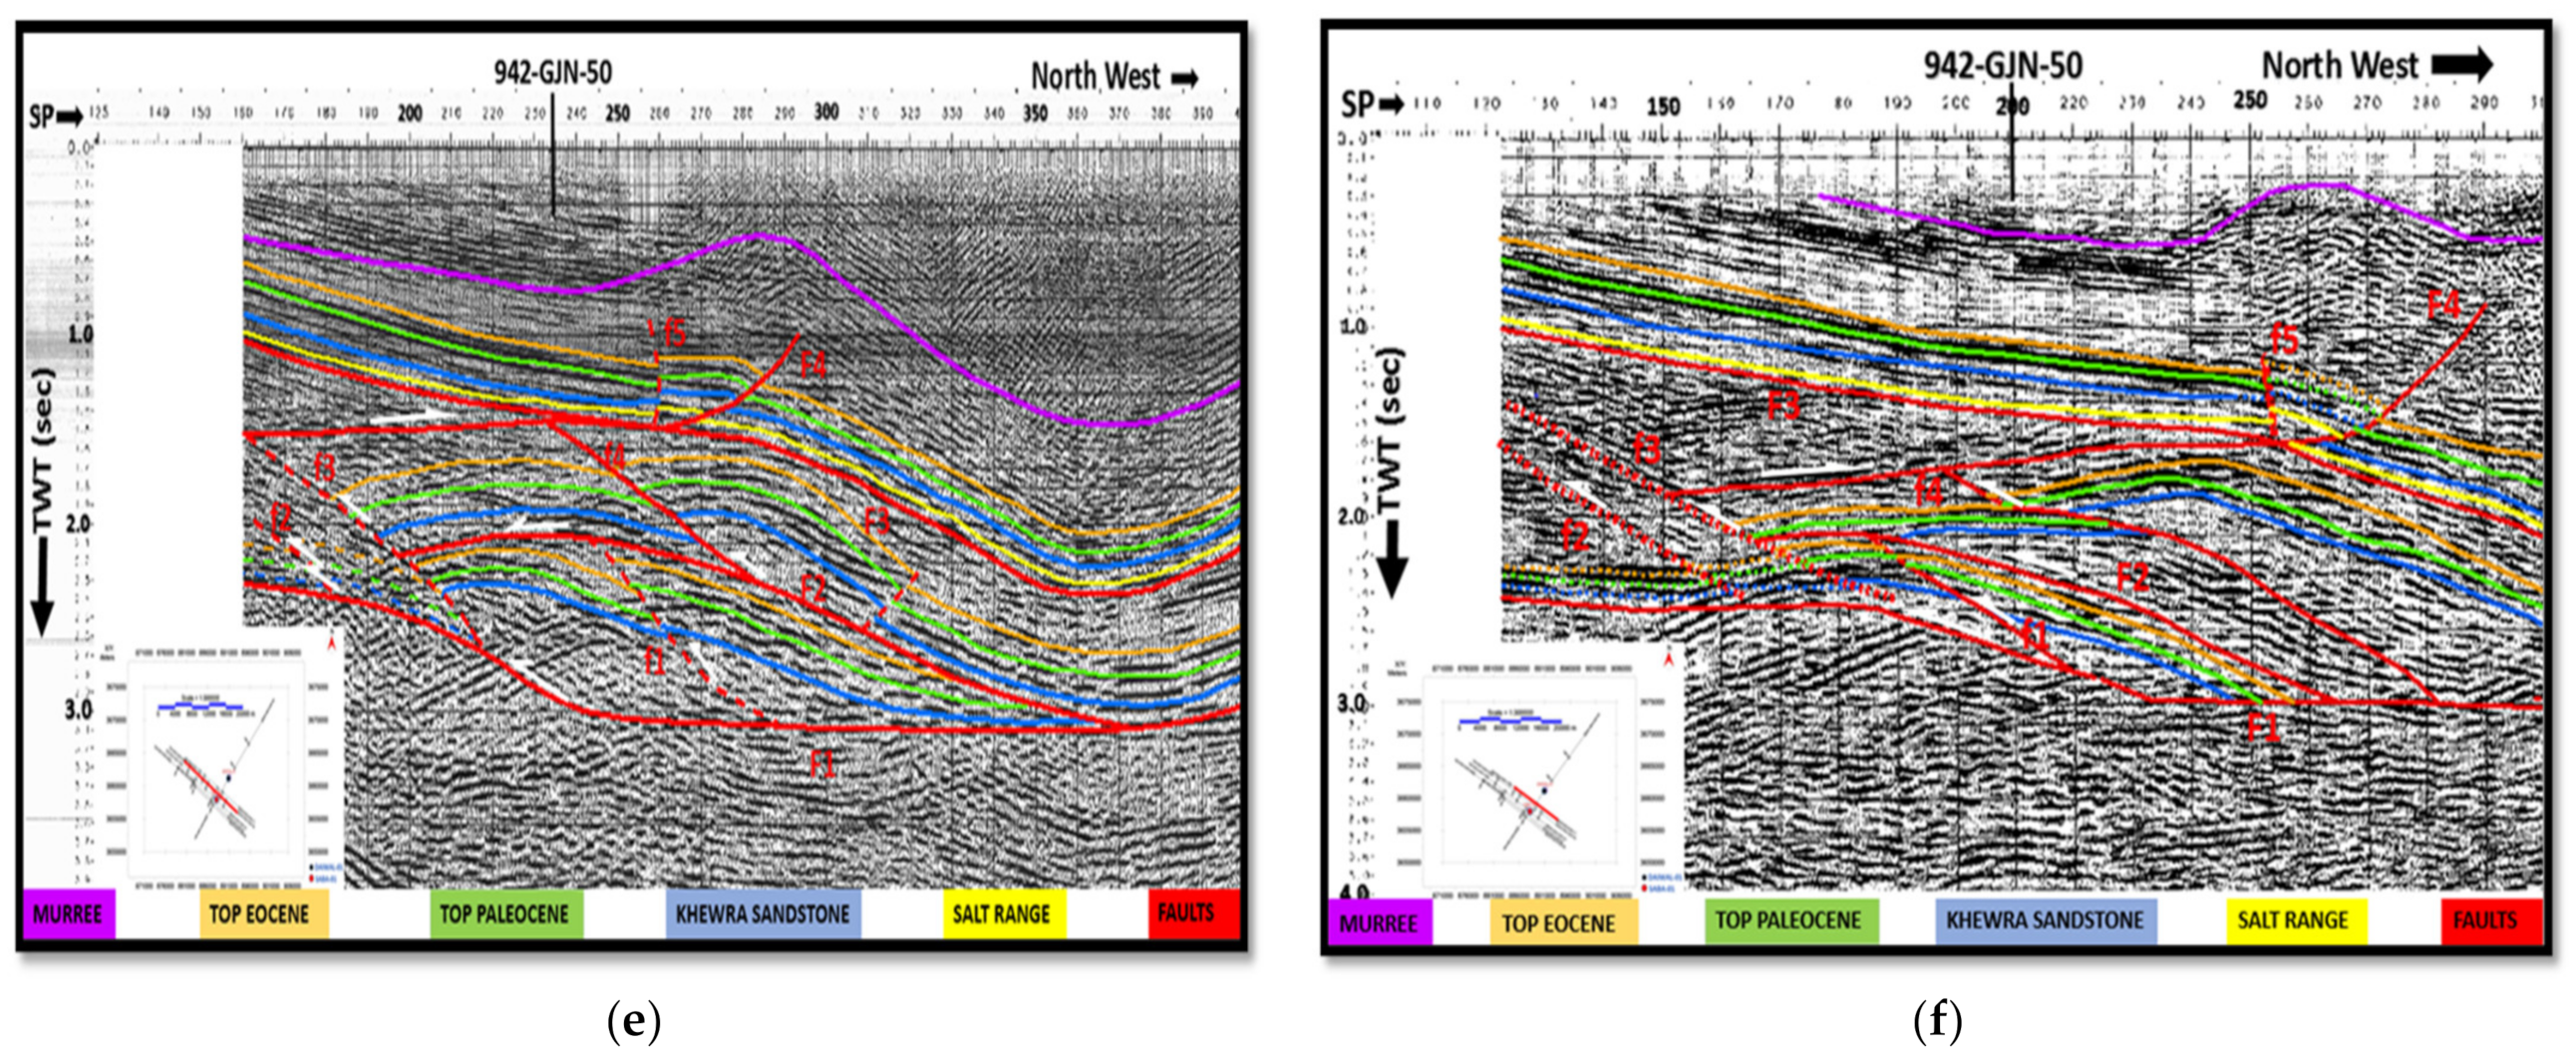
Figure 5.
Interpretation of the seismic lines: (a) 942-GJN-50 line, (b) 942-GJN-29 line, (c) 942-GJN-48 line, (d) 932-GJN-12 line, (e) 932-GJN-34 line, and (f) GO-925-GJN-11 line.
Figure 5.
Interpretation of the seismic lines: (a) 942-GJN-50 line, (b) 942-GJN-29 line, (c) 942-GJN-48 line, (d) 932-GJN-12 line, (e) 932-GJN-34 line, and (f) GO-925-GJN-11 line.
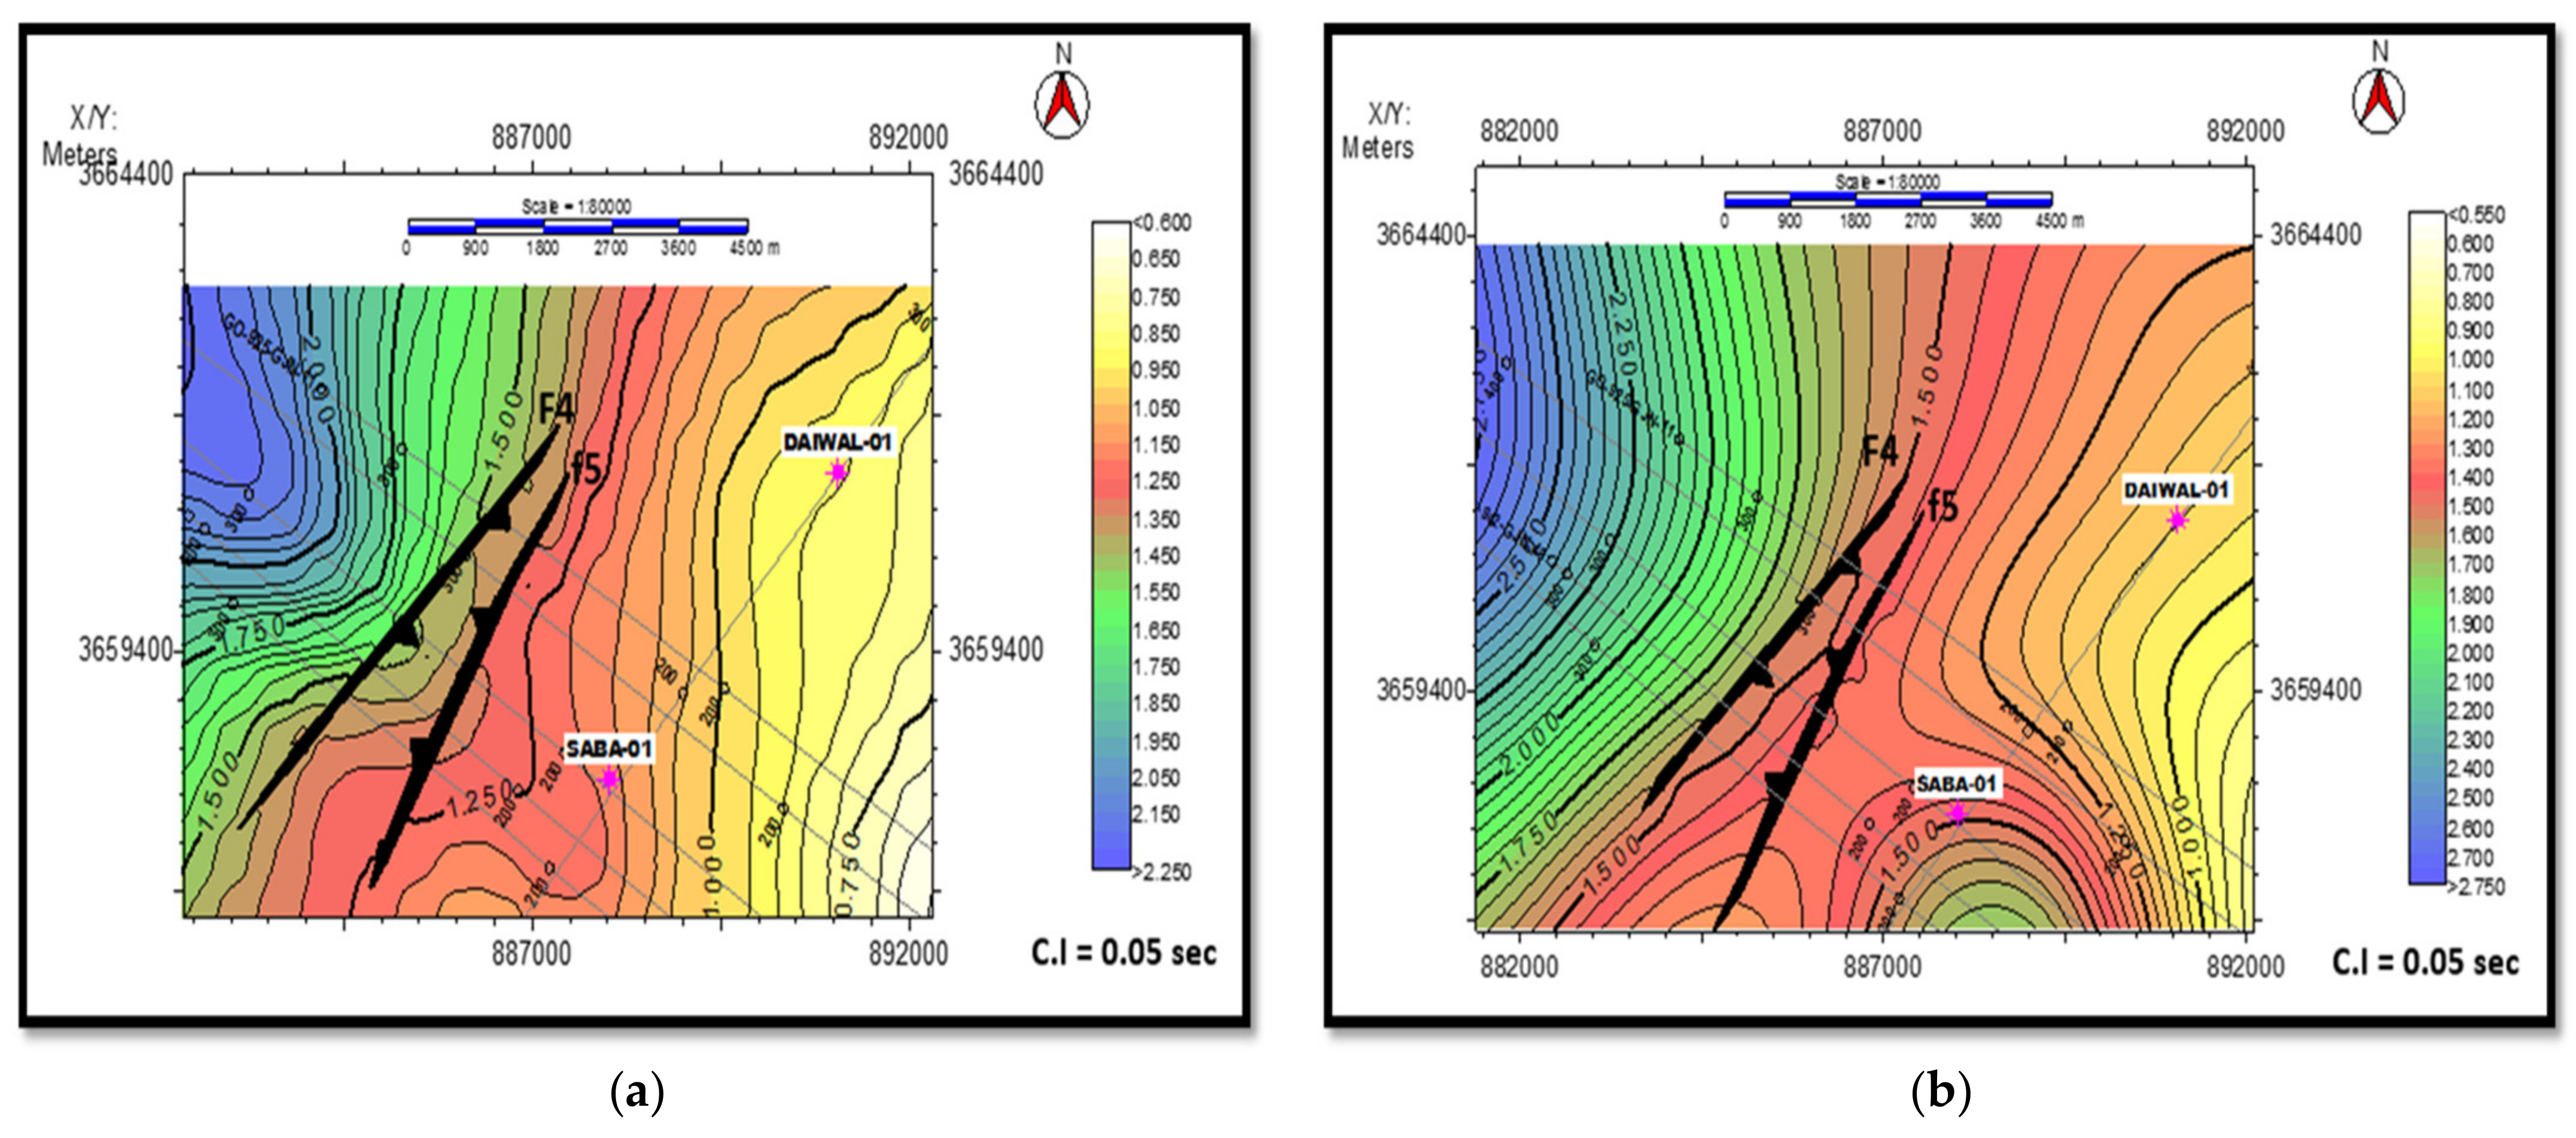
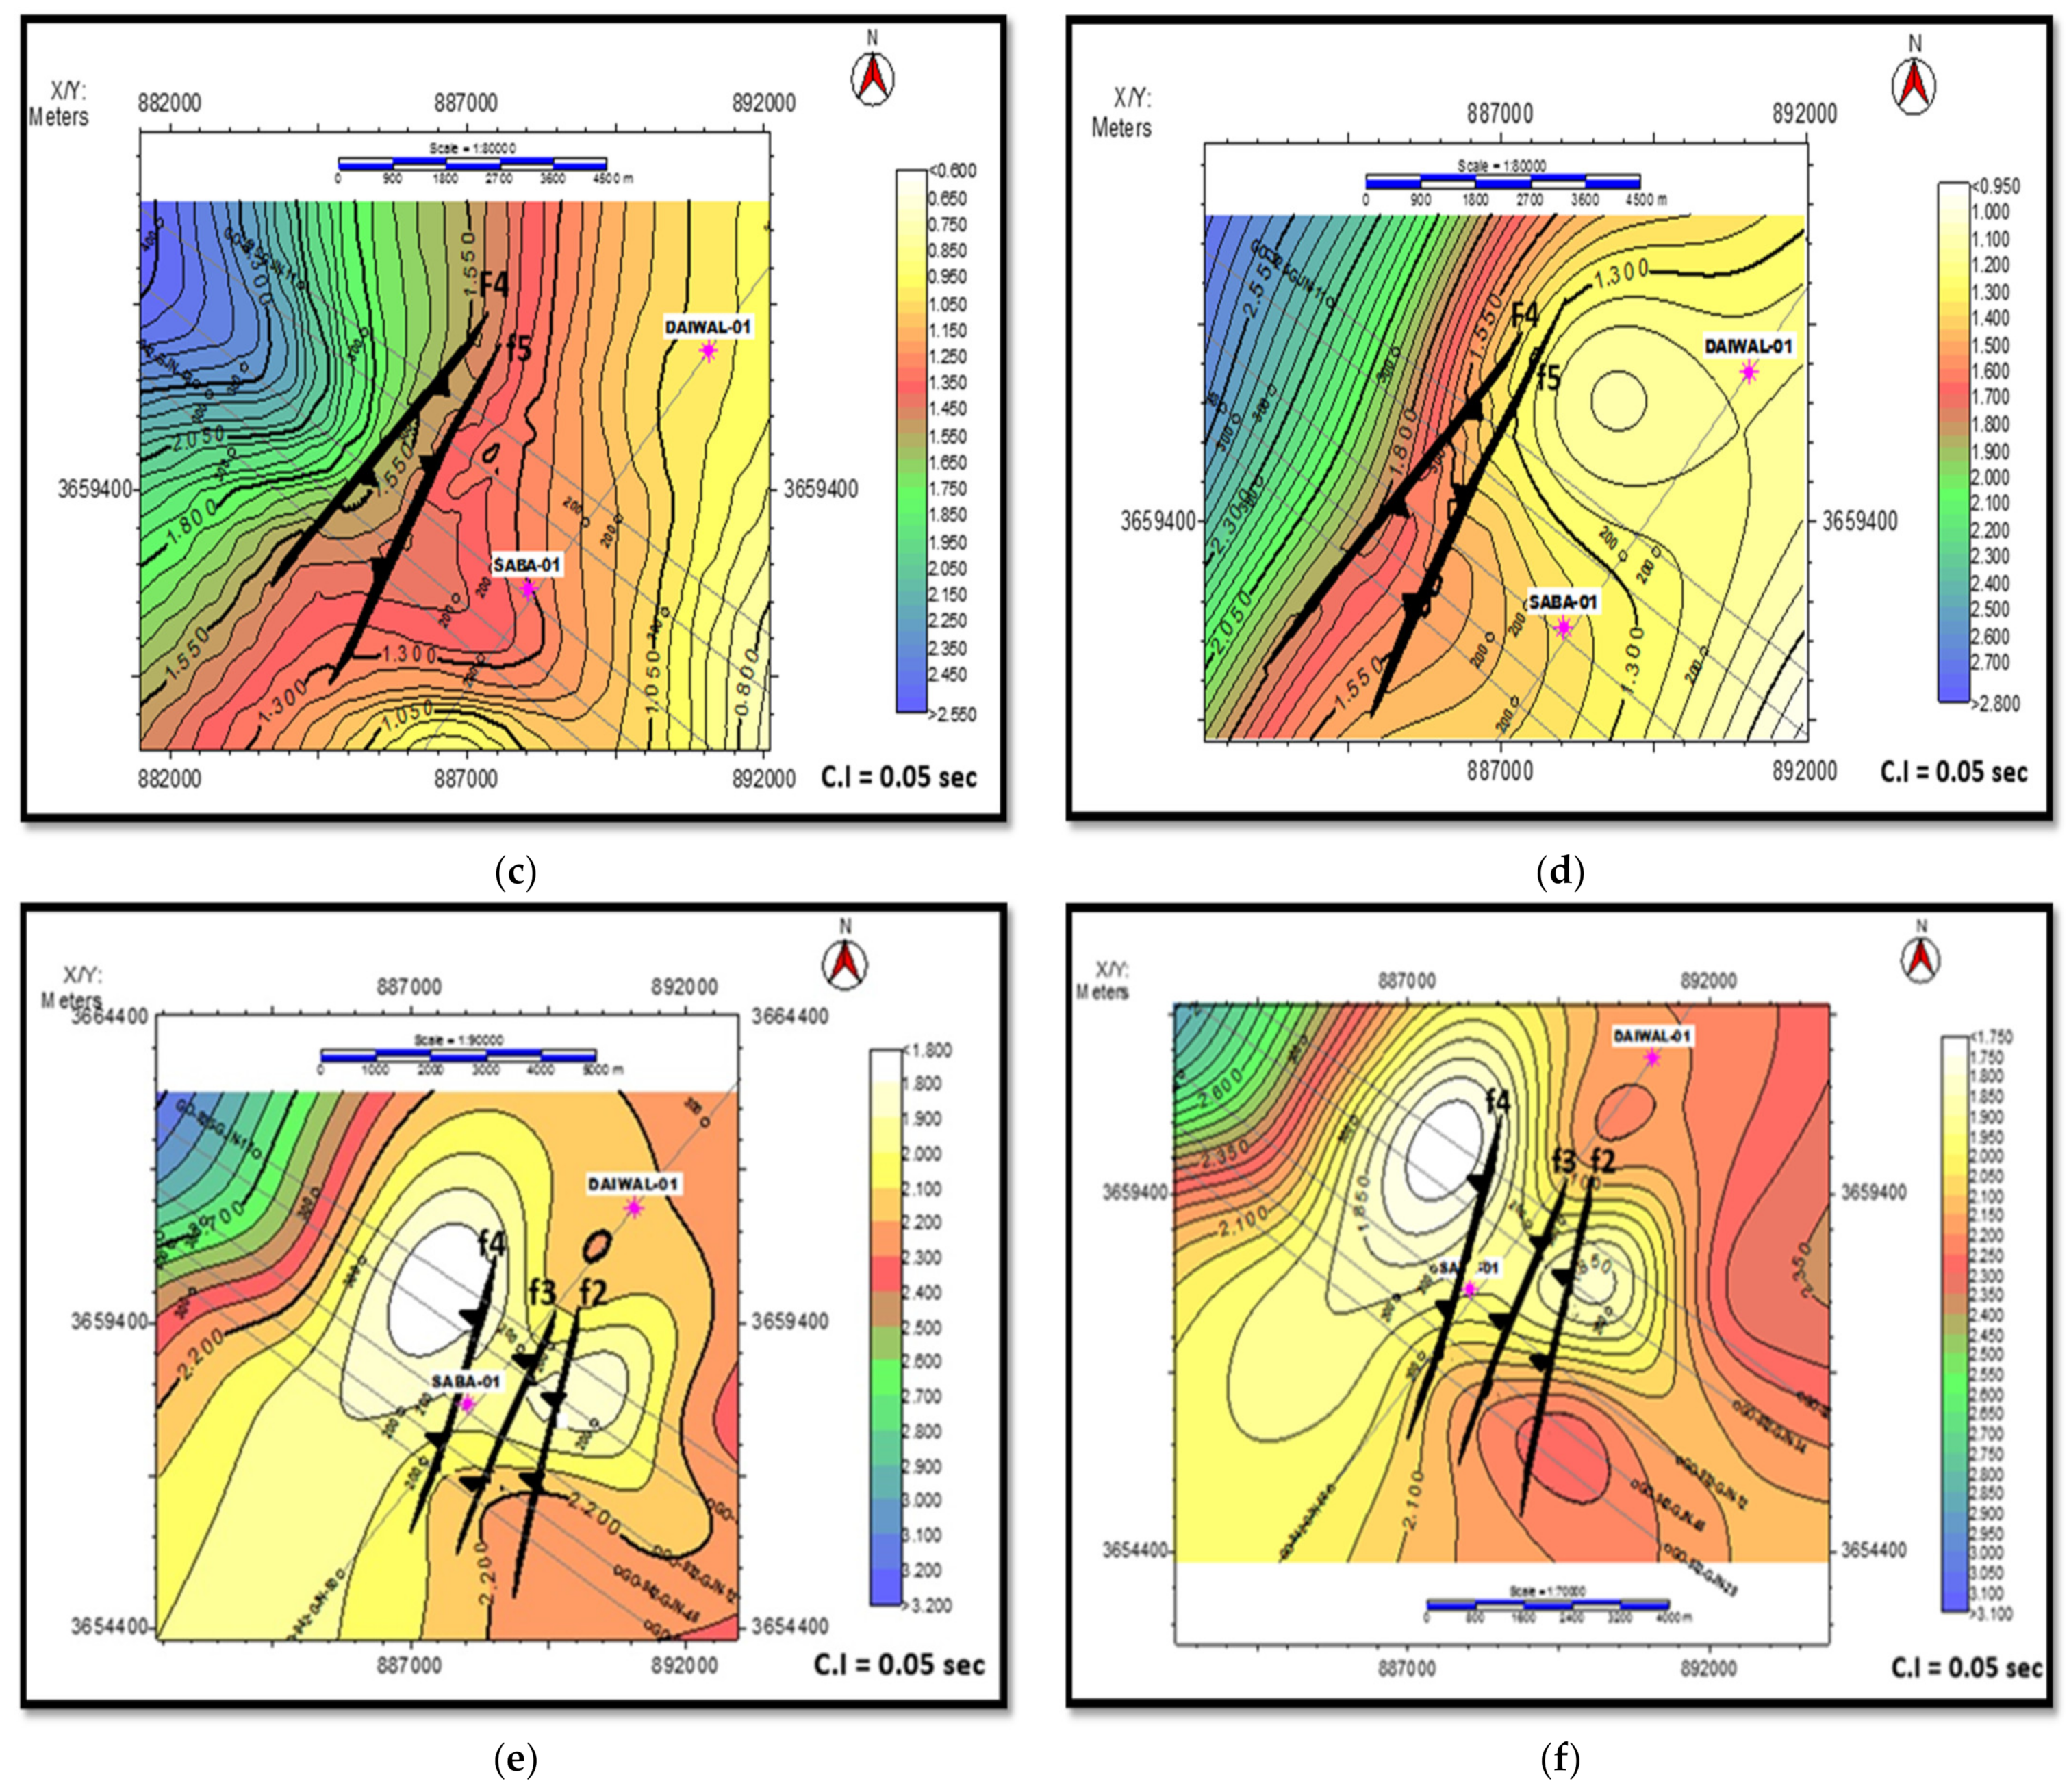
Figure 6.
Time contour maps for Contour Interval (C.I) of 0.05 sec, for (a) top Eocene 1, (b) top Paleocene 1, (c) Khewra sandstone 1, (d) walt range 1, (e) top Eocene 2, and (f) top Paleocene 2.
Figure 6.
Time contour maps for Contour Interval (C.I) of 0.05 sec, for (a) top Eocene 1, (b) top Paleocene 1, (c) Khewra sandstone 1, (d) walt range 1, (e) top Eocene 2, and (f) top Paleocene 2.
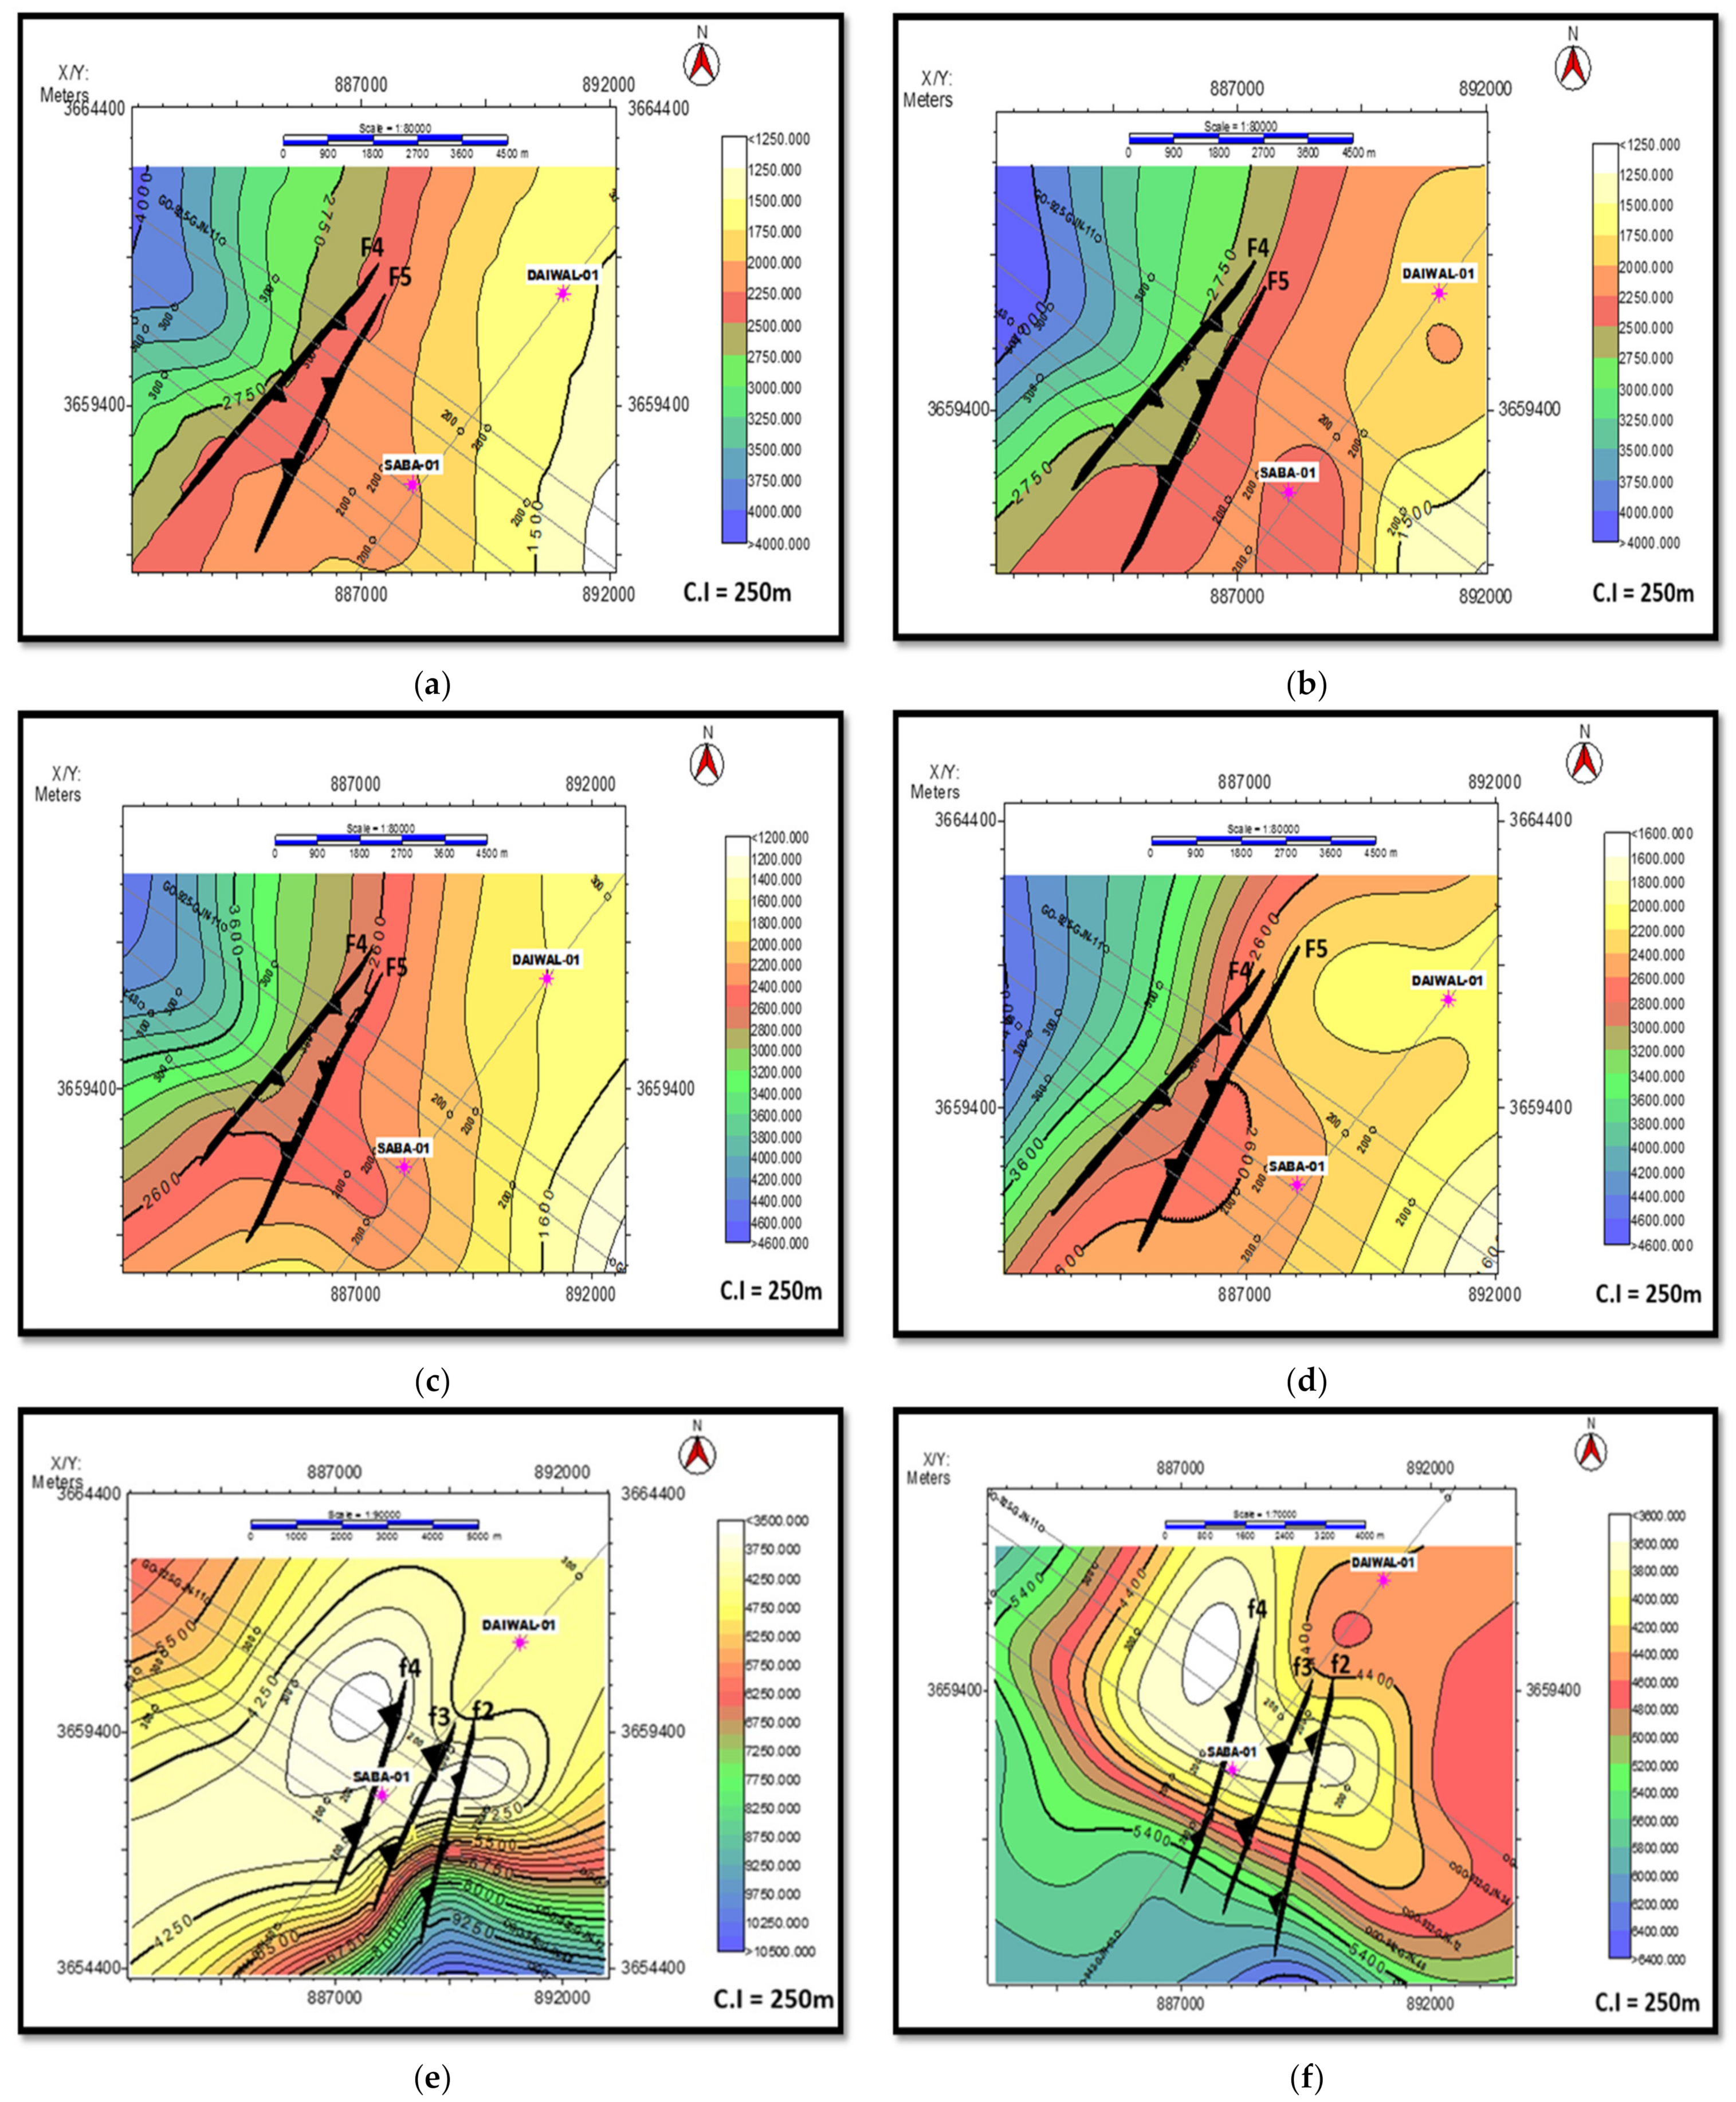
Figure 7.
Depth contour maps for Contour Interval (C.I) of 250 m, for (a) top Eocene 1, (b) top Paleocene 1, (c) Khewra sandstone 1, (d) salt range 1, (e) top Eocene 2, and (f) top Paleocene 2.
Figure 7.
Depth contour maps for Contour Interval (C.I) of 250 m, for (a) top Eocene 1, (b) top Paleocene 1, (c) Khewra sandstone 1, (d) salt range 1, (e) top Eocene 2, and (f) top Paleocene 2.
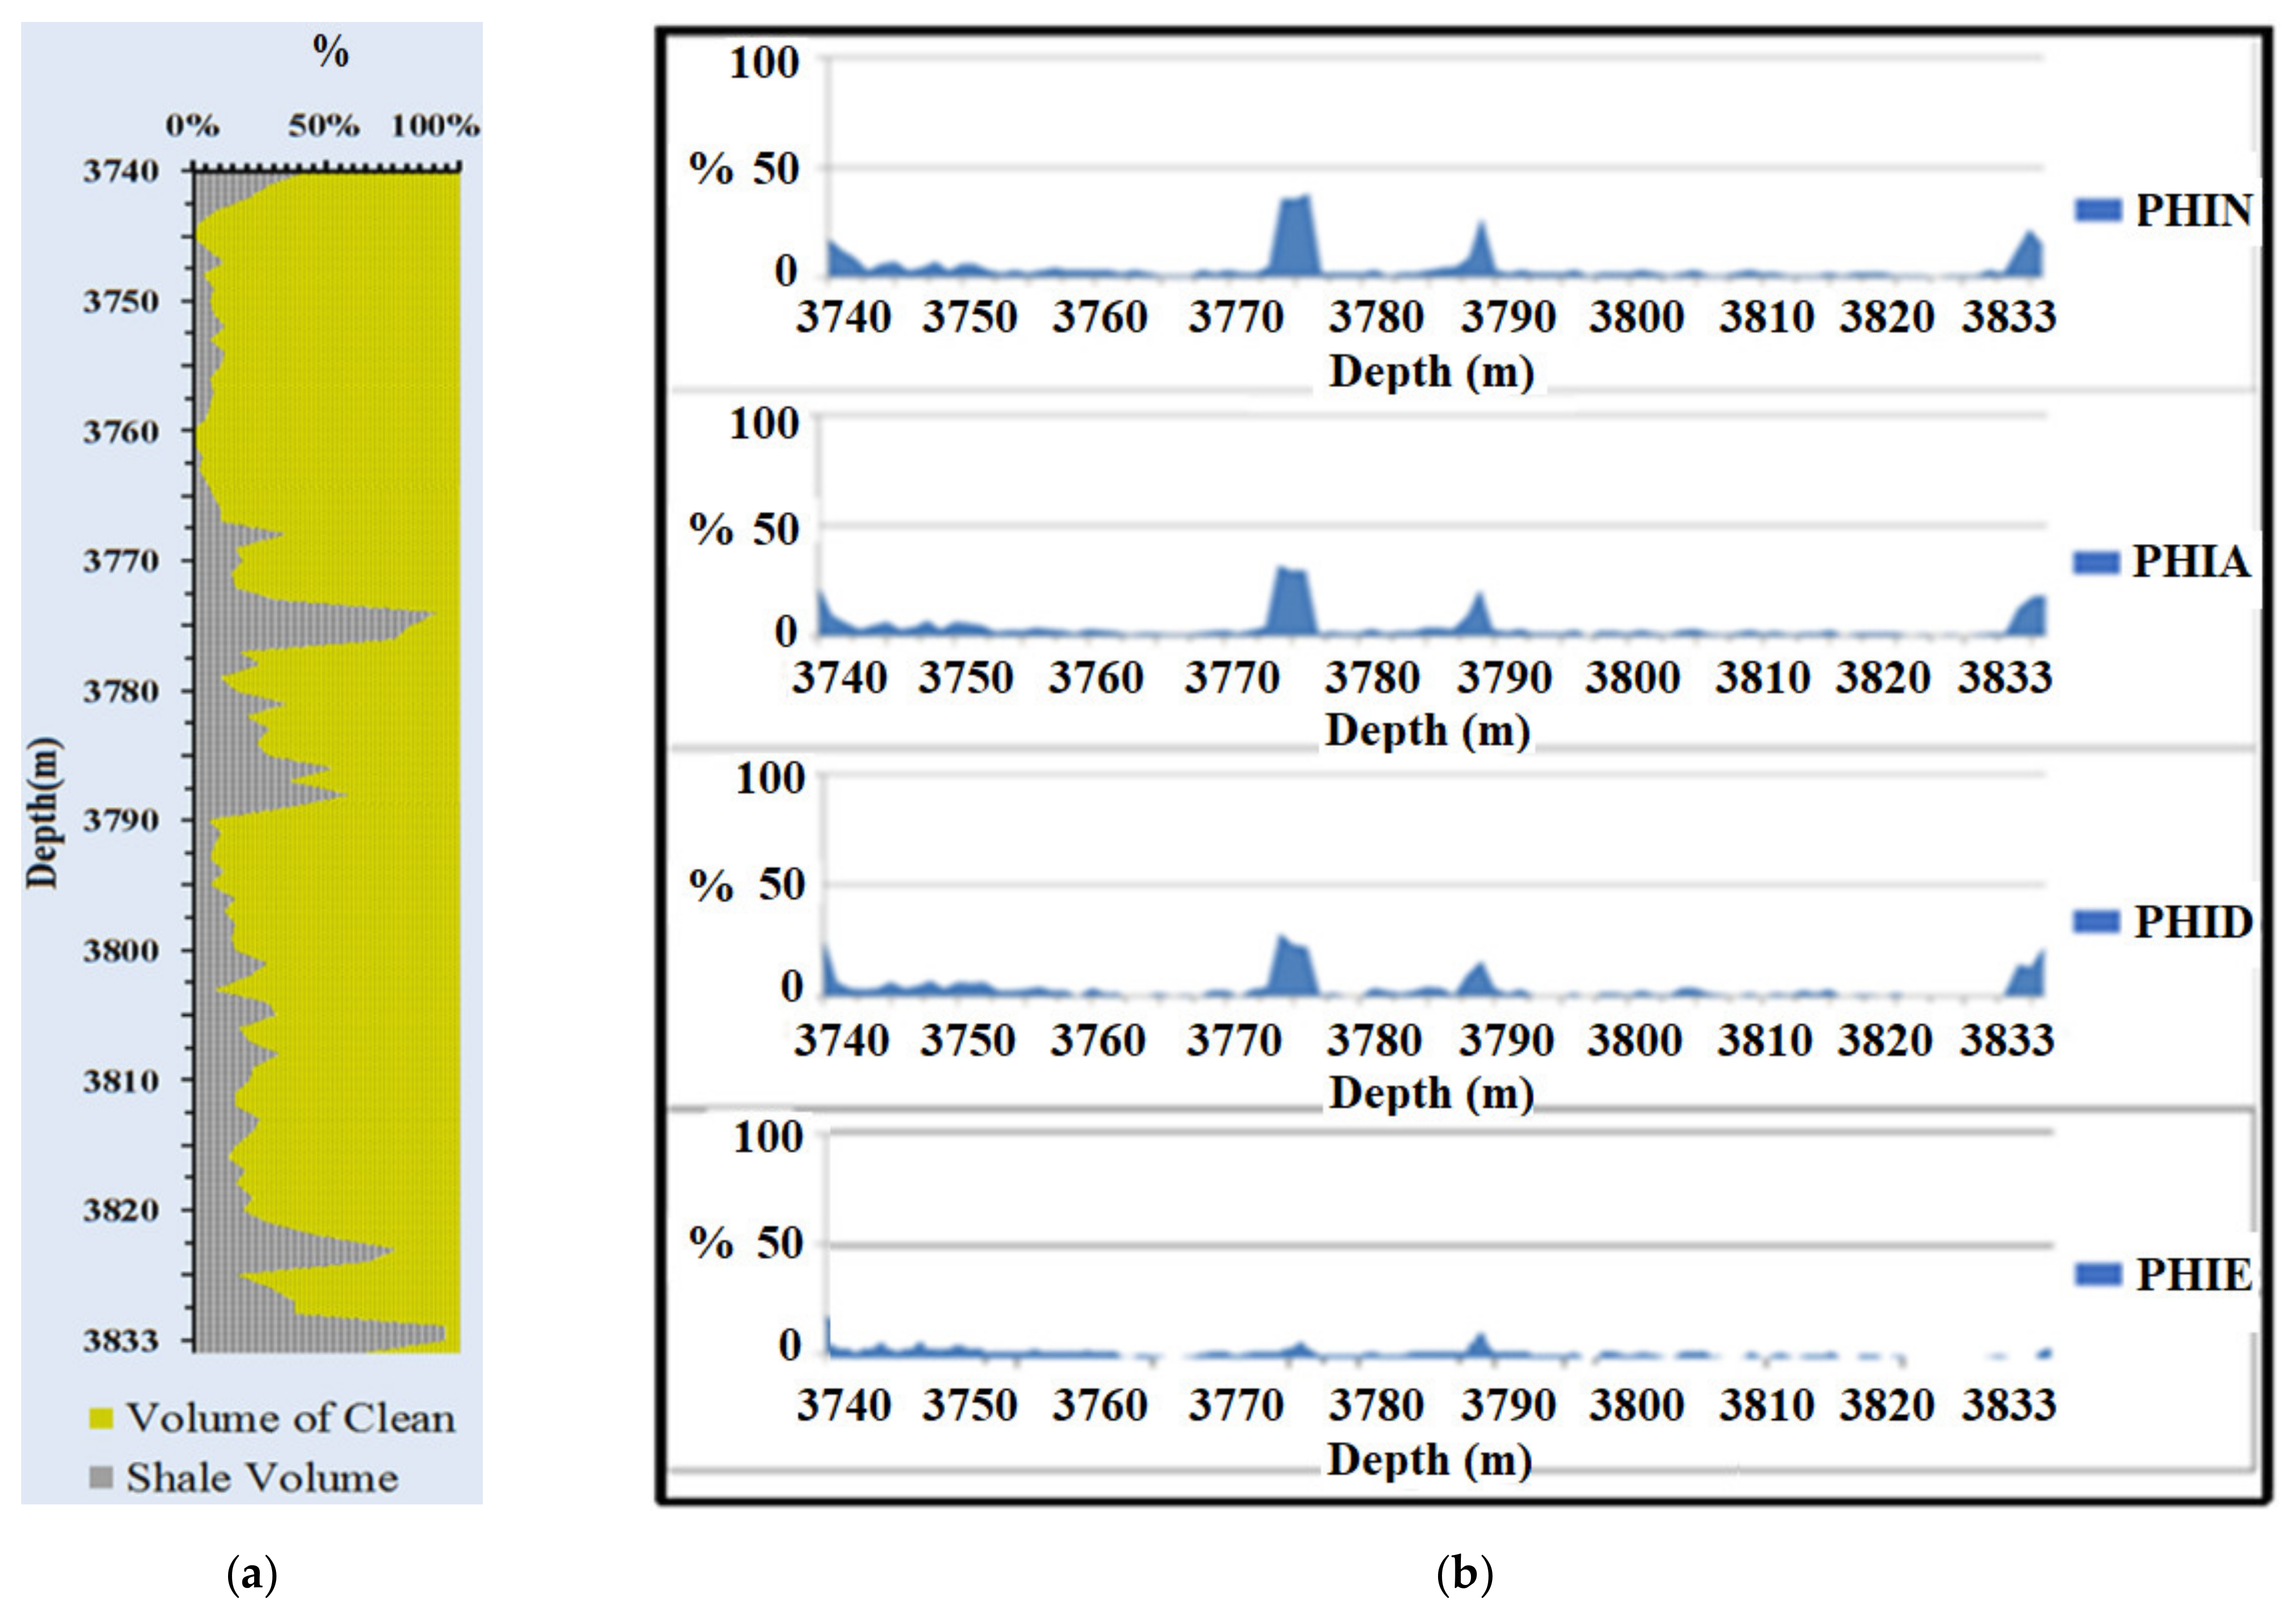
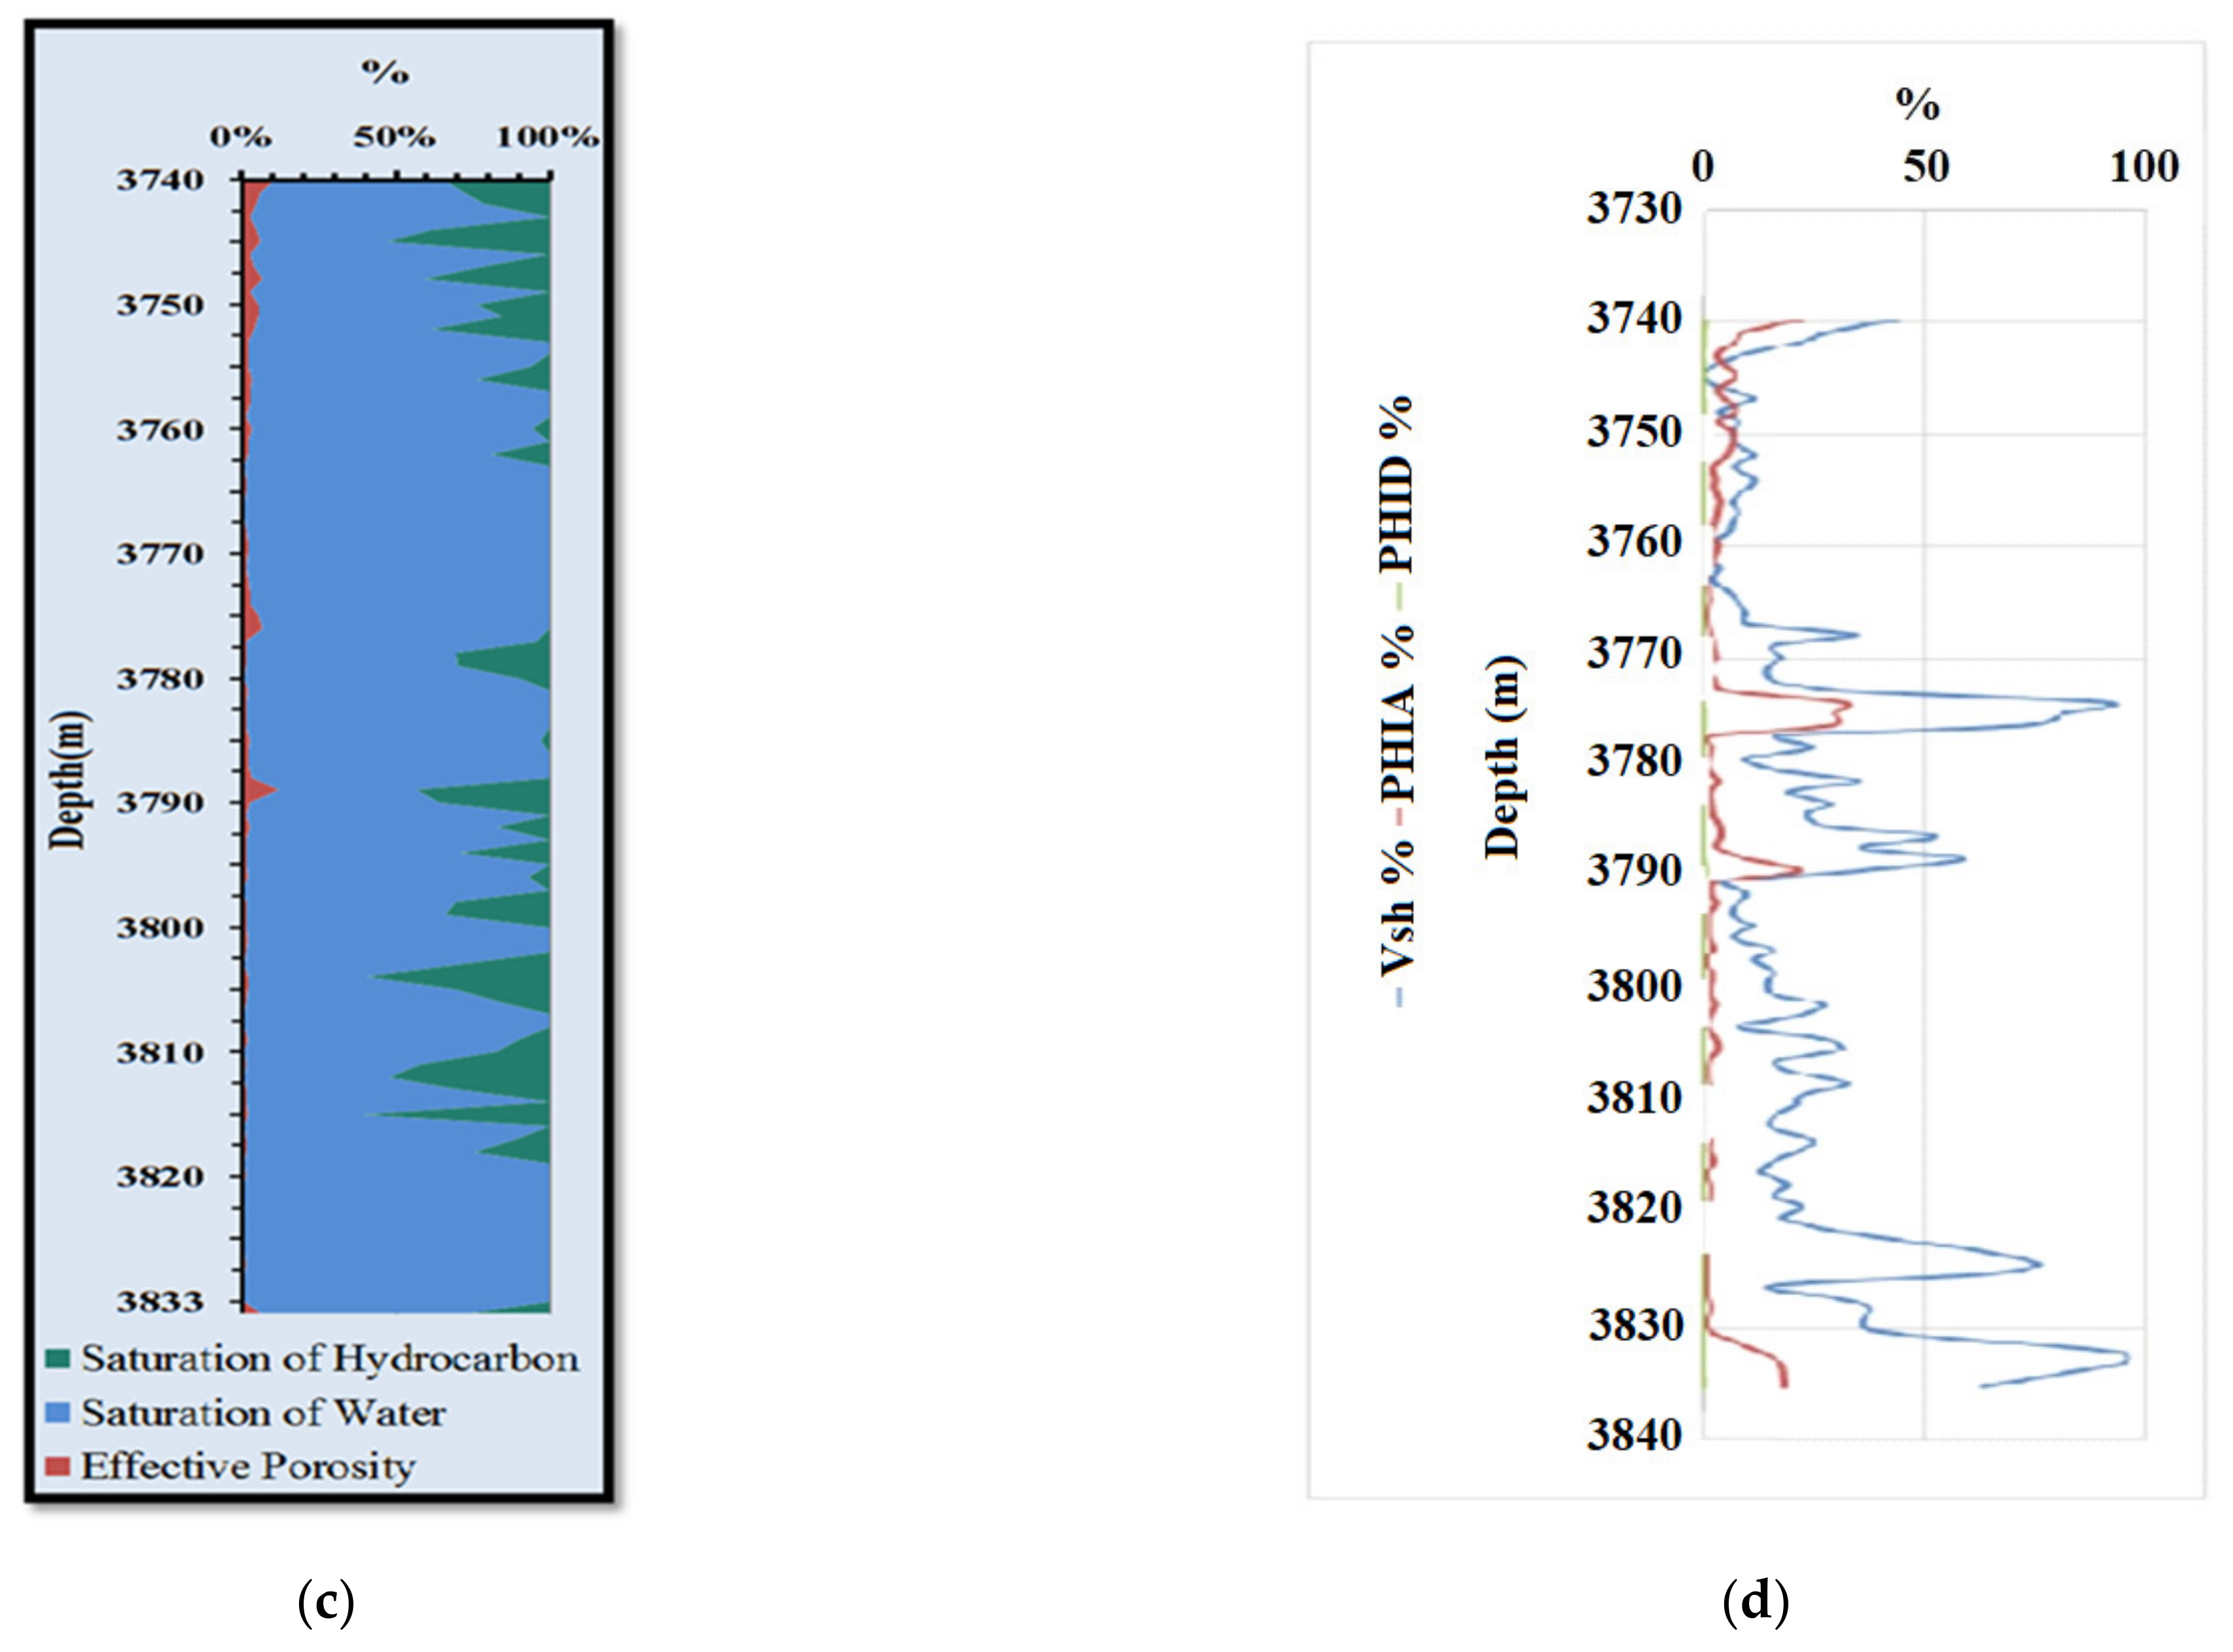
Figure 8.
(a) Relationship between the volume of shale and volume of clean with respect to the depth of zone 1; (b) relationship between neutron porosity, average porosity, density porosity, and effective porosity of zone 1; (c) Relationship between the saturation of water and saturation of hydrocarbon for zone 1; (d) relationship between the volume of shale (Vsh), average porosity (PHIA), and average density porosity (PHID) of zone 1.
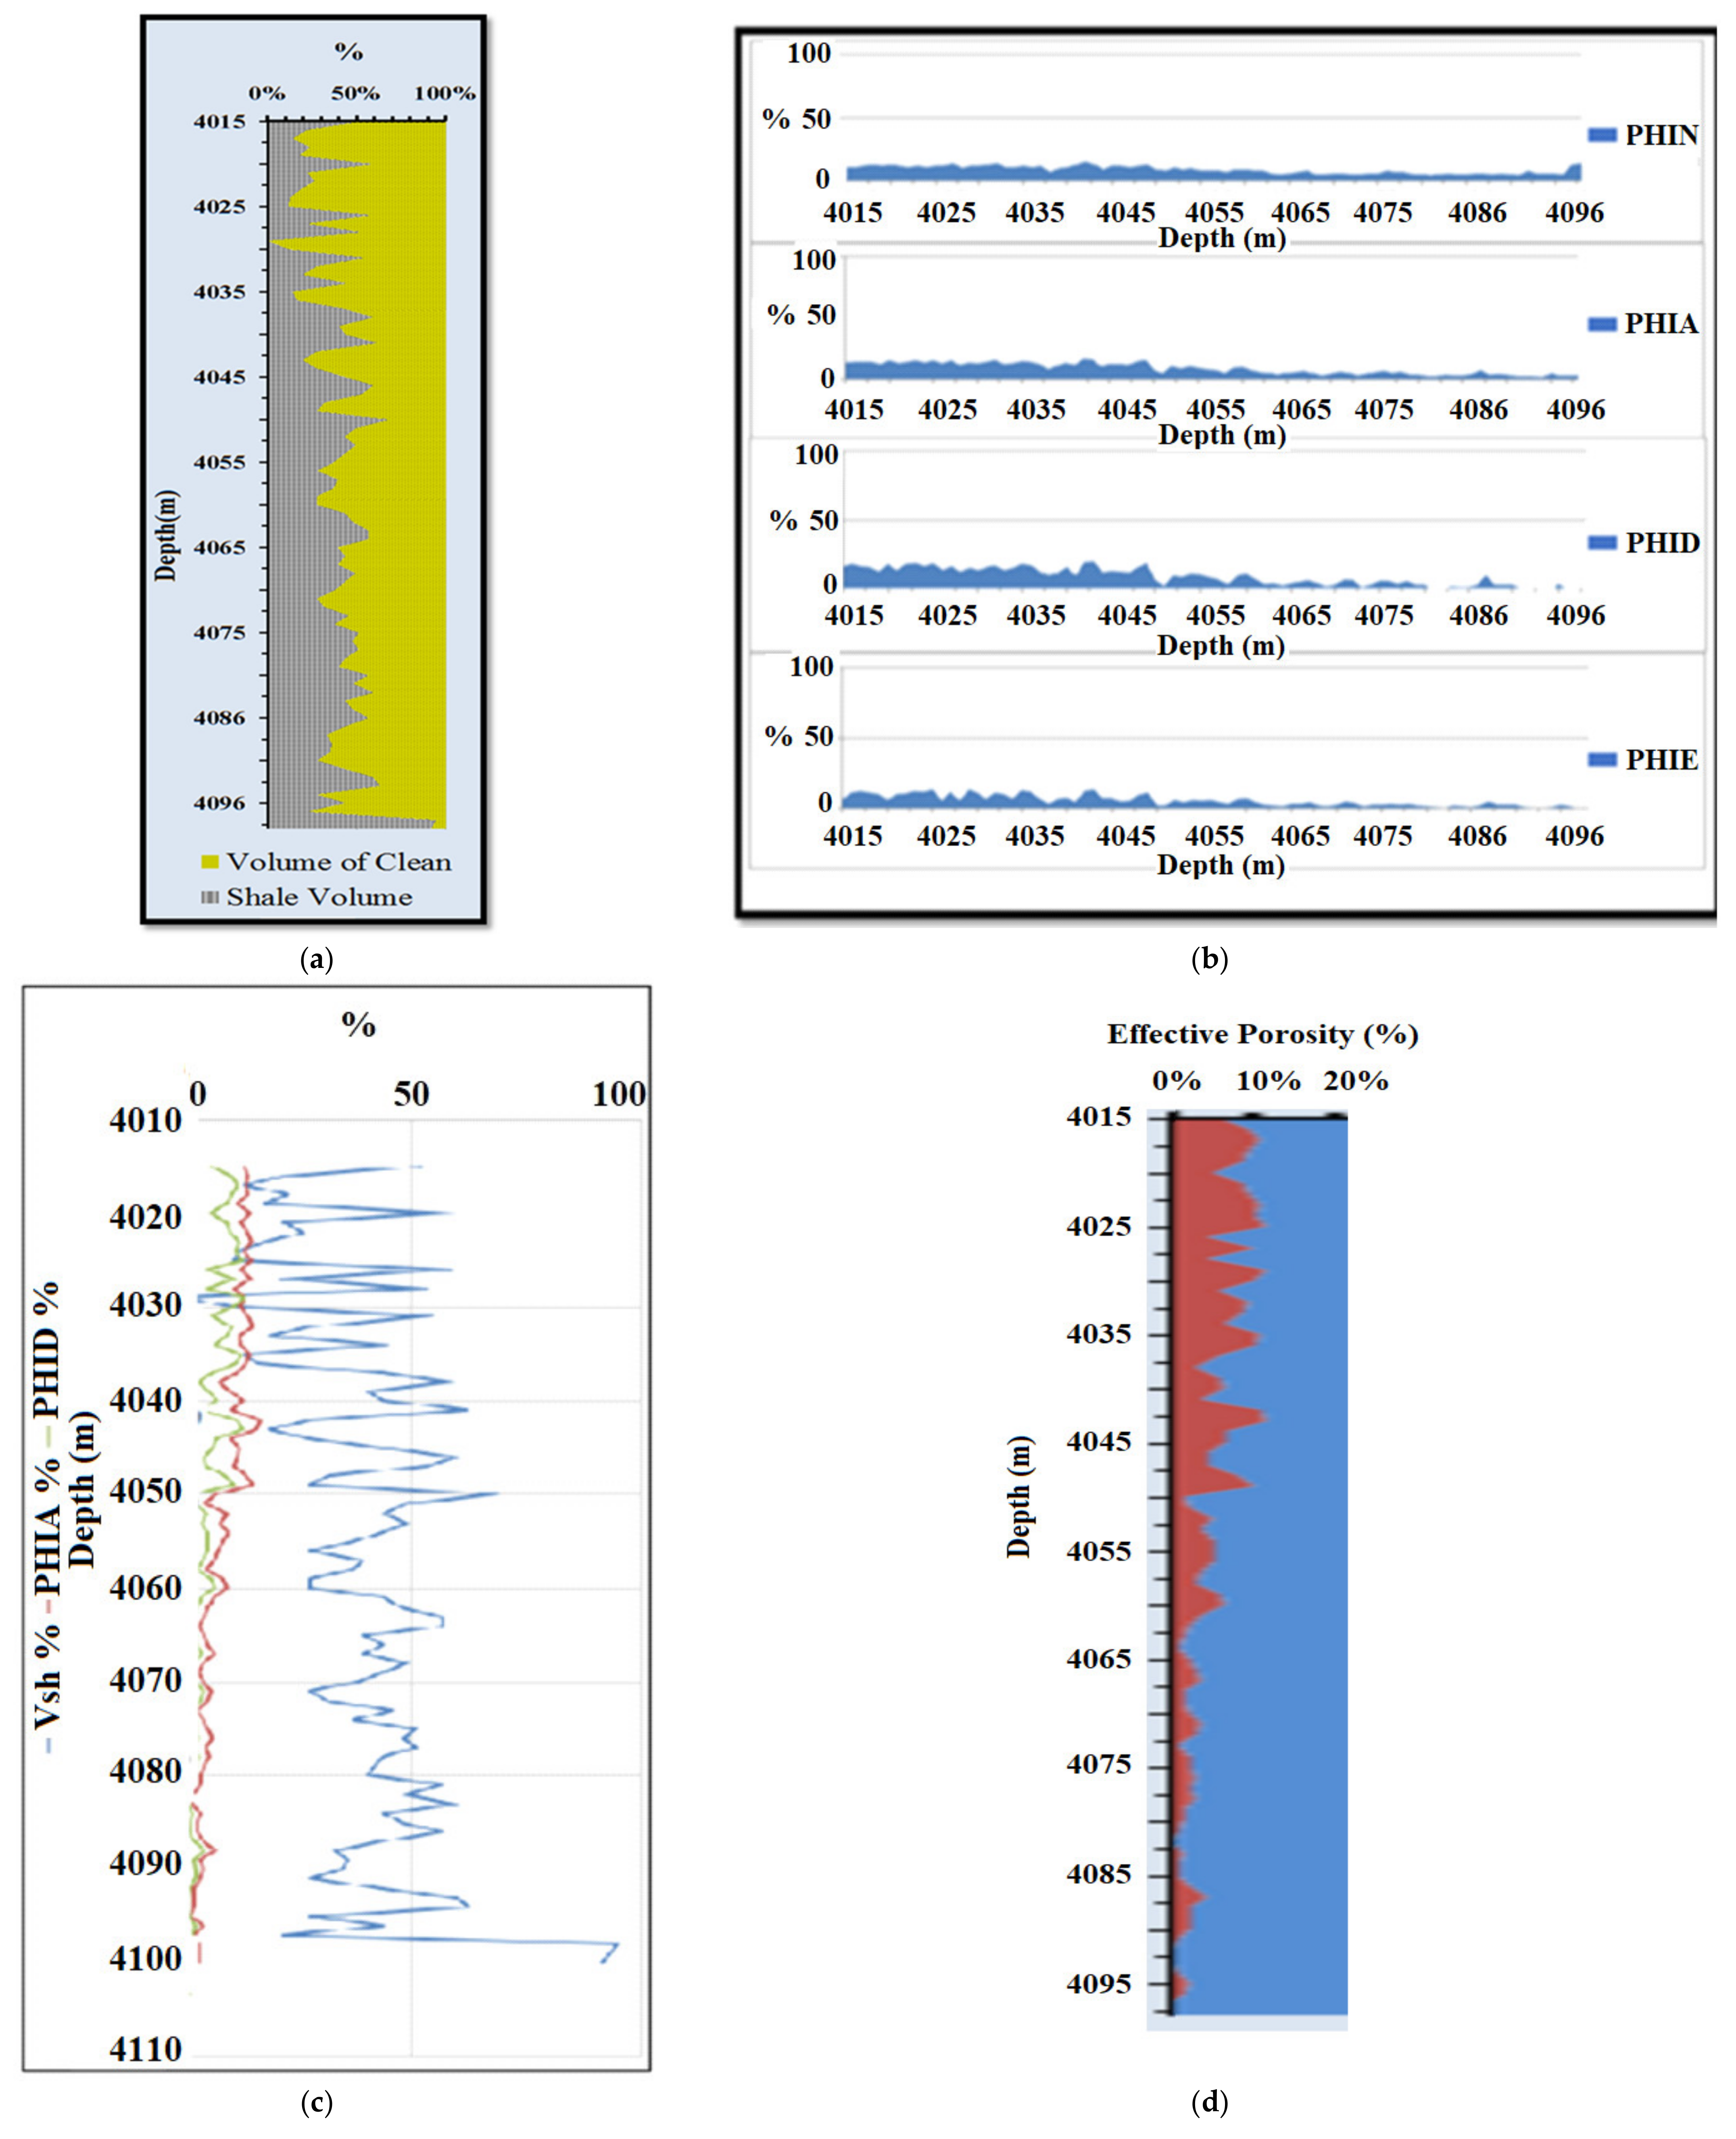
Figure 9.
(a) Relationship between volume of shale and volume of clean with respect to the depth of zone 2; (b) relationship between neutron porosity, average porosity, density porosity, and effective porosity of zone 2; (c) relationship between the volume of shale (Vsh), average porosity (PHIA), and average density porosity (PHID) of zone 2; (d) variation in effective porosity along the depth.
Table 1.
Petroleum system of the study area.
Table 1.
Petroleum system of the study area.
| Formation | Age | Rock Type |
|---|
| Murree, Salt Range | Miocene, Eocene | Seal |
| Chorgali, Sakesar Limestone | Eocene | Reservoir |
| Patala, Lockhart Limestone | Paleocene | Source |
Table 2.
Seismic lines available for interpretation of the Rajian area.
Table 2.
Seismic lines available for interpretation of the Rajian area.
| No. | Line Name | Line Type | Orientation |
|---|
| 1. | GO-932-GJN-29 | Dip Line | NW–SE |
| 2. | GO-942-GJN-48 | Dip Line | NW–SE |
| 3. | GO-932-GJN-12 | Dip Line | NW–SE |
| 4. | GO-932-GJN-34 | Dip Line | NW–SE |
| 5. | GO-925-GJN-11 | Dip Line | NW–SE |
| 6. | GO-942-GJN-50 | Strike Line | NE–SW |
Table 3.
Marking of horizons on control line through well to seismic tie.
Table 3.
Marking of horizons on control line through well to seismic tie.
| Formation Name | Formation Depth = Formation Top − Kelly bushing + SRD | Formation
Depth (m) | Two Way Time (seconds) | Well Name |
|---|
| Murree 1 Formation | FD = 1079 − 513 + 350 | 916 | 0.55 | Saba-01 |
| Top Eocene 1 | FD = 2215 − 513 + 350 | 2052 | 1.17 | Saba-01 |
| Top Paleocene 1 | FD = 2337 − 513 + 350 | 2174 | 1.24 | Saba-01 |
| Khewra Sandstone 1 | FD = 2526 − 513 + 350 | 2363 | 1.32 | Saba-01 |
| Salt Range | FD = 2654 − 513 + 350 | 2491 | 1.39 | Saba-01 |
| Top Eocene 2 | FD = 4587 − 577 + 350 | 4360 | 2.07 | Daiwal-01 |
| Top Paleocene 2 | FD = 4700 − 577 + 350 | 4473 | 2.12 | Daiwal-01 |
| Khewra Sandstone 2 | FD = 4890 − 577 + 350 | 4663 | 2.18 | Daiwal-01 |
Table 4.
Major and minor faults marked on seismic sections.
Table 4.
Major and minor faults marked on seismic sections.
| Fault Name | Fault Nature | Tectonic Transport Direction |
|---|
| Major Fault (F1) | Basement Thrust | SE |
| Major Fault (F2) | Major Thrust | SE |
| Major Fault (F3) | Roof Thrust | SE |
| Major Fault (F4) | Back Thrust | NW |
| Minor Fault (f1) | Thrust | SE |
| Minor Fault (f2) | Thrust | SE |
| Minor Fault (f3) | Thrust | SE |
| Minor Fault (f4) | Thrust | SE |
| Minor Fault (f5) | Thrust | SE |
Table 5.
Logs available for petrophysical interpretation of reservoir zones.
Table 5.
Logs available for petrophysical interpretation of reservoir zones.
| Lithological Logs | Porosity Logs | Fluid Dynamic Logs |
|---|
| Gamma Ray Log (GR) | Sonic Log (DT) | Resistivity Logs (LLD and LLS) |
| Self-Potential Log (SP) | Density Log (RHOB) | - |
| - | Neutron Log (NPHi) | - |
Table 6.
Potential zones for hydrocarbon accumulation.
Table 6.
Potential zones for hydrocarbon accumulation.
| ZONE 1 |
| Initial Depth (m) | 3740 |
| End Depth (m) | 3835 |
| Thickness (m) | 95 |
| ZONE 2 |
| Initial Depth (m) | 4015 |
| End Depth (m) | 4100 |
| Thickness (m) | 85 |
Table 7.
Petrophysical analysis results obtained for zone 1.
Table 7.
Petrophysical analysis results obtained for zone 1.
| Zone 1 |
|---|
| Depth (m) | 3740 to 3835 |
| Thickness (m) | 95 |
| Average Vsh (%) | 23.35 |
| Average Vclean (%) | 76.64 |
| Average Density Porosity (PHID) (%) | 3.92 |
| Average Neutron Porosity (PHIN) (%) | 4.69 |
| Average Porosity (PHIA) (%) | 4.30 |
| Average Effective Porosity (PHIE) (%) | 2.42 |
| Average Water Saturation (Sw) (%) | 88.09 |
| Average Hydrocarbon Saturation (Sh) (%) | 11.9 |
Table 8.
Petrophysical interpretation of reservoir zone 2.
Table 8.
Petrophysical interpretation of reservoir zone 2.
| Zone 2 |
|---|
| Depth (m) | 4015 to 4100 |
| Thickness (m) | 85 |
| Average Vsh (%) | 39.98 |
| Average Vclean (%) | 60.01 |
| Average Density Porosity (PHID) (%) | 8.70 |
| Average Neutron Porosity (PHIN) (%) | 8.89 |
| Average Porosity (PHIA) (%) | 8.79 |
| Average Effective Porosity (PHIE) (%) | 5.64 |
| Average Water Saturation (Sw) (%) | 100 |
| Average Hydrocarbon Saturation (Sh) (%) | 0 |


