Article

Dynamic Properties of Thermal Shock Treated Sandstone Subjected to Coupled Dynamic and Static Loads

1
School of Resources and Safety Engineering, Central South University, Changsha 410083, China
2
School of Civil Engineering, Sun Yat-sen University, Zhuhai 519082, China
3
School of Aeronautics and Astronautics, Sun Yat-sen University, Shenzhen 518107, China
*
Author to whom correspondence should be addressed.
Minerals 2021, 11(8), 889; https://doi.org/10.3390/min11080889
Submission received: 12 July 2021 / Revised: 5 August 2021 / Accepted: 16 August 2021 / Published: 18 August 2021

Abstract

:
In deep rock engineering, the rock mass can be subjected to thermal stress caused by sudden changes in temperature, which is referred to as thermal shock (TS). To study the effect of TS on heated sandstone, three cooling methods are used to provide different cooling rates. Then the coupled dynamic and static loading tests are carried out on the heated sandstone by means of a modified split Hopkinson pressure bar (SHPB) system. The test results show that as the heating level increases, the dry density, P-wave velocity, and the dynamic combined strength of the heated sandstone decrease, while specimen porosity increases. Particularly, a sharp change in the physical properties of sandstone can be observed at 650 °C, which is believed to be caused by the α-β transition of quartz at 573 °C. At each heating level of the test, the damage caused by the higher cooling rate to the heated sandstone is more than that caused by the lower cooling rate. The different failure modes of sandstone with increasing temperature are analyzed. The mechanism of TS acting on heated sandstone is discussed, and two typical fracture patterns reflecting the action of TS are identified through SEM.

1. Introduction

In both above-ground rock structures with large temperature differences between day and night and underground rock engineering such as geothermal energy engineering, underground coal gasification and radioactive waste disposal, rocks as the main load-bearing material can be subjected to extreme conditions involving high temperature [1,2,3,4,5,6,7,8,9] and weathering [10,11,12,13]. Sudden changes in temperature can cause thermal stress and “catastrophic damage in the form of cracks so that the strength of the material is suddenly decreased’’ [14]. This process is referred to as thermal shock (TS) [14,15,16]. In addition, the rock mass suffers not only the static in-situ stress, but also the widespread stress adjustments, blasting loading, and excavation unloading during the excavation process [17,18,19,20]. Thus, the dynamic disturbances cannot be ignored when evaluating the load-bearing capacity of the rocks in the field of deep engineering. Therefore, analyzing the impact of the TS process on the dynamic mechanical properties of the rock is essential for the structural stability and safety design of rock engineering both aboveground and underground.
In recent years, several studies have contributed to the understanding of the physicomechanical properties of rocks after TS. Dong et al. [21], Ghobadi and Babazadeh [22], Wang et al. [23], and Yu et al. [24] conducted dynamics or statics experiments on rocks subjected to cyclic TS, their results showed that the cycle has a cumulative effect with the accumulation of TS cycles. Li et al. [25] investigated the influence of TS caused by rapid cooling on the dynamic mechanical properties of granite by nuclear magnetic resonance (NMR) and scanning electron microscope (SEM) and found that the pores inside the heated granite increase both in size and quantity as the heating level or cooling rate rise. Huang et al. [26], Shen et al. [27], and Wu et al. [28] conducted static experiments to investigate the thermal deterioration of granite after TS and found that the thermal cracking propagates and opens up with the increase in temperature, and structural damage is more serious under rapid cooling conditions. To study the index properties of rocks that had deteriorated due to physical weathering, Yavuz et al. [29] applied 20 cycles of freeze-thaw and physical weathering tests on 12 different carbonate rocks. Their results showed that the index properties of rocks after repeated TS decrease in varying levels with respect to initial values. Li et al. [30] investigated the effects of TS on the mechanical responses of granite through Brazilian tests on the cracked straight through Brazilian disc (CSTBD) under Mode I and Mode II loading. Their results indicated that the peak load values and the Mode I and Mode II fracture toughness for water-cooled specimens are lower than those for air-cooled specimens. Li et al. [31] investigated the influence of water and liquid nitrogen cooling treatment on the physical and mechanical properties of the heated sandstone. Their results showed that the damage caused by the liquid nitrogen cooling treatment to the heated sandstone is greater than that of the water-cooling treatment. However, the cooling rate of the heated granite treated with different high temperatures was not provided. Wang et al. [32] conducted a physical inspection, and quasi-static and dynamic splitting tensile tests on red sandstone after different TS cycles, and found that with the increase in TS cycles, the density reduces, and the total porosity and effective porosity increase. However, their experiments adopted a low cooling rate of about 2.3 °C/min according to the temperature profile. The comparative low temperature changing rates used in the experiments make it difficult to acknowledge the effect of TS, which is a phenomenon featured by sudden changes in temperature.
Through a literature review, we notice that previous studies primarily focused on the effect of TS on the static mechanical behavior of rocks. However, studies taking into account the effect of TS on the dynamic mechanical behavior of sandstone under coupled dynamic and static loads are rarely reported. In fact, the rock mass is inevitably affected by dynamic disturbances caused by mechanical rock breaking and blasting loading, which involves a typical coupled dynamic and static loading mode. Therefore, the SHPB system is adopted to carry out the coupled dynamic and static loading experiments on sandstone after different TS treatments, where the heating level is up to 850 °C in this paper. The evolutions of porosity, P-wave velocity, and dynamic combined strength are analyzed. Three cooling methods are adopted to provide different cooling rates, which are stove cooling (no TS), air cooling (TS), and freezer cooling (TS), and the highest cooling rate of TS is up to 45.72 °C/min. In addition, efforts have been made to observe and discover more typical microscopic fracture features caused by TS, and the damage mechanism of heated sandstone under three different cooling methods is analyzed. The results of this study can be used to provide a reference for damage analysis and safety assessment of rock engineering that undergoes high temperature and rapid cooling.

2. Experimental Material and Testing Procedure

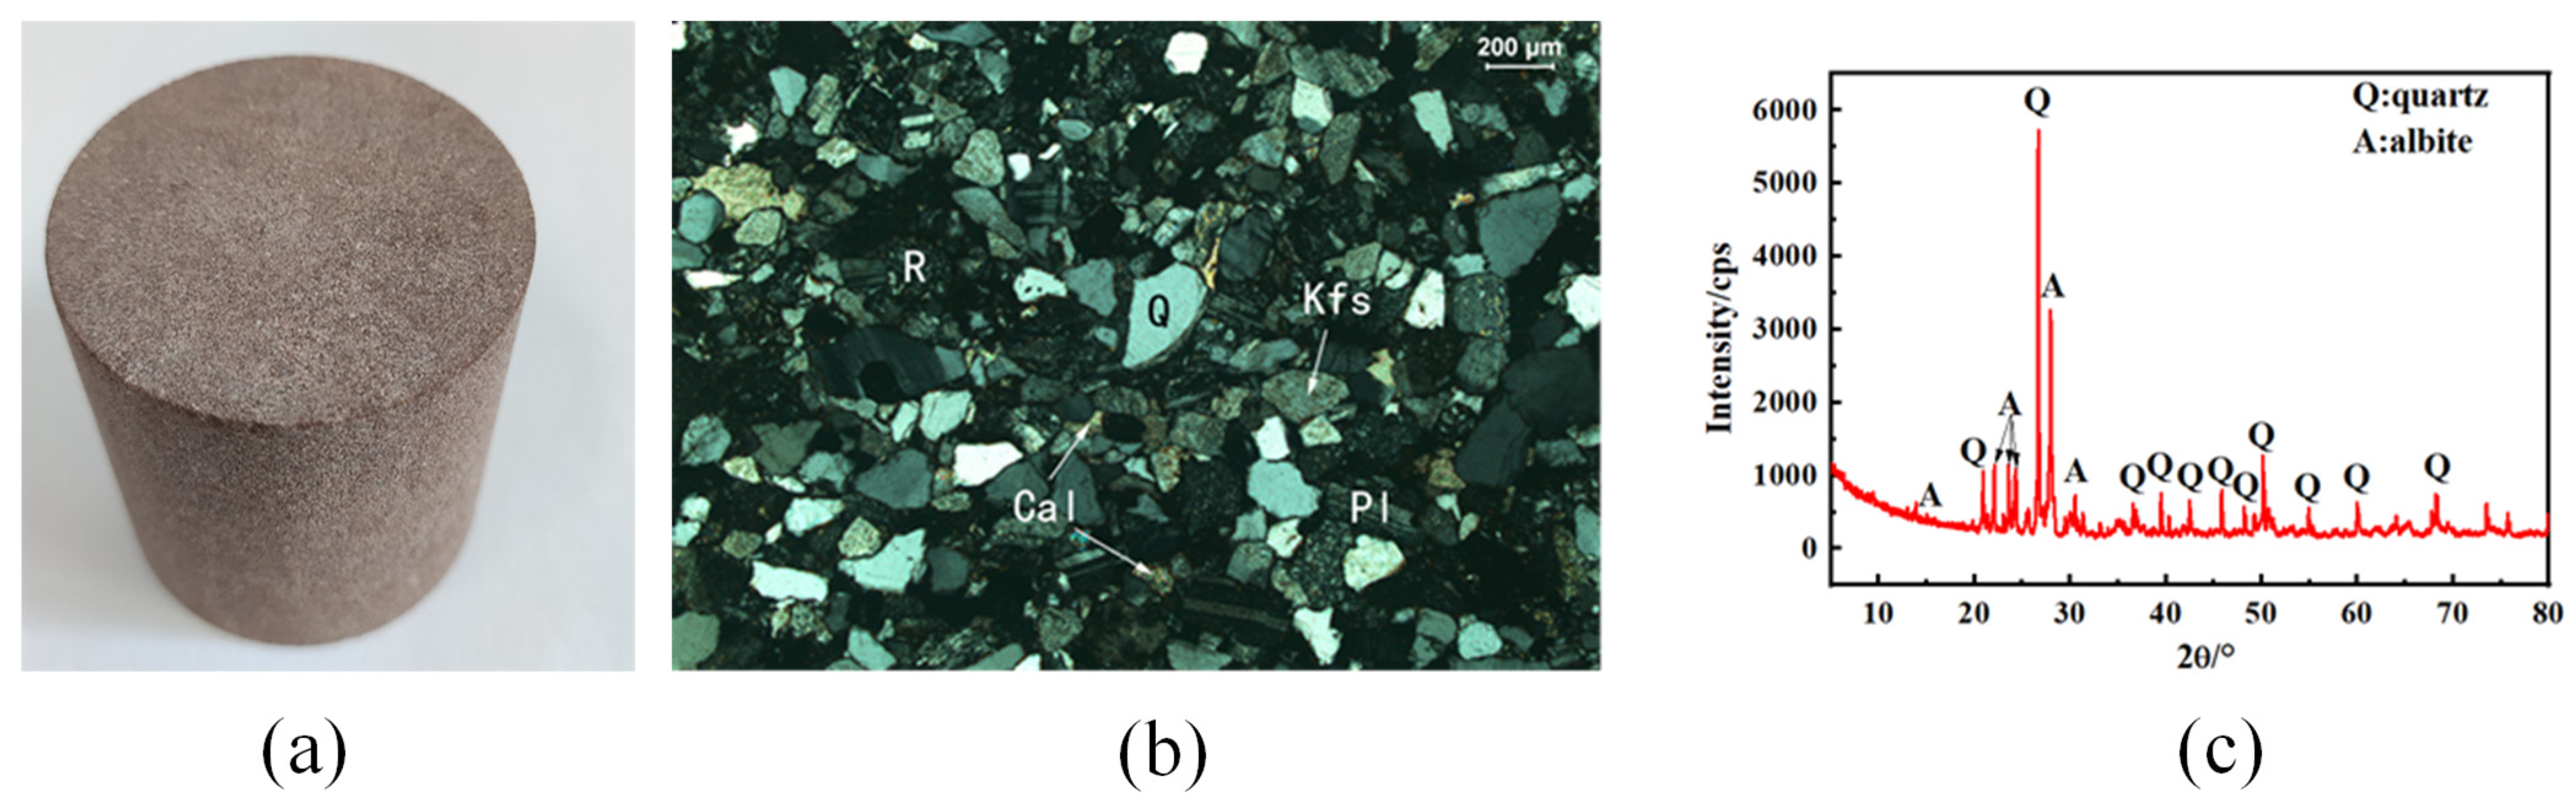
2.1. Specimen Preparation

The rock material used in the experiments is a fine-grained sandstone cored from the same integral and uniform rock block, which is quarried from Shandong Province, China. The diameters of the specimens used in the coupled dynamic and static loading experiment are 50 mm with a height-to-diameter ratio of 1:1 (Figure 1a), and carefully polished at both ends and sides. The non-parallelism and non-perpendicularity are both less than 0.02 mm, which meet the standards of the International Society for Rock Mechanics (ISRM) [33]. According to the suggested methods proposed by ISRM, the average dry-density and porosity of selected sandstone at ambient temperature are 2.43 g/cm3 and 5.87%, respectively. The thin section analysis and the X-ray diffraction (XRD) are adopted to analyze the mineral content of sandstone specimens. Due to the heterogeneity of rock, the values may vary with different sections or specimens. Since the sandstone specimen used in the experiment is cored from the same integral and uniform rock block, thin section analysis can provide an assessment of the percentage value of a section of the specimen under observation to a certain extent [34]. The result of thin-section analysis and XRD indicates that the composition and corresponding content of sandstone are roughly as follows: quartz (45%), potash feldspar (40%), plagioclase (10%), calcite (2%), iron (2%), and sericite (1%) in Figure 1b,c.

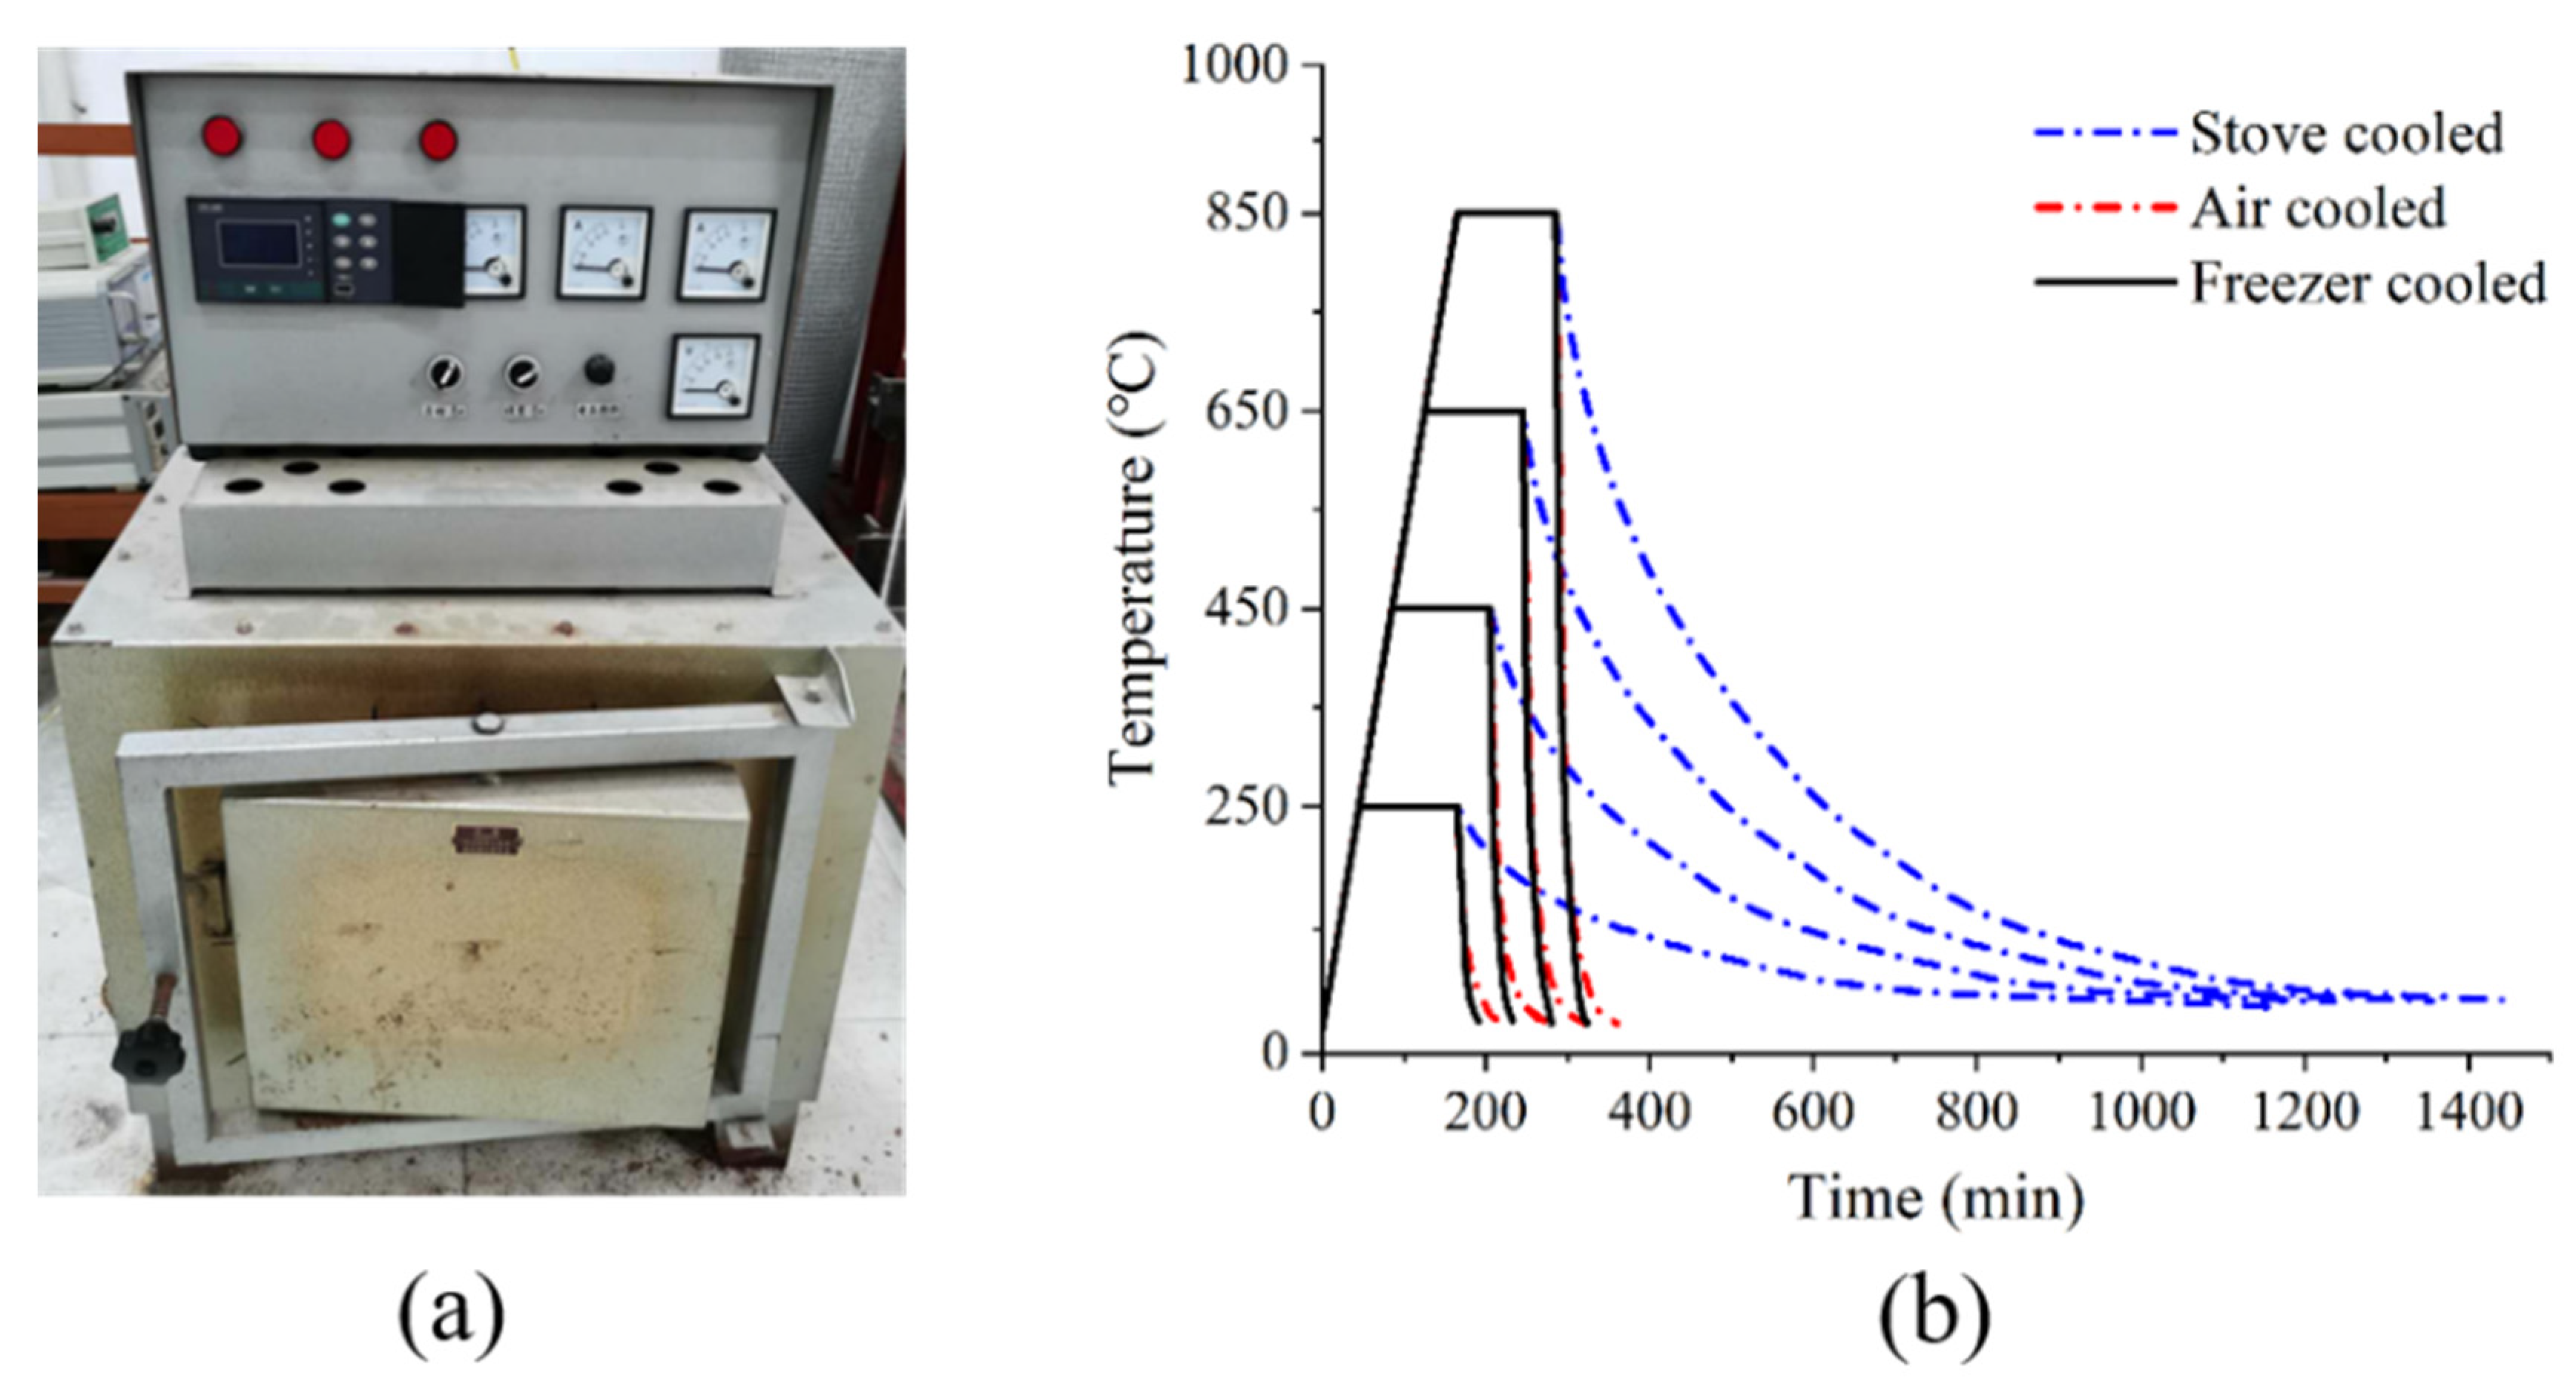
2.2. Thermal Shock Treatment

The sandstone specimens are heated at 250, 450, 650, and 850 °C in a box-type electrical stove (heating rate: 5 °C/min) as shown in Figure 2a. The specimens are subsequently cooled by stove cooling, air cooling, and freezer cooling, respectively. For each heating level and cooling method, four specimens are used in the test. The TS treatment process can be described as follows. Heat the rock specimen to the target temperature and keep the temperature constant for two hours to make the temperature field in the specimen uniformly distributed. Then turn off the power switch and let the specimen cool to ambient temperature (control group), where the temperature inside the stove is recorded by the monitor every 60 s. For the other two experiment groups, the specimen is cooled in the air or the freezer to cool down to ambient temperature.
In this work, the freezer is set to a constant temperature of −60 °C. In order to obtain an accurate relationship between rock temperature and time, the temperature of the specimen is measured by a thermocouple thermometer (HT-9815, Dongguan Xintai Instrument, Dongguan, China). The obtained thermal temperature profile is shown in Figure 2b. The average cooling rate is calculated by a weighted average method in Equation (1):
V ¯ T = k = 1 n K k t K d T ( t ) d t = 0 t 0 T ( t ) T ( t ) d t 0 t 0 T ( t ) d t
where V ¯ T represents the average cooling rate; T(t) is a function of temperature as a function of time; T denotes the derivative of T(t); t0 denotes the time required for the specimen to cool to room temperature.
According to the weighted average, when the rock is heated to 250, 450, 650, and 850 °C, the air-cooling rate is 8.96, 17.62, 26.84, and 41.37 °C/min, respectively. The cooling rate in the freezer is 13.73, 26.61, 30.61, and 45.72 °C/min, respectively. According to the literature review, no consensus has been reached regarding the temperature changing rate threshold for inducing TS in rocks. However, it can be considered that the temperature changing rate ≥2 °C/min can be used to examine the TS effect [14]. In this study, the temperature changing rate of stove cooling is less than 0.5 °C/min [25]. Therefore, the sandstone specimens cooled inside the stove can be used as references that are free from the effect of TS. The air-cooling and freezer-cooling conditions can well be categorized into TS conditions [14], while the stove-cooled specimens have avoided the TS effect.

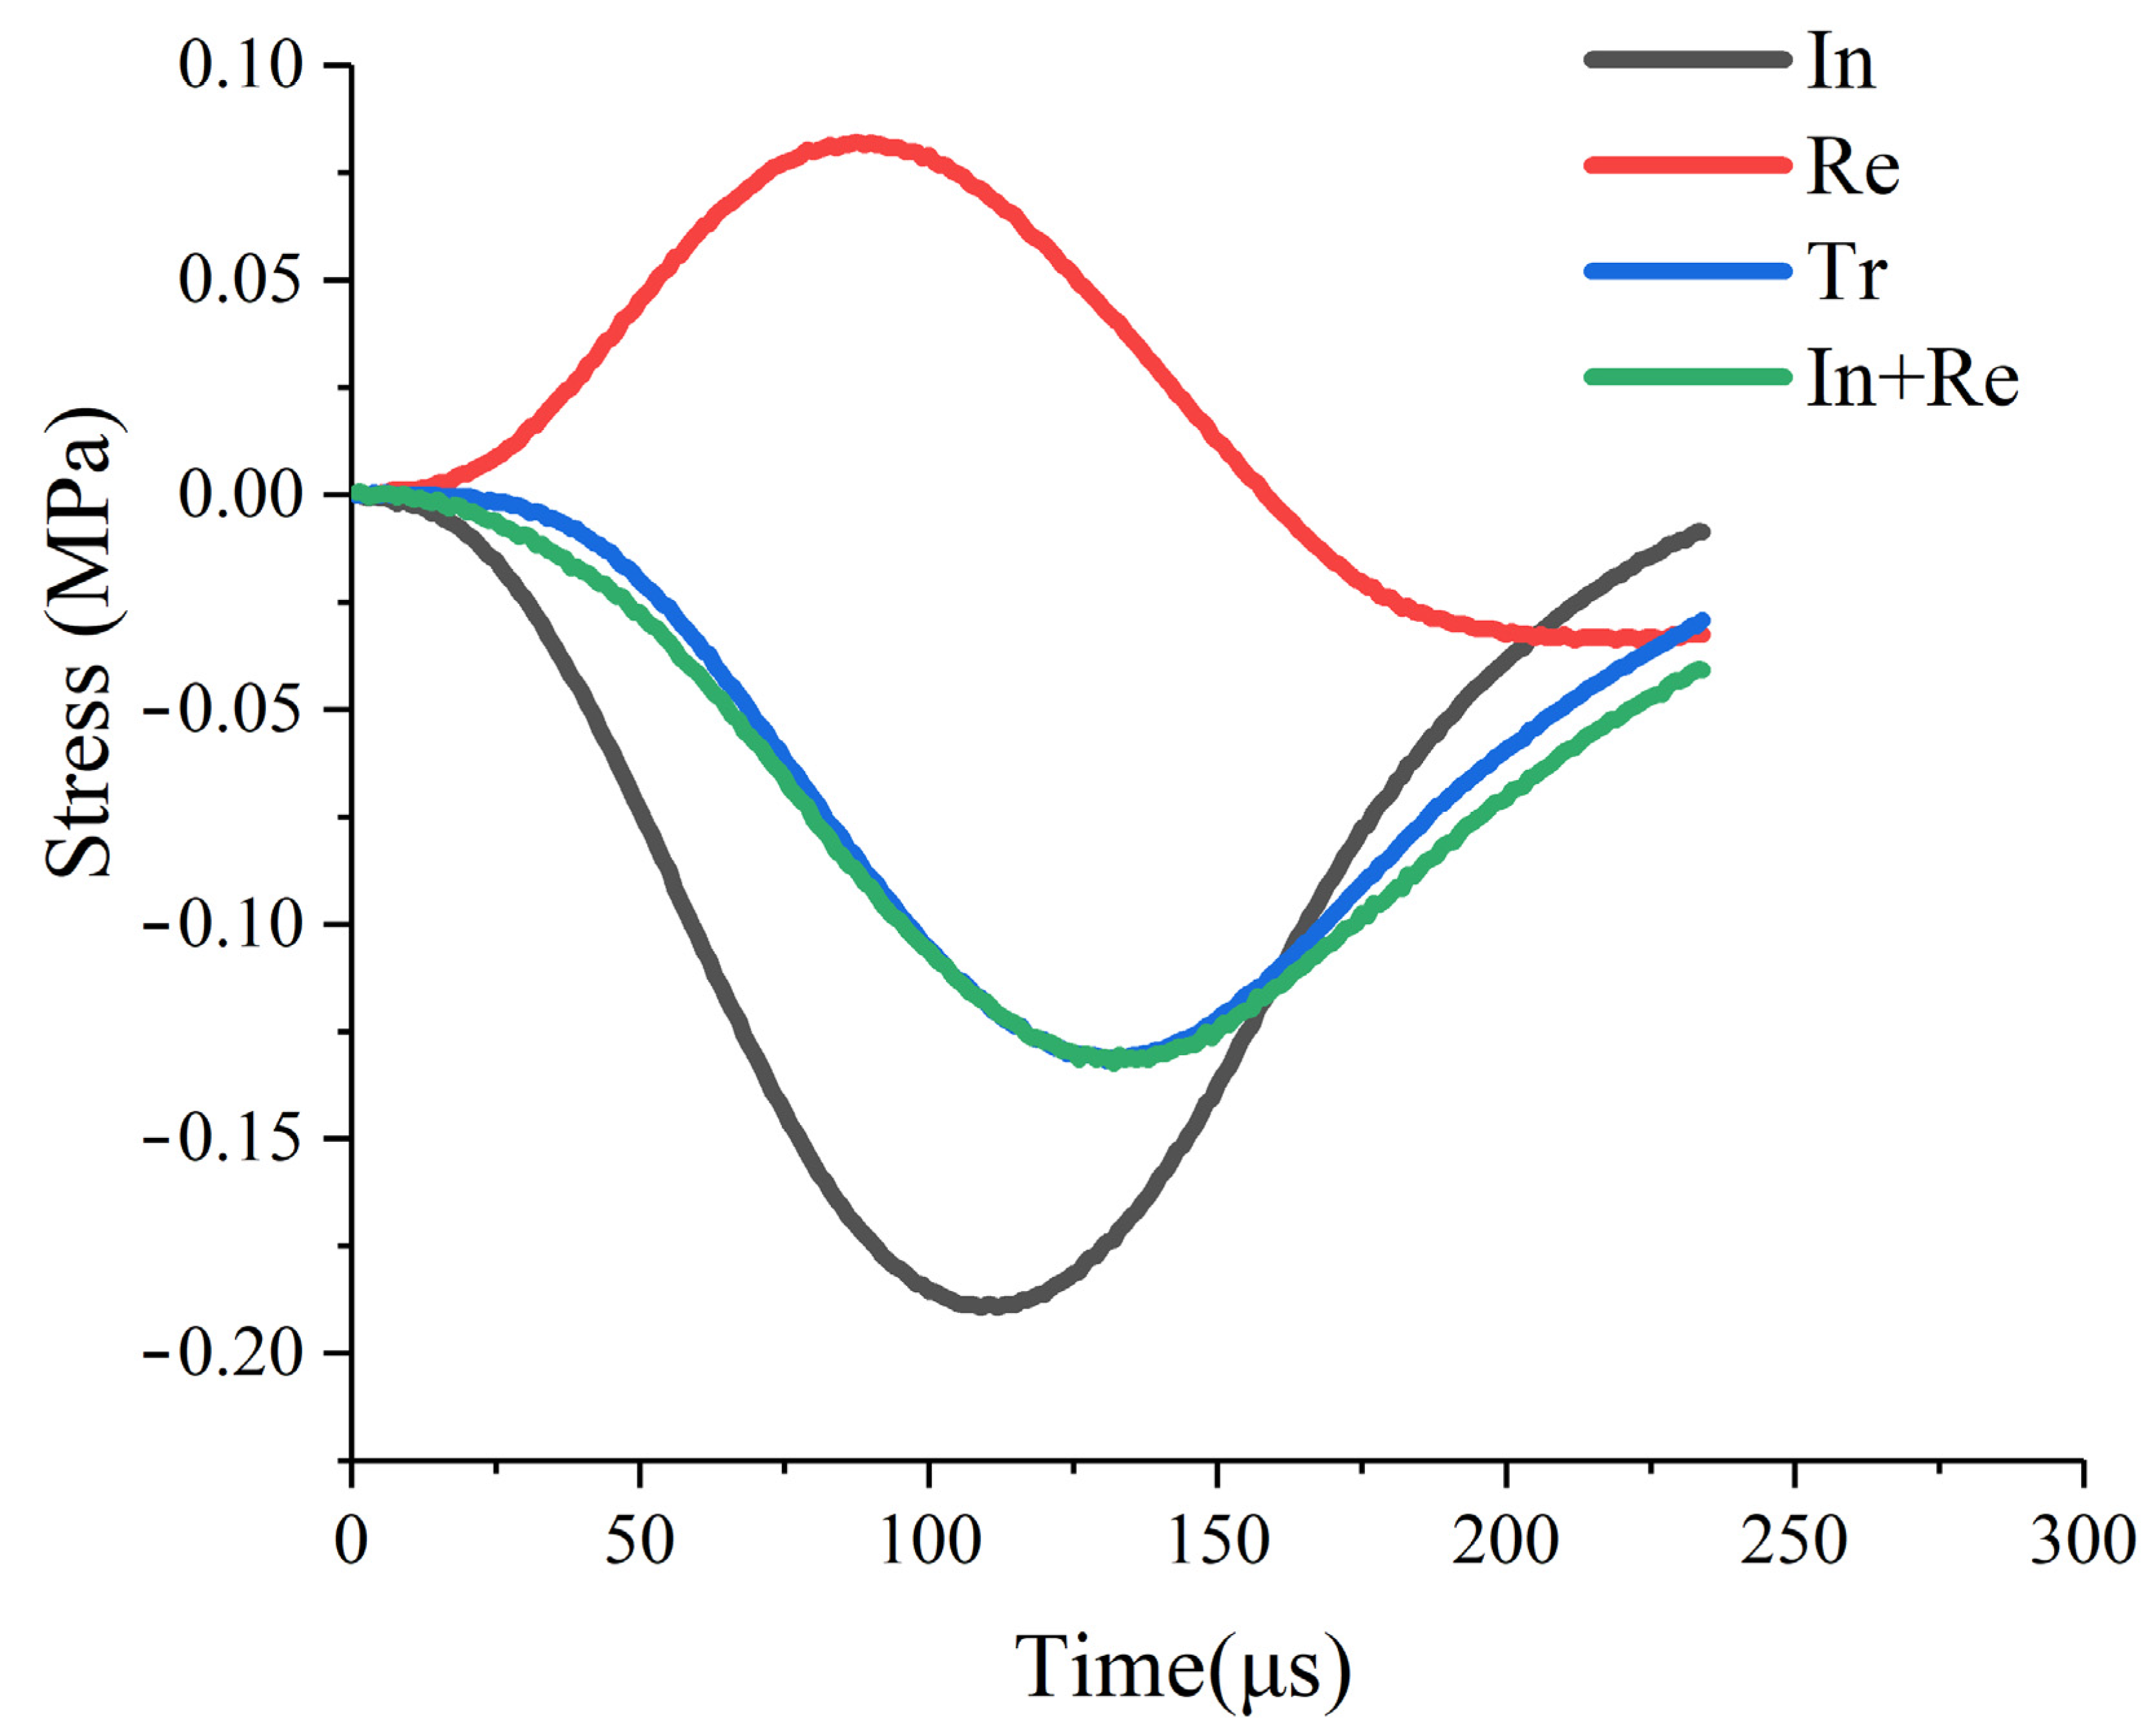
2.3. Coupled Dynamic and Static Loading Process

The coupled dynamic and static loading tests are performed on an improved SHPB system [35,36]. As can be seen in Figure 3, the test system consists of a gas gun, a spindle-shaped punch, an incident bar, a transmitted bar, an absorbing bar, a damper, and a set of axial static pressure devices. The test system is capable of performing high strain rate loading experiments, and the spindle impact rammer can achieve a constant strain rate half-sine stress wave loading [37]. The main parameters are shown in Table 1. Before the test, the reliability and accuracy of the test system are examined. The test waveform should conform to the one-dimensional stress wave principle of the test system and the stress homogenization principle of the specimen. The tested specimen is placed between the incident bar and transmitted bar. An appropriate amount of grease is applied to the two loading ends of the specimen to ensure good contact between the specimen and the bars. The incident bar is struck by the punch driven by the gas released from the gas cylinder through the gas gun. In the test, the axial pressure (static loading) and air pressure (dynamic loading) are 15 MPa and 0.55 MPa, respectively. The same air pressure is used to ensure the same impact load in each test. As the stress wave advances in the incident bar, a part of the stress wave returns to the incident bar, and the other part of the stress wave passes through the specimen, which resulted in its failure. The failure evolution process of the specimens is captured by a high-speed camera (FASTCAM SA 1.1, Photron USA Inc, San Diego, CA, USA). The videography frequency is 75,000 fps and each picture is taken at every 13 μs. Finally, the changing signals of the strain gauge voltage are transmitted through the dynamic strain test devices and are recorded by the oscilloscope, and thus the strain data can be obtained.
The traditional SHPB experiment is based on the one-dimensional stress and uniform loading conditions on the specimen. The wave equation of the rock specimen under coupled dynamic and static loads is the same as the classical one-dimensional wave [36]:
ρ 2 u t 2 = E 2 u x 2
According to the one-dimensional stress wave theory, values of σ(t), ε(t), and ε ˙ (t) can be calculated using the following formulae:
σ ( t ) = A e E e 2 A s ( ε I + ε R + ε T )
ε ( t ) = C e L s 0 t ( ε I ε R ε T ) d t
ε ˙ ( t ) = C e L s ( ε I ε R ε T )
In Equations (3)–(5), As and Ae represent the cross-sectional areas of the specimen and the bar, respectively; Ce, Ee, and Ls represent the longitudinal wave velocity, Young’s modulus of elastic bar, and the length of the specimen [37], respectively; εI, εR, and εT represent the incident strain, reflected strain, and transmitted strain, respectively. The forces P1 and P2 on the two sides of a specimen can be calculated as:
P 1 = E e A e ( ε I + ε R )
P 2 = E e A e ε T
The experiment requires the stress on both sides of the specimen to reach a balanced state to avoid axial inertia effects and render reasonable results. According to Equation (6) and Equation (7), the stress and strain rate of the specimen in the dynamic compressive loading process can be calculated as:
σ ( t ) = A e E e A s ε T
ε ˙ ( t ) = 2 C e L s ε R
Figure 4 shows an example of the stress balance diagram of one typical test. The transmitted wave (blue curve) is basically coincident with the superimposed wave of the incident wave and the reflected wave (green curve), which indicates that the specimen reaches the stress equilibrium condition during the loading process. Results of the sandstone specimens after TS are shown in Table 2.

3. Results

3.1. Physical Properties of Specimens after TS
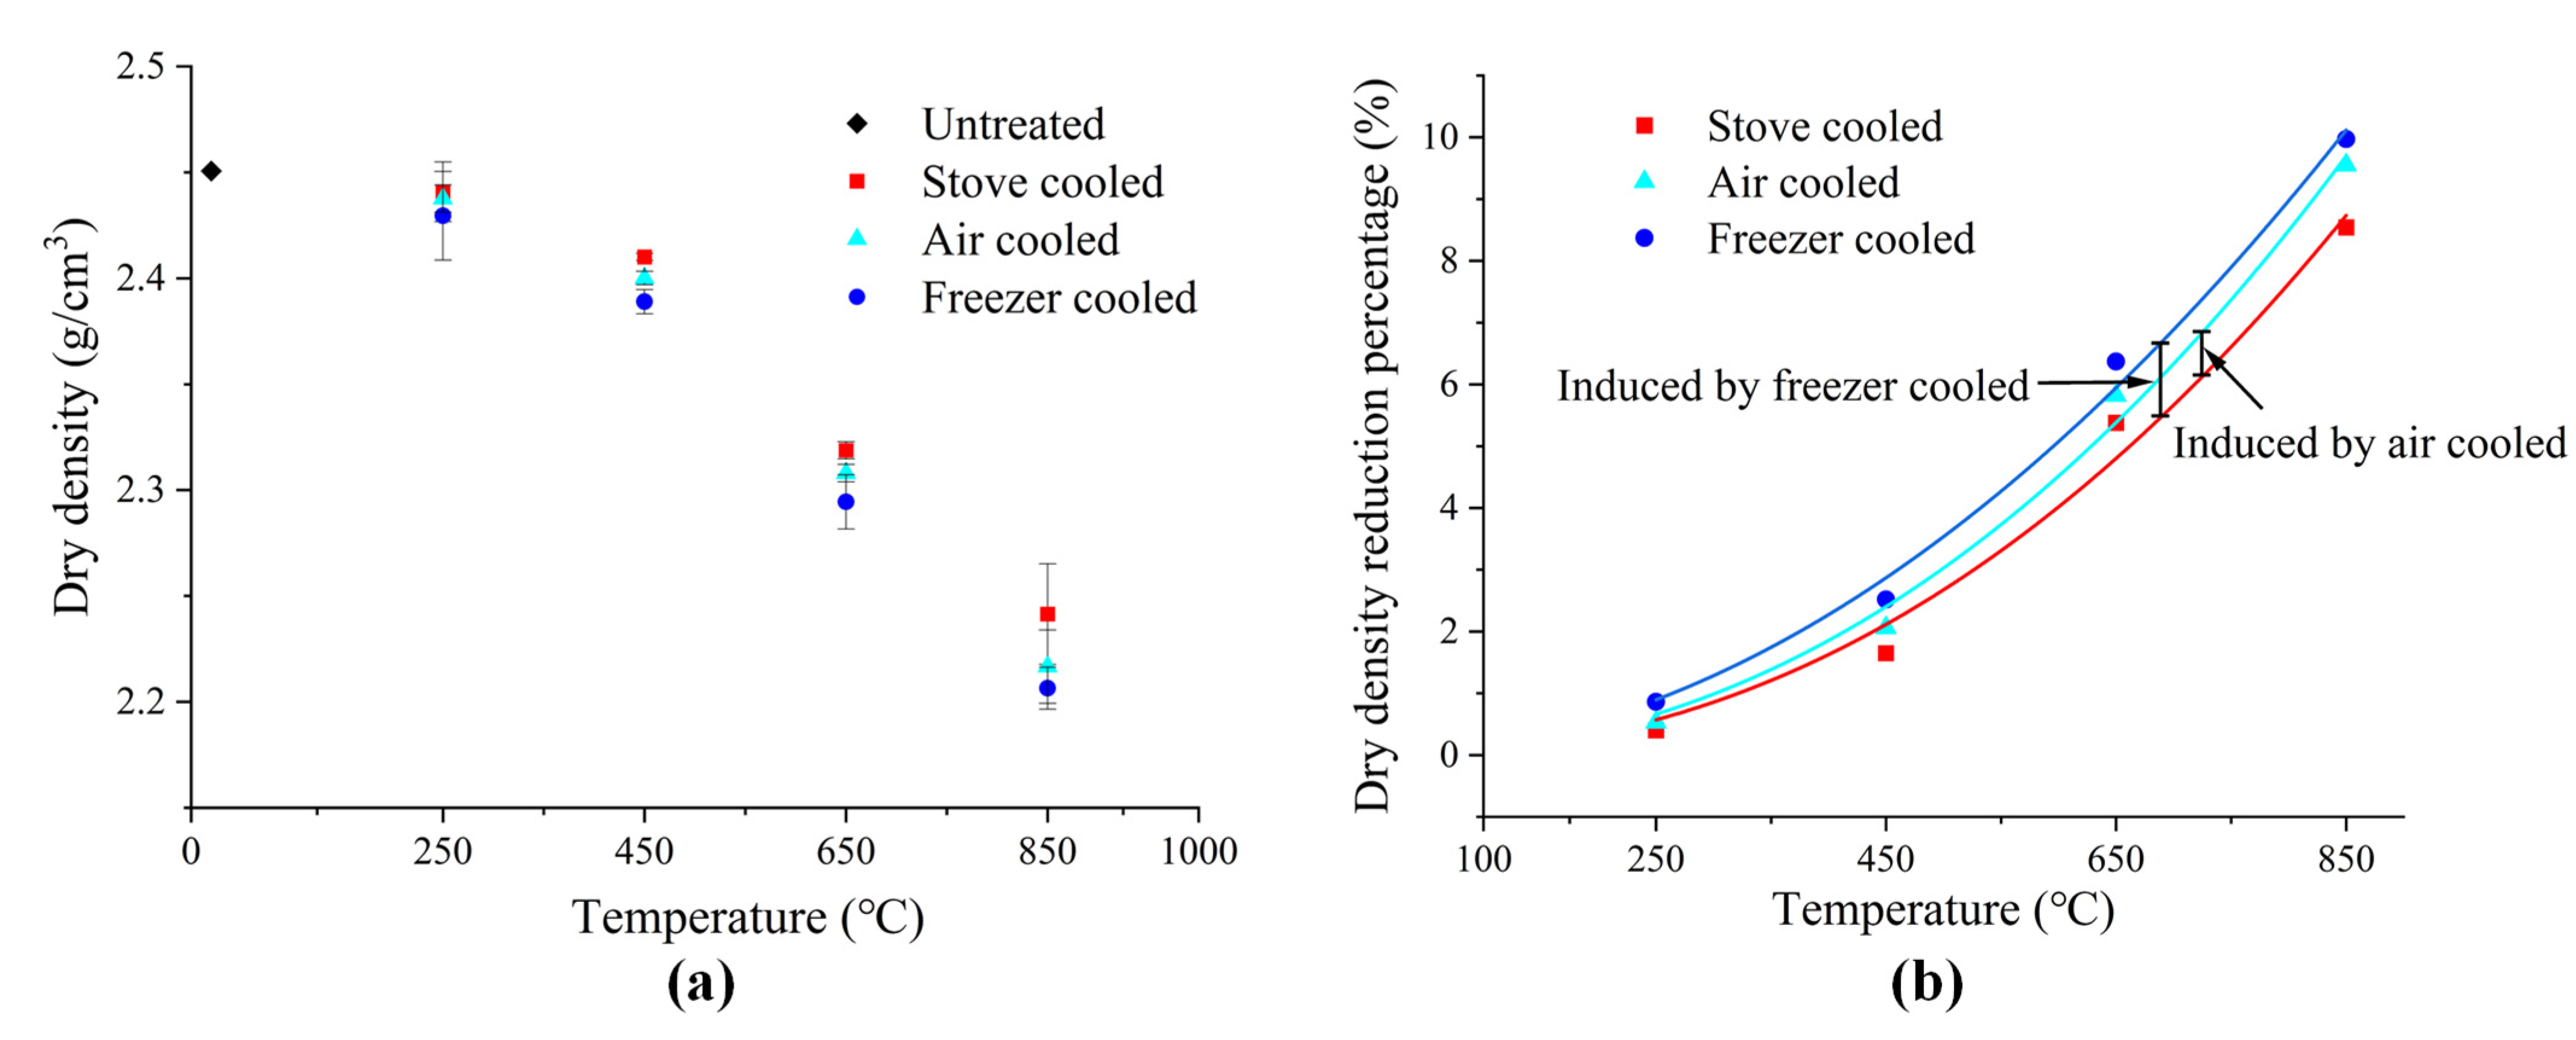
Dry density, porosity, and P-wave velocity are important parameters of petrophysical properties. Testing these parameters is of positive significance for measuring the damaging effect of TS on the integrity of the rock matrix [35]. In this section, the evolution pattern of these parameters with the variation of heating level and cooling rate is analyzed based on the test results.

3.1.1. Dry Density

The buoyancy method suggested by ISRM [33] is adopted to measure the density of the sandstone specimens. The dry density of sandstone specimens (also P-wave velocity and porosity introduced in the following) free from TS treatment are used as a reference. For each cooling method under one heating level, the dry density values of the four specimens are averaged as listed in Table 3. Figure 5a,b illustrates the result of the variation in the dry density and the percentage reduction in the dry density of the specimen as a function of heating treatment, respectively. The dry density reduction percentage is calculated by Equation (10):
D D R P = ρ ρ ρ × 100 %
where DDRP denotes the dry density reduction percentage, and ρ and ρ′ are the dry density of the specimen before and after TS treatment, respectively. Due to the heterogeneity of rock materials, the dry density values of specimens (also P-wave velocity and porosity introduced in the following) in the same set of experiments are usually scattered. To illustrate the variation in experimental results, the standard deviation of the dry density values are given in Table 3, and the scatteredness of the results is also illustrated in Figure 5a.
The experimental result illustrates that the dry density of the specimen presents a descending trend with the increasing heating level compared with the untreated specimen. It is worth noting that at the temperature of 450 °C, the dry density of the rock decreases less significantly (2.52% drop caused by freezer cooled), and a sharp drop occurs at the temperature of 650 °C (6.37% drop caused by freezer cooled, Figure 5a). As shown in Figure 5b, at any heating level, as the cooling rate increases, the dry density reduction percentage increases. Moreover, the percentage drop in dry density caused by freezer cooling is greater than that caused by air cooling, which indicates that a stronger effect of TS caused by a higher cooling rate can further aggravate damage to the specimen. The decrease in the dry density of the specimen is assumed to be caused by the microcracks generated during the heat treatment and cooling process: the generation and development of the cracks enlarge the pore space inside the rock, thus increasing the volume of the rock and decreasing the dry density. Such inference is supported by the following experimental results of petrophysical properties and microstructure observation. As illustrated in Figure 5b, the data of the percentage reduction in dry density caused by three cooling methods are exponentially fitted using Equations (11)–(13):
DDRP(stove cooled) = 2.57 × 10⁻⁶ × T2.23, R2 = 0.98
DDRP(air cooled) = 3.63 × 10⁻⁶ × T2.19, R2 = 0.99
DDRP(freezer cooled) = 1.59 × 10⁻⁵ × T1.98, R2 = 0.99
where T denotes temperature.

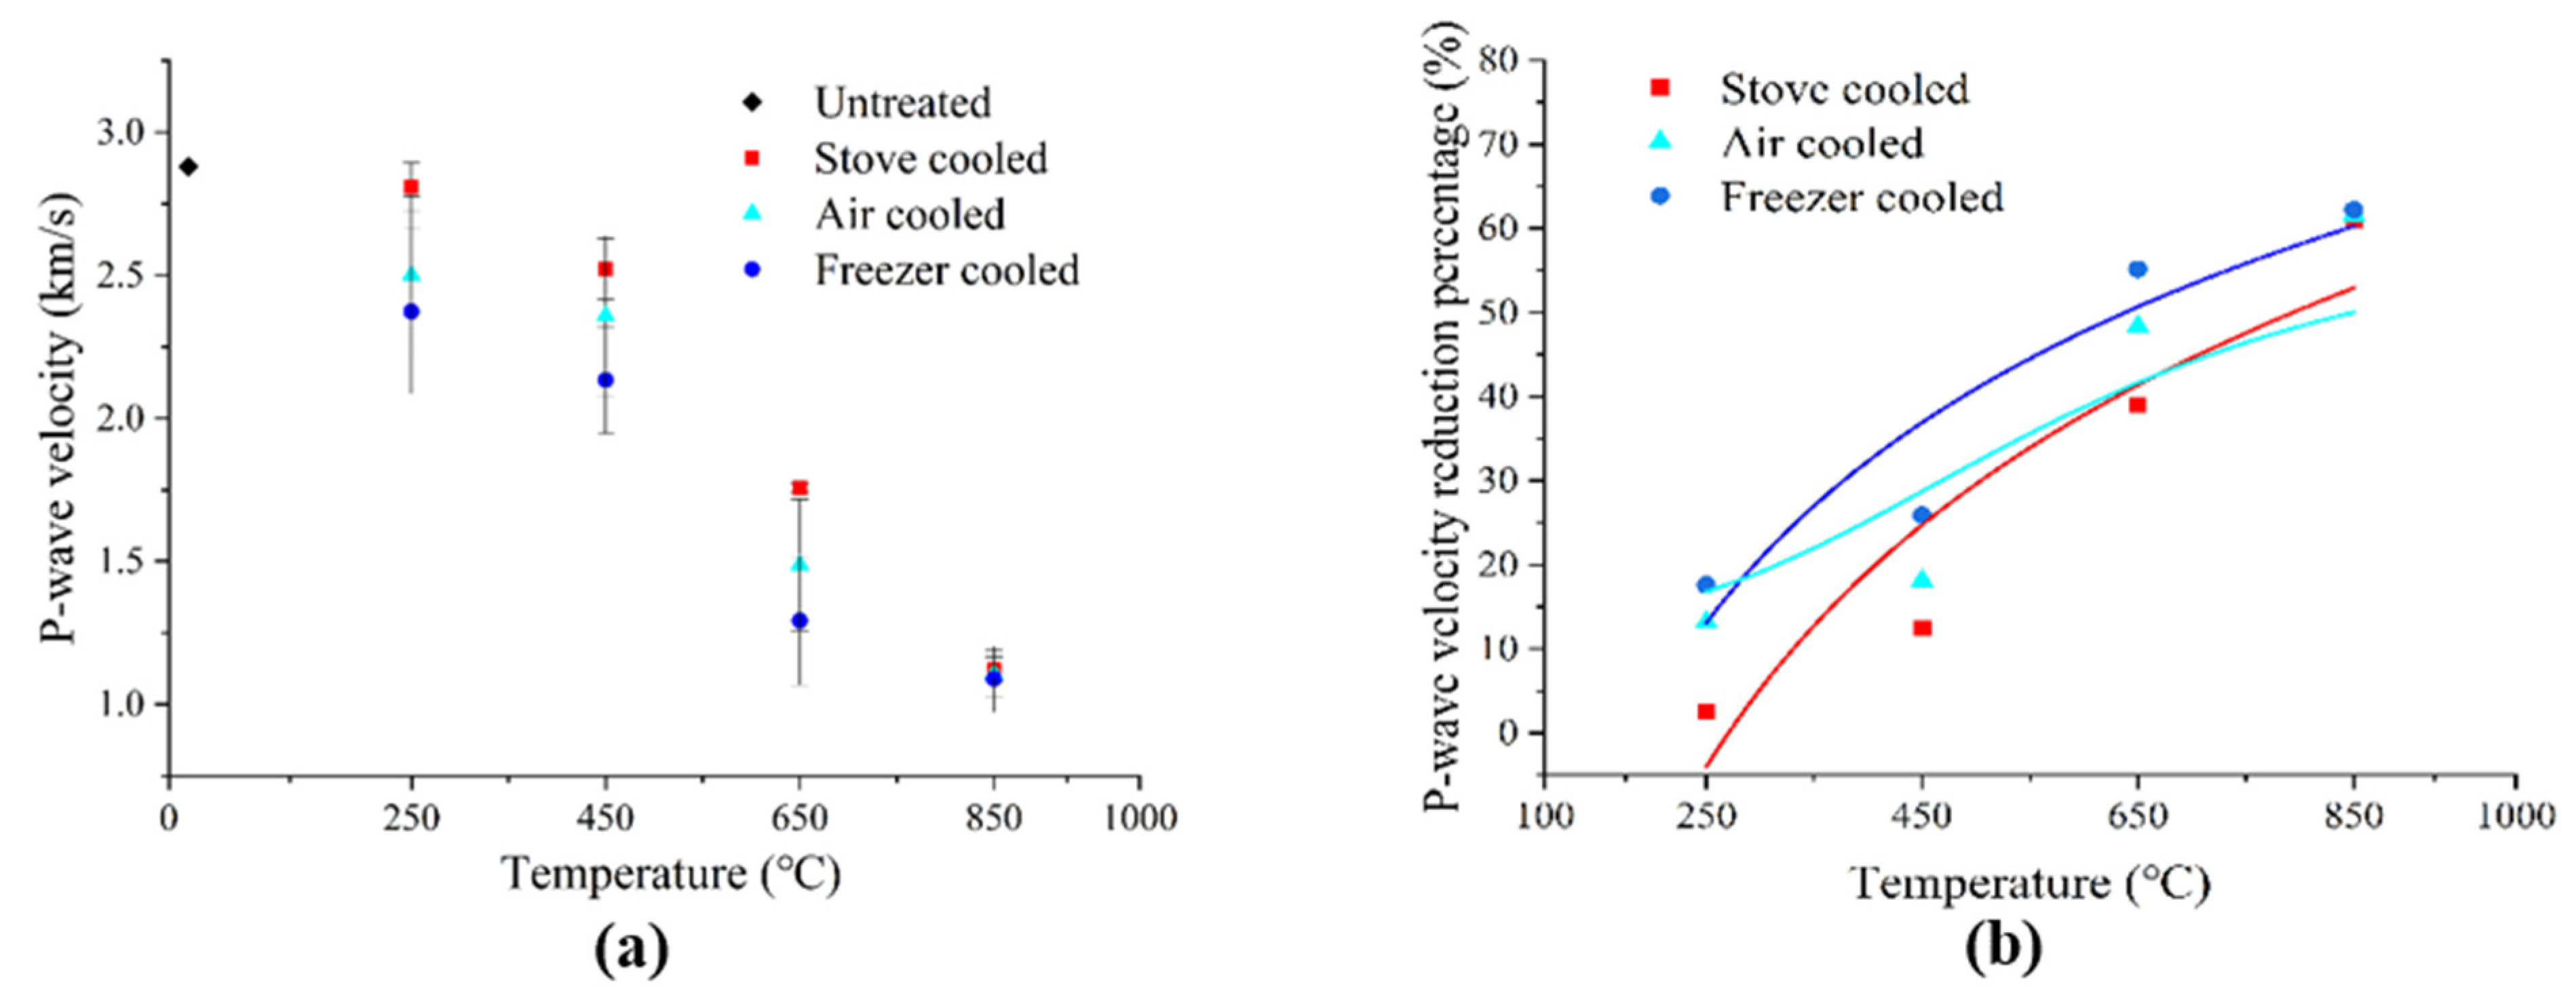
3.1.2. P-Wave Velocity
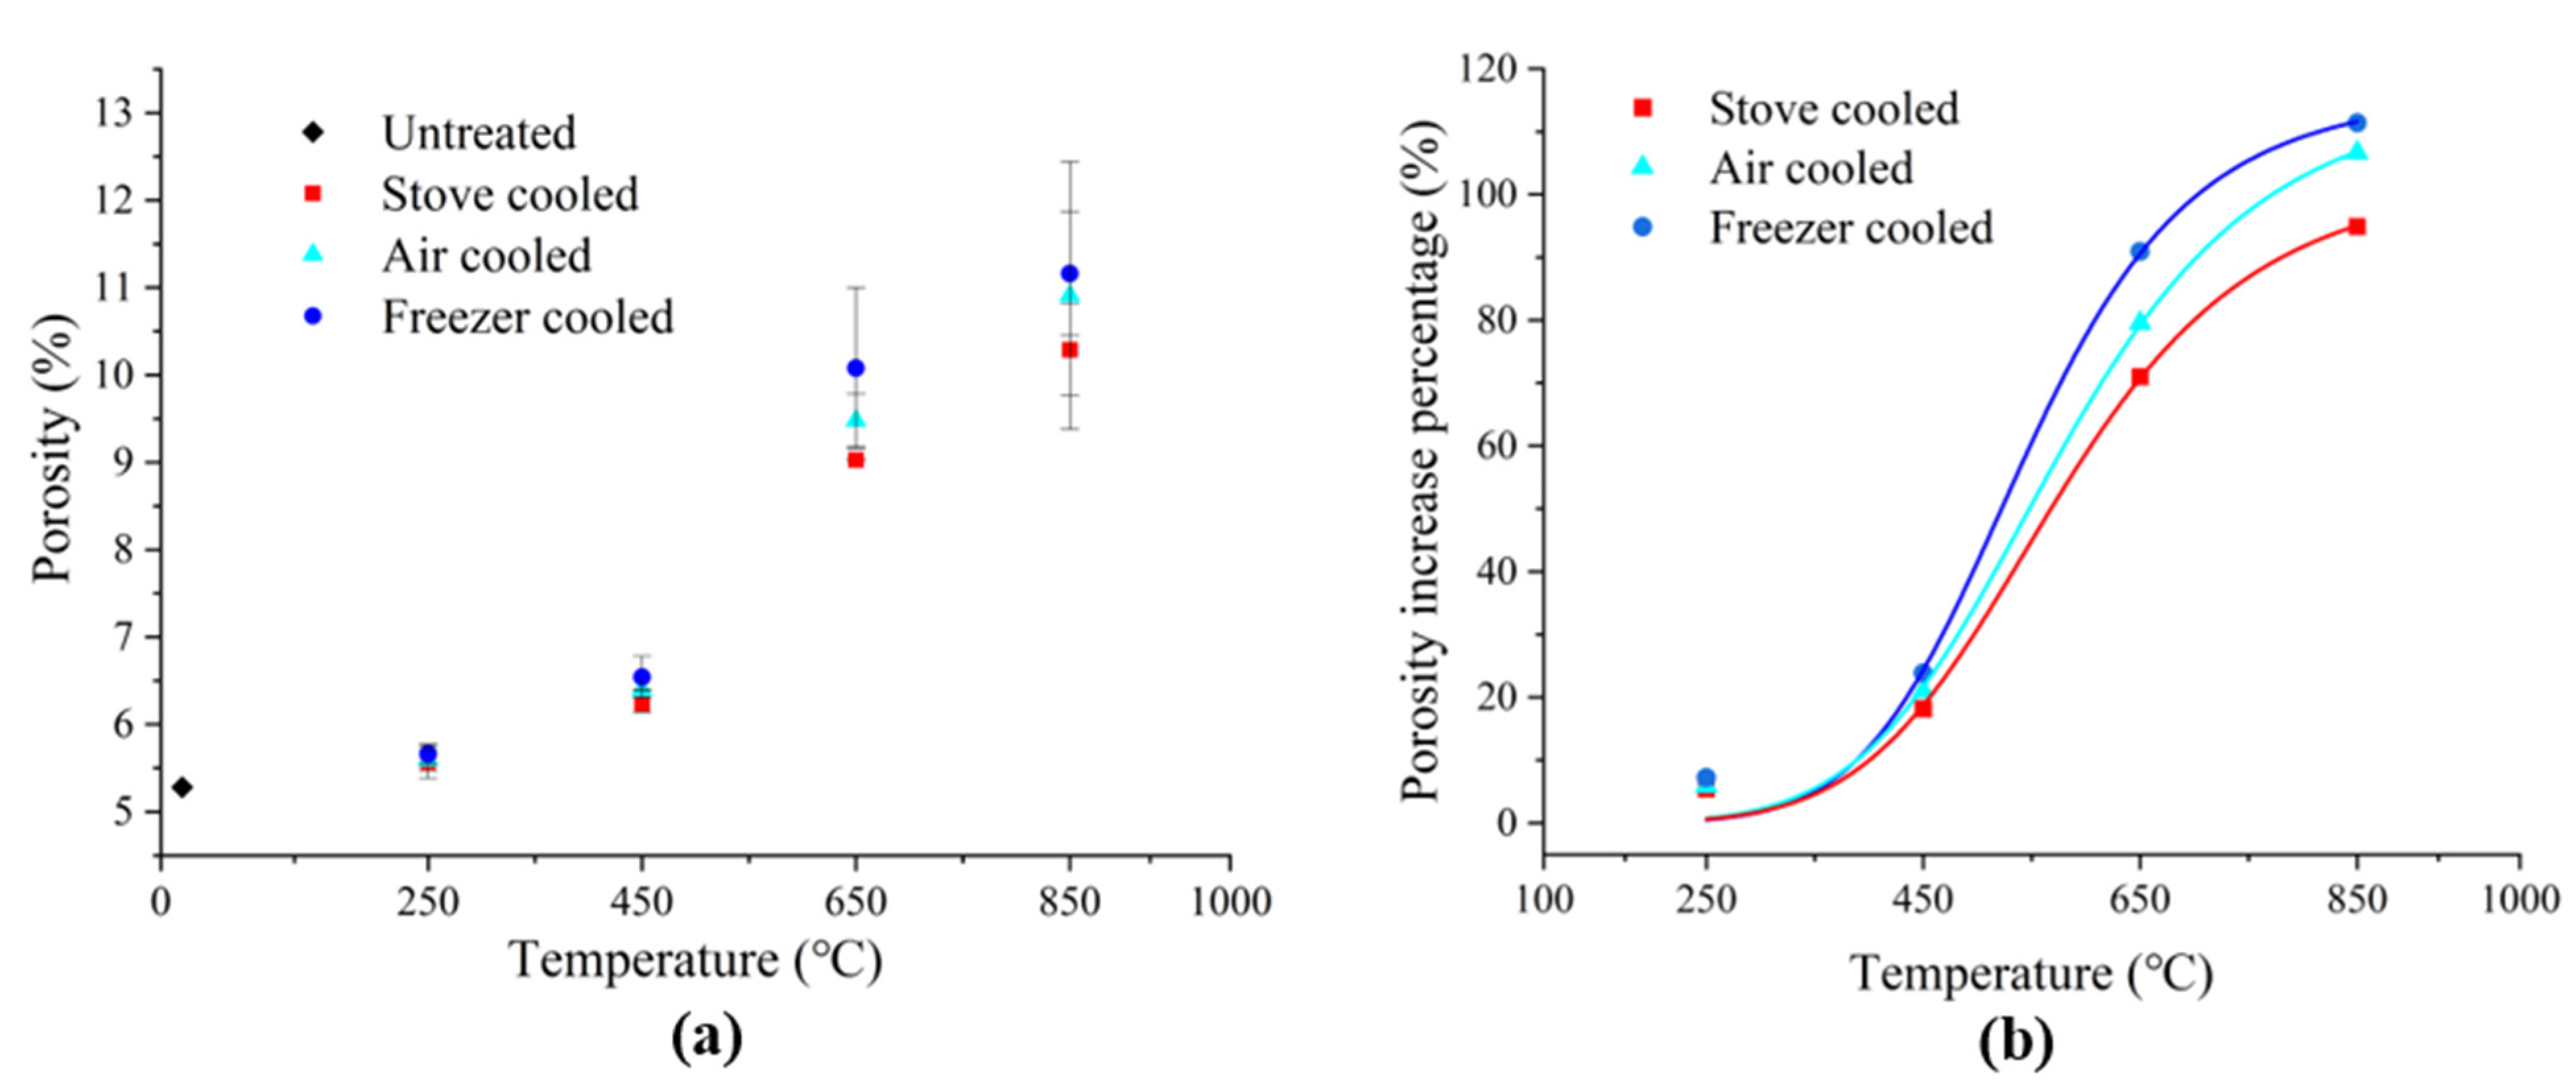
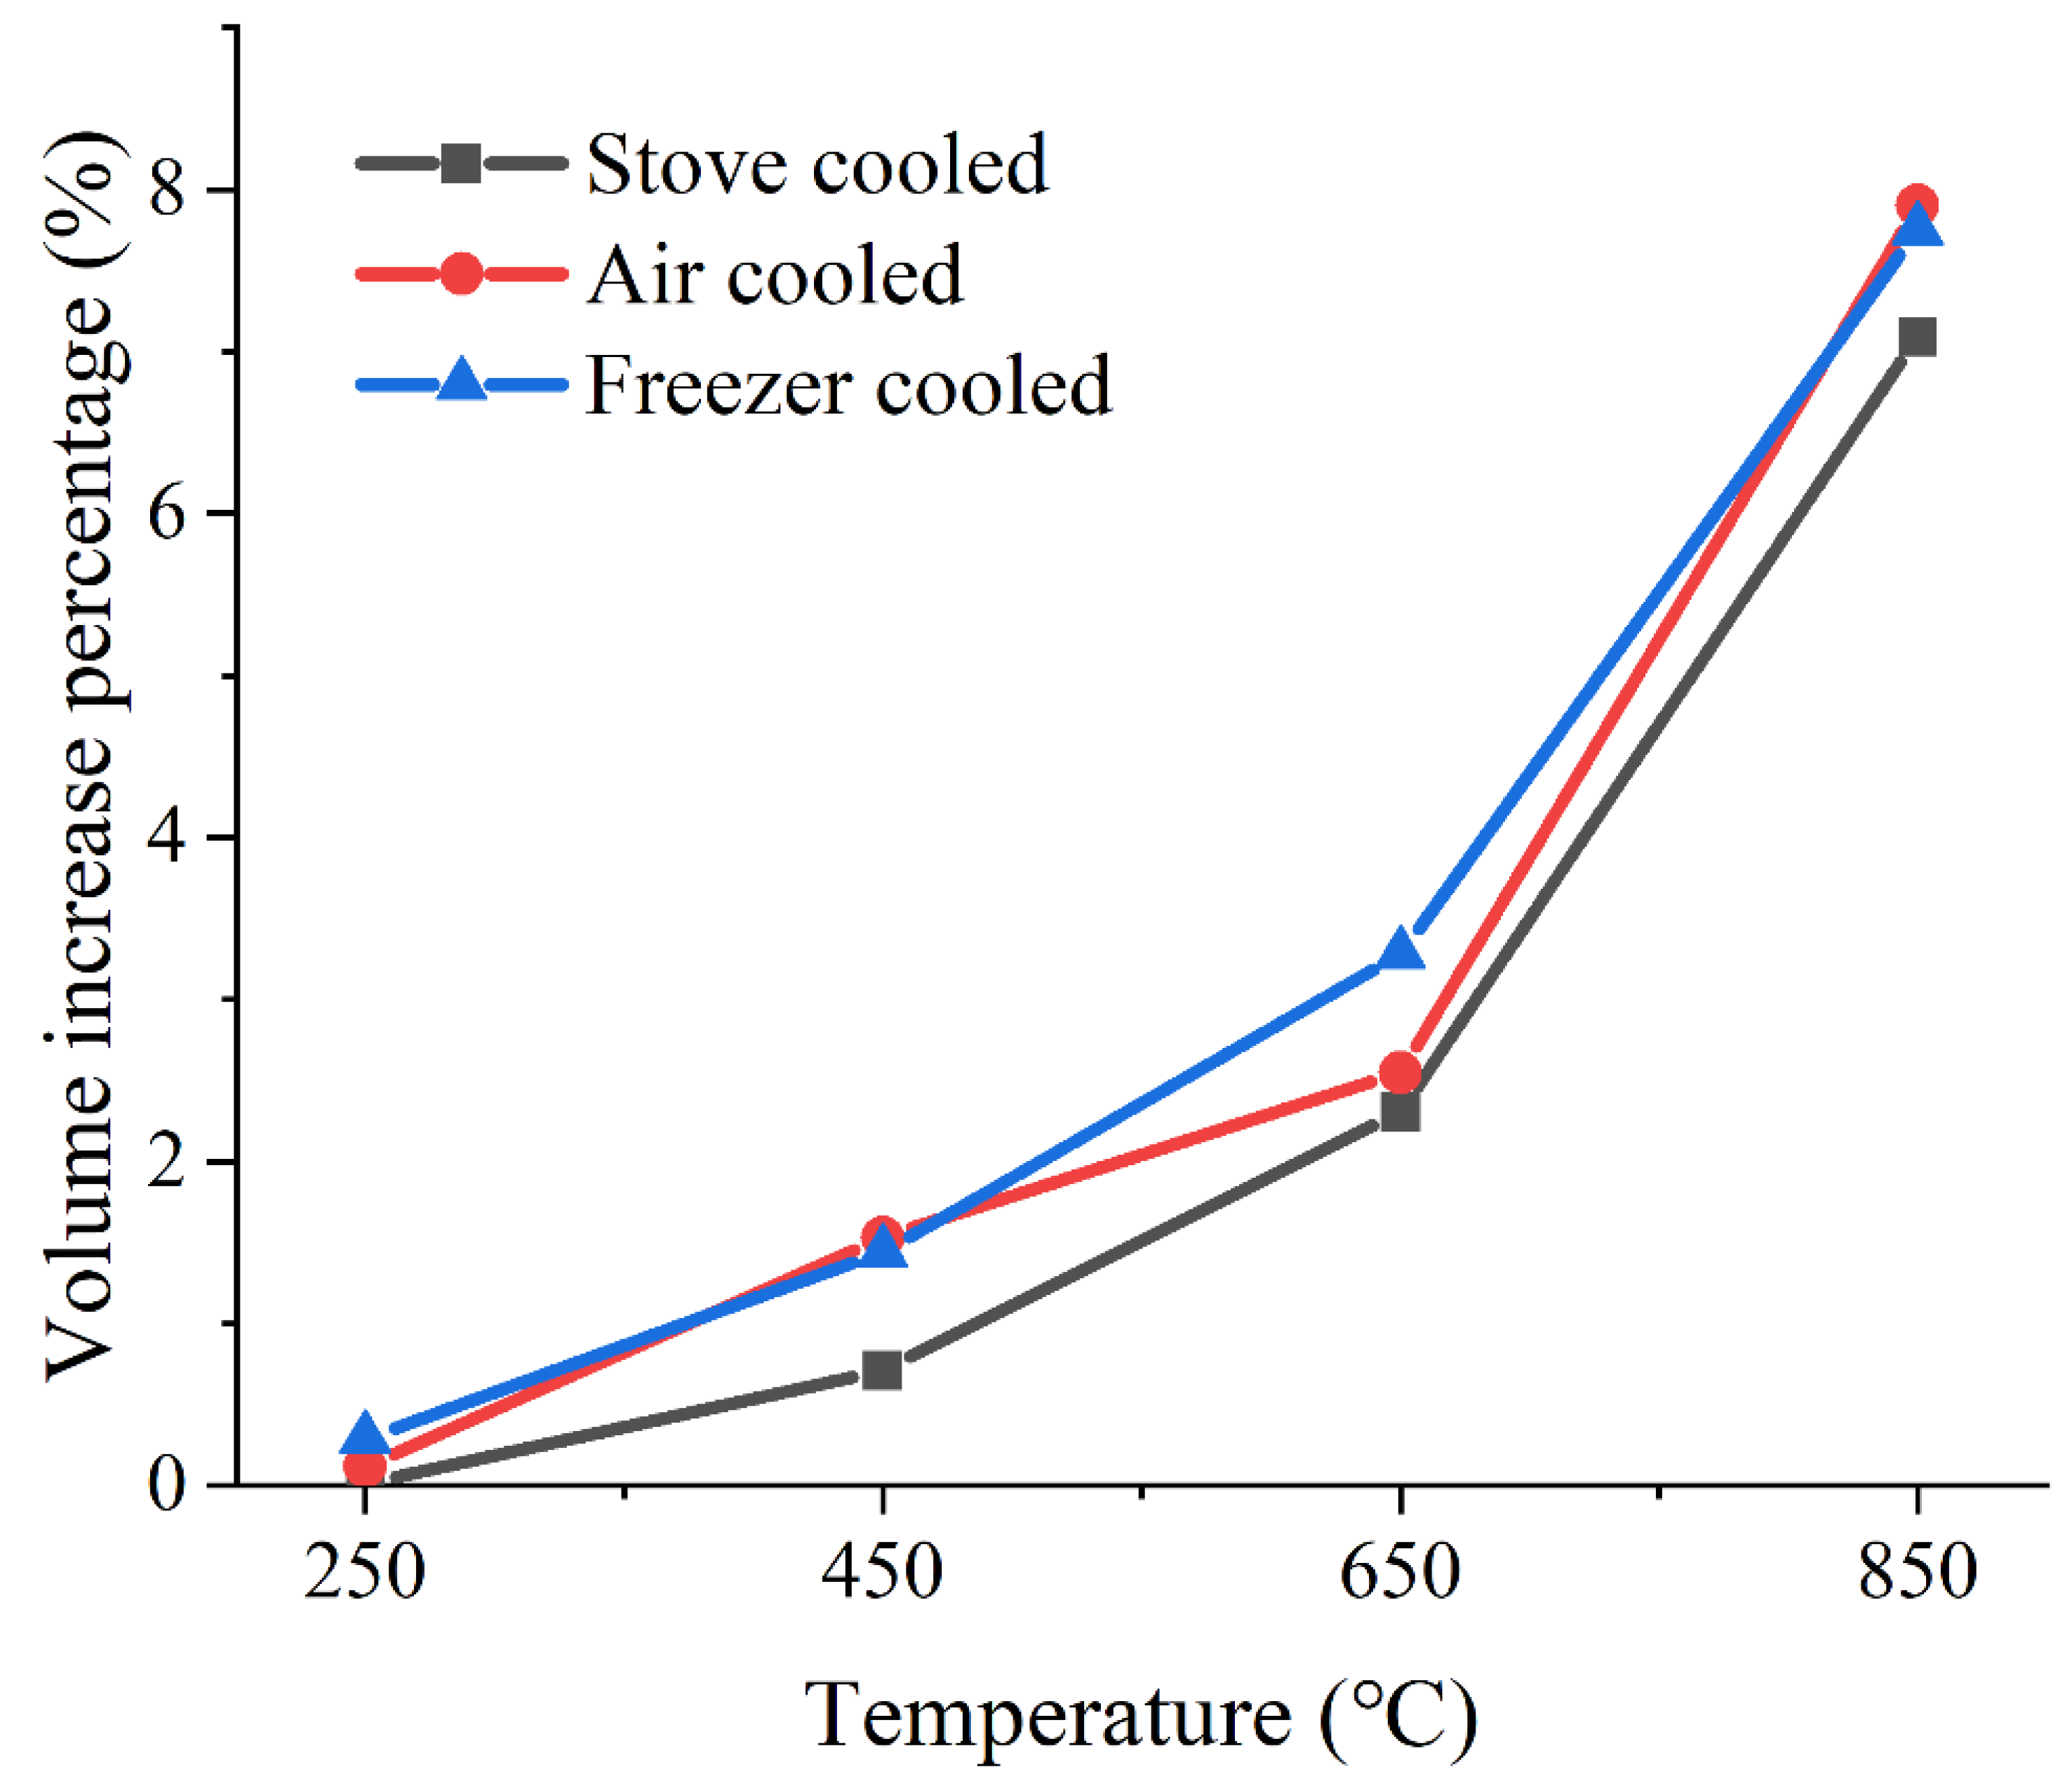
The P-wave velocity can be regarded as a reflection of the integrity and internal physical properties of the rock. Therefore, P-wave velocity is commonly used for describing the interior damage in rock. In this work, P-wave velocity is measured by a non-destructive ultrasonic detector (SETCW A-01 produced by Hunan Sine Electronic Technology). Petroleum jelly is applied to the two end faces of the specimen to ensure the effective connection between the specimen and the sensor during the measurement. P-wave velocity values of the four specimens are averaged as listed in Table 4, where the standard deviations of the P-wave velocity values are also given. Figure 6a,b illustrates the variation of the P-wave velocity and the percentage reduction in the P-wave velocity of the specimen as a function of the heating level, respectively. The P-wave velocity reduction percentage is calculated by Equation (14):
P V R P = V P V P V P × 100 %
where PVRP denotes the P-wave velocity reduction percentage; VP and V P are the P-wave velocities of the specimens before and after TS treatment, respectively.
As shown in Figure 6a, the P-wave velocity is negatively correlated with heating temperature. In the first three temperature levels, compared with stove cooling, the P-wave velocity reduction caused by air cooling and freezer cooling is greater, which indicates that the higher cooling rate causes more damage to the sandstone Figure 6b. The high temperature causes the strongly bound water and constitutional water inside the rock to escape, which leads to the evident damage of the mineral crystalline structure and the increase in microcracking [38,39,40,41,42]. In particular, a sharp drop occurs at 650 °C. For instance, the sandstone specimens heated to 250, 450, and 650 °C and stove-cooled can cause a reduction in the average P-wave velocity of around 2.5%, 12.43%, and 39.03%; the corresponding reduction in the specimen after air cooling is 13.19%, 18.13%, and 48.37%. The corresponding reduction in the specimen after freezer-cooling is up to 17.60%, 25.90%, and 55.14%, respectively. The main reason for this phenomenon might be that the effect of TS can cause additional damage to the internal structure of the sandstone, resulting in a decrease in the P-wave velocity. Such a trend is in accordance with that of dry density. At a temperature of 850 °C, the magnitude of P-wave velocity reduction caused by the three cooling methods is almost equal, which indicates that the cracks and pores caused by the heating at 850 °C are sufficient to accommodate the damage generated during the cooling process. As illustrated in Figure 6b, the data of the percentage reduction in P-wave velocity caused by three cooling methods are fitted by Equations (15)–(17):
PVRP(stove cooled) = 284 × ln(0.18 × ln(T)), R2 = 0.87
PVRP(air cooled) = 6148/(1 + (T/577)3), R2 = 0.81
PVRP(freezer cooled) = 235 × ln(0.19 × ln(T)), i2 = 0.88

3.1.3. Porosity

According to the method suggested by ISRM, the porosity of sandstone is measured by the buoyancy technique [33]. The average porosity values of the four specimens and the standard deviation of the porosity values are given in Table 5. Figure 7a,b illustrates the variation of the porosity and the percentage reduction in the porosity as a function of heating level, respectively. The porosity increase percentage is calculated by Equation (18):
P I P = P P P × 100 %
where PIP denotes the porosity increase percentage; P and P are the porosity of the specimens before and after TS treatment, respectively.
Compared with the untreated specimen, the porosity of the specimen presents an ascending trend as the heating level rises as shown in Figure 7a. From 250 to 450 °C, the growth in porosity is comparatively slow. The corresponding porosity caused by the stove cooling increases by 5.49% and 18.18%; the porosity caused by air cooling increases by 5.87% and 21.02%, and the porosity caused by freezer cooling increases by 7.2% and 23.86%, respectively. However, similar to the previous trend of dry density and P-wave velocity of sandstone, the porosity of sandstone also has a similar large variation at 650 °C. The porosity of sandstone caused by stove cooling, air cooling, and freezer cooling increases by 71.02%, 79.55%, and 90.91%, respectively. Furthermore, the percentage of porosity increase caused by air cooling and freezer cooling both exceed 100% at 850 °C, increasing by 106.63% and 111.36%, respectively. As shown in Figure 7b, the percentage of the porosity increase caused by freezer cooling is greater than that caused by air cooling, which indicates that higher cooling rates have a significant effect on sandstone porosity. The heating treatment and cooling process produce microcracks in the sandstone, which increase the volume of sandstone, thus increasing its porosity. As the porosity of sandstone increases, the dry density and P-wave velocity of sandstone decrease. This is the reason that the dry density and P-wave velocity of sandstone decrease. As illustrated in Figure 7b, the data of the percentage of porosity increase caused by three cooling methods are fitted with Equations (19)–(21):
PIP(stove cooled) = 103 × T6/(5736 + T6), R2 = 0.99
PIP(air cooled) = 116 × T6/(5746 + T6), R2 = 0.99
PIP(freezer cooled) = 116 × T7/(5437 + T7), R2 = 0.99

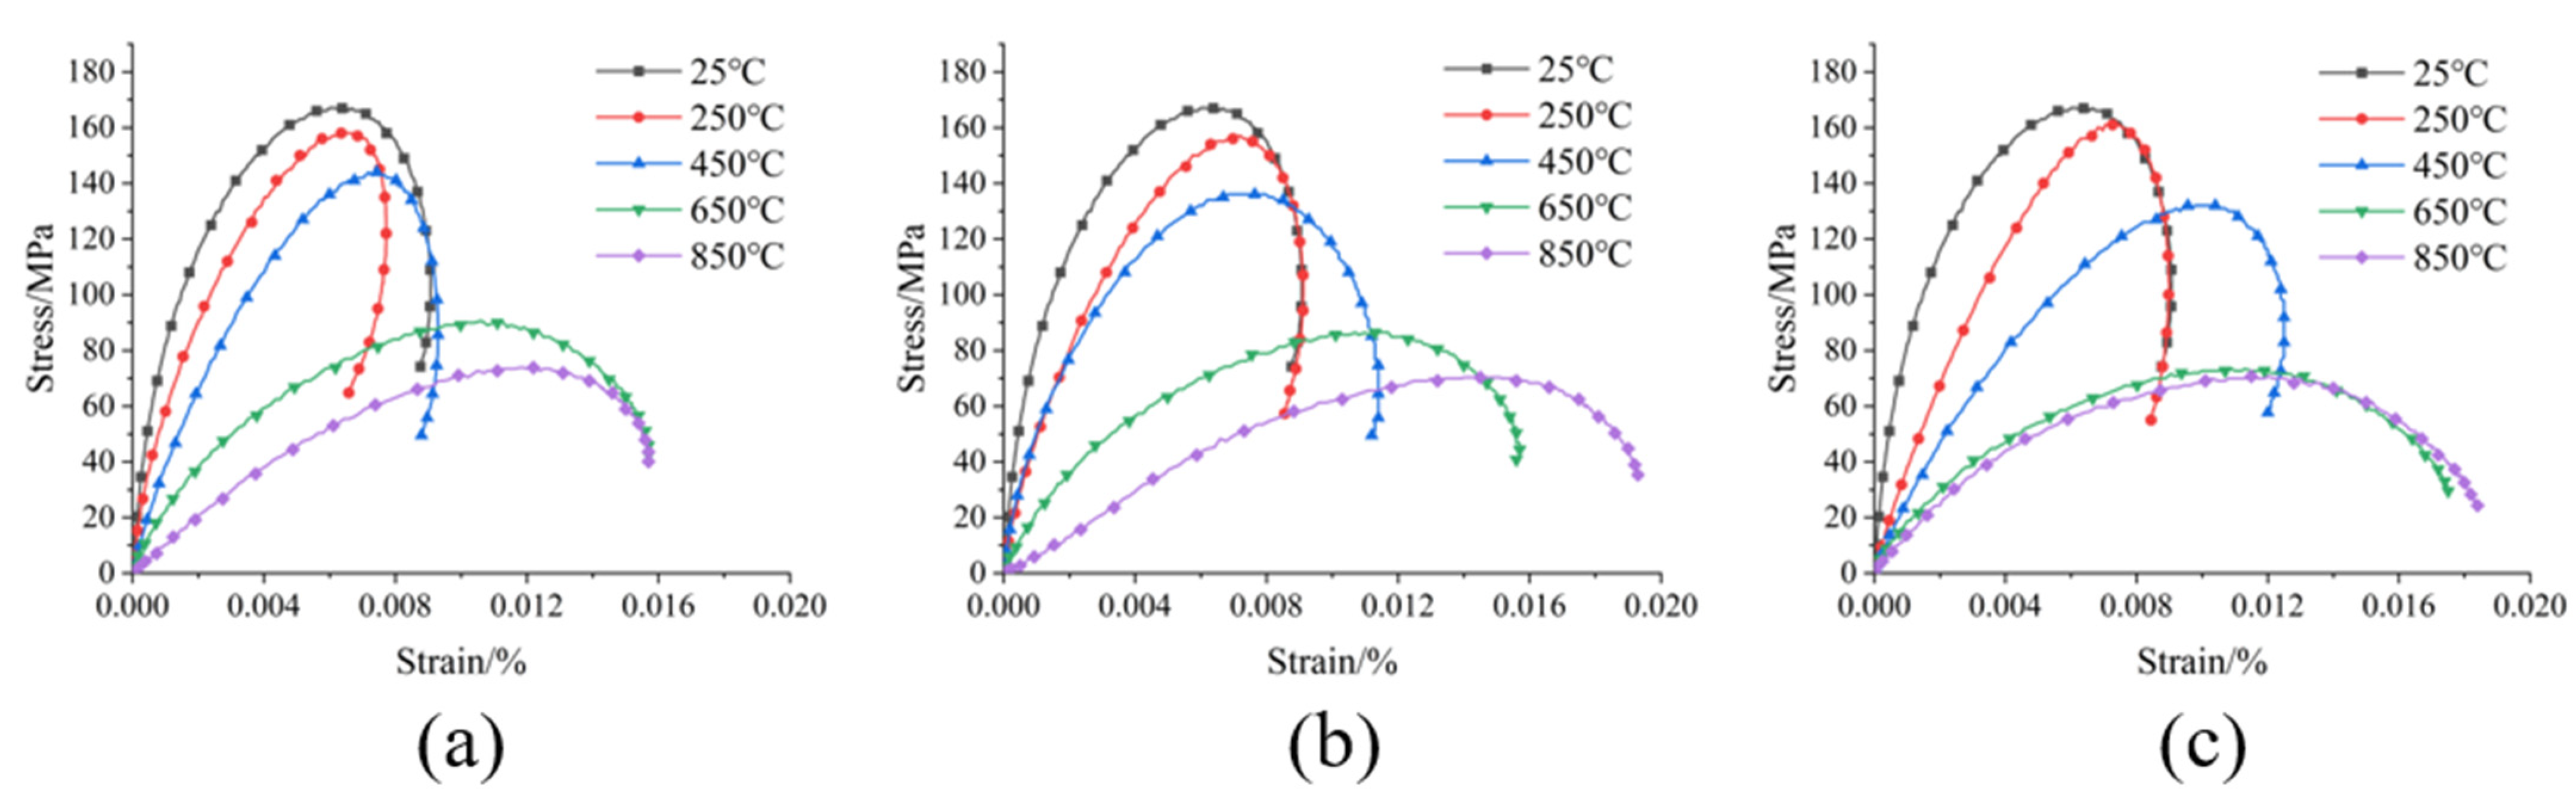
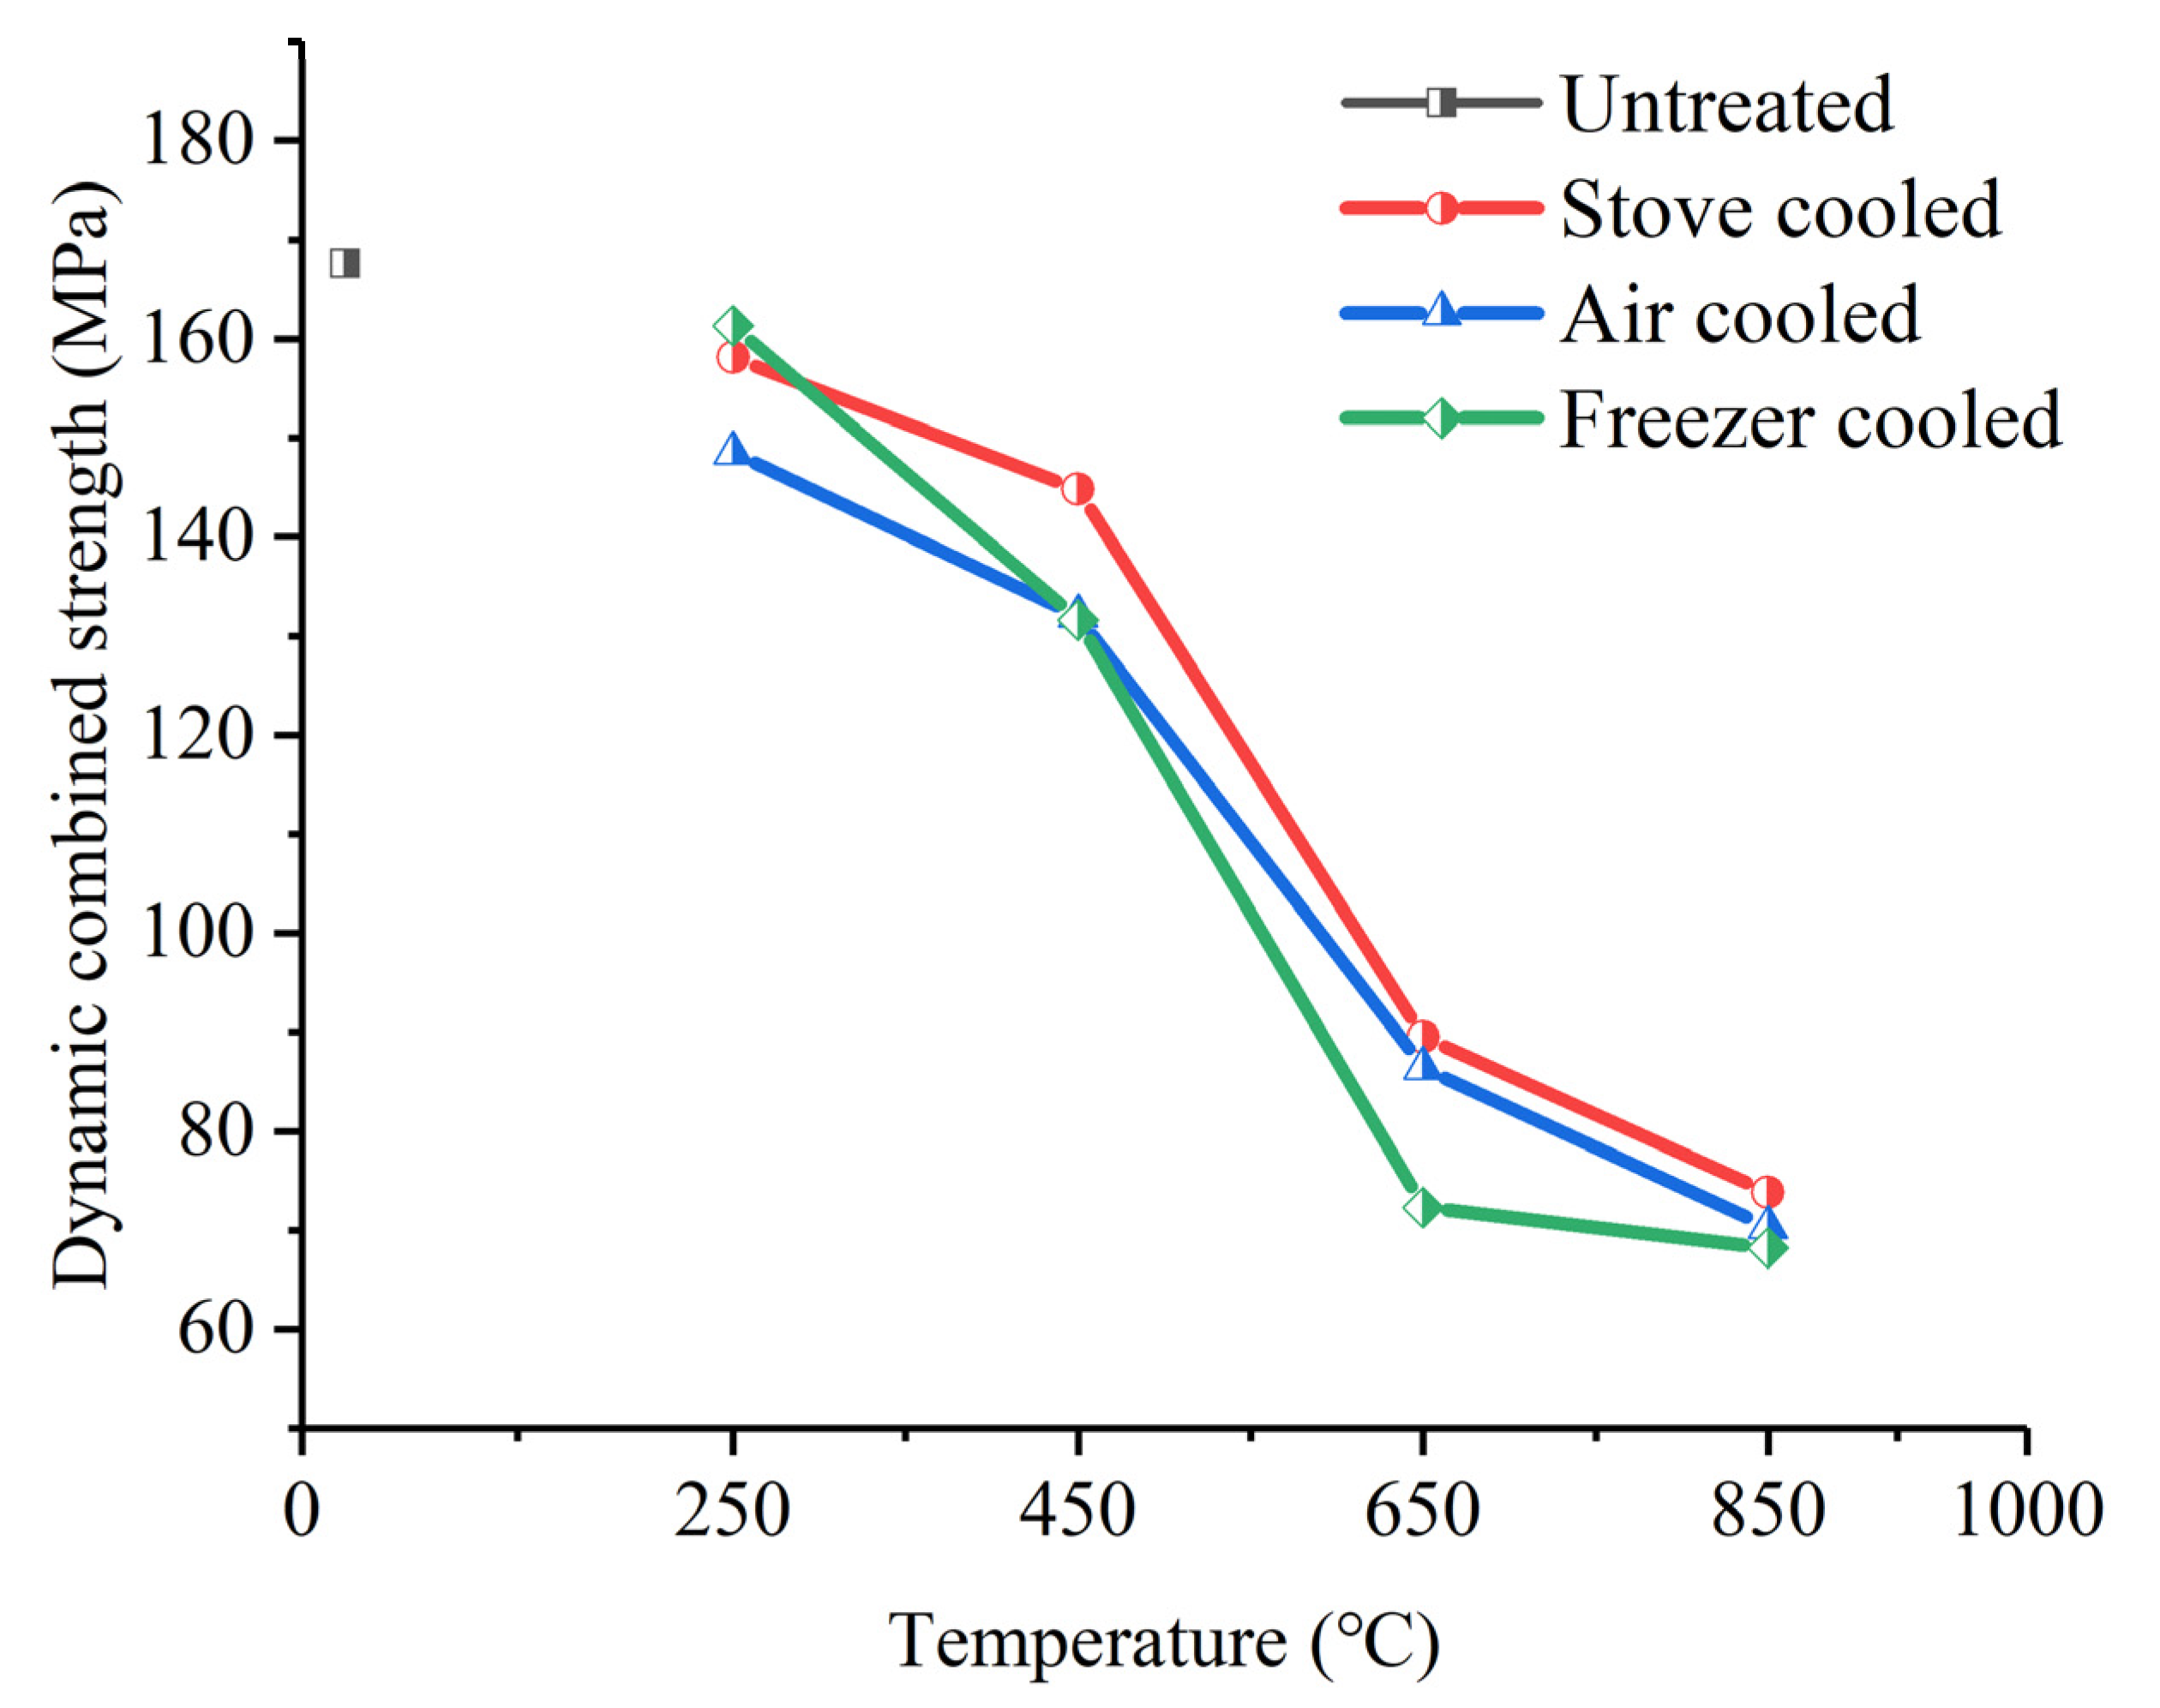
3.2. Dynamic Combined Strength of Sandstone

To demonstrate the effect of TS on the dynamic mechanical characteristics of sandstone specimens, the representative stress–strain curves of sandstone specimens cooled with different cooling methods are shown in Figure 8 as an example. As can be seen from the figures, the dynamic stress–strain curves of five groups of sandstone specimens enter the elastic stage at the beginning of the rising phase. As the strain increases, the tangent modulus of the sandstone specimen gradually decreases, and with the increase in heating level, the dynamic load peak stress of the sandstone specimen decreases gradually under the same cooling method. As shown in Figure 8, at lower heating levels (e.g., 25, 250, and 450 °C), the strain of the post-peak curve decreases with the decrease in stress, which is called springback [20]. At higher heating levels (e.g., 650 and 850 °C), no springback can be observed. Based on the test results, the dynamic combined strength of specimens can be obtained as the peak value of the stress–strain curves, which can be regarded as a reflection of the capacity of the impact resistance. In the coupled dynamic and static loading experiment, the dynamic combined strength of the specimen is represented by the sum of the axial static stress and the dynamic compressive strength, Equation (22):
PUCS = Pas + Pdcs
where PUCS is the dynamic combined strength; Pas is the axial static stress; Pdcs is the dynamic compressive strength.
The dynamic combined strength values of the specimens before and after TS treatments are listed in Table 6. As shown in Figure 9, the dynamic combined strength of the specimen presents a descending trend with the increasing heating level. When the temperature of TS treatment was less than 450 °C, the maximum drop of 21.48% of the dynamic comprehensive strength was caused by the freezer cooling. It was noticed that a sharp drop in strength (48.45% by air-cooled and 56.86% by freezer-cooled) occurs at the heating temperature of 650 °C, which was in accordance with the observation that the dry density and P-wave velocity decrease and porosity increases significantly at 650 °C. It is known that the crystal structure of quartz goes through α–β transition at the temperature of 573 °C [43,44,45]. Therefore, in this study, the α–β transition of quartz occurred in the sandstone at the heating level of 650 °C and above. The α–β transformation can cause a change in the geometry of the quartz, which encourages the development of pores between the mineral particles, resulting in additional damage and a decrease in the strength of the sandstone. At 850 °C, the dynamic combined strength decreases by 58.05% for air-cooled specimens and decreases by 59.31% for freezer-cooled specimens, which is in accordance with the trend of the physical properties of sandstone after TS. For each heating temperature, the dynamic combined strength of freezer-cooled specimens is lower than that of air-cooled specimens, which indicates a higher degree of damage caused by the higher cooling rate.

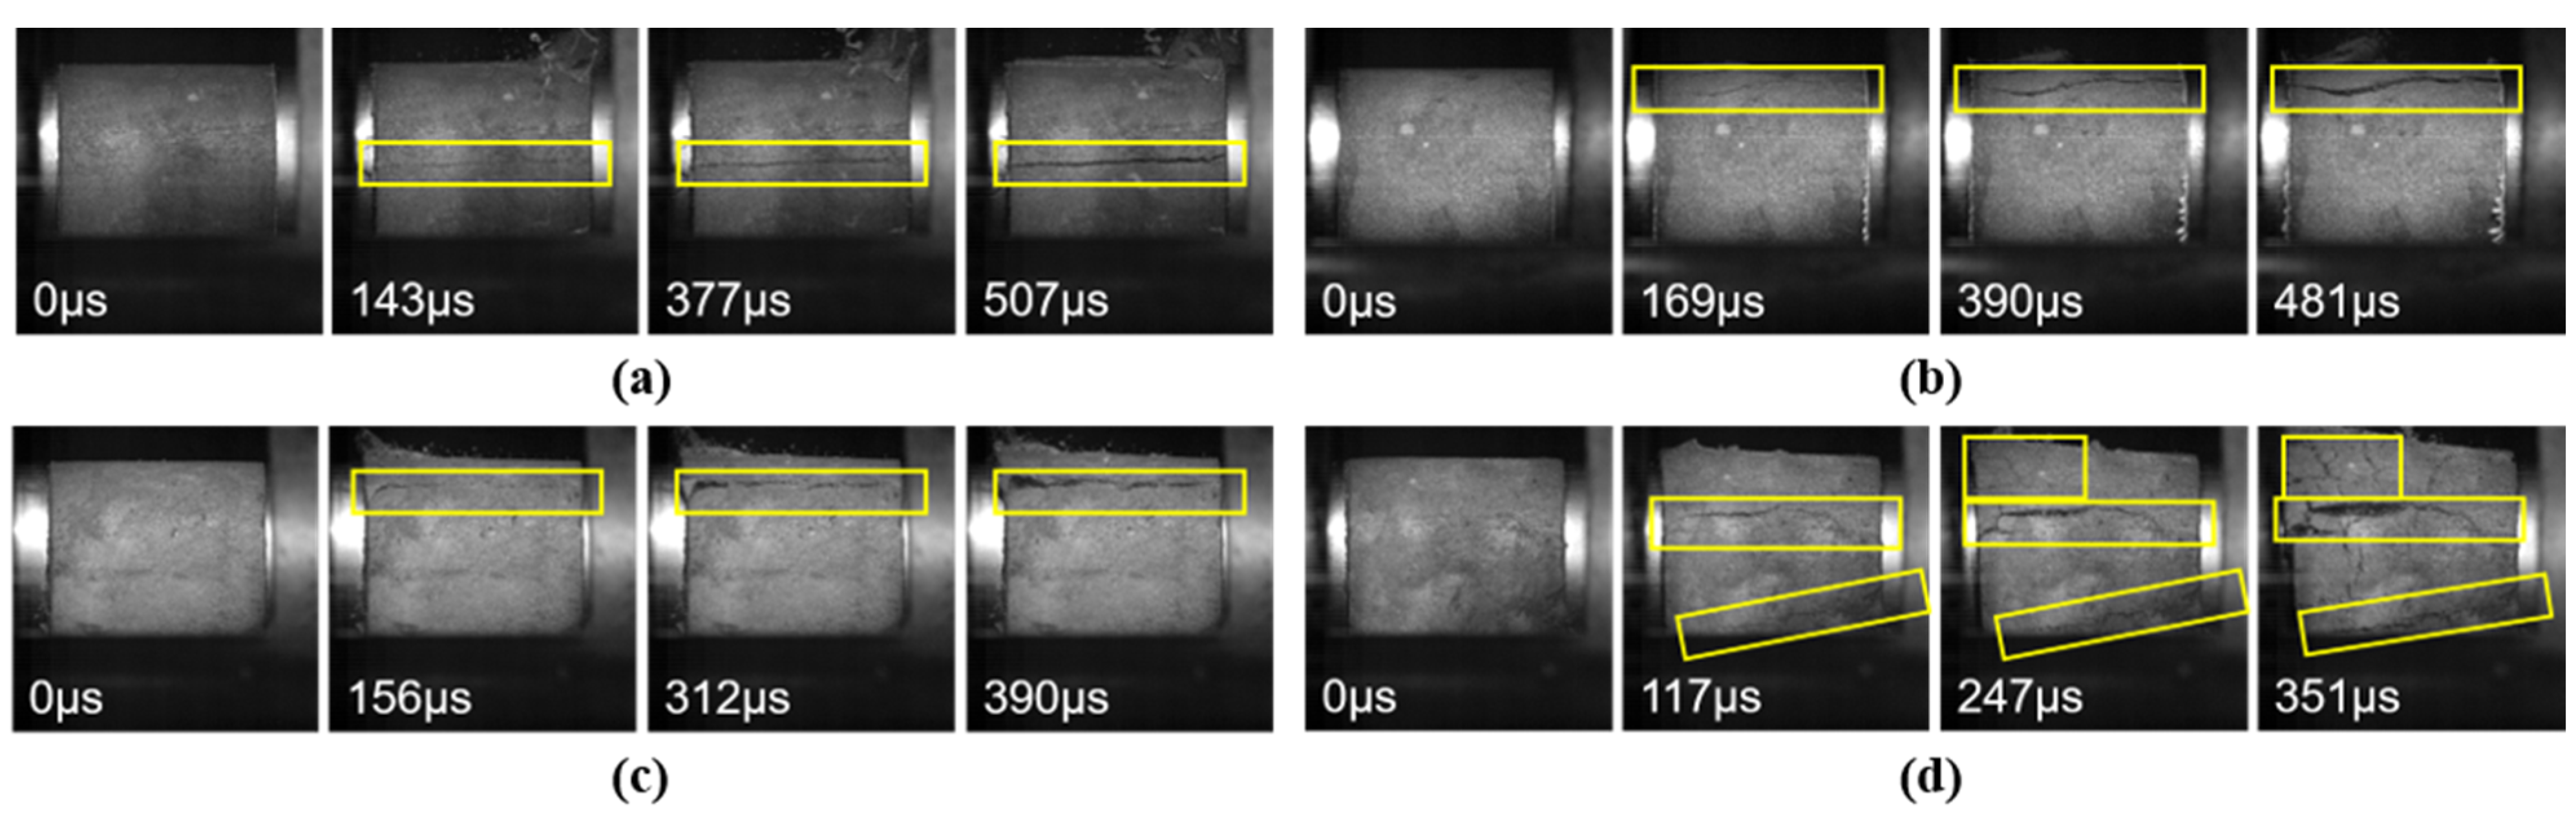
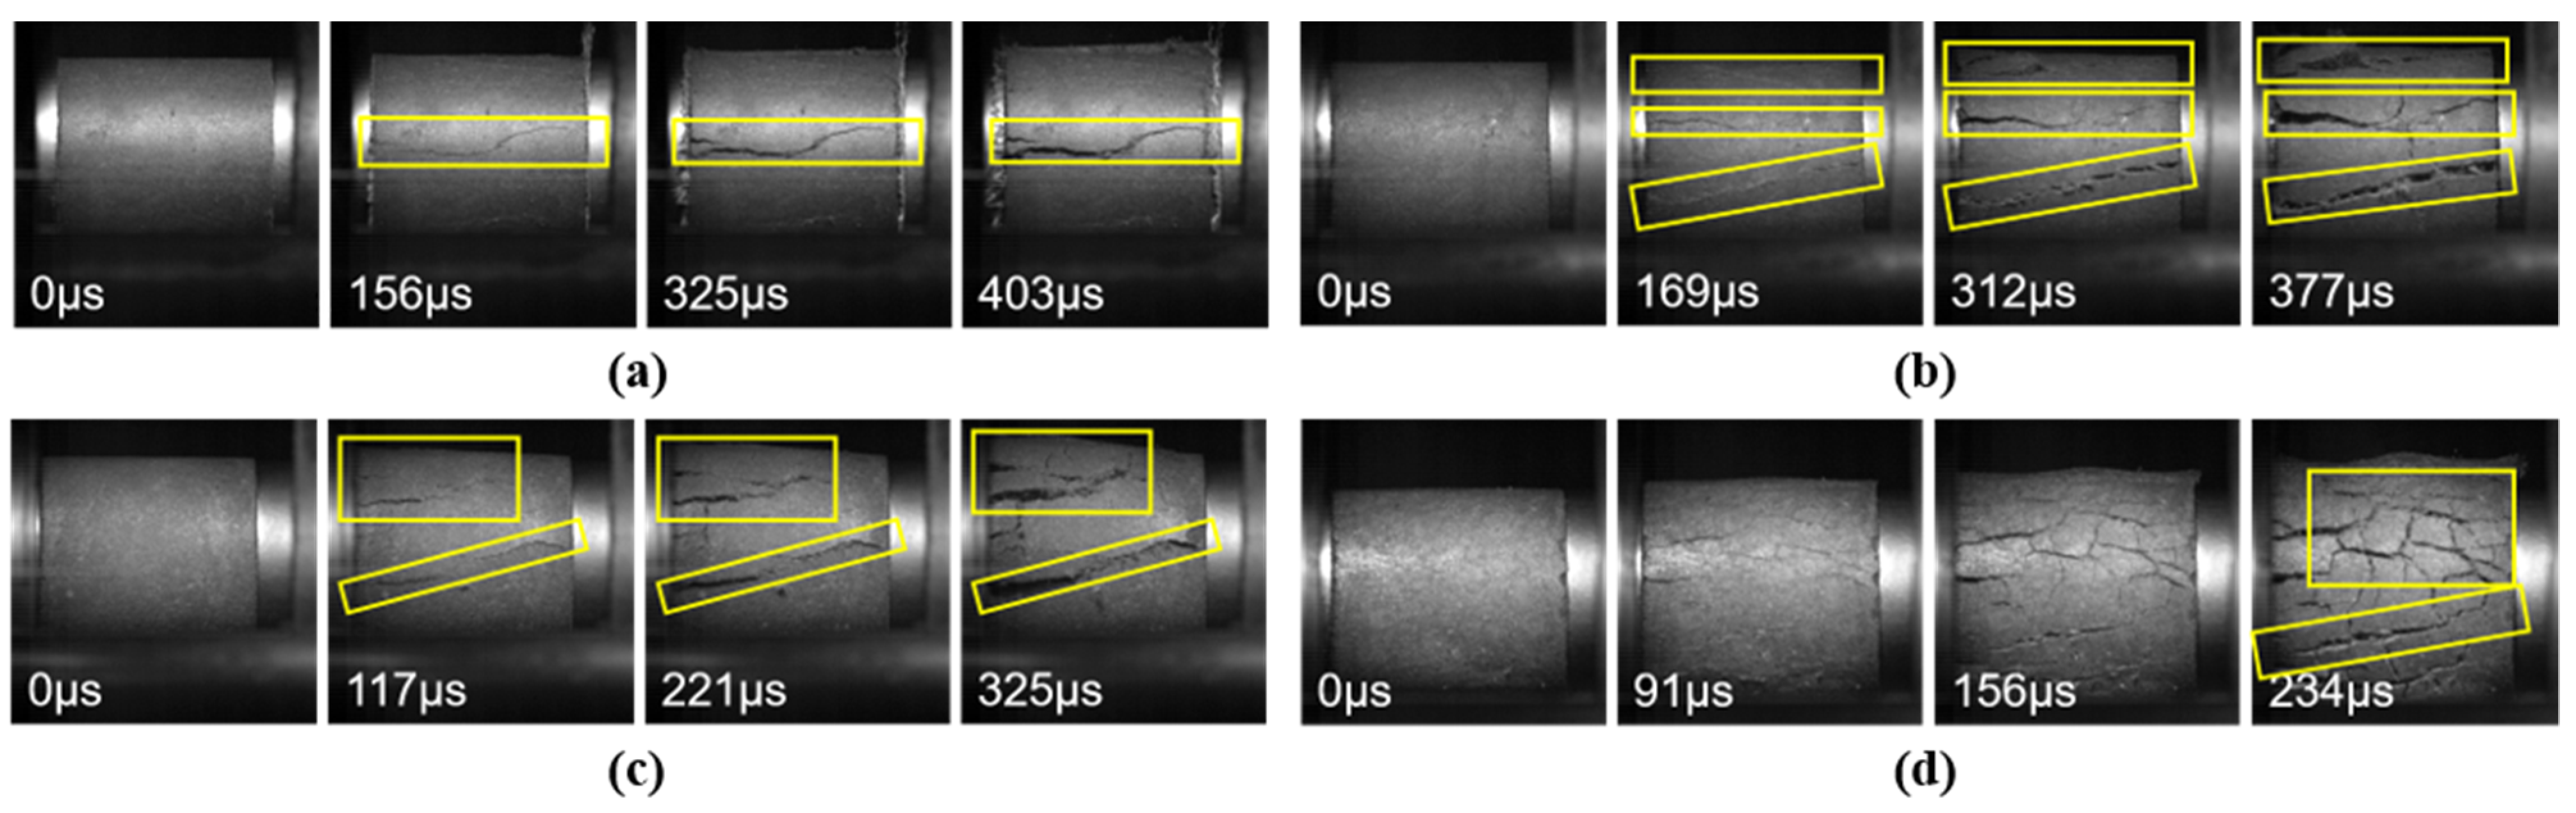
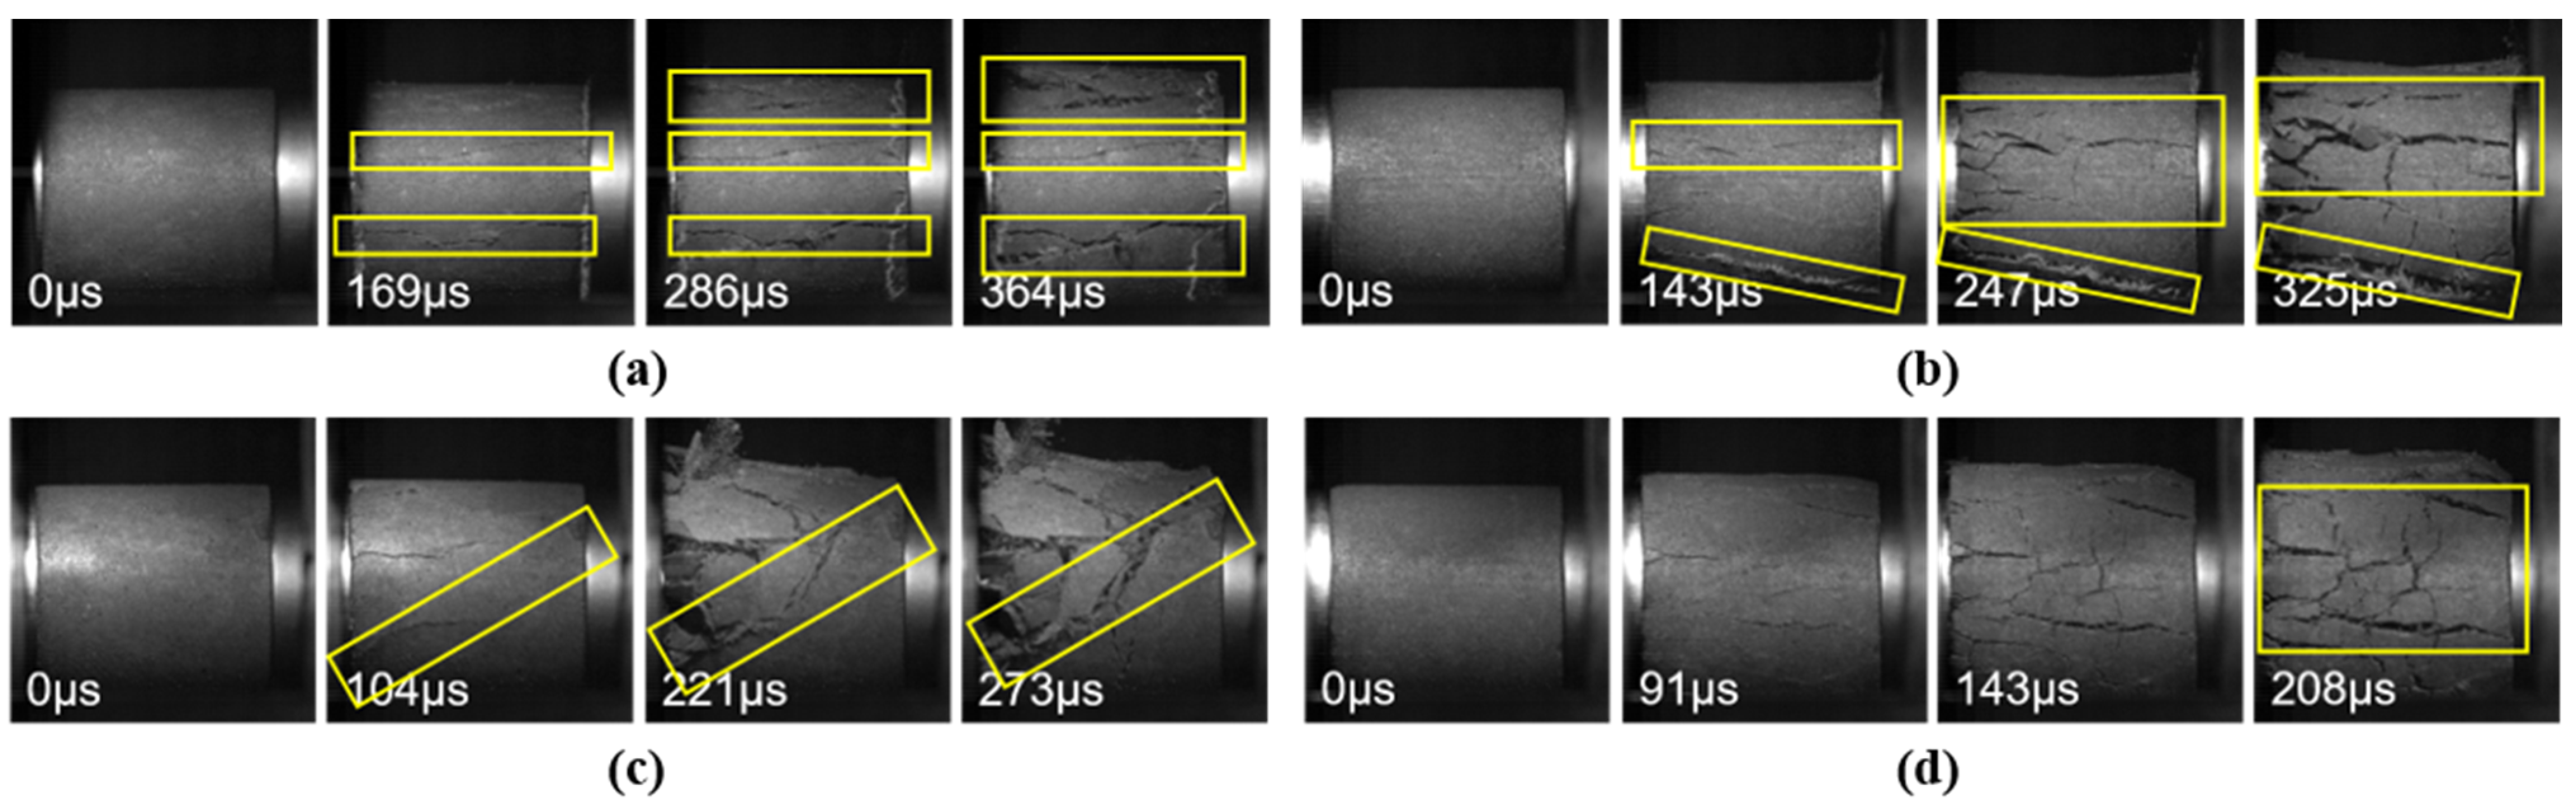
3.3. Failure Mode of Sandstone under Coupled Dynamic and Static Loads

In this section, the failure modes of TS-treated sandstone specimens are analyzed and discussed under coupled dynamic and static loads. Figure 10 shows the failure modes of sandstone specimens cooled in the stove after heating at four different temperature levels. When the heating temperature is below 650 °C, fractures along the loading direction are observed in the specimen suggesting an axial splitting tensile failure mode (Figure 10a–c). However, when heating treatment reaches 850 °C, the fractures are along the two primary failure paths and some local failure is induced. In this case, the sandstone specimen primarily experiences axial splitting tensile failure, while shear failure occurred in the lower left and right corner Figure 10d. The reason for this phenomenon is that the heating temperature up to 850 °C damages the internal structure of the rock substantially. Large amounts of thermal microcracks are induced, and these microcracks propagate and merge into macrocracks during the loading process. For the specimens cooled in air, when the heating temperature is 250 °C, the induced fractures are along a main failure path, and the failure mode was axial splitting tensile failure (Figure 11a). However, local shear failure is also observed at the lower-left corner of the specimen at a heating level of 450 °C (Figure 11b). At a higher heating temperature of 650 °C, the proportion of local shear failure at the lower-left corner was greater than that of 450 °C (Figure 11c). It is also worth noting that a large number of cracks occur in the sandstone at 850 °C during the loading process. These cracks merged into macrocracks, which resulted in fracture patterns with no clear dominant path (Figure 11d). Comparing with the air-cooled specimens, the higher cooling rate caused by freezer cooling causes more damage to the internal structure of the rock. As shown in Figure 12a, the failure mode of sandstone specimens is mainly an axial splitting tensile failure, while shear failure occurred in the upper part of the sandstone at 250 °C. A large number of cracks appeared in the specimen and merged into macrocracks during the loading process at 450 °C. The failure mode of sandstone specimens was mainly shear failure, while axial splitting tensile failure occurred in the middle of the sandstone in Figure 12b. At 650 °C, the failure mode of the sandstone specimen becomes shear failure in Figure 12c. The failure mode of sandstone caused by freezer cooling is similar to that caused by air cooling at 850 °C, where no clear main failure path can be determined (Figure 12d). The coupled dynamic and static loading experiment results show that under the same heating temperature, the failure mode is influenced by different cooling methods. It is assumed that due to that the weakening of the internal structure of the sandstone caused by the higher cooling rate, more microcracks are produced, and the fracture preferentially occurs along the microcracks during the loading process, which leads to differences in the failure mode of the sandstone.

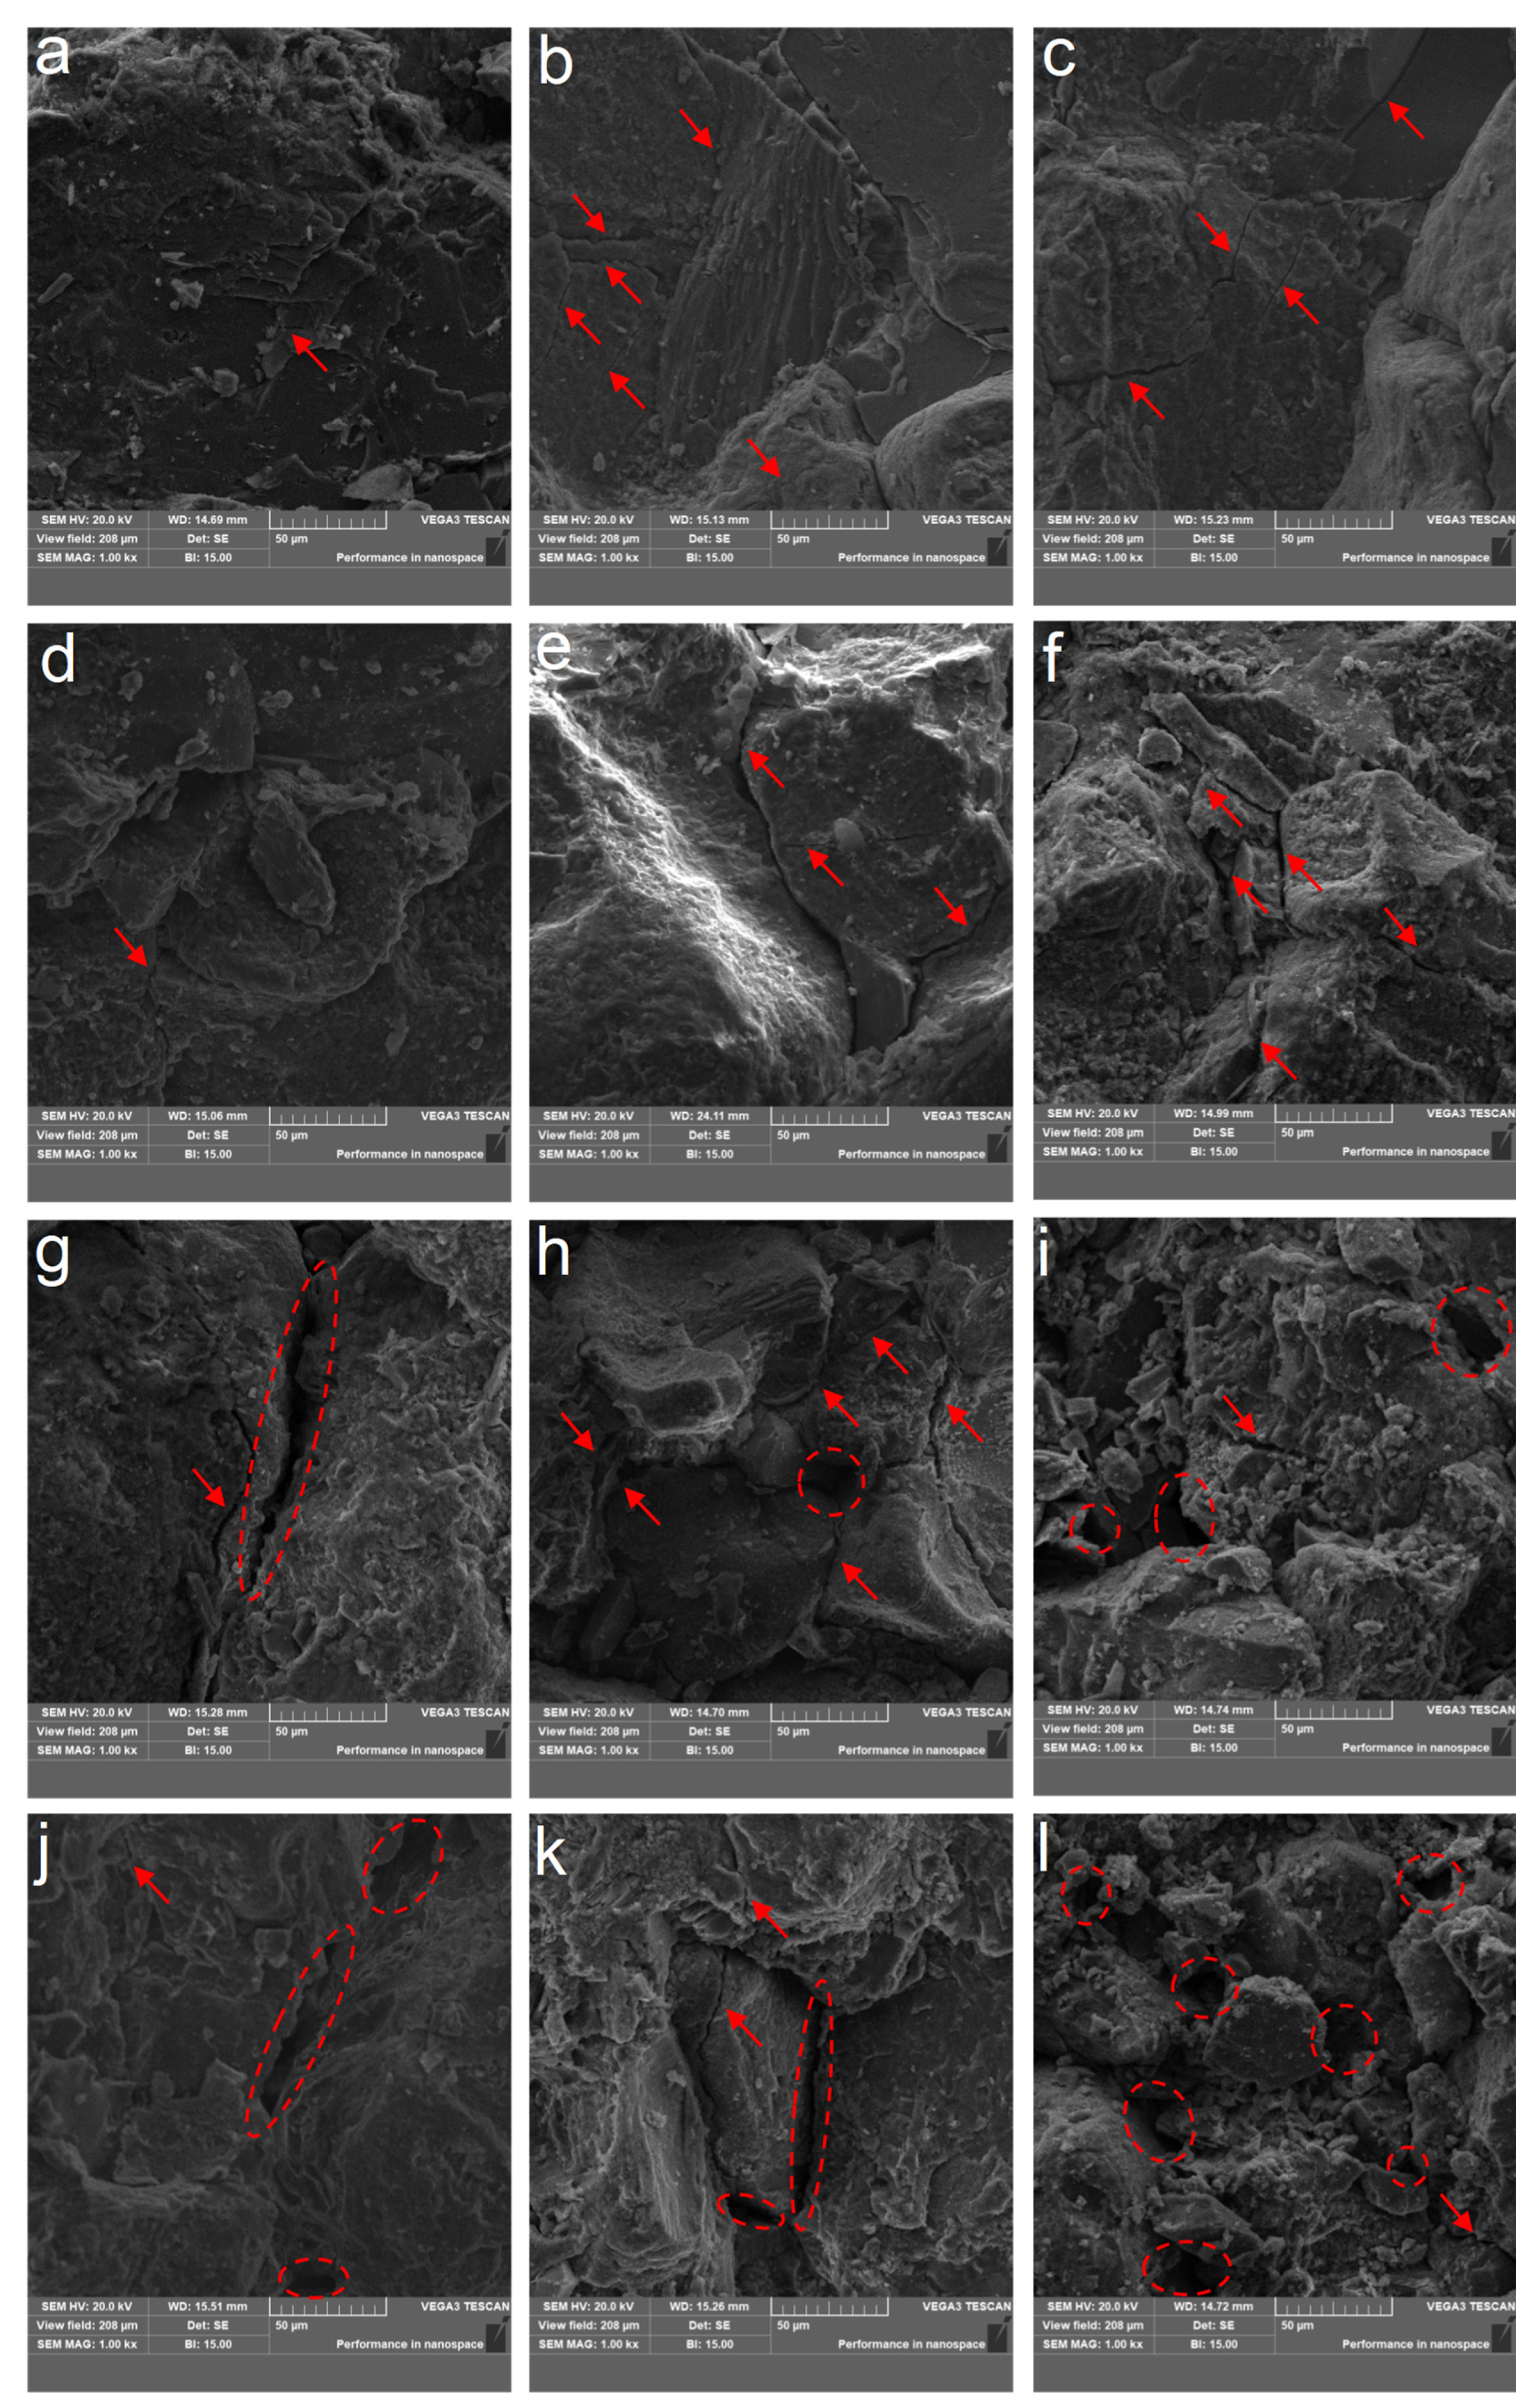
3.4. Microscopic Characteristics of Sandstone Failure

Due to the heterogeneity and anisotropy of rock minerals, the rock specimens subjected to TS can produce different microscopic fracture morphologies. SEM imaging is used to analyze the microscopic fracture of specimens after dynamic loading. In this way, changes in the internal microstructure can be described, thus elucidating the variations in physical and mechanical properties of the sandstone specimens. At a heating temperature of 250 °C, although some pores exist in the stove-cooled specimen, the mineral particles are tightly cemented and no apparent cracks were observed (Figure 13a). However, some significant cracks and transgranular fractures are observed if the specimen experiences fast cooling (Figure 13b,c). Microscopic observation also indicates that, compared with the fracture morphology of the rock under high-temperature treatment in Figure 13d–l, the fracture of the rock under low-temperature treatment is smooth, and mainly transgranular fractures with fewer local intergranular fractures as shown in Figure 13a–c. The main reason for this phenomenon might be that the lower heating temperatures weaken the cementation of rock minerals, but still maintains the strong interlocking between the mineral particles, which makes the major fracture path go through instead of along the mineral particles, thus resulting in a smooth fracture surface. As seen in Figure 13d–f, intergranular fractures gradually increase with the increase in cooling rate. It is worth noting that when the heating temperature reaches 650 °C, the microscopic fracture surface appears more uneven, and a large number of pores and debris are observed. This observation is in accordance with the sudden change in the physicomechanical properties of sandstone at 650 °C. When the sandstone is heated at 850 °C and cooled by the freezer, the microstructure of the sandstone becomes looser, containing more pores and debris. The main reason for this phenomenon is assumed to be that such a high temperature aggravates the damage of the internal structure of the rock, which severely reduces the particle–particle or particle–cement bonding ability, thus resulting in the frequent occurrence of intergranular fractures.

4. Discussion

4.1. Effect of Quartz Content

The thermal expansion of minerals is closely related to the increase in rock volume in the thermal loading process. Specifically, the thermal expansion coefficient of quartz is significantly greater than that of other minerals [46,47,48]. In this study, quartz content accounts for the largest proportion of the mineral composition of the sandstone specimens. Therefore, the content of quartz greatly affects the action of TS in rocks. The volume of the rock before and after TS treatment is measured by the method recommended by ISRM [1]. The volume increase percentage is calculated by Equation (23):
V = V 2 V 1 V 1 × 100 %
where V denotes the volume increase percentage; V1 and V2 are the dry density of the specimen before and after TS treatment, respectively. Figure 14 illustrates that the volume increase percentage of the specimen presents an ascending trend with the increasing heating level. At two temperature levels of 250 and 450 °C, the volume of sandstone after air cooling slowly increased to 0.12% and 1.53%, while the volume of sandstone after freezer cooling increased by 0.29% and 1.44%, respectively. This may be due to the comparatively low expansion rate of the minerals, and the fact that a large number of new pores had not yet formed, which can also be corroborated from Figure 13a–f. A significant increase in the volume of sandstone was observed at the heating level of 650 °C. The volume of sandstone increased by 2.55% after air cooling and increased by 3.28% after freezer cooling. The main reason for this phenomenon might be that the thermal expansion of mineral particles occurred extensively. The difference in thermal expansion coefficient between quartz and surrounding minerals can cause higher local thermal stress at the boundary of the quartz, which leads to significant deformation discrepancy. At the same time, the α–β transition of quartz occurring at 573 °C can further promote the change of quartz geometry and cause additional damage, which explains why a large number of cracks and pores are observed in the sandstone at 650 °C in Figure 13h,i. When the heating temperature rises to 850 °C, the volume increase rate of sandstone after air cooling was up to 7.90%, while the volume increase rate of sandstone after freezer cooling was up to 7.85%. This indicates that at a higher heating level, the mineral thermal expansion of the specimen can further develop and the differences caused by the thermal expansion coefficients of various minerals cause more damage to the specimen. Thus, the volume of the specimen continues to increase. This is in accordance with the microscopic observations in Figure 13k,l.

4.2. Damage Mechanisms of Sandstone Induced by Thermal Shock

The damage mechanism of thermal shock to rock is affected by many factors, such as the initial structure of the rock itself, anisotropy, non-uniformity of thermal expansion of minerals, and temperature gradient [49]. In this study, the single TS condition discussed is a mechanism that mainly involves the application of thermal loading in a comparatively short period of time, where the cooling rate induced by rapid temperature change causes damage to the object. In the process of cooling, the surface of the rock undergoes a rapid temperature drop. Due to the rock’s poor conductivity of heat, the temperature of the inside of the rock specimen cannot change at the same rate as the surface. Therefore, a temperature gradient is formed, which causes uneven thermal stress distributions inside the rock specimen and forms certain thermal crack patterns corresponding to the temperature gradient. When different cooling methods are applied, a different cooling rate at the surface of the specimen is caused. Therefore, different patterns of temperature gradient are formed inside the specimen, and the number of thermal cracks also changes. This again affects the physical and mechanical properties of the rock specimen. For example, for specimens heated at the same high temperature, the cooling rate provided by freezer cooling is greater than that provided by air cooling. Therefore, a steeper temperature gradient can be formed by freezer cooling, and thus the thermal stress between mineral particles caused by the freezer cooling is significantly greater than that caused by air cooling. The joint action of the higher thermal stress between mineral particles and that originating from temperature-gradient resulted in more remarkable damage in the freezer cooling case than in the air cooling case.
A series of effects of TS on sandstone can be observed in the range of nanometers to meters. The two main fracture modes (orthogonal and polygonal fractures) are believed to be caused by TS from the macro-perspective as shown in Figure 15a [14]. In this study, the micro-perspective is used to discuss the microscopic fracture morphology of sandstone. The observation shows that the above two typical fracture modes can be also observed in the microscopic fracture morphology of sandstone after TS. It is reasonable to assume that the macroscopic orthogonal and polygonal fractures caused by TS evolve from the microscopic fractures of the same pattern. In addition, a kind of transcrystalline step-like fracture morphology can always be observed as shown in Figure 16. Whether this transcrystalline stepped pattern is the characteristic of the typical fracture morphology of sandstone after TS treatment remains to be verified.

5. Conclusions

In this study, a modified SHPB system is adopted to carry out the coupled dynamic and static loading experiments on sandstone after TS with different cooling rates. Based on the scope of this study, the following conclusions can be drawn:
  • As the heating level increases, the dry density and P-wave velocity of the heated sandstone decrease, while the porosity increases. In particular, a sharp change in the physical properties of sandstone can be observed at 650 °C. At any heating level, the dry density and P-wave velocity of the freezer-cooled sandstone specimens are lower than that of the air-cooled sandstone specimens, whereas the porosity has the opposite trend;
  • The dynamic combined strength of sandstone decreases as the heating level rises. For the same heating levels (450–850 °C), the freezer-cooled specimen has lower dynamic combined strength than the air-cooled specimen. In addition, a sharp drop in the dynamic combined strength occurs at the heat temperature of 650 °C, which is believed to be caused by the α-β transition of quartz at 573 °C;
  • The failure mode of sandstone changes with the increase in temperature. In addition, higher cooling rates also have a significant impact on the failure mode of sandstone for each heating level. In addition, mainly transgranular fractures occur at lower heating levels such as 250 °C, whereas large amounts of intergranular fractures occur at higher temperatures (450–850 °C);
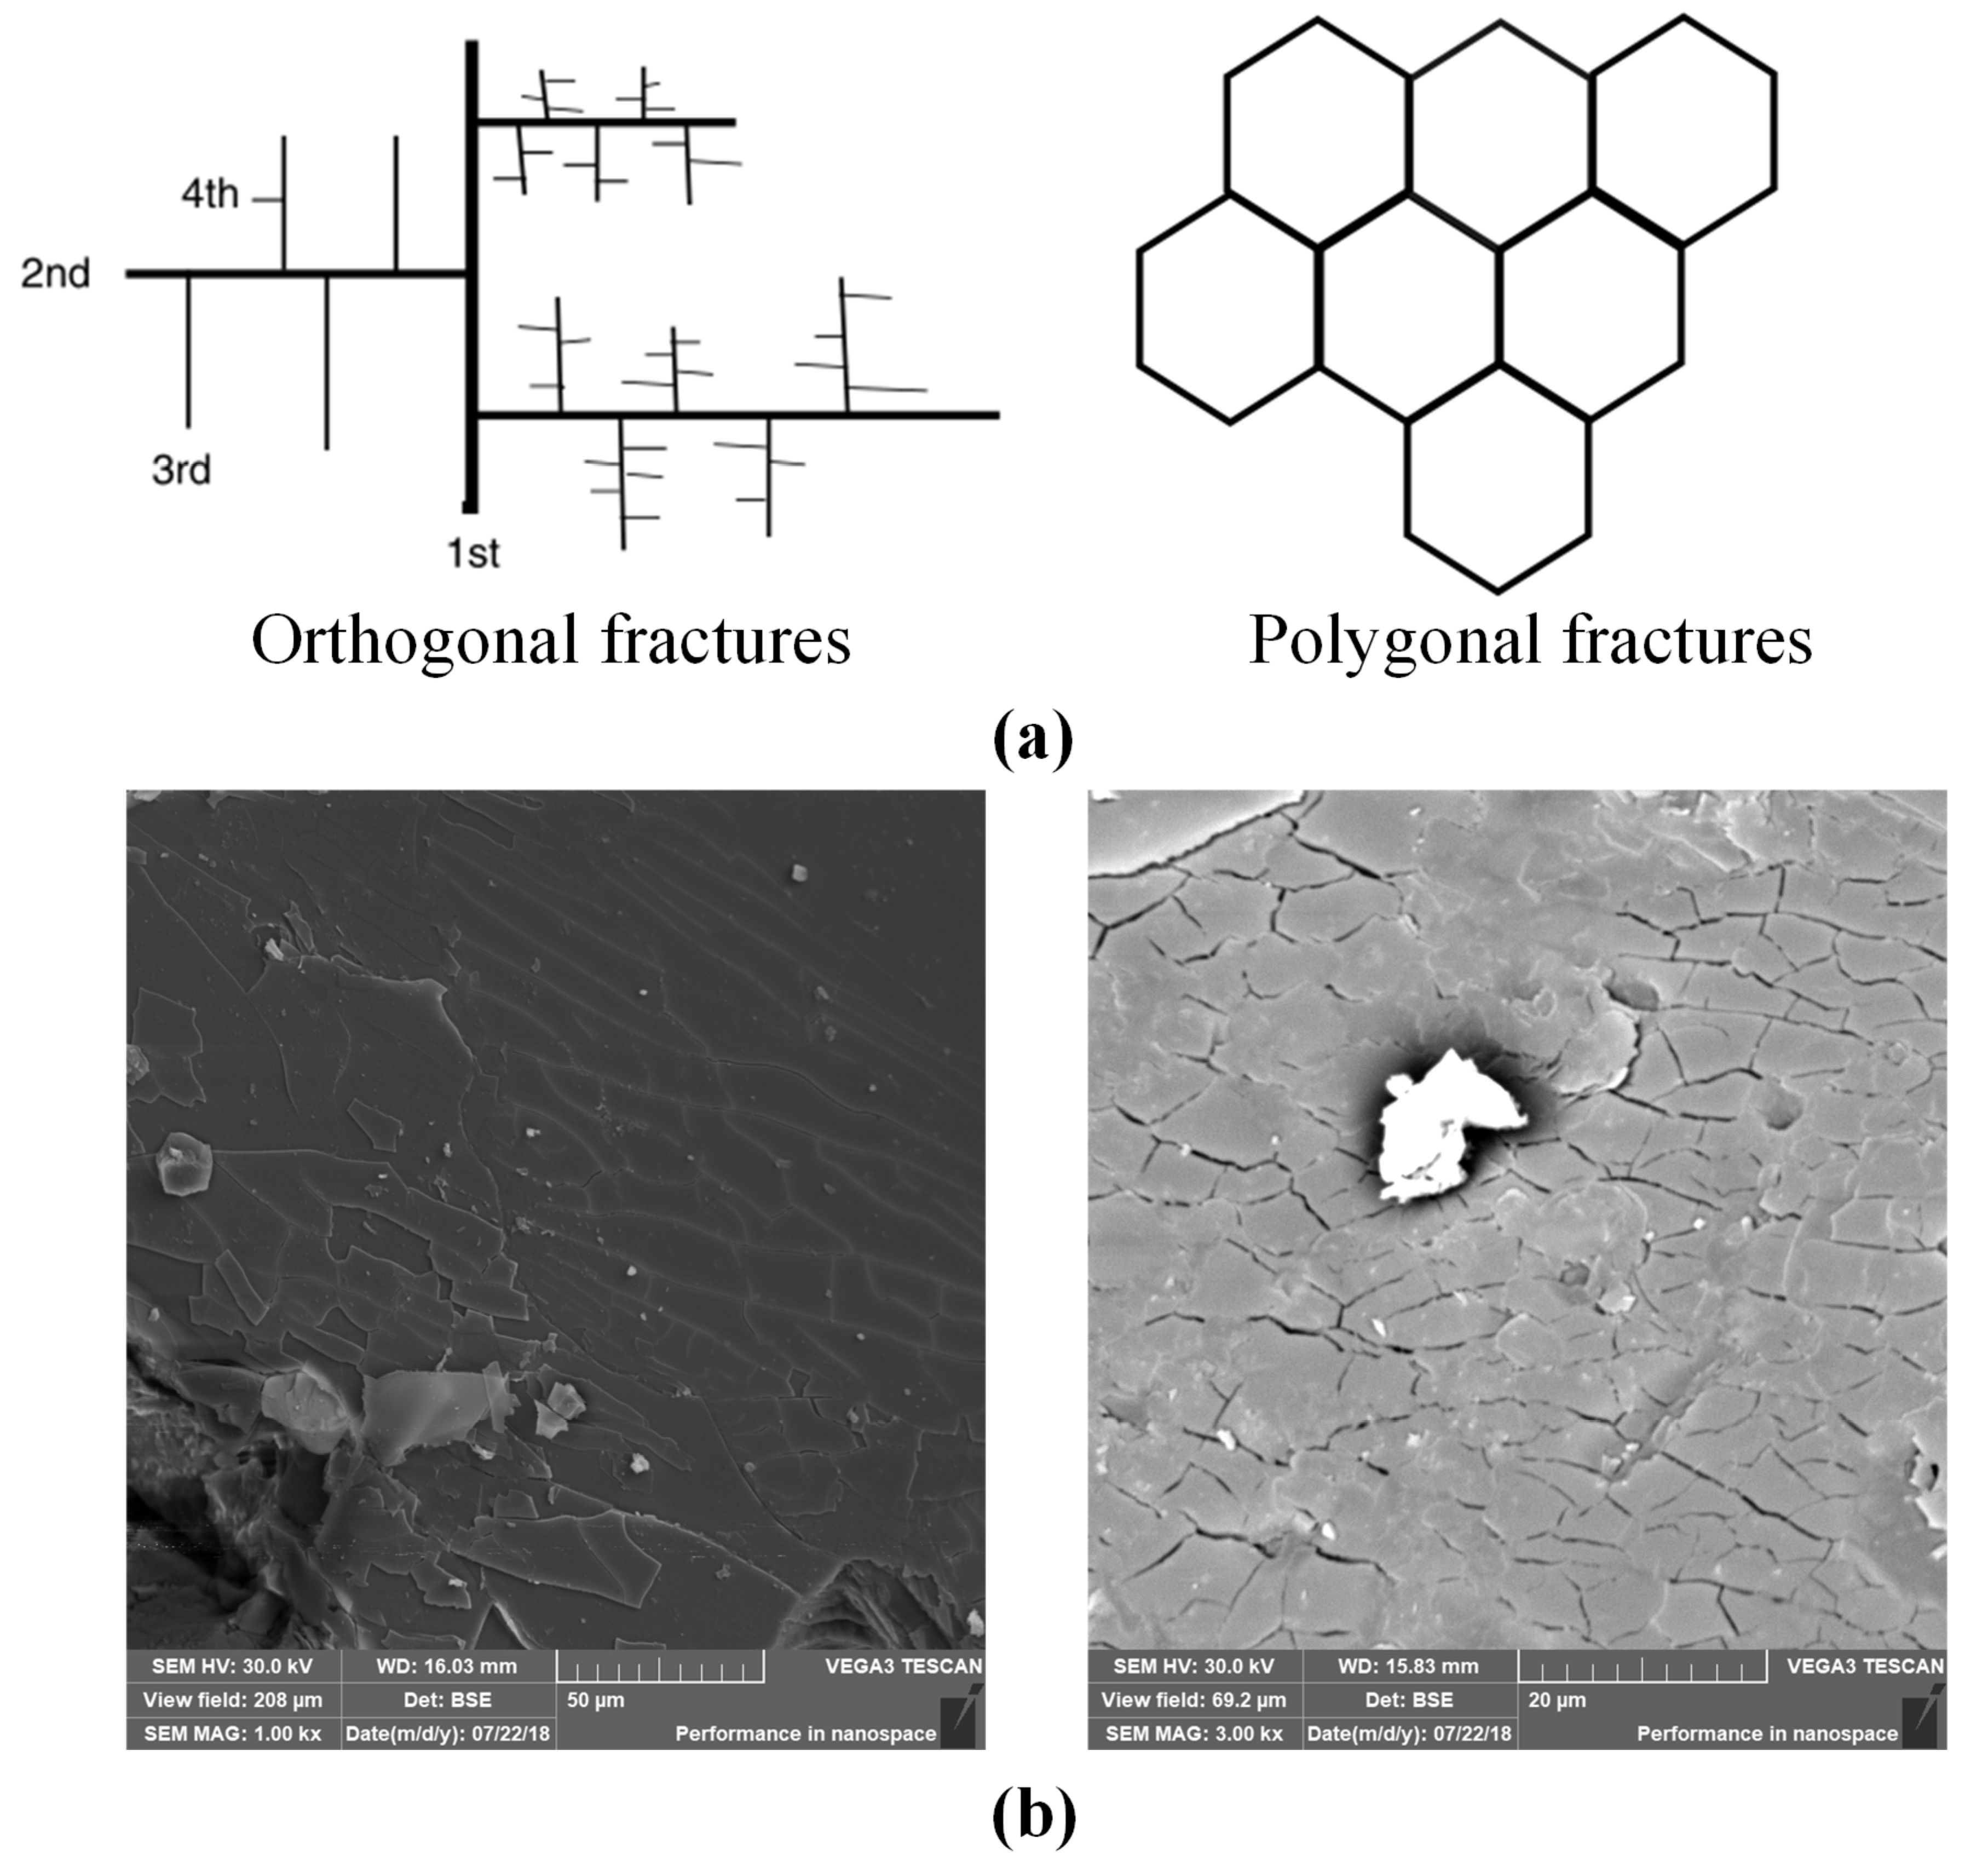
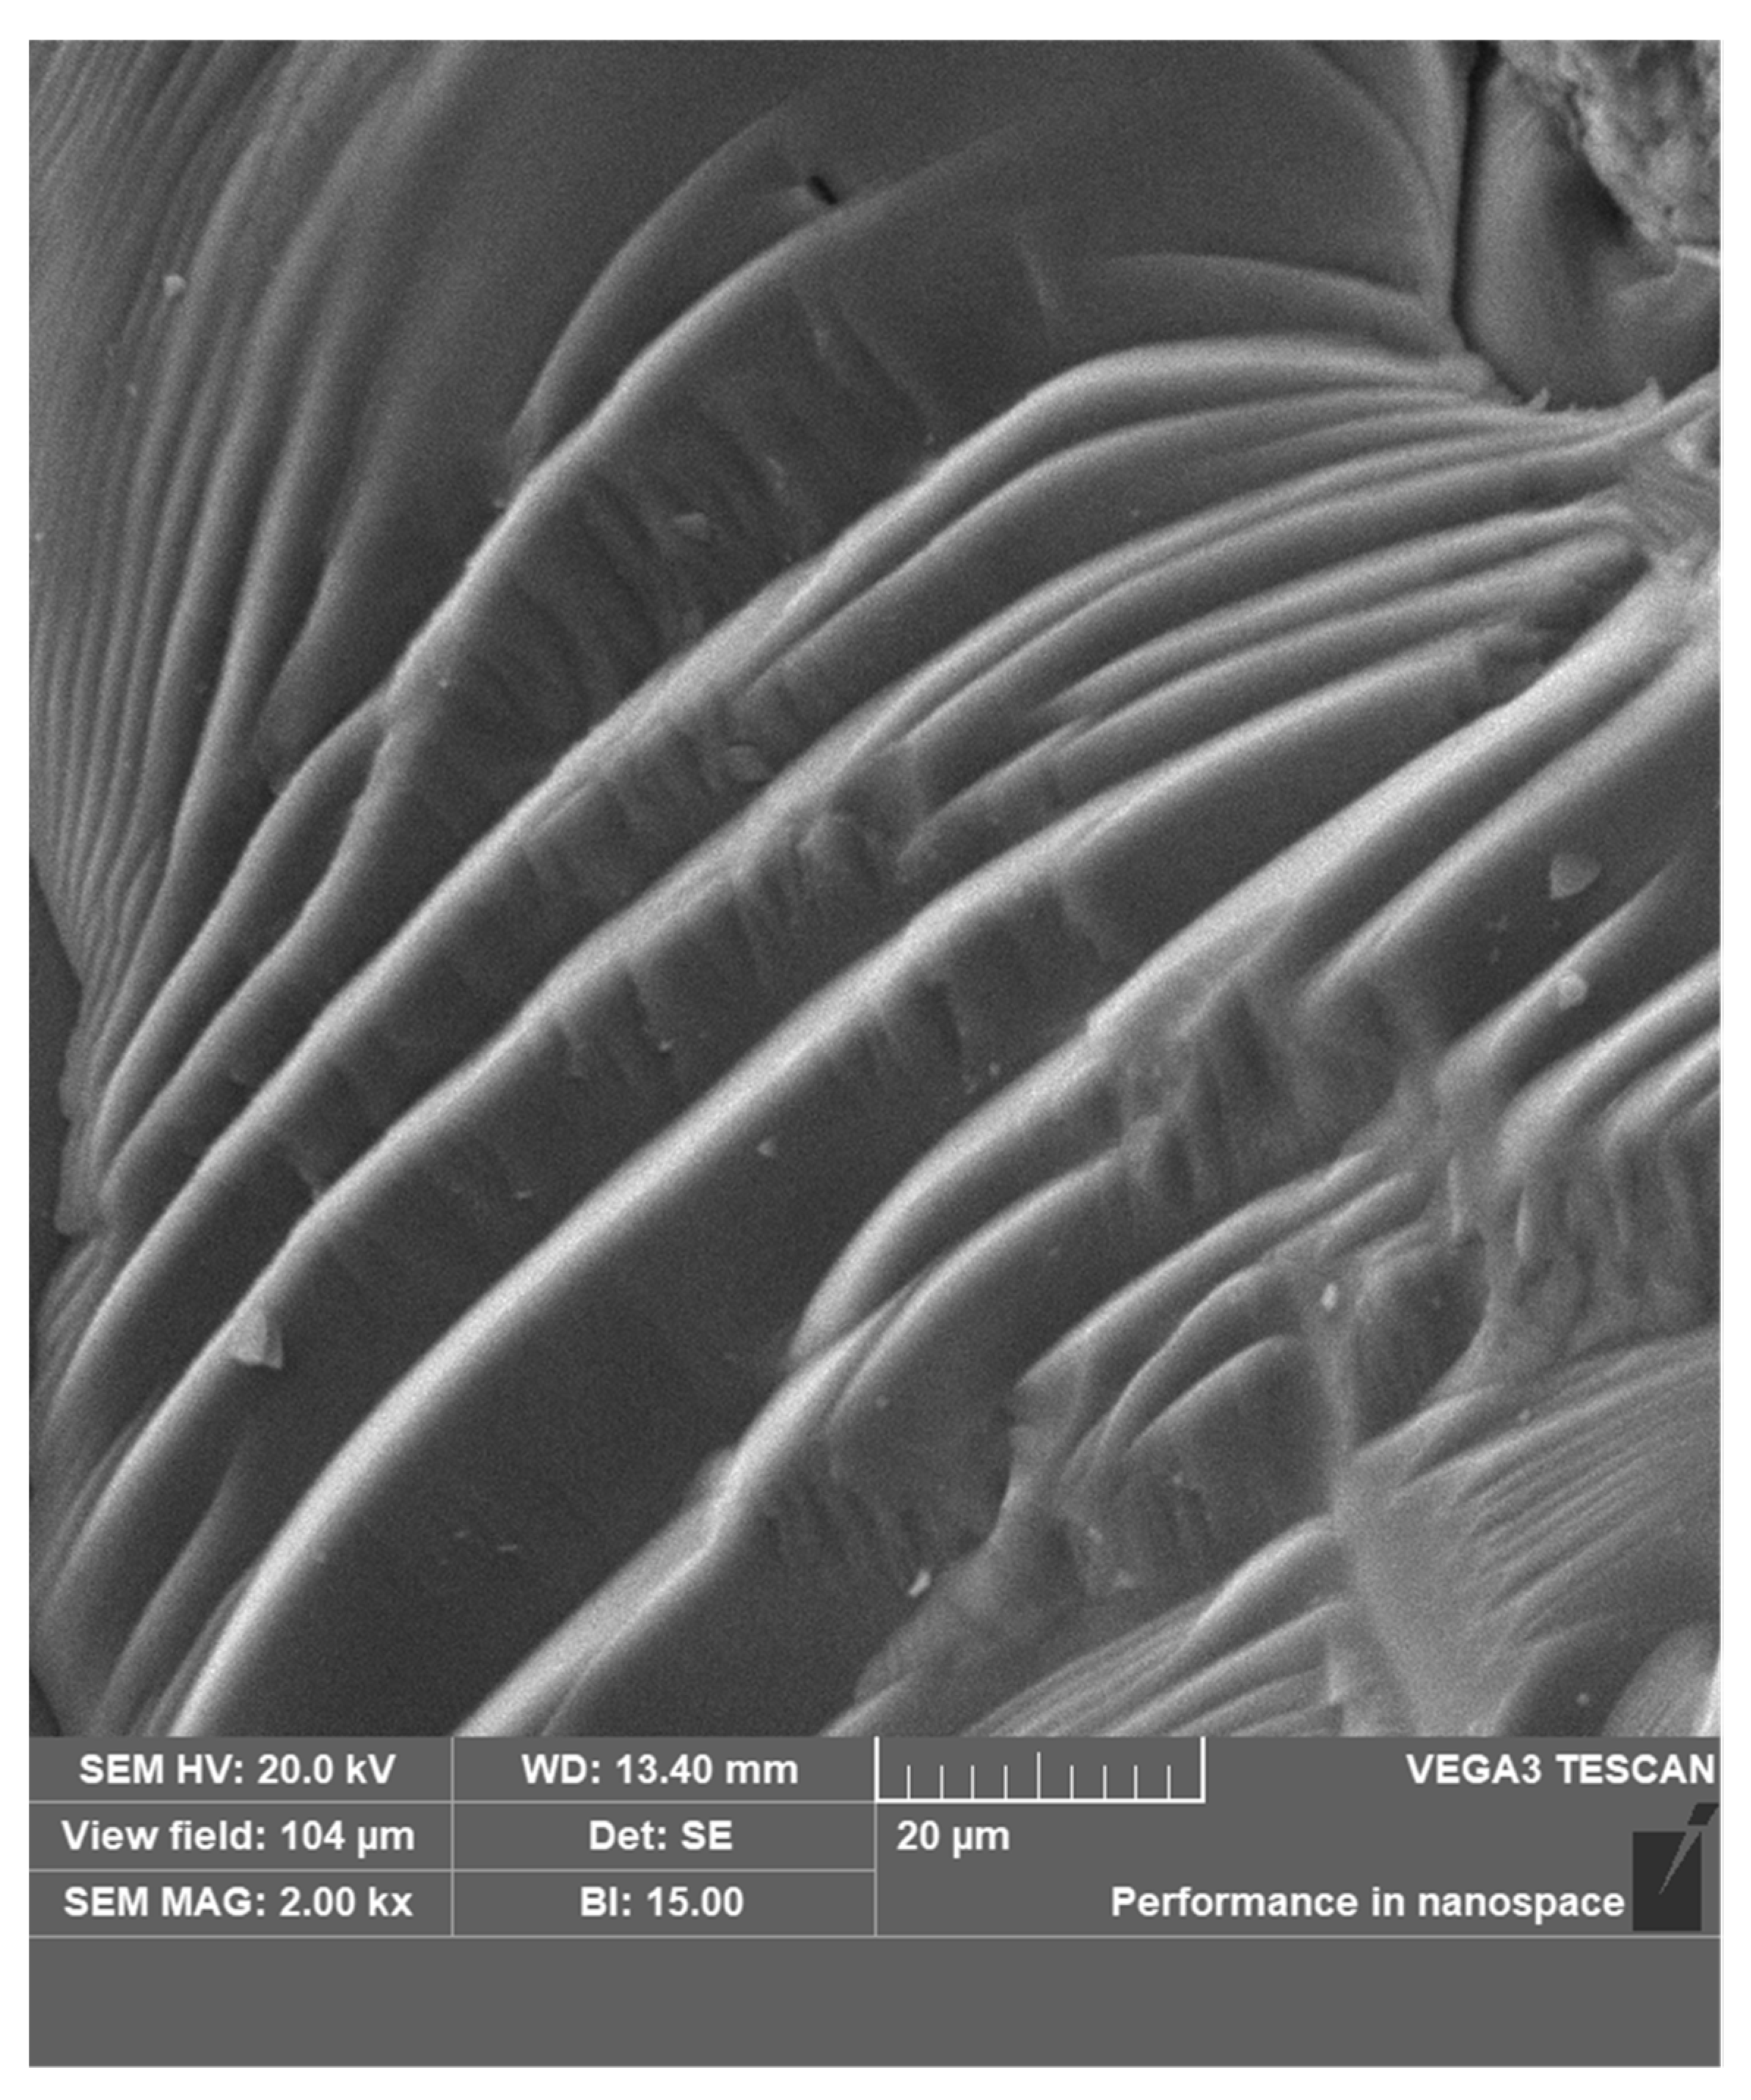
  • The TS condition can occur inside the rock during the air cooling and freezer cooling process. It is understood that the mechanism of TS is affected by many factors. In this work, the mechanism of TS mainly takes into account the combined effect of the non-uniformity of mineral thermal expansion and temperature gradient, both of which promote the development of rock cracks and pores and cause a change in the microstructure. In particular, two typical fracture patterns (orthogonal and polygonal fractures) reflecting the action of TS are observed through SEM, and a kind of transcrystalline step-like fracture morphology is also observed.

Author Contributions

Conceptualization, X.L. (Xiang Li); Methodology, X.L. (Xiang Li); Formal analysis, X.L. (Xiang Li) and S.H.; Investigation, S.H.; Data curation, S.H.; Writing—Original draft preparation, X.L. (Xiang Li) and S.H.; Writing—Review and editing, X.L. (Xiang Li) and S.H.; Visualization, W.D.; Supervision, K.P., W.D. and X.F.; Project administration, X.L. (Xibing Li); Funding acquisition, X.L. (Xibing Li), T.Y. and L.H. All authors have read and agreed to the published version of the manuscript.

Funding

This work was supported by the National Nature Science Foundation of China (grant numbers 41972283, 51974043, and 51978677), the Fundamental Research Funds for the Central Universities, Sun Yat-sen University (grant number 2021qntd15), and the Science and Technology Planning Project in the Field of Social Development in Zhuhai City (grant number ZH22036205200004PWC).

Data Availability Statement

The source data can be obtained in the article.

Conflicts of Interest

We declare that we do not have any commercial or associative interest that represents a conflict of interest in connection with the work submitted.

References

  1. Yin, T.; Bai, L.; Li, X.; Li, X.; Zhang, S. Effect of thermal treatment on the mode I fracture toughness of granite under dynamic and static coupling load. Eng. Fract. Mech. 2018, 199, 143–158. [Google Scholar] [CrossRef]
  2. Ding, Q.-L.; Ju, F.; Mao, X.-B.; Ma, D.; Yu, B.-Y.; Song, S. Experimental Investigation of the Mechanical Behavior in Unloading Conditions of Sandstone After High-Temperature Treatment. Rock Mech. Rock Eng. 2016, 49, 2641–2653. [Google Scholar] [CrossRef]
  3. Jin, P.; Hu, Y.; Shao, J.; Liu, Z.; Feng, G.; Song, S. Influence of Temperature on the Structure of Pore–Fracture of Sandstone. Rock Mech. Rock Eng. 2020, 53, 1–12. [Google Scholar] [CrossRef]
  4. Shang, J.; Jayasinghe, B.; Xiao, F.; Duan, K.; Nie, W.; Zhao, Z. Three-dimensional DEM investigation of the fracture behaviour of thermally degraded rocks with consideration of material anisotropy. Theor. Appl. Fract. Mech. 2019, 104, 104. [Google Scholar] [CrossRef]
  5. Peng, K.; Shi, S.; Zou, Q.; Wen, Z.; Wang, Y.; Jiang, Z.; Zheng, C. Quantitative Characteristics of Energy Evolution of Gas-Bearing Coal Under Cyclic Loading and its Action Mechanisms on Coal and Gas Outburst. Rock Mech. Rock Eng. 2021, 54, 3115–3133. [Google Scholar] [CrossRef]
  6. Miao, S.; Li, Y.; Tan, W.; Ren, F. Relation between the in-situ stress field and geological tectonics of a gold mine area in Jiaodong Peninsula, China. Int. J. Rock Mech. Min. Sci. 2012, 51, 76–80. [Google Scholar] [CrossRef]
  7. Chen, J.; Yin, L.M.; Song, R.; Li, L. The Thermal Damage Properties of Mudstone, Gypsum and Rock Salt from Yingcheng, Hubei, China. Minerals 2015, 5, 104–116. [Google Scholar] [CrossRef] [Green Version]
  8. Heap, M.J.; Kushnir, A.R.; Vasseur, J.; Wadsworth, F.B.; Harlé, P.; Baud, P.; Kennedy, B.M.; Troll, V.R.; Deegan, F.M. The thermal properties of porous andesite. J. Volcanol. Geotherm. Res. 2020, 398, 106901. [Google Scholar] [CrossRef]
  9. Xu, T.; Zhou, G.L.; Heap, M.; Zhu, W.C.; Chen, C.F.; Baud, P. The Influence of Temperature on Time-Dependent Deformation and Failure in Granite: A Mesoscale Modeling Approach. Rock Mech. Rock Eng. 2017, 50, 2345–2364. [Google Scholar] [CrossRef]
  10. Violay, M.; Heap, M.; Acosta, M.; Madonna, C. Porosity evolution at the brittle-ductile transition in the continental crust: Implications for deep hydro-geothermal circulation. Sci. Rep. 2017, 7, 1–10. [Google Scholar] [CrossRef]
  11. Pimienta, L.; Orellana, L.F.; Violay, M. Variations in Elastic and Electrical Properties of Crustal Rocks with Varying Degree of Microfracturation. J. Geophys. Res. Solid Earth 2019, 124, 6376–6396. [Google Scholar] [CrossRef]
  12. Riebe, C.S.; Kirchner, J.W.; Finkel, R.C. Erosional and climatic effects on long-term chemical weathering rates in granitic landscapes spanning diverse climate regimes. Earth Planet. Sci. Lett. 2004, 224, 547–562. [Google Scholar] [CrossRef]
  13. Langman, J.B.; Moore, M.L.; Ptacek, C.J.; Smith, L.; Sego, D.; Blowes, D.W. Diavik Waste Rock Project: Evolution of Mineral Weathering, Element Release, and Acid Generation and Neutralization during a Five-Year Humidity Cell Experiment. Minerals 2014, 4, 257–278. [Google Scholar] [CrossRef] [Green Version]
  14. Hall, K.; Thorn, C.E. Thermal fatigue and thermal shock in bedrock: An attempt to unravel the geomorphic processes and products. Geomorphology 2014, 206, 1–13. [Google Scholar] [CrossRef]
  15. Memari, A.; Azar, M.R.K. Thermo-mechanical shock fracture analysis by meshless method. Theor. Appl. Fract. Mech. 2019, 102, 171–192. [Google Scholar] [CrossRef]
  16. Zhang, Z.-P.; Shao, Y.-F.; Song, F. Characteristics of crack patterns controlling the retained strength of ceramics after thermal shock. Front. Mater. Sci. China 2010, 4, 251–254. [Google Scholar] [CrossRef]
  17. Du, K.; Tao, M.; Li, X.-B.; Zhou, J. Experimental Study of Slabbing and Rockburst Induced by True-Triaxial Unloading and Local Dynamic Disturbance. Rock Mech. Rock Eng. 2016, 49, 3437–3453. [Google Scholar] [CrossRef]
  18. Li, D.; Wang, T.; Cheng, T.-J.; Sun, X.-L. Static and dynamic tensile failure characteristics of rock based on splitting test of circular ring. Trans. Nonferrous Met. Soc. China 2016, 26, 1912–1918. [Google Scholar] [CrossRef]
  19. Niu, S.Y.; Chen, C.; Zhang, J.Z.; Zhang, F.X.; Wang, F.X.; Sun, A.Q. The Thermal and Dynamic Process of Core→Mantle→Crust and the Metallogenesis of Guojiadian Mantle Branch in Northwestern Jiaodong. Minerals 2019, 9, 249. [Google Scholar] [CrossRef] [Green Version]
  20. Gong, F.; Jia, H.; Zhang, Z.; Hu, J.; Luo, S. Energy Dissipation and Particle Size Distribution of Granite under Different Incident Energies in SHPB Compression Tests. Shock. Vib. 2020, 2020, 1–14. [Google Scholar] [CrossRef]
  21. Dong, Z.; Sun, Q.; Ranjith, P.G. Surface properties of grayish-yellow sandstone after thermal shock. Environ. Earth Sci. 2019, 78, 1–13. [Google Scholar] [CrossRef]
  22. Ghobadi, M.H.; Babazadeh, R. Experimental Studies on the Effects of Cyclic Freezing–Thawing, Salt Crystallization, and Thermal Shock on the Physical and Mechanical Characteristics of Selected Sandstones. Rock Mech. Rock Eng. 2015, 48, 1001–1016. [Google Scholar] [CrossRef]
  23. Wang, P.; Xu, J.; Liu, S.; Wang, H. Dynamic mechanical properties and deterioration of red-sandstone subjected to repeated thermal shocks. Eng. Geol. 2016, 212, 44–52. [Google Scholar] [CrossRef]
  24. Yu, P.; Pan, P.-Z.; Feng, G.-L.; Wu, Z.; Zhao, S. Physico-mechanical properties of granite after cyclic thermal shock. J. Rock Mech. Geotech. Eng. 2020, 12, 693–706. [Google Scholar] [CrossRef]
  25. Li, X.; Li, B.; Li, X.; Yin, T.; Wang, Y.; Dang, W. Thermal shock effects on the mechanical behavior of granite exposed to dynamic loading. Arch. Civ. Mech. Eng. 2020, 20, 1–11. [Google Scholar] [CrossRef]
  26. Huang, Y.-H.; Yang, S.-Q.; Bu, Y.-S. Effect of thermal shock on the strength and fracture behavior of pre-flawed granite specimens under uniaxial compression. Theor. Appl. Fract. Mech. 2020, 106, 102474. [Google Scholar] [CrossRef]
  27. Shen, Y.; Hou, X.; Yuan, J.; Xu, Z.; Hao, J.; Gu, L.; Liu, Z. Thermal deterioration of high-temperature granite after cooling shock: Multiple-identification and damage mechanism. Bull. Int. Assoc. Eng. Geol. 2020, 79, 5385–5398. [Google Scholar] [CrossRef]
  28. Wu, X.; Huang, Z.; Song, H.; Zhang, S.; Cheng, Z.; Li, R.; Wen, H.; Huang, P.; Dai, X. Variations of Physical and Mechanical Properties of Heated Granite After Rapid Cooling with Liquid Nitrogen. Rock Mech. Rock Eng. 2019, 52, 2123–2139. [Google Scholar] [CrossRef]
  29. Yavuz, H.; Altindag, R.; Sarac, S.; Ugur, I.; Sengun, N. Estimating the index properties of deteriorated carbonate rocks due to freeze–thaw and thermal shock weathering. Int. J. Rock Mech. Min. Sci. 2006, 43, 767–775. [Google Scholar] [CrossRef]
  30. Li, X.; Zhang, Z.Y.; Chen, W.; Yin, T.B. Mode I and Mode II Granite Fractures after Distinct Thermal Shock Treatments. J. Mater. Civ. Eng. 2019, 31. [Google Scholar] [CrossRef]
  31. Li, Q.; Yin, T.; Li, X.; Zhang, S. Effects of rapid cooling treatment on heated sandstone: A comparison between water and liquid nitrogen cooling. Bull. Int. Assoc. Eng. Geol. 2019, 79, 313–327. [Google Scholar] [CrossRef]
  32. Wang, P.; Xu, J.; Fang, X.; Wen, M.; Zheng, G.; Wang, P. Dynamic splitting tensile behaviors of red-sandstone subjected to repeated thermal shocks: Deterioration and micro-mechanism. Eng. Geol. 2017, 223, 1–10. [Google Scholar] [CrossRef]
  33. ISRM. Suggested Methods for Determining Water Content, Porosity Density, Absorption and Related Properties and Swelling and Slake-Durability Index Properties. Int. J. Rock Mech. Min. Sci. Geomech. Abstr. 1979, 2, 141–156. [Google Scholar]
  34. Zhang, Y.; Sun, Q.; Geng, J. Microstructural characterization of limestone exposed to heat with XRD, SEM and TG-DSC. Mater. Charact. 2017, 134, 285–295. [Google Scholar] [CrossRef]
  35. Zhang, Q.; Zhao, J. A Review of Dynamic Experimental Techniques and Mechanical Behaviour of Rock Materials. Rock Mech. Rock Eng. 2013, 47, 1411–1478. [Google Scholar] [CrossRef] [Green Version]
  36. Zhou, Z.; Li, X.; Liu, A.; Zou, Y. Stress uniformity of split Hopkinson pressure bar under half-sine wave loads. Int. J. Rock Mech. Min. Sci. 2011, 48, 697–701. [Google Scholar] [CrossRef]
  37. Li, X.; Lok, T.; Zhao, J.; Zhao, P. Oscillation elimination in the Hopkinson bar apparatus and resultant complete dynamic stress–strain curves for rocks. Int. J. Rock Mech. Min. Sci. 2000, 37, 1055–1060. [Google Scholar] [CrossRef]
  38. Shen, Y.-J.; Zhang, Y.; Gao, F.; Yang, G.-S.; Lai, X.-P. Influence of Temperature on the Microstructure Deterioration of Sandstone. Energies 2018, 11, 1753. [Google Scholar] [CrossRef] [Green Version]
  39. Li, X.; Zhou, Z.; Lok, T.-S.; Hong, L.; Yin, T. Innovative testing technique of rock subjected to coupled static and dynamic loads. Int. J. Rock Mech. Min. Sci. 2008, 45, 739–748. [Google Scholar] [CrossRef]
  40. Dai, F.; Huang, S.; Xia, K.; Tan, Z. Some Fundamental Issues in Dynamic Compression and Tension Tests of Rocks Using Split Hopkinson Pressure Bar. Rock Mech. Rock Eng. 2010, 43, 657–666. [Google Scholar] [CrossRef]
  41. Yagiz, S. P-wave velocity test for assessment of geotechnical properties of some rock materials. Bull. Mater. Sci. 2011, 34, 947–953. [Google Scholar] [CrossRef]
  42. Zhang, W.; Sun, Q.; Hao, S.; Geng, J.; Lv, C. Experimental study on the variation of physical and mechanical properties of rock after high temperature treatment. Appl. Therm. Eng. 2016, 98, 1297–1304. [Google Scholar] [CrossRef]
  43. Van der Molen, I. The shift of the α-β transition temperature of quartz associated with the thermal expansion of granite at high pressure. Tectonophysics 1981, 73, 323–342. [Google Scholar] [CrossRef]
  44. Antao, S.M. Quartz: Structural and thermodynamic analyses across the α-β transition with origin of negative thermal expansion (NTE) in β quartz and calcite. Acta Crystallogr. Sect. B 2016, 72, 249–262. [Google Scholar] [CrossRef] [PubMed]
  45. Ericksen, J.L. On the Theory of the α–β Phase Transition in Quartz. J. Elast. Phys. Sci. Solids. 2001, 63, 61–86. [Google Scholar]
  46. Parsons, W.H.; Johnson, W.H. Factors Affecting the Thermal Expansion of Concrete Aggregate Materials. Am. Concr. Inst. J. Proc. 1944, 40, 457–466. [Google Scholar]
  47. Wu, X.; Huang, Z.; Zhang, S.; Cheng, Z.; Li, R.; Song, H.; Wen, H.; Huang, P. Damage Analysis of High-Temperature Rocks Subjected to LN2 Thermal Shock. Rock Mech. Rock Eng. 2019, 52, 2585–2603. [Google Scholar] [CrossRef]
  48. Kranz, R.L. Microcracks in rocks: A review. Tectonophysics 1983, 100, 449–480. [Google Scholar] [CrossRef]
  49. Zhang, Y.; Zhao, G.-F.; Li, Q. Acoustic emission uncovers thermal damage evolution of rock. Int. J. Rock Mech. Min. Sci. 2020, 132, 104388. [Google Scholar] [CrossRef]
Figure 1. Sandstone specimen used in the test: (a) geometry of the specimen, (b) photomicrograph of the sandstone under cross-polarized light (Q = quartz, Kfs = potash feldspar, Pl = plagioclase, R = rock debris, Cal = calcite), (c) XRD spectrum of sandstone.
Minerals 11 00889 g001
Figure 2. (a) A box-type electrical stove, (b) temperature profiles of three cooling methods versus TS temperature.
Minerals 11 00889 g002
Figure 3. Coupled dynamic and static loading system based on the SHPB device.
Minerals 11 00889 g003
Figure 4. Stress balance diagram of specimens in the dynamic loading process.
Minerals 11 00889 g004
Figure 5. (a) Dry density of the specimens versus TS temperature (error bars represent standard deviation), (b) dry density reduction percentage of three cooling methods versus TS temperature.
Minerals 11 00889 g005
Figure 6. (a) P-wave velocity of the specimens versus TS temperature (error bars represent standard deviation), (b) P-wave velocity reduction percentage of three cooling methods versus TS temperature.
Minerals 11 00889 g006
Figure 7. (a) Porosity of the specimens versus TS temperature (error bars represent standard deviation), (b) porosity increase percentage of three cooling methods versus TS temperature.
Minerals 11 00889 g007
Figure 8. Dynamic stress–strain curve of the sandstone specimens: (a) stove-cooled; (b) air-cooled; (c) freezer-cooled.
Minerals 11 00889 g008
Figure 9. Dynamic combined strength of the specimens versus TS temperature.
Minerals 11 00889 g009
Figure 10. Failure processes of stove-cooled sandstone specimens after heating: (a) 250 °C; (b) 450 °C; (c) 650 °C; (d) 850 °C.
Minerals 11 00889 g010
Figure 11. Failure processes of air-cooled sandstone specimens after heating: (a) 250 °C; (b) 450 °C; (c) 650 °C; (d) 850 °C.
Minerals 11 00889 g011
Figure 12. Failure processes of freezer-cooled sandstone specimens after heating: (a) 250 °C; (b) 450 °C; (c) 650 °C; (d) 850 °C.
Minerals 11 00889 g012
Figure 13. SEM images of fracture morphology after TS: (a) T = 250 °C, stove-cooled; (b) T = 250 °C, air-cooled; (c) T = 250 °C, freezer-cooled; (d) T = 450 °C, stove-cooled; (e) T = 450 °C, air-cooled; (f) T = 450 °C, freezer-cooled; (g) T = 650 °C, stove-cooled; (h) T = 650 °C, air-cooled; (i) T = 650 °C, freezer-cooled; (j) T = 850 °C, stove-cooled; (k) T = 850 °C, air-cooled; (l) T = 850 °C, freezer-cooled.
Minerals 11 00889 g013
Figure 14. Volume increase percentage of three cooling methods versus TS temperature.
Minerals 11 00889 g014
Figure 15. Fracture surfaces of sandstone specimens after TS: (a) two main fracture modes (orthogonal and polygonal fractures) [14], (b) microscopic fracture morphology corresponding to two main macroscopic fracture modes.
Minerals 11 00889 g015
Figure 16. Transcrystalline step-like fracture pattern of sandstone.
Minerals 11 00889 g016
Table 1. The main parameters of the SHPB system.
Diameter
of Bars (mm)
Incident
Bar length (mm)
Absorbing
Bar Length (mm)
Transmission
Bar Length
(mm)
Elastic
Modulus of the
Bars
(GPa)
Poisson’s Ratio of the BarsP-Wave
Velocity of the Bars (m/s)
Density of the Bars (kg/m3)
50200050015002400.2854007800
Table 2. Experiments performed in this study.
Test PerformedThin Section Analysis and X-ray Diffraction Test
Specimen conditionsSandstone specimen before TS
Results obtainedMineral composition of the specimen
Test performedTS treatment
Heating level25 °C250 °C450 °C650 °C850 °C
Cooling methodStove coolingAir coolingFreezer cooling
Specimen conditionsSandstone specimens damaged due to TS treatments
Results obtainedCooling rates of different cooling methods
Test performedPhysical parameter test (before and after TS)
Specimen conditionsSandstone specimens before TS (not damaged), and specimens after TS treatments (damaged)
Results obtainedDry densityP-wave velocityPorosityVolume
Test performedCoupled dynamic and static loads mechanical test
Specimen conditionsDamaged sandstone specimens after TS treatments
Results obtainedDynamic combined strength
Test performedScanning electron microscope observation
Specimen conditionsSmall pieces of rock chips obtained from the fragments of the sandstone specimens after mechanical tests
Results obtainedMicroscopic fracture, crack, and pore of specimen
Table 3. Averaged dry density (g/cm3) of sandstone specimens after TS.
Parameter Temperature (°C)
250450650850
Stove-cooled
ρ 2.4412.4102.3192.241
σ ρ 0.0140.0020.0040.024
Air-cooled
ρ 2.4382.4002.3082.217
σ ρ 0.0060.0030.0040.017
Freezer-cooled
ρ 2.4302.3892.2942.206
σ ρ 0.0210.0060.0130.010
Note: σ = standard deviation.
Table 4. Averaged P-wave velocity (km/s) of sandstone specimens after TS.
Parameter Temperature (°C)
250450650850
Stove-cooled
V P 2.8082.5221.7561.124
σ V 0.0860.1070.0170.042
Air-cooled
V P 2.5002.3581.4871.107
σ V 0.2740.2790.2300.080
Freezer-cooled
V P 2.3732.1341.2921.088
σ V 0.2870.1870.2250.115
Table 5. Averaged porosity (%) of sandstone specimens after TS.
Parameter Temperature (°C)
250450650850
Stove-cooled
P 5.576.249.0310.29
σ P 0.190.100.00760.52
Air-cooled
P 5.596.399.4810.91
σ P 0.130.00790.301.53
Freezer-cooled
P 5.666.5410.0811.16
σ P 0.110.240.920.71
Table 6. Averaged dynamic combined strength (MPa) of sandstone specimens after TS.
Parameter Temperature (°C)
25250450650850
Untreated
PUCS167.6
Stove-cooled
PUCS 158.1144.889.573.8
Air-cooled
PUCS 148.5132.086.470.3
Freezer-cooled
PUCS 161.3131.672.368.2
Publisher’s Note: MDPI stays neutral with regard to jurisdictional claims in published maps and institutional affiliations.

