Article

Study of Pigments from the Colonial Convent of Actopan, Hidalgo, Mexico

by
Jesús Benjamín Ortega-Lazcano
1,
Demetrio Mendoza-Anaya
2,
Eleazar Salinas-Rodríguez
1,
Juan Hernández-Ávila
1,
Otilio Arturo Acevedo-Sandoval
3 and
Ventura Rodríguez-Lugo
1,*
1
Área Académica de Ciencias de la Tierra y Materiales, Instituto de Ciencias Básicas e Ingeniería, Universidad Autónoma del Estado de Hidalgo, Pachuca 42184, Mexico
2
Instituto Nacional de Investigaciones Nucleares, Ocoyoacac 52750, Mexico
3
Área Académica de Química, Instituto de Ciencias Básicas e Ingeniería, Universidad Autónoma del Estado de Hidalgo, Pachuca 42184, Mexico
*
Author to whom correspondence should be addressed.
Minerals 2021, 11(8), 852; https://doi.org/10.3390/min11080852
Submission received: 30 June 2021 / Revised: 27 July 2021 / Accepted: 3 August 2021 / Published: 7 August 2021
(This article belongs to the Section Clays and Engineered Mineral Materials)

Abstract

:
In this work, scanning electron microscopy (SEM), X-ray diffraction (XRD), and infrared spectroscopy (FTIR) techniques were used to study blue, red, and ochre pigments from wall paintings of the 16th century colonial convent of San Nicolás de Tolentino in Actopan, Hidalgo, Mexico. In the blue pigments, nanometric fibers with a chemical composition of mostly O, Si, Al, and Mg were identified. XRD and FTIR analysis indicated the presence of palygorskite clay, which suggests that these analyzed blue pigments are similar to Mayan blue. In the red pigment, structures with different morphologies (spines and flake shapes, for instance), with a composition of C, O, Al, Si, S, Ca, Na, Mg, and K and a higher concentration of Fe and Pb, were observed. Complementary analysis showed that the red color originates from hematite and lead. Finally, the ochre pigment showed a significant presence of O and Fe, which was associated with the goethite mineral, while calcite was a crystalline phase identified in all analyzed pigments; these show that these pigments are characteristic of the known Mexican Colonial color palette.

Graphical Abstract

1. Introduction

From prehistoric times, people have sought to represent and transmit beliefs, culture, religion, and what happened in the environment, preserving what is beneficial and essential for survival and well-being [1,2]. In this respect, mural painting has played an important role in the history of Mexico because through it, we can learn many facts regarding pre-Hispanic life, the development of the Spanish conquest and colonization, and the independence and the modern life of Mexico. In particular, mural paintings made in religious convents immediately after the Spanish defeated native warriors in Tenochtitlan Mexico contributed in an important way to the consummation of the conquest of Mesoamerica and the conformation of the New Spain, and, at the same time and in a subtle manner, a new religion (Christianity) was imposed with the decoration of religious images on the walls and other available areas in the convents [3]. The friars intended to save all those having different customs; their main interest was to show the Christian God and give them salvation for their souls [4]. Painting was used as a means of evangelizing because through the pictures, it was easier to introduce the indigenous people into the History of Salvation and that Jesus Christ is the only way to Heaven and to eternal life; otherwise, committing a mortal sin without performing proper penance leads directly to “hell” [4,5,6].
The earlier mural paintings were made by the fresco technique by anonymous artists with careful monitoring by the monks. The raw materials used to elaborate these earlier paintings had a regional origin and were categorized as organic, inorganic, and synthetic [7]; the first were obtained from vegetables and animal sources, for example, indigo and cochineal. The second were mainly manufactured from minerals such as iron oxide, yellow-ochre silty clays, cinnabar, and green earth. Synthetic colorants were obtained by the combination of organic and inorganic colorant materials, for example, Mayan blue [8].
Nowadays, it is possible to appreciate the historical and artistic beauty of the mural paintings in colonial convents, which are mainly located in central Mexico. An example is the Augustinian ex-monastery of San Nicolás Tolentino in Actopan in the State of Hidalgo (Figure 1) and at its open chapel, which is the largest open chapel in Mexico. The Augustinian Order founded this convent in 1546; the building is attributed to Fray Andrés de Mata. Its cover is in a plateresque style, and its cloister combines Gothic and New Spain styles. From an architectural and pictorial point of view, the former convent of San Nicolás de Tolentino constitutes one of the greatest examples of New Spain art of the 16th century, as seen in Figure 1, for which it was declared an Historic and Artistic Monument of the Nation, by means of the Decree of February 2, 1933, issued by the Government of the Mexican Republic [9].
Wall painting is a first-hand source of knowledge about religious thought in New Spain as the images have been used in different instances, such as for pedagogical means, as well as cult objects [10]. Known as “grutescos” in Spanish, the adjective form “grotesque” is also used, which combines in an identifiable way the absurd, contradictory, unreal, illogical, and laughable [11]. The syncretization of Spanish art with Mexican art turned the grotesque into what was also called “tequitqui,” with a color palette different from the Spanish one, such as the use of smoke black, grana cochineal red, and indigo blue [12].
Unfortunately, the colonial paintings show a high level of deterioration, which is associated with environmental and human factors. For this reason, the analysis and characterization of historic vestiges making use of all available tools that provide any kind of information about these will be valued [13].
The purpose of characterizing the components of a painting is to answer questions such as the identification of an artist’s color palette or the identification of the hands of illustrators in ancient breviaries [14], determining authenticity [13,15] or provenance [15], identifying the alteration products [16,17], and deducing the mechanisms of deterioration [17] in order to determine the causes that produced it, and designing new treatment methods to control the action of deterioration agents [1,14]. Other reasons are to obtain historical information on the relationships between populations [14,18,19,20]; information to understand the mineralogical background of certain geological areas [20,21], trade routes [6,14,22], and the migration of cultural groups [23]; and to provide knowledge of technological evolution. Studies on the physicochemical and microstructural aspects and the unexpected deterioration of wall paintings caused by environmental impacts after their release have recently been carried out [24].
However, their deterioration has not always been so rapid; various pre-Hispanic wall paintings created later during the Viceroyalties in America have maintained their colors for hundreds of years. They were made with natural minerals and, rarely, synthetic pigments such as Mayan blue with exceptional resistance to diluted or concentrated acids and alkalis at boiling point, aqua regia, solvents, oxidizing and reducing agents, biocorrosion, and moderate heat [25].
There are few reports using analytical techniques to study colonial mural paintings in Mexico. Nevertheless, we can cite the work carried out by Ruvalcaba-Sil et al., who implemented a noninvasive methodology to study the pigments and other components of nine wall paintings in three former Augustinian colonial convents located in Epazoyucan, Actopan, and Ixmiquilpan in the state of Hidalgo, central Mexico, for which they used two techniques: X-ray fluorescence and Raman spectroscopy [26,27]; however, more work is needed. Therefore, the purpose of this work was to characterize and identify the pigments of wall paintings and to obtain the greatest amount of information that will serve as a basis for conservation, preservation, and restoration work.

2. Materials and Methods
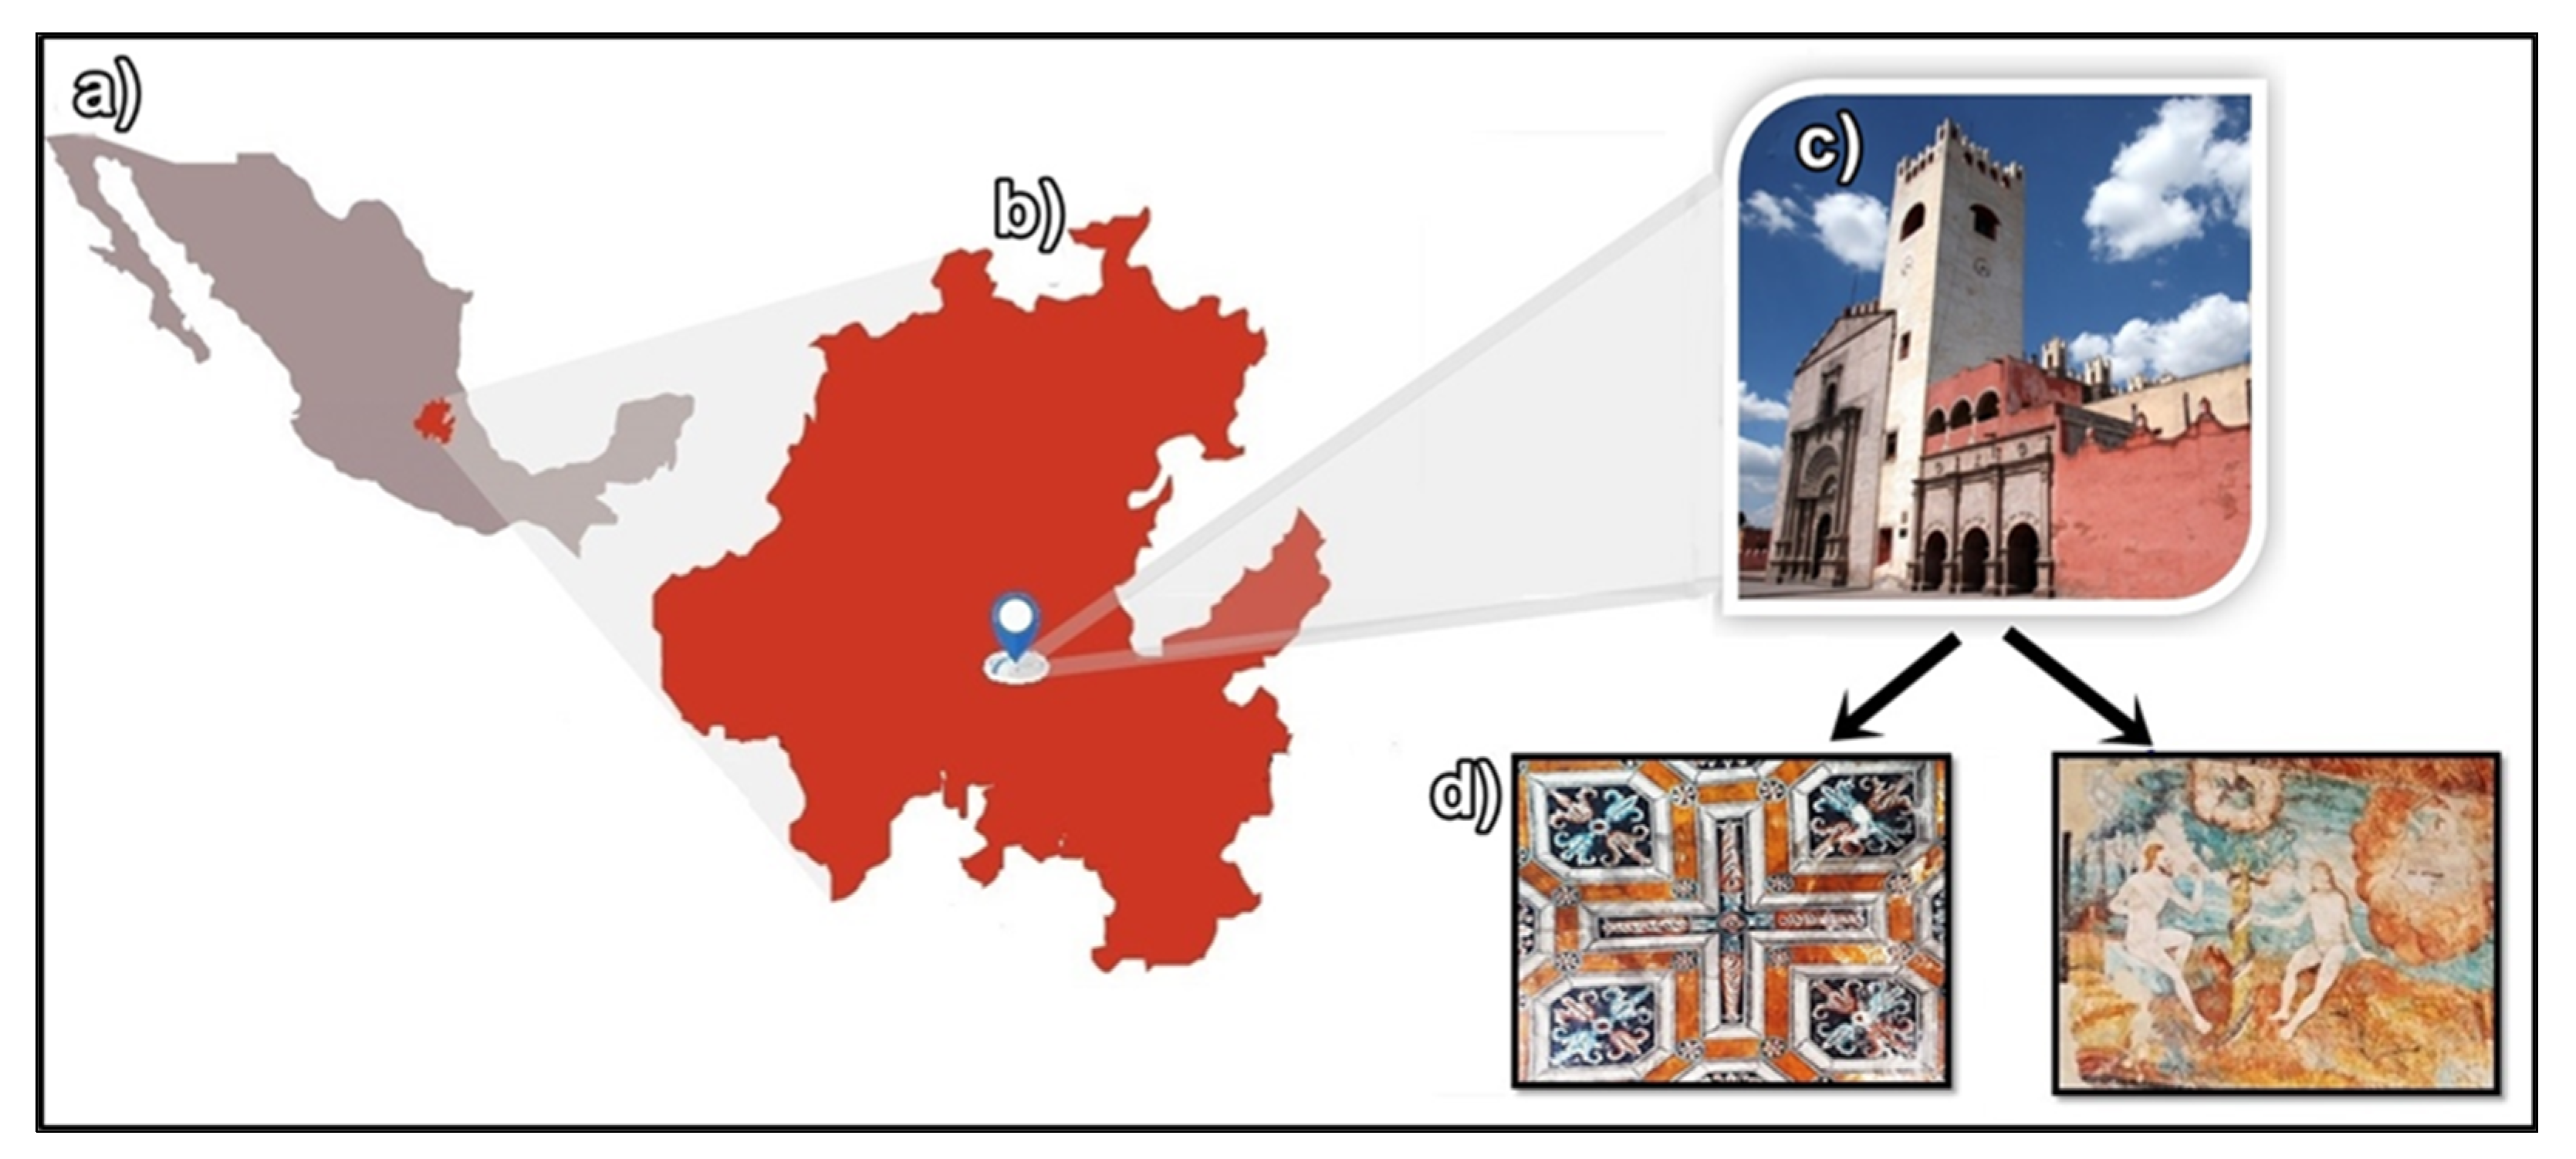
2.1. Sampling

In order to avoid damage to the paintings, the analyses were performed on samples carefully collected using tweezers and a scalpel to remove little fragments of the paintings to the substrate; three colors were included: blue, red, and ochre. The samples (less than 2 mm in thickness) were placed in vials, which were labeled as shown in Table 1. Figure 2a identifies the area where the two ochre pigment samples were taken, while Figure 2b indicates the location where the blue and red pigments were sampled

2.2. Characterization

Microstructural characterization was carried out with a low-vacuum scanning electron microscope (SEM), JEOL JSM-5900LV (Jeol Ltd., Tokyo, Japan), with a coupled Oxford probe for elemental microanalysis (EDS). Each sample was prepared by making a cut with a scalpel to take a fraction of the pigment with a thickness of 1 to 2 mm to be examined under an optical microscope. This fraction was placed on carbon tape previously fixed on an aluminum sample holder. Later, it was covered with a thin gold film, approximately 100 Å thick, by the sputtering method. Secondary electron images were obtained with an acceleration voltage of 20 kV and EDS spectra at 25 kV. EDS analyses were performed in representative regions for each sample.
For the determination of the crystalline phases that constitute each sample, a D8 Discover Bruker Diffractometer (Bruker, German technology) with a Cu tube (λ = 1.5406 Å) was used. XRD data are typically collected at one address, 2-theta. To prepare the sample, it was ground, and the pigment layer was peeled off with a scalpel and pulverized in an agate mortar; the powder was then placed in a glass sample holder. The scanning range was from 10° to 90° in 2-theta degrees at 35 kV and 25 mA, with a step size of 0.03° and time of step of 0.08 s.
To determine the physicochemical nature of the pigments used in wall paintings and the possible mordants or binders, infrared spectroscopy was performed using a Perkin Elmer Spectrum GX (Perkin Elmer Ltd., Boston, MA, USA) Fourier-transform infrared (FTIR) spectrophotometer in transmittance mode. For the preparation of the samples, 1 mg of the powder sample was taken and mixed with 99 mg of dry potassium bromide to form a semitransparent pellet by compression, which was placed in a special sample holder for solid pellets. The samples were run in the mid-infrared range, from 400 to 4000 cm−1 with 10 scans.

3. Results

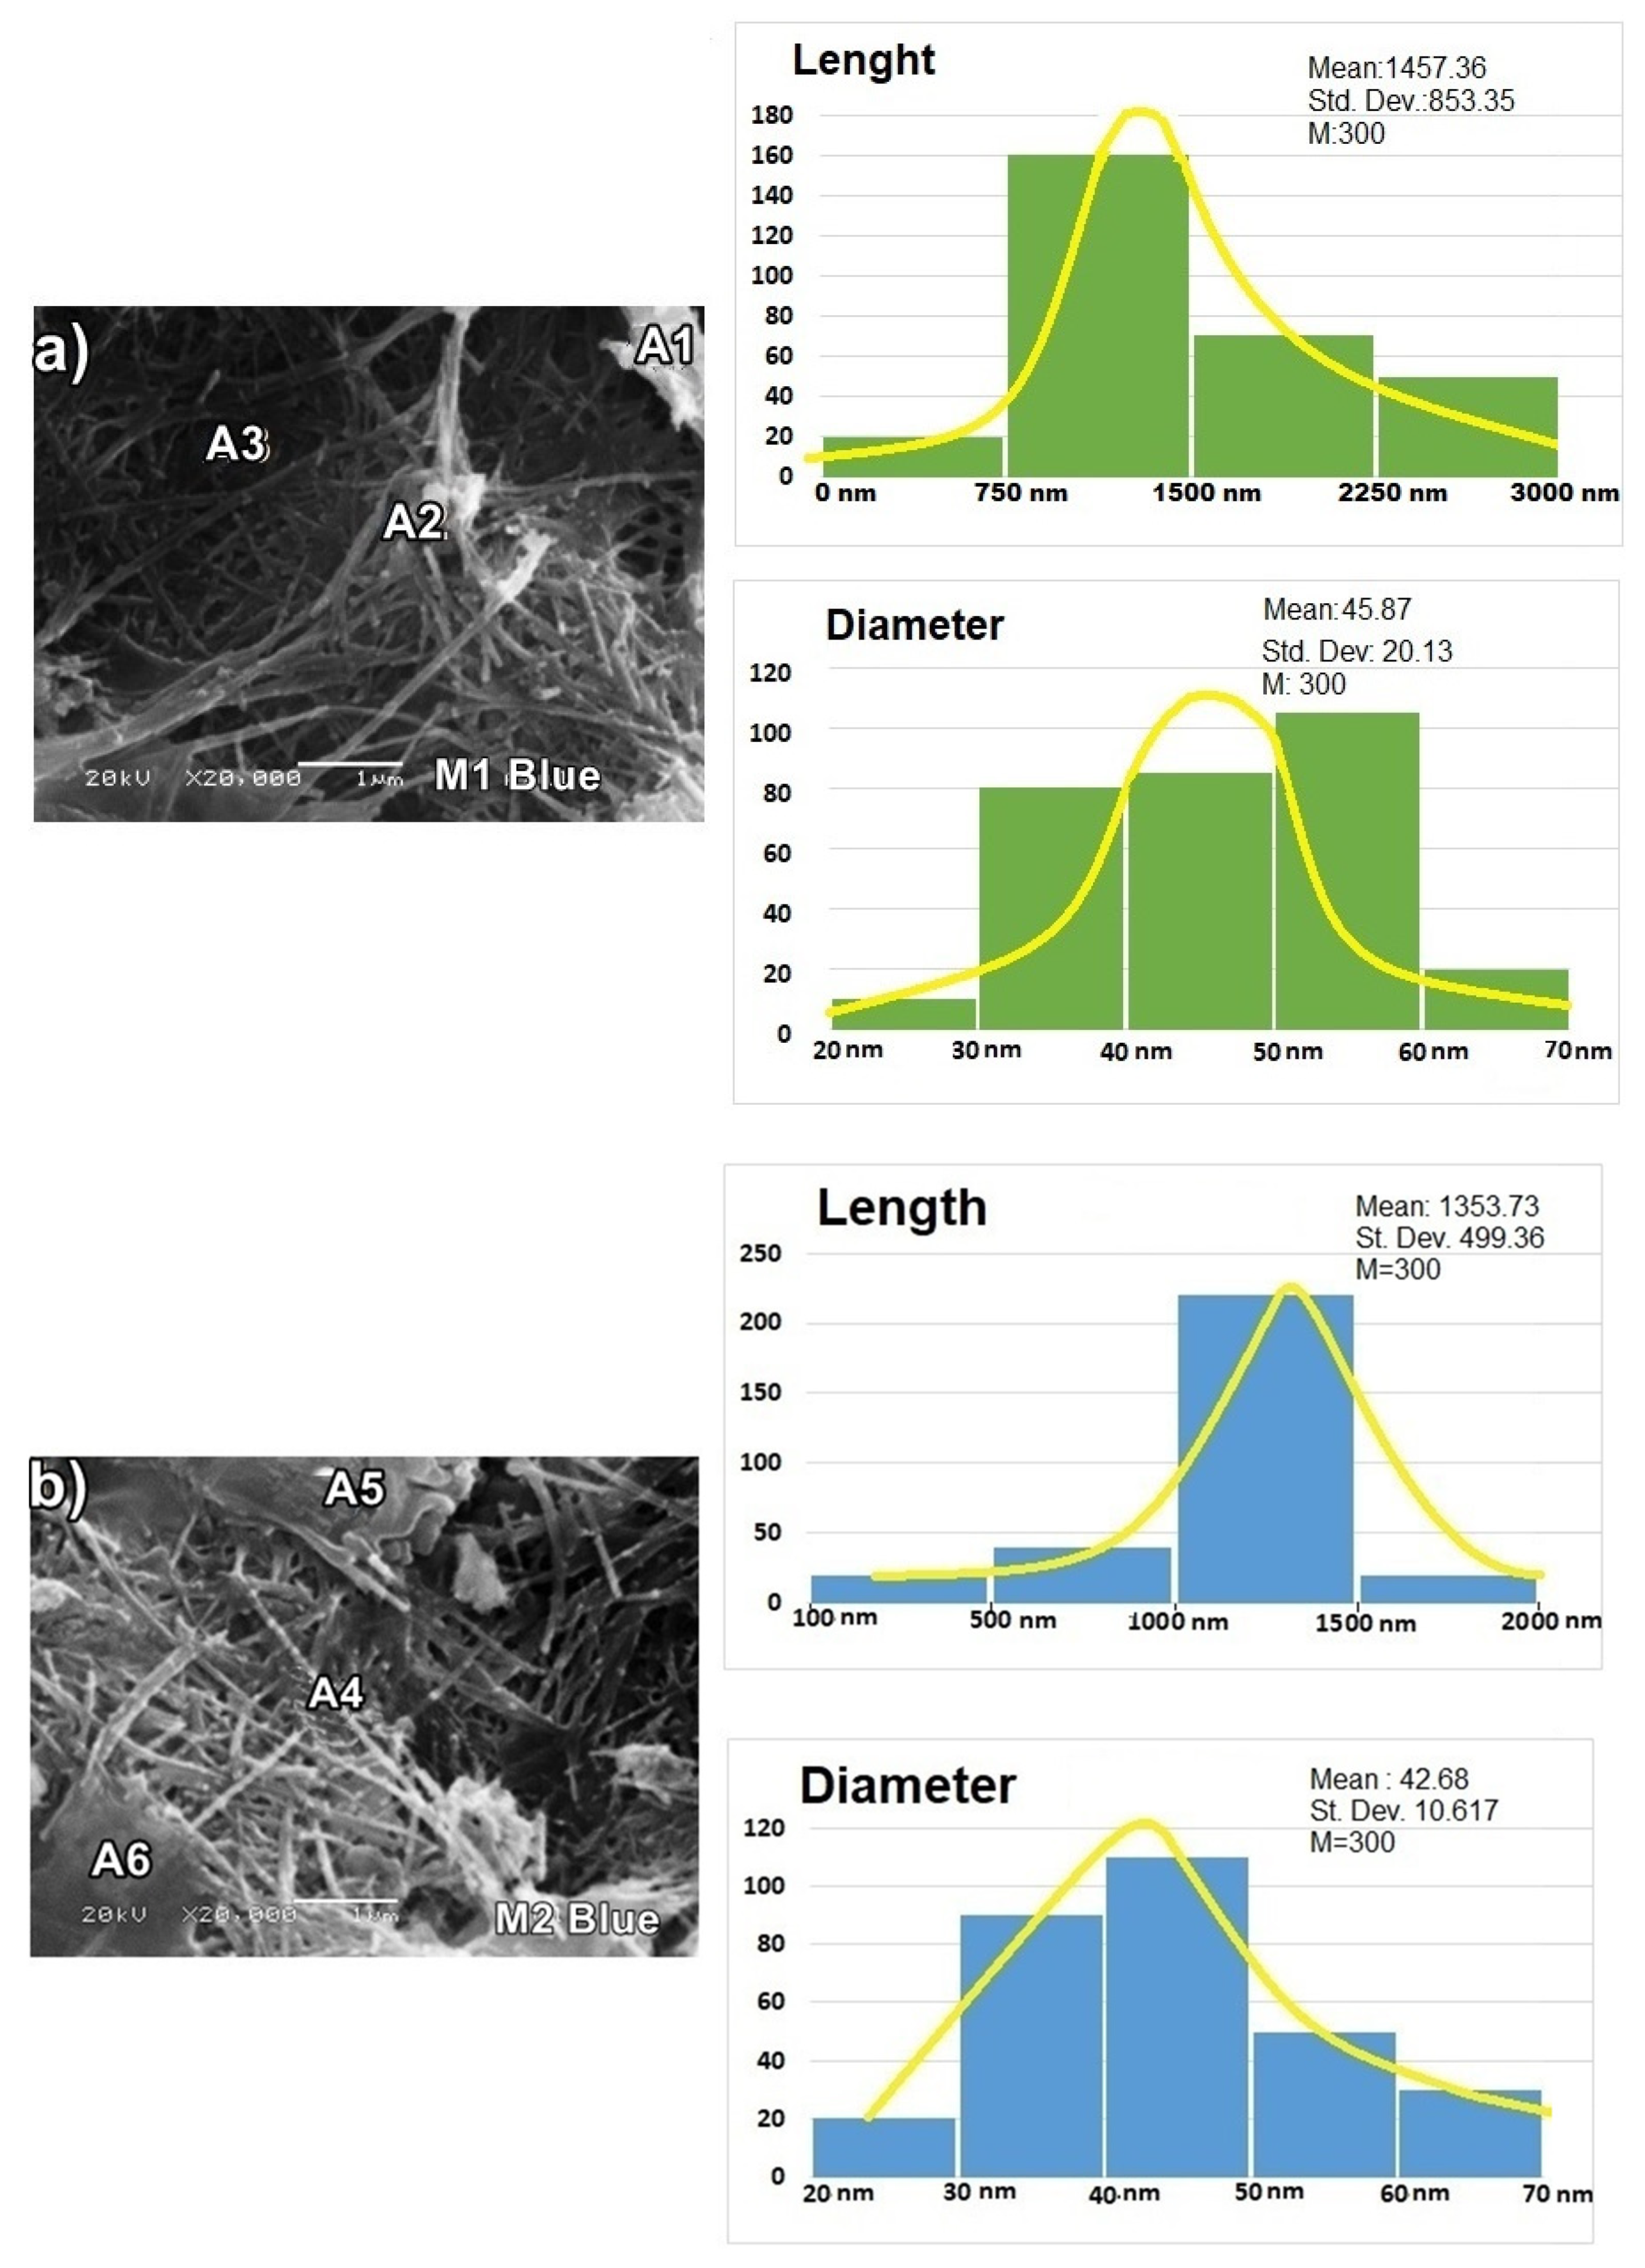
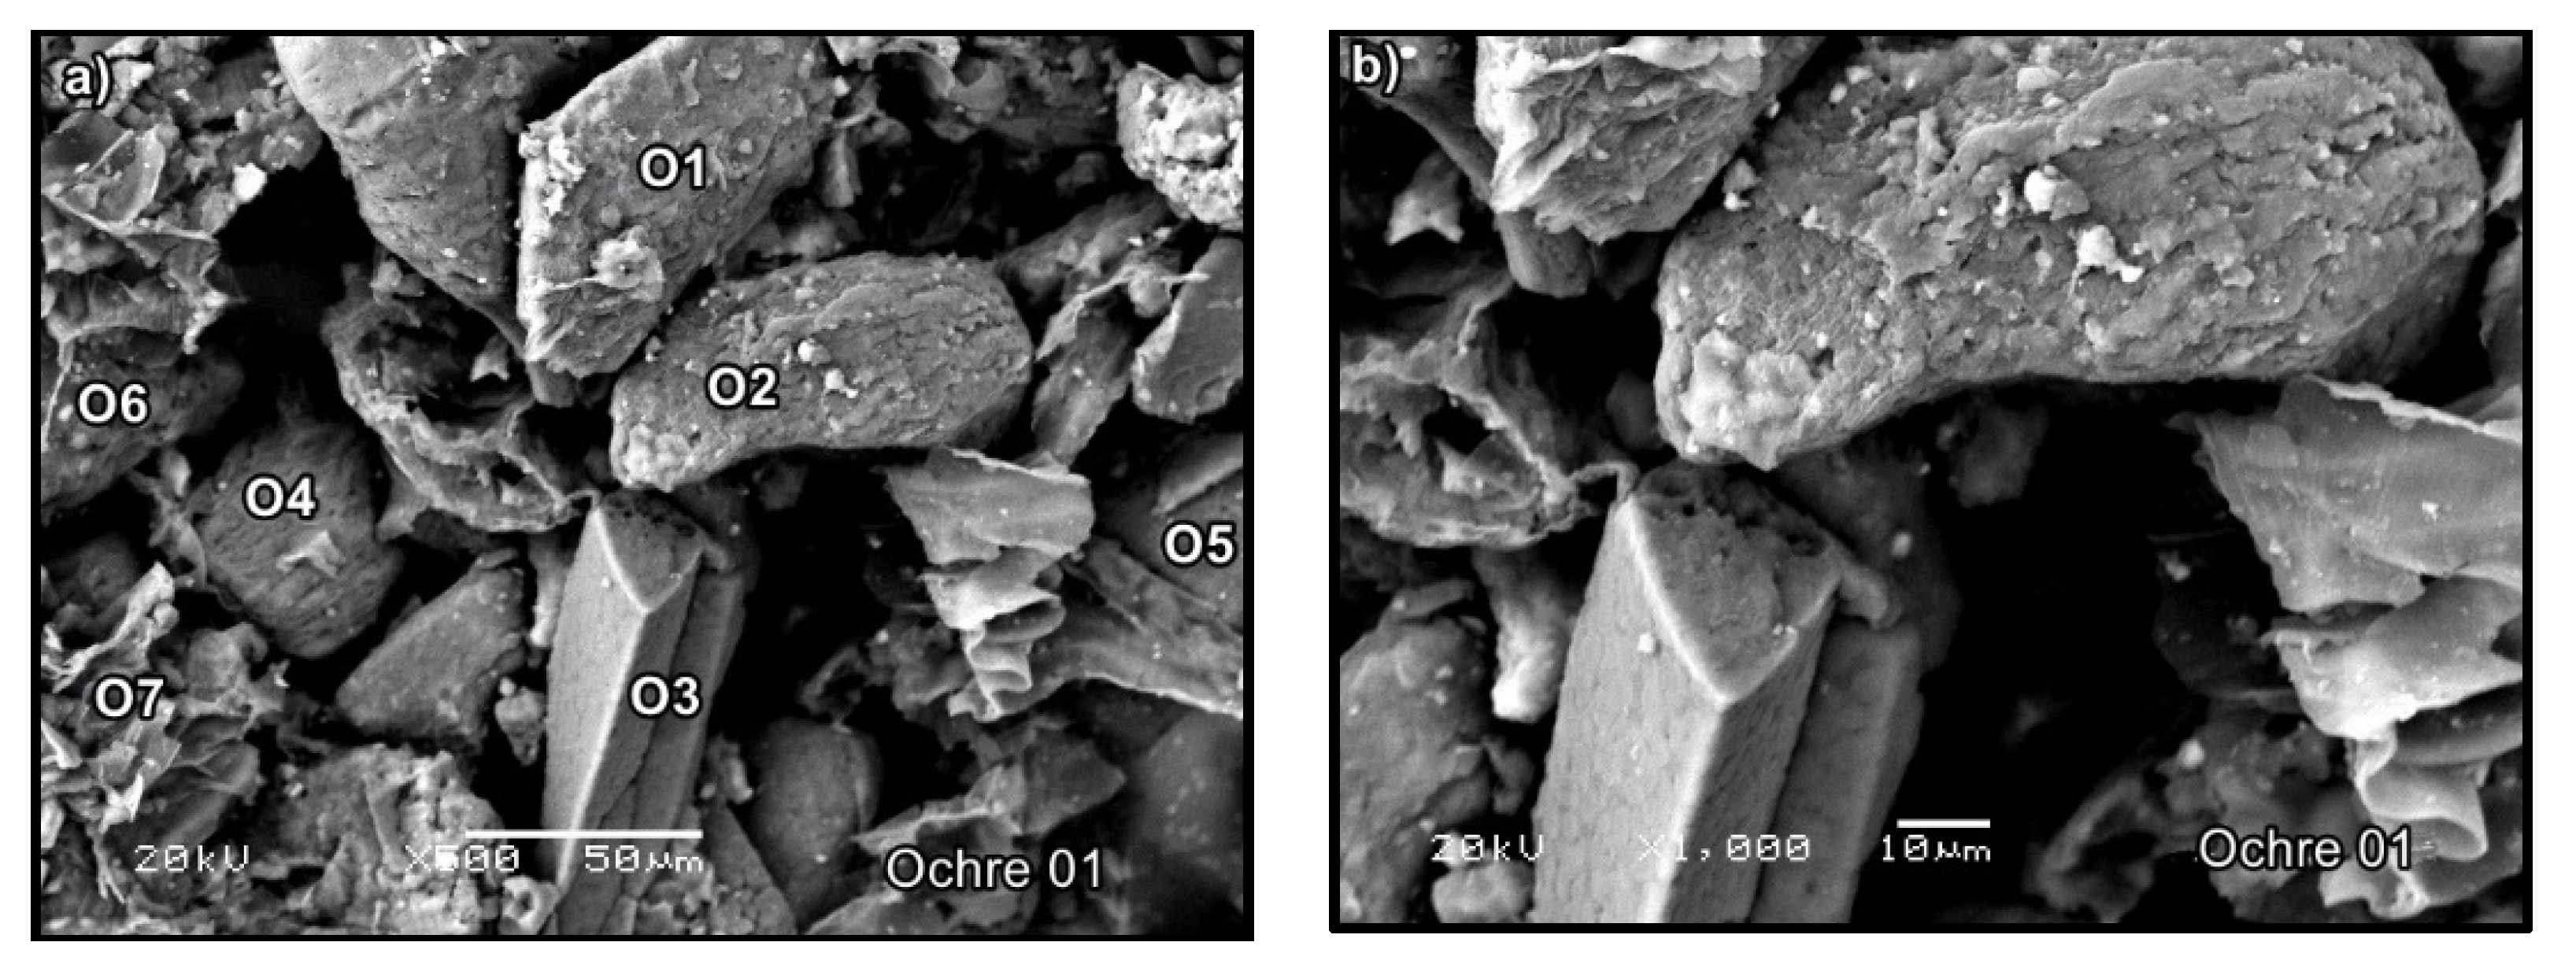
3.1. SEM and EDS Analysis

Figure 3a,b shows the typical morphology of the blue pigment. In Figure 3a, fibers with an average diameter of 57.89 nm and average length of 1105.36 nm are observed, while in Figure 3b, fibers with an average diameter of 42.68 nm and average length of 1353.73 nm are distinguished, as well as laminar structures in the A5 and A6 regions approximately 1.6 µm wide and 1.4 µm in length. Figure 3a,b shows the graphical distribution of the size classes of the fibers present in the blue pigment. EDS analysis showed that C and O are more abundant in wt%; Mg, Al, and Si are in intermediate abundance, while Na, Cl, K, and Fe have a lower presence, as can be observed in Table 2. It should be mentioned that the EDS analysis was performed in different selected areas, indicated as A1 to A5 in Figure 3. Ca and S were also found in amounts lower than 3 wt% in regions A2, A3, and A4, while in regions A1, A5, and A6, the S was found between 4 wt% and 5 wt%. Ca was found to be 12 wt% in the A1 region and in amounts greater than 20 wt% in the A5 and A6 regions. This is interesting because structures with flat surfaces are rich in calcium, while particles with fiber structures showed a lower quantity of it; this indicates that different material phases are present in the blue pigment. The elemental analysis of the fibers showed that they are mainly composed of O, Si, Al, Mg, and Fe; according to their morphology and chemical composition, these fibers are associated with palygorskite clay [28].
Figure 4a,b corresponds to the SEM micrographs of two different areas in the red pigment. In Figure 4a, agglomerates with an average diameter of 4.16 µm and average length of 7.53 µm are observed. Agglomerates with an average diameter of 1.70 µm and average length of 2 µm are seen in the R5 and R6 regions (Figure 4b). However, granular, rod, and laminar-shaped structures are also observed, with an average length of 303.25 nm and an average width of 62.33 nm. The graphs in Figure 4a,b correspond to the size classes distribution of the fibers and agglomerates observed in the red pigment.
Table 3 shows the EDS analysis performed on several points of the red pigments, which are indicated as R1 up to R6 in Figure 4a,b. According to Table 3, in the red pigment, a higher concentration of C, O, Fe (up to 16.65 wt%), and Pb (up to 11.00 wt%) was determined. Si and Ca were identified in amounts of between 6 wt% and 9 wt%, while Al and S occurred in amounts less than 3 wt%. Finally, Mg and K were only found in a concentration of less than 1 wt%.
In Figure 5, the mapping of the red pigment is shown in order to determine the distribution of the elements present in the sample: Pb, Al, S, K, Fe, and Ca. According to this figure, all elements are homogenously distributed; however, it is possible to observe that the Pb and, to a lesser extent, Si tend to form agglomerates, which are observed as particles of a larger size.
Figure 6a corresponds to an SEM micrograph of a specific zone of the ochre pigment; structures with rough surfaces up to 50 µm in size, as well as spiral ribbon-shaped laminar structures of 50 µm in length and 26 µm in width, were observed; a triangular prism shape structure was also noted. Figure 6b is a magnification image of the O1, O2, and O3 regions where the detail of the morphology of the described structures is appreciated. The EDS chemical analysis made at different points (O1, O2, O3, O4, O5, and O6 in Figure 6a) is shown in Table 4. Again, an appreciable difference in the chemical composition with respect to the blue and red pigments was observed; for instance, C and Pb were identified in lower wt% than in the red pigment, while Ca and Fe were present in higher wt%. The corresponding wt% of all identified elements are presented in Table 4.

3.2. X-ray Diffraction Analysis

In the blue pigments, typical diffraction patterns are shown in Figure 7. All the samples displayed some characteristic peaks at 7.26°, 14.45°, 17.67°, 23.89°, 26.56°, 39.35°, 41.01°, 44.83°, and 50.46° on the 2-theta scale. Based on this information, a search was carried out in the International Centre for Diffraction Data (ICCD); as a result, it was found that these peaks correspond to the hkl planes (110), (200), (150), (260), (241), (331), (300), (541), (561), and (300) of the palygorskite clay ((Mg, Al) 2Si4O10 OH)4H2O) with PDF card No. 21-0957. The characteristic peaks were also identified at 10.34°, 19.69°, 20.69°, and 34.85°, which are related to the hkl planes (130), (060), (131), and (371) of the sepiolite (Mg4Si6O15 (OH)2 H2O) with card No. 25-1371. The diffraction peaks at 29.40°, 57.39°, and 64.66° in 2-theta belonged to the hkl planes (104), (122), and (300) of the calcite (CaCO3) with card No. 47-1743. It should be mentioned that palygorskite clay had a higher abundance. In Figure 7, the corresponding indexing planes for the identified crystalline phases are shown.
The X-ray diffractograms of two samples with the red pigment are presented in Figure 8. It was possible to identify several crystalline phases: CaCO3, SiO2, Fe2O3, and PbO2; the corresponding diffraction peaks for each phase were indicated in each diffractogram (Figure 8). According to the International Center for Diffraction Data (ICDD), the PDF card No. 02-0919 was identified for hematite, card No. 01-0649 for quartz, card No. 47-1743 for calcite, and card No. 41-1492 for lead dioxide. All the samples displayed some characteristic peaks at 23.05°, 29.40°, 35.97°, 43.16°, 47.11°, 56.56°, 60.99°, 64.66°, and 77.16° in the 2-theta scale that are associated with the hkl planes (012), (104), (202), (024), (202), (208), (300), (12-1), and (11-2) of calcite. The diffraction peaks at 25.42°, 31.97°, 40.66°, 52.12°, 58.89°, 66.83°, and 76.87° belonged to the hkl planes (101), (210), (220), (310), (202), and (400) related to lead dioxide, and the characteristic peaks at 24.23°, 33.28°, 35.74°, 40.99°, 49.49°, 54.23°, 57.55°, 62.72°, 75.374°, and 77.55°, which correspond to the hkl planes (110), (113), (024), (023), (116), (122), (214), (217), and (306), are linked to hematite. In Figure 8, the corresponding indexing planes for the identified crystalline phases are shown.
The X-ray diffractogram of a sample with the ochre pigment is presented in Figure 9. According to the International Centre for Diffraction Data (ICDD), the PDF card No. 02-0273 was identified for goethite (Fe3O(OH)), 01-0649 for quartz (SiO2), and the card No. 25-0618 for sanidine (KSi3AlO8) (Figure 9). All the samples displayed some characteristic peaks at 26.83°, 39.49°, 42.61°, 45.79°, 50.08°, 54.93°, 60.03°, 67.86°, 73.33°, 77.55°, 79.87°, 81.50°, and 84.11°, which corresponded to the hkl planes (101), (102), (200), (201), (112), (202), (211), (212), (104), (220), (213), (114), and (311) belonging to quartz. The characteristic diffraction peaks at 21.23°, 24.30°, 33.28°, 35.74°, 39.40°, 40.97°, 43.69°, 49.55°, 54.23°, 56.25°, 57.71°, 62.54°, 64.08°, 69.64°, 72.033°, 75.515°, 77.85°, 78.84°, 80.76°, 83.04°, 84.92°, and 88.69° were related to the hkl planes (101), (012), (110), (006), (113), (202), (024), (116), (211), (018), (214), (300), (208), (1010), (220), (036), (223), (128), and (021) for the goethite crystalline phase. Finally, the characteristic peaks at 13.30°, 19.36°, 20.93°, 22.49°, 23.45°, 25.06°, 25.73°, 27.33°, 29.79°, 30.92°, 31.95°, 34.67°, 37.07°, 37.90°, 41.52°, 43.94°, 47.10°, 50.86°, and 52.33° were related to the hkl planes (110), (021), (-201), (111), (-130), (-221), (-112), (040), (131), (022), (-311), (221), (151), (-203), (060), (061), (351), (043), and (242) linked to sanidine. In Figure 10, the corresponding indexing planes for the identified crystalline phases are shown.

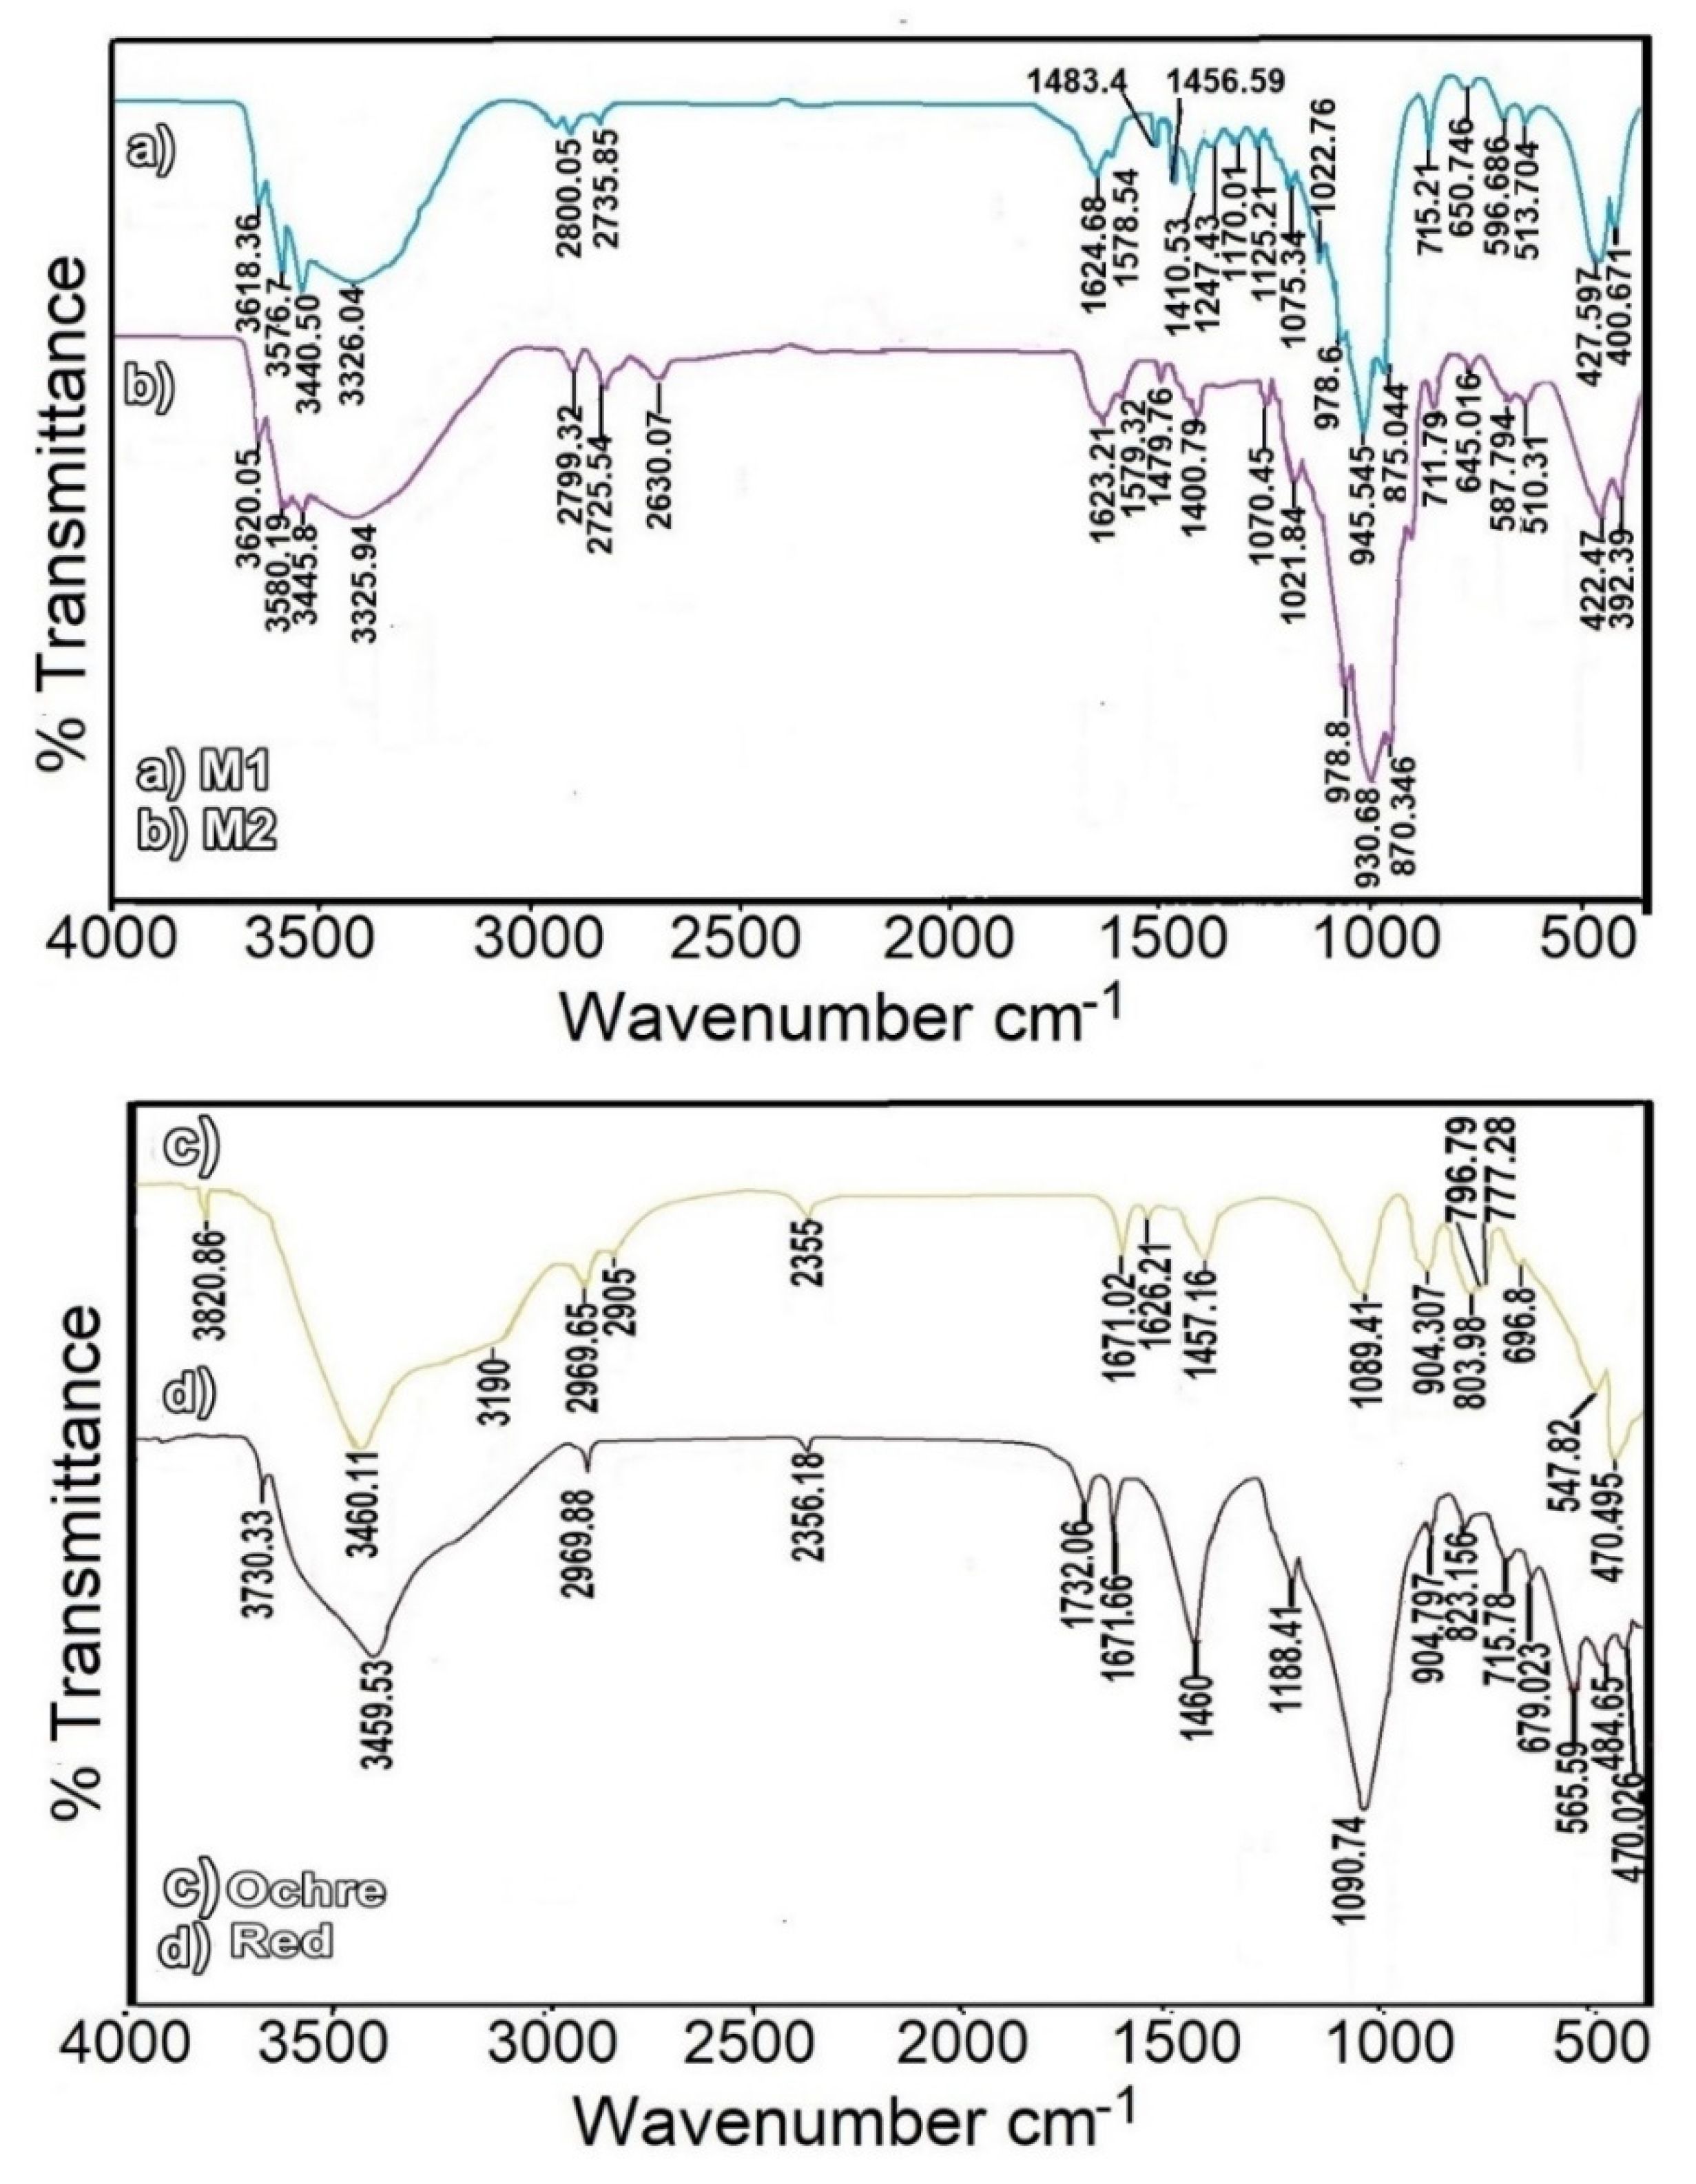
3.3. Infrared Spectroscopy Analysis

The FTIR spectra of blue pigments (samples M1 and M2) are shown in Figure 10a. It is important to note the similarity of the absorption spectra for both samples. In these, the presence of stretching bands of the Mg-OH bond can be observed at 3576−440 cm−1, and the symmetric stretching bands at 3324 and 3618 cm−1 correspond to Al−Fe−OH and Al−OH [29,30]. Furthermore, these symmetric and asymmetric stretch bands are associated with zeolitic water bonds and with the octahedral layer of palygorskite clay [29]. In addition, the absorption bands at 2807 cm−1 correspond to interactions of the C–H bonds, while the band at 2790-2736-2725 cm−1 is associated with the interaction of the CH2 group [31,32]. The vibratory band at 2630 cm−1 is due to intramolecular bridges with the carbonyl group and OH [33]. Bands attributed to C=O vibrations were detected near 1623 cm−1 (stretching) [34]. The stretching and bending vibrations of six-membered rings occurred at 1578–1579, 1483, and 1456 cm−1, whereas bands attributed to vibrations of C–H arose at 1483, 1456, 1247, and 1170 cm−1 (rocking) [34]; this is interesting because Baran et al. (2010) reported these absorption bands for indigo [34]. Finally, the stretch and strain bands for CO3 of calcite were at 1400 1410, 870, and 875 cm−1, as well as the asymmetric stretch bands of the same bond at 715 cm−1 [29,35]. The vibrational modes referents to palygorskite were found at 3620, 3570, 1022, 978, and 650 cm−1 [36,37]. Other absorption bands and corresponding functional groups in the blue pigments are also presented in Table 5.
The FTIR absorption spectra, of red and ochre pigments, are presented in Figure 10b. Some important differences can be observed in both spectra, for example, the bands at 470, 484, and 565 cm−1 [38,39], which correspond to the Fe-O-Fe and Fe-O bonds of hematite (Fe2O3), and 470, 803, and 905 cm−1 for goethite [40]. Concerning the red pigment, we observed bands at 715 and 1460 cm−1 associated with calcite [35,41], while quartz showed bands at 1090 and 1188 cm-1 that correspond to stretching bands of the Si-O bond [40,42]. In the ochre pigment, bands associated with quartz were found at 796 and 777 cm−1, as well as bands at 696 and 1089 cm−1 [40] corresponding to the stretch bands of the SiO bond. Additional absorption bands and their corresponding functional groups are presented in Table 5.

4. Discussion

The mural paintings have always had a significant role, both in decorative and religious symbolism, as can be seen on the walls of some archaeological ruins, ceramics, or pre-Hispanic figurines. This must have been noted by the religious evangelizers, who decided to use them during the Spanish conquest. All this would explain why the walls of religious convents were decorated with wall paintings in a range of shades, covering a spectrum of different colors from warm (red-yellow) to cold (blue-green) tones [50].
In the SEM micrographs, nanometric fibers in the blue pigments were observed; from the average diameter and chemical elemental composition, they can be associated with the palygorskite and sepiolite clays [51]. This assertion was supported by the XRD and FTIR results, which effectively showed the presence of both clays, with palygorskite being the most abundant, and this was confirmed by EDS analysis finding elements such as O, Si, Al, and Mg. The presence of the indigo molecule was also corroborated with the FTIR, confirming the origin of the blue tone of the pigment. These results indicated that the blue pigments analyzed herein were manufactured similarly to Mayan blue.
It should be pointed out that this pigment is typical of the Mayan culture and was widely used in murals, pottery, and sculptures in a wide region of Mesoamerica in the pre-Hispanic time (since the 8th century BCE) and during the colonization. Mayan blue is very different from any other pigment used in other parts of the world [52]. Its extreme physicochemical stability explains why many artworks have survived for centuries under drastic environmental conditions.
The greater amount of Ca (more than 20 wt%) is associated with calcium carbonate (calcite), which was the substratum in which the wall paintings were made, and the rest is related to calcium sulfate (between 4.04 and 5.89 wt% of S) reported in blue, red, and ochre pigments. This assertion was supported by the XRD and FTIR results, and it should be mentioned that, since 1933–1934, colonial convents were under the protection of the INAH (Instituto Nacional de Antropología e Historia), and a layer of plaster was placed on the wall containing the paintings in order to preserve them. It was not until 1940 that the paintings were re-exhibited [53].
On the other hand, through the scanning electron microscopy analysis of the red pigment, agglomerates of very small fibrous particles and agglomerates of almost spherical particles were observed. For the agglomerates and the fibers, a higher concentration of Fe was detected. It should be mentioned that these spherical particles can be associated with the typical structure of hematite that would give rise to the red color of the sample [54,55].
The XRD results of the red pigment showed the presence of crystalline phases of quartz, lead dioxide, hematite, and calcium carbonate. The PbO2 was used by the Spanish as a pigment that was combined with hematite to obtain a brown or dark red color; this tells us about the synchronization of cultures that occurred during the 16th and 17th centuries; it should be mentioned that this metallic oxide was used as a fungicide and pesticide [56]. In the IR spectra, the stretch bands between 470 and 650 are important in the red pigment because they are associated with a series of wide and large bands from ferric oxide for the hematite mineral that would give a red hue.
With regard to the SEM results of the ochre pigment, the domain of structures with sharp edges and very short lengths was observed. It was not possible to study the size classes; however, particles between 50 μm and 100 μm were observed with a higher concentration of Fe. We also observed a structure with the shape of a triangular prism associated with sanidine, which is a feldspar with a significant concentration of Si, Al, and Na.
XRD analysis of the ochre pigment showed the presence of sanidine, which is feldspar, very common in effusive-type felsic volcanic rocks and hypo-abyssal rocks. Feldspar usually appears with several quantities of iron, calcium, and quartz [57]. In the infrared spectra of these ochre pigments, the most important areas of the spectrum obtained were found in two regions: at 547 cm−1, which corresponds to the vibrational modes of sanidine, and the symmetric stretching bands from 900 cm−1 to 800 cm−1 can be associated with the inter-actions of goethite (Fe3+ O (OH), corroborating with what has been described as giving origin to the color [40].
It was not possible to make a complete comparison of these results with the results reported by Ruvalcaba et al. [26], because the sampling was performed in different sites and included other colors. However, they analyzed the blue pigment and reported the presence of indigo, which agrees with our result. They also reported that the white colors were mainly calcium carbonates, but some gypsum was also found, and the black color of the grisaille was charcoal. The light pink color for the religious people consists of lead (minium) and calcium with the presence of mercury (vermillion) in the darker areas. In this work, we reported the presence of lead oxide (minium) in the red pigment. The interpretation of the results obtained by means of these techniques allowed us to find the origin of the pigments at the former convent of Actopan and the synchronization between two cultures: the Hispanic and the Otomi.

5. Conclusions

The obtained results allowed us to determine the origin of the color of the analyzed colonial pigments, distinguished by the presence of Mayan blue pigment in blue samples, hematite in red samples, and sanidine and goethite in ochre samples. In addition, calcite was associated with the substratum. Calcium sulfate was used as layer protection for the murals in the early 20th century. The pigments used in the decoration of the wall paintings of the Convent and other similar enclosures are largely natural minerals suitable for the fresco technique because they have good chemical resistance and colorfastness, with the exception of the Mayan blue pigment, which is a synthetic colorant obtained by the combination of organic and inorganic materials. The large size and importance of the murals in patrimonial convents of Mexico and the diversity of materials allowed the balance between modern techniques and historical research, thereby providing a range of data that allowed us to obtain a large quantity of good-quality information. We believe that our results have contributed to showing the syncretization of the artistic work of native people in the region with that of the monks who introduced the Christian religion in this colonial territory; there is no doubt that the religious strategy of the monks facilitated evangelism and also contributed to the conquest of Mesoamerica.
Finally, further analysis of the samples from different zones of the mural paintings are necessary to achieve better knowledge about the styles and roles of the various materials in the colors; this will be the main goal for future research.

Author Contributions

Conceptualization, D.M.-A.; formal analysis, E.S.-R., J.H.-Á., O.A.A.-S. and V.R.-L.; investigation, J.B.O.-L., D.M.-A. and V.R.-L.; methodology, J.B.O.-L., supervision, V.R.-L.; validation, D.M.-A.; writing—original draft, J.B.O.-L.; writing—review and editing, D.M.-A. and V.R.-L. All authors have read and agreed to the published version of the manuscript.

Funding

This research received no external funding.

Data Availability Statement

Data is contained within the article.

Acknowledgments

The authors are thankful to CONACYT for the scholarship awarded to Jesus Benjamin Ortega Lazcano belonging to the Doctorate program in Materials Sciences at the Universidad Autónoma del Estado de Hidalgo, number 4192.

Conflicts of Interest

The authors declare no conflict of interest.

References

  1. Ortega Avilés, M. Characterization of Pre-Hispanic Pigments Using Modern Analytical Techniques; UAEM: Toluca, México, 2003. [Google Scholar]
  2. Henrickson, R.C. In two ancient ceramic traditions. MRS Online Proc. Libr. 1995, 352, 553–571. [Google Scholar] [CrossRef]
  3. Magaloni Kerpel, D. The Colors of the Jungle. Procedures, Materials and Colors in Mayan Mural Painting Mexican Archeology; Instituto Nacional de Antropología e Historia, INAH: México City, México, 2008; Volume V, pp. 46–51. ISSN 0188-8218. [Google Scholar]
  4. Hernandez Sotelo, A. From paradise to hell: Towards a possible indigenous reading of the open chapel of Actopan Hidalgo. Pensam. Novohispano. 2005, 11. [Google Scholar]
  5. Cabrera Ortí, M.A. The Methods of Physicochemical Analysis and The History of Art; Monográfica (Universidad de Granada), Arte y arqueología; 22; Universidad de Granada: Granada, Spain, 1994. [Google Scholar]
  6. Abad Casal, L.; García Ramos, G.; Justo Erbez, Á. Physicochemical and mineralogical study of a series of paintings and wall coverings from Itálica (Sevilla). Arch. Español Arqueol. 1976, 49, 141–158. [Google Scholar]
  7. Vergara Hernandez, A. Hell in 16th Century Augustinian Mural Painting, Actopan and Xoxoteco in the State of Hidalgo, 1st ed.; Universidad Autonoma del Estado de Hidalgo: Pachuca, Mexico, 2008. [Google Scholar]
  8. Guirola, C. Tintes Naturales: Su uso en Mesoamérica Desde la Época Prehispánica; Asociación FLAAR Mesoamerica: Guatemala City, Guatemala, 2010; pp. 1–16. [Google Scholar]
  9. Anastacio Cruz, M.; Bustamante Godínez, H. Ex-Convent of San Nicolás de Tolentino a Virtual Visit; INAH, Hidalgo Mexico: Pachuca, Mexico, 2015. [Google Scholar]
  10. Von Wobeser, G.; Vila Villar, E. The beyond in New Spain Painting. 16th to 18th Centuries; UNAM: México City, Mexico, 2018; ISBN 9786070204494. [Google Scholar]
  11. Fernández Arenas, J. D’ Art: Revista del Departament d’Historia de l’Arte; Publusher: Zacatecas, Mexico, 1972; pp. 5–20. [Google Scholar]
  12. Romano Rodríguez, C. Anuario Saber Novohispano, Universidad Autónoma de Zacatecas, 1st ed.; Universidar Autonoma de Zacatecas: Zacatecas, México, 1995; pp. 333–344. [Google Scholar]
  13. Tite, M.S. Methods of Physical Examination in Archaeology, 10th ed.; Publicado por Elsevier Science & Technology Books: New York, NY, USA, 2002; ISBN 9780129164500. [Google Scholar]
  14. Vandenabeele, P.; Hardy, A.; Edwards, H.G.M.; Moens, L. Evaluation of a principal components-based searching algorithm for raman spectroscopic identification of organic pigments in 20th century artwork. Appl. Spectrosc. 2001, 55, 525–533. [Google Scholar] [CrossRef]
  15. Vandenabeele, P.; Wehling, B.; Moens, L.; Edwards, H.; De Reu, M.; Van Hooydonk, G. Analysis with micro-Raman spectroscopy of natural organic binding media and varnishes used in art. Anal. Chim. Acta 2000, 407, 261–274. [Google Scholar] [CrossRef]
  16. Ortega, R.F.; Lee, B.K. Neutron activation study of ancient pigments from murals of cholula and teotihuacan. Archaeometry 1970, 12, 197–202. [Google Scholar] [CrossRef]
  17. Langenscheid, A. Mining in the Mesoamerican Area, Rocks and Minerals of Ancient Mexico Mexican Archeology; Instituto Nacional de Antropología e Historia, INAH: México City, México, 2007; Volume XVI, pp. 6–15. ISSN 0188-8218. [Google Scholar]
  18. Martín-Del-Rio, J.J.; Flores-Alés, V.; Alejandre-Sánchez, F.J.; Blasco-López, F.J. New method for historic rammed-earth wall characterization: The almohade ramparts of Malaga and Seville. Stud. Conserv. 2019, 64, 363–372. [Google Scholar] [CrossRef]
  19. Peisach, M.; Pineda, C.A.; Jacobson, L. Nuclear analytical study of rock paintings. J. Radioanal. Nucl. Chem. 1991, 151, 221–227. [Google Scholar] [CrossRef]
  20. Ménager, M.; Fernández Esquivel, P.M.; Salgado González, S. The natural pigments used in Costa Rica: Preliminary analysis of geomaterials and polychrome ceramic fragments from Guanacaste. Cuad. Antropol. 2019, 30, 1–19. [Google Scholar] [CrossRef]
  21. Siotto, E.; Dellepiane, M.; Callieri, M.; Scopigno, R.; Gratziu, C.; Moscato, A.; Burgio, L.; Legnaioli, S.; Lorenzetti, G.; Palleschi, V. A multidisciplinary approach for the study and the virtual reconstruction of the ancient polychromy of Roman sarcophagi. J. Cult. Heritage 2015, 16, 307–314. [Google Scholar] [CrossRef]
  22. Souza, L.A.C.; Derrick, M.R. The use of Ft-Ir spectrometry for the identification and characterization of gesso-glue grounds in wooden polychromed sculptures and panel paintings. MRS Proc. 1995, 352, 573–578. [Google Scholar] [CrossRef]
  23. Mendoza Anaya, D.; Arenas Alatorre, J.A.; Ruvalcaba Sil, J.L.; Rodríguez Lugo, V. The identification of clayey and stone materials used in the manufacture of the frieze modeled on the stucco of the SUBII-C1 of Calakmul, through analysis X-ray diffraction. In Materials Science and Its Impact on Archeology; Mendoza Anaya, D., Arenas Alatorre, J.A., Ruvalcaba Sil, J.L., Ventura, R.L., Eds.; Academia Mexicana de Ciencia de Materiales: Mexico City, Mexico, 2006; pp. 237–252. ISBN 970-773-269-5. Primera. [Google Scholar]
  24. Lugo, V.R.; Ortiz-Velázquez, L.; Miranda, J.; Ortiz-Rojas, M.; Castaño, V.M. Study of prehispanic wall paintings from Xochicalco, Mexico, using PIXE, XRD, SEM and FTIR. J. Radioanal. Nucl. Chem. 1999, 240, 561–569. [Google Scholar] [CrossRef]
  25. Santos, H.C.; Silva, T.F.; Leite, A.R.; Assis, R.F.; Campos, P.H.O.V.; Rizzutto, M.A.; Tabacniks, M.H. Characterization of a system that combines energy dispersive X-ray diffraction with X-ray fluorescence and its potential applications in archeometry. J. Appl. Phys. 2019, 126, 044901. [Google Scholar] [CrossRef]
  26. Ruvalcaba-Sil, J.L.; Wong-Rueda, M.; Garcia-Bucio, M.A.; Casanova-Gonzalez, E.; Manrique, M.; Aguilar-Melo, V.; Claes, P.; Aguilar-Tellez, D.M. Study of Mexican colonial mural paintings: An in-situ non-invasive approach. MRS Proc. 2017, 1656, 75–93. [Google Scholar] [CrossRef]
  27. Miranda, J.; Oliver, A.; DaCal, A.; Ruvalcaba, J.; Cruz, F.; Ortiz, M.; Viñas, R. PIXE analysis of cave sediments, prehispanic paintings and obsidian cutting tools from Baja California Sur caves. Nucl. Instrum. Methods Phys. Res. Sect. B Beam Interact. Mater. Atoms. 1993, 75, 454–457. [Google Scholar] [CrossRef]
  28. Cisneros-Rosado, D.; Uribe-Calderon, J.A. Effect of surface modification of Palygorskite on the properties of Polypropylene/Polypropylene-g-Maleic Anhydride/Palygorskite nanocomposites. Int. J. Polym. Sci. 2017, 2017, 1–12. [Google Scholar] [CrossRef] [Green Version]
  29. Polette-Niewold, L.A.; Manciu, F.S.; Torres, B.; Alvarado, M.; Chianelli, R.R. Organic/inorganic complex pigments: Ancient colors Maya Blue. J. Inorg. Biochem. 2007, 101, 1958–1973. [Google Scholar] [CrossRef]
  30. Domenici, D.; Buti, D.; Miliani, C.; Brunetti, B.G.; Sgamellotti, A. The Colours of Indigenous Memory: Non-invasive Analyses of Pre-Hispanic Mesoamerican Codices. In Science and Art; The Royal Society of Chemistry: Londres, UK, 2010; pp. 94–119. ISBN 978-1-84973-81-8-7. [Google Scholar]
  31. Ortega, M.; Ascencio, J.A.; San-Germán, C.M.; Fernández, M.E.; Lopez, L.; Jose-Yacaman, M. Analysis of prehispanic pigments from “Templo Mayor” of Mexico city. J. Mater. Sci. 2001, 36, 751–756. [Google Scholar] [CrossRef]
  32. Ortega-Avilés, M.; San-Germán, C.M.; Mendoza-Anaya, D.; Morales, D.; Jose-Yacaman, M. Characterization of mural paintings from Cacaxtla. J. Mater. Sci. 2001, 36, 2227–2236. [Google Scholar] [CrossRef]
  33. Rojo, F. Infrared Spectroscopy Tables; UNAM: México City, México, 2000; p. 11. [Google Scholar]
  34. Baran, A.; Fiedler, A.; Schulz, H.; Baranska, M. In situ Raman and IR spectroscopic analysis of indigo dye. Anal. Methods 2010, 2, 1372–1376. [Google Scholar] [CrossRef]
  35. Aguayo, T.; Vargas, S. IR-ATR Spectra Database. In Spectra Database; Subdireccion Nacional de Gestion Patrimonial: Santiago de Chile, Chile, 2017; Volume 63, p. 89. [Google Scholar]
  36. Sánchez Del Río, M.; Doménech, A.; Doménech-Carbó, M.T.; De Agredos, P.; Vázquez, M.L.; Suárez, M.; García-Romero, E. The maya blue pigment. Dev. Clay Sci. 2011, 3, 453–481. [Google Scholar]
  37. Suárez, M.; García-Romero, E. Macroscopic palygorskite from lisbom volcanic complex. Eur. J. Miner. 2006, 18, 119–126. [Google Scholar] [CrossRef]
  38. Rendon, J.L.; Serna, C.J. IR spectra of powder hematite: Effects of particle size and shape. Clay Miner. 1981, 16, 375–382. [Google Scholar] [CrossRef]
  39. Adegoke, H.I.; AmooAdekola, F.; Fatoki, O.; Ximba, B. Adsorption of Cr (VI) on synthetic hematite (α-Fe2O3) nanoparticles of different morphologies. Korean J. Chem. Eng. 2014, 31, 142–154. [Google Scholar] [CrossRef]
  40. Genestar, C.; Pons, C. Earth pigments in painting: Characterisation and differentiation by means of FTIR spectroscopy and SEM-EDS microanalysis. Anal. Bioanal. Chem. 2005, 382, 269–274. [Google Scholar] [CrossRef]
  41. Myszka, B.; Schüßler, M.; Hurle, K.; Demmert, B.; Detsch, R.; Boccaccini, A.R.; Wolf, S.E. Phase-specific bioactivity and altered Ostwald ripening pathways of calcium carbonate polymorphs in simulated body fluid. RSC Adv. 2019, 9, 18232–18244. [Google Scholar] [CrossRef] [Green Version]
  42. Fagundo, J.R.; Valdés, J.J.; Pajón, J.M. Determination of the content of quartz minerals and kaolinite in sediments by infrared spectroscopy. J. Chem. Sci. 1984, 15, 327–333. [Google Scholar]
  43. Leona, M.; Picollo, M.; Casadio, F.; Picollo, M.B. Identification of the pre-columbian pigment maya blue on works of Art by noninvasive UV-Vis and Raman spectroscopic techniques. J. Am. Inst. Conserv. 2004, 43, 39. [Google Scholar] [CrossRef]
  44. Tatsch, E.; Schrader, B. Near-infrared fourier transform Raman spectroscopy of indigoids. J. Raman Spectrosc. 1995, 26, 467–473. [Google Scholar] [CrossRef]
  45. Cui, H.; Ren, W.; Lin, P.; Liu, Y. Structure control synthesis of iron oxide polymorph nanoparticles through an epoxide precipitation route. J. Exp. Nanosci. 2012, 8, 869–875. [Google Scholar] [CrossRef]
  46. Ghosh, M.K.; Poinern, G.; Issa, T.; Singh, P. Arsenic adsorption on goethite nanoparticles produced through hydrazine sulfate assisted synthesis method. Korean J. Chem. Eng. 2011, 29, 95–102. [Google Scholar] [CrossRef]
  47. Jovanovski, G.; Makreski, P. Minerals from Macedonia. XXX. Complementary use of vibrational spectroscopy and X-ray powder diffraction for spectra-structural study of some cyclo-, phyllo- and tectosilicate minerals. A review. Maced. J. Chem. Chem. Eng. 2016, 35, 125. [Google Scholar] [CrossRef] [Green Version]
  48. Theodosoglou, E.; Koroneos, A.; Soldatos, T.; Zorba, T.; Paraskevopoulos, K.M. Comparative fourier transform infrared and X-ray powder diffraction analysis of naturally occurred k-feldspars. Bull. Geol. Soc. Greece 2017, 43, 2752–2761. [Google Scholar] [CrossRef] [Green Version]
  49. Gunasekaran, S.; Anbalagan, G.; Pandi, S. Raman and infrared spectra of carbonates of calcite structure. J. Raman Spectrosc. 2006, 37, 892–899. [Google Scholar] [CrossRef]
  50. Vivar-Cravioto, L.C. Convent of San Nicolás Tolentino, Actopan; Convent of San Miguel Arcángel, Ixmiquilpan, 1st ed.; General Direction of Publications and Printed Matter of the Government of the State of Hidalgo: Pachuca, México, 2012.
  51. Galindo, A.L.; Viseras, C.; Aguzzi, C.; Cerezo, P. Pharmaceutical and cosmetic uses of fibrous clays. Dev. Clay Sci. 2011, 3, 299–324. [Google Scholar] [CrossRef]
  52. Del Rio, M.S.; Martinetto, P.; Somogyi, A.; Reyes-Valerio, C.; Dooryhee, E.; Peltier, N.; Alianelli, L.; Moignard, B.; Pichon, L.; Calligaro, T.; et al. Microanalysis study of archaeological mural samples containing Maya blue pigment. Spectrochim. Acta Part B At. Spectrosc. 2004, 59, 1619–1625. [Google Scholar] [CrossRef]
  53. Velázquez Fernandez, J.J. Conservation, Restoration and Adaptation: Former Convent of San Nicolás Tolentino, Actopan, Hidalgo, Metropolitan; Autonomous University: Toluca, Mexico, 2015. [Google Scholar]
  54. Arenas Alatorre, J.; Rendón, L.; Cañetas, J.; Zorrilla, C.; Silva-velázquez, Y. Instituto de Fisica; UNAM: Mexico City, Mexico, 2021; pp. 1–3. [Google Scholar]
  55. Rufus, A.; Sreeju, N.; Philip, D. Size tunable biosynthesis and luminescence quenching of nanostructured hematite (α-Fe2O3) for catalytic degradation of organic pollutants. J. Phys. Chem. Solids 2019, 124, 221–234. [Google Scholar] [CrossRef]
  56. Avellano Norte, J. Mural Painting and Its Origin and Didactics; Universidad Compultense de Madrid: Madrid, Spain, 2015. [Google Scholar]
  57. Louisa, T. The Ceramics Bible, 11th ed.; Chronicle Books: San Francisco, CA, USA, 2018; ISBN 978-1452101620. [Google Scholar]
Figure 1. (a) Geolocation map of the state of Hidalgo Mexico at the coordinates 20°16′06″ N 98°56′35″ W; (b) geolocation map of the convent of San Nicolás de Tolentino at the coordinates 20°16′6.24″ N, 98°56′34.8″ W; (c) the main facade of the convent of San Nicolás de Tolentino; and (d) samples of mural paintings from the convent: geometric themes of the barrel vault (left) and the garden of Eden (right).
Minerals 11 00852 g001
Figure 2. (a) General view of the mural painting, the red circle marking the specific area where the ochre sample was taken, and (b) general view of the mural painting, the red circle marking the specific area where the blue and red color samples were taken.
Minerals 11 00852 g002
Figure 3. Blue pigment micrographs showing localized areas for EDS analysis and size classes: (a) M1 blue, and (b) M2 blue.
Minerals 11 00852 g003
Figure 4. Red pigment micrographs showing localized areas for EDS analysis and size classes: (a) N1 Red, and (b) N2 Red.
Minerals 11 00852 g004aMinerals 11 00852 g004b
Figure 5. Elementary mapping of a red pigment sample.
Minerals 11 00852 g005
Figure 6. Micrograph of the ochre pigment marking the main classes of morphology: (a) sample 01, and (b) magnification of an area of sample 01.
Minerals 11 00852 g006
Figure 7. X-ray diffractogram of the blue pigment.
Minerals 11 00852 g007
Figure 8. X-ray diffractogram of the red pigment.
Minerals 11 00852 g008
Figure 9. X-ray diffractogram of the ochre pigment.
Minerals 11 00852 g009
Figure 10. Infrared absorption spectra of pigments: (a) M1 blue, (b) M2 blue, (c) ochre, and (d) red.
Minerals 11 00852 g010
Table 1. Classification of the samples to be analyzed, and description and location of the sampling area.
Num.SampleLocationDescription
1Blue M1Western wall of the sacristySampling from zoomorphic figure of a central border in the sacristy that showed damage and loss of polychromy in some regions
2Blue M2Western wall of the sacristy
3Blue M3Western wall of the sacristy
4Red N1Western wall of the sacristySampling from Anthropomorphous figures of a central border in the sacristy that showed damage and loss of polychromy in some regions
5Red N2Western wall of the sacristy
6Ochre 01Eastern wall of the sacristySamples were taken from a central border in the sacristy. The damage and loss of polychromy is also evident
7Ochre 02Eastern wall of the sacristy
Table 2. Elemental composition (%) determined through EDS of the blue samples.
SampleM1M2
Elementwt%
A1A2A3A4A5A6
C28.4627.5638.0639.9317.7014.84
O44.1545.9145.2648.9643.9644.71
Na0.620.480.380.31--
Mg1.086.104.391.611.541.0
Al2.093.213.212.811.520.92
Si6.6012.424.261.987.153.78
S2.782.292.782.134.875.19
Cl0.640.450.510.420.250.19
K0.560.450.550.340.17-
Ca12.60.500.51.3822.3429.13
Fe0.420.630.10.130.500.24
Table 3. Elemental composition (wt%) determined through EDS of the red samples.
SampleN1N2
Elementwt%
R1R2R3R4R5R6
C29.7343.8029.1430.0735.1035.53
O29.8729.5630.2030.7228.7227.35
Mg0.570.230.540.550.610.39
Al2.800.941.642.562.732.17
Si5.181.446.353.762.592.38
S1.110.920.991.862.492.16
K0.560.120.520.460.230.19
Ca4.845.918.845.673.652.31
Fe14.7610.7314.6016.6616.3816.16
Pb10.586.357.187.697.511.36
Table 4. Elemental composition (wt%) determined through EDS of the Ochre samples.
Sample01
Elementwt%
O1O2O3O4O5O6O7
C14.8014.2014.5112.9115.3915.5714.09
O37.5138.6036.9640.0340.8940.3039.19
Na0.360.189.850.111.960.10.7
Mg0.440.611.020.763.402.231.98
Al0.850.801.480.630.500.502.38
Si1.801.442.091.211.141.201.82
S4.044.324.095.225.895.795.69
Ca20.7420.6810.8720.5318.5920.1020.12
Fe18.3917.8317.1716.6611.2213.1712.53
Pb1.071.341.961.941.021.041.50
Table 5. Infrared absorption frequencies of the pigments.
Frequency cm−1Vibrational ModeReferencesYear
Blue Pigment
3620,3618,3576Mg-OH, Al-Mg-OHSanchez et al. [36] 2011
3445–3440Zeolitic waterPolette et al. [29]2007
3326–3325Mg-OH and Al-OHPolette et al. [29]2007
2800–2799ν CHOrtega et al. [31,32]2001
2735–2725ν CH2Ortega et al. [31,32]2001
2630Interaction C=O y Mg-OHRojo et al. [33]2000
1623-1624ν C=OBaran et al. [34,43]2010
1579–1578ν CC+ ν C=C + ν   C = O + ρ C–HBaran et al. [34]2010
1483–1479 ρ C–H + ν CCBaran et al. [34]2010
1456 ρ C–H + ν CCBaran et al. [34]2010
1400–1410CO3 (Calcite)[35]2017
1247 ρ C–HBaran et al. [34]2010
1170 ν   CN + ρ CH + ρ NHBaran et al. [34]2010
1125–1070ν CN + ρNHBaran et al. [34]2010
1022-1021ν Si-O (Palygorskite)Suárez et al. [37]
979-978δC-CO-C=C + νSi-OTatsch et al. [44]1995
945-930Si-OTatsch et al. [44]1995
870–875Calcite[35]2017
715–711Calcite[35]
650–645Mg-Mg-OHSanchez et al. [36]2011
596–587δC-NH-C + Al-OPolette et al. [29]2007
510–513Al-O-AlOrtega et al. [1]2003
427νAl-N + γ C=OPolette et al. [29]2007
412-400-392γ C--HTatsch et al. [44]1995
Ochre Pigment
3820–3460-ν OHGenestar et al. [40]2005
3190Fe-OHGenestar et al. [40]2005
2969–2905- Cui et al. [45]2013
2355CO3 Ghosh et al. [46]2012
1671–1626-OHGhosh et al. [46]2012
1457-ν COJovanovski et al. [47]2016
1089–696Si-OGenestar et al. [40]2005
904-803Fe3+ O (OH)Genestar et al. [40]2005
796–777Si-OGenestar et al. [40]2005
547SanidineTheodosoglou et al. [48]2017
470O-Fe
Red Pigment
3730–3459-ν OHGenestar et al. [40]2005
2969- Cui et al. [45]2013
1732-904-823-νPbO2[35]2017
2356CO3Ghosh et al. [46]2012
1671-OHAdegoke et al. [39]2014
1460ν COMyszka et al. [41]2019
1188–1090Si-O[1,40,42]
715–679CalciteGunasekaran et al. [49]2006
565-484-470Fe2O3Rendón et al. [38]1981
Modes: γ—deformation modes; ν—stretching; ρ—rocking; δ—torsion.
Publisher’s Note: MDPI stays neutral with regard to jurisdictional claims in published maps and institutional affiliations.

