
Nitrogen under Super-Reducing Conditions: Ti Oxynitride Melts in Xenolithic Corundum Aggregates from Mt Carmel (N. Israel)

 , , , ,
Abstract
:1. Introduction
2. Methods
2.1. SEM, FE-SEM, EMP
2.2. Transmission Electron Microscopy (TEM)
3. Results
3.1. Background
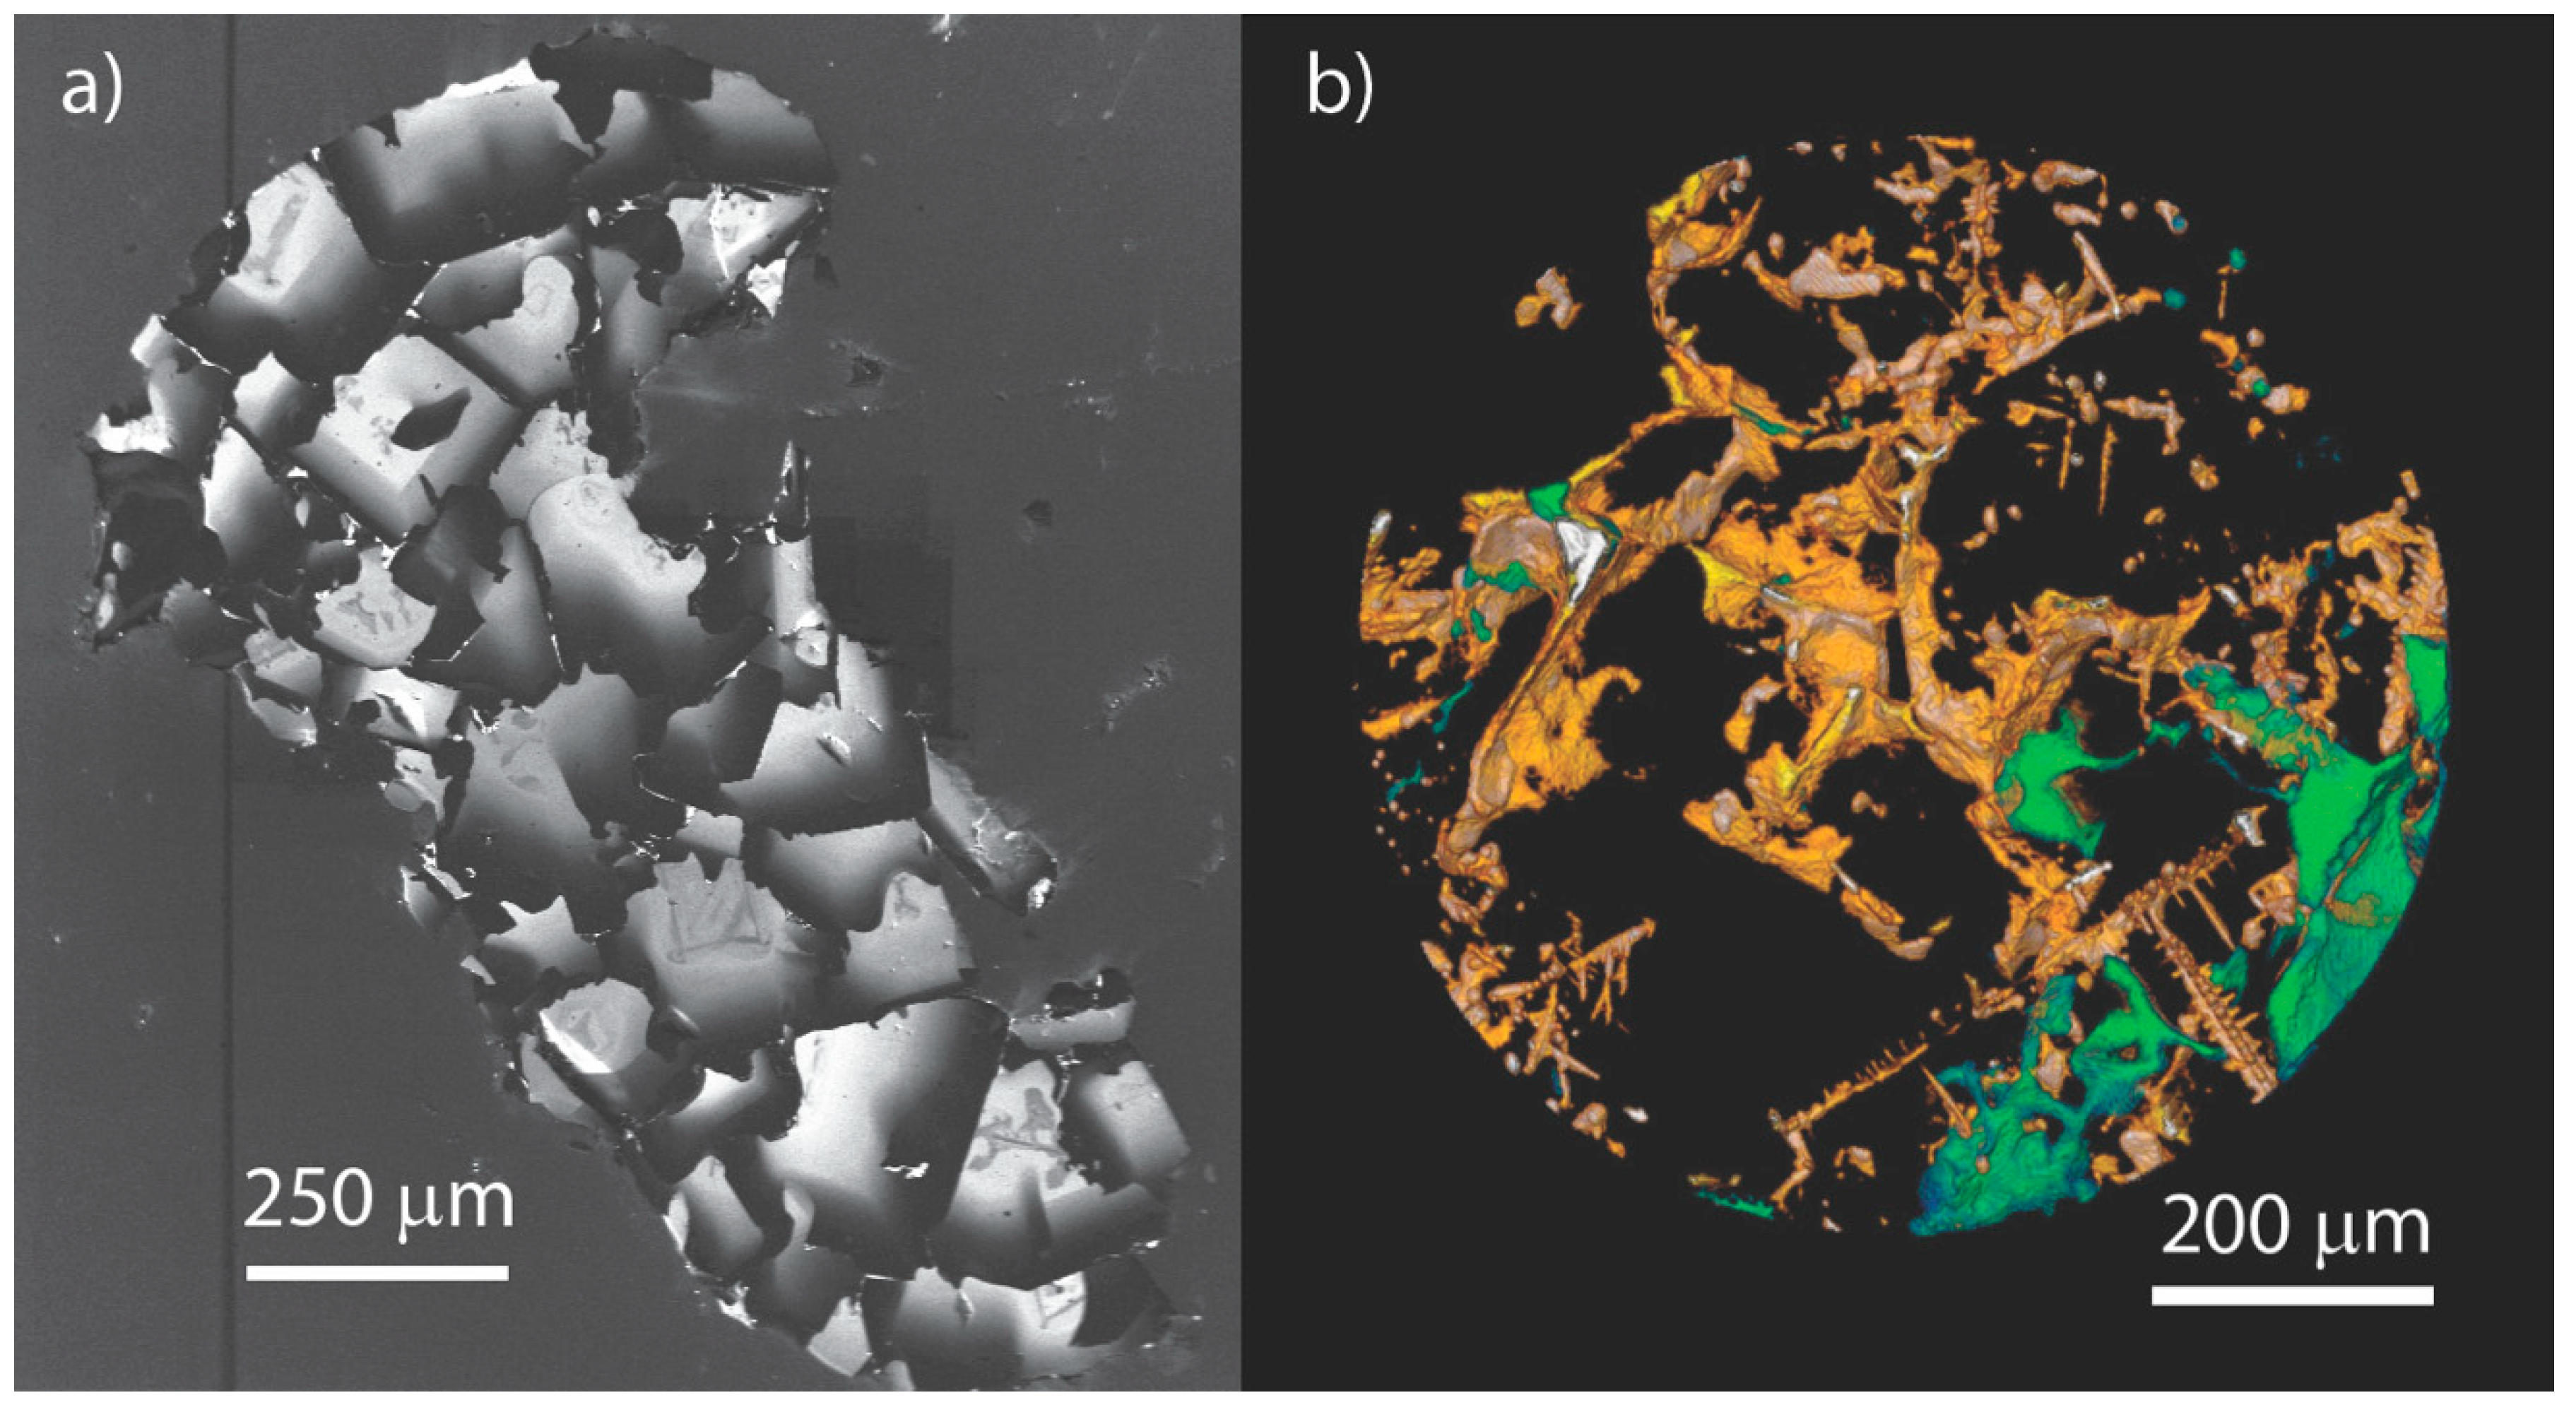
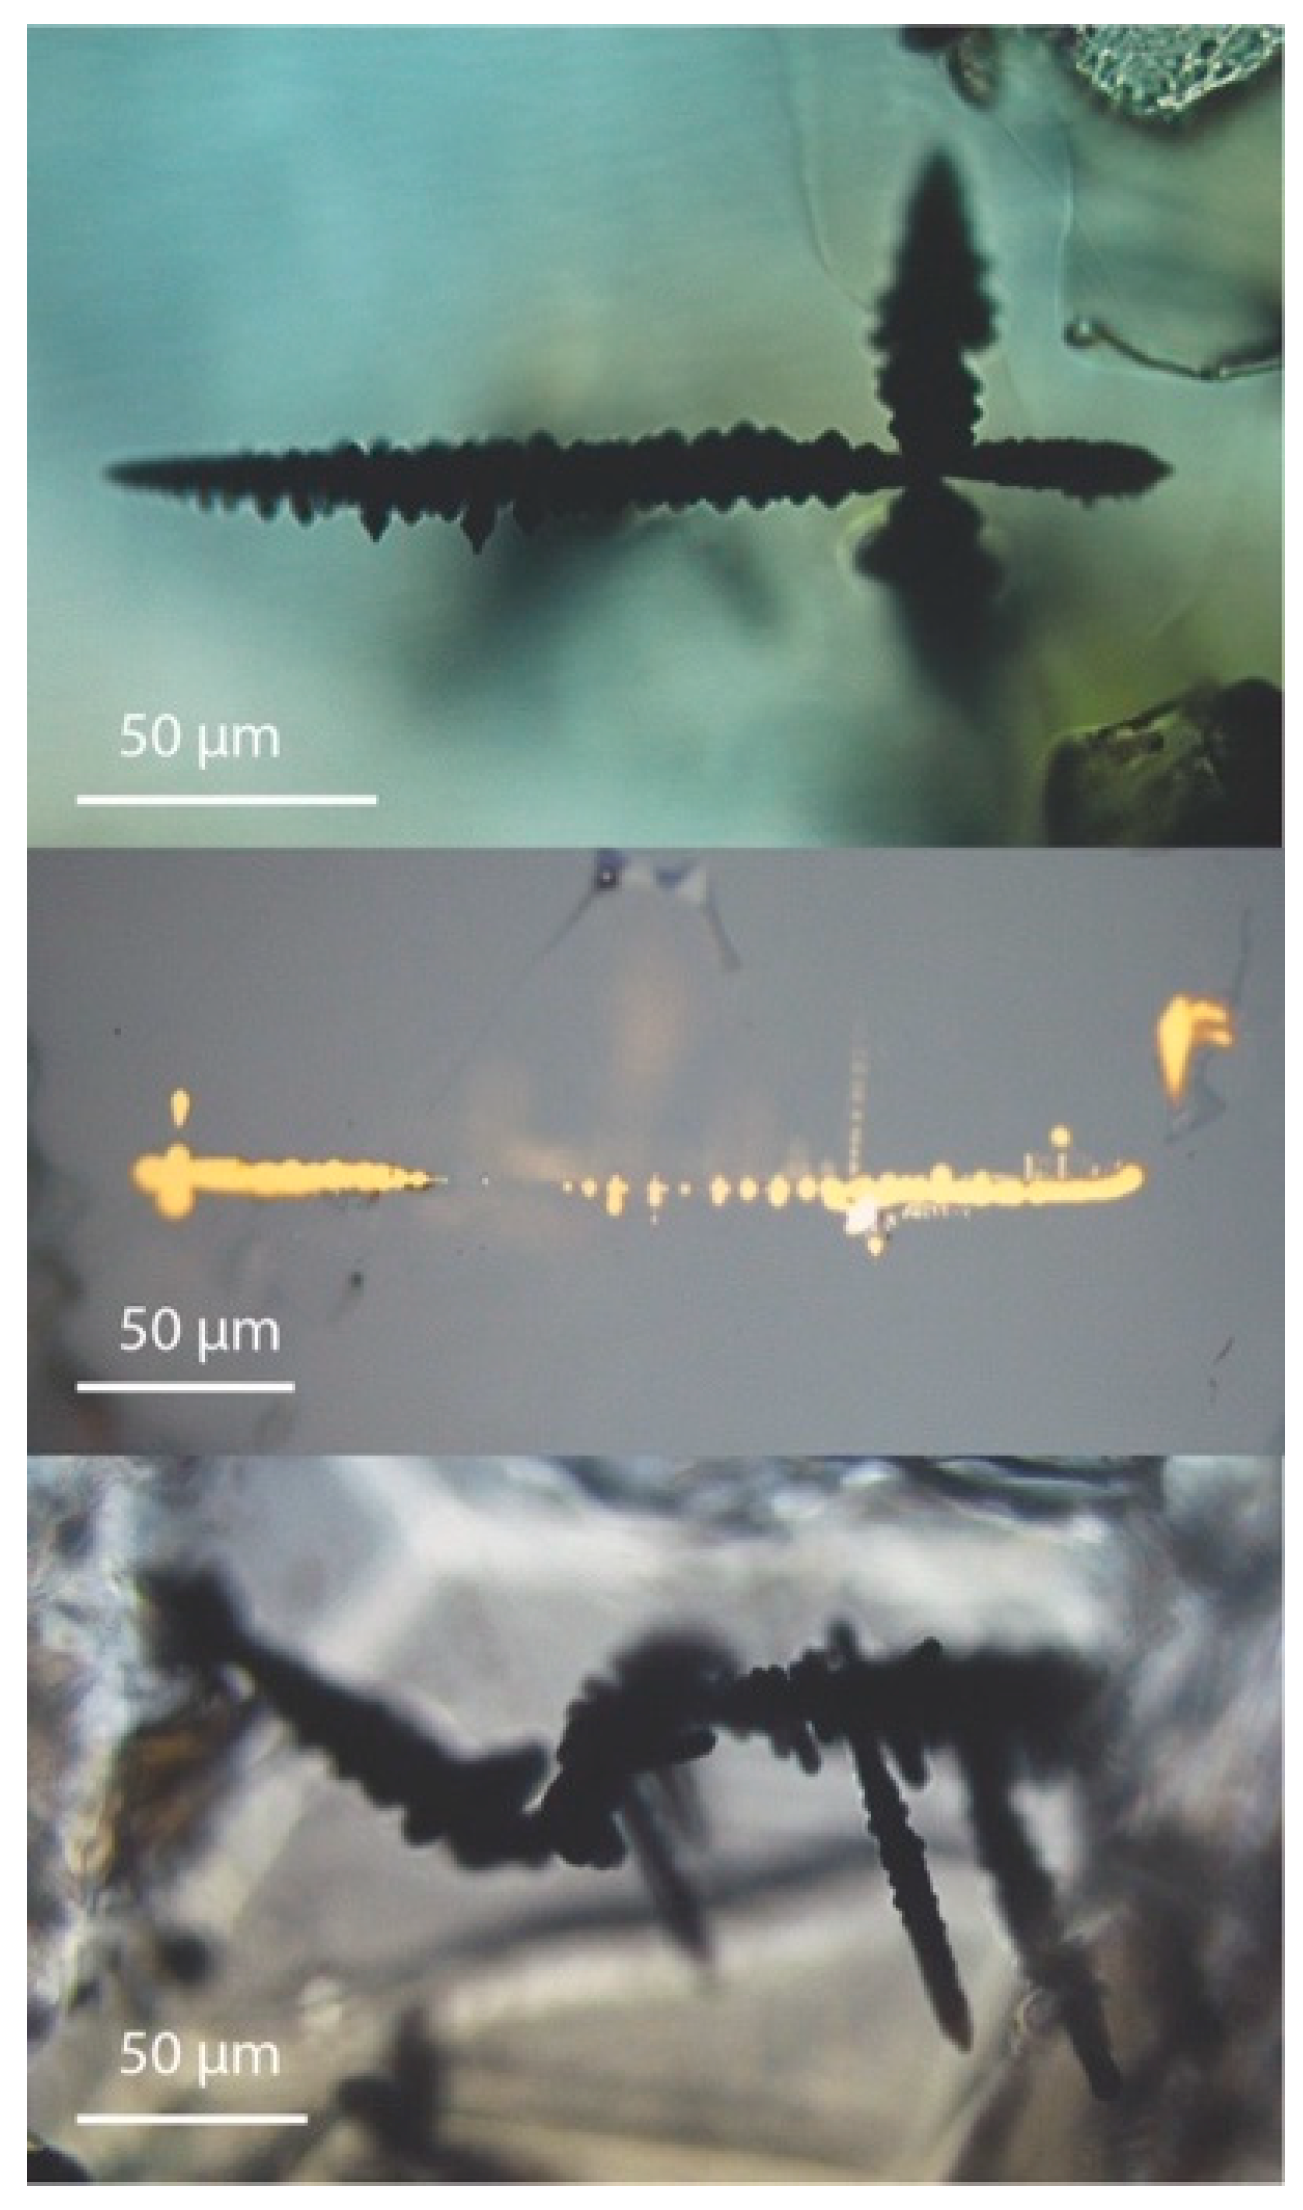
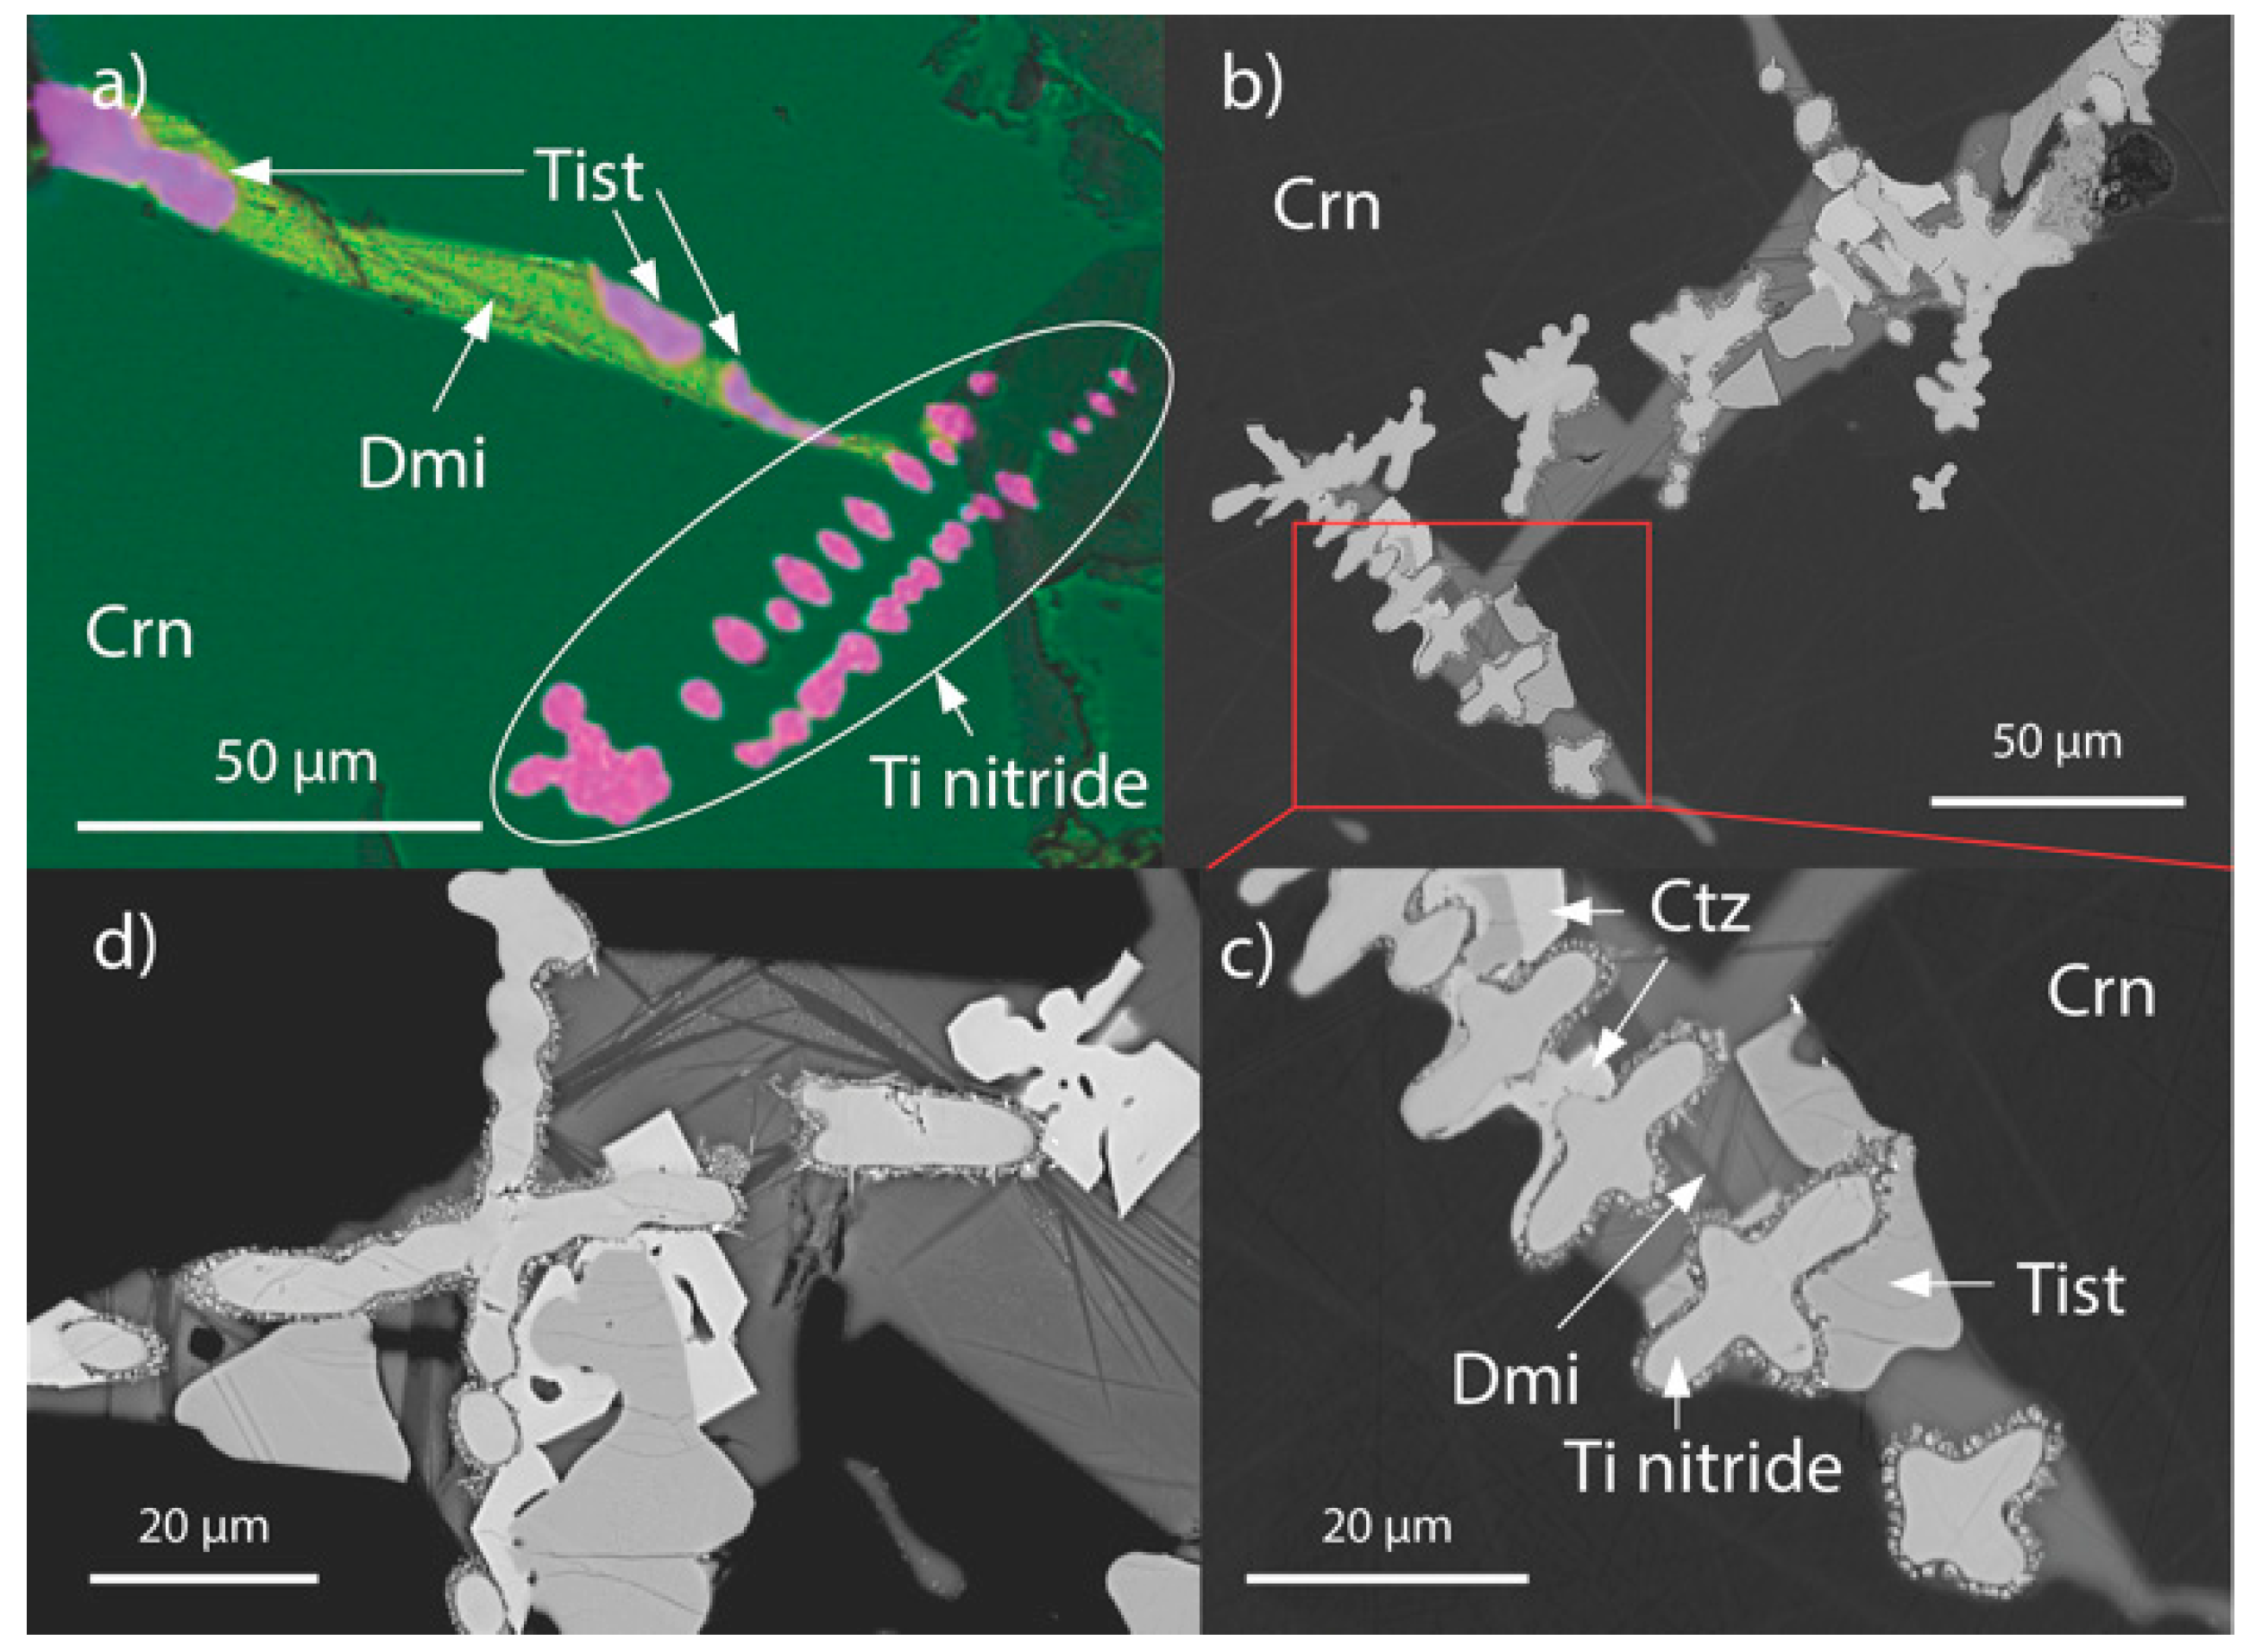
3.2. Petrography
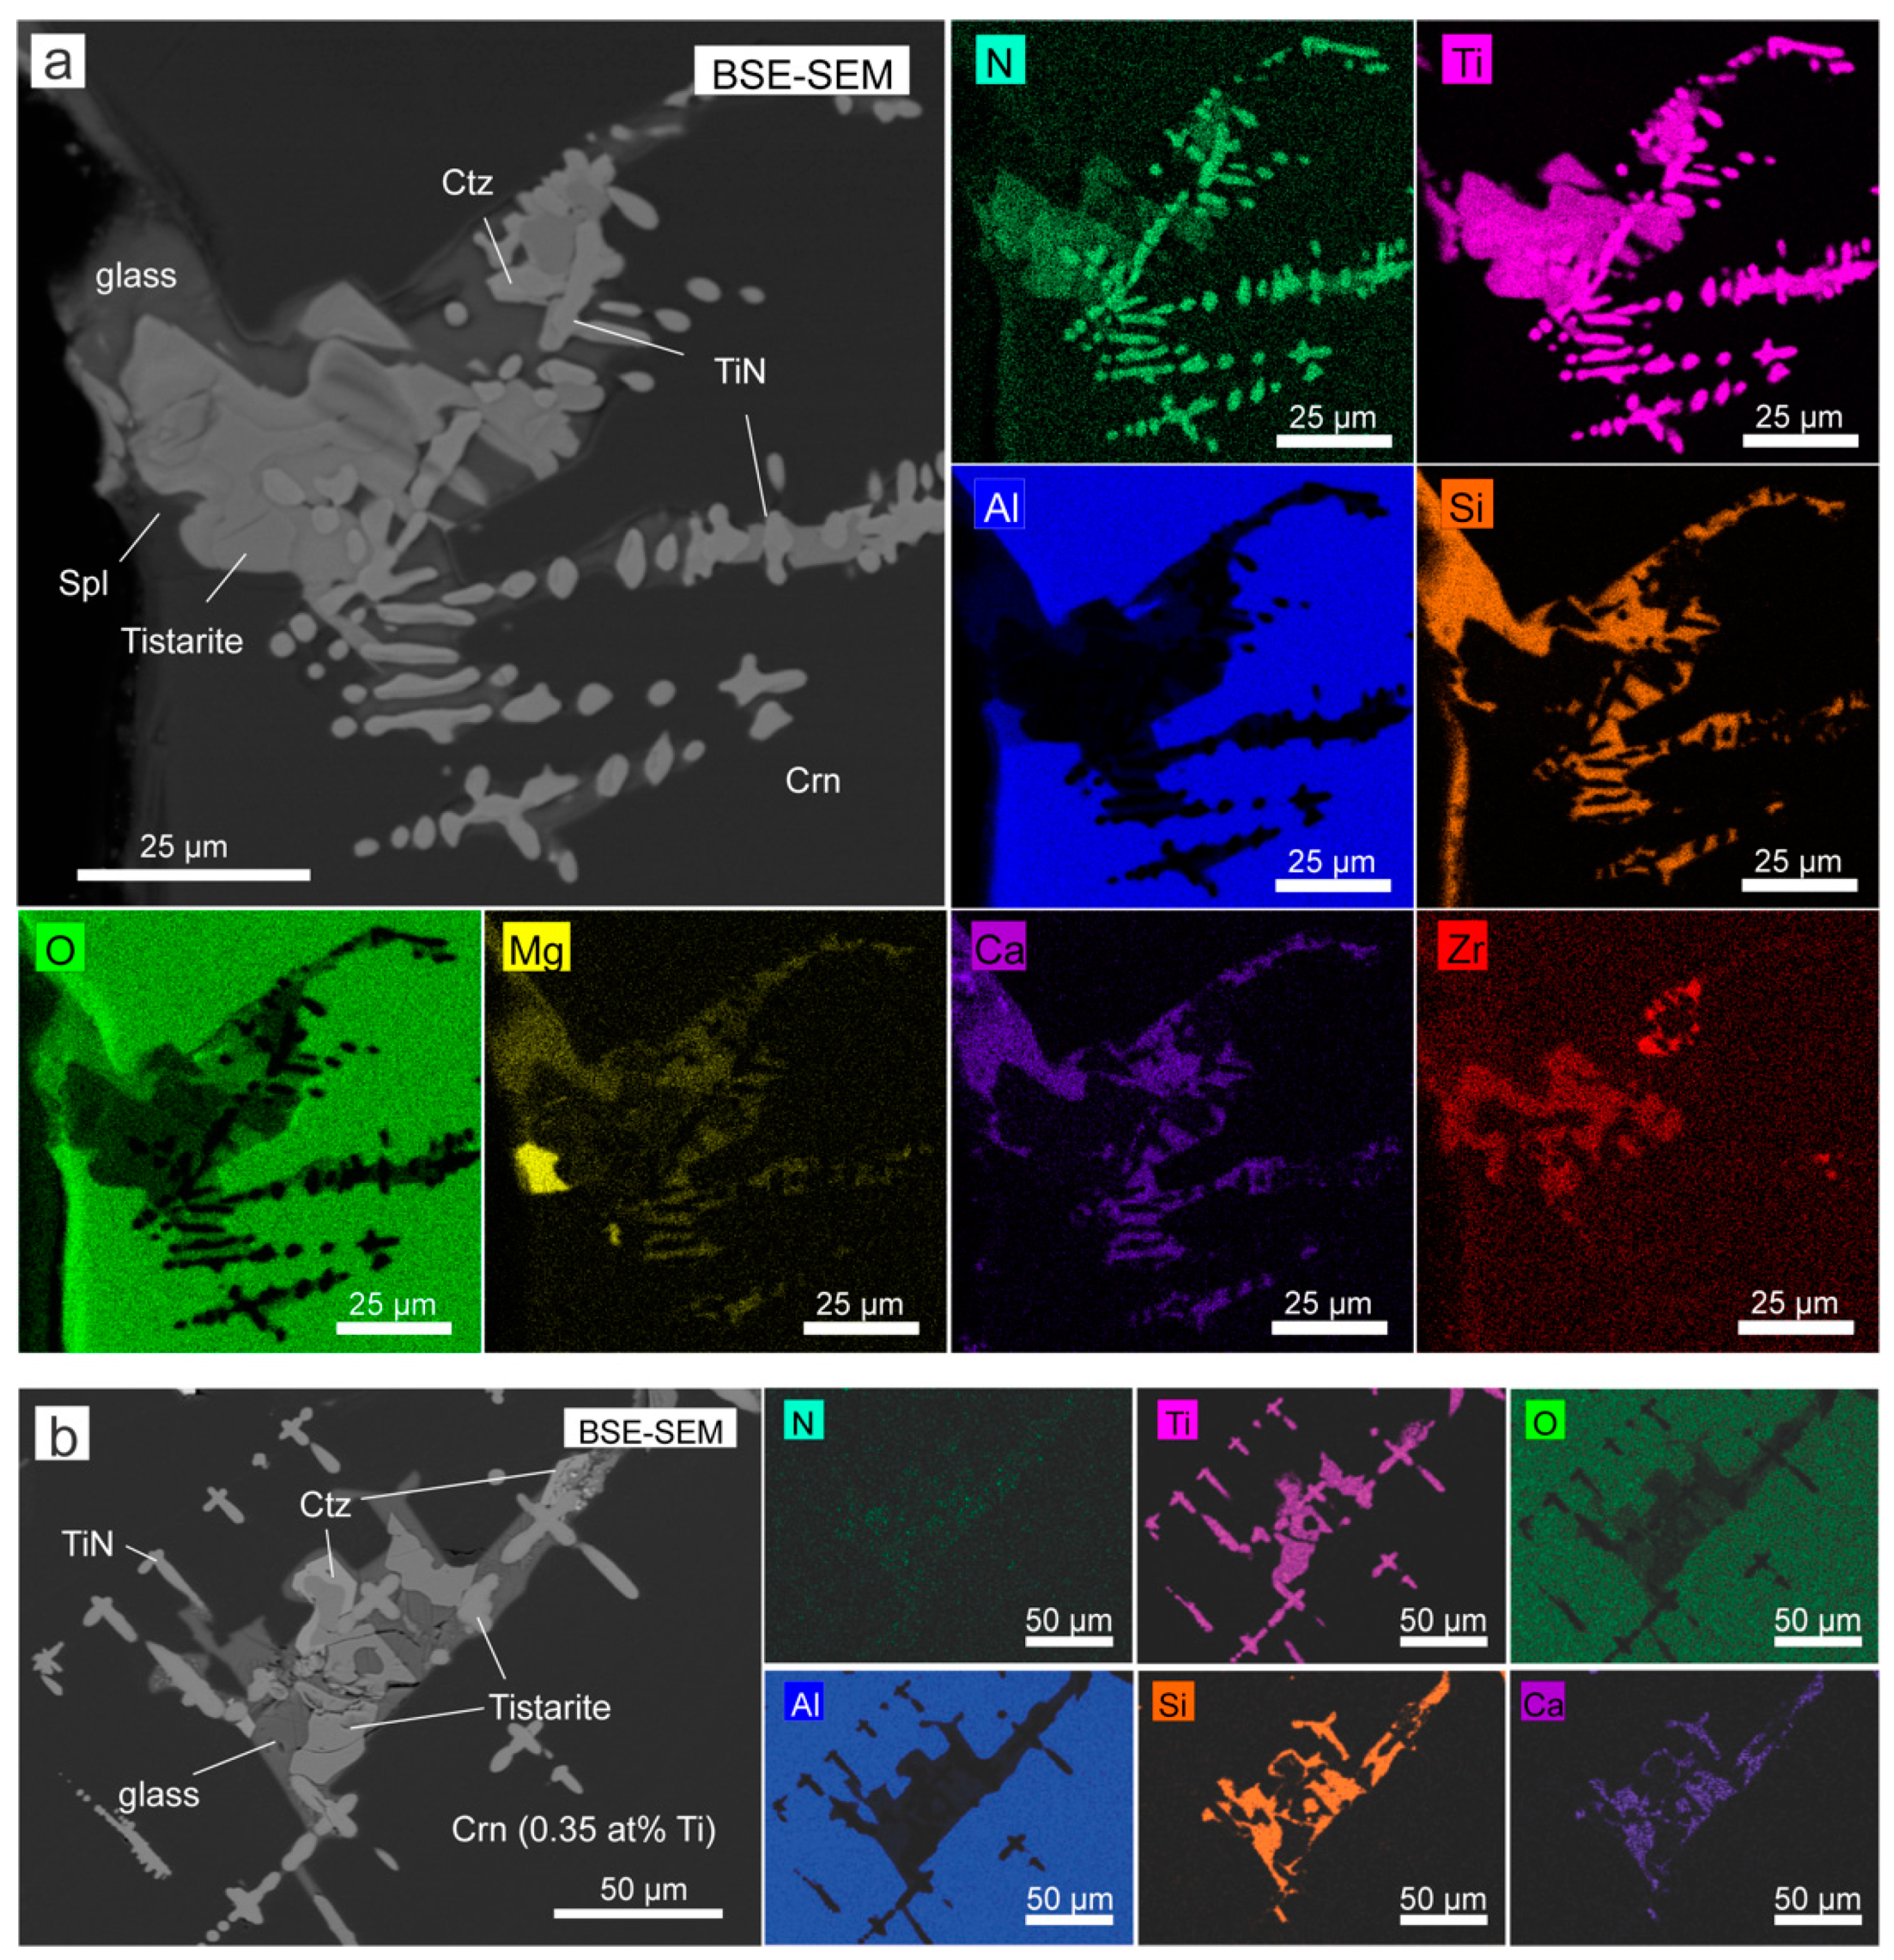
3.3. Mineral Chemistry and Structure
4. Discussion
4.1. Valence State of Ti in Ti(N,O,C)
4.2. Evolution of the Ti(N,O,C) Melts
5. Conclusions
Supplementary Materials
Author Contributions
Funding
Data Availability Statement
Acknowledgments
Conflicts of Interest
References
- Frost, D.J.; McCammon, C.A. The redox state of Earth’s mantle. Ann. Rev. Earth Planet. Sci. Lett. 2008, 36, 389–420. [Google Scholar] [CrossRef]
- Rohrbach, A.; Ballhaus, C.; Golla–Schindler, U.; Ulmer, P.; Kamenetsky, V.S.; Kuzmin, D.V. Metal saturation in the upper mantle. Nature 2007, 449, 456–458. [Google Scholar] [CrossRef]
- Stagno, V.; Ojwang, D.O.; McCammon, C.A.; Frost, D. The oxidation state of the mantle and the extraction of carbon from Earth’s interior. Nature 2013, 493, 84–88. [Google Scholar] [CrossRef] [PubMed]
- Larimer, J.W. An experimental investigation of oldhamite, CaS; and the petrological significance of oldhamite in meteorites. Geochim. Cosmochim. Acta 1968, 32, 965–982. [Google Scholar] [CrossRef]
- Tatarintsev, V.I.; Sandomirskaya, S.M.; Tsymbal, S.N. First finding of titanium nitride (osbornite) in Earth’s rocks. Dokl. USSR 1987, 296, 1458–1461. [Google Scholar]
- Dobrzhinetskaya, L.F.; Wirth, R.; Yang, J.; Hutcheon, I.D.; Weber, P.K.; Green, H.W. High-pressure highly reduced nitrides and oxides from chromitite of a Tibetan ophiolite. Proc. Natl. Acad. Sci. USA 2009, 106, 19233–19238. [Google Scholar] [CrossRef] [Green Version]
- Xu, X.; Yang, J.; Chen, S.; Fang, Q.; Bai, W.; Ba, D. Unusual mantle mineral group from chromitite orebody Cr-11 in Luobusa ophiolite of Yarlung-Zangbo suture zone, Tibet. J. Earth Sci. 2009, 20, 284–302. [Google Scholar] [CrossRef]
- Zhang, R.Y.; Yang, J.-S.; Ernst, W.; Jahn, B.-M.; Iizuka, Y.; Guo, G.-L. Discovery of in situ super-reducing, ultrahigh-pressure phases in the Luobusa ophiolitic chromitites, Tibet: New insights into the deep upper mantle and mantle transition zone. Am. Mineral. 2016, 101, 1285–1294. [Google Scholar] [CrossRef]
- Xiong, Q.; Griffin, W.L.; Huang, J.-X.; Gain, S.E.M.; Toledo, V.; Pearson, N.J.; O’Reilly, S.Y. Super-reduced mineral assemblages in “ophiolitic” chromitites and peridotites: The view from Mt Carmel. Eur. J. Mineral. 2017, 29, 557–570. [Google Scholar] [CrossRef]
- Griffin, W.L.; Gain, S.E.; Huang, J.; Saunders, M.; Shaw, J.; Toledo, V.; O’Reilly, S.Y. A terrestrial magmatic hibonite-grossite-vanadium assemblage: Desilication and extreme reduction in a volcanic plumbing system, Mount Carmel, Israel. Am. Mineral. 2019, 104, 207–219. [Google Scholar] [CrossRef]
- Griffin, W.; Gain, S.; Cámara, F.; Bindi, L.; Shaw, J.; Alard, O.; Saunders, M.; Huang, J.-X.; Toledo, V.; O’Reilly, S. Extreme reduction: Mantle-derived oxide xenoliths from a hydrogen-rich environment. Lithos 2020, 358–359, 105404. [Google Scholar] [CrossRef]
- Griffin, W.L.; Gain, S.E.M.; Adams, D.T.; Huang, J.-X.; Saunders, M.; Toledo, V.; Pearson, N.J.; O’Reilly, S.Y. First terrestrial occurrence of tistarite (Ti2O3): Ultra-low oxygen fugacity in the upper mantle beneath Mt Carmel, Israel. Geology 2016, 44, 815–818. [Google Scholar] [CrossRef] [Green Version]
- Griffin, W.; Gain, S.; Huang, J.-X.; Belousova, E.; Toledo, V.; O’Reilly, S. Permian to quaternary magmatism beneath the Mt Carmel area, Israel: Zircons from volcanic rocks and associated alluvial deposits. Lithos 2018, 314–315, 307–322. [Google Scholar] [CrossRef]
- Griffin, W.L.; Gain, S.E.M.; Bindi, L.; Toledo, V.; Cámara, F.; Saunders, M.; O’Reilly, S.Y. Carmeltazite, ZrAl2Ti4O11, a new mineral trapped in corundum from volcanic rocks of Mt Carmel, northern Israel. Minerals 2018, 8, 601. [Google Scholar] [CrossRef] [Green Version]
- Griffin, W.L.; Gain, S.E.M.; Saunders, M.; Bindi, L.; Alard, O.; Toledo, V.; O’Reilly, S.Y. Parageneses of TiB2 in corundum xenoliths from Mt Carmel, Israel: Siderophile behaviour of Boron under reducing conditions. Am. Mineral. 2021, 105, 1609–1621. [Google Scholar] [CrossRef]
- Griffin, W.L.; Gain, S.E.M.; Huang, J.-X.; Alard, O.; Toledo, V.; O’Reilly, S.Y. Immiscible metallic melts in the upper mantle beneath Mount Carmel, Israel: Silicides, phosphides and carbides. Am. Mineral. 2021, in press. [Google Scholar]
- Huang, J.-X.; Xiong, Q.; Gain, S.E.; Griffin, W.L.; Murphy, T.D.; Shiryaev, A.A.; Li, L.; Toledo, V.; Tomshin, M.D.; O’Reilly, S.Y. Immiscible metallic melts in the deep Earth: Clues from moissanite (SiC) in volcanic rocks. Sci. Bull. 2020, 65, 1479–1488. [Google Scholar] [CrossRef]
- Griffin, W.L.; Gain, S.E.M.; Saunders, M.; Cámara, F.; Bindi, L.; Spartà, D.; Toledo, V.; O’Reilly, S.Y. Cr2O3 in Corundum: Ultra-high contents under reducing conditions. Am. Mineral. 2021, in press. [Google Scholar]
- Litasov, K.D.; Kagi, H.; Bekker, T.B. Enigmatic super-reduced phases in corundum from natural rocks: Possible contamination from artificial abrasive materials or metallurgical slags. Lithos 2019, 340–341, 181–190. [Google Scholar] [CrossRef]
- Griffin, W.L.; Huang, J.; Thomassot, E.; Gain, S.E.M.; Toledo, V.; O’Reilly, S.Y. Super-reducing conditions in ancient and modern volcanic systems: Sources and behaviour of carbon-rich fluids in the lithospheric mantle. Mineral. Petrol. 2018, 112 (Suppl. 1), 101–114. [Google Scholar] [CrossRef]
- Oliveira, B.; Griffin, W.L.; Gain, S.E.M.; Saunders, M.; Shaw, J.; Toledo, V.; Afonso, J.C.; O’Reilly, S.Y. Ti3+ in corundum traces crystal growth in a highly reduced magma. Sci. Rep. 2021, 11, 2439. [Google Scholar] [CrossRef]
- Bindi, L.; Cámara, F.; Griffin, W.L.; Huang, J.-X.; Gain, S.E.; Toledo, V.; O’Reilly, S.Y. Discovery of the first natural hydride. Am. Mineral. 2019, 104, 611–614. [Google Scholar] [CrossRef]
- Bindi, L.; Cámara, F.; Gain, S.E.M.; Griffin, W.L.; Huang, J.-X.; Saunders, M.; Toledo, V. Kishonite, VH2, and oreillyite, Cr2N, two new minerals from the corundum xenocrysts of Mt Carmel, Northern Israel. Minerals 2020, 10, 1118. [Google Scholar] [CrossRef]
- Roedder, E. Origin of fluid inclusions and changes that occur after trapping. In Fluid Inclusions: Applications to Petrology; Hollister, L.S., Crawford, M.L., Eds.; Mineralogical Association of Canada Short Courses: Calgary, AB, Canada, 1981; Volume 6, pp. 101–137. [Google Scholar]
- Rees, K.; Lorusso, E.; Cosham, S.D.; Hyett, G.; Kulak, A.N. Combining single source chemical vapour deposition precursors to explore the phase space of titanium oxynitride thin films. Dalton Trans. 2018, 47, 10536–10543. [Google Scholar] [CrossRef] [Green Version]
- Tkachuk, O.; Matychak, Y.; Pohrelyuk, I.; Fedirko, V. Diffusion of nitrogen and phase-structural transformations in titanium. Metallofiz. Noveishie. Tekhnol. 2016, 36, 1079–1089. [Google Scholar] [CrossRef] [Green Version]
- Wreidt, H.A.; Murray, J.L. The N-Ti (Nitrogen-Titanium) system. Bull. Alloy. Phase Diagr. 1987, 8, 378–388. [Google Scholar] [CrossRef]
- Khidirov, I. Revision of the Ti-N phase diagram as probed by neutron diffraction. Russ. J. Inorg. Chem. 2011, 56, 298–303. [Google Scholar] [CrossRef]
- Roskosz, M.; Bouhifd, M.A.; Jephcoat, A.; Marty, B.; Mysen, B. Nitrogen solubility in molten metal and silicate at high pressure and temperature. Geochim. Cosmochim. Acta 2013, 121, 15–28. [Google Scholar] [CrossRef]
- Mysen, B.O.; Yamashita, S.; Chertkova, N. Solubility and solution mechanisms of NOH volatiles in silicate melts at high pressure and temperature—Amine groups and hydrogen fugacity. Am. Mineral. 2008, 93, 1760–1770. [Google Scholar] [CrossRef]
- Kadik, A.A.; Litvin, Y.A.; Koltashev, V.V.; Kryukova, E.B.; Plotnichenko, V.G.; Tsekhonya, T.I.; Kononkova, N.N. Solution behavior of reduced N–H–O volatiles in FeO–Na2O–SiO2–Al2O3 melt equilibrated with molten Fe alloy at high pressure and temperature. Phys. Earth Planet. Inter. 2013, 214, 14–24. [Google Scholar] [CrossRef]
- Libourel, G.; Marty, B.; Humbert, F. Nitrogen solubility in basaltic melt. Part I. Effect of oxygen fugacity. Geochim. Cosmochim. Acta 2003, 67, 4123–4135. [Google Scholar] [CrossRef]
- Speelmanns, I.M.; Schmidt, M.W.; Liebske, C. Nitrogen solubility in core materials. Geophys. Res. Lett. 2018, 45, 7434–7443. [Google Scholar] [CrossRef] [Green Version]
- Liu, J.; Dorfman, S.; Lv, M.; Zhu, F.; Kono, Y. Loss of immiscible nitrogen from metallic melt explains Earth’s missing nitrogen. Geochem. Perspect. Lett. 2019, 11, 18–22. [Google Scholar] [CrossRef] [Green Version]
- Kadik, A.A.; Kurovskaya, N.A.; Ignat’Ev, Y.A.; Kononkova, N.N.; Koltashev, V.V.; Plotnichenko, V.G. Influence of oxygen fugacity on the solubility of nitrogen, carbon, and hydrogen in FeO-Na2O-SiO2-Al2O3 melts in equilibrium with metallic iron at 1.5 GPa and 1400 °C. Geochem. Internat. 2011, 49, 429–438. [Google Scholar] [CrossRef]
- Martinez, I.; Javoy, M. The stability of nitrides in meteorites and in the Earth’s mantle: A thermodynamic and experimental study. Mineral. Mag. 1998, 62, 955–956. [Google Scholar] [CrossRef]
- Neumann, G.; Kieffer, R.; Ettmayer, P. Uber das System TiC-TiN-TiO. Monatsh. Chem. 1972, 103, 130–1137. [Google Scholar] [CrossRef]
- Fukai, Y. The Metal-Hydrogen System: Basic Bulk Properties; Springer: Berlin/Heidelberg, Germany, 2006; Volume 21, p. 497. [Google Scholar]
- Do, H.; Yen, T.-C.; Chang, L. Stability and etching of titanium oxynitride films in hydrogen microwave plasma. J. Vac. Sci. Technol. A 2013, 31, 041304. [Google Scholar] [CrossRef]


| Morphology | n | Weight % | Atomic % | Mean | Mean | ||||
|---|---|---|---|---|---|---|---|---|---|
| C | N | O | C | N | O | Ti/(N, O, C) | N/(O + C) | ||
| small, low-C | 12 | 0.9 | 17.1 | 6.3 | 2.3 | 37.4 | 12.1 | 0.93 | 3.3 |
| small, high-C | 11 | 5.4 | 13.7 | 5.1 | 13.3 | 29.2 | 9.6 | 0.92 | 1.4 |
| large interstitial | 8 | 0.8 | 15.4 | 9.3 | 2.0 | 33.0 | 17.5 | 0.90 | 1.8 |
| silicate melts | 28 | 0.9 | 15.7 | 8.6 | 2.3 | 34.0 | 16.2 | 0.90 | 2.3 |
| with silicides | 17 | 5.6 | 12.2 | 6.9 | 13.9 | 26.0 | 12.9 | 0.89 | 1.1 |
| void fillings low-C | 5 | 1.3 | 15.0 | 8.6 | 2.7 | 33.0 | 16.2 | 0.92 | 2.4 |
| void fillings high-C | 6 | 6.1 | 11.9 | 8.1 | 14.9 | 25.1 | 14.5 | 0.83 | 1.0 |
Publisher’s Note: MDPI stays neutral with regard to jurisdictional claims in published maps and institutional affiliations. |
© 2021 by the authors. Licensee MDPI, Basel, Switzerland. This article is an open access article distributed under the terms and conditions of the Creative Commons Attribution (CC BY) license (https://creativecommons.org/licenses/by/4.0/).
Share and Cite
Griffin, W.L.; Gain, S.E.M.; Saunders, M.; Alard, O.; Shaw, J.; Toledo, V.; O’Reilly, S.Y. Nitrogen under Super-Reducing Conditions: Ti Oxynitride Melts in Xenolithic Corundum Aggregates from Mt Carmel (N. Israel). Minerals 2021, 11, 780. https://doi.org/10.3390/min11070780
Griffin WL, Gain SEM, Saunders M, Alard O, Shaw J, Toledo V, O’Reilly SY. Nitrogen under Super-Reducing Conditions: Ti Oxynitride Melts in Xenolithic Corundum Aggregates from Mt Carmel (N. Israel). Minerals. 2021; 11(7):780. https://doi.org/10.3390/min11070780
Chicago/Turabian StyleGriffin, William L., Sarah E. M. Gain, Martin Saunders, Olivier Alard, Jeremy Shaw, Vered Toledo, and Suzanne Y. O’Reilly. 2021. "Nitrogen under Super-Reducing Conditions: Ti Oxynitride Melts in Xenolithic Corundum Aggregates from Mt Carmel (N. Israel)" Minerals 11, no. 7: 780. https://doi.org/10.3390/min11070780