Article

Geological Mapping Using Drone-Based Photogrammetry: An Application for Exploration of Vein-Type Cu Mineralization

1
Department of Ecology, Institute of Science and High Technology and Environmental Sciences, Graduate University of Advanced Technology, Kerman 7631818356, Iran
2
Department of Mining Engineering, Faculty of Engineering, Vali-e-Asr University of Rafsanjan, Rafsanjan 7718897111, Iran
*
Authors to whom correspondence should be addressed.
Minerals 2021, 11(6), 585; https://doi.org/10.3390/min11060585
Submission received: 14 April 2021 / Revised: 18 May 2021 / Accepted: 27 May 2021 / Published: 31 May 2021

Abstract

:
In this research, drone-based photogrammetry was utilized for mapping geology with the objective of mineral exploration in the Shahzadeh Abbas Cu deposit, Kerman province, Iran. Cu mineralization is of vein-type and follows geological structures. A low-cost drone was used to collect geological data. A spatial resolution of 3.26 cm was achieved by considering a flight altitude of 70 m. To reach the accuracy of less than 5 cm, 70% lateral and 80% front image overlaps were applied and 220 temporary ground control points (TGCPs) were used in an area of 2.02 km2. TGCPs were accurately positioned using DGPS-RTK measurements. Agisoft PhotoScan software was used for photogrammetric processing. The orthophoto product was performed for outlining geological units through visual interpretation. The digital elevation model (DEM) was converted to a hill-shade model in ArcGIS software to extract the geological structures such as faults and dikes. A draft geology map was prepared using orthophoto and hill-shade images to minimize the time and cost of the subsequent field work. Rock sampling was carried out and Cu-bearing veins were specified through field investigations. The geology map was finalized based on field work data and petrology studies. The geological survey indicated that diabase dikes with a northwest–southeast strike often host Cu mineralization in the study area. The position of Cu-bearing dikes was delineated for the next stage of the exploration program. This research demonstrated the time- and cost-effectiveness of using drone-based photogrammetry for preparing base geology maps for the exploration of vein-type mineralization in far districts with rough topography.

Graphical Abstract

1. Introduction

Remote sensing technology has experienced great advances in the exploration of mineral deposits in recent years. The application of some geoscience sensors such as ASTER, Landsat ETM+/OLI, and Sentinel-2 MSI is common in most mineral exploration campaigns because of their worldwide coverage and free and openly available data [1,2,3]. The study of airborne/spaceborne data is often applied in the initial parts of mineral exploration programs. These studies can be directly focused on mineral mapping using multispectral/hyperspectral imaging instruments such as ASTER and Hyperion [4,5,6,7,8]. Some remotely sensed data such as Landsat ETM+/OLI, Sentinel, SPOT, and IRS can be used for geological and structural mapping [9,10,11,12]. Geology maps are permanently used in various scales from mineral exploration to mine exploitation. Nowadays, precise geology maps can be prepared thanks to high resolution images provided by airborne/spaceborne imagery and the development of image processing techniques. However, the application of aircraft and high-resolution satellite images is mainly limited due to the high cost and unavailability of data. Today, drone photogrammetry is gradually replacing traditional ground-based and conventional aircraft-based mapping, especially in inaccessible areas [13,14].
Drone photogrammetry has opened up a new perspective in aerial surveying for geology and mining purposes. The literature review indicates rapid progress in the use of drones in the mining industry, from mineral exploration to mine exploitation. A semi-automated method was applied for mapping geological faults using an eight-rotor octocopter in Piccaninny Point on the east coast of Tasmania, Australia [15]. Drone-based photogrammetry was used to document rock outcrops in the surface quarry Lehôtka pod Brehmi, Slovakia [16]. Mapping the mine pit and creation of 3D geological models was carried out using a quadcopter in the Penjamon mine, Malaysia [17]. This study demonstrated the application of inexpensive drones in mining and mineral exploration. Unmanned aerial systems (UAS) can offer a low-cost and easy-to-use method for supporting open-pit mining and restoration monitoring [18,19]. UAS imagery accomplished the monitoring of opencast mining restoration with accurate spatial and thematic information in an active calcareous sandstone quarry located in central Catalonia, Spain [18]. A combination of ground- and drone-based photogrammetry and hyperspectral VNIR, SWIR, and LWIR imaging was employed to obtain more efficient ground surveys in the Naundorf quarry in the Freiberg mining district, Saxony (Germany) [20]. Magnetometry survey and hyperspectral imaging were carried out using multi-sensor drones in two mining areas of Central Finland [14]. Results showed that multi-copters with lower altitude and speed provide higher resolution data compared to fixed-wing UAS. Fixed-wing UAS with higher height and speed has longer endurance, so covers larger areas in a short time. A fixed-wing unmanned aerial vehicle (UAV) and two quadcopters were utilized to establish drone-based 3D outcrop models in the Aptian carbonate platform to basin transition of the Maestrat Basin (Spain) [21]. This research showed the application of combining 3D outcrop models with field data for reservoir modeling in oil and gas exploration and production. Drone-based photogrammetry specified the acidic dikes associated with gold deposits in the Beishan area of Gansu, China [22]. An unmanned aircraft was used to evaluate the stability of artificial slopes of the Laže 1 quarry in Slovenia [23]. Topographic modeling and structural geological mapping of a limestone quarry were accomplished using UAVs in combination with terrestrial laser scanning in southern Hungary [24].
The Kerman Cenozoic magmatic belt (KCMB) hosts several well-known Cu deposits of Iran such as Sar Cheshmeh, Meiduk, and Darrehzar [25,26,27]. Porphyry- and vein-type Cu mineralization are widespread in the KCMB. Porphyry Cu deposits are discoverable due to their large hydrothermal alteration halos through remote sensing studies [2,6,28,29]. Vein-type Cu mineralization is geologically controlled by faults and fractures that present no noticeable spectral features for conducting remote sensing investigations. Thus, the reconnaissance of favorable geological structures such as faults and joints can increase the chance of succeeding in field work. These structural lineaments can be accurately derived from remotely sensed data to prepare a precise geology map. A geology map with structural details can help find mineralized veins.
This study aims to conduct a large-scale geological mapping using drone-based photogrammetry to facilitate mineral exploration in the Shahzadeh Abbas Cu deposit. Shahzadeh Abbas Cu deposit is situated 28 km east of the large Sar Cheshmeh Cu porphyry mine, Kerman province, Iran. Vein-type Cu mineralization occurs in joints and fractures. The topography of the study area is rough, which causes difficulties for field investigation and geological survey. Thus, drone-based imagery was undertaken to project geological features on a base geology map. In this research, several photogrammetry products are prepared to complete field work data to specify mineralized zones for future studies.

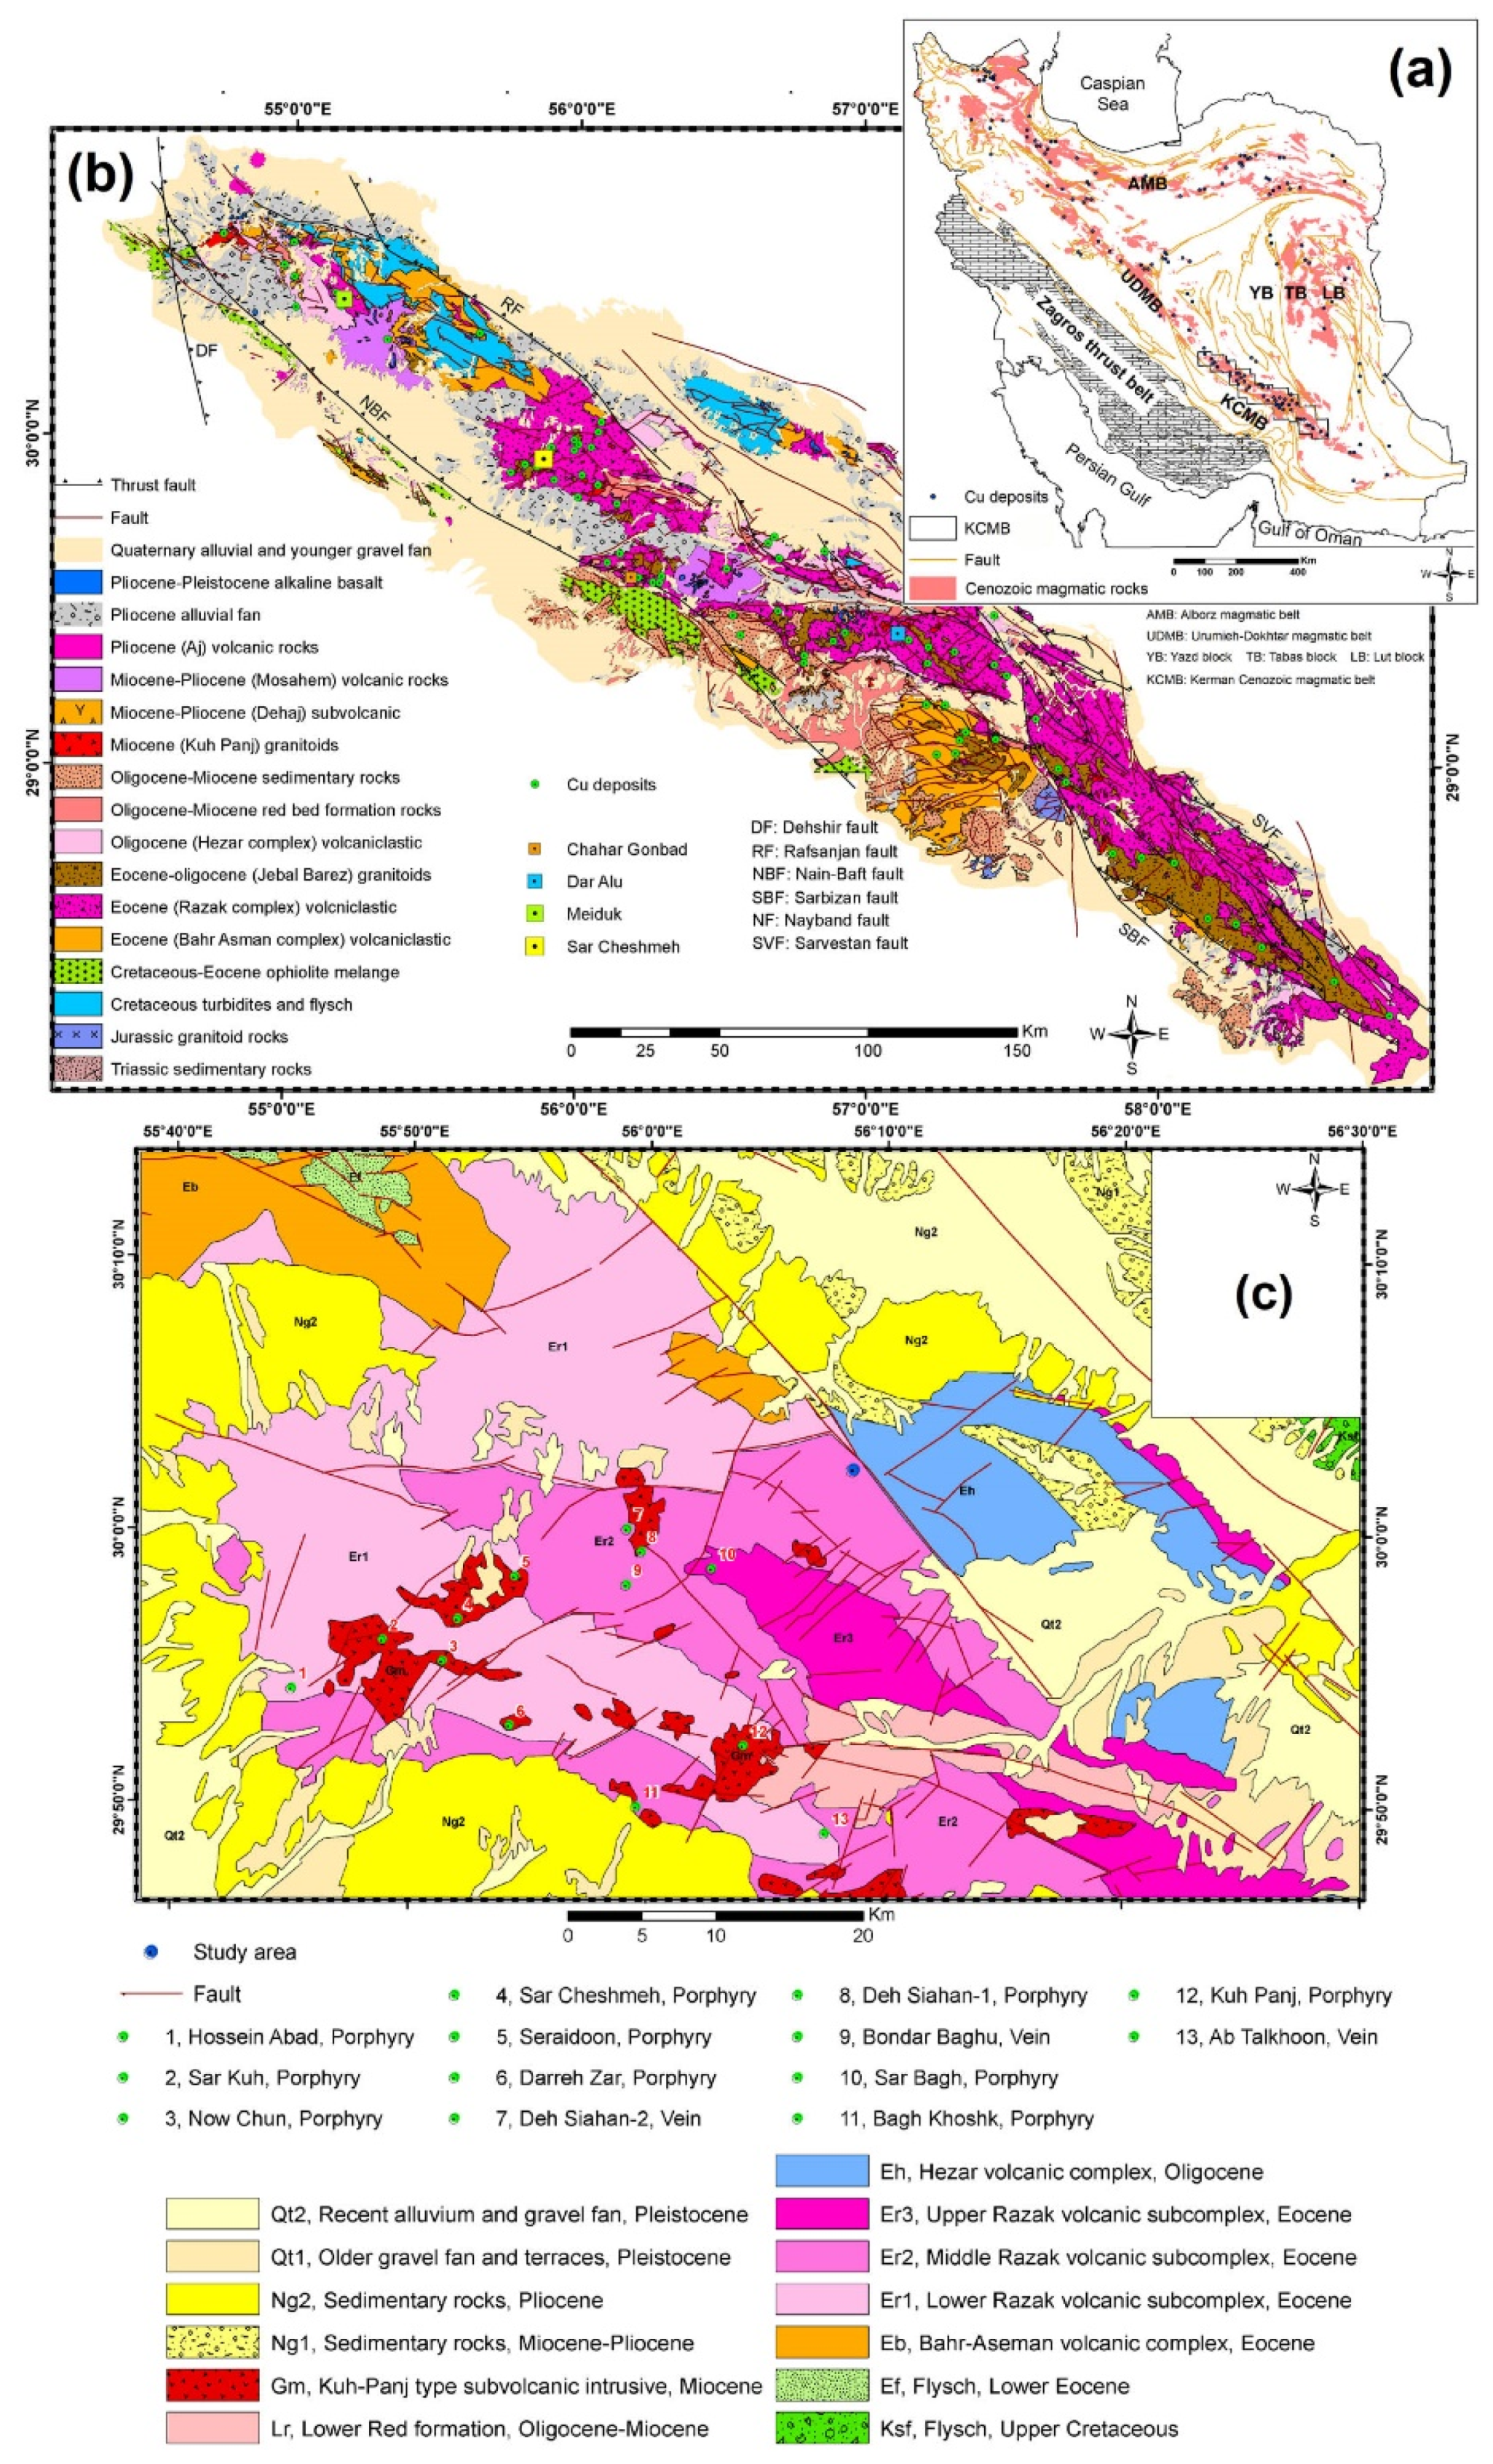
2. Geological Setting

The Shahzadeh Abbas area is situated in the southern part of the Tertiary Urumieh–Dokhtar magmatic belt, in the center of the KCMB. Cu deposits in the KCMB of Iran are genetically related to Miocene porphyries (Figure 1a) [23,24,25]. The porphyries were intruded and emplaced into Eocene volcanic–sedimentary successions to form associated Cu deposits [26,30,31]. The Eocene volcanic–sedimentary rocks involve basalt, andesite, trachyandesite, trachybasalt, rhyolite, agglomerate, tuffs, lava flows, and sedimentary rocks. The Miocene intrusive rocks are granite, granodiorite, diorite, and monzonite. The oldest and youngest exposed rocks are the upper Lower Eocene volcanic rocks and the Quaternary alluvial deposits and gravel fans, respectively. Some well-known Cu deposits are situated in this area (Figure 1b). The study area is located in an Eocene volcanic–sedimentary complex comprised mainly of volcaniclastics, basalt, basaltic andesite, andesite, porphyritic andesite, trachyandesite, and sedimentary rocks (Figure 1c).

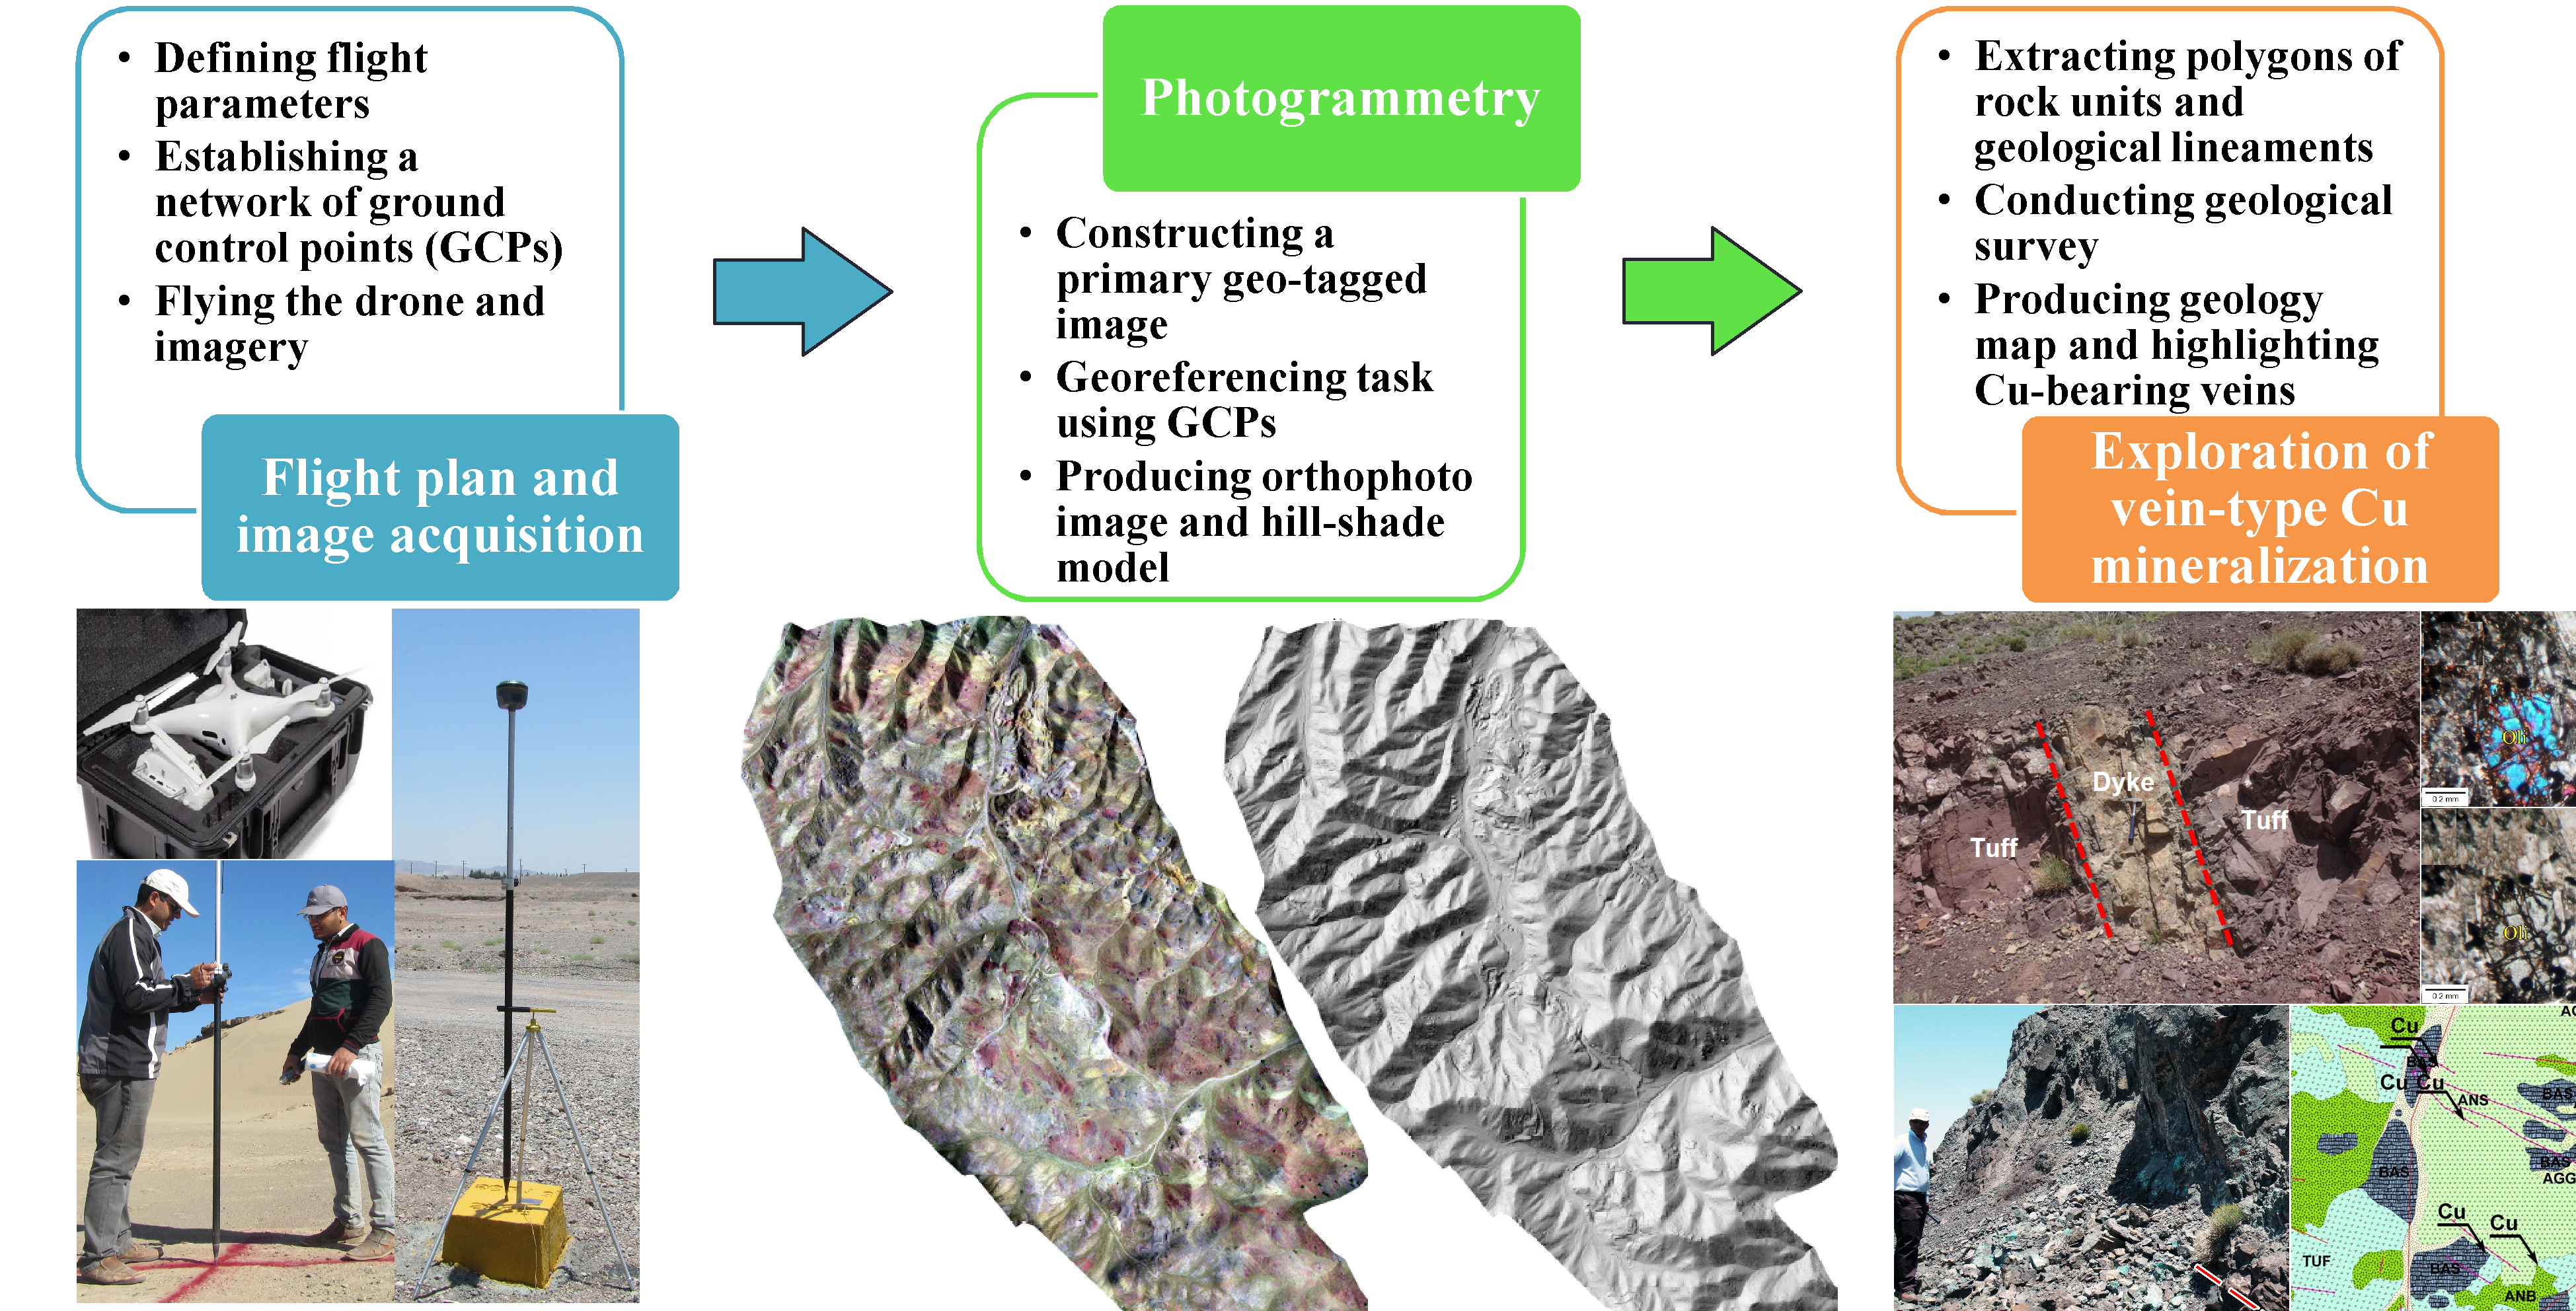
3. Materials and Methods

Geology maps are one of the essential requirements of any mineral exploration campaign. Remotely sensed data are generally used for preparing geology maps. In the case of vein-type mineralization, drone imagery can provide high-resolution images suitable for deriving geological and structural information according to mineral exploration objectives. This research attempts to show the capability of drones for establishing base geology maps for the exploration of vein-type Cu deposits. Five main parts were considered to reach the research target, including (1) setting the flight parameters and flying the drone, (2) acquiring and processing images, (3) creating a draft geology map, (4) performing field work, and (5) finalizing the geology map.

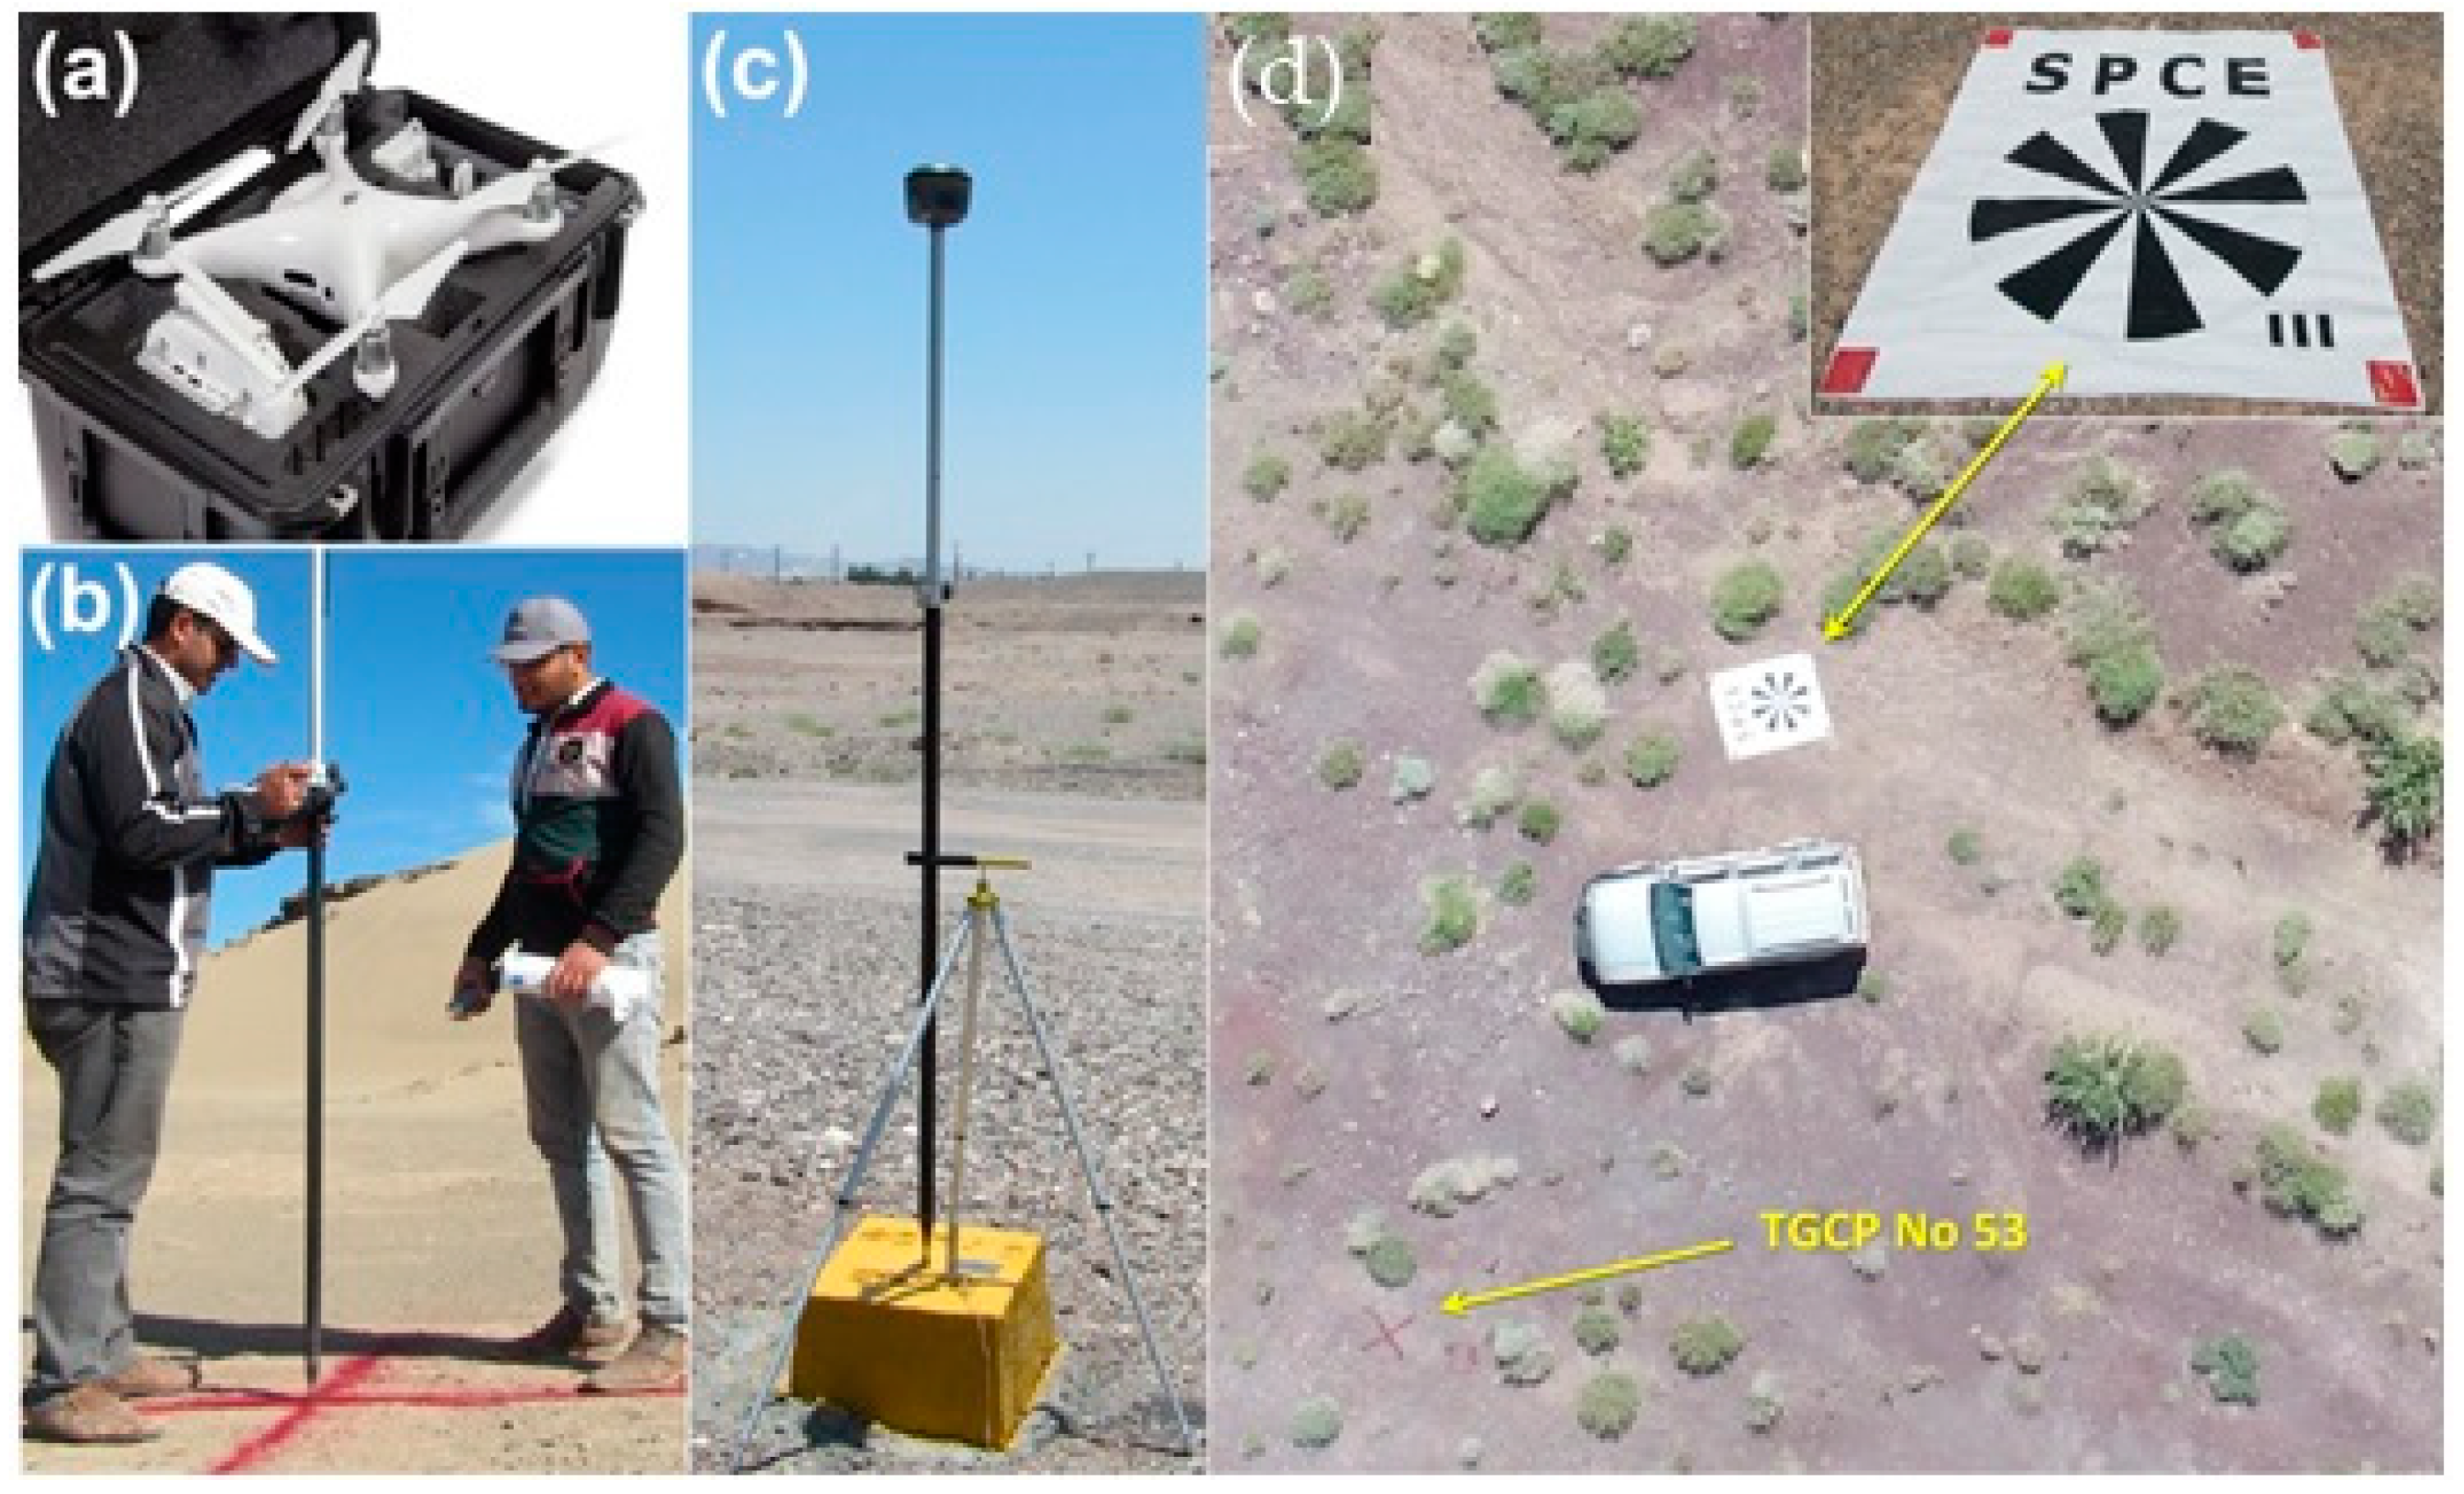
3.1. Platform Type and Flight Settings

Commercial multi-rotor platforms have been successfully used for geological applications [14,15,20]. In this research, a DJI Phantom 4 Pro V2.0 (Da-Jiang Innovations Science & Technology Co., Ltd., Shenzhen, China) was used with its original sensors (Figure 2a). This lightweight quadcopter enables high-resolution imagery with an acceptable time flight to cover more area compared to common heavier hexacopter and octocopter platforms. It carries a built-in 1-inch 20 Megapixels CMOS camera (Da-Jiang Innovations Science & Technology Co., Ltd., Shenzhen, China) on a gimbal. The camera’s lens offers a field of view (FOV) of 84′ with a focal length range of 8.8 mm/24 mm (35 mm format equivalent) and aperture f/2.8–f/11, with autofocus.
The flight path was designed in DJIGo software (v4.0, Da-Jiang Innovations Science & Technology Co., Ltd., Shenzhen, China). A minimum of 70% side and 80% front image overlaps were applied to have an accuracy of less than 5 cm. The flight was performed at an altitude of 70 m (flight speed of 72 kph) to meet a spatial resolution of less than 10 cm. The other flight settings were carried out using the DroneDeploy application (v2.66, Infatics Inc., Santa Clara, CA, USA).

3.2. Data Acquisition and Analysis

The built-in GPS of the DJI Phantom 4 Pro V2.0 helps to geo-tag the acquired images for general applications. However, a grid of temporary ground control points (TGCPs) or markers is necessary to improve the accuracy of geometrical corrections. An accuracy of less than 5 cm was aimed for geological mapping. Accordingly, 220 TGCPs were considered to ascertain the accuracy requirements. TGCPs were marked in the form of red color crosses on the ground surface (Figure 2b). They were accurately positioned using a ground-based real-time kinematic–differential global positioning system (RTK-DGPS) from the SOUTH Galaxy receiver (G1+, South group, Guangzhou, China) (Figure 2c). Besides, five checkpoints with known coordinates were considered to estimate the overall accuracy of the orthomosaic image of the whole area. Several types of calibration targets, namely bar target, Slanted Edge Test, and Siemens star are generally performed to assess the spatial resolution of UAVs. The Siemens star enables the spatial resolution to be measured in all directions for the flight path of the UAV [32]. A Siemens star target on a flat surface was used to determine the spatial resolution of the CMOS camera (Figure 2d) [32,33].
The number of acquired images is a function of the area size and image overlap. After the aerial survey, Agisoft PhotoScan software (v1.4.4, Agisoft LLC, Saint Petersburg, Russia) was applied for photogrammetric processing. Essential data including discrete images and camera locations were loaded from the drone to the software to initialize the photogrammetry procedure. The World Geodetic System 1984 (WGS84) was selected as the datum. Camera locations and matching points were used to align images and establish a sparse point cloud model. The model includes a set of aligned discrete images and must be converted to a georeferenced dense-point cloud model.
Several methods are available for satisfying the georeferencing task such as direct georeferencing using the onboard raw GNSS (GNSSNAV) data, direct georeferencing using Post-Processed Kinematic single-frequency carrier-phase without in situ ground support, direct georeferencing using Post-Processed Kinematic double-frequency carrier-phase GNSS data with in situ ground support, and indirect georeferencing using Ground Control Points (GCPs) [34]. Although the application of indirect georeferencing using GCPs needs time-consuming intense field work, it offers the most accurate solution [34]. After constructing the sparse point cloud model, the georeferencing task was performed using 220 TGCPs. As a result, a dense point-cloud model was built in the next step. A dense point-cloud model is a single display of all acquired images that are connected based on calculating the depth information for each camera location. The mesh and digital elevation (DEM) models are normally built from the dense-point cloud model. The mesh model that is a display of surface and/or volume of objects was reconstructed. Both the mesh and DEM models can be used to build the orthophoto image (Orthomosaic).

3.3. Geology Map Preparation

Geology maps with as many details as possible can increase the efficiency of mineral exploration programs. Drone-based imagery provides worthy information for the instantaneous discrimination of lithology before undertaking the geological survey. Thus, a draft (first edition) geology map can be prepared based on photogrammetry products to save the time and cost of the field work. If the drone is equipped with a multispectral or hyperspectral sensor, mineral mapping can be carried out in addition to lithological mapping [20].
Minerals and rocks usually exhibit spectral features in the short wavelength infrared (SWIR) region of the electromagnetic spectrum [4,5,8,9]. Visible bands cannot offer vital information for discriminating rock and minerals. The CMOS camera of DJI Phantom 4 Pro V2.0 provides RGB images that are not released as individual blue, green, and red bands. This shortcoming makes it impossible to apply image processing methods, but these high-resolution images can be applied for geological and structural mapping [15,16,22,24].
The visual interpretation of images can be performed based on the color changes of rock units and can lead to the primary discrimination of lithology in the study area. Therefore, the first edition of the geology map (draft geology map) can be produced. The accuracy of the draft geology map depends on the experience of the image interpreter(s). High resolution images can also be utilized for extracting lineament features from photogrammetric products. The draft geology map is finalized after conducting field work but it can be applied to plan the subsequent geological survey.
In this research, the orthophoto image was created using the mesh model for providing the draft geology map. The orthophoto image was loaded into ArcGIS software (v10.7, Environmental Systems Research Institute-Esri, Redlands, CA, USA) to establish the draft geology map of the study area. Primary polygons of geological units were created based on visual interpretation of the orthophoto image. These polygons were edited and finalized after conducting the field work. Since mineralized veins are controlled by lineament features such as faults and dikes, surveying the geological structures is vital for the exploration of vein-type Cu mineralization in the Shahzadeh Abbas deposit. Thus, a hill-shade model was created from the DEM model in the ArcGIS software and was applied for the extraction of lineament features.

3.4. Field Data Collection

Field investigation and laboratory studies are essential parts of a mineral exploration program. A geological survey was undertaken considering the draft geology map. Rock samples were gathered from predefined locations to verify the lithology and to check the possible mineralized zones. Thin section studies were performed to specify rock types. Finally, field work data and ground truth were used to finalize the geology map of the study area.

4. Results and Discussion

4.1. Mineralization Type and Exploration Key

The Shahzadeh Abbas deposit is situated on the KCMB. The region has been influenced by magmatic evolutions in Eocene. Plutonic rocks are responsible for forming porphyry and/or vein-type Cu mineralization. Faults and fractures made a fair medium for the circulation of hydrothermal fluids and facilitated the distribution of Cu mineralization. The vein-type Cu mineralization has occurred in the Shahzadeh Abbas deposit. Therefore, determining the exact location of lineament features such as faults, joints, and dikes can assist the identification of mineralized zones in the rough topography of the study area.

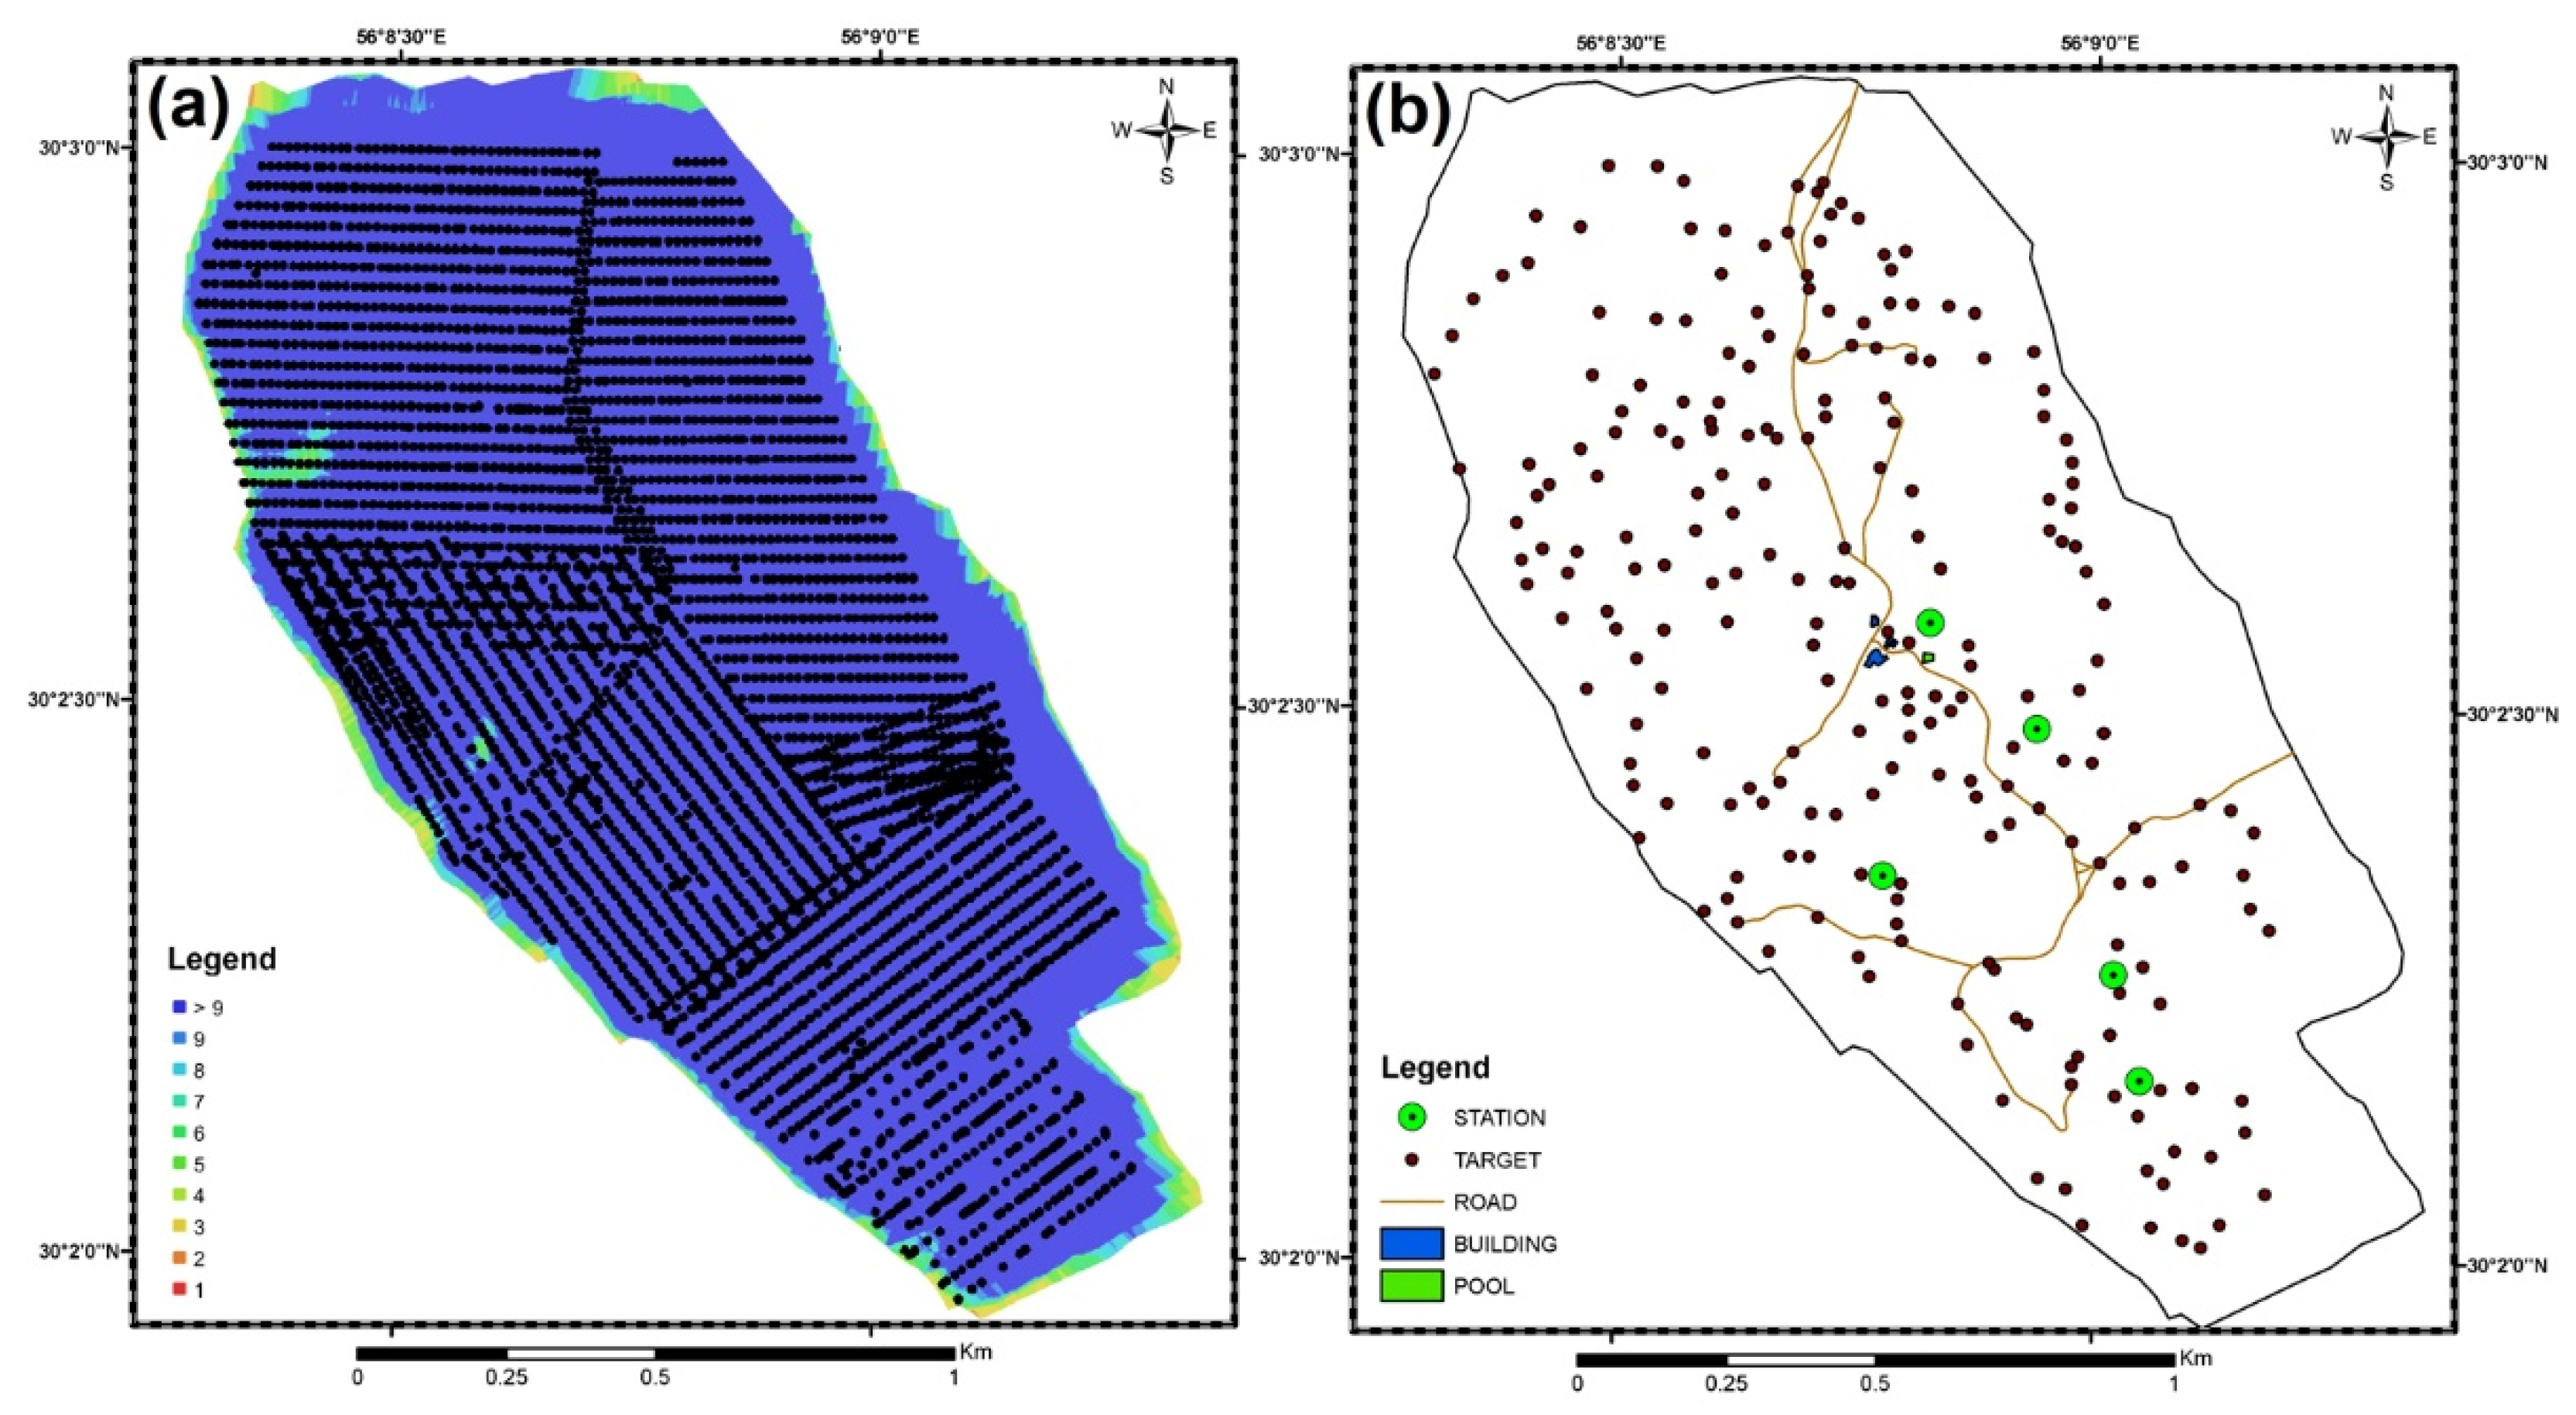
4.2. Achievements of Flight Settings

Reducing flight altitude is essential to increase the spatial resolution for the accurate determination of geological boundaries and position of faults. However, it increases the time of aerial survey and image processing procedure. The higher image resolution of UAVs compared to satellite images can lead to more accurate structural information being derived [15,20,35,36,37]. The flight was performed at an altitude of 70 m. Therefore, the spatial resolution of 3.26 cm was calculated using the Siemens star target. This spatial resolution satisfied the required accuracy for outlining the lithology and especially geological lineaments. Flight lines were designed to have 70% lateral and 80% front overlaps. In Figure 3a, the blue color demonstrates the area with excellent image overlap. Therefore, a perfect image overlap with no gap was achieved in an area of 2.02 km2. About 4018 images were acquired to build the dense-point cloud model. Georeferencing the dense-point cloud model was accomplished using 220 TGCPs (about one TGCP per hectare). Figure 3b exhibits the distribution of TGCPs in the study area. A root mean square error (RMSE) of 2.91 cm was measured for the TGCPs. The RMSE of 3.96 cm was obtained for five checkpoints that satisfied the required accuracy of less than 5 cm for the orthophoto (orthomosaic) image.

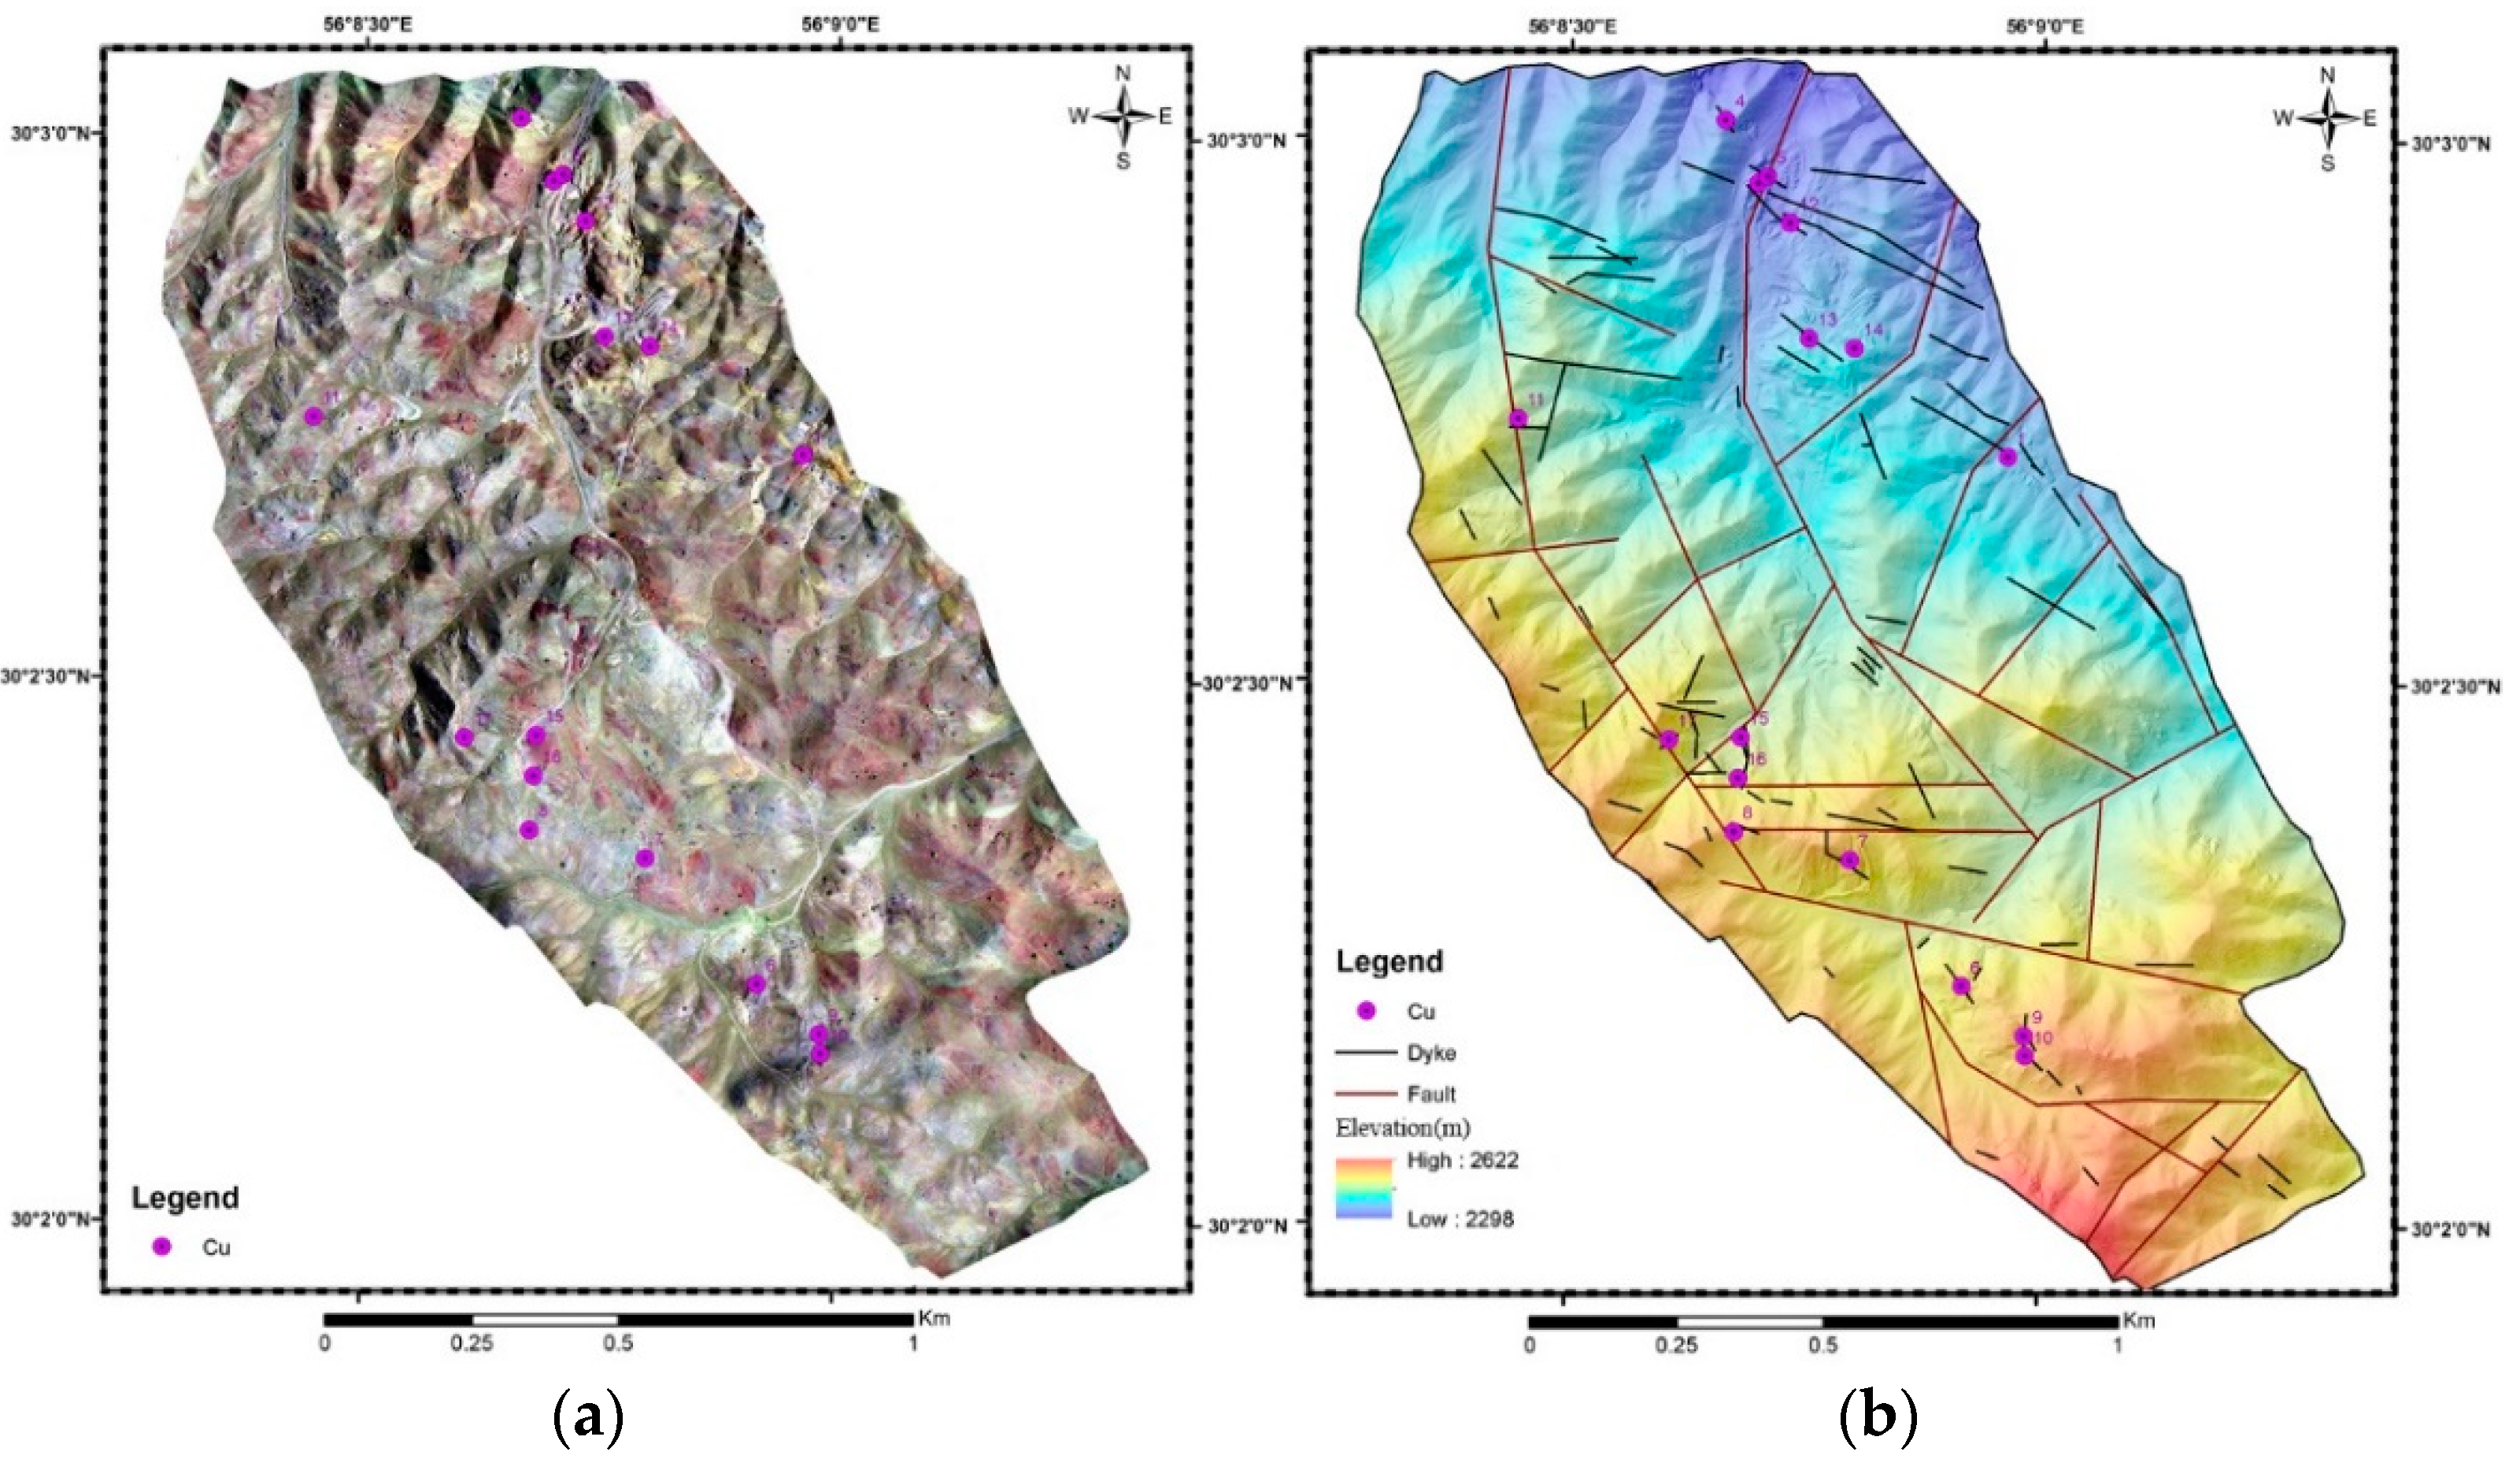
4.3. Analysis of Orthophoto Map and Hill-Shade Model

CMOS camera of DJI Phantom 4 Pro V2.0 is an RGB sensor. The camera acquires RGB images that are comparable with true color composites (TCCs) of Landsat ETM+/OLI or Sentinel. TCCs of medium resolution spaceborne sensors are used for geological mapping but the higher resolution of the CMOS camera helped to outline geological features more accurately.
The orthophoto image, which was derived from dense point-cloud, is presented in Figure 4a. The image provides a useful insight into the lithology of the study area. Rock units were specified based on their color differences. Geology boundaries were delineated thanks to the high resolution of the image. Primary polygons of rock units were drawn using ArcGIS software. The hill-shade image was utilized to extract lineament structures for detecting vein-type mineralization. The structural layer of the draft geology map was prepared using ArcGIS software. Figure 4b shows the location of structural features in the study area. To finalize the geology map, a geological survey was conducted. Considering the draft geology map, the situation of rock samples was defined based on a time and cost-effective plan to accomplish the field work.

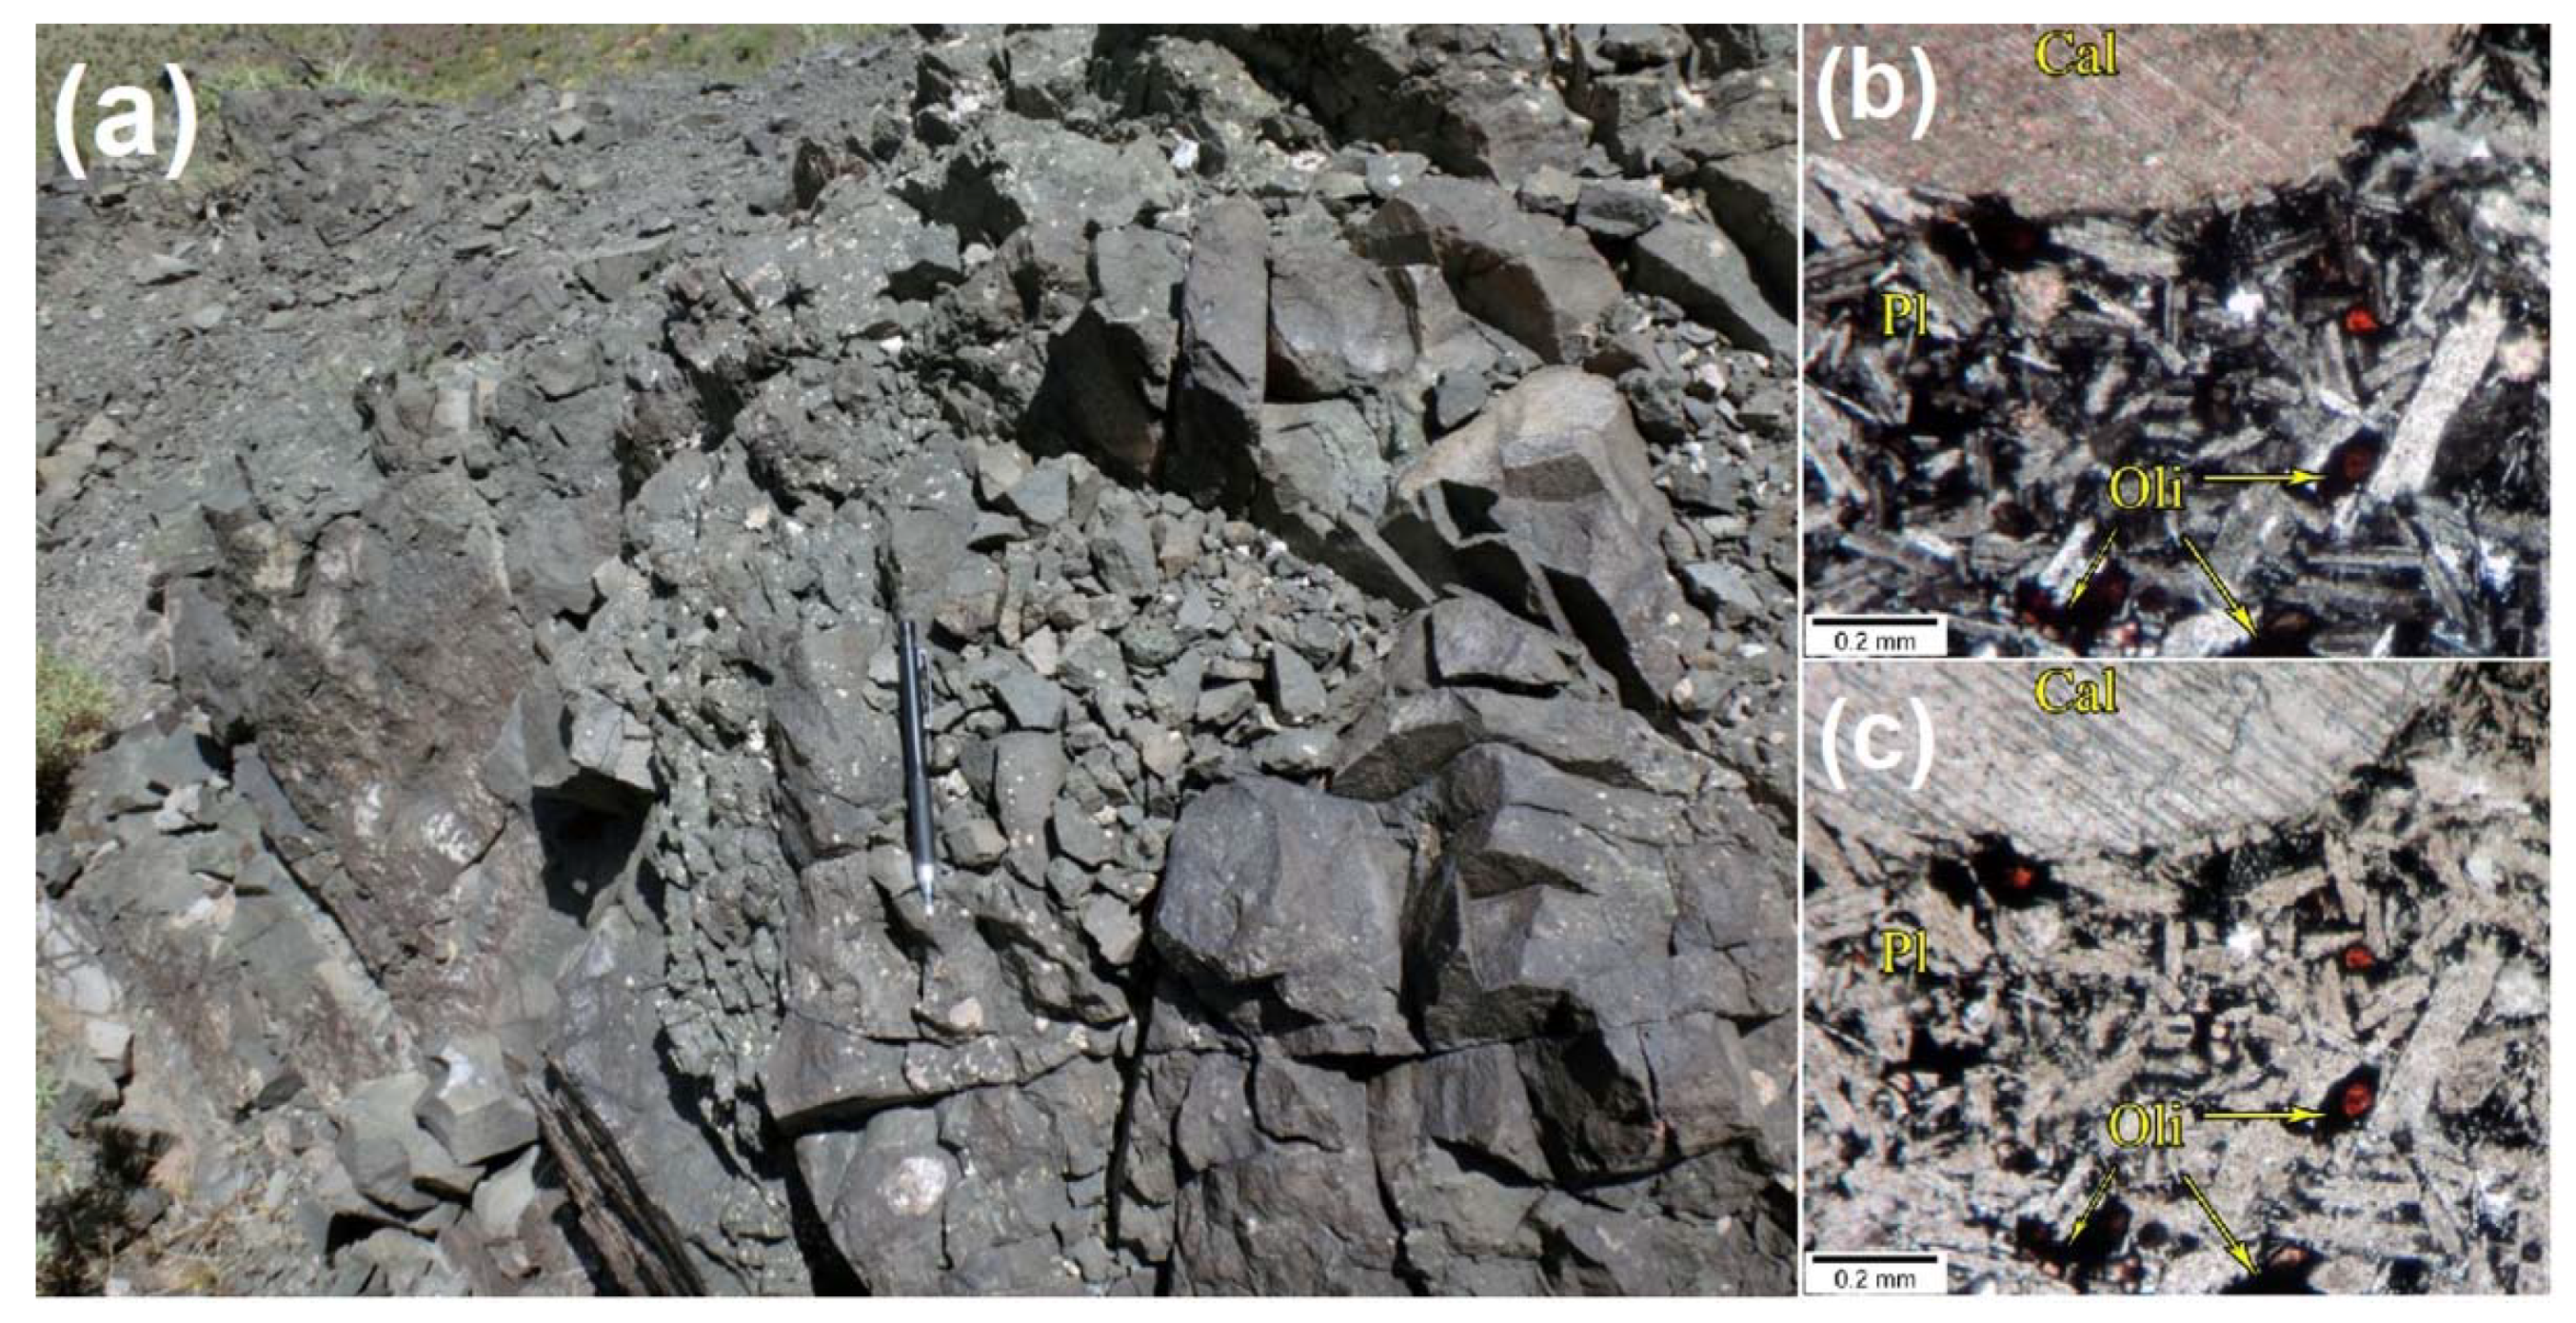
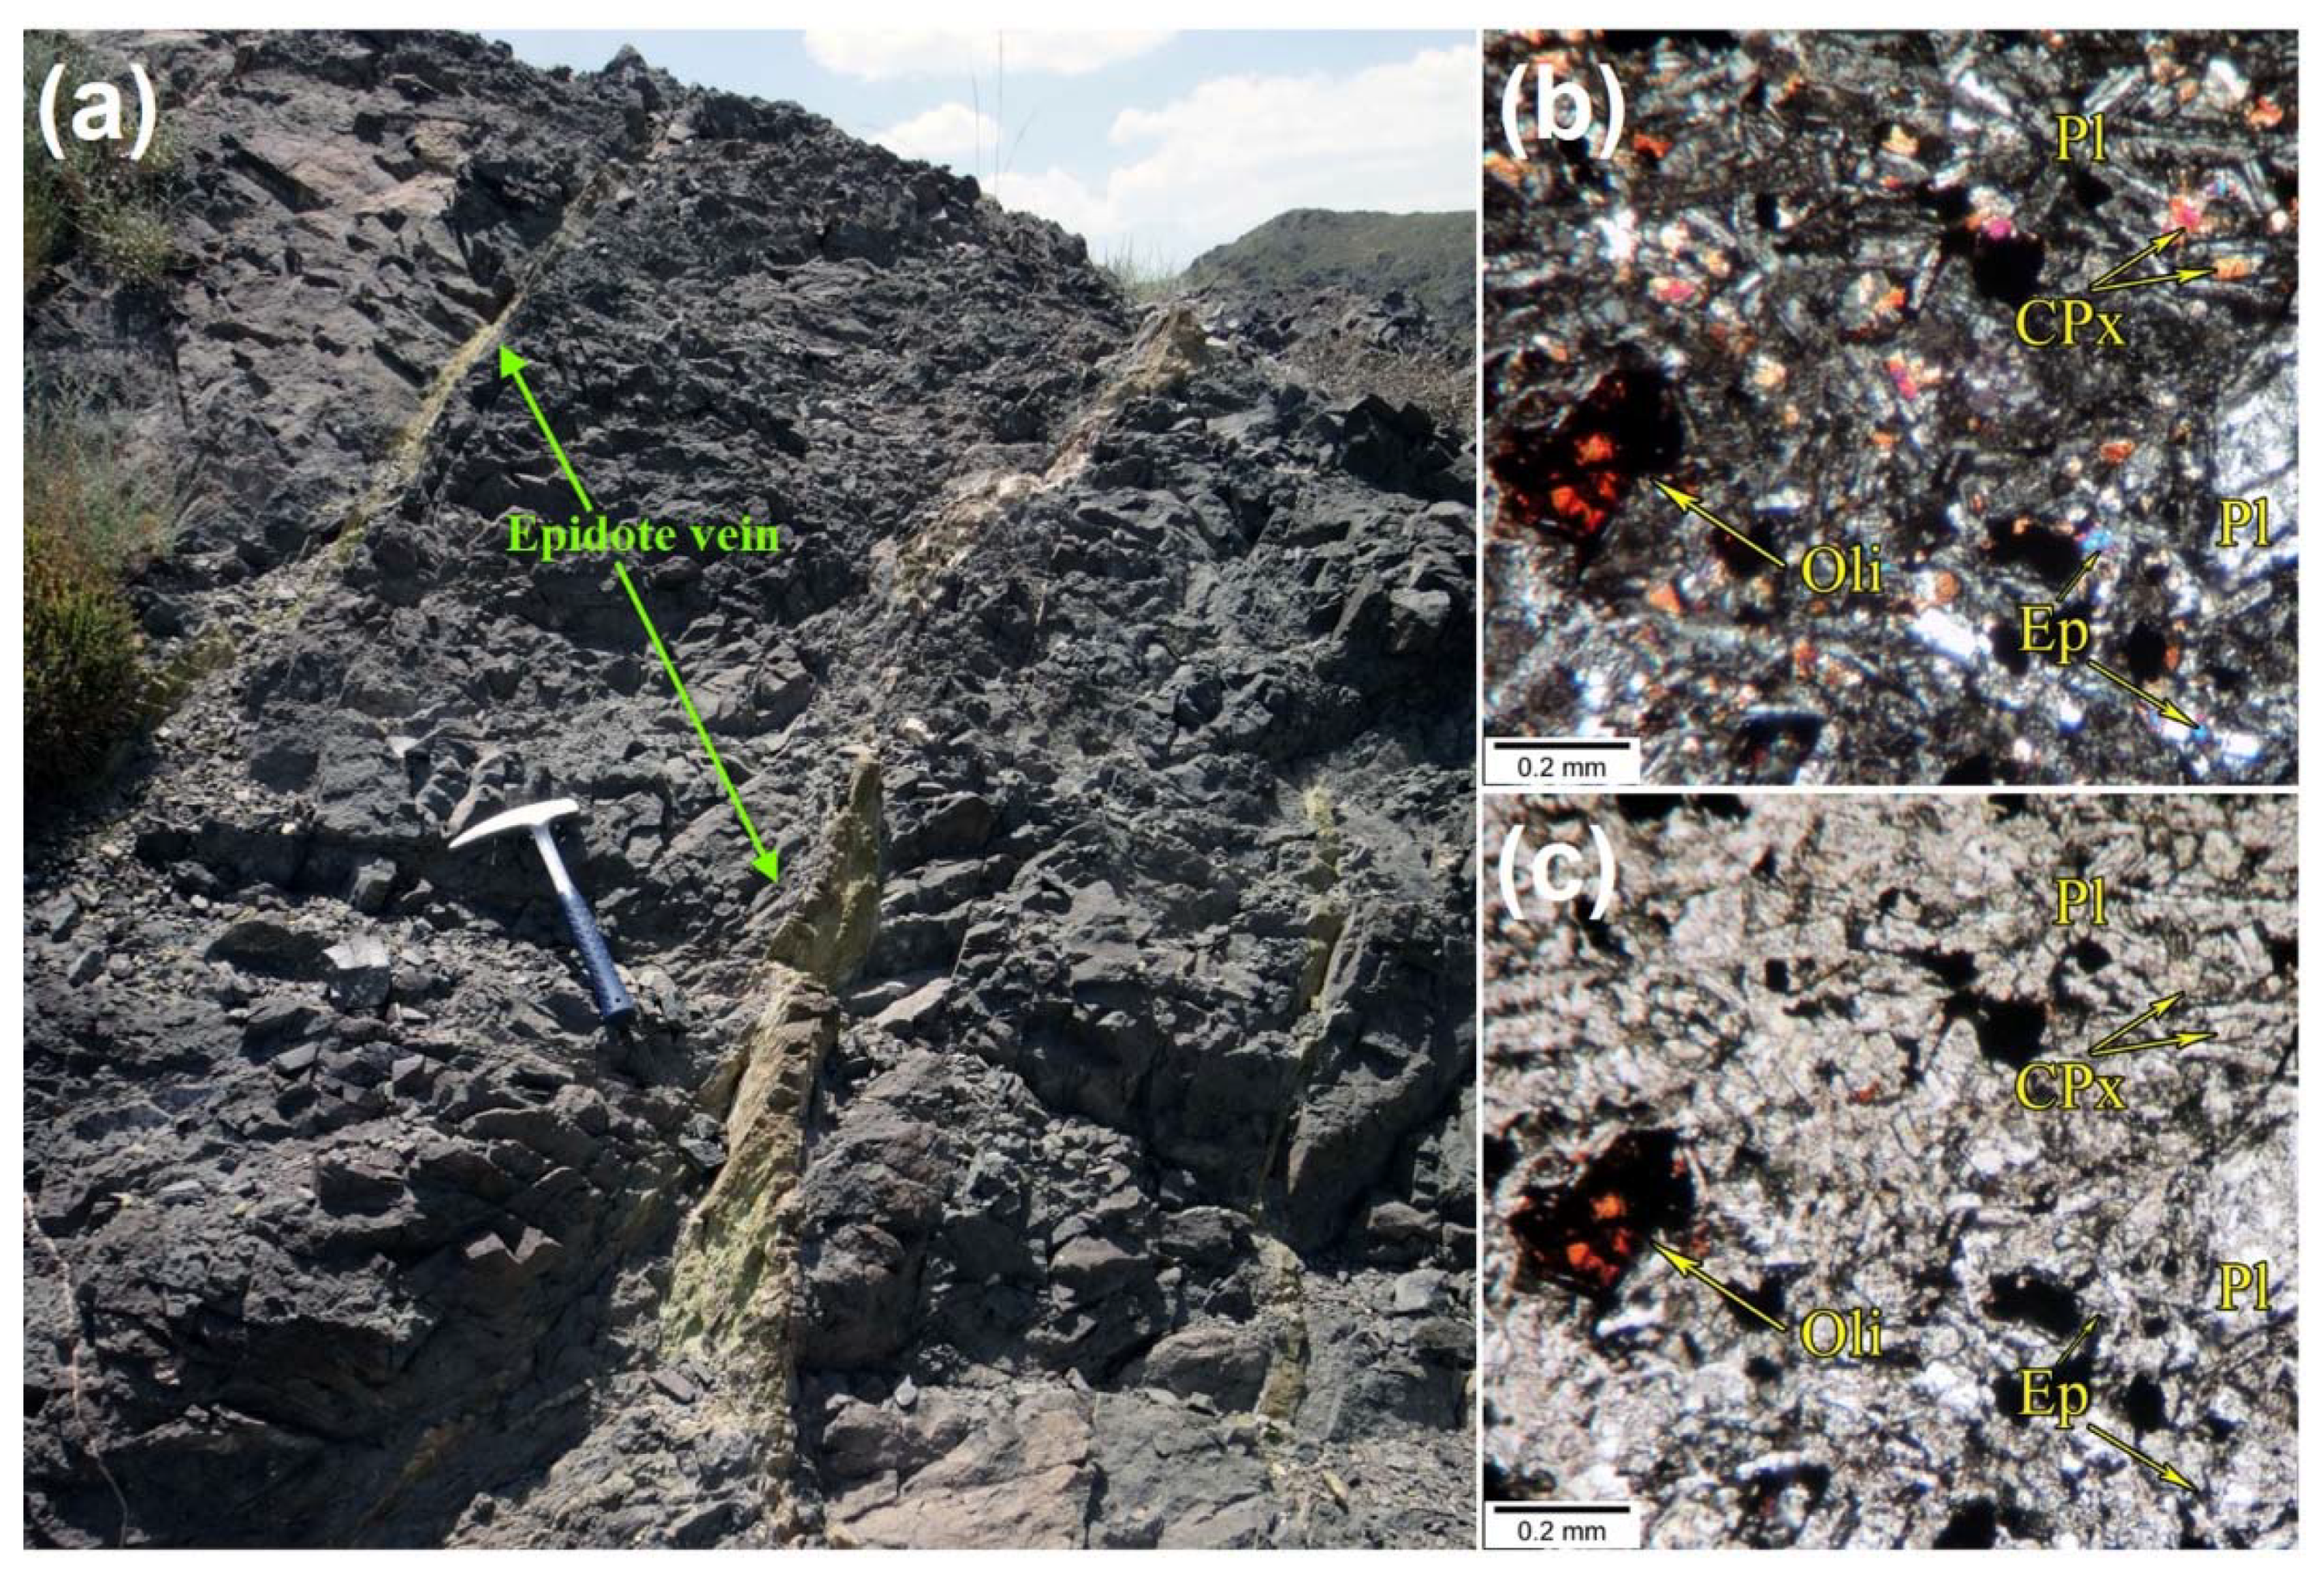
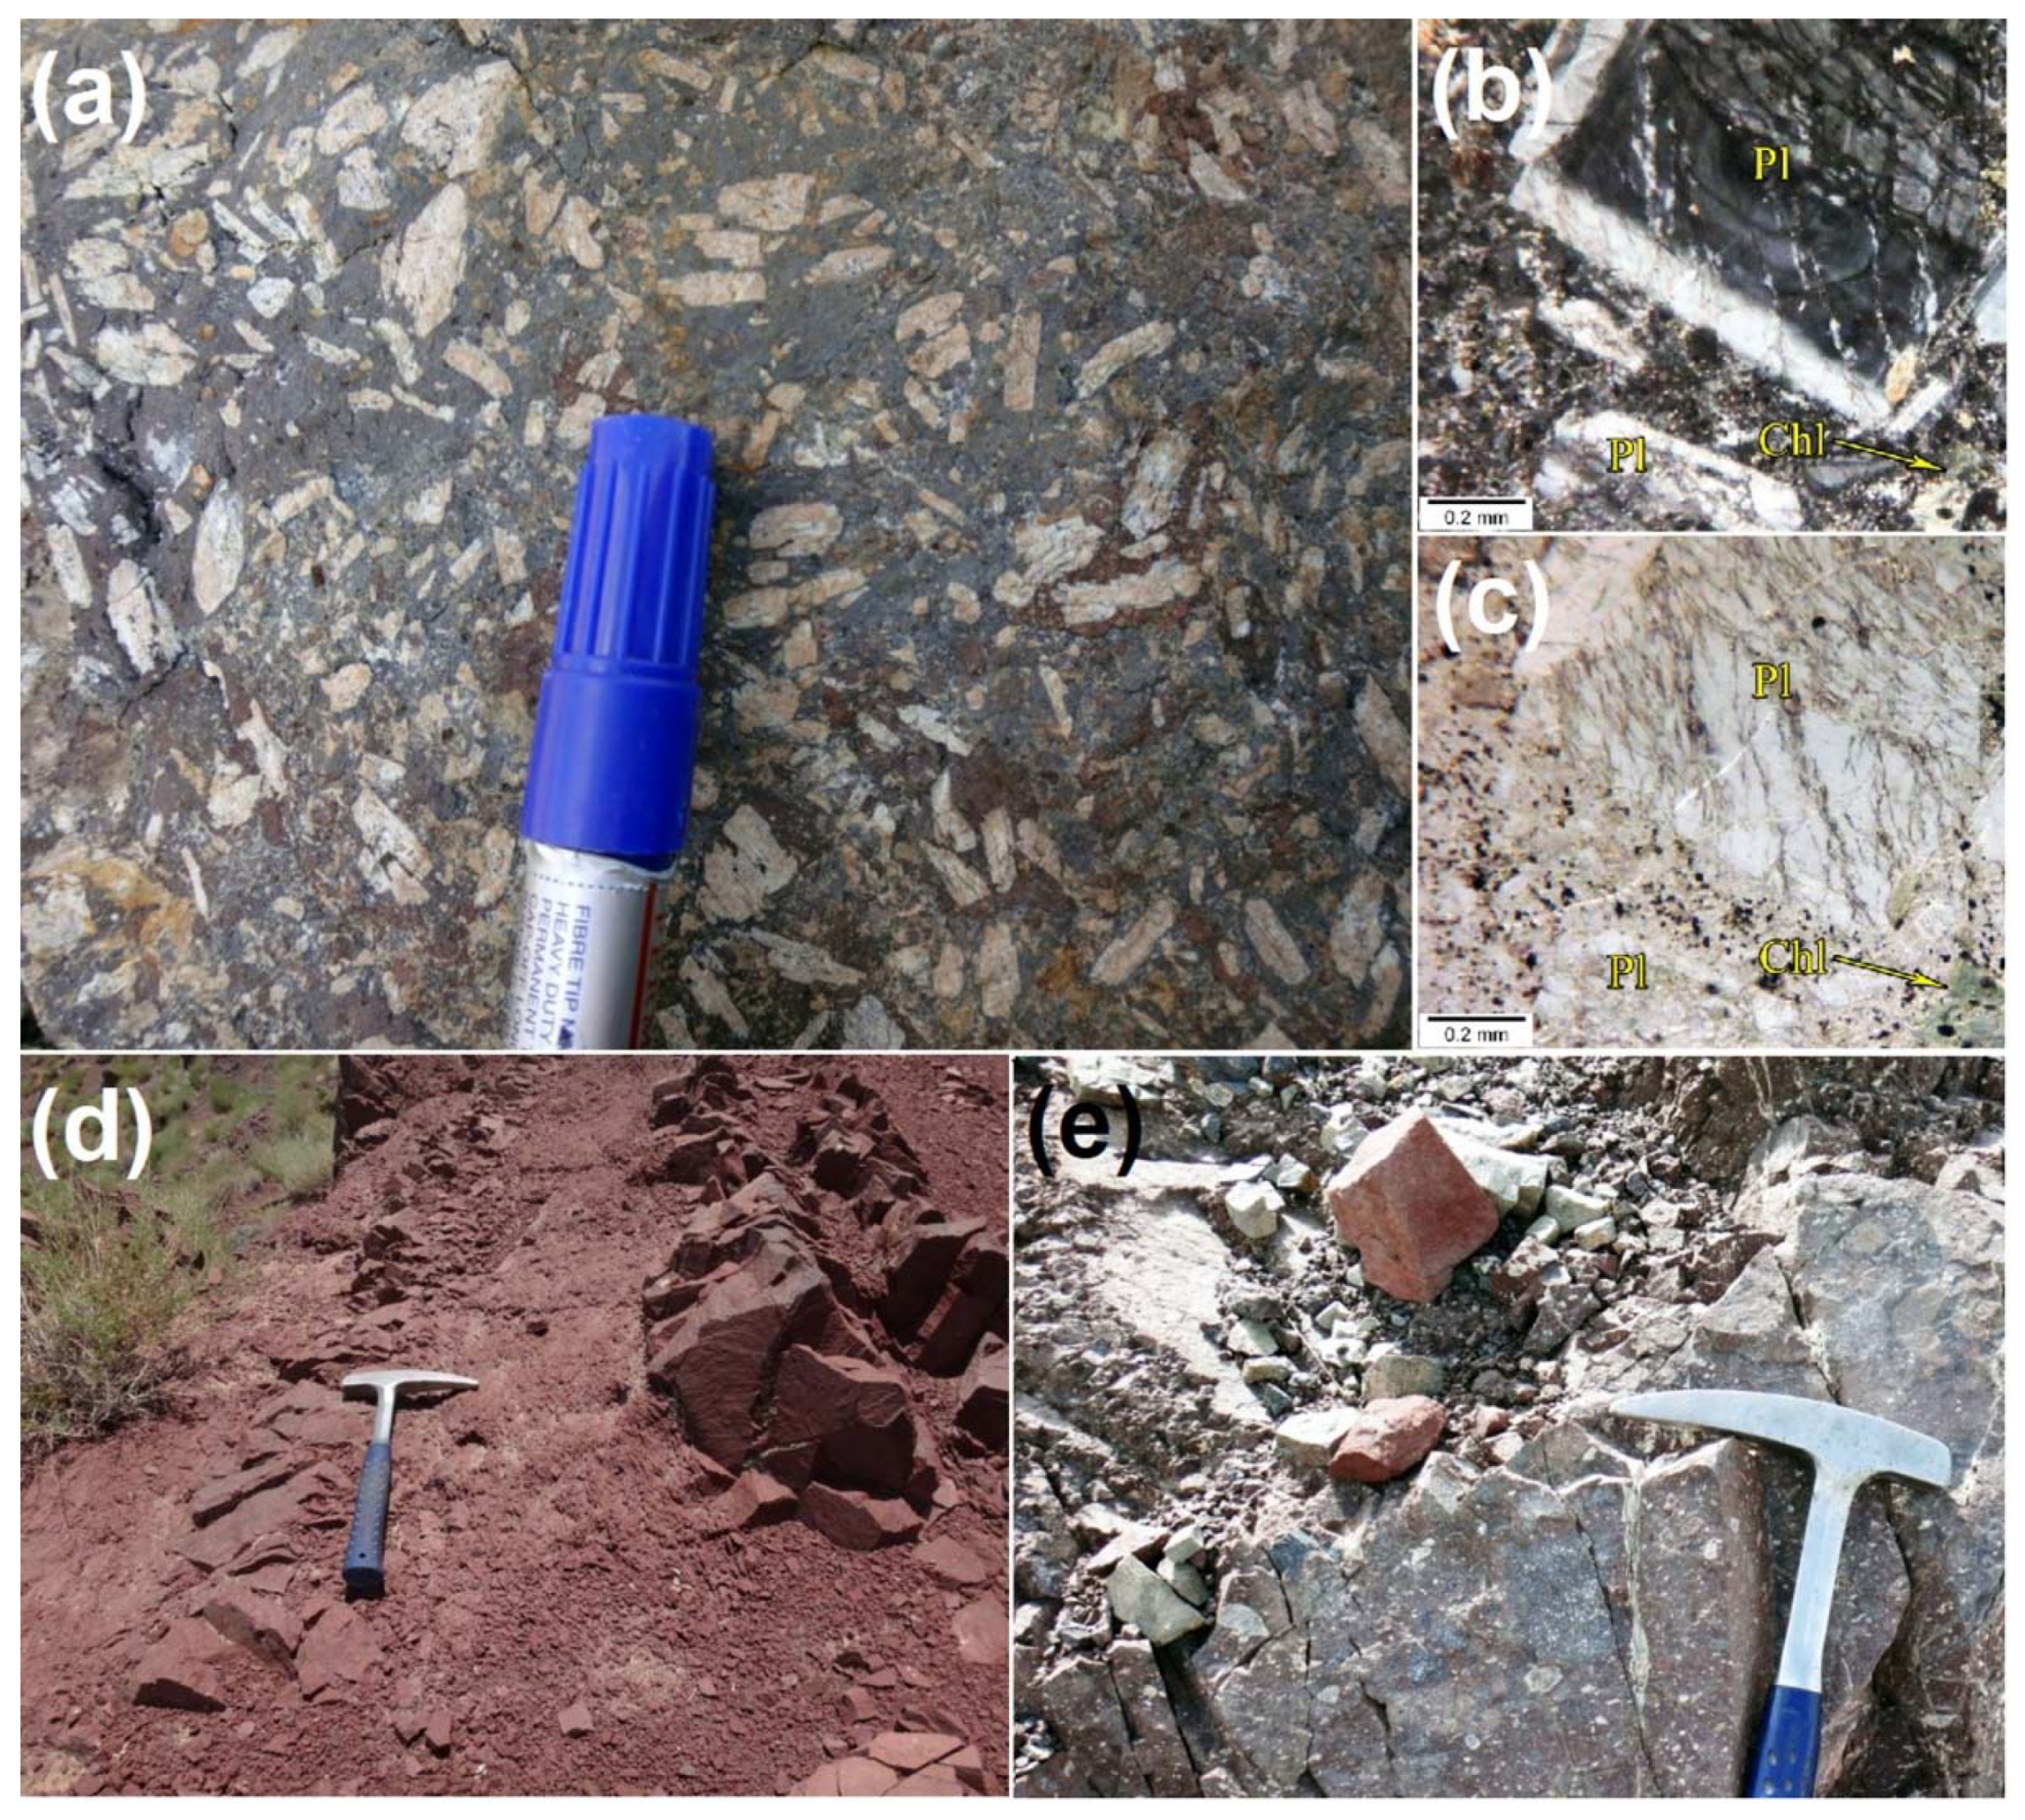
4.4. Field Work and Finalizing the Geology Map

Various outcrops of igneous rocks (e.g., andesite, porphyry andesite, basaltic andesite, and basalt), pyroclastic rocks (e.g., crystal tuff, lapilli tuff, lithic tuff, and agglomerate), and sedimentary rocks such as fossilized limestone were observed during the geological survey. Dikes with different thicknesses can also be seen in the study area, which are the only outcrops of intruded rocks.
Igneous rocks include basalt, basaltic andesitic, and andesite belonging to Eocene volcanic activities. These rocks have generally undergone propylitic alteration. Basalt is generally black–brown; the freshly broken surface appears grey to black (Figure 5a). Pores are often filled by secondary minerals such as calcite and quartz. Olivine, pyroxene, and plagioclase are seen in thin sections (Figure 5b,c).
Basaltic andesite shows a porphyritic texture with a very fine to glassy groundmass. They are burnt brown to purple in weathered surface and the color of the freshly broken surface is gray to dark gray (Figure 6a). The main minerals are pyroxene, olivine, and plagioclase (Figure 6b,c). Rocks are intensively fractured. Fractures may be filled with veins containing calcite, epidote, quartz, or iron oxide. Weak Cu mineralization is seen in some epidote veins but probably has no economic importance (Figure 6a).
Andesite is the most common igneous rock in the study area. This rock is sometimes seen with a porphyritic texture and fine-grained groundmass (Figure 7a). Weathered and freshly broken surfaces are brown–pale green and gray, respectively. The main minerals are feldspar (especially plagioclase) and less pyroxene (Figure 7b,c). Manganese and iron oxide dendrites are sometimes found on the rock surface.
A variety of tuffs as well as agglomerate form the pyroclastic unit. The tuffs are light gray and light purple on the freshly broken surface, while on the weathered surface they are brown to red (Figure 7d). The main minerals are plagioclase and quartz. Agglomerates are mainly composed of different types of lavas (mainly andesitic lavas) that are cemented by volcanic ash (Figure 7e).
Secondary intrusive phases in the form of dikes are responsible for vein-type Cu mineralization in the study area. The general trend of the dikes is northwest–southeast and they are mostly of gabbro–diorite porphyry type. Gabbro–diorite porphyry dikes have a fine-grained groundmass and are light green to yellow on the weathered surface (Figure 8a). The color of the freshly broken surface is greenish-gray. Plagioclase, pyroxene, and olivine are the main minerals (Figure 8b,c). These dikes usually show no Cu mineralization.
Field observation shows Cu mineralization has often occurred in the diabase dikes (Figure 8d). Diabase dikes (trachybasalt porphyry) are generally darker than gabbro–diorite porphyry dikes. These dikes are olive-green to dark brown and the color of the freshly broken surface is dark green to black (Figure 8d). These rocks are generally composed of fine-grained plagioclase with porphyroids of alkali feldspars (Figure 8e,f).
Figure 3b shows the location of lineament features such as dikes in the rough topography of the study area. The general trend of dikes is northwest–southeast. Diabase dikes follow a similar trend but the northeast–southwest direction is also seen in some locations. The thickness of diabase dikes varies between 0.5 m and 1 m. Some epidote veins with a northwest–southeast strike also exhibit Cu mineralization. These veins may not be economically significant.
Figure 9 shows the geology map of the study area based on aerial photogrammetry and geological surveys. Primary geology polygons that were drawn using the orthophoto image were modified based on field work data. Dikes with Cu mineralization were marked on the geology map for the next steps of the mineral exploration program (Figure 9). Based on the finalized geology map, most Cu-bearing dikes have a northwest–southeast trend. Cu minerals on the surface are seen in the form of malachite (Figure 8d).

5. Conclusions

Remote sensing studies have been successfully used for mineral exploration in recent decades. Geology maps with different scales are prepared in mineral exploration campaigns. High-resolution imagery can be essential for geological studies and the exploration of vein-type Cu deposits, especially in far mountainous areas. Drone-borne imagery has facilitated topography and geology mapping, especially in far regions and difficult terrains. To use drones, flight parameters must be defined depending on surveying purpose(s). Usually, spatial resolution and the accuracy of photogrammetric products are two main factors that must be controlled by setting flight parameters. Flight height and image overlap ensure the desired accuracy and spatial resolution. Providing a precise geology map with appropriate accuracy is essential for the exploration of vein-type Cu mineralization. Vein-type Cu deposits are structurally controlled by faults and fractures with different thicknesses. A spatial resolution of about 5 cm is recommended to delineate structural lineaments. A flight altitude of 70 m should be considered to satisfy this resolution. Orthophoto images and DEM models are two main products of drone photogrammetry that are used for extracting geological units and structures. The orthophoto image is appropriate for outlining the geological units. DEM models must be converted to the hill-shade model for extracting the geological structures such as faults and dikes. Geological structures such as faults and dikes must be verified for finding Cu mineralization through field work. Thus, having the accurate location of structural lineaments is so important to save time and the cost of field work. Accuracy less than 5 cm is suggested for constructing the base geology map. To meet this accuracy, 70% side and 80% front image overlaps with a network of TGCPs should be considered. It is recommended to have at least one TGCP per hectare. These flight settings led to reaching an accuracy of about 3.96 cm in the Shahzadeh Abbas deposit. Vein-type Cu mineralization in the Shahzadeh Abbas deposit has often occurred in diabase dikes. It is proposed to focus on diabase dikes mainly with northwest–southeast orientations in the next stage of the exploration program. Hydrothermal alteration is a widespread geological feature in the KCMB. Detecting various types of alteration is valuable, especially for the exploration of porphyry Cu deposits. Considering the maximum payload of the supposed drone, it is possible to add a sensor with a wider spectral range to enhance alteration zones in the areas with similar geological settings.

Author Contributions

Conceptualization, methodology, software, formal analysis, review and editing, M.H.; conceptualization, methodology, validation, supervision, writing—original draft preparation, H.S. Both authors have read and agreed to the published version of the manuscript.

Funding

This research received no external funding.

Acknowledgments

Surgan Parseh Consulting Engineers (SPCE) provided the logistics for field visits and field data collection.

Conflicts of Interest

The authors declare no conflict of interest.

References

  1. Hu, B.; Xu, Y.; Wan, B.; Wu, X.; Yi, G. Hydrothermally altered mineral mapping using synthetic application of Sentinel-2A MSI, ASTER and Hyperion data in the Duolong area, Tibetan Plateau, China. Ore Geol. Rev. 2018, 101, 384–397. [Google Scholar] [CrossRef]
  2. Abrams, M.; Yamaguchi, Y. Twenty years of ASTER contributions to lithologic mapping and mineral exploration. Remote. Sens. 2019, 11, 1394. [Google Scholar] [CrossRef] [Green Version]
  3. Sekandari, M.; Masoumi, I.; Beiranvand Pour, A.; M Muslim, A.; Rahmani, O.; Hashim, M.; Basem, Z.; Biswajeet, P.; Ankita, M.; Aminpour, S.M. Application of Landsat-8, Sentinel-2, ASTER and WorldView-3 spectral imagery for exploration of carbonate-hosted Pb-Zn deposits in the CENTRAL IRANIAN TERRANE (CIT). Remote. Sens. 2020, 12, 1239. [Google Scholar] [CrossRef] [Green Version]
  4. Hubbard, B.; Crowley, J.; Zimbelman, D. Comparative alteration mineral mapping using visible to shortwave infrared (0.4–2.4 mu m) Hyperion, ALI, and ASTER imagery. IEEE Trans. Geosci. Remote. Sens. 2003, 41, 1401–1410. [Google Scholar] [CrossRef]
  5. Ramos, Y.; Goita, K.; Peloquin, S. Mapping advanced argillic alteration zones with ASTER and Hyperion data in the Andes Mountains of Peru. J. Appl. Remote. Sens. 2016, 10, 026031. [Google Scholar] [CrossRef]
  6. Yousefi, S.J.; Ranjbar, H.; Alirezaei, S.; Dargahi, S.; Lentz, D.R. Comparison of hydrothermal alteration patterns associated with porphyry Cu deposits hosted by granitoids and intermediate-mafic volcanic rocks, Kerman Magmatic Arc, Iran: Application of geological, mineralogical and Remote. sensing data. J. Afr. Earth. Sci. 2018, 142, 112–123. [Google Scholar] [CrossRef]
  7. Hewson, R.; Mshiu, E.; Hecker, C.; Van der Werff, H.; Van Ruitenbeek, F.; Alkema, D.; Van der Meer, F. The application of day and night time ASTER satellite imagery for geothermal and mineral mapping in East Africa. Int. J. Appl. Earth Obs. Geoinf. 2020, 85, 101991. [Google Scholar] [CrossRef]
  8. Shirmard, H.; Farahbakhsh, E.; Pour, A.B.; Muslim, A.M.; Müller, R.D.; Chandra, R. Integration of selective dimensionality reduction techniques for mineral exploration using ASTER satellite data. Remote. Sens. 2020, 12, 1261. [Google Scholar] [CrossRef] [Green Version]
  9. Ahmadirouhani, R.; Karimpour, M.H.; Rahimi, B.; Malekzadeh-Shafaroudi, A.; Pour, A.B.; Pradhan, B. Integration of SPOT-5 and ASTER satellite data for structural tracing and hydrothermal alteration mineral mapping: Implications for Cu–Au prospecting. Int. J. Image Data Fusion 2018, 9, 237–262. [Google Scholar] [CrossRef]
  10. Maheswaran, S.U.; Anbazhagan, S.; Tamilarasan, K.; Kasilingam, C.; Chinnamuthu, M. Lithology and Structural Mapping of Kadavur Basin, Tamil Nadu, India, Using IRS P6 LISS III Satellite Data. J. Indian Soc. Remote. Sens. 2019, 47, 1275–1286. [Google Scholar] [CrossRef]
  11. Pour, A.B.; Hashim, M.; Hong, J.K.; Park, Y. Lithological and alteration mineral mapping in poorly exposed lithologies using Landsat-8 and ASTER satellite data: North-eastern Graham Land, Antarctic Peninsula. Ore Geol. Rev. 2019, 108, 112–133. [Google Scholar] [CrossRef]
  12. Salehi, S.; Mielke, C.; Brogaard Pedersen, C.; Dalsenni Olsen, S. Comparison of ASTER and Sentinel-2 spaceborne datasets for geological mapping: A case study from North-East Greenland. Geol. Surv. Den. Greenl. Bull. 2019, 43. [Google Scholar] [CrossRef]
  13. Colomina, I.; Molina, P. Unmanned aerial systems for photogrammetry and Remote. sensing: A review. ISPRS J. Photogramm. Remote. Sens. 2014, 92, 79–97. [Google Scholar] [CrossRef] [Green Version]
  14. Heincke, B.; Jackisch, R.; Saartenoja, A.; Salmirinne, H.; Rapp, S.; Zimmermann, R.; Pirttijärvi, M.; Sörensen, E.V.; Gloaguen, R.; Ek, L.; et al. Developing multi-sensor drones for geological mapping and mineral exploration: Setup and first results from the MULSEDRO project. Geol. Surv. Den. Greenl. Bull. 2019, 43, e2019430302: 01–05. [Google Scholar] [CrossRef] [Green Version]
  15. Vasuki, Y.; Holden, E.J.; Kovesi, P.; Micklethwaite, S. Semi-automatic mapping of geological Structures using UAV-based photogrammetric data: An image analysis approach. Comput. Geosci. 2014, 69, 22–32. [Google Scholar] [CrossRef]
  16. Blistan, P.; Kovanič, Ľ.; Zelizňaková, V.; Palková, J. Using UAV photogrammetry to document rock outcrops. Acta Montan. Slovaca 2016, 21, 154–161. [Google Scholar]
  17. Szentpeteri, K.; Setiawan, T.; Ismanto, A. Drones (UAVs) in mining and Exploration. An application example: Pit Mapping and Geological Modelling. In Proceedings of the MGEI 8th Annual Convention, Unconventional Exploration Target & Latest Technique and New Tools in Mineral and Coal Exploration, Bandung, West Java, Indonesia, 5–6 October 2016. [Google Scholar]
  18. Padró, J.C.; Carabassa, V.; Balagué, J.; Brotons, L.; Alcañiz, J.M.; Pons, X. Monitoring opencast mine restorations using Unmanned Aerial System (UAS) imagery. Sci. Total Environ. 2018, 657, 1602–1614. [Google Scholar] [CrossRef]
  19. Carabassa, V.; Montero, P.; Crespo, M.; Padró, J.C.; Balagué, J.; Alcañiz, J.M.; Brotons, L.; Pons, X. UAS Remote. Sensing Products for Supporting Extraction Management and Restoration Monitoring in Open-Pit Mines. Multidiscip. Digit. Publ. Inst. Proc. 2019, 30, 4. [Google Scholar] [CrossRef] [Green Version]
  20. Kirsch, M.; Lorenz, S.; Zimmermann, R.; Tusa, L.; Möckel, R.; Hödl, P.; Booysen, R.; Khodadadzadeh, M.; Gloaguen, R. Integration of terrestrial and drone-borne hyperspectral and photogrammetric sensing methods for exploration mapping and mining monitoring. Remote. Sens. 2018, 10, 1366. [Google Scholar] [CrossRef] [Green Version]
  21. Dujoncquoy, E.; Masse, P.; Nicol, Y.; Putra, A.S.; Kenter, J.; Russo, S.; Dhont, D. UAV-based 3D outcrop analog models for oil and gas exploration and production. In IGARSS 2019-2019 IEEE International Geoscience and Remote. Sensing Symposium; IEEE: Piscataway, NJ, USA, 2019; pp. 6791–6794. [Google Scholar] [CrossRef]
  22. Dai, J.; Xue, L.; Sang, X.; Li, Z.; Ma, J.; Sun, H. Research Method for Dyke Swarms Based on UAV Remote. Sensing in Desert Areas: A Case Study in Beishan, Gansu, China. In IOP Conference Series: Earth and Environmental Science 2020; IOP Publishing: Bristol, UK, 2020; Volume 558, p. 032040. [Google Scholar] [CrossRef]
  23. Lazar, A.; Vižintin, G.; Beguš, T.; Vulić, M. The Use of Precise Survey Techniques to Find the Connection between Discontinuities and Surface Morphologic Features in the Laže Quarry in Slovenia. Minerals 2020, 10, 326. [Google Scholar] [CrossRef] [Green Version]
  24. Török, Á.; Bögöly, G.; Somogyi, Á.; Lovas, T. Application of UAV in Topographic Modelling and Structural Geological Mapping of Quarries and Their Surroundings—Delineation of Fault-Bordered Raw Material Reserves. Sensors 2020, 20, 489. [Google Scholar] [CrossRef] [PubMed] [Green Version]
  25. Bazin, D.; Hübner, H. Copper Deposits in Iran; Geological Survey of Iran: Teheran, Iran, 1969; Volume 13, p. 365. [Google Scholar]
  26. Dimitrijevic, M.D. Geology of the Kerman Region, Report No. Yu/52; Geological Survey of Iran: Teheran, Iran, 1973.
  27. Honarmand, M. Mineral potential modeling of Kerman Metallogenic Copper Belt using GIS. Ph.D. Thesis, Shahid Bahonar University of Kerman, Kerman, Iran, 2012; p. 333. [Google Scholar]
  28. Honarmand, M.; Ranjbar, H.; Shahabpour, J. Combined use of ASTER and ALI data for hydrothermal alteration mapping in the northwestern part of the Kerman magmatic arc, Iran. Int. J. Remote. Sens. 2013, 34, 2023–2046. [Google Scholar] [CrossRef]
  29. Shahriari, H.; Ranjbar, H.; Honarmand, M. Image segmentation for hydrothermal alteration mapping using PCA and concentration–area fractal model. Nat. Resour. Res. 2013, 22, 191–206. [Google Scholar] [CrossRef]
  30. Shafiei, B. Lead isotope signatures of the igneous rocks and porphyry copper deposits from the Kerman Cenozoic magmatic arc (SE Iran), and their magmatic-metallogenetic implications. Ore Geol. Rev. 2010, 38, 27–36. [Google Scholar] [CrossRef]
  31. Shafiei, B.; Haschke, M.; Shahabpour, J. Recycling of orogenic arc crust triggers porphyry Cu mineralization in Kerman Cenozoic arc rocks, southeastern Iran. Miner. Deposita 2009, 44, 265. [Google Scholar] [CrossRef]
  32. Orych, A. Review of methods for determining the spatial resolution of uav sensors. Int. Arch. Photogramm. Remote. Sens. Spat. Inf. Sci. 2015, 40. [Google Scholar] [CrossRef] [Green Version]
  33. Honkavaara, E.; Peltoniemi, J.; Ahokas, E.; Kuittinen, R.; Hyyppä, J.; Jaakkola, J.; Harri, K.; Lauri, M.; Kimmo, N.; Suomalainen, J. A permanent test field for digital photogrammetric systems. Photogramm. Eng. Remote. Sensing 2008, 74, 95–106. [Google Scholar] [CrossRef] [Green Version]
  34. Padró, J.C.; Muñoz, F.J.; Planas, J.; Pons, X. Comparison of four UAV georeferencing methods for environmental monitoring purposes focusing on the combined use with airborne and satellite Remote. sensing platforms. Int. J. Appl. Earth Obs. Geoinf. 2019, 75, 130–140. [Google Scholar] [CrossRef]
  35. Cruden, A.; Vollgger, S.; Dering, G.; Micklethwaite, S. High spatial resolution mapping of dykes using unmanned aerial vehicle (UAV) photogrammetry: New insights on emplacement processes. Acta Geol. Sin. Engl. 2016, 90, 52–53. [Google Scholar] [CrossRef]
  36. Zhang, H.; Chen, N.; Gao, B.; Xu, Y.; Chen, J. Semi-automatic mapping of dyke and dyke-related fractures using UAV-based photogrammetric data: A case study from Sijiao Island, coastal Southeastern China. J. Struct. Geol. 2020, 132, 103971. [Google Scholar] [CrossRef]
  37. Padró, J.C.; Muñoz, F.J.; Ávila, L.Á.; Pesquer, L.; Pons, X. Radiometric correction of Landsat-8 and Sentinel-2A scenes using drone imagery in synergy with field spectroradiometry. Remote. Sens. 2018, 10, 1687. [Google Scholar] [CrossRef] [Green Version]
Figure 1. (a) Relief map of Cenozoic volcanic belts [27], (b) simplified geology map of the KCMB [25], and (c) geology map of the study area [27].
Minerals 11 00585 g001
Figure 2. (a) DJI Phantom 4 Pro V2.0, (b) TGCP (marker), (c) SOUTH Galaxy G1+ receiver on a benchmark, and (d) Siemens star target.
Minerals 11 00585 g002
Figure 3. (a) Camera locations and image overlap, and (b) distribution of TGCPs in the study area.
Minerals 11 00585 g003
Figure 4. (a) Orthophoto image of the study area, and (b) hill-shade model containing lineament features.
Minerals 11 00585 g004
Figure 5. (a) Outcrop of basalt, (b,c) thin section shows olivine and plagioclase minerals inside secondary calcite in XPL and PPL modes, respectively. Cal: calcite, Oli: olivine, and Pl: plagioclase.
Minerals 11 00585 g005
Figure 6. (a) Outcrop of basaltic andesite with epidote veins, (b,c) thin section shows olivine, plagioclase, clinopyroxene, and epidote minerals in XPL and PPL modes, respectively. Cal: calcite, CPx: clinopyroxene, Ep: epidote, Oli: olivine, and Pl: plagioclase.
Minerals 11 00585 g006
Figure 7. (a) Andesite porphyry, (b,c) thin section shows plagioclase and chlorite minerals in XPL and PPL modes, respectively, (d) red tuff, and (e) agglomerate. Chl: chlorite and Pl: plagioclase.
Minerals 11 00585 g007
Figure 8. (a) Outcrop of micro dioritic gabbro dike intruded into a red tuff sequence, (b,c) thin section shows plagioclase and olivine minerals in XPL and PPL modes, respectively, (d) outcrop of a diabase dike containing Cu mineralization, (e,f) thin section shows plagioclase and feldspar minerals in XPL and PPL modes. Fel: feldspar, Oli: olivine, and Pl: plagioclase.
Minerals 11 00585 g008
Figure 9. Geology map of the Shahzadeh Abbas deposit.
Minerals 11 00585 g009
Publisher’s Note: MDPI stays neutral with regard to jurisdictional claims in published maps and institutional affiliations.

