Article

Experimental and Numerical Investigations on Conductive Drying of Phosphate Washing Waste Clay

1
National Center for Research and Studies on Water and Energy, Cadi Ayyad University, Marrakesh 40000, Morocco
2
Fluid Mechanics and Energy Laboratory, Faculty of Sciences Semlalia, Marrakesh 40000, Morocco
3
Water, Biodiversity and Climate Change Laboratory, Faculty of Sciences Semlalia, Marrakesh 40000, Morocco
4
LPFAS, Polydisciplinary Faculty, Cadi Ayyad University, Safi 46000, Morocco
5
LMPEQ, National School of Applied Sciences, Cadi Ayyad University, Safi 46000, Morocco
6
Team of Solar Energy and Aromatic and Medicinal Plants, ENS, Cadi Ayyad University, Marrakesh 40130, Morocco
7
Sustainable Development Department, Mohammed VI Polytechnic University, Benguerir 43150, Morocco
*
Author to whom correspondence should be addressed.
Minerals 2021, 11(5), 482; https://doi.org/10.3390/min11050482
Submission received: 25 February 2021 / Revised: 19 April 2021 / Accepted: 23 April 2021 / Published: 30 April 2021

Abstract

:
Morocco is the leading producer of phosphate and its derivatives in the world with a total production of 35 Mt. However, the extraction and the valorization of this mine generate huge quantities of phosphate washing waste clay (PHWWC) that constitute a main environmental and economic concern. To facilitate this waste clay storage and handling, it is necessary to decrease its moisture content that represents 80% of PHWWC. The present paper is devoted to studying the conductive drying of PHWWC. Drying experiments were conducted in a laboratory pilot. Afterwards, the experiment results were implemented in a one-dimensional numerical model of heat and mass transfer in a porous media to identify the drying parameters and performances. It was found that most of the water contained in PHWWC is free water that is removed with a constant drying rate. The volume reduction with a marked cracks phenomenon attained 65% without any significant effect of drying temperature and sample thickness. The effective moisture diffusivity of the PHWWC for a conductive drying process is ranged between 10−9 and 1.1 × 10⁻⁸ m2·s−1. The thermal efficiency of the drying system is up to 86%. The results could be used for the purpose of design and scale-up of the industrial dryer based on laboratory-scale experiments.

1. Introduction

Morocco is the leading exporter of phosphate and its derivatives with around 75% of the world’s phosphate reserves [1,2]. The phosphate deposits are mainly localized in Youssoufia (Gantour), Khouribga (Oulad Abdoun), and Layoune (BouCraa) areas. During the enriching process of the natural phosphate ore, a combination of mineral treatments, including screening, crushing, washing and flotation are conducted to separate fluoroapatite from associated gangue minerals [3]. This process generates huge quantities of waste and flotation tailings [3], which are generally pumped out, without treatment, from laundries to spreading basins on the surrounding of the mine site. For instance, the amount of PHWWC is around 28.1 million tons [2]. The increasing volumes of waste clay could present major environmental, storage and transport problems, as well as altering the landscape. Indeed, phosphorus could gradually be released during natural weathering processes and free ions could cause eutrophication of water resources. However, in alkaline solutions, calcium is the dominant cation that reacts with phosphate [4]. Most of the dissolved phosphorus reacts with calcium-forming calcium phosphates. High pH values then influenced the formation of insoluble calcium phosphates species that precipitated from the solution [5]. Taking into account the alkaline pH of the PHWWC, the release of phosphates ions from waste clay solution is negligible [6], suggesting low negative impact on the surrounding water resources and giving priority to storage and transportation issues. Managing and handling these wastes is becoming an important subject in terms of public concerns and environmental and financial aspects [7].
As it can be seen from Table 1, the mineralogical and chemical analyses of the PHWWC revealed that it contains mainly quartz, calcite, dolomite…. These materials are suitable for use in civil engineering [8]. Some perspectives for the reuse of PHWWC are mortar, concrete and road construction [3]. The potential of using PHWWC in ceramic manufacturing was also investigated by [2]. Lightweight aggregates that are composed of PHWWC, cement kiln and clay were studied by [9]. Amrani et al. [10] found that phosphate wastes could be successfully used as natural aggregates similar to conventional materials frequently used in road infrastructure. The study of Shen et al. [11] provided a quantitative analysis indicating the safe use of these wastes in building. Other work [12] has implemented the phosphate waste clay in surface thin layer in order to remediate contaminated soils by metallic tailing residues and to stabilize heavy metals avoiding their mobility and release through the alkaline pH of such calcium waste clay.
Nevertheless, in all cases, storage, handling and transportation are necessary steps in any valorization and disposal of such materials. The high moisture content of PHWWC (70–82%) is a critical problem, and the drying process is fundamental for any further disposal, since it will reduce the PHWWC volume and, therefore, the cost of the management options. Using appropriate drying technologies could be a good alternative for decreasing negative environmental impacts of PHWWC and improving site rehabilitation techniques [3].
Drying technology is often classified as convective, conductive and solar dryings modes. A combination of two different modes is also used as a combined or hybrid drying [13]. Morocco has high potential solar energy. The yearly average of global radiation is 5.3 kWh/m2/day [14]. Solar heat treatment of phosphate rocks was developed by [15,16]. The authors introduced a concentrated solar power in the industry of flameless calcination of the mineral. It was found that the direct carbon dioxide (CO2) emissions can be divided in half, and the proposed system can be economically viable. Solar drying could be a promising and efficient drying process. In this context, using a greenhouse solar dryer seems to be a very attractive solution. This technique is largely used for food drying industry and for agricultural products [17,18]. Sewage sludge produced in wastewater treatment plants is also dried in solar greenhouse [19,20]. The product or the material is generally spread in a bed with an appropriate thickness inside the greenhouse and is heated with solar radiations [13]. To increase the evaporation process, heating the greenhouse floor by injecting hot fluids could be a motivating solution. Especially, when solar energy could be used for heating the fluid, the possibility of conductive drying can be efficient and economic. However, it was observed from the literature that less importance was devoted to the conductive drying in comparison with the convective one [13,17,18].
The aim of the present paper is to investigate the behavior of PHWWC during conductive drying process. An experimental pilot scale was designed to produce thermal conditions for contact drying and to evaluate the moisture content and the drying rate of the drying sample. The numerical part of this study is focused on developing a simplified numerical model of heat and mass transfer in PHWWC to predict the drying parameters and the thermal efficiency of the conductive drying process. In order to provide more accuracy to the numerical model solution, which is a novelty of this study, realistic boundary conditions such as temperature, heat input and dimension of the drying sample, were obtained from the experimental procedure and were inhibited in the numerical model as input parameters.

2. Materials and Methods

2.1. Materials

The material used in this study is the phosphate washing waste clay (PHWWC) taken from the decanter outlet of the Khouribga mine site. It was kept in thermal containers to conserve its hygroscopic properties before the drying experiments. Before experimentation, the containers were fully stirred to obtain homogeneous samples. The main characteristics of the PHWWC are shown in Table 2; it is characterized by a high water content of 82%, which constitutes a major drawback during transportation and further disposal of this waste.

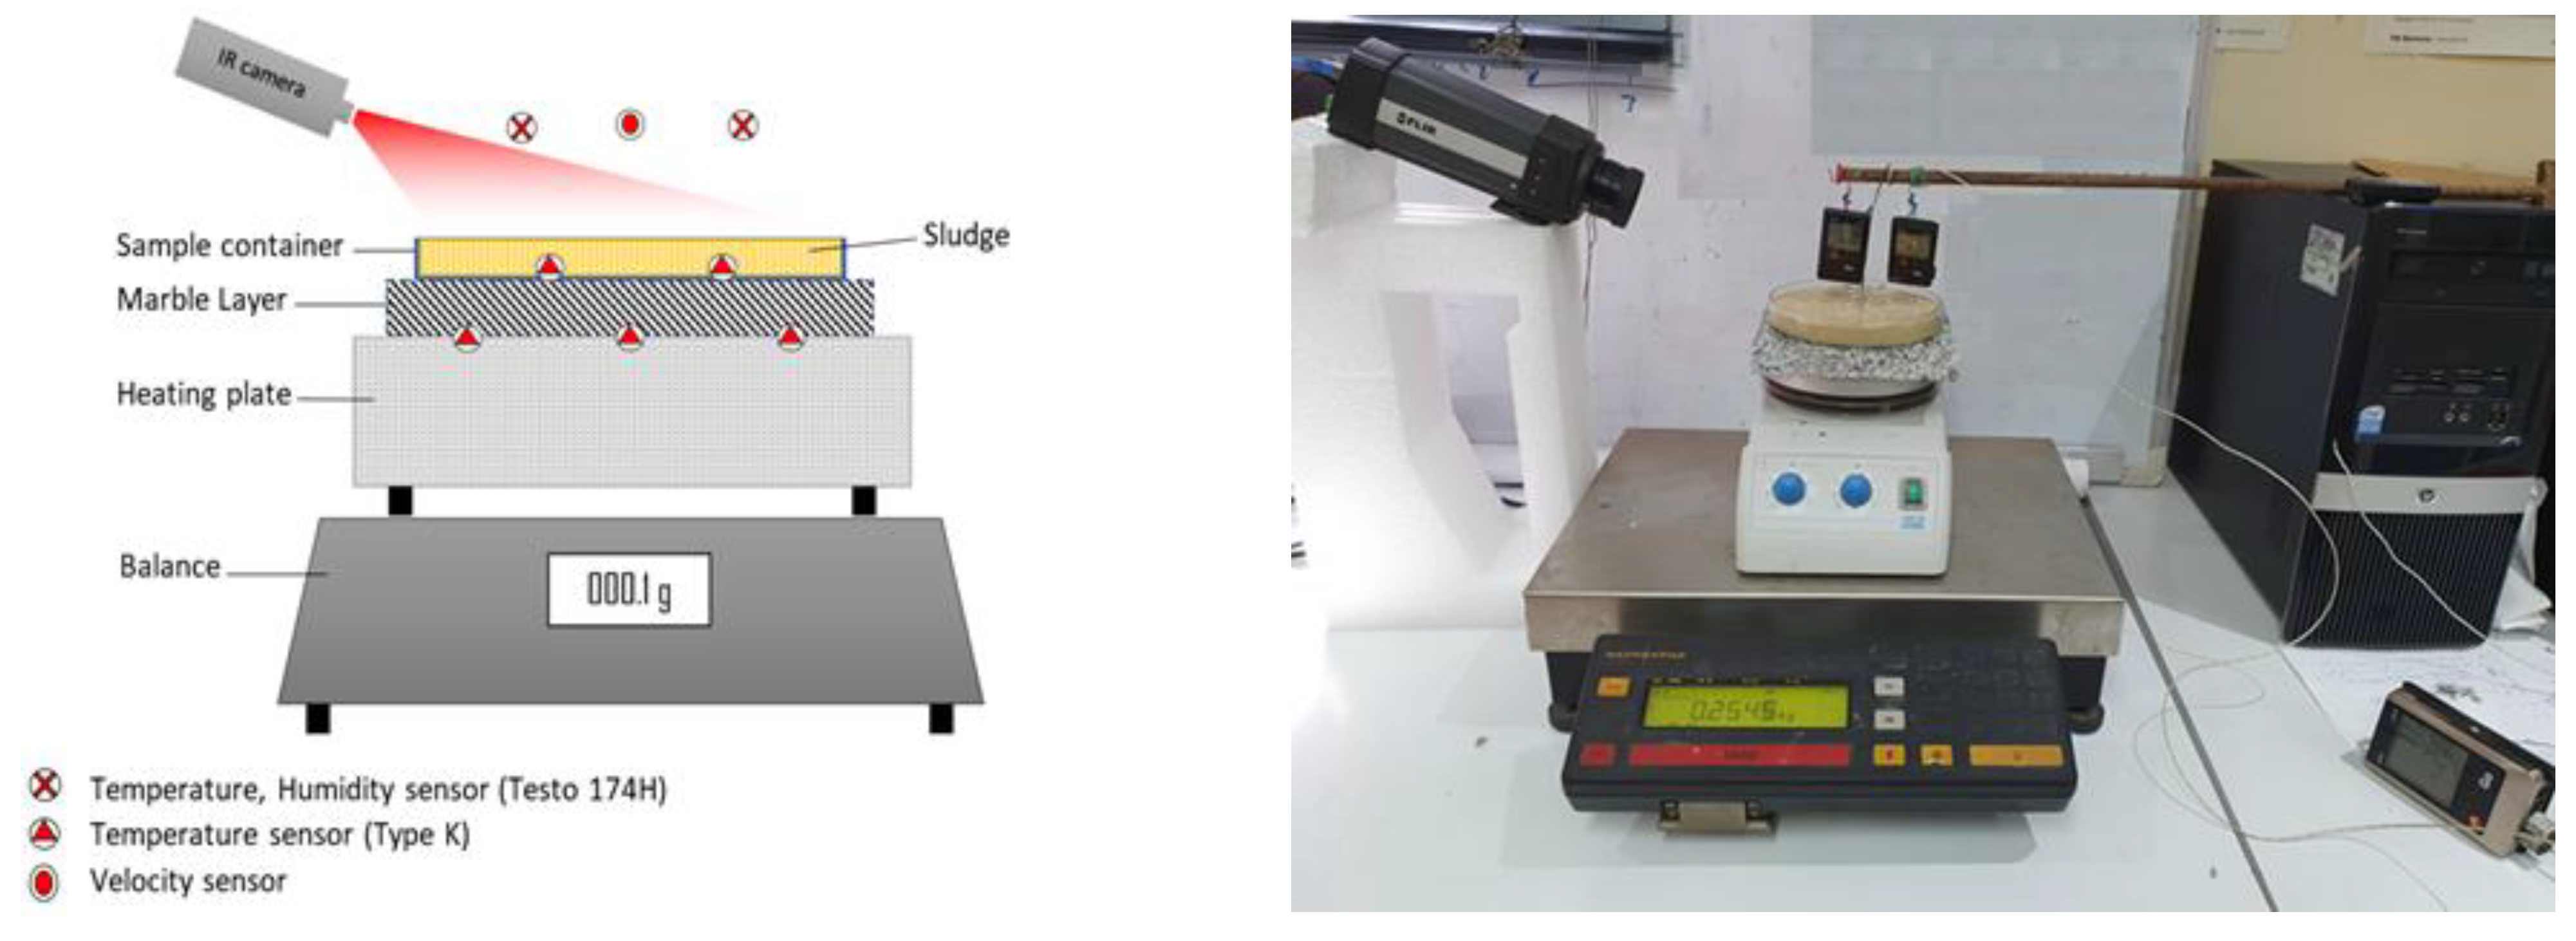
2.2. Experimental Procedure

The experiments were carried out in a laboratory set-up specifically designed to be used for the conductive drying operation of PHWWC. Figure 1 shows a scheme of the experimental dryer. The heat load from the heating plate is transmitted first to a marble layer, then to the PHWWC by conduction and the drying process occurs. The heat transferred to the waste clay sample was determined by measuring the temperature on both sides of the marble layer (Th and T0), its thickness (emarb) and its thermal conductivity (kmarb). Using apparatus based on the hot wire method, which is available in the National Center for Studies and Research on Water and Energy (CNEREE), the thermal conductivity of the marble layer was found to be 2.332 Wm−1 K−1. The thickness of the used marble layer is 2.1 cm, and the supplied conductive heat Qc is calculated using the formula in Appendix A. A marble layer was used because it is a rigid material that can be used on an industrial scale. It is a good thermal conductor (2.332 Wm−1 K−1). It facilitates the identification and the calculation of the supplied heat flux at the bottom of the drying sample and attenuates the heat flux variation coming from the use of the heating plate as a heating system.
As shown in Figure 1, three temperature sensors (Type k) were used to measure the temperature at the bottom of the marble layer (Th) and the bottom of the waste clay sample (T0). During the drying process, the top surface of waste clay sample changed continually. The sample volume decreased and the shrinkage phenomenon occurred. Thus, instead of using a temperature sensor, an infrared camera was used to record the temperature evolution (T3) at the top surface of the waste clay sample. Furthermore, and for the same reason, no temperature sensor was placed inside the PHWWC sample, and hence, the temperature evolution along the height of the samples will be deduced numerically. The thickness of the PHWWC (eph) is measured every 10 min.
The drying system was placed on a digital balance. During the drying process, weight of the PHWWC (Mt) was recorded every 10 min until a constant weight was reached.
Humidity and temperature of air surrounding the PHWWC were also registered by a Testo 174 sensor (Testo campany, Lenzkirch City, Germany). It was found that the variation of the surrounding air temperature and humidity during the entire process were small and negligible, as they vary, respectively, around 26–28 °C and 25–30%. Velocity and temperature of surrounding air were used to evaluate the convective heat exchange coefficient (hconv) between the surface of PHWWC and the ambient air. The main instruments used in the experiment are presented in Table 3.
The weight of the dried PHWWC (Md) was obtained by keeping samples in an oven with a controlled temperature of 105 °C for 24 h. The measuring devices are connected to an acquisition interface that transmits data to a computer. Experimentations were carried out with PHWWC samples derived from Khouribga mine site. Before starting drying experiments, a mechanical dehydration was applied to the PHWWC. The sample was well mixed inside a decanter. After one day of rest, the surface water was removed. The operation was repeated until the surface water became minor. The initial moisture content in the PHWWC after this process, which will be used in all subsequent drying experiments, is (2 ± 0.02) kg water/kg d.b. Three set temperatures Th (110, 120 and 135 °C) of the heating plate and two sample thicknesses (1 and 2 cm) were used to investigate the PHWWC behavior during the drying process.

2.3. Analytical Method

To describe mathematically the conductive drying of PHWWC, a one-dimensional model was adopted to simulate the drying process of PHWWC. The drying surface is big enough to make this assumption possible and to neglect the edge effects   ( Q l 0 ) . In order to simplify the study, the sample is divided into segments, as shown in Figure 2. The three segments used in this study are considered as thin layers. Temperature and moisture contents were assumed to be uniform for each layer.
The energy balance equation is written for each layer as follow (Equations (1)–(3)):
Layer 1:
  Q c = k e f f e p h ( T 0 T 1 ) +   m ˙ 1 L v
Layer 2:
k e f f e p h ( T 0 T 1 ) +   m ˙ 1 L v = k e f f e p h   ( T 1 T 2 ) + m ˙ 2 L v
Layer 3:
k e f f e p h   ( T 1 T 2 ) + m ˙ 2 L v = h c o n v ( T 3 T a ) + m ˙ 3 L v
where Qc (Wm−2) is the conductive heat flux density. Ta (°C) is the ambient temperature. T1, 2, 3 (°C) are the layers temperature. Lv (J kg−1) is the latent heat of vaporization. keff (Wm−1 K−1) is the effective thermal conductivity. m ˙ 1 , m ˙ 2 and m ˙ 3 (kg·m−2·s−1) are, respectively, the water vapor transport through the layers 1, 2 and 3. Phosphate waste clay structure is similar to a granular material such as soil. Therefore, moisture distribution inside the material can be described by a diffusion model (Fick’s law), which claims that the migration of water vapor is due to the concentration gradient in air filling pores of phosphate waste clay [21,22]. Instead of using concentration gradient in calculation, we can use pressure gradient, since water vapor is considered as an ideal gaz. Furthermore, phosphate washing waste clay has a high moisture content. Thus, we can assume that air inside pores is saturated vapor [22], and according to the Fick’s law, the water vapor diffusion m ˙ 1 , m ˙ 2 and m ˙ 3 are expressed as [22] (Equations (4)–(6)):
  m ˙ 1 = δ e f f ρ a P s ( T 0 ) P s ( T 1 ) e p h P a
m ˙ 2 = δ e f f ρ a P s ( T 1 ) P s ( T 2 ) e p h P a
m ˙ 3 = δ e f f ρ a P s ( T 2 ) P s ( T 3 ) e p h P a
δ e f f is the effective moisture diffusivity. It is considered as varying during the drying process, and it is a function of moisture content, material kind, temperature and drying technique [23,24].
P s ( T ) is defined as the saturated vapor pressure at the temperature T. It is expressed by the following formula [25] (Equation (7)):
  P s ( T ) = 133.32 e x p ( 18.584 3984.2 233.426 + T )
PHWWC is constituted by vapor and liquid phases filling the pores through the aggregates that is the solid phase. The estimation of the effective thermal conductivity k e f f   is led using the volume-weighted average of the different phase thermal conductivities as follows [26] (Equation (8)):
k e f f = ( 1 φ ) k s + φ S k w + φ ( 1 S ) k a
where k s is the thermal conductivity of the solid phase of the PHWWC, which was measured by the apparatus based on hot wire method and was found to be 0.3 Wm−1 k−1. k w and k a are the thermal conductivity of the liquid and the vapor phase of the PHWWC, respectively. k w   and k a were computed using the formulas in Appendix A. φ and S are, respectively, the porosity and the degree of water saturation in phosphate waste clay. They are calculated, respectively, by [27] (Equations (9) and (10)):
φ = 1 ρ a p p ρ s ( 1 + X )
S = X ( 1 φ ) ρ s φ ρ w
where X is the moisture content. It is defined as being the mass ratio of water content over dry matter. During the drying experiments, X is given by (Equation (11)):
X = M t M d M d
The intrinsic density or the dry matter density ρ s is determined by the pycnometry method. It was found in the range of 2000–2300 kg/m3.During the experiments, the apparent density ρ a p p   is evaluated. The weight of the sample of phosphate waste clay M t   is stated, the thickness e p h   is measured regularly, and the section of the phosphate waste clay container (A) is known. The apparent density is estimated as follows (Equation (12)):
ρ a p p = M t e p h A

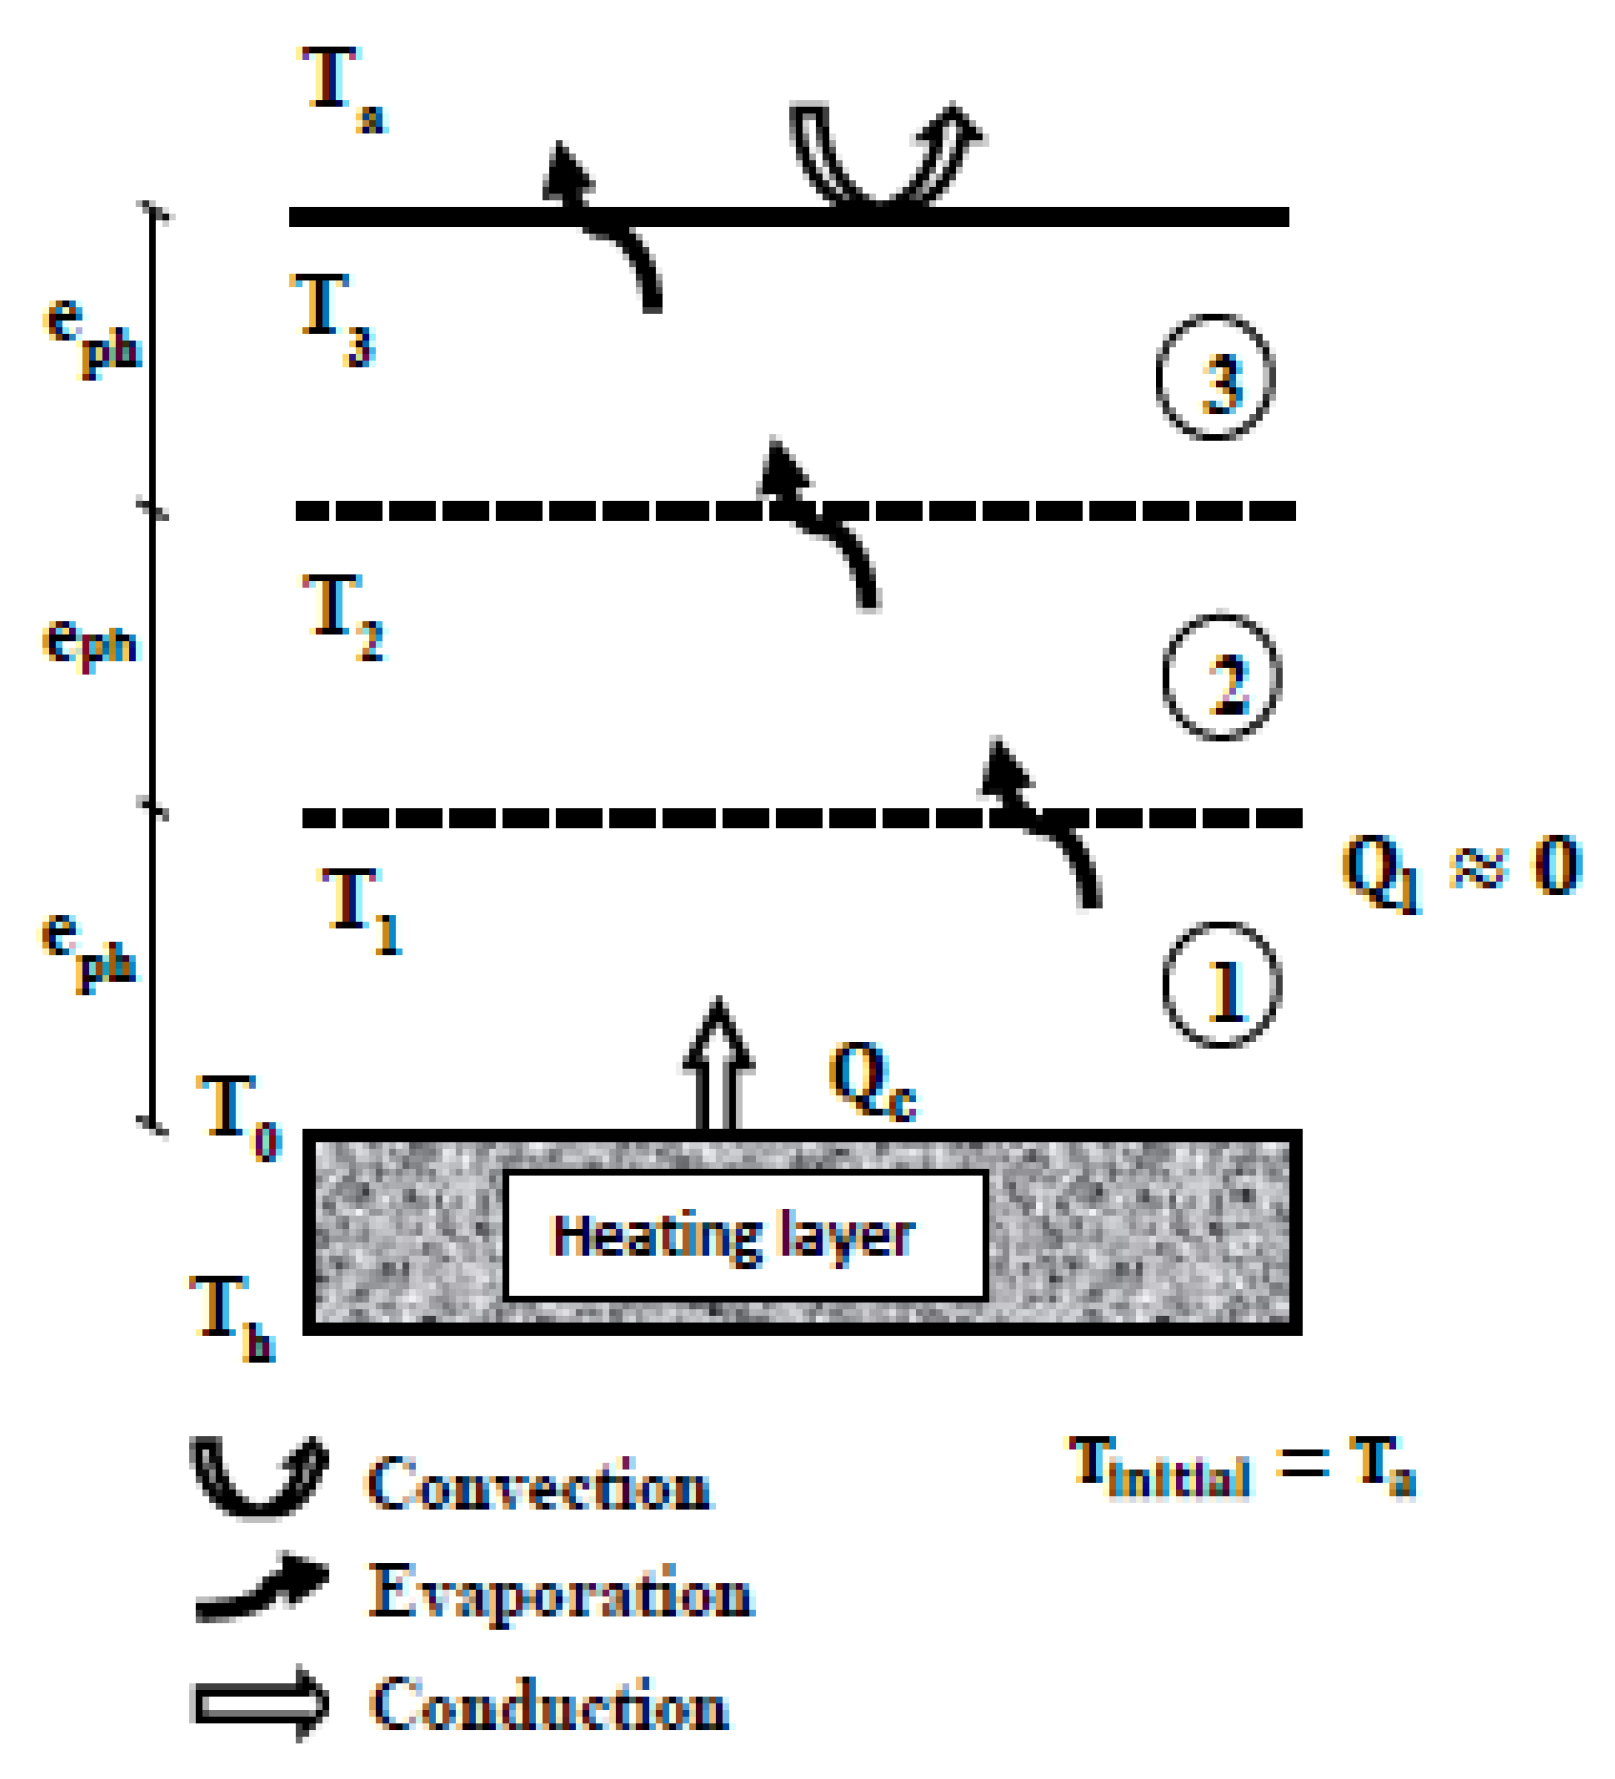
2.4. Methodology and Numerical Simulation

During the drying process, the conductive heat flux at the bottom of the PHWWC is estimated by measuring the temperature on both sides of the marble layer, as illustrated in Figure 1. Temperature and velocity of air surrounding the sample are also recorded. By using a correlation based on the regime of convection and Nusselt number, the convective heat coefficient hconv is determined [28].
At each time step, the bottom temperature of the sample T0, the surface temperature T3, the thickness ( e p h ) and the weight of the sample ( M t ) are recorded.
Moisture content (X), apparent density ( ρ a p p ) ,   porosity ( φ ) , degree of water saturation ( S ) and the effective conductivity (keff) are computed using, respectively, the Equations (9)–(12). Afterwards, those parameters and the measured temperatures (T0, T3 and Ta) and the thickness ( e p h ) of the PHWWC are implemented in the drying numerical model developed in Equations (1)–(3). The outputs of the numerical model are internal temperatures (T1 and T2) and the effective moisture diffusivity of the PHWWC δ e f f .
The equations constituting the model form a system of three nonlinear equations. The saturated vapor pressure is the nonlinear term in equations. For this purpose, the Newton Raphson method (iterative method) is used. It consists of initializing the solution of the system and defining and resolving series of tangent linear system by means of the Jacobian matrix. The iterative calculation continues until convergence is reached. At each time step, the Newton iterations are started with the converged values found in the previous step.

3. Results and Discussions

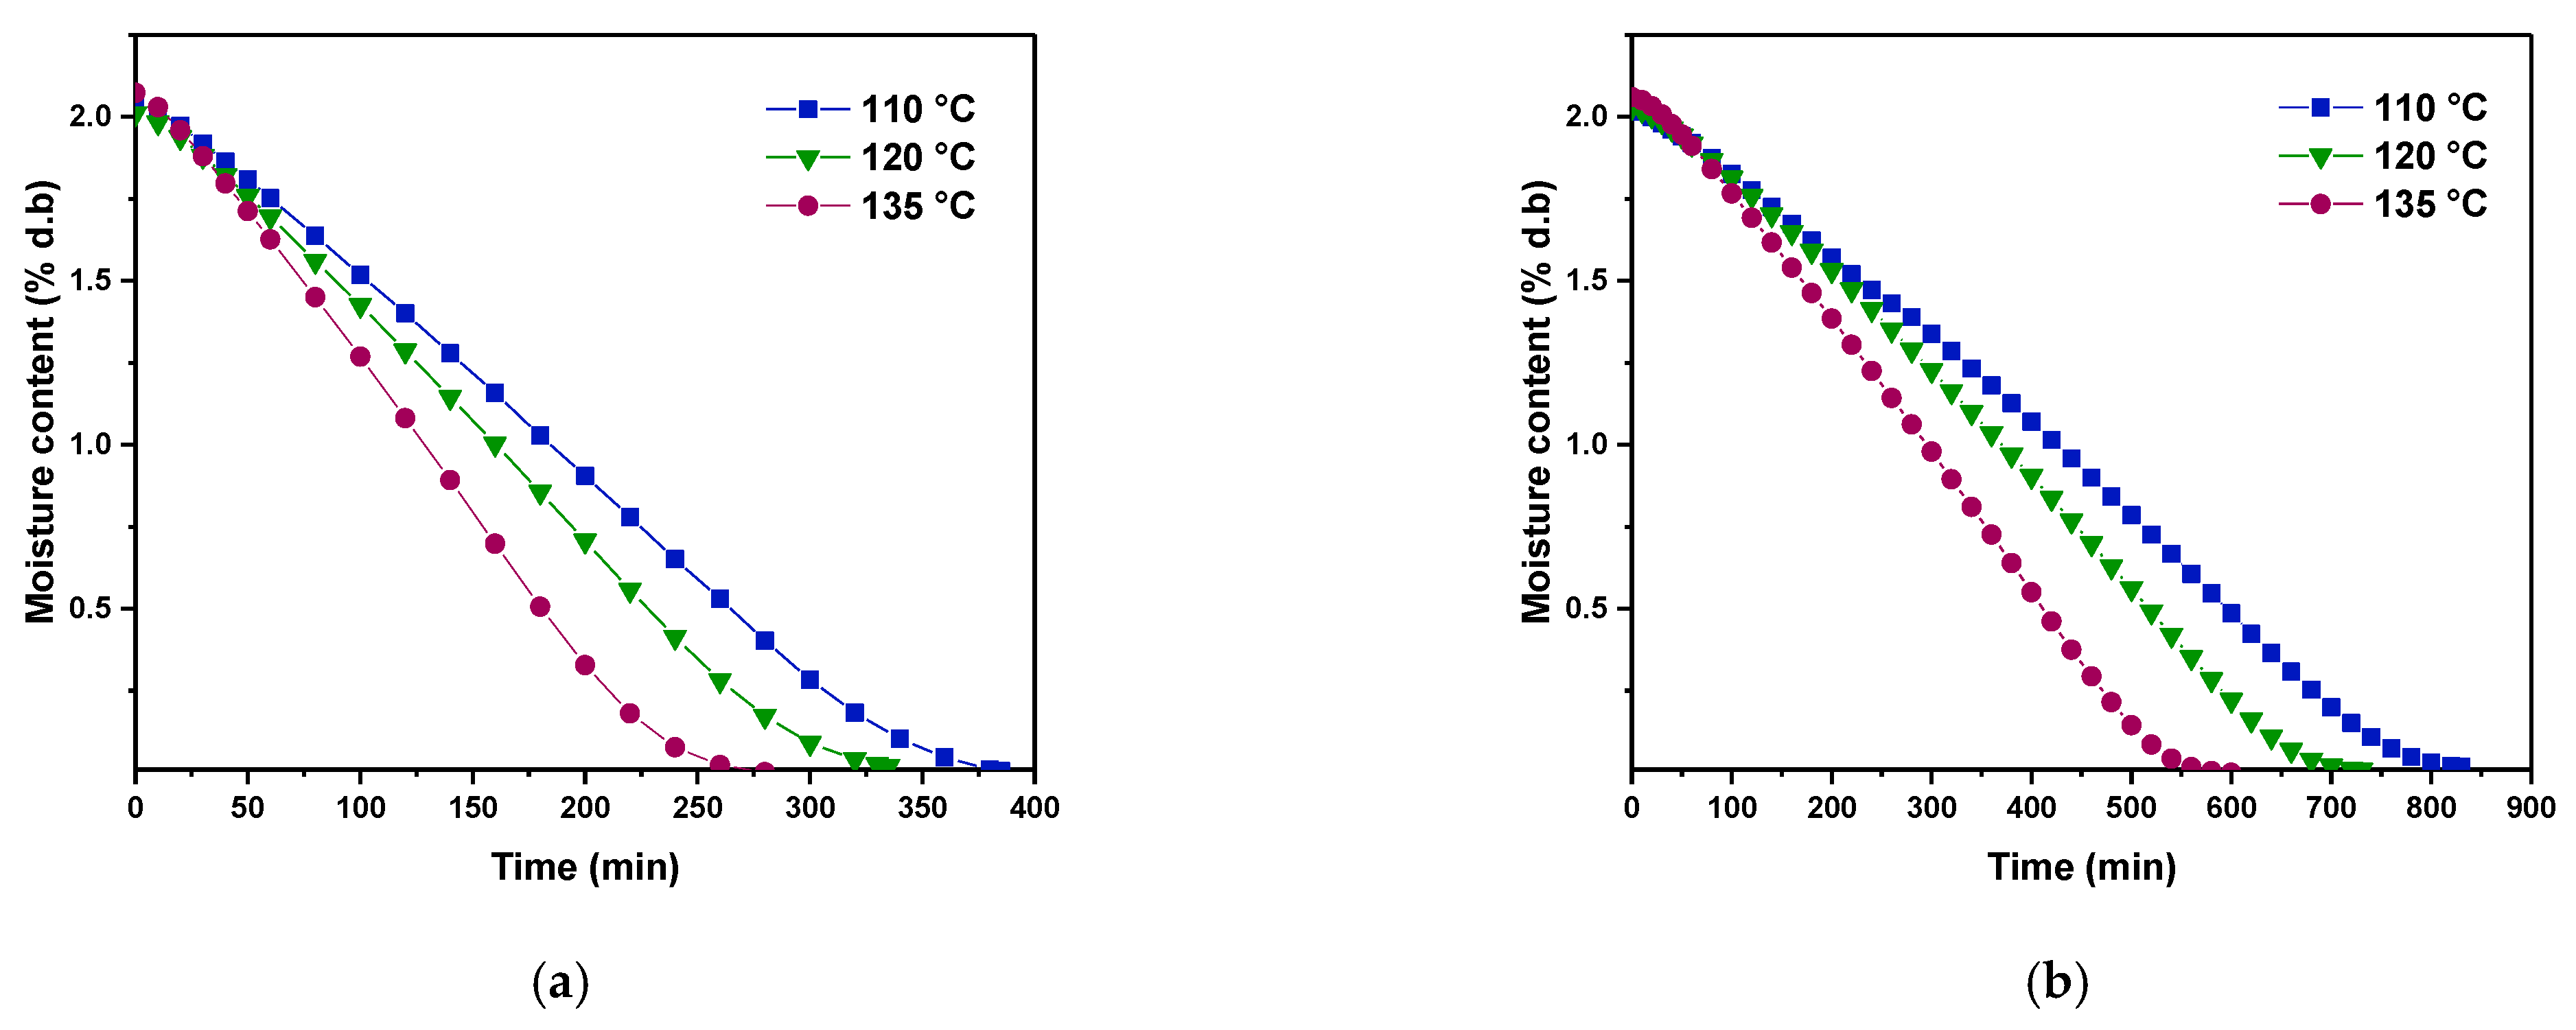
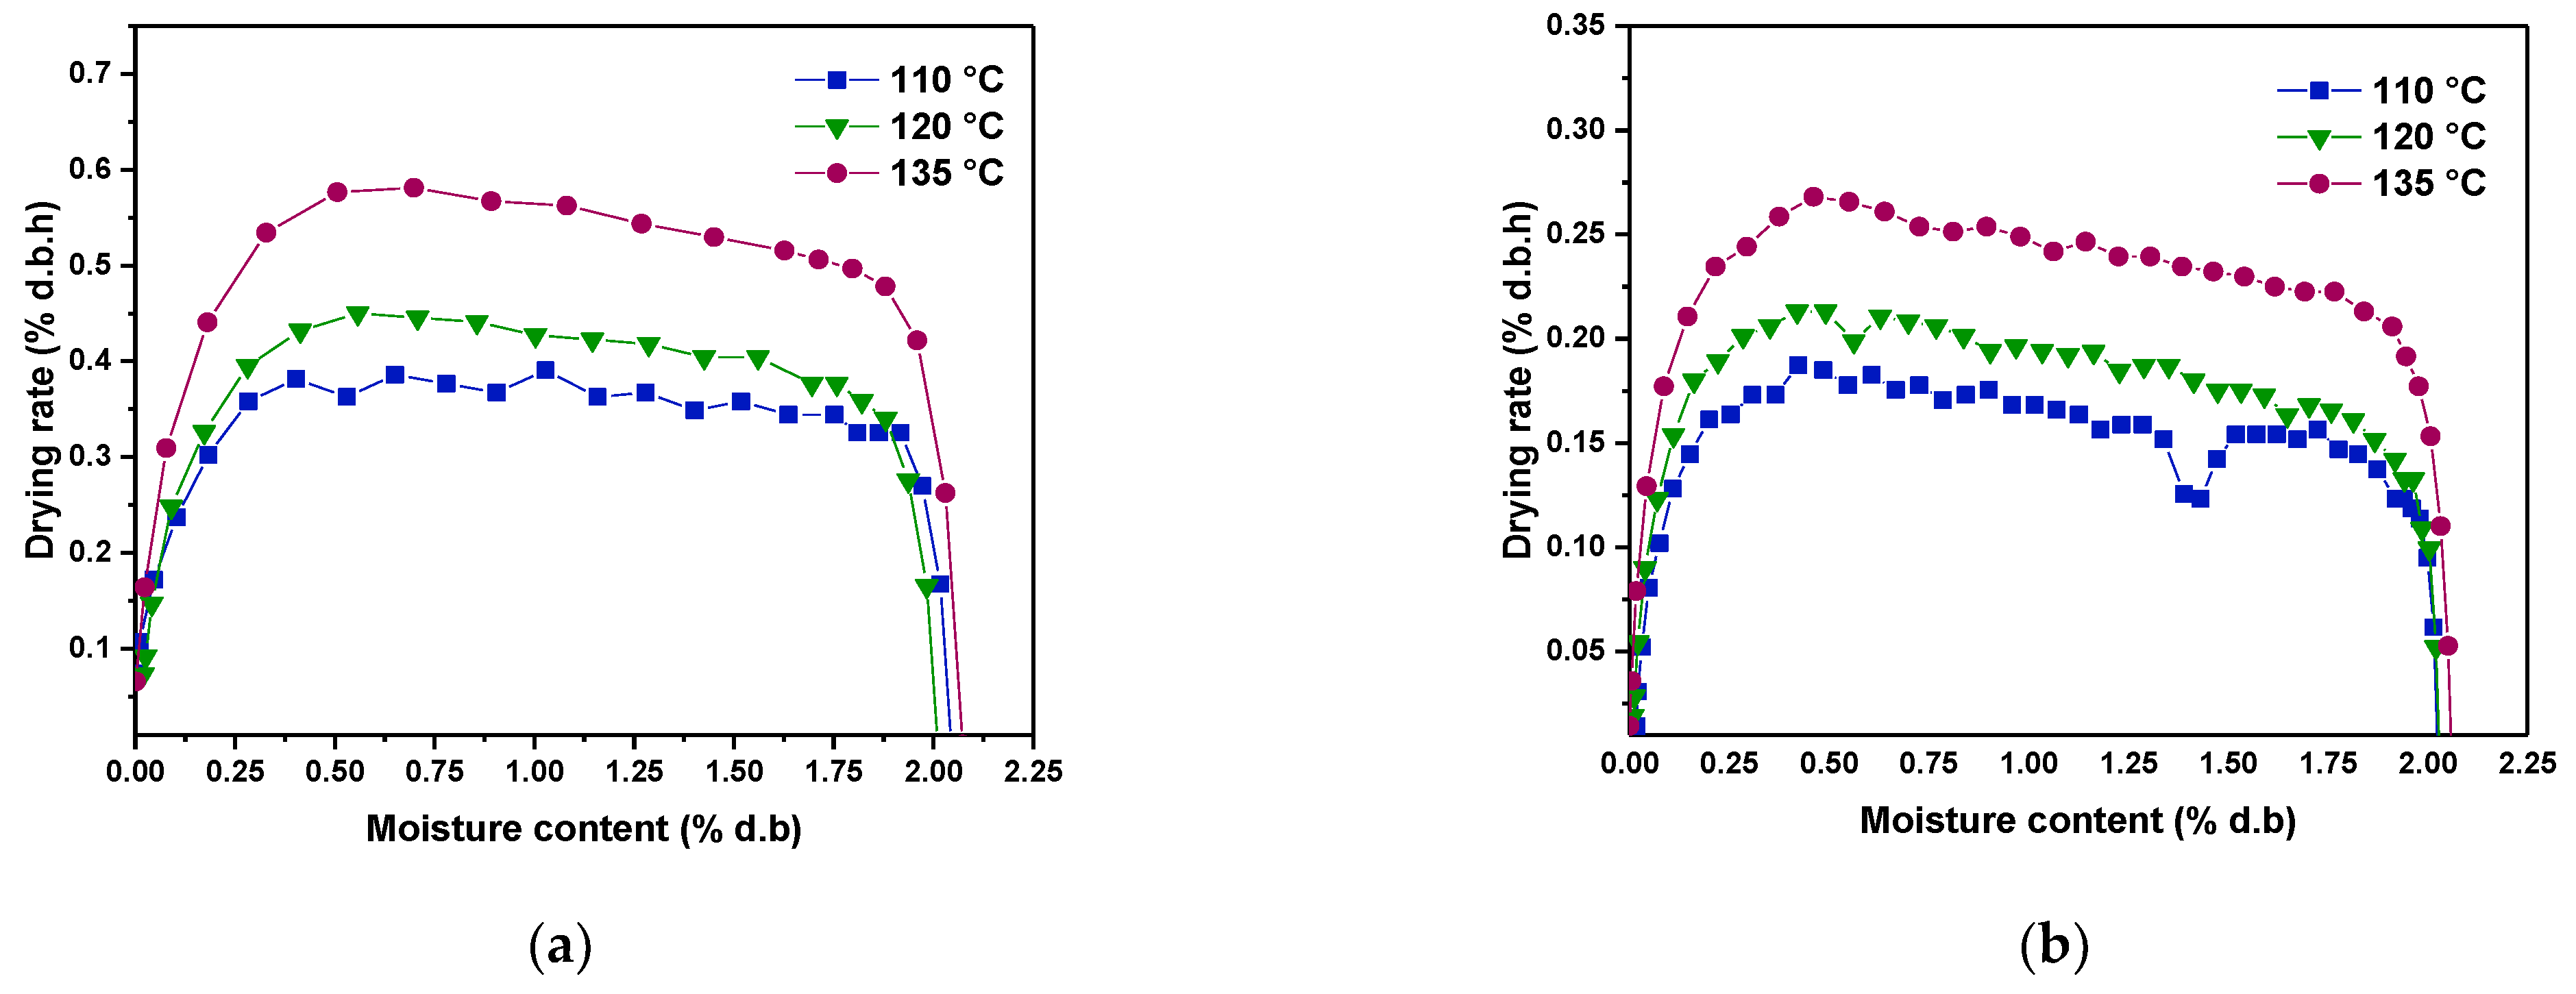
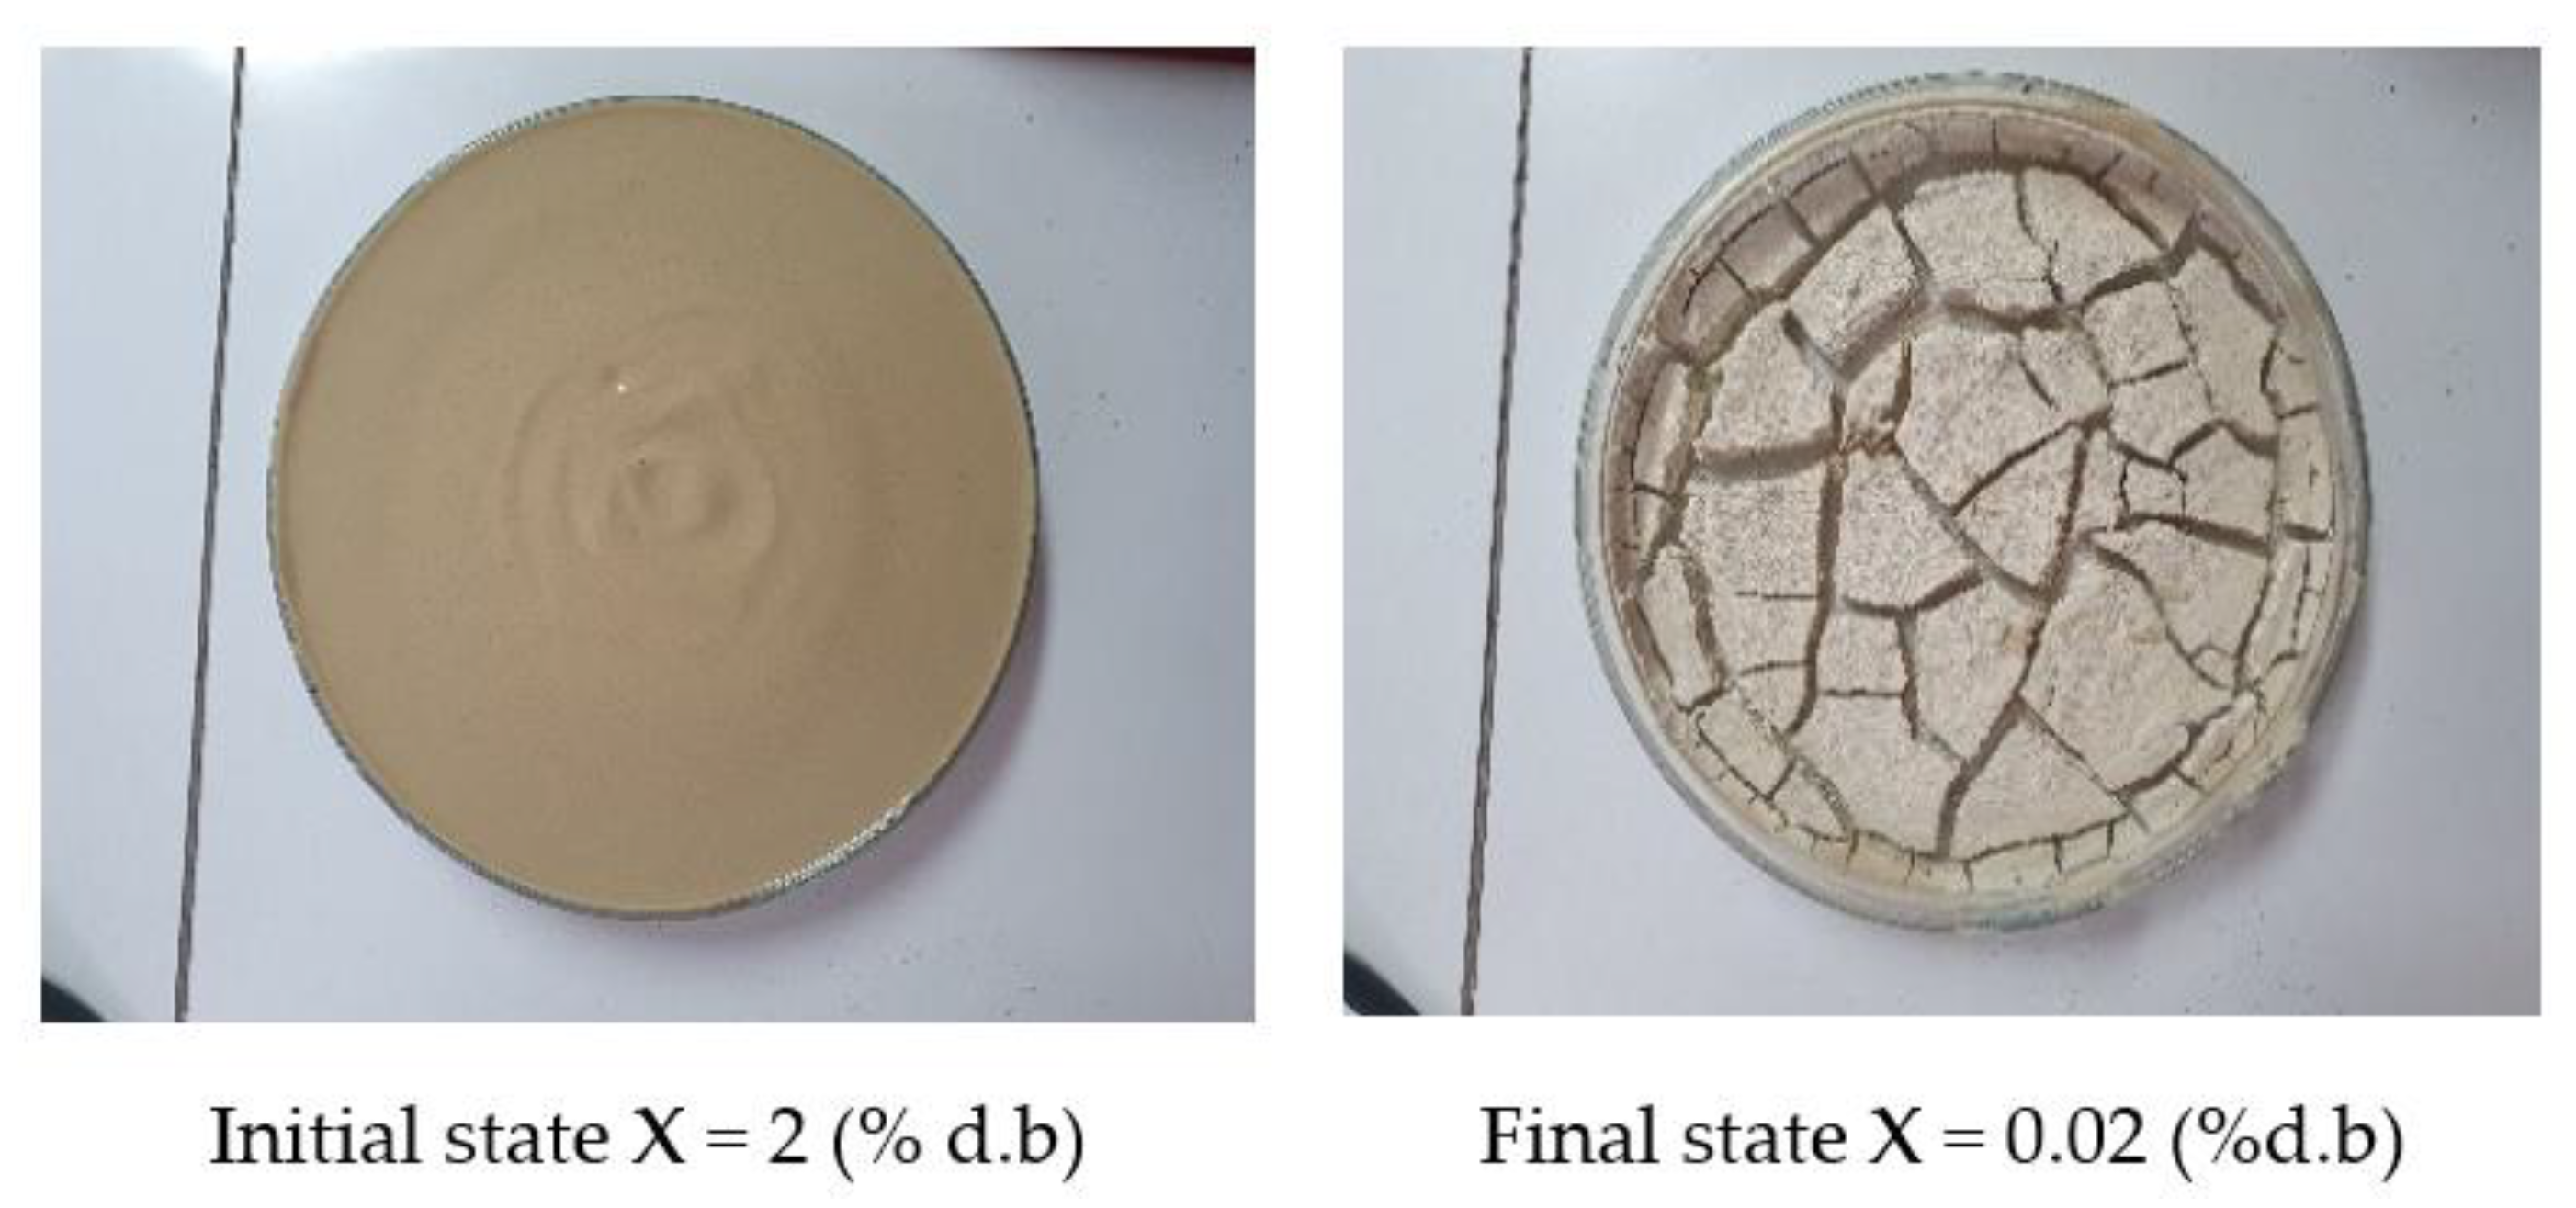
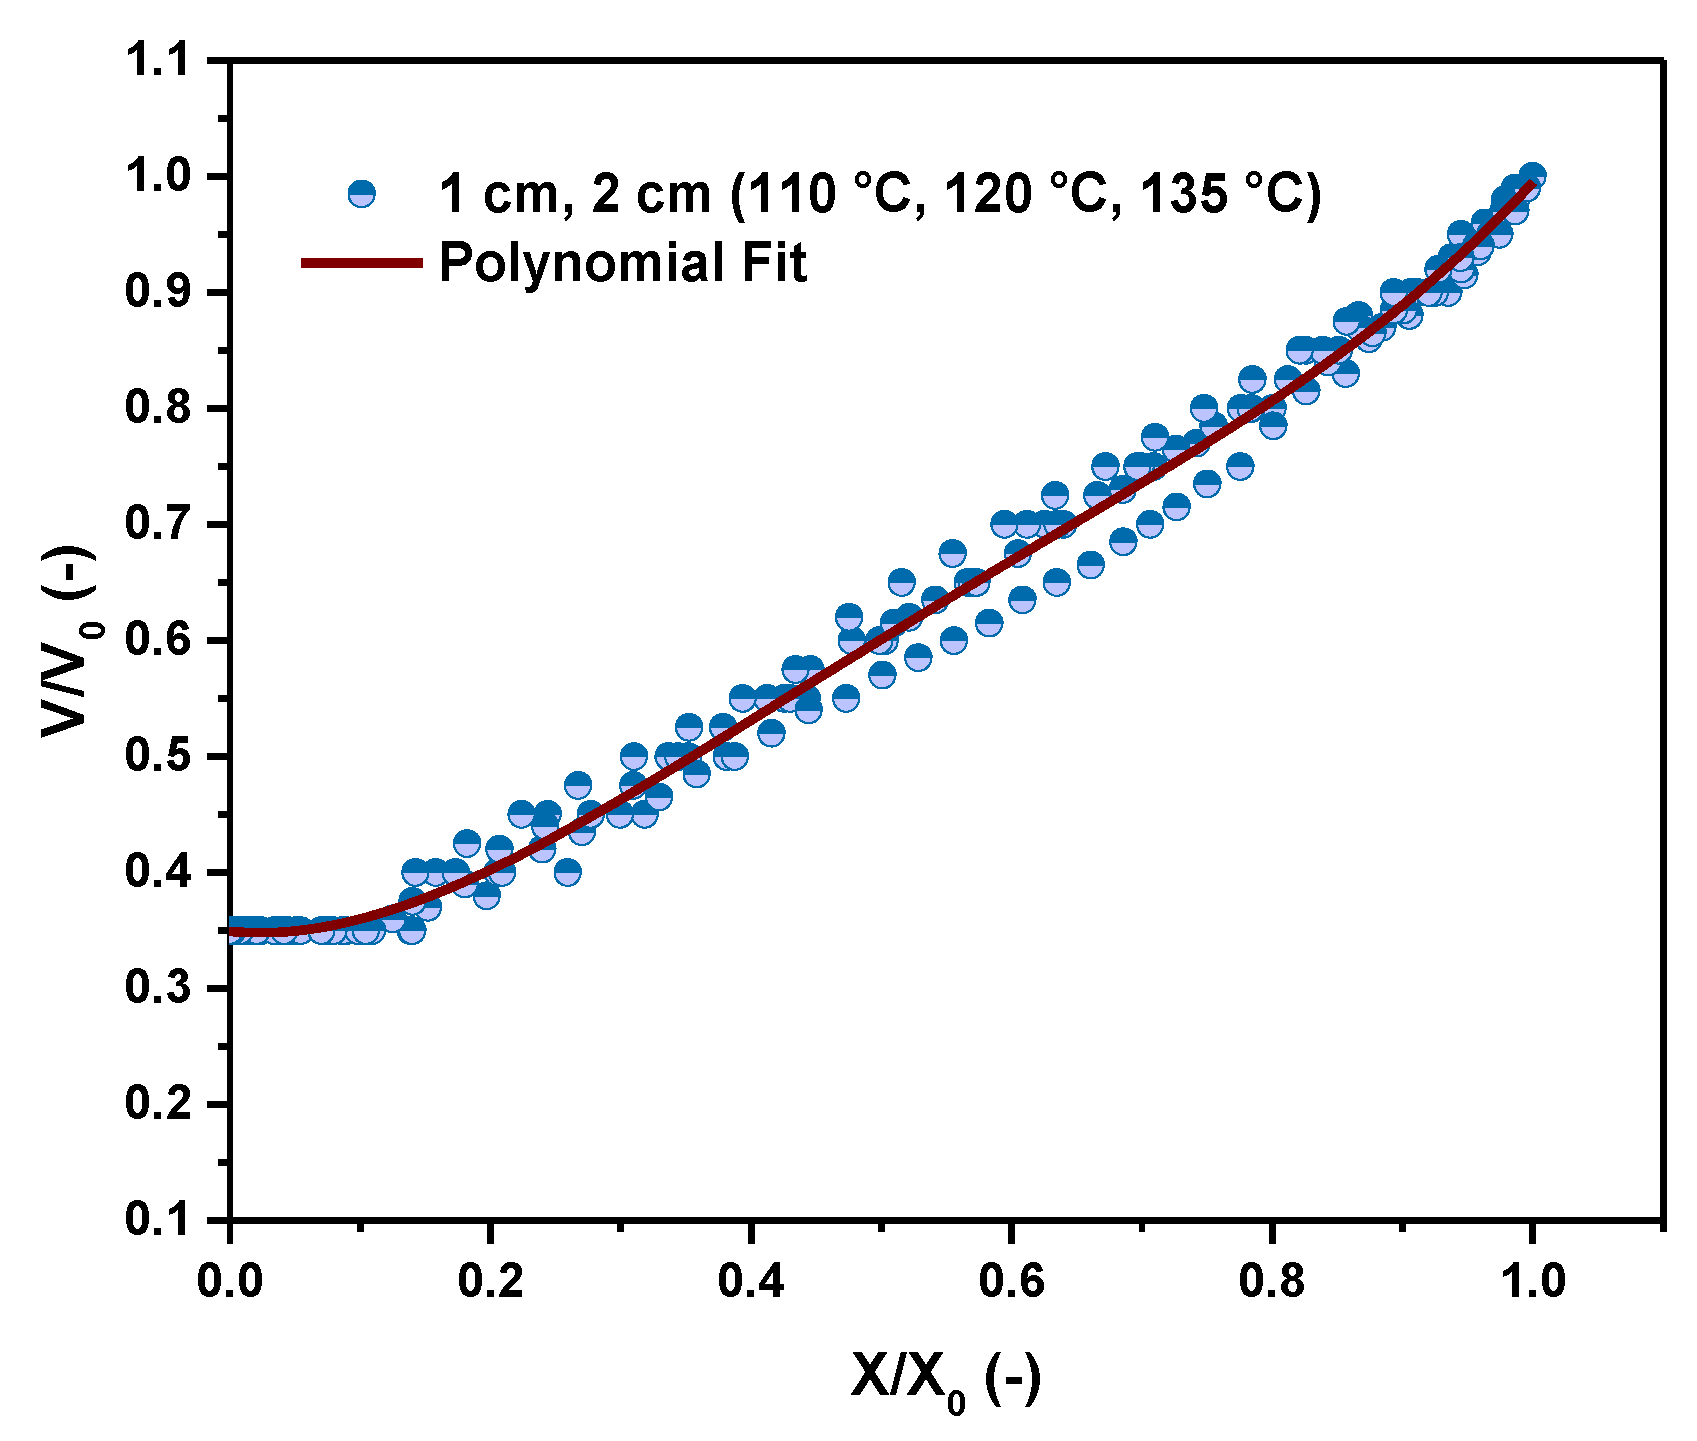
3.1. Drying Kinetics of PHWWC

The experimental results of the moisture content variation with time for different drying conditions are illustrated in Figure 3a,b. Experimentations were conducted using thicknesses of 1 and 2 cm for the PHWWC. The set temperatures of the heating plate are, respectively, 110, 120 and 135 °C. The chosen temperatures in this study can achieve the typical range of heat flux that can be reached through using a heating slab in which a heat transfer fluid circulates after being heated by a solar concentrator. This is a further stage of this work.
As seen in Figure 3a,b, the moisture content decreases with time. In addition, the drying temperature and the thickness of the PHWWC drying layer considerably affect the moisture content curves. As expected, the drying temperature increase resulted in an enhancement of heat transfer and a rapid decrease in moisture content in the PHWWC layer.
Besides, from Figure 3a,b, the thickness decrease in the PHWWC drying layer led to a shorter drying time. For a thickness of 1 cm, the drying time varies between 280 min and 380 min, according to the drying temperature. However, for a thickness of 2 cm, the drying time increases and varies between 520 and 820 min. Similar trends of moisture content curves were found in the literature for the drying process of food and sewage sludge [29,30,31].
As it is known, through the drying process, the material passes by several phases. The number of the phases depends on the nature of the material and the drying process and conditions [13,32,33]. As it is reported by several authors [32,34], the most used method for detecting the different phases is the representation of the drying rate as a function of the moisture content known in the literature as Krischer’s curve (Figure 4). The analysis of this figure shows the presence of the three standard drying phases. In the first phase, called the heating stage or adaptation phase, the PHWWC is heated until attaining the drying temperature of the system. The evaporation rate increases as the temperature of PHWWC increases, and the energy transferred to the PHWWC in this stage is used to heat up the material. In the second phase, called the constant drying rate, the evaporation rate remains almost constant. As it is reported by [13,32], the evaporated water during this phase can be considered as free water, and all the energy transferred to the PHWWC is used to evaporate this free water.
During the third phase, called the falling drying rate period, the evaporated water decreases considerably until reaching a very small value. This period is short in the drying process of PHWWC, as it is reported in Figure 4a,b. In this period, the interstitial water, the surface water and, finally, the bound water are removed, and the drying process end is attained [9]. The temperature of PHWWC increases, as it will be seen and discussed in the next section. In addition, the moisture content varies approximatively from 1.95 to 0.17 (% d.b.) with a constant drying rate, as displayed in Figure 4a,b. Hence, it is important to note that most of the water contained in the PHWWC is free water that could be reduced by investigating in an appropriate dewatering system.
Figure 4a,b also reveals that the growth in drying temperature or the diminution of the thickness of the PHWWC considerably improves the drying rate, especially in the constant drying rate phase. This is justified by the augmentation of the amount of energy received by the PHWWC.
During the drying of PHWWC, shrinkage and crack are phenomena that occur, as shown in Figure 5. The reduction in volume is very important, as illustrated in Figure 6. It reaches 65% of its initial volume. This volume drop could considerably reduce the charge of transportation and disposal. However, the impact of the drying temperature and the thickness of the sample are not very significant. The difference between the shrinkage curves is small. Similar results were found by several authors dealing with the drying process of food [29,35,36]. The fitting analysis of shrinkage curves presented in Figure 6 shows that the following polynomial equation could be used for modeling the reduced volume as a function of the reduced moisture content with a square error of 0.994 (Equation (13)).
V V 0 = 0.349 0.109 X X 0 + 2.461 ( X X 0 ) 2 3.237 ( X X 0 ) 3 + 1.53 ( X X 0 ) 4

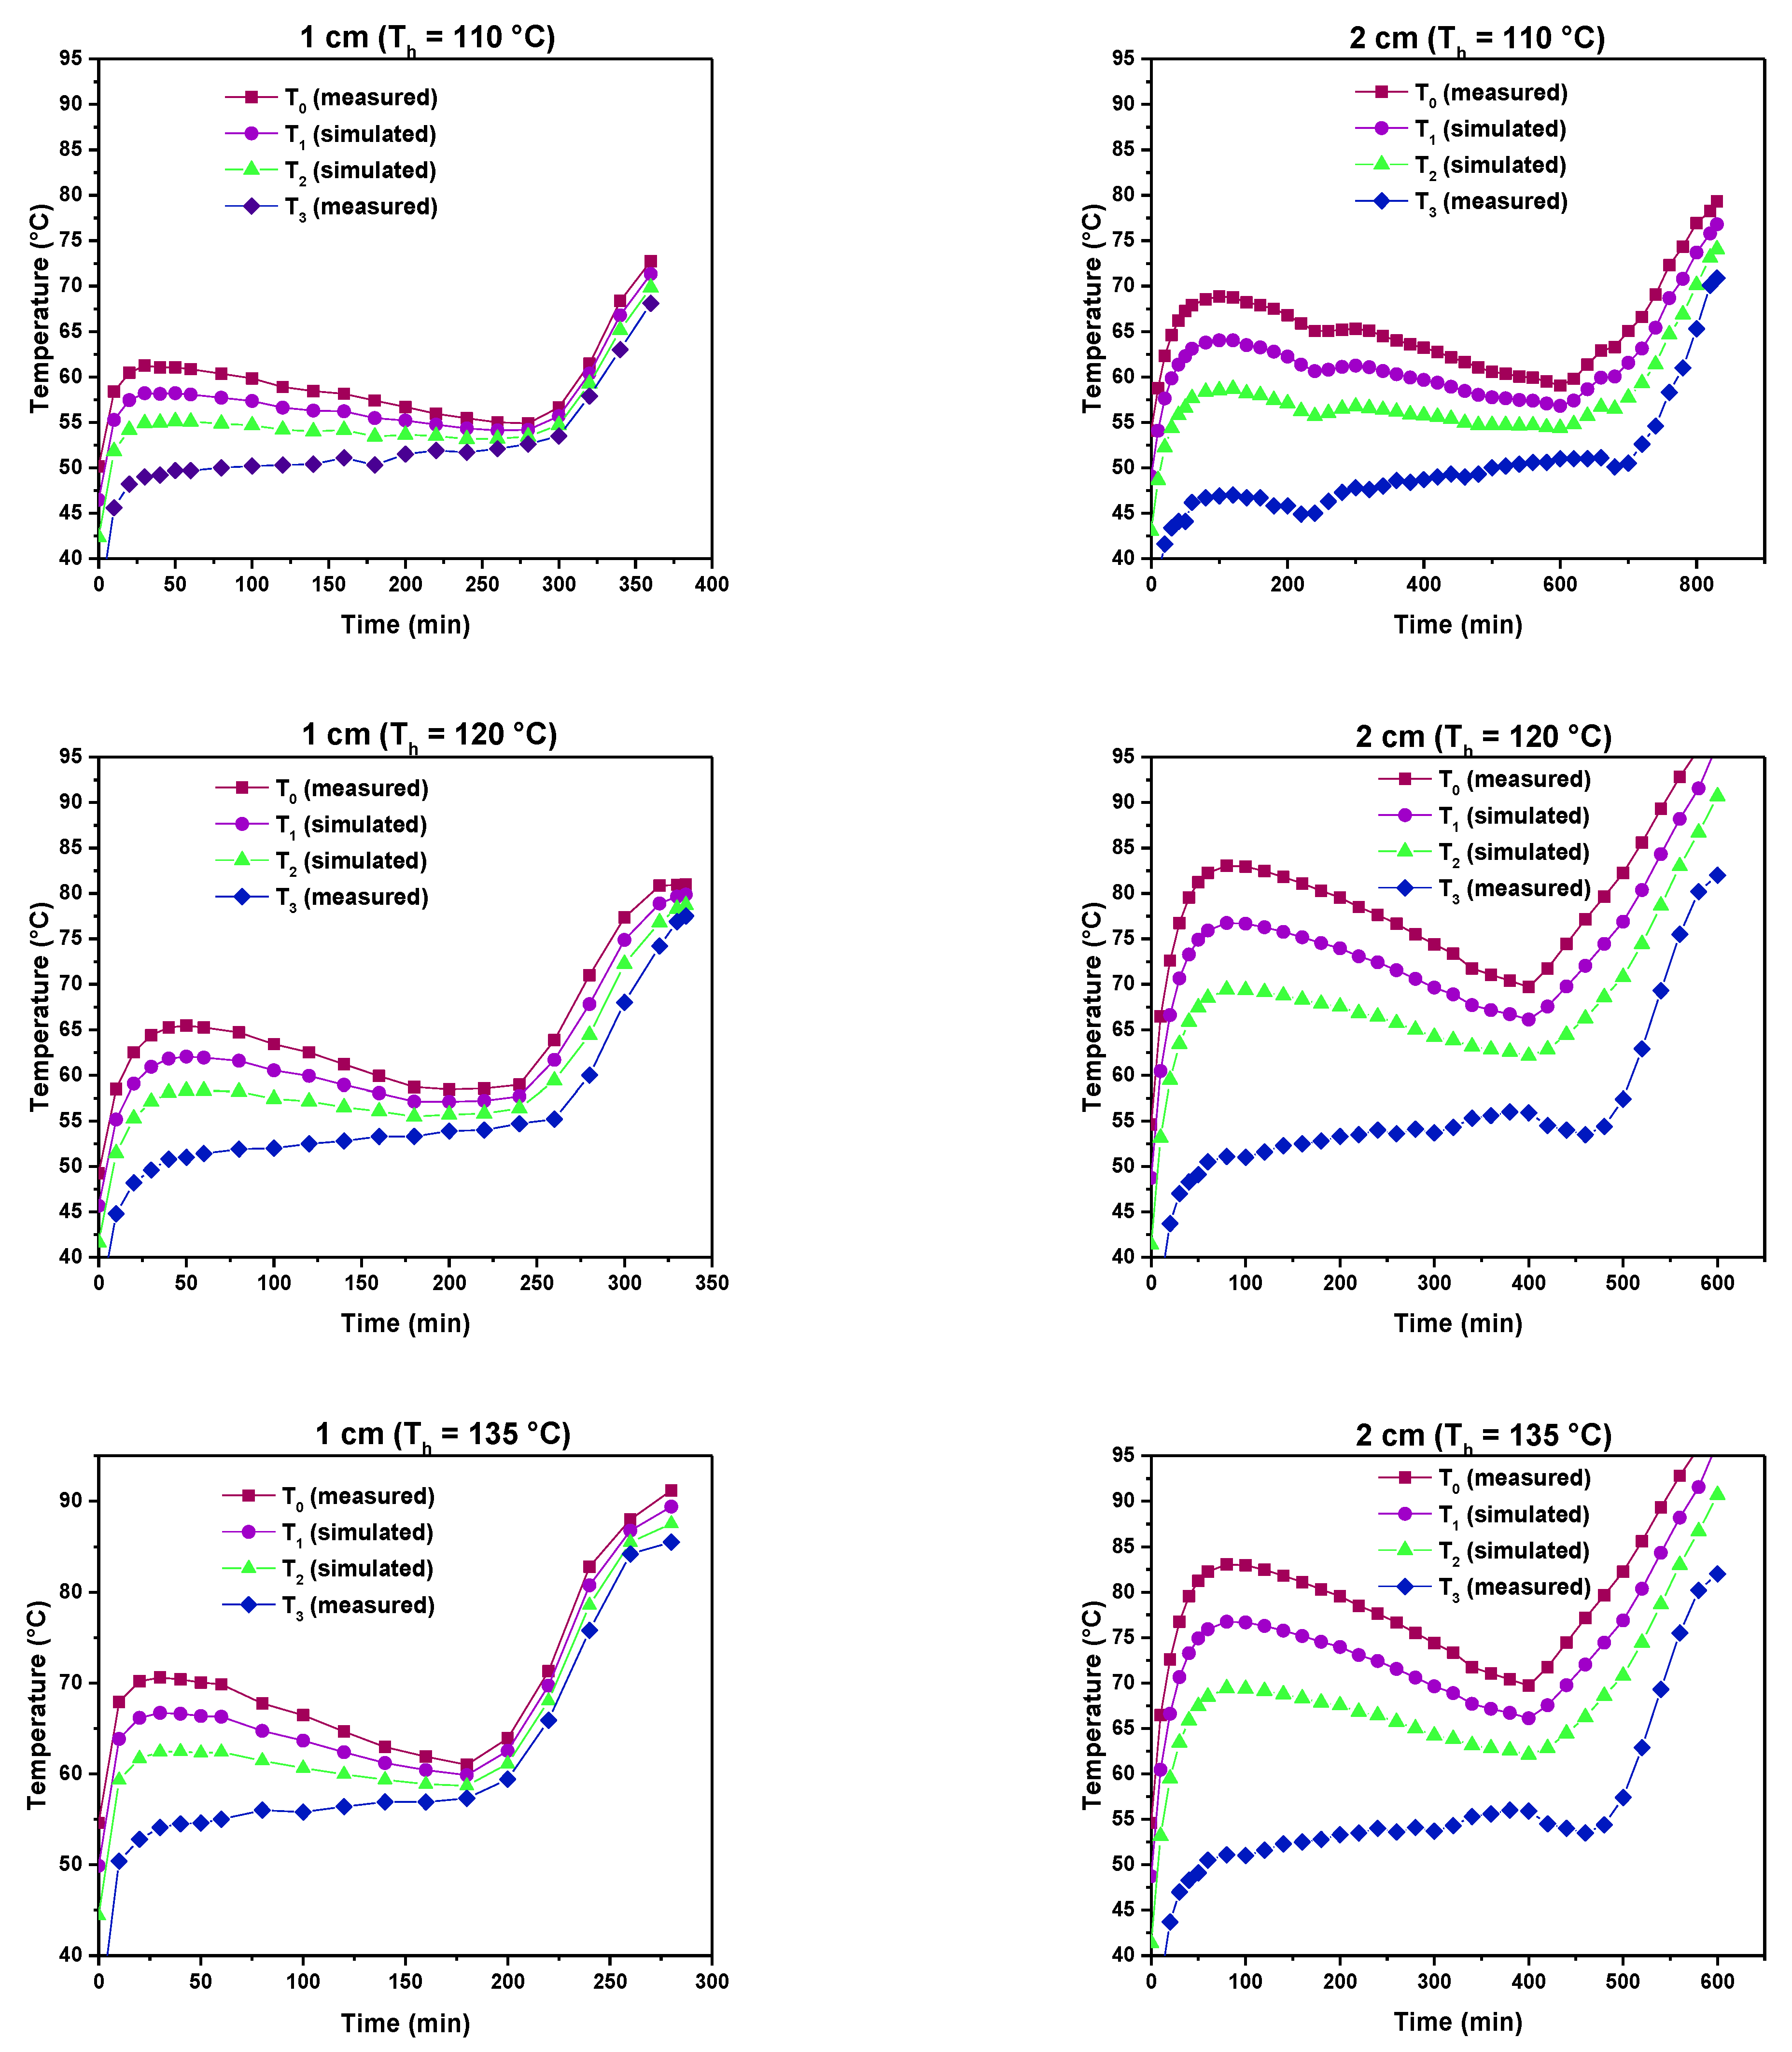
3.2. Thermal Analysis of PHWWC Drying

The PHWWC sample to be dried is placed on a conductive layer (marble layer), which is heated on the other side by a heating plate. The supplied heat is used both to heat the material and to feed the vaporization of water contained in the material.
The measured temperatures (T0 at the bottom of the PHWWC sample and T3 at the top of the sample) and the simulated internal temperatures T1 and T2 are shown in Figure 7 for two thicknesses (1, 2 cm) and for different drying conditions (110, 120 and 135 °C). During the drying process, all the PHWWC samples showed the existence of the three main drying phases mentioned before (adaptation, constant drying rate and falling drying rate periods).
During the adaptation period, the temperature of the PHWWC increases to a temperature equilibration or adjustment between the PHWWC and the heating plate [37]. This period is short. It was observed that the bottom temperature T0 remains lower than the heating plate temperature, which could be explained by the thermal resistance of the marble-air layer together. The adjustment temperature between the PHWWC and the heating plate takes 10 to 15 min, according to the PHWWC thickness.
The second period represents almost a constant temperature trend in each internal layer (T1, T2 and T3) in PHWWC. In this period, the energy received by the PHWWC sample serves essentially to evaporate water from the material. The temperature gradient inside the PHWWC, from the bottom to the top of the sample, remains nearly constant in the constant drying rate period. Nevertheless, at the end of this period and just before starting the falling drying rate period, a slight decrease in temperature is noticed from the profiles’ temperature (Figure 7). This finding is justified by the fact that in this stage of drying, crack phenomenon starts and the thermocouples inside the PHWWC becomes badly covered by the product and measures only the air temperature inside the PHWWC, things that explain this diminution in temperature. In addition, the formation of cracks permits the filtration of air inside the sample, leading to its temperature decrease. Nevertheless, as soon as the moisture content diminishes considerably in the sample, the temperature increases again. This behavior change is considered as the beginning of the falling drying rate period.
The effects of the drying conditions and the thickness of the PHWWC samples on the drying process are clear in Figure 7. In fact, increasing the PHWWC thickness leads to a longer constant drying rate period and increasing the drying temperature leads to a shorter constant drying rate period. From the above mentioned results, it can be concluded that the interval and the time duration of the constant drying period is highly influenced by the drying conditions and the thickness of the PHWWC drying samples.
During the last period observed in Figure 7 (falling drying rate period), the acquired energy is used for evaporating the remaining water in the PHWWC sample and improving its temperature. In this phase, the temperature gradient inside the PHWWC sample slowed down. The difference between the temperatures T0 and T3 of the bottom and the top surfaces of the sample becomes small, indicating the end of mass transfer and drying process [20,37,38].

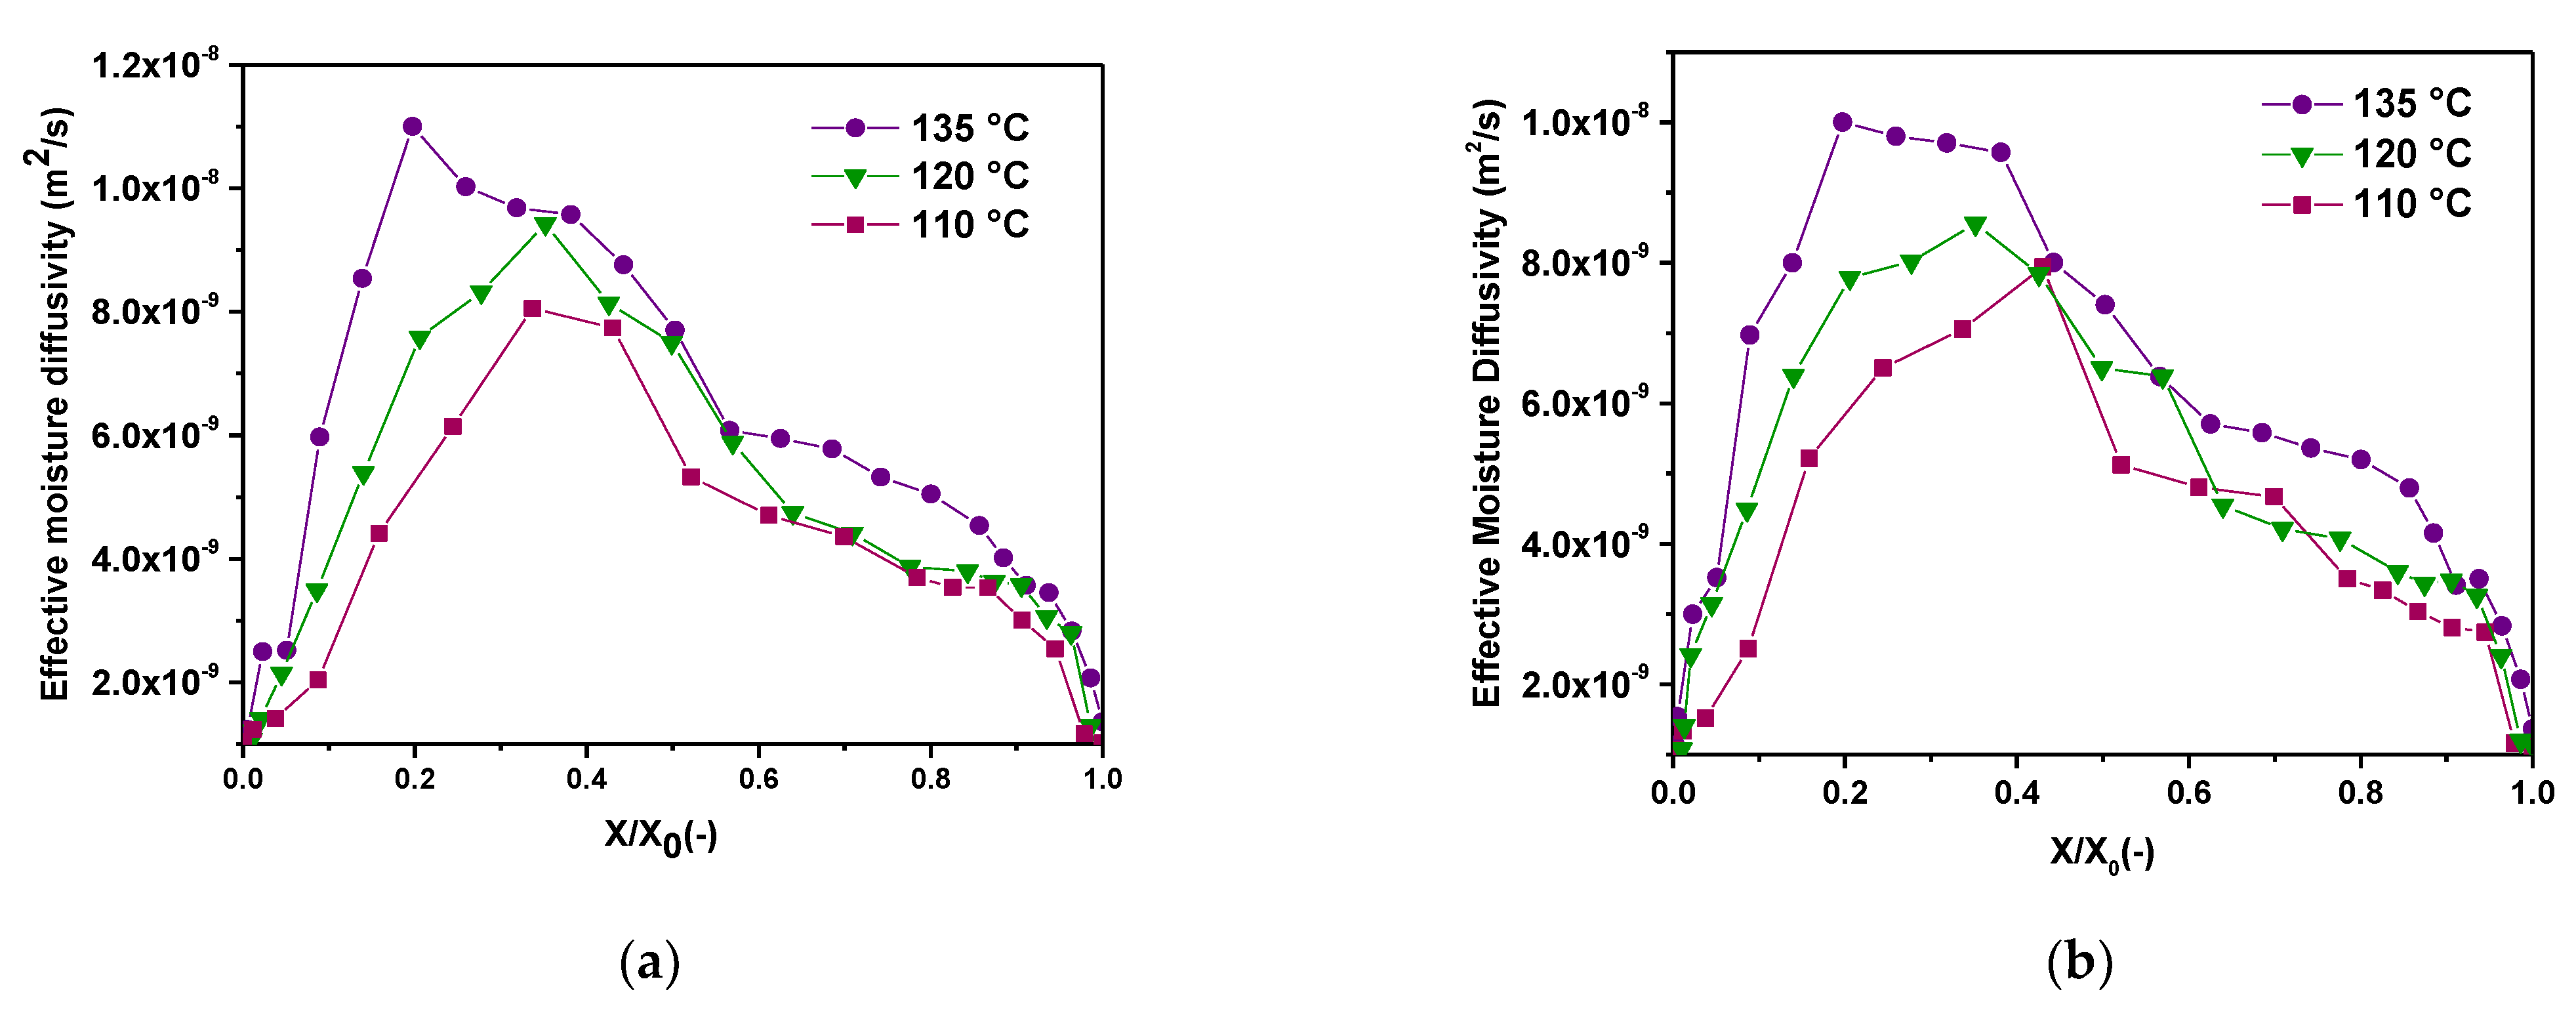
3.3. Effective Moisture Diffusivity

Generally, mechanisms of water migration in porous media are complex to quantify. Drying mechanisms include capillary flow, liquid diffusion produced by the concentration difference through the material, vapor diffusion initiated by the gradient pressure in air-filled pores and other mechanisms [38]. In order to take into account all of these mechanisms of water transport through a drying process, the use of the effective moisture diffusivity is appropriate. Indeed, all of mechanisms of moisture migration are combined and included in the effective moisture diffusivity δeff [22,38,39].
Experimental drying data were established and implemented in a numerical model based on Fick’s law, and the effective moisture diffusivity for the conductive drying of PHWWC was estimated. Figure 8a,b shows the estimated evolution of δeff as a function of the moisture content in different drying conditions (110, 120 and 135 °C) and for a PHWWC sample thicknesses of 1 and 2 cm.
The analysis of the results presented in Figure 8a,b shows the existence of two principal periods. In the first one, δeff increases until a maximum value as the drying process occurs and the moisture content decreases. δeff attains the maximum value. This phase is the constant drying rate period. All the free water is removed. The received heat by conduction is converted to latent heat, and the water is evaporated in the PHWWC samples. In addition, the shrinkage phenomenon was noticed in this drying phase. This phenomenon is caused by the capillary forces and flows that depend on the pore size [38,40]. The shrinkage phenomenon characterizes the constant drying rate period [38,41], and the decrease in the sample volume is generally equal to the volume of the evaporated water (Figure 7).
Thus, the capillary flow is the governing mechanism of moisture transport in the constant drying rate period. The capillary forces are maximized at the end of the constant drying rate period. Consequently, the crack phenomenon appears [41], and in this point of drying, the moisture content is commonly called the critical moisture content. For the PHWWC drying, the reduced critical moisture content varies from 0.19 to 0.25% d.b. with respect to the drying temperature (110, 120 and 135 °C) and the PHWWC sample thicknesses (1 and 2 cm).
It can be seen in Figure 8a,b that the maximum value of δeff (1.1 × 10⁻⁸) is obtained for the PHWWC sample that is submitted to the maximum drying temperature (135 °C). This result is expected, but the thickness impact is less pronounced than the drying temperature. This might be due to the shrinkage phenomenon.
By the end of the constant drying rate period, δeff decreases. This stage of drying is the falling drying rate period. Drying rate decreases considerably, as it was seen in Figure 4a,b and the PHWWC sample temperature rises (Figure 7). Vapor diffusion is the controlling mechanisms of moisture transport [38]. δeff of the PHWWC for conductive drying varies between 1 × 10⁻⁹ and 1.1 × 10⁻⁸. Several authors [38,39] found this range of values for the effective moisture diffusivity of clay porous media.
A polynomial fitting of δeff curves is established for modeling the effective moisture diffusivity as a function of the reduced moisture content and the drying temperature (Table 4).

3.4. Dryer Efficiency Analysis

The thermal efficiency of the dryer is computed using the following formula (Equation (14)):
η = Q e Q c
where   Q e is the heat required for water evaporation, and Q c is the supplied heat to the drying sample.   Q e and Q c are computed using the formulas in Appendix A.
Table 5 summarizes the average values of the supplied energy to the drying sample, the heat required for water evaporation, the thermal efficiency and the water evaporation capacity of the conductive drying system.
As it is reported in Table 5, the average evaporation capacity of the system is ranged from 1.149 to 1.890 kg water/m2·h. The highest water evaporation capacity is obtained for the maximum supplied energy. The thermal efficiency of the conductive drying system is up to 86%, which shows the interest of investing in a conductive drying system.

4. Conclusions

In this study of the conductive drying of phosphate washing waste clay, drying kinetics were established using a laboratory pilot. A numerical model based on Fick’s law was written and was resolved by Newton Raphson for nonlinear system. Experimental data of drying were implemented in the numerical model as input parameters. Temperature profiles through the phosphate washing waste clay sample were simulated. It was found that increasing the drying temperature or decreasing the PHWWC sample thickness leads to a shorter constant drying rate period. Shrinkage curves were modulated as a function of the reduced moisture content. The calculated effective moisture diffusivity is considered as an overall mass migration of moisture inside the material that includes most of the transport mechanisms. It was also found that most of the water contained in the PHWWC is free water. The thermal efficiency of the conductive drying is up to 86%. The water evaporation capacity of the conductive drying system is ranged from 1.149 to 1.89 kg water/m2·h for the range of the supplied conductive heat energy used in this study (1693–2382 W/m2) and for the sample thicknesses of 1 and 2 cm. The results of this study could be a tool for designing a suitable industrial dryer for phosphate washing waste clay. In perspective, we would like to highlight the effect of adding mixing frequency to the conductive drying system and investigating the integration of different solar thermal technology to the conductive drying system.

Author Contributions

Conceptualization, F.B.; data curation, Y.B. and A.H.; investigation, F.A.N.; project administration, N.O.; supervision, N.O. and L.M.; validation, F.B., Y.B. and A.H.; writing—original draft, F.B.; writing—review and editing, L.B., A.I., H.E.M. and L.M. All authors have read and agreed to the published version of the manuscript.

Funding

The APC was funded by the OCP-Foundation-UM6P-CNRST-R&D research project referenced TRT-NAI-01/2017.

Data Availability Statement

Not applicable.

Acknowledgments

A big thank to the National Center for Research and Studies on Water and Energy (Cadi Ayyad University, Morocco) for the technical and scientific support to this work.

Conflicts of Interest

The authors declare no conflict of interest.

Appendix A

Thermal conductivity of water [25]:
k w = 2.9 · 10 11 T 4 + 4.1 · 10 8 T 3 0.016 · 10 3 T 2 + 2.5 · 10 3 T + 0.55
Density of water [19]:
ρ w = 999.9 + 0.0315   ( T 273.15 ) 0.0057   ( T 273.15 ) 2
Latent heat of vaporization of water [22]:
  L v = 4185.5   ( 597 0.56 · T )
Thermal conductivity of air [22]:
k a = 7.57 · 10 5 T + 0.0242
Density of air [22]:
ρ a = 353 T + 273
The supplied conductive heat flux density Q c :
Q c = ( T h T 0 )   ( e a k a + e m a r b k m a r b + e c k c )
The required evaporation heat Q e :
Q e = Q c h c o n v   ( T 3 T a )

References

  1. Loutou, M.; Hajjaji, M.; Mansori, M.; Favotto, C.; Hakkou, R. Phosphate waste clay: Thermal transformation and use as light weight aggregate material. J. Environ. Manag. 2013, 130, 354–360. [Google Scholar] [CrossRef] [PubMed]
  2. Mehahad, M.S.; Bounar, A. Ressources Minérale; Centre National de Documentation du Maroc: Rabat, Morocco, 2008. [Google Scholar]
  3. Hakkou, R.; Benzaazouab, M.; Bussièreb, B. Valorization of phosphate waste rocks and sludge from the Moroccan phosphate mines: Challenges and perspectives. Procedia Eng. 2016, 138, 110–118. [Google Scholar] [CrossRef] [Green Version]
  4. Siebielec, G.; Ukalska-Jaruga, A.; Kidd, P. Bioavailability of trace elements in soils amended with high-phosphate materials. In Phosphate in Soils: Interaction with Micronutrients, Radionuclides and Heavy Metals; CRC Press: Boca Raton, FL, USA, 2014; pp. 237–268. [Google Scholar]
  5. Waheed, K.N.; Ijaz, N.; Khatoon, Z.; Hayat, S.; Nuzhat, U. Effects of pH on release of phosphorus from rock phosphate at different temperatures against the various time intervals involved. Inter. J. Biosci. 2017, 10, 202–209. [Google Scholar]
  6. Ouakibi, O.; Loqman, S.; Hakkou, R.; Benzaazoua, M. The Potential Use of Phosphatic Limestone Wastes in the Passive Treatment of AMD: A Laboratory Study. Mine Water Environ. 2013, 32, 266–277. [Google Scholar] [CrossRef]
  7. Taha, Y.; Benzaazoua, M. Editorial for Special Issue: Recent Trends in Phosphate Mining, Beneficiation and Related Waste Management. Minerals 2019, 9, 755. [Google Scholar] [CrossRef] [Green Version]
  8. Bilali, L.; Benchanaa, M.; El Harfi, K.; Mokhlisse, A.; Outzourhit, A. A detailed study of the microwave pyrolysis of the Moroc-can (Youssoufia) rock phosphate. J. Anal. Appl. Pyrolysis 2005, 73, 1–15. [Google Scholar] [CrossRef]
  9. Loutou, M.; Hajjaji, M.; Mansori, M.; Favotto, C.; Hakkou, R. Heated blends of phosphate waste: Microstructure characterization, effects of processing factors and use as a phosphorus source for alfalfa growth. J. Environ. Manag. 2016, 177, 169–176. [Google Scholar] [CrossRef]
  10. Amrani, M.; Taha, Y.; Kchikach, A.; Benzaazoua, M.; Hakkou, R. Valorization of Phosphate Mine Waste Rocks as Materials for Road Construction. Minerals 2019, 9, 237. [Google Scholar] [CrossRef] [Green Version]
  11. Shen, Z.; Zhang, Q.; Cheng, W.; Chen, Q. Radioactivity of Five Typical General Industrial Solid Wastes and its Influence in Solid Waste Recycling. Minerals 2019, 9, 168. [Google Scholar] [CrossRef] [Green Version]
  12. Hakkou, R.; Benzaazoua, M.; Bussière, B. Laboratory Evaluation of the Use of Alkaline Phosphate Wastes for the Control of Acidic Mine Drainage. Mine Water Environ. 2009, 28, 206–218. [Google Scholar] [CrossRef]
  13. Bennamoun, L.; Arlabosse, P.A. Leonard, Review on fundamental aspect of application of drying process to wastewater sludge Renew. Sustain. Energy Rev. 2013, 28, 29–43. [Google Scholar] [CrossRef] [Green Version]
  14. Kousksou, T.; Allouhi, A.; Belattar, M.; Jamil, A.; El Rhafiki, T.; Zeraouli, Y. Morocco’s strategy for energy security and low-carbon growth. Energy 2015, 84, 98–105. [Google Scholar] [CrossRef]
  15. Haneklaus, N.; Schroders, S.; Zheng, Y.; Allelein, H.J. Economic evaluation of flameless phosphate rock calcination with con-centrated solar power and high temperature reactors. Energy 2017, 140, 1148–1157. [Google Scholar] [CrossRef]
  16. Haneklaus, N.; Zheng, Y.; Allelein, H.-J. Stop Smoking—Tube-In-Tube Helical System for Flameless Calcination of Minerals. Processes 2017, 5, 67. [Google Scholar] [CrossRef] [Green Version]
  17. Chauhan, P.S.; Kumar, A. Thermal modeling and drying kinetics of gooseberry drying inside north wall insulated greenhouse dryer. Appl. Eng. 2018, 130, 587–597. [Google Scholar] [CrossRef]
  18. Chauhan, P.S.; Kumar, A.; Gupta, B. A review on thermal models for greenhouse dryers. Renew. Sustain. Energy Rev. 2017, 75, 548–558. [Google Scholar] [CrossRef]
  19. Ameria, B.; Hanini, S.; Benhamou, A.; Chibane, D. Comparative approach to the performance of direct and indirect solar dry-ing of sludge from sewage plants, experimental and theoretical evaluation. Sol. Energy 2018, 159, 722–732. [Google Scholar] [CrossRef]
  20. Louarn, S.; Ploteau, J.P.; Glouannec, P.; Noel, H. Experimental and Numerical Study of Flat Plate sludge Drying at Low Temperature by Convection and Direct Conduction. Dry. Technol. 2014, 32, 1664–1674. [Google Scholar] [CrossRef]
  21. Ceaglske, N.H.; Hougen, O.A. Drying of granular solids. Ind. Eng. Chem. 1937, 29, 805–813. [Google Scholar] [CrossRef]
  22. Slim, R.; Zoughaib, A.; Clodic, D. Modelling of a solar and heat pump sludge drying system. Int. J. Refrig. 2008, 31, 1156–1168. [Google Scholar] [CrossRef]
  23. Vu, H.T.; Tsotsas, E. Mass and Heat Transport Models for Analysis of the Drying Process in Porous Media: A Review and Numerical Implementation. Int. J. Chem. Eng. 2018, 2018, 1–13. [Google Scholar] [CrossRef]
  24. Mourad, M.; Hemati, M.; Laguerie, C. A New Correlation for the Estimation of Moisture Diffusivity in Corn Kernels from Drying Kinetics. Dry. Technol. 1996, 14, 873–894. [Google Scholar] [CrossRef]
  25. Vargaftik, N.B.; Vinogradov, J.K.; Yargin, V.S. Handbook of Physical Properties of Liquids and Gases: Pure Substances and Mixtures, 3rd ed.; Begell House: New York, NY, USA, 1996. [Google Scholar]
  26. Kumar, C.; Joardder, M.U.; Farrell, T.W.; Millar, G.J.; Karim, A. A porous media transport model for apple drying. Biosyst. Eng. 2018, 176, 12–25. [Google Scholar] [CrossRef]
  27. Zhou, T.; Chen, M.; Fu, B.; Liang, B.; Li, Q. Investigation on thermal and moisture migration performance in sand combined with graphite. Appl. Eng. 2018, 145, 212–220. [Google Scholar] [CrossRef]
  28. Berroug, F.; Lakhal, E.; El Omari, M.; Faraji, M.; El Qarnia, H. Thermal performance of a greenhouse with a phase change material north wall. Energy Build. 2011, 43, 3027–3035. [Google Scholar] [CrossRef]
  29. Bennamoun, L.; Khama, R.; Léonard, A. Convective drying of a single cherry tomato: Modeling and experimental study. Food Bioprod. Process. 2015, 94, 114–123. [Google Scholar] [CrossRef]
  30. Front, R.; Gomez-Rico, M.F.; Fullana, A. Skin effect in the heat and mass transfer model for sewage sludge drying. Sep. Pur. Technol. 2011, 77, 146–161. [Google Scholar]
  31. Huang, Y.W.; Chen, M.Q.; Jia, L. Assessment on thermal behavior of municipal sewage sludge thin layer during hot air forced convective drying. Appl. Therm. Eng. 2016, 96, 209–216. [Google Scholar] [CrossRef]
  32. Krischer, O.; Kast, W. Die Wissenschaftlichen Grundlagen der Trocknungstechnik, Erster Band, Dritte Auflage; Springer: Berlin/Heidelberg, Germany, 1992. [Google Scholar]
  33. Bennamoun, L.; Kahlerras, L.; Michel, F.; Courard, L.; Salmon, T.; Fraikin, L. Determination of moisture diffusivity during dry-ing of mortar cement: Experimental and modeling study. Int. J. Energy Eng. 2013, 3, 1–6. [Google Scholar]
  34. Kemp, I.C.; Fyhr, C.; Laurent, S.; Roques, M.A.; Groenewold, C.E.; Tsotsas, E. Methods for processing experimental drying kinetics data. Dry. Technol. 2001, 19, 15–34. [Google Scholar] [CrossRef]
  35. Madiouli, J.; Sghaier, J.; Lecomte, D.; Sammouda, H. Determination of porosity change from shrinkage curves during drying of food material. Food Bioprod. Process. 2012, 90, 43–51. [Google Scholar] [CrossRef] [Green Version]
  36. Xanthopoulos, G.; Yanniotis, S.; Boudouvis, A. Numerical Simulation of Variable Water Diffusivity during Drying of Peeled and Unpeeled Tomato. J. Food Sci. 2012, 77, E287–E296. [Google Scholar] [CrossRef] [PubMed]
  37. Qiu, J.; Kloosterboer, K.; Guo, Y.; Boom, R.M.; Schutyser, M.A. Conductive thin film drying kinetics relevant to drum drying. J. Food Eng. 2019, 242, 68–75. [Google Scholar] [CrossRef]
  38. Vasic, M.; Grbavcic, Z.; Radojević, Z. Analysis of Moisture Transfer During the Drying of Clay Tiles with Particular Reference to an Estimation of the Time-Dependent Effective Diffusivity. Dry. Technol. 2014, 32, 829–840. [Google Scholar] [CrossRef]
  39. Chemkhi, S.; Zagrouba, F. Water diffusion coefficient in clay material from drying data. Desalination 2005, 185, 491–498. [Google Scholar] [CrossRef]
  40. Kowalski, S.J. Thermomechanical approach to shrinking and cracking phenomena in drying. Dry. Technol. 2001, 19, 731–765. [Google Scholar] [CrossRef]
  41. Somiya, S.; Aldinger, F.; Claussen, N.; Priggs, M.R.; Uchino, K.; Koumoto, K.; Kaneno, M. Handbook of Advanced Ceramics: Vol. Processing and Application; Elsevier: London, UK, 2003. [Google Scholar]
Figure 1. Scheme of the experimental set-up.
Minerals 11 00482 g001
Figure 2. Thermal model of the conductive drying of PHWWC.
Minerals 11 00482 g002
Figure 3. Variation of the moisture content versus time, (a): 1 cm and (b): 2 cm.
Minerals 11 00482 g003
Figure 4. Variation of the drying rate versus the moisture content, (a): 1 cm and (b): 2 cm.
Minerals 11 00482 g004
Figure 5. Evolution of the PHWWC sample form during the drying process.
Minerals 11 00482 g005
Figure 6. Variation of volume versus the reduced moisture content.
Minerals 11 00482 g006
Figure 7. Measured and simulated temperatures inside the PHWWC drying sample for different temperatures Th (110, 120 and 135 °C) and thicknesses (1, 2 cm).
Minerals 11 00482 g007
Figure 8. Variation of the effective moisture diffusivity versus the reduced moisture content, (a): 1 cm and (b): 2 cm.
Minerals 11 00482 g008
Table 1. Chemical and mineralogical composition of phosphate waste clay [3].
Chemical Composition (wt.%)
SiO2Al2O3CaOMgONa2OK2OTiO2P2O5Cr2O3Fe2O3
22.82.4834.24.110.770.40.17140.10.91
Mineralogical Composition (wt.%)
Quartz 17Dolomite 7Calcite 15Fluorapatite 44Smectite clay 7
Table 2. Characteristics of fresh PHWWC samples.
AnalysisUnitSample Content
Moisture content%82 ± 2
Volatile solids%7.78 ± 0.6
pH-9.01 ± 0.06
Electrical conductivity ( μ s / cm )   at   20   ° C 1528 ± 10
SalinityPSU0.755 ± 0.02
Total organic carbon% COT164 ± 0.16
Limestone (CaCo3)%20.5 ± 1.1
Total phosphorusPpm2614 ± 168
Zinc (Zn)Ppm244.38 ± 11
Lead (Pb)Ppm6.43 ± 0.11
Copper (Cu)Ppm1.64 ± 0.16
Cadmium (Cd)Ppm12.9 ± 0.75
Table 3. Characteristics of the experimental materials.
MaterialCharacteristics
Infrared CameraFLIR SC300-Series, Sweden
Heating plateVELP SCIENTIFICA, Italy
Temperature, humidity and velocity sensorTesto 174H, Testo 400, Type K, Germany
BalanceSartorius, Germany
Thermal conductivity apparatusJeulin 253118, France
Table 4. Polynomial fitting of the effective moisture diffusivity δeff.
TemperaturesPolynomial ModelR2
135 °C 10 9 δ e f f = 0.2 + 94.6 X X 0 297 ( X X 0 ) 2 + 349 ( X X 0 ) 3 144 ( X X 0 ) 4 0.997
120 °C 10 9 δ e f f = 0.3 + 64 X X 0 165 ( X X 0 ) 2 + 158 ( X X 0 ) 3 556 ( X X 0 ) 4 0.988
110 °C 10 9 δ e f f = 0.38 + 38.9 X X 0 75 ( X X 0 ) 2 + 48 ( X X 0 ) 3 10.8 ( X X 0 ) 4 0.997
Table 5. Thermal drying parameters and efficiency.
Sample
Thickness
Supplied Energy
(Wm−2)
Evaporation Energy
(Wm−2)
Thermal
Efficiency
Evaporation Capacity
(kg Water/m2·h)
1 cm1693 (Th = 110 °C)149387%1.149
1755 (Th = 120 °C)151186%1.450
2307 (Th = 135 °C)208190%1.830
2 cm1712 (Th = 110 °C)152389%1.153
1768 (Th = 120 °C)152186%1.511
2382 (Th = 135 °C)215290%1.890
Publisher’s Note: MDPI stays neutral with regard to jurisdictional claims in published maps and institutional affiliations.

