
Iron Isotope Compositions of Coexisting Sulfide and Silicate Minerals in Sudbury-Type Ores from the Jinchuan Ni-Cu Sulfide Deposit: A Perspective on Possible Core-Mantle Iron Isotope Fractionation

 ,
,
Abstract
:1. Introduction
- (1)
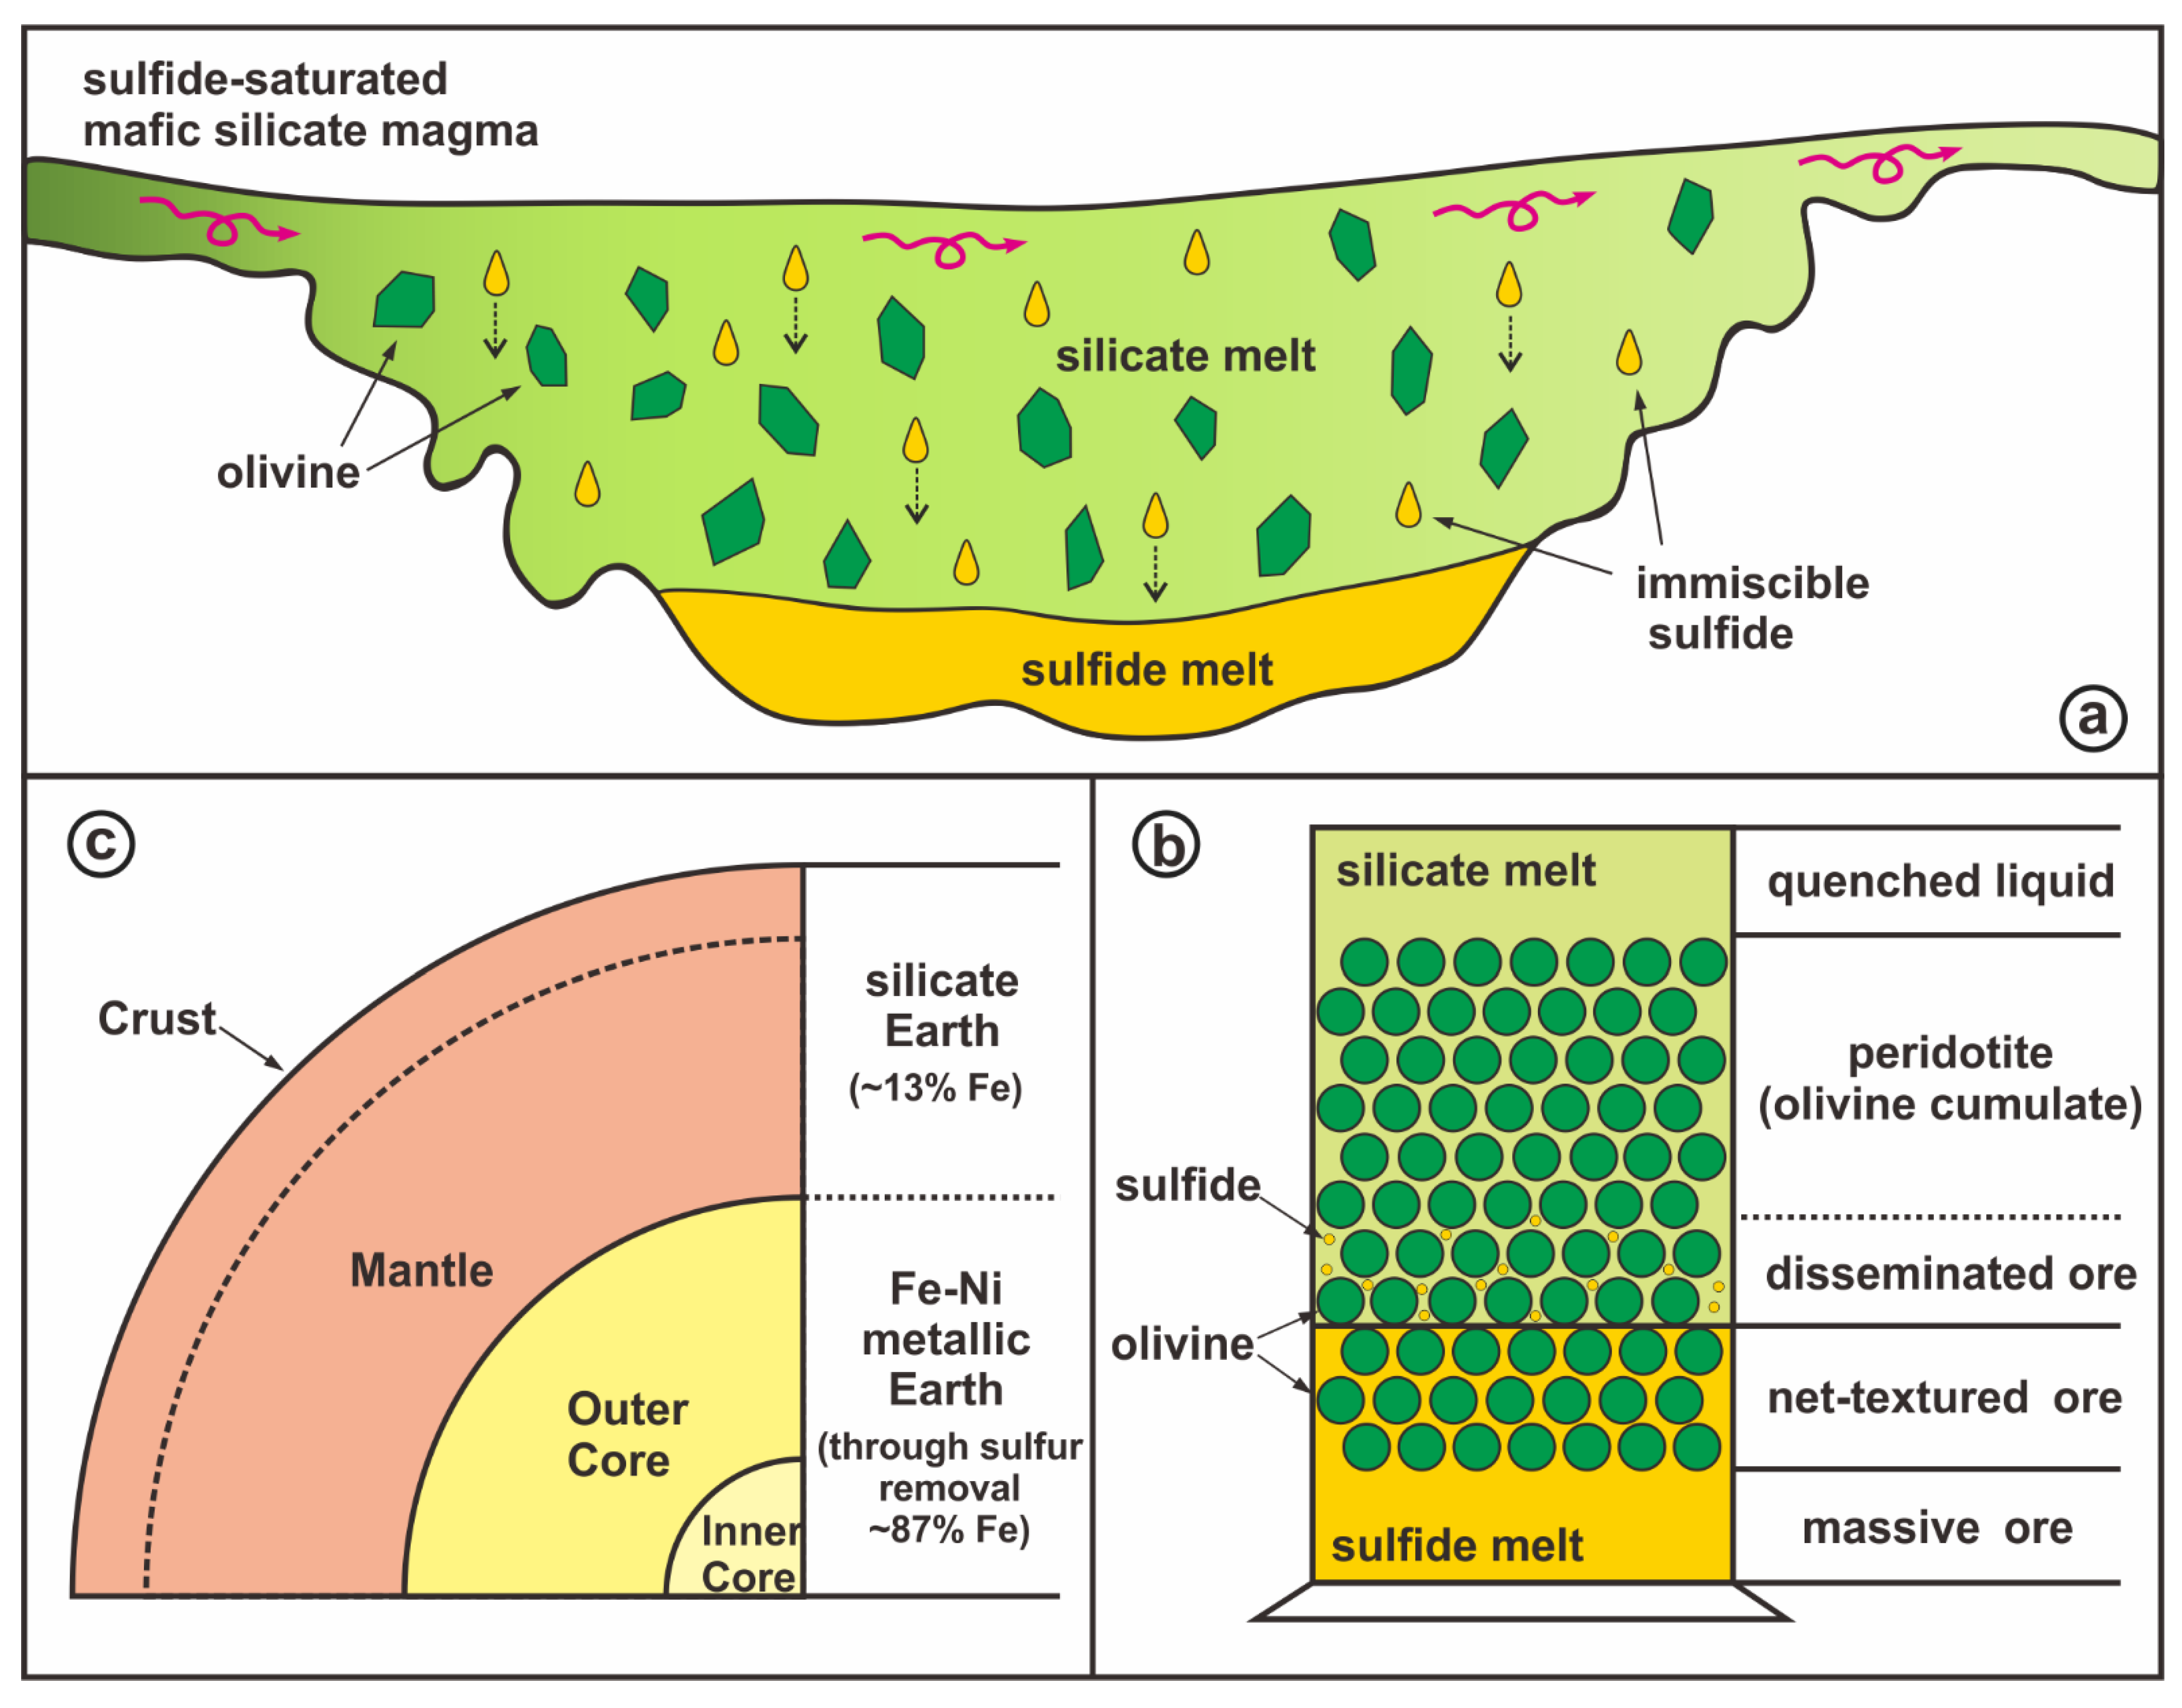
- The core separation was accomplished through silicate melt and sulfide melt segregation due to density difference. The sulfide melt must have then developed into the Fe-Ni metallic core through sulfur removal under core depth pressure-temperature conditions. Hence the prior sulfides and metals must possess the same iron isotope composition, representing that of the metallic core in equilibrium with the silicate Earth (Figure 1).
- (2)
- The core–mantle separation took place under high pressure and temperature in the deep Earth, but the magmatism takes place under upper mantle or deep crustal conditions. We do not ignore the effects of pressure and temperature on potential Fe isotope fractionation, but we use the best natural materials to study this important problem as the strategically must-do first step. The results will form the foundation for further studies.
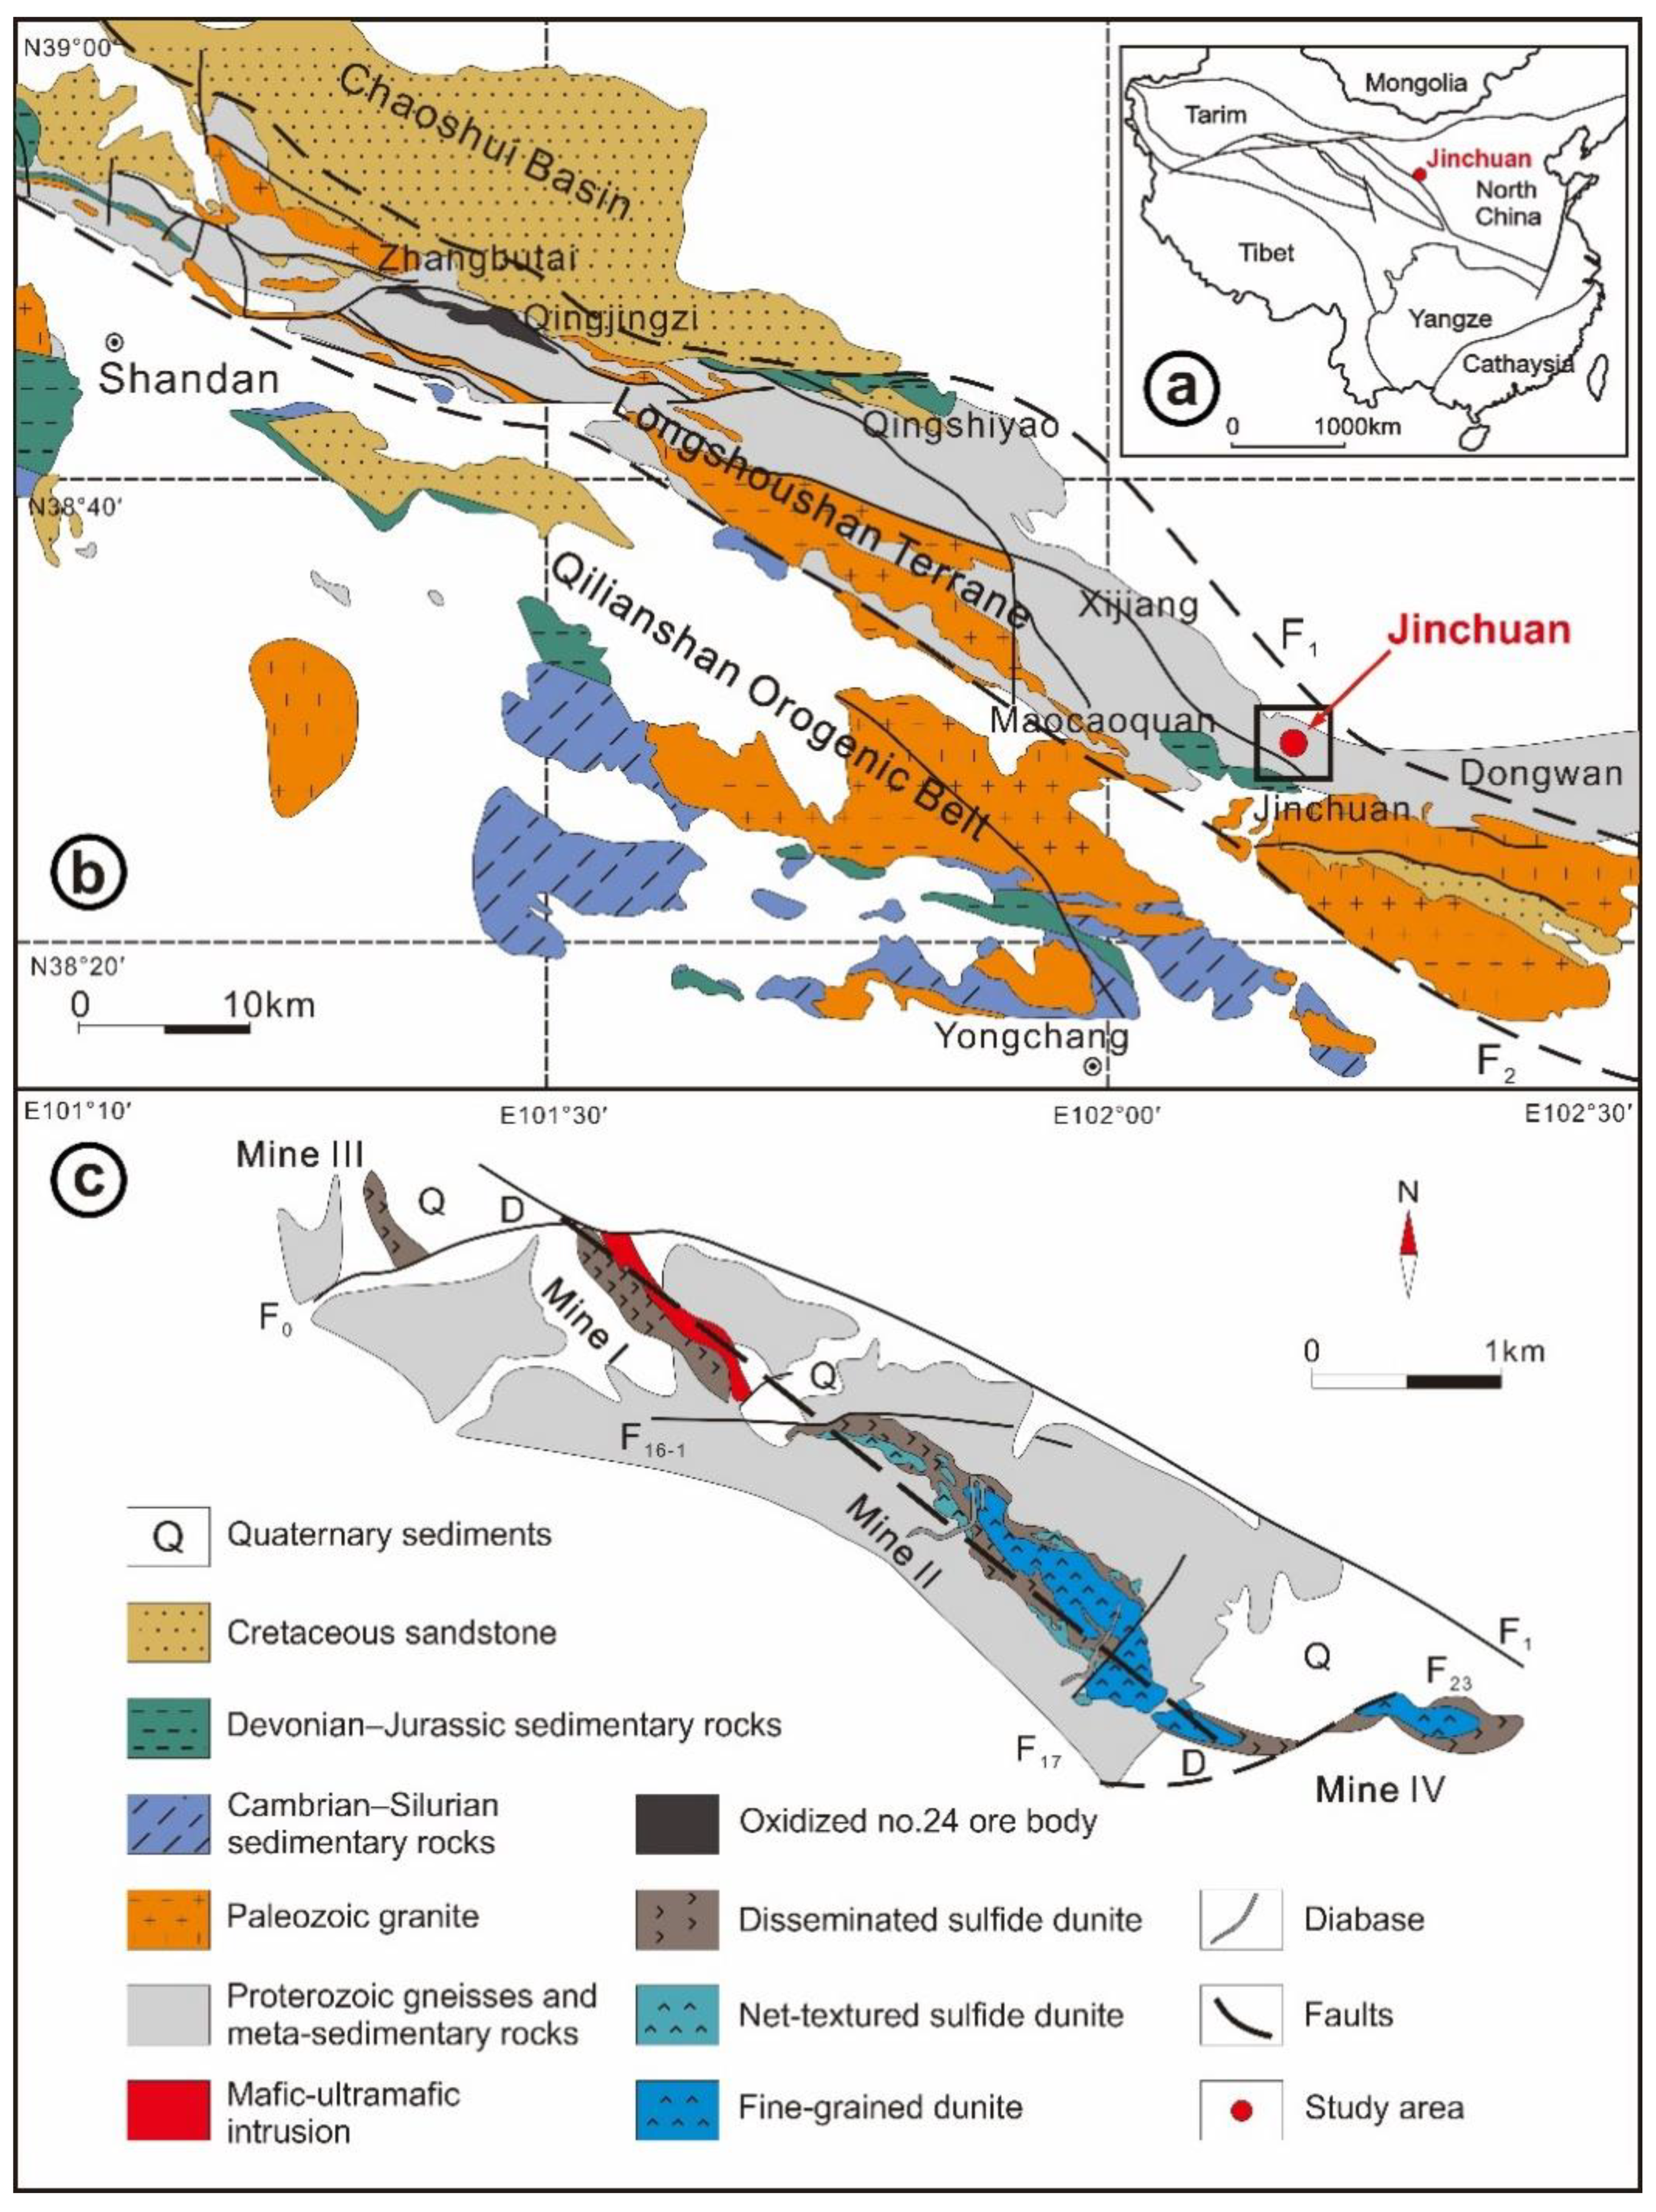
2. Geological Setting
3. Sample and Methods
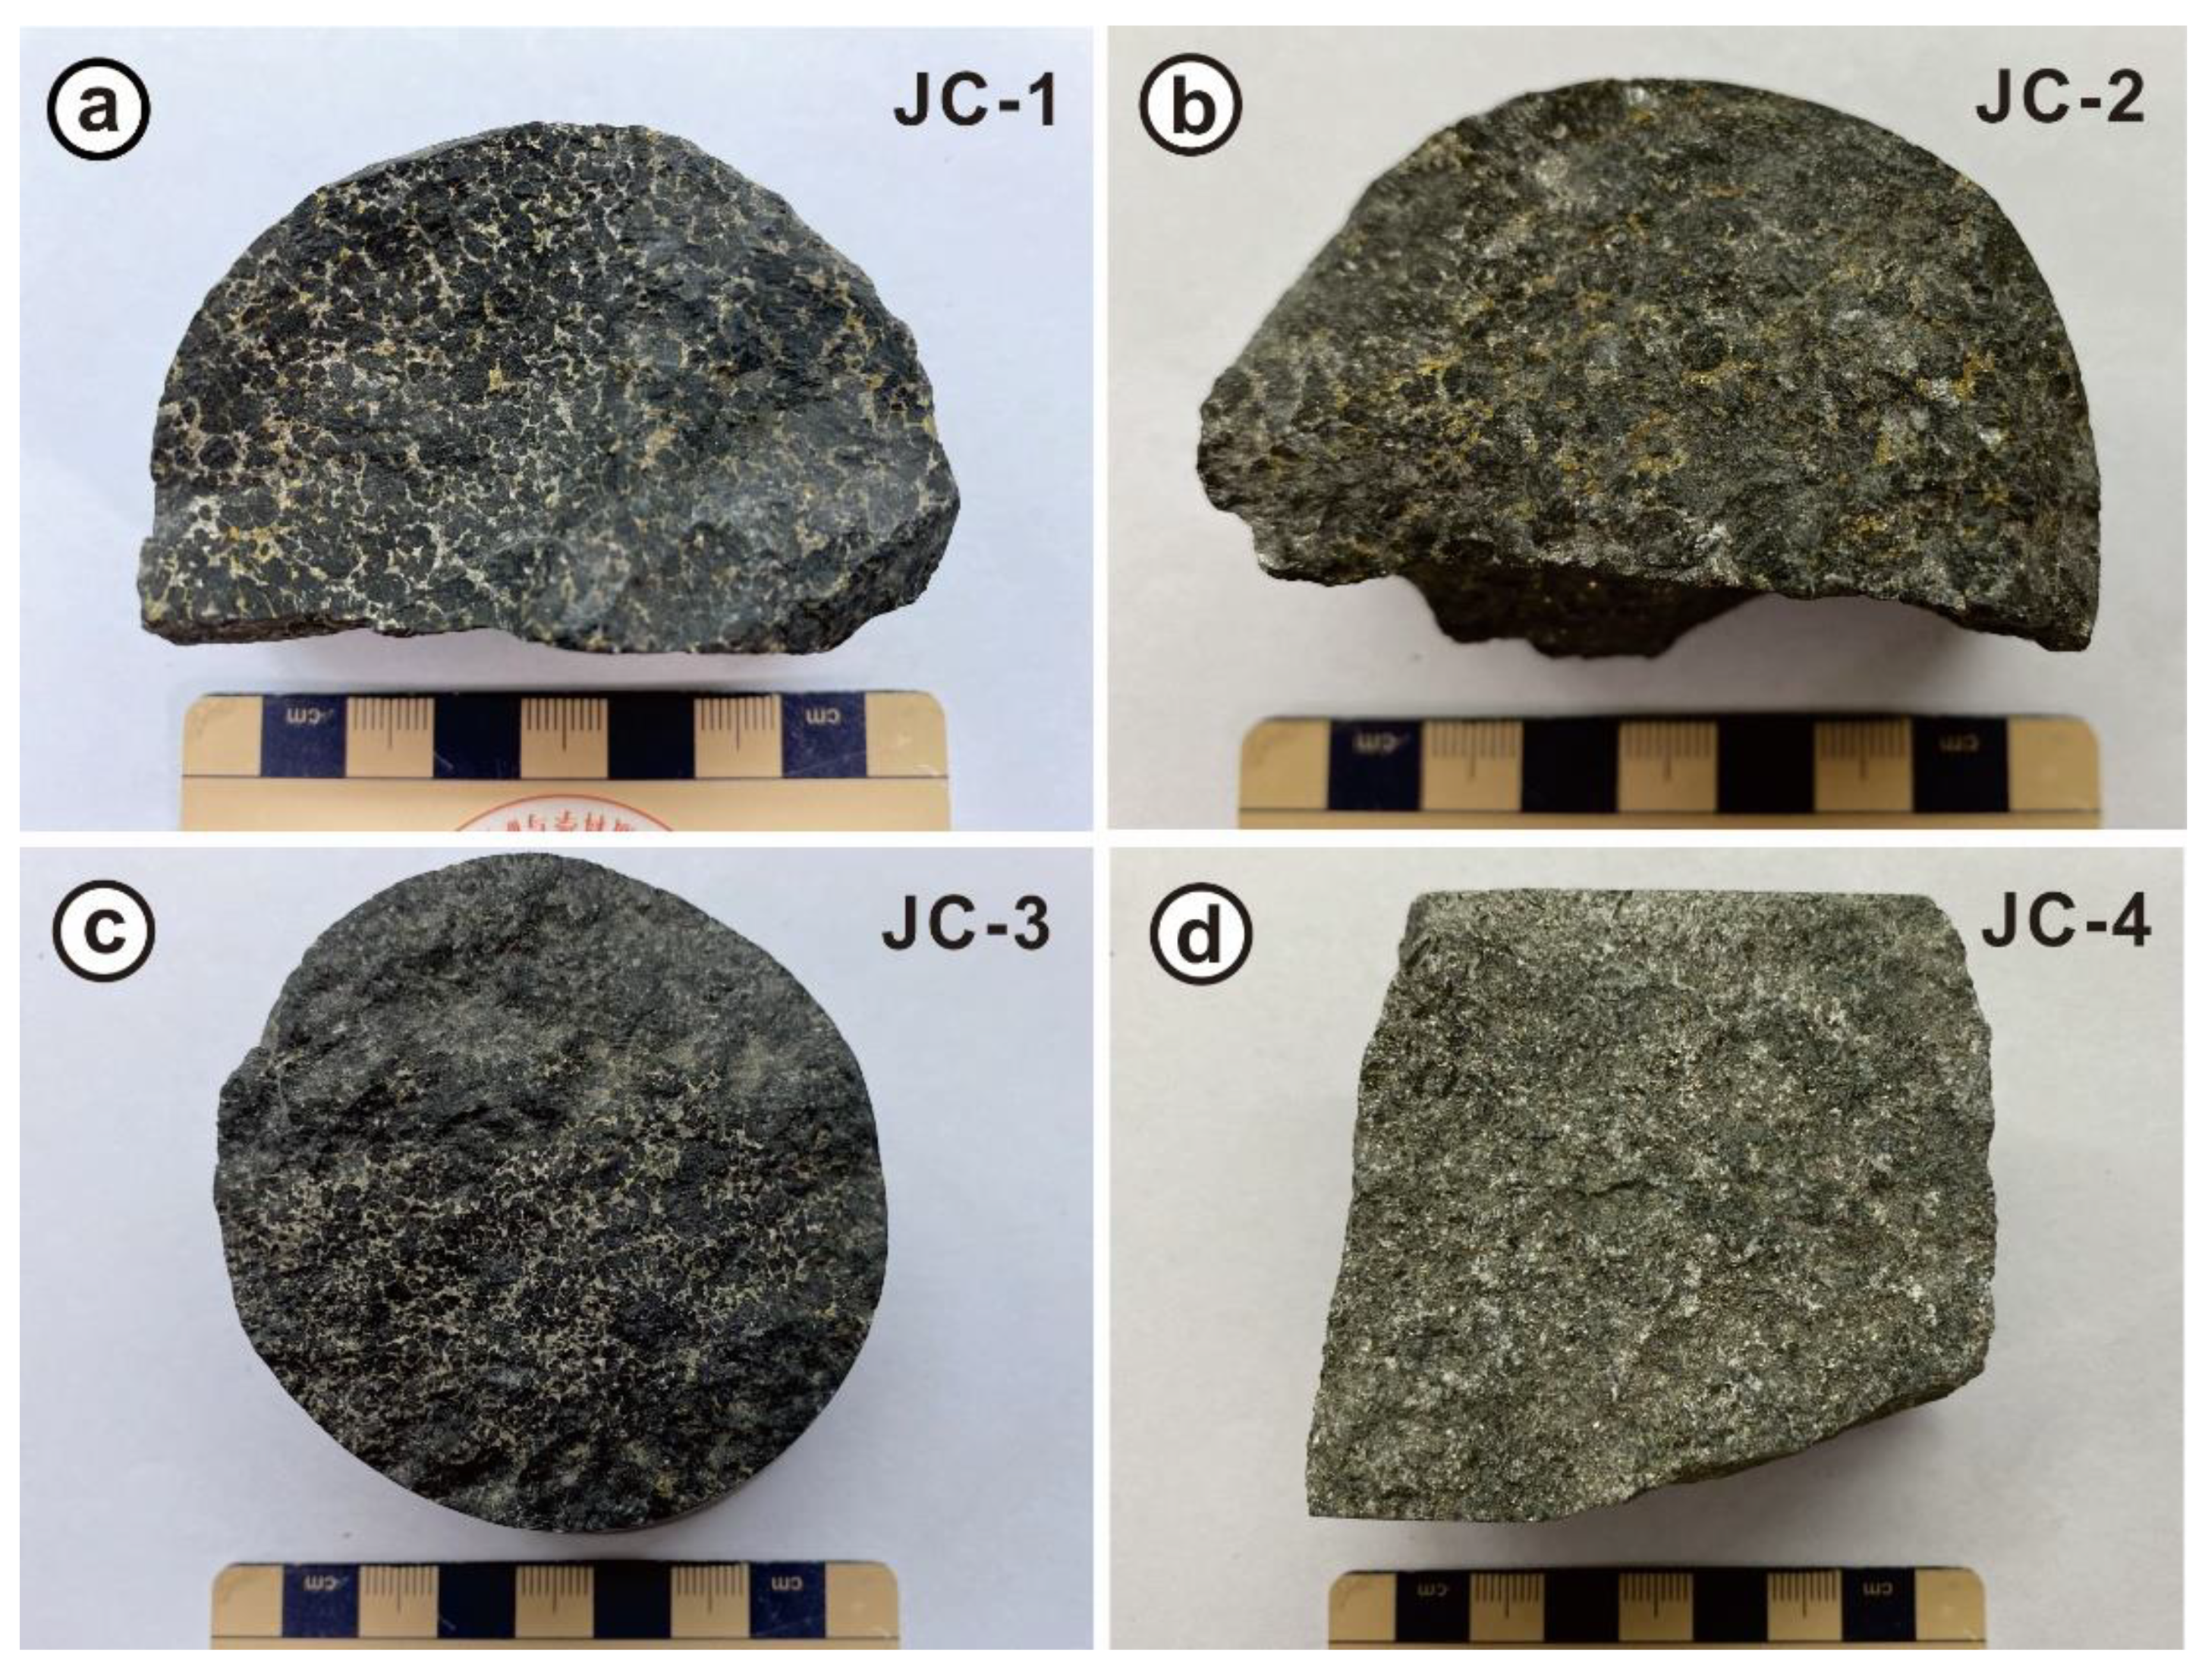
3.1. Sample
3.2. Methods
4. Results
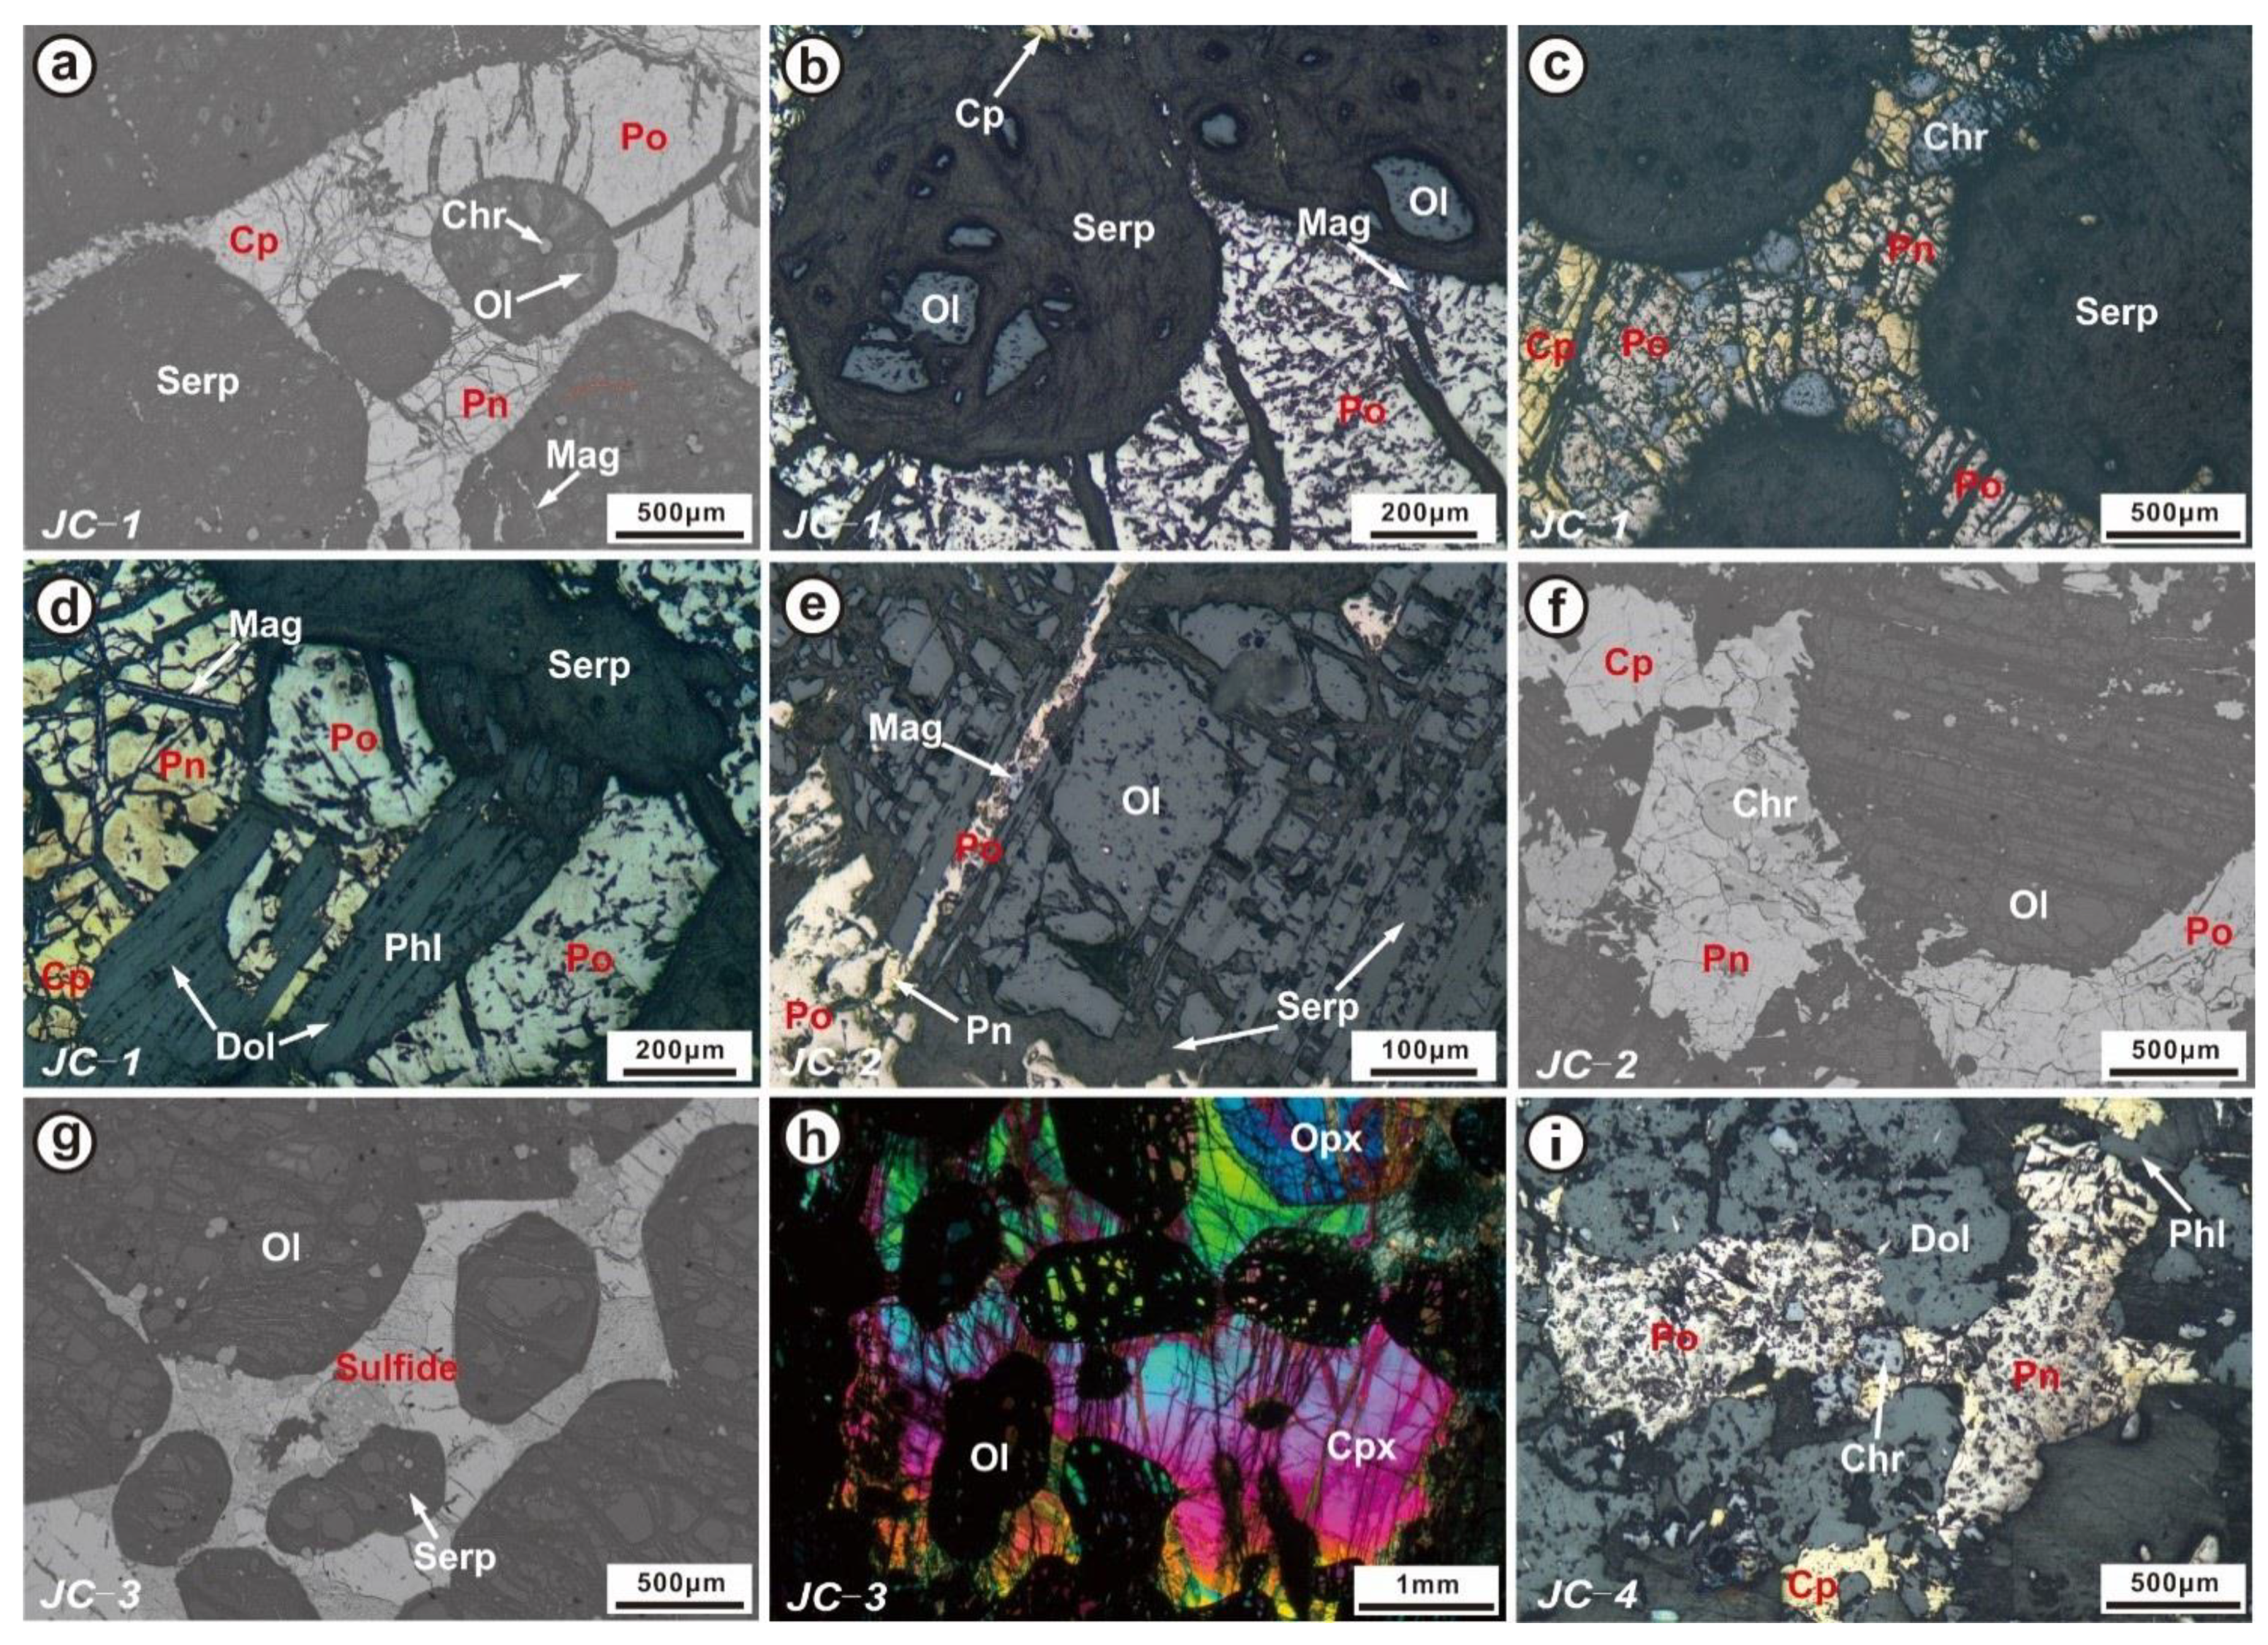
4.1. Mineral Chemistry
4.2. Bulk-Rock Ore Sample Major Element Composition
4.3. Iron Isotopes of Mineral Separates
5. Discussion
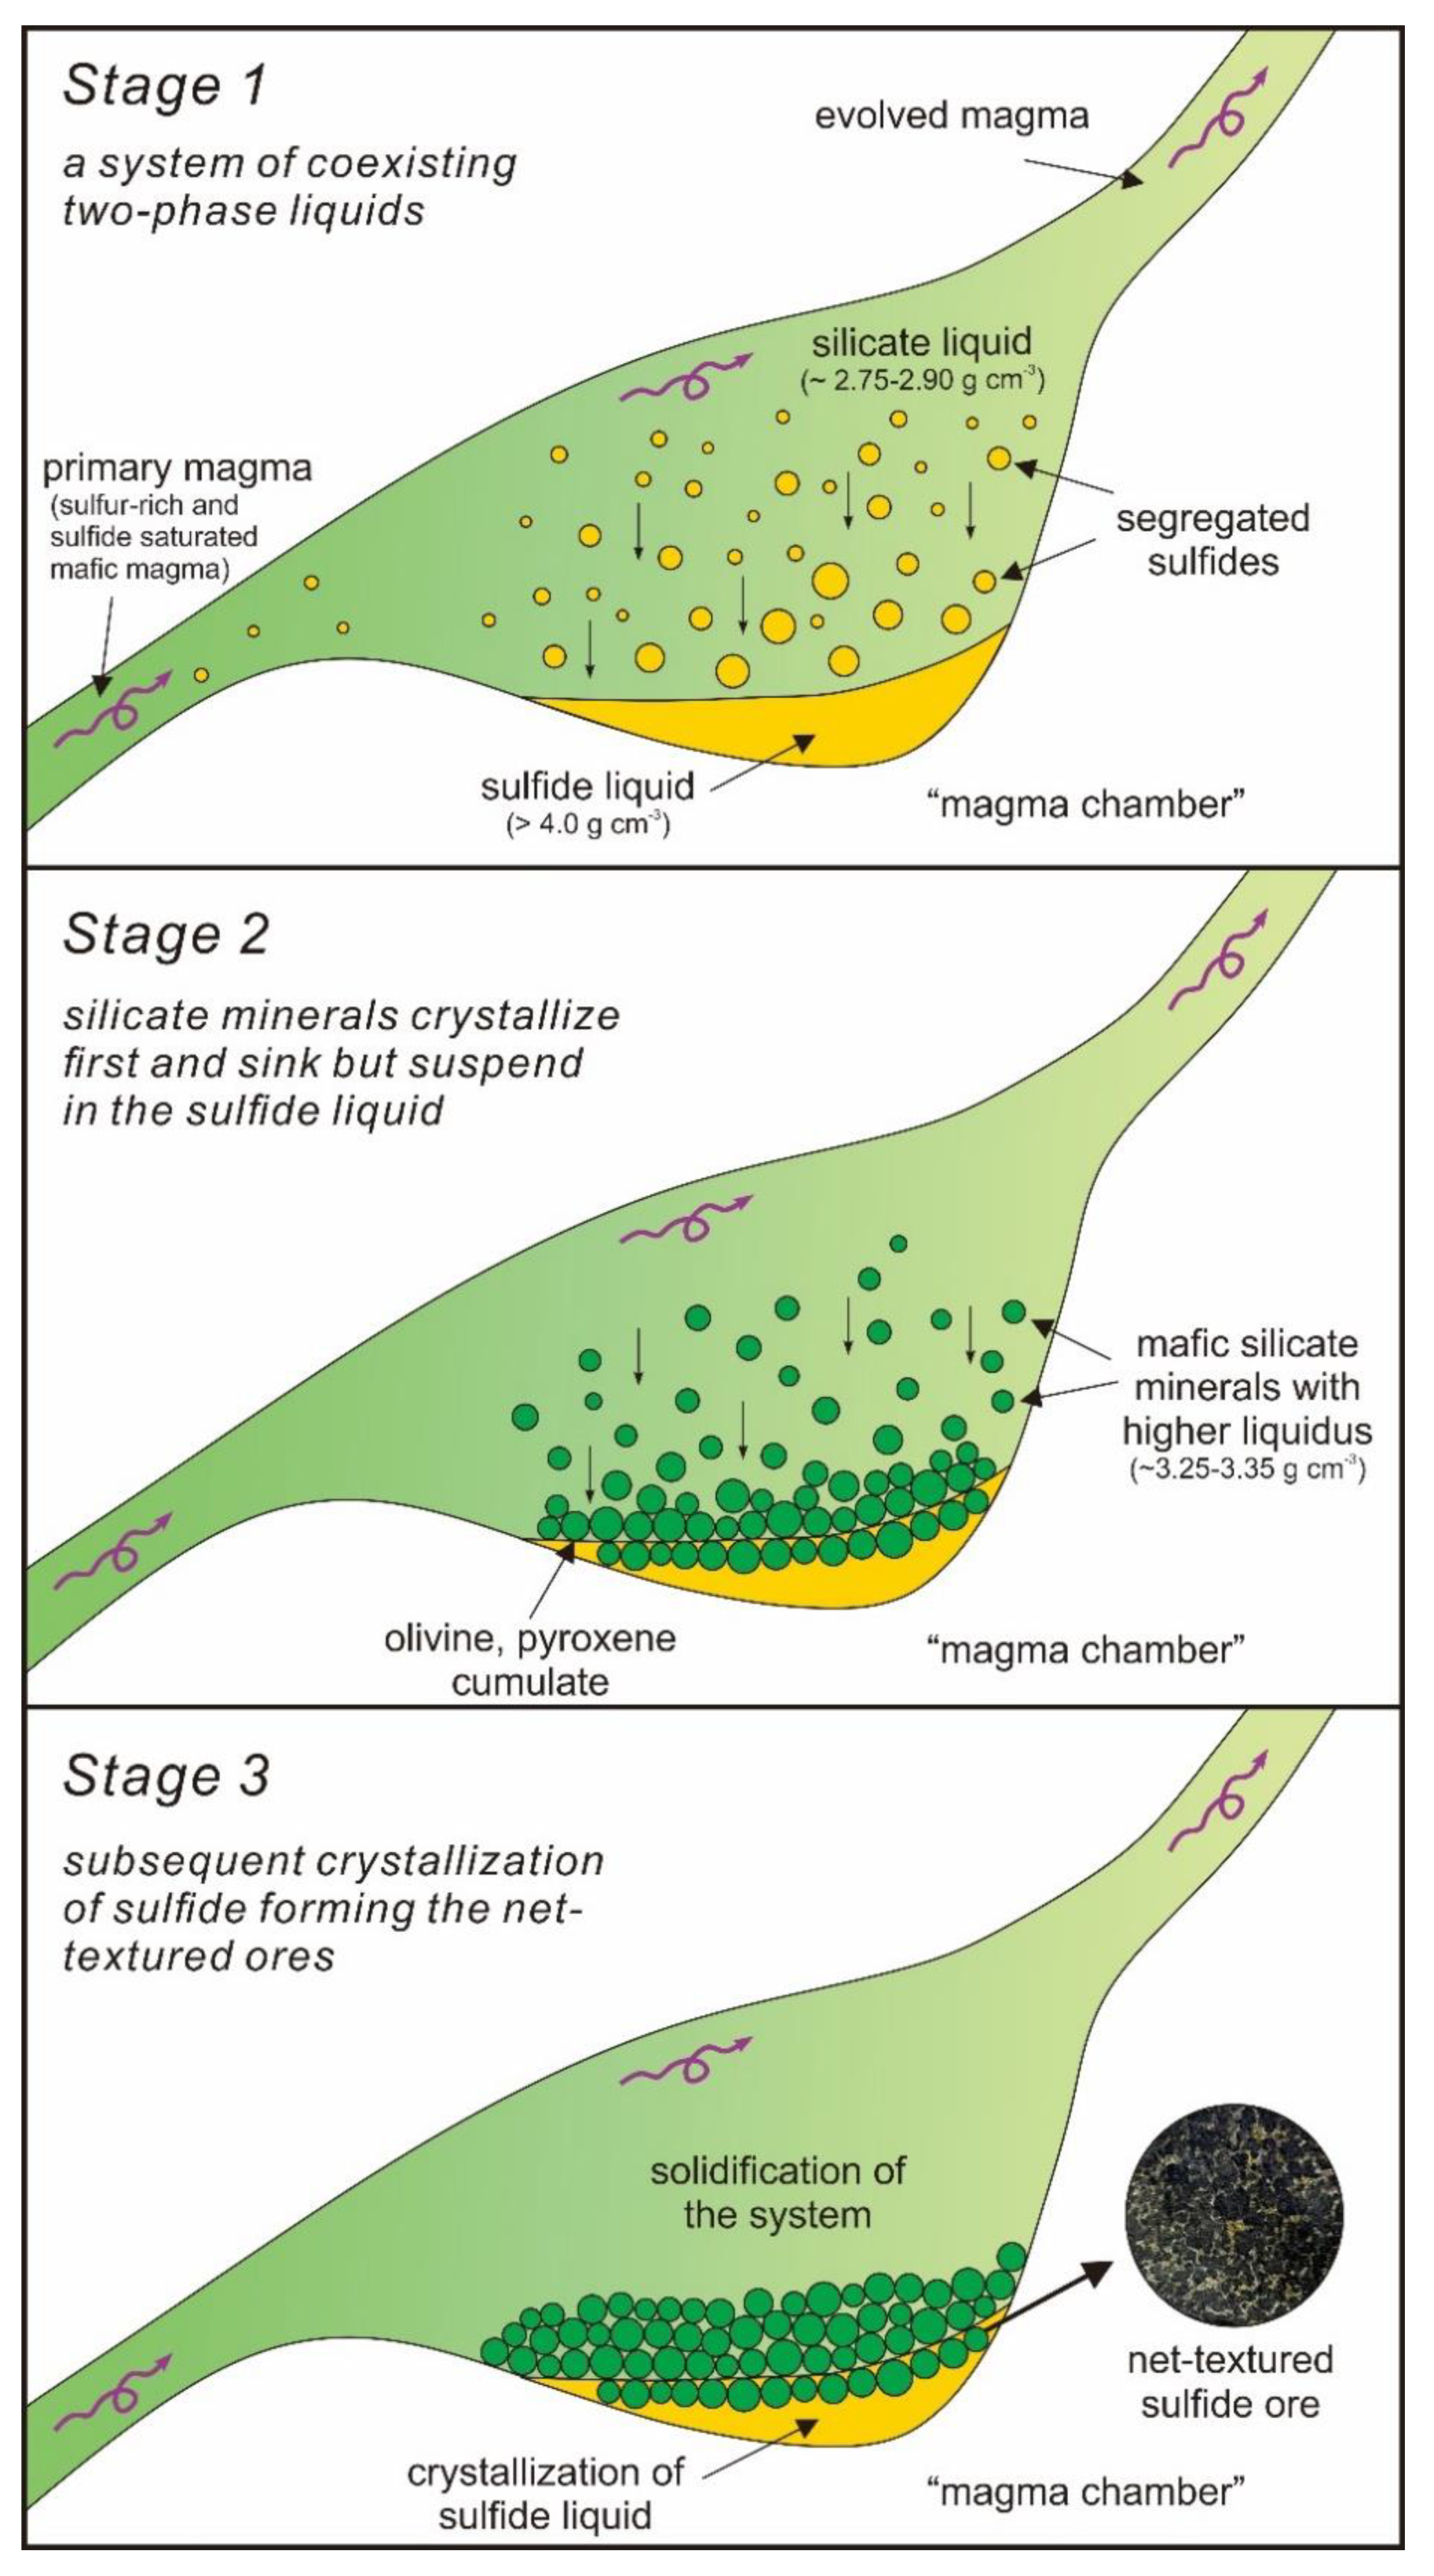
- (1)
- A sulfur-rich and sulfide saturated mafic magma led to sulfide melt exsolution/segregation, forming a system of coexisting two-phase liquids, the silicate liquid and the sulfide liquid.
- (2)
- (3)
- With the higher liquidus temperature, mafic silicate minerals (olivine, orthopyroxene, and clinopyroxene) with densities of 3.25–3.35 g cm−3 [52] begin to crystallize first and tend to sink at the base of the silicate liquid, but would suspend in the denser sulfide liquid, constituting the network texture.
- (4)
- Subsequent crystallization of sulfide liquid and solidification of the system results in the observed net-textured Ni-Cu ores above the massive ores and below the disseminated ores in this density/buoyancy controlled scenario.
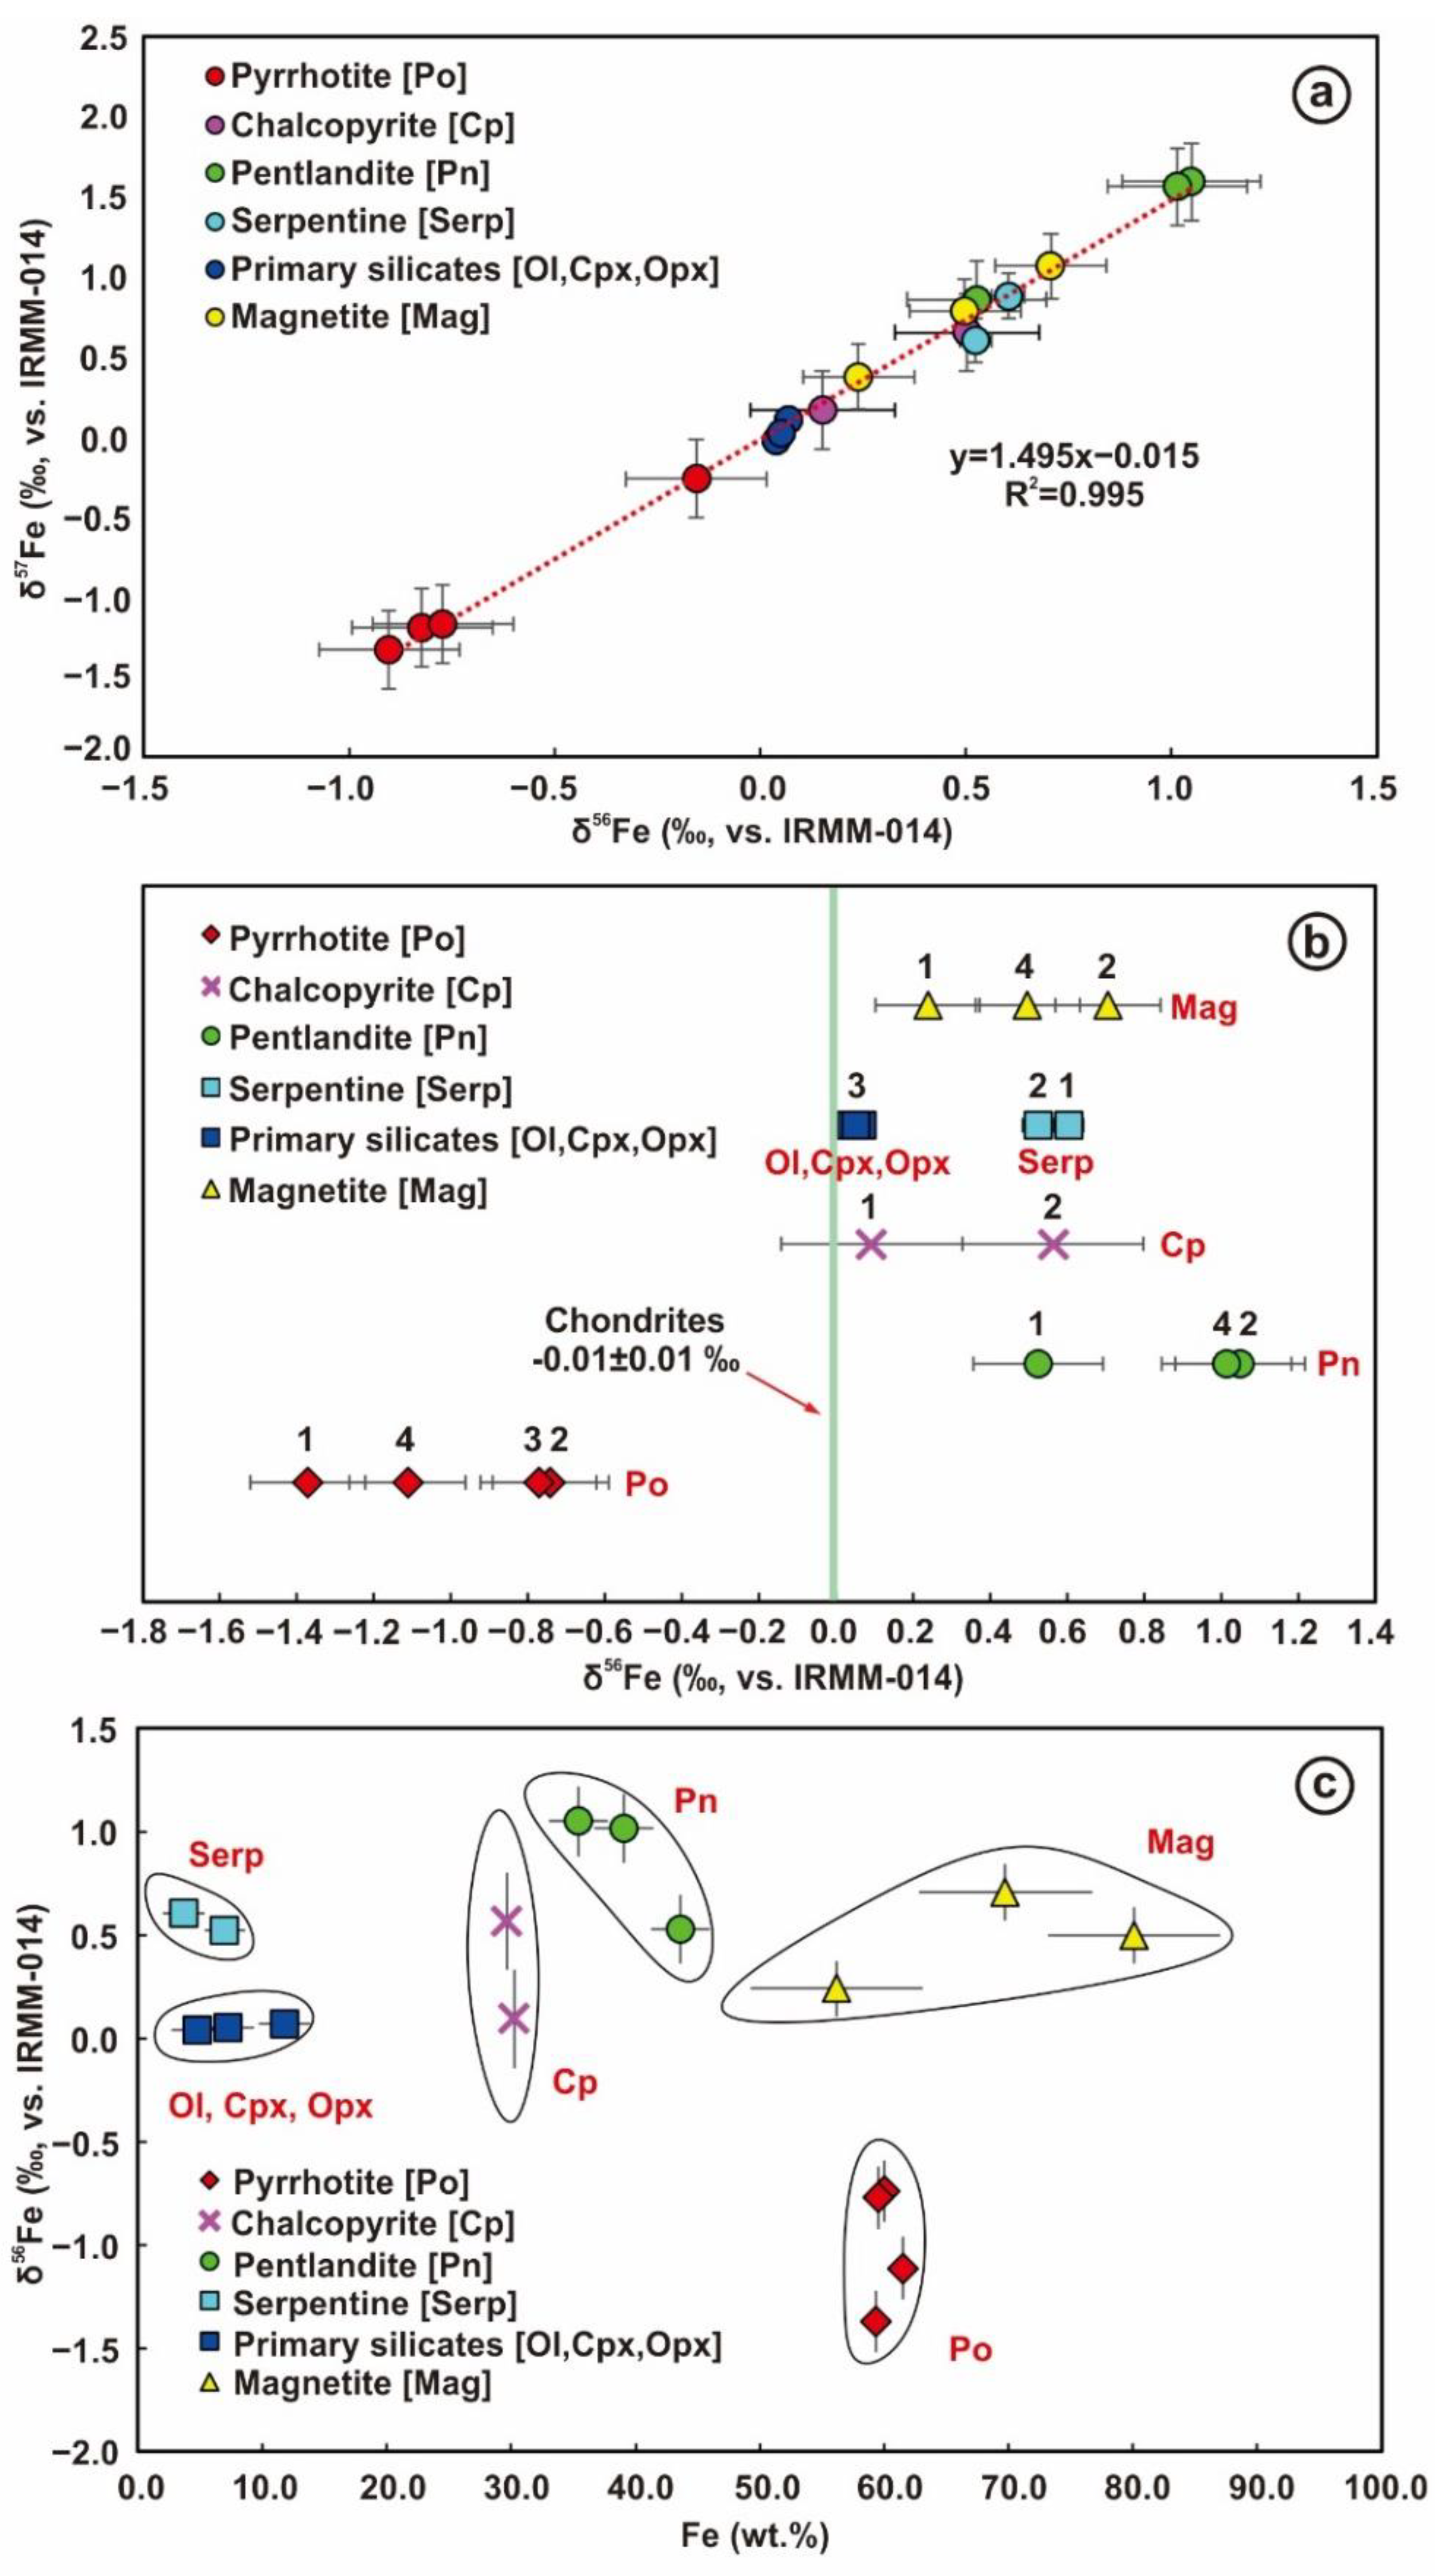
5.1. Iron Isotope Composition of Different Iron-Bearing Minerals
5.1.1. Iron Isotope Compositional Differences between Minerals with Different Valence States
5.1.2. Iron Isotope Compositional Differences between Coexisting Sulfide Minerals
5.1.3. Iron Isotope Compositions of Primary Silicate Minerals
5.1.4. Iron Isotope Compositions of Serpentines
5.2. Constructing Iron Isotope Compositions of Coexisting Sulfide Liquid and Silicate Liquid
5.2.1. Iron Isotope Compositions of the Silicate Liquid
5.2.2. Iron Isotope Compositions of the Sulfide Liquid
- (1)
- By excluding the gains of light Fe isotopes for pyrrhotite caused by serpentinization. The δ56Fe values of the bulk-sulfide of JC-1 and JC-2 would be −0.77‰ and −0.20‰, respectively.
- (2)
- By using pyrrhotite that is less affected by serpentinization in sample JC-3 instead the pyrrhotite in JC-1 and 2, which are strongly serpentinized, the δ56Fe values of the bulk-sulfide of JC-1 and JC-2 would be −0.39‰ and −0.22‰, respectively.
- (3)
- By taking full consideration of the probable gains of light Fe isotopes for pyrrhotite caused by serpentinization, we could use the difference of iron isotope compositions between the serpentine and average of unaltered silicate minerals (δ56Fe = 0.05‰, Ol, Cpx, and Opx) in the net-textured ores, the iron contents of serpentine and pyrrhotite, and the contents of these two minerals in the whole ore respectively to calculate how much lighter are Fe isotope compositions of the pyrrhotite caused by serpentinization as Δ56FePo × WPo × FePo = Δ56FeSerp-Ol × WSerp × FeSerp (WPo = Po content in ore; FePo = iron content in Po; Wserp = Serp content in ore; Feserp% = iron content in Serp), then take the analytical value plus the Δ56FePo calculated above to give the probable value of pyrrhotite before serpentinization as δ56FePo-before serpentinized = δ56FePo-analytical value + Δ56FePo. The δ56Fe values of the bulk-sulfide of JC-1 and JC-2 would be −0.59‰ and −0.11‰, respectively.
- (4)
- If we use pentlandite and chalcopyrite only without including pyrrhotite modified by later serpentinization, we would obtain δ56Fe values of the bulk-sulfide of JC-1 and JC-2 to be 0.32‰ and 0.95‰, respectively.
5.2.3. Differences of Iron Isotopes Between Sulfide Liquid and Silicate Liquid
6. Conclusions
- (1)
- There were three major sulfide minerals (pyrrhotite (Po), chalcopyrite (Cp), and pentlandite (Pn)) in the net-textured ores. The δ56Fe value of these sulfides varied greatly: −1.37–−0.74‰ (Po) < 0.09–0.56‰ (Cp) < 0.53–1.05‰ (Pn).
- (2)
- The silicate minerals were all of cumulate origin, dominated by olivine (Ol) with a small amount of pyroxene (clinopyroxene (Cpx) < orthopyroxene (Opx)). Their δ56Fe values were 0.07 ± 0.03‰ (Ol) > 0.05 ± 0.07‰ (Opx) > 0.04 ± 0.02‰ (Cpx), which were all close to the chondritic values.
- (3)
- By assuming that the coexisting sulfide and silicate minerals of net-textured ores were crystallized/solidified from respective sulfide and silicate liquids segregated from the sulfur-rich and sulfide-saturated parental magma, and by reconstructing the weighted mean iron isotope compositions of bulk-sulfide minerals and bulk-silicate minerals, we obtained the iron isotope composition of the silicate liquid (δ56Fe ≈ 0.21‰) in equilibrium with the silicate minerals (Ol, Cpx, and Opx) and the iron isotope composition of the sulfide liquid (δ56Fe ≈ −0.30‰), which was the best value possible with caveats, including the effect of serpentinization that must have resulted in heavy Fe isotope enrichment in serpentines while light Fe isotope enrichment in the coexisting pyrrhotite.
- (4)
- Our preferred scenario of core formation was through silicate-sulfide liquid segregation followed by sulfur removal. The sulfide liquid iron isotope composition was expected to be the same as the metallic core. Thus, there must be iron isotope fractionation between the metallic core and the silicate mantle according to the significant differences of iron isotope composition between the sulfide liquid and silicate liquid obtained from the Jinchuan net-textured sulfide ore samples with the fractionation factor of Δ56Fesilicate-sulfide ≈ 0.51‰. If we simply compared the difference between the weighted mean bulk-silicate minerals of δ56Fe(0.70ol,0.25opx,0.05cpx) = 0.06‰ with weighted mean bulk-sulfide minerals of δ56Fe ≈ −0.30‰, we would have Δ56Fesilicate-sulfide ≈ 0.36‰. This is still a rather large difference and we do not intend to claim this value to be correct, but emphasize that iron isotope fractionation does take place between silicates and sulfides in the Sudbury-type magmatic sulfide mineralization. We thus hypothesized that iron isotope fractionation must take place during core–mantle separation, and predicted that the bulk Earth must have significantly lighter Fe isotope composition than the chondrites (i.e., δ56Fe < −0.01 ± 0.01‰). We predicted that the Fe isotope analysis of coexisting sulfide-silicate liquids produced experimentally under varying mantle depth conditions will complement the study of the type we reported here and altogether helped provide credible Fe isotope compositions of the bulk-Earth and the possible Fe isotope differences between the Earth’s core and the silicate Earth.
Author Contributions
Funding
Data Availability Statement
Conflicts of Interest
Appendix A
- (1)
- The weight percentages of the major elements FeOT, CuO, and NiO in the impure mineral separates (wt.%; Table 4) are converted into the mole percentages of the elements Fe, Cu, and Ni (mol.%);
- (2)
- According to the empirical molecular formulae given by different sulfides in Table 2, the mole percentage of the element is converted into the mineral molecular percentage (mol.%). Assuming that the coefficients of Fe, Cu, and Ni in the empirical molecular formula of sulfide are x, y, and z respectively, the general molecular formula can be expressed as FexCuyNizSn, which gives pyrrhotite as Fex1Cuy1Niz1S, chalcopyrite as Fex2Cuy2Niz2S2, and pentlandite as Fex3Cuy3Niz3S8;Pentlandite (mol.%) = Ni (mol.%)/z3, chalcopyrite (mol.%) = Cu (mol.%)/y2,Fe content of Pyrrhotite (mol.%) = Total Fe − x3 × Pentlandite (mol.%) − x2 × chalcopyrite (mol.%), and Pyrrhotite (mol.%) = Fe content of Pyrrhotite (mol.%)/x1.
- (3)
- The mole percentage of each sulfide and its empirical molecular formula (Table 2) are converted to the mass percentage (wt.%) of each sulfide, and then normalized to 100%. Sulfide (wt.%) = Sulfide (mol.%) × The relative molecular mass of the empirical molecular formula × 100%.
Appendix B
Appendix C
- (1)
- The major ore elements (such as FeO, CuO, and Cr2O3 in wt.%; Table 4) in the bulk-ore samples (JC-1, 2, and 3) are converted to their molar percentages (such as Fe, Cu, and Cr in mol.%).
- (2)
- The modal mineralogy in mol.% can be calculated using the unique element of each mineral (e.g., Ni in pentlandite, Cu in chalcopyrite, Cr in chromite, etc.). For the elements common in all minerals, simultaneous equations are used.
- (3)
- Since pyrrhotite only contains Fe and S, its modal calculation is done after the modes of all other iron-bearing minerals are completed using the residual Fe of total Fe minus all the Fe already used so as to obtain the modes of all the major minerals in the net-textured ore samples.
- (4)
- Then, convert the molar percentage of each mineral in the bulk-ore samples into weight percentage (wt.%) using the molecular formulae (Table 8): Each mineral (wt.%) = each mineral (mol.%) × relative molecular weight in the experimental molecular formula;
- (5)
- Normalize the above to 100%.
References
- Weyer, S.; Ionov, D.A. Partial melting and melt percolation in the mantle: The message from Fe isotopes. Earth Planet. Sci. Lett. 2007, 259, 119–133. [Google Scholar] [CrossRef]
- Schoenberg, R.; von Blanckenburg, F. Modes of planetary-scale Fe isotope fractionation. Earth Planet. Sci. Lett. 2006, 252, 342–359. [Google Scholar] [CrossRef]
- Zhu, X.K.; Guo, Y.L.; O’Nions, R.K.; Yound, E.D.; Ash, R.D. Isotopic homogeneity of iron in the early solar nebula. Nature 2001, 412, 311–313. [Google Scholar] [CrossRef] [PubMed]
- Poitrasson, F.; Freydier, R. Heavy iron isotope composition of granites determined by high resolution MC-ICP-MS. Chem. Geol. 2005, 222, 132–147. [Google Scholar] [CrossRef]
- Hezel, D.C.; Needham, A.W.; Armytage, R.; Georg, B.; Abel, R.L.; Kurahashi, E.; Coles, B.J.; Rehkamper, M.; Russell, S.S. A nebula setting as the origin for bulk chondrule Fe isotope variations in CV chondrites. Earth Planet. Sci. Lett. 2010, 196, 423–433. [Google Scholar] [CrossRef]
- Dauphas, N.; Craddock, P.R.; Asimow, P.D.; Bennett, V.C.; Nutman, A.P.; Ohnenstetter, D. Iron isotopes may reveal the redox conditions of mantle melting from Archean to Present. Earth Planet. Sci. Lett. 2009, 288, 255–267. [Google Scholar] [CrossRef]
- Wang, Y.; Zhu, X.K. Fe isotope systematics and its implications in ore deposit geology. Acta Petrol. Sin. 2012, 28, 3638–3654. (In Chinese) [Google Scholar]
- Poitrasson, F.; Halliday, A.N.; Lee, D.C.; Levasseur, S.; Teutsch, N. Iron isotope differences between Earth, Moon, Mars and Vesta as possible records of contrasted accretion mechanisms. Earth Planet. Sci. Lett. 2004, 223, 253–266. [Google Scholar] [CrossRef]
- Dauphas, N.; John, S.G.; Rouxel, O. Iron isotope systematics. Rev. Mineral. Geochem. 2017, 82, 415–510. [Google Scholar] [CrossRef]
- Dauphas, N.; Roskosz, M.; Alp, E.; Golden, D.; Sio, C.; Tissot, F.; Hu, M.; Zhao, J.; Gao, L.; Morris, R. A general moment NRIXS approach to the determination of equilibrium Fe isotopic fractionation factors: Application to goethite and jarosite. Geochim. Cosmochim. Acta 2012, 94, 254–275. [Google Scholar] [CrossRef] [Green Version]
- Dauphas, N.; Roskosz, M.; Alp, E.; Neuville, D.; Hu, M.; Sio, C.; Tissot, F.; Zhao, J.; Tissandier, L.; Médard, E. Magma redox and structural controls on iron isotope variations in Earth’s mantle and crust. Earth Planet. Sci. Lett. 2014, 398, 127–140. [Google Scholar] [CrossRef] [Green Version]
- Poitrasson, F.; Roskosz, M.; Corgne, A. No iron isotope fractionation between molten alloys and silicate melt to 2000 ℃ and 7.7 GPa: Experimental evidence and implications for planetary differentiation and accretion. Earth Planet. Sci. Lett. 2009, 278, 376–385. [Google Scholar] [CrossRef]
- Hin, R.C.; Schmidt, M.W.; Bourdon, B. Experimental evidence for the absence of iron isotope fractionation between metal and silicate liquids at 1 GPa and 1250–1300 ℃ and its cosmochemical consequences. Geochim. Cosmochim. Acta 2012, 93, 164–181. [Google Scholar] [CrossRef]
- Shahar, A.; Hillgren, V.; Horan, M.; Mesa-Garcia, J.; Kaufman, L.; Mock, T. Sulfur-controlled iron isotope fractionation experiments of core formation in planetary bodies. Geochim. Cosmochim. Acta 2015, 150, 253–264. [Google Scholar] [CrossRef]
- Shahar, A.; Schauble, E.A.; Caracas, R.; Gleason, A.E.; Reagan, M.M.; Xiao, Y.; Shu, J.; Mao, W. Pressure-dependent isotopic composition of iron alloys. Science 2016, 352, 580–582. [Google Scholar] [CrossRef] [Green Version]
- Polyakov, V.B. Equilibrium iron isotope fractionation at core-mantle boundary conditions. Science 2009, 323, 912–914. [Google Scholar] [CrossRef] [PubMed] [Green Version]
- Liu, J.; Dauphas, N.; Roskosz, M.; Hu, M.Y.; Yang, H.; Bi, W.; Zhao, J.; Alp, E.E.; Hu, J.Y.; Lin, J.F. Iron isotopic fractionation between silicate mantle and metallic core at high pressure. Nat. Commun. 2017, 8, 14377. [Google Scholar] [CrossRef] [PubMed]
- Naldrett, A.J. Magmatic sulfide deposits: Geology, Geochemistry and Exploration; Springer: Berlin/Heidelberg, Germany, 2004. [Google Scholar]
- Naldrett, A.J. A portion of the system Fe-S-O between 900 and 1080 ℃ and its application to sulfide ore magmas. J. Petrol. 1969, 10, 171–201. [Google Scholar] [CrossRef]
- Naldrett, A.J. Nickel sulfide deposits-their classification and genesis with special emphasis on deposits of volcanic association. Can. Inst. Min. Metall. Bull. 1973, 66, 45–63. [Google Scholar]
- Naldrett, A.J. World-class Ni-Cu-PGE deposits: Key factors in their genesis. Miner. Depos. 1999, 34, 227–240. [Google Scholar] [CrossRef]
- Jia, E.H. Geological characteristics of the Jinchuan Cu-Ni sulfide deposit in Gansu province. Miner. Deposits 1986, 5, 27–38. (In Chinese) [Google Scholar]
- Yu, W.J.; Gao, Q.; Zhang, Z.P.; Jin, X.Q.; Deng, D.Q. Characteristics experimental of surrounding rock mass in tectonic zone and its rheological law analysis. J. Cent. South Univ. (Sci. Technol.) 2009, 40, 1086–1091. (In Chinese) [Google Scholar]
- Tang, Z.L.; Li, W.Y. Mineralization model and geology of the Jinchuan PGE-bearing deposit; Geological Publishing House: Beijing, China, 1995; pp. 1–205. (In Chinese) [Google Scholar]
- Song, S.G.; Niu, Y.L.; Su, L.; Xia, X.H. Tectonics of the North Qilian orogen, NW China. Gondwana Res. 2013, 23, 1378–1401. [Google Scholar] [CrossRef]
- Li, C.; Xu, Z.; Waal, S.A.D.; Ripley, E.M.; Maier, W.D. Compositional variations of olivine from the Jinchuan Ni-Cu sulfide deposit, western China: Implications for ore genesis. Miner. Depos. 2004, 39, 159–172. [Google Scholar] [CrossRef]
- Zhang, M.J.; Tang, Q.Y.; Hu, P.Q.; Ye, X.R.; Cong, Y.N. Noble gas isotopic constraints on the origin and evolution of the Jinchuan Ni-Cu-(PGE) sulfide ore-bearing ultramafic intrusion, western China. Chem. Geol. 2013, 339, 301–312. [Google Scholar] [CrossRef]
- Yang, G.; Du, D.A.; Lu, J.R.; Qu, W.J.; Chen, J.F. Re-Os (ICP-MS) dating of massive sulfide ore in Jinchuan Ni-Cu-Pt deposit. Sci. China Ser. D Earth Sci. 2005, 35, 241–245. (In Chinese) [Google Scholar]
- Yan, H.Q.; Su, S.G.; Jiao, J.G.; Tang, H. Metallogenetic epoch of Jinchuan Cu-Ni (PGE) magmatic sulfide deposit. Earth Sci. Front. 2005, 12, 309–315. (In Chinese) [Google Scholar]
- Li, X.H.; Su, L.; Chung, S.L.; Li, Z.X.; Liu, Y.; Song, B.; Liu, D.Y. Formation of the Jinchuan ultramafic intrusion and the world’s third largest Ni-Cu sulfide deposit: Associated with the ∼825 Ma south China mantle plume? Geochem. Geophys. Geosyst. 2005, 6. [Google Scholar] [CrossRef]
- Tian, Y.L.; Wu, S.J.; Meng, R.; Wang, Y.S.; Lin, C.L.; Xiao, L.Z. La-ICPMS Zircon U-Pb age of the Jinchuan ultramafic intrusion. Acta Mineral. Sin. 2007, 27, 211–217. (In Chinese) [Google Scholar]
- Tang, Z.L.; Yang, J.D.; Xu, S.J.; Tao, X.C.; Li, W.Y. Sm-Nd Dating of Jinchuan Ore-bearing Ultramafic rock. Chin. Sci. Bull. 1992, 37, 918–920. (In Chinese) [Google Scholar]
- Peng, P.; Liu, W.J.; Zhai, M.G. Response of north China block to Rodinia supercontinent and its characteristics. Acta Petorl. Mineral. 2002, 21, 342–355. (In Chinese) [Google Scholar]
- Li, X.H.; Su, L.; Song, B.; Liu, D.Y. Jinchuan ultramafic intrusive SHRIMP zircon U-Pb age and its geological significance. Chin. Sci. Bull. 2004, 49, 401–402. (In Chinese) [Google Scholar]
- Li, W.Y.; Yang, P.F. Late Neoproterozoic sedimentations of the carbonate-detrital flows in Longshou mountains, northwest China: Implications for its tectonic environments. Acta Sendimentol. Sin. 2004, 22, 142–146. (In Chinese) [Google Scholar]
- Zhang, M.J.; Kamo, S.L.; Chusi, L.; Hu, P.Q.; Edward, M.R. Precise U-Pb zircon-baddeleyite age of the Jinchuan sulfide ore-bearing ultramafic intrusion, Western China. Miner. Depos. 2010, 45, 3–9. [Google Scholar] [CrossRef]
- Ai, Q.X.; Zeng, R.Y.; He, Q.J.; Lai, J.Q.; Mao, X.C. Geochronology and Zircon Hf Isotope of Meta-basic rocks from Jinchuan Mineral Area and Its Geological Significance. Acta Mineral. Sin. 2018, 389, 185–195. [Google Scholar]
- Yan, H.Q.; Liu, Q.F.; Tang, Z.L.; Fan, M.C.; Wang, Q.; Ren, J.M.; Fan, C.F. Structural properties of the Longshoushan block: Constraint from LA-ICP-MS U-Pb zircon dating. Eng. Sci. 2015, 17, 59–72. (In Chinese) [Google Scholar] [CrossRef]
- Liu, Y.S.; Hu, Z.C.; Gao, S.; Günther, D.; Xu, J.; Gao, C.G.; Chen, H.H. In situ analysis of major and trace elements of anhydrous minerals by LA-ICP-MS without applying an internal standard. Chem. Geol. 2008, 257, 34–43. [Google Scholar] [CrossRef]
- Chen, L.; Liu, Y.S.; Hu, Z.C.; Gao, S.; Zong, K.Q.; Chen, H.H. Accurate determinations of fifty-four major and trace elements in carbonate by LA-ICP-MS using normalization strategy of bulk components as 100%. Chem. Geol. 2011, 284, 283–295. [Google Scholar] [CrossRef]
- Kong, J.J.; Niu, Y.L.; Sun, P.; Xiao, Y.Y.; Guo, P.Y.; Hong, D.; Zhang, Y.; Shao, F.L.; Wang, X.H.; Duan, M. The origin and geodynamic significance of the Mesozoic dykes in eastern continental China. Lithos 2019, 332, 328–339. [Google Scholar] [CrossRef] [Green Version]
- Chen, S.; Wang, X.H.; Niu, Y.L.; Sun, P.; Duan, M.; Xiao, Y.Y.; Guo, P.Y.; Gong, H.M.; Wang, G.D.; Xue, Q.Q. Simple and cost-effective methods for precise analysis of trace element abundances in geological materials with ICP-MS. Sci. Bull. 2017, 62, 277–289. [Google Scholar] [CrossRef] [Green Version]
- Gong, H.M.; Guo, P.Y.; Chen, S.; Duan, M.; Sun, P.; Wang, X.H.; Niu, Y.L. A re-assessment of nickel-doping method in iron isotope analysis on rock samples using multi-collector inductively coupled plasma mass spectrometry. Acta Geochim. 2020, 39, 355–364. [Google Scholar] [CrossRef]
- Oeser, M.; Weyer, S.; Horn, I.; Schuth, S. High-precision Fe and Mg isotope ratios of silicate reference glasses deter-mined in situ by femtosecond LA-MC-ICP-MS and by solution nebulization MC-ICP-MS. Geostand. Geoanal. Res. 2014, 38, 311–328. [Google Scholar] [CrossRef]
- Chen, K.Y.; Yuan, H.L.; Liang, P.; Bao, Z.A.; Chen, L. Improved nickel-corrected isotopic analysis of iron using high-resolution multi-collector inductively coupled plasma mass spectrometry. Int. J. Mass Spectrom. 2017, 421, 196–203. [Google Scholar] [CrossRef]
- Chen, S.; Niu, Y.L.; Guo, P.Y.; Gong, H.M.; Sun, P.; Xue, Q.Q.; Duan, M.; Wang, X.H. Iron isotope fractionation during mid-ocean ridge basalt (MORB) evolution: Evidence from lavas on the East Pacific Rise at 10°30′N and its implications. Geochim. Cosmochim. Acta 2019, 267, 227–239. [Google Scholar] [CrossRef]
- He, Y.; Ke, S.; Teng, F.Z.; Wang, T.; Wu, H.; Lu, Y.; Li, S. High-precision iron isotope analysis of geological reference materials by high-resolution MC-ICP-MS. Geostand. Geoanal. Res. 2015, 39, 341–356. [Google Scholar] [CrossRef]
- Craddock, P.R.; Dauphas, N. Iron isotopic compositions of geological reference materials and chondrites. Geostand. Geoanal. Res. 2011, 35, 101–123. [Google Scholar] [CrossRef]
- Ye, H.; Wu, C.Z.; Yang, T.; Santosh, M.; Yao, X.Z.; Gao, B.F.; Wang, X.L.; Li, W. Updating the Geologic Barcodes for South China: Discovery of Late Archean Banded Iron Formations in the Yangtze Craton. Sci. Rep. 2017, 7, 1–9. [Google Scholar] [CrossRef] [Green Version]
- Ye, H.; Wu, C.Z.; Brzozowski, M.J.; Yang, T.; Zha, X.P.; Zhao, S.G.; Gao, B.F.; Li, W.Q. Calibrating equilibrium Fe isotope fractionation factors between magnetite, garnet, amphibole, and biotite. Geochim. Cosmochim. Acta 2020, 271, 78–95. [Google Scholar] [CrossRef]
- Mungall, J.E.; Su, S. Interfacial tension between magmatic sulfide and silicate liquids: Constraints on kinetics of sulfide liquation and sulfide migration through silicate rocks. Earth Planet. Sci. Lett. 2005, 234, 135–149. [Google Scholar] [CrossRef]
- Niu, Y.L.; Batiza, R. In-situ densities of silicate melts and minerals as a function of temperature, pressure, and composition. J. Geol. 1991, 99, 767–775. [Google Scholar] [CrossRef]
- Bilenker, L.D.; Weis, D.; Scoates, J.S.; Perry, E. The application of stable Fe isotopes to magmatic sulfide systems: Constraints on the Fe isotope composition of magmatic pyrrhotite. Econ. Geol. 2018, 113, 1181–1192. [Google Scholar] [CrossRef]
- Beard, B.L.; Johnson, C.M. Inter-mineral Fe isotope variations in mantle-derived rocks and implications for the Fe geochemical cycle. Geochim. Cosmochim. Acta 2004, 68, 4727–4743. [Google Scholar] [CrossRef]
- Johnson, C.M.; Skulan, J.L.; Beard, B.L.; Sun, H.; Nealson, K.H.; Braterman, P.S. Isotopic fractionation between Fe (III) and Fe (II) in aqueous solutions. Earth Planet. Sci. Lett. 2002, 195, 141–153. [Google Scholar] [CrossRef]
- Welch, S.A.; Beard, B.L.; Johnson, C.M.; Braterman, P.S. Kinetic and equilibrium Fe isotope fractionation between aqueous Fe (II) and Fe (III). Geochim. Cosmochim. Acta 2003, 67, 4231–4250. [Google Scholar] [CrossRef]
- Wiesli, R.A.; Beard, B.L.; Johnson, C.M. Experimental determination of Fe isotope fractionation between aqueous Fe (II), siderite, and green rust in abiotic system. Chem. Geol. 2004, 221, 343–362. [Google Scholar] [CrossRef]
- Sossi, P.A.; O’Neill, H.S.C. The effect of bonding environment on iron isotope fractionation between minerals at high temperature. Geochim. Cosmochim. Acta 2017, 196, 121–143. [Google Scholar] [CrossRef]
- Wei, Y.Q.; Niu, Y.L.; Gong, H.M.; Duan, M.; Chen, S.; Guo, P.Y.; Sun, P. Geochemistry and iron isotope systematics of coexisting Fe-bearing minerals in magmatic Fe-Ti deposits: A case study of the Damiao titanomagnetite ore deposits, North China Craton. Gondwana Res. 2020, 81, 240–251. [Google Scholar] [CrossRef]
- Fujisawa, M.; Suga, S.; Mizokawa, T.; Fujimori, A.; Sato, K. Electronic structures of CuFeS2 and CuAl0.9Fe0.1S2 studied by electron and optical spectroscopies. Phys. Rev. B 1994, 49, 7155. [Google Scholar] [CrossRef]
- Chauke, H.R.; Nguyen-Manh, D.; Ngoepe, P.E.; Pettifor, D.G.; Fries, S.G. Electronic structure and stability of the pentlandites Co9S8 and (Fe, Ni)9S8. Phys. Rev. B 2002, 66, 155105. [Google Scholar] [CrossRef]
- Sakkopoulos, S.; Vitoratos, E.; Argyreas, T. Correlation between chemical bonds and properties in pyrrhotite. J. Chem. Educ. 1986, 63, 665. [Google Scholar] [CrossRef]
- Gibbs, G.V.; Cox, D.F.; Rosso, K.M.; Ross, N.L.; Downs, R.T.; Spackman, M.A. Theoretical electron density distributions for Fe- and Cu-sulfide earth materials: A connection between bond length, bond critical point properties, local energy densities, and bonded interactions. J. Phys. Chem. B 2007, 111, 1923–1931. [Google Scholar] [CrossRef] [PubMed]
- Lu, L.G.; Yu, S.S. Metal distribution in iron-nickel sulfide mineral pentlandite: First-principles study. Chem. Phys. Lett. 2019, 736, 136786. [Google Scholar] [CrossRef]
- Niu, Y.L.; Langmuir, C.H.; Kinzler, R.J. The origin of abyssal peridotites: A new perspective. Earth Planet. Sci. Lett. 1997, 152, 251–265. [Google Scholar] [CrossRef]
- Scott, S.R.; Sims, K.W.W.; Frost, B.R.; Kelemen, P.B.; Swapp, S.M. On the hydration of olivine in ultramafic rocks: Implications from Fe isotopes in serpentinites. Geochim. Cosmochim. Acta 2017, 215, 105–121. [Google Scholar] [CrossRef]
- Niu, Y.L.; Gong, H.M.; Wang, X.H.; Xiao, Y.Y.; Guo, P.Y.; Shao, F.L.; Sun, P.; Chen, S.; Duan, M.; Kong, J.J.; et al. Some key problems on the petrogenesis of seafloor basalts, abyssal peridotites and geodynamics-A non-traditional isotope approach. Adv. Earth Sci. 2017, 32, 111–127. (In Chinese) [Google Scholar]
- Williams, H.M.; Bizimis, M. Iron isotope tracing of mantle heterogeneity within the source regions of oceanic basalts. Earth Planet. Sci. Lett. 2014, 404, 396–407. [Google Scholar] [CrossRef] [Green Version]
- McDonough, W.F. 3.16-Compositional model for the earth’s core. Treatise Geochem. 2014, 2, 559–576. [Google Scholar]
- Poitrasson, F.; Levasseur, S.; Teutsch, N. Significance of iron isotope mineral fractionation in pallasites and iron meteorites for the core-mantle differentiation of terrestrial planets. Earth Planet. Sci. Lett. 2005, 234, 151–164. [Google Scholar] [CrossRef]
- Bigeleisen, J.; Mayer, M.G. Calculation of equilibrium constants for isotopic exchange reactions. J. Chem. Phys. 1947, 15, 261–267. [Google Scholar] [CrossRef]
- Urey, H.C. The thermodynamic properties of isotopic substances. J. Chem. Soc. 1947, 562–581. [Google Scholar] [CrossRef] [PubMed]
- He, Y.; Wu, H.; Ke, S.; Liu, S.A.; Wang, Q. Iron isotopic compositions of adakitic and non-adakitic granitic magmas: Magma compositional control and subtle residual garnet effect. Geochim. Cosmochim. Acta 2017, 203, 89–102. [Google Scholar] [CrossRef]
- Li, D.Y.; Xiao, Y.L.; Li, W.Y.; Zhu, X.; Williams, H.M.; Li, Y.L. Iron isotopic systematics of UHP eclogites respond to oxidizing fluid during exhumation. J. Metamorph. Geol. 2016, 34, 987–997. [Google Scholar] [CrossRef]
- Williams, H.M.; Nielsen, S.G.; Renac, C.; Griffin, W.L.; O’Reilly, S.Y.; McCammon, E.A.; Pearson, N.; Viljoen, F.; Alt, J.C.; Halliday, A.N. Fractionation of oxygen and iron isotopes by partial melting processes: Implications for the interpretation of stable isotope signatures in mafic rocks. Earth Planet. Sci. Lett. 2009, 283, 156–166. [Google Scholar] [CrossRef]


| Sample No. | Ore Type | Petrographic Description |
|---|---|---|
| JC-1 | Net-textured ore | sulfide-rich dunite, composed chiefly of olivine (~8%), which has been completely altered to serpentine (~68%) (olivine + serpentine ≈ 76%). The interstitial space between olivine grains is mainly filled by sulfides (~22%), including pyrrhotite (~12%), chalcopyrite (~4%), and pentlandite (~6%), forming the structure of spongy meteorite (net-texture), minor Cr-spinel (~1%) and altered minerals (~1%). |
| JC-2 | Net-textured ore | sulfide-rich dunite, composed chiefly of olivine (~32%), which has been strongly serpentinized (~46%) ((olivine + serpentine ≈ 78%). The interstitial space between olivine grains is mainly filled by sulfides (~18%), including pyrrhotite (~10%), chalcopyrite (~2%), and pentlandite (~6%), forming the structure of spongy meteorite (net-texture), minor Cr-spinel (~1%), and altered minerals (~3%). |
| JC-3 | Net-textured ore | sulfide-rich lherzolite, consists of olivine (~50%), pyroxenes (~35%; orthopyroxene (~20%) > clinopyroxene (~15%)), plagioclase (~4%), and minor Cr-spinel (~1%). Metallic sulfides are mainly composed of pyrrhotite (~5%), chalcopyrite (~3%), pentlandite (~2%), and minor cubanite. |
| JC-4 | Disseminated ore | sulfide-rich altered ore from metasomatic orebody at the contact of the mafic intrusion with dolomite marble dominated by dolomite (~50%), phlogopite (~16%), amphibole (~12%), sulfide (~16%), and a small amount of serpentine (~6%). |
| Sample No. | Ore Type | Sulfide Mineral | Calculated Molecular Formula | N | S | Fe | Cu | Ni | Total |
|---|---|---|---|---|---|---|---|---|---|
| wt.% | wt.% | wt.% | wt.% | wt.% | |||||
| JC-1 | Net-textured ore | Pyrrhotite | Fe0.855S | 36 | 39.86 | 59.37 | 0.044 | 0.092 | 99.53 |
| Chalcopyrite | Cu0.944Fe0.959S2 | 32 | 36.20 | 30.23 | 33.85 | 0.051 | 100.5 | ||
| Pentlandite | (Fe4.531,Ni3.825)8.355S8 | 25 | 34.51 | 34.04 | 0.051 | 30.20 | 99.31 | ||
| JC-2 | Net-textured ore | Pyrrhotite | Fe0.852S | 26 | 40.42 | 60.01 | 0.052 | 0.202 | 100.8 |
| Chalcopyrite | Cu0.912Fe0.930S2 | 13 | 36.62 | 29.65 | 33.09 | 0.018 | 99.57 | ||
| Pentlandite | (Fe4.125,Ni4.038)8.164S8 | 22 | 34.15 | 30.67 | 0.087 | 31.56 | 97.31 | ||
| JC-3 | Net-textured ore | Pyrrhotite | Fe0.889S | 15 | 39.74 | 61.53 | 0.059 | 0.044 | 101.5 |
| Chalcopyrite | Cu0.885Fe0.948S2 | 18 | 36.79 | 30.36 | 32.27 | 0.011 | 99.60 | ||
| Pentlandite | (Fe4.026,Ni3.507)7.533S8 | 13 | 36.31 | 31.83 | 0.249 | 29.14 | 98.35 | ||
| Cubanite | Cu0.857Fe1.849S3 | 5 | 37.94 | 40.71 | 21.47 | 0.022 | 100.3 | ||
| JC-4 | Disseminated ore | Pyrrhotite | Fe0.826S | 13 | 41.38 | 59.51 | 0.051 | 0.492 | 101.6 |
| Chalcopyrite | Cu0.897Fe0.937S2 | 8 | 36.95 | 30.16 | 32.85 | 0.081 | 100.3 | ||
| Pentlandite | (Fe3.997,Ni3.930)7.928S8 | 12 | 35.45 | 30.85 | 0.064 | 31.88 | 99.00 |
| Sample No. | Standard | JC-1 | JC-2 | JC-3 | JC-4 | |||||||||||
|---|---|---|---|---|---|---|---|---|---|---|---|---|---|---|---|---|
| Mineral | BIR-1G | BCR-2G | BHVO-2G | Olivine | Serpentine | Chromite | Olivine | Serpentine | Chromite | Olivine | Serpentine | Chromite | Clinopyroxene | Orthopyroxene | Plagioclase | Serpentine |
| N | 24 | 24 | 24 | 4 | 3 | 12 | 4 | 4 | 9 | 3 | 3 | 7 | 4 | 4 | 2 | 8 |
| Major elements (wt.%) | ||||||||||||||||
| SiO2 | 46.84 | 53.02 | 49.01 | 38.19 | 36.12 | 0.052 | 38.80 | 38.75 | 0.081 | 38.54 | 38.71 | 0.058 | 50.18 | 53.69 | 53.38 | 39.97 |
| TiO2 | 0.929 | 2.254 | 2.698 | 0.017 | 0.434 | 0.925 | 0.012 | 0.020 | 1.471 | 0.021 | 0.012 | 1.150 | 0.417 | 0.195 | 0.106 | 0.020 |
| Al2O3 | 15.23 | 13.91 | 14.28 | 0.023 | 3.842 | 9.636 | 0.026 | 2.623 | 0.133 | 0.041 | 0.028 | 15.69 | 3.630 | 2.186 | 29.25 | 0.038 |
| FeOT | 11.52 | 13.91 | 11.79 | 15.43 | 9.003 | 51.64 | 16.52 | 7.738 | 75.96 | 16.72 | 13.24 | 39.22 | 5.812 | 9.496 | 0.418 | 14.68 |
| MnO | 0.178 | 0.205 | 0.173 | 0.203 | 0.712 | 0.389 | 0.303 | 0.086 | 0.394 | 0.229 | 0.251 | 0.322 | 0.155 | 0.206 | 0.004 | 0.052 |
| MgO | 9.371 | 3.501 | 7.011 | 45.17 | 34.93 | 3.163 | 43.22 | 37.01 | 0.630 | 43.57 | 33.14 | 4.938 | 18.84 | 30.94 | 0.130 | 31.25 |
| CaO | 13.12 | 7.108 | 11.33 | 0.141 | 0.042 | 0.033 | 0.387 | 0.009 | 0.014 | 0.126 | 0.371 | 0.014 | 19.27 | 2.220 | 11.47 | 0.164 |
| Na2O | 1.862 | 3.218 | 2.284 | 0.006 | 0.018 | 0.068 | 0.026 | 0.004 | 0.137 | 0.003 | 0.027 | 0.123 | 0.298 | 0.049 | 4.804 | 0.059 |
| K2O | 0.021 | 1.748 | 0.522 | - | 0.009 | 0.017 | 0.014 | 0.004 | 0.027 | 0.001 | 0.014 | 0.021 | - | 0.001 | 0.279 | 0.032 |
| P2O5 | 0.051 | 0.356 | 0.278 | 0.038 | 0.019 | 0.030 | 0.037 | 0.026 | 0.016 | 0.035 | 0.044 | 0.040 | 0.019 | 0.024 | 0.029 | 0.038 |
| Cr2O3 | 0.057 | 0.002 | 0.042 | 0.014 | 1.501 | 32.15 | 0.012 | 0.425 | 13.10 | 0.017 | 0.010 | 37.64 | 1.107 | 0.625 | - | 0.055 |
| NiO | 0.022 | 0.001 | 0.015 | 0.304 | 0.042 | 0.087 | 0.144 | 0.073 | 0.372 | 0.186 | 0.292 | 0.080 | 0.030 | 0.048 | 0.001 | 0.177 |
| FeOcal. | - | - | - | - | - | 28.96 | - | - | 30.46 | - | - | 27.82 | - | - | - | - |
| Fe2O3 cal. | - | - | - | - | - | 25.21 | - | - | 50.56 | - | - | 12.67 | - | - | - | - |
| Total | 99.30 | 99.36 | 99.52 | 99.53 | 86.73 | 100.7 | 99.51 | 86.77 | 97.40 | 99.49 | 86.14 | 100.6 | 99.81 | 99.71 | 99.88 | 86.55 |
| Trace element (ppm) | ||||||||||||||||
| Li | 2.922 | 8.934 | 4.573 | 2.745 | 8.089 | 0.463 | 7.076 | 1.434 | 8.287 | 5.396 | 0.184 | 0.622 | 17.08 | 2.492 | 0.205 | 7.453 |
| Be | 0.142 | 2.728 | 1.364 | 0.172 | 0.094 | - | 0.136 | 0.103 | 0.283 | 0.018 | 0.129 | 0.100 | 0.025 | 0.038 | 0.612 | 0.063 |
| Sc | 42.67 | 33.56 | 32.31 | 4.523 | 72.00 | 1.380 | 2.943 | 13.54 | 1.326 | 5.595 | 4.782 | 1.088 | 64.81 | 29.16 | 0.397 | 18.84 |
| V | 534.2 | 704.2 | 441.9 | 3.093 | 291.1 | 9844 | 2.679 | 39.46 | 1096 | 6.076 | 6.303 | 1871 | 275.3 | 120.9 | 2.742 | 7.568 |
| Cr | 388.4 | 15.14 | 286.5 | 97.83 | 10272 | - | 79.66 | 2910 | - | 115.7 | 71.10 | - | 7574 | 4273 | 2.000 | 378.8 |
| Co | 53.24 | 37.83 | 45.37 | 139.0 | 27.29 | 180.2 | 78.73 | 28.13 | 66.72 | 176.8 | 156.2 | 494.7 | 40.74 | 74.99 | 0.228 | 97.86 |
| Ni | 172.5 | 11.64 | 117.5 | 2387 | 329.7 | 683.6 | 1129 | 571.0 | 2919 | 1459 | 2291 | 630.6 | 233.3 | 375.7 | 8.157 | 1395 |
| Cu | 120.8 | 16.67 | 129.1 | 0.089 | 2.106 | 14.00 | 0.766 | 0.137 | 0.144 | 0.030 | 470.6 | 0.028 | 0.830 | 0.279 | 0.355 | 71.54 |
| Zn | 74.37 | 139.1 | 105.5 | 120.9 | 8.064 | 1577 | 98.60 | 33.43 | 664.8 | 109.1 | 17.14 | 3365 | 29.54 | 73.53 | 2.479 | 59.12 |
| Ga | 15.60 | 21.75 | 21.48 | 0.086 | 3.610 | 36.42 | 0.064 | 4.939 | 11.72 | 0.228 | 2.122 | 78.84 | 5.732 | 4.073 | 25.37 | 0.706 |
| Ge | 1.132 | 2.363 | 2.763 | 5.037 | 1.300 | - | 5.450 | 1.616 | 1.138 | 1.551 | 2.300 | 0.559 | 3.041 | 11.15 | 2.453 | 2.828 |
| Rb | 0.271 | 46.39 | 9.373 | 0.015 | 0.211 | - | 1.013 | 1.548 | - | 0.067 | 0.094 | - | 0.033 | 0.146 | 1.002 | 3.842 |
| Sr | 106.8 | 341.7 | 391.0 | 0.014 | 0.624 | 1.879 | 2.044 | 0.228 | 0.804 | 0.188 | 4.305 | 0.006 | 19.27 | 0.506 | 671.9 | 38.59 |
| Y | 15.03 | 35.72 | 25.49 | 0.319 | 10.69 | 0.026 | 0.562 | 0.538 | - | 0.454 | 0.686 | 0.005 | 12.31 | 2.121 | 0.401 | 4.087 |
| Zr | 13.79 | 182.8 | 165.9 | 0.109 | 11.43 | 0.144 | 0.254 | 0.384 | - | 0.258 | 0.527 | 0.950 | 12.13 | 1.807 | 0.112 | 0.193 |
| Nb | 0.511 | 13.49 | 20.40 | 0.003 | 0.058 | 0.040 | 0.230 | 0.223 | 0.066 | 0.001 | 0.011 | 0.098 | 0.023 | 0.005 | 0.015 | 0.415 |
| Mo | 0.045 | 237.1 | 3.727 | 0.043 | 0.450 | 0.322 | 0.066 | 0.632 | 0.069 | 0.022 | 0.038 | 0.068 | 0.067 | 0.016 | 0.030 | 7.022 |
| Cs | 0.016 | 1.310 | 0.161 | 0.032 | 0.041 | - | 0.237 | 0.364 | - | 0.017 | 0.015 | - | 0.014 | 0.023 | 0.032 | 1.060 |
| Ba | 6.594 | 687.4 | 128.7 | 0.021 | 2.643 | 1.605 | 7.628 | 2.537 | 0.809 | 0.107 | 2.652 | - | 0.150 | 0.395 | 233.1 | 12.27 |
| La | 0.581 | 25.08 | 14.89 | 0.346 | 1.185 | 0.058 | 0.089 | 0.106 | 0.005 | 0.005 | 0.160 | - | 0.807 | 0.009 | 3.481 | 0.387 |
| Ce | 1.810 | 53.02 | 36.73 | 0.002 | 4.515 | 0.084 | 0.267 | 0.238 | 0.037 | 0.008 | 0.353 | - | 3.502 | 0.074 | 6.194 | 1.259 |
| Pr | 0.366 | 6.737 | 5.139 | 0.001 | 0.760 | 0.006 | 0.046 | 0.029 | 0.005 | 0.001 | 0.049 | - | 0.709 | 0.013 | 0.617 | 0.213 |
| Nd | 2.360 | 28.56 | 24.09 | 0.029 | 4.182 | - | 0.191 | 0.190 | 0.038 | 0.004 | 0.170 | - | 4.462 | 0.137 | 2.300 | 1.125 |
| Sm | 1.047 | 6.494 | 6.031 | 0.033 | 1.329 | 0.025 | 0.064 | 0.063 | - | 0.003 | 0.024 | - | 1.742 | 0.074 | 0.304 | 0.399 |
| Eu | 0.520 | 2.061 | 2.284 | 0.004 | 0.472 | - | 0.018 | 0.025 | 0.035 | 0.002 | 0.007 | - | 0.517 | 0.034 | 1.039 | 0.126 |
| Gd | 1.769 | 6.814 | 6.044 | 0.014 | 1.959 | 0.012 | 0.075 | 0.060 | 0.085 | 0.009 | 0.022 | - | 2.186 | 0.174 | 0.299 | 0.502 |
| Tb | 0.360 | 1.161 | 1.083 | 0.004 | 0.308 | - | 0.013 | 0.007 | 0.008 | 0.002 | 0.007 | - | 0.352 | 0.038 | 0.027 | 0.090 |
| Dy | 2.722 | 7.779 | 7.546 | 0.067 | 2.102 | 0.015 | 0.116 | 0.105 | 0.034 | 0.037 | 0.061 | 0.009 | 2.374 | 0.287 | 0.106 | 0.650 |
| Ho | 0.580 | 1.470 | 1.186 | 0.016 | 0.432 | 0.002 | 0.028 | 0.017 | 0.016 | 0.014 | 0.016 | - | 0.476 | 0.076 | 0.019 | 0.166 |
| Er | 1.644 | 3.617 | 2.520 | 0.041 | 1.220 | 0.016 | 0.063 | 0.085 | - | 0.070 | 0.104 | - | 1.327 | 0.288 | 0.029 | 0.578 |
| Tm | 0.237 | 0.522 | 0.318 | 0.012 | 0.168 | 0.003 | 0.019 | 0.016 | - | 0.014 | 0.030 | 0.002 | 0.188 | 0.047 | 0.007 | 0.103 |
| Yb | 1.596 | 3.373 | 2.003 | 0.111 | 1.063 | - | 0.125 | 0.089 | 0.050 | 0.139 | 0.235 | 0.040 | 1.171 | 0.362 | 0.006 | 0.711 |
| Lu | 1.778 | 7.392 | 5.266 | 0.011 | 0.155 | - | 0.015 | 0.021 | 0.009 | 0.026 | 0.055 | 0.002 | 0.158 | 0.057 | 0.003 | 0.158 |
| Hf | 1.545 | 21.03 | 25.84 | 0.013 | 0.557 | 0.020 | 0.019 | 0.016 | 0.013 | 0.004 | 0.011 | 0.013 | 0.584 | 0.089 | 0.019 | 0.004 |
| Ta | 0.027 | 0.790 | 1.166 | 0.004 | 0.004 | - | 0.012 | 0.008 | 0.018 | 0.003 | - | 0.002 | 0.007 | 0.001 | 0.006 | 0.022 |
| Pb | 3.535 | 10.74 | 1.799 | 0.045 | 0.255 | 0.247 | 16.17 | 3.347 | 18.01 | 0.035 | 4.078 | - | 0.226 | 0.063 | 0.693 | 4.215 |
| Th | 0.032 | 11.56 | 2.819 | 0.004 | 0.021 | 0.005 | 0.018 | 0.048 | 0.010 | - | 0.002 | - | 0.012 | 0.002 | 0.005 | 0.112 |
| U | 0.015 | 1.653 | 0.412 | 0.002 | 0.011 | - | 0.035 | 0.083 | 0.043 | 0.001 | 0.003 | - | 0.005 | 0.003 | 0.011 | 0.216 |
| Sample No. | Bulk-Rock Ores/Mineral Separates | Major Elements (wt.%, ICP-OES) | |||||||||||||
|---|---|---|---|---|---|---|---|---|---|---|---|---|---|---|---|
| bulk-rock ores (Alkali dissolution) | SiO2 | TiO2 | Al2O3 | FeOT | MnO | MgO | CaO | Na2O | K2O | P2O5 | CuO | NiO | Cr2O3 | Total | |
| Standard | BLANK | 0.019 | - | - | 0.001 | - | 0.001 | 0.027 | 0.002 | 0.001 | 0.007 | - | - | - | 0.058 |
| BCR-2 | 55.44 | 2.265 | 13.12 | 12.21 | 0.196 | 3.603 | 7.092 | 3.175 | 1.841 | 0.385 | 0.002 | 0.002 | 0.003 | 99.34 | |
| BHVO-2 | 50.43 | 2.728 | 13.10 | 10.84 | 0.166 | 7.205 | 11.27 | 2.167 | 0.499 | 0.284 | 0.014 | 0.017 | 0.040 | 98.76 | |
| Whole ore | JC-1 | 24.89 | 0.062 | 0.626 | 24.49 | 0.126 | 25.20 | 0.411 | 0.039 | 0.061 | - | 2.682 | 2.500 | 0.501 | 81.59 |
| JC-2 | 25.41 | 0.065 | 1.003 | 26.07 | 0.148 | 24.40 | 1.505 | 0.025 | 0.030 | - | 1.135 | 4.013 | 0.464 | 84.27 | |
| JC-3 | 36.43 | 0.337 | 2.355 | 16.49 | 0.179 | 27.73 | 2.132 | 0.224 | 0.273 | 0.032 | 1.220 | 0.971 | 0.469 | 88.85 | |
| JC-4 | 25.76 | 0.078 | 0.634 | 22.06 | 0.199 | 19.34 | 6.429 | 0.048 | 0.231 | 0.024 | 0.475 | 2.954 | 0.646 | 78.88 | |
| Replicate samples | JC-3-R | 36.71 | 0.342 | 2.385 | 16.48 | 0.181 | 27.77 | 2.121 | 0.238 | 0.305 | 0.035 | 1.245 | 0.972 | 0.491 | 89.28 |
| Silicate/oxide mineral separates (Acid dissolution) | SiO2 | TiO2 | Al2O3 | FeOT | MnO | MgO | CaO | Na2O | K2O | P2O5 | CuO | NiO | Cr2O3 | Total | |
| JC-1 | Serpentine | - | 0.211 | 0.660 | 5.408 | 0.062 | 14.45 | 0.134 | 0.034 | 0.006 | 0.005 | 0.029 | 0.051 | 0.583 | 21.63 |
| Magnetite | - | 0.911 | 8.449 | 64.00 | 0.564 | 2.704 | 0.094 | 0.006 | 0.013 | - | 0.063 | 0.127 | 23.92 | 100.9 | |
| JC-2 | Serpentine | - | 0.050 | 2.310 | 9.460 | 0.095 | 27.39 | 0.144 | 0.007 | 0.002 | 0.007 | 0.027 | 0.073 | 0.373 | 39.94 |
| Magnetite | - | 1.321 | 0.211 | 87.48 | 0.421 | 1.652 | 0.079 | 0.014 | 0.019 | 0.001 | 0.040 | 0.159 | 8.622 | 100.0 | |
| JC-3 | Olivine | - | 0.035 | 0.145 | 16.15 | 0.226 | 38.57 | 0.328 | 0.008 | 0.002 | 0.013 | 0.002 | 0.183 | 0.080 | 55.74 |
| Clinopyroxene | - | 0.537 | 3.789 | 6.274 | 0.167 | 19.37 | 19.51 | 0.346 | 0.027 | - | 0.004 | 0.029 | 0.968 | 51.02 | |
| Orthopyroxene | - | 0.274 | 2.434 | 10.30 | 0.221 | 31.48 | 2.817 | 0.060 | 0.011 | 0.010 | 0.004 | 0.050 | 0.590 | 48.25 | |
| JC-4 | Magnetite | - | 0.955 | 0.151 | 81.57 | 0.236 | 0.676 | 0.579 | 0.005 | - | - | 0.057 | 0.147 | 8.239 | 92.62 |
| Replicate samples | JC-4 Magnetite-R | - | 0.955 | 0.148 | 82.03 | 0.236 | 0.679 | 0.536 | 0.004 | 0.001 | 0.002 | 0.062 | 0.158 | 9.016 | 93.83 |
| Sulfide mineral separates (Acid dissolution) | Si | Ti | Al | Fe | Mn | Mg | Ca | Na | K | P | Cu | Ni | Cr | Total | |
| JC-1 | Pyrrhotite (+Pentlandite) | - | 0.008 | 0.064 | 47.73 | 0.050 | 3.307 | 0.910 | 0.006 | 0.027 | 0.041 | 1.674 | 11.26 | 0.066 | 65.15 |
| Chalcopyrite (+Pentlandite) | - | 0.008 | 0.029 | 37.87 | 0.012 | 0.586 | 0.373 | 0.001 | 0.041 | 0.332 | 18.73 | 15.52 | 0.004 | 73.50 | |
| Pentlandite | - | 0.005 | 0.015 | 36.07 | 0.004 | 0.327 | 0.216 | 0.015 | 0.037 | 0.003 | 0.228 | 30.50 | 0.009 | 67.42 | |
| JC-2 | Pyrrhotite (+Pentlandite) | - | 0.003 | 0.039 | 48.12 | 0.016 | 1.710 | 0.085 | - | 0.025 | 0.009 | 0.383 | 16.53 | 0.008 | 66.92 |
| Chalcopyrite | - | 0.001 | 0.025 | 31.93 | 0.012 | 0.878 | 0.100 | - | 0.024 | 0.384 | 29.74 | 1.445 | 0.002 | 64.53 | |
| Pentlandite | - | 0.003 | 0.007 | 34.02 | 0.004 | 0.483 | 0.041 | - | 0.018 | 0.008 | 0.680 | 34.92 | 0.002 | 70.18 | |
| JC-3 | Pyrrhotite | - | 5.281 | 2.522 | 55.94 | 0.272 | 1.480 | 5.760 | 0.031 | 0.017 | - | 0.172 | 0.096 | 5.978 | 77.55 |
| JC-4 | Pyrrhotite (+Pentlandite) | - | 0.002 | 0.012 | 59.24 | 0.002 | 0.225 | 0.091 | - | - | 0.003 | 0.526 | 6.114 | 0.010 | 66.22 |
| Pentlandite | - | 0.004 | 0.012 | 33.40 | 0.002 | 0.260 | 0.323 | - | 0.017 | 0.017 | 0.761 | 35.16 | 0.003 | 69.96 | |
| Replicate samples | JC-4 Pentlandite-R | - | 0.004 | 0.008 | 33.33 | 0.002 | 0.250 | 0.055 | - | 0.014 | 0.013 | 0.693 | 34.57 | 0.003 | 68.94 |
| Sample No. | Mineral Separates | δ56Fe (‰) | 2SD | δ57Fe (‰) | 2SD |
|---|---|---|---|---|---|
| Standard | BCR-2 | 0.13 | 0.03 | 0.11 | 0.04 |
| BHVO-2 | 0.11 | 0.02 | 0.03 | 0.05 | |
| AGV-2 | 0.12 | 0.07 | 0.07 | 0.04 | |
| W-2a | 0.02 | 0.02 | 0.03 | 0.07 | |
| JC-1 | Pyrrhotite (+Pentlandite) | −0.82 | 0.04 | −1.19 | 0.09 |
| Chalcopyrite (+Pentlandite) | 0.15 | 0.06 | 0.17 | 0.11 | |
| Pentlandite | 0.53 | 0.03 | 0.86 | 0.04 | |
| Serpentine | 0.60 | 0.05 | 0.88 | 0.05 | |
| Magnetite | 0.24 | 0.04 | 0.38 | 0.03 | |
| JC-2 | Pyrrhotite (+Pentlandite) | −0.16 | 0.01 | −0.26 | 0.05 |
| Chalcopyrite | 0.50 | 0.04 | 0.65 | 0.06 | |
| Pentlandite | 1.05 | 0.05 | 1.60 | 0.10 | |
| Serpentine | 0.52 | 0.02 | 0.60 | 0.05 | |
| Magnetite | 0.71 | 0.05 | 1.07 | 0.06 | |
| JC-3 | Pyrrhotite | −0.77 | 0.05 | −1.17 | 0.07 |
| Olivine | 0.07 | 0.03 | 0.11 | 0.09 | |
| Clinopyroxene | 0.04 | 0.02 | −0.02 | 0.04 | |
| Orthopyroxene | 0.05 | 0.07 | 0.03 | 0.09 | |
| JC-4 | Pyrrhotite (+Pentlandite) | −0.90 | 0.03 | −1.33 | 0.05 |
| Pentlandite | 1.02 | 0.04 | 1.57 | 0.04 | |
| Magnetite | 0.50 | 0.03 | 0.79 | 0.06 | |
| Replicate samples | JC-4 Pentlandite-R | 0.99 | 0.03 | 1.46 | 0.06 |
| JC-4 Magnetite-R | 0.44 | 0.04 | 0.75 | 0.02 |
| Part 1. Mineral Separates. | |||||||||
| Sample No. | Mineral Separates | δ56Fe (Mineral Separate) | A2 = Sulfide Content of Mineral Separate (wt.%) | A3 = Fe Content of Mineral Separate | Value of Ci | ||||
| (‰, from Table 5) | Pyrrhotite | Chalcopyrite | Pentlandite | (wt.%, from Table 4) | C(Pyrrhotite) | C(Chalcopyrite) | C(Pentlandite) | ||
| JC-1 | Pyrrhotite (+Pentlandite) | −0.82 | 57.3 | 5.1 | 37.6 | 47.73 | 70.3 | 3.2 | 26.5 |
| Chalcopyrite (+Pentlandite) | 0.15 | 5.4 | 49.4 | 45.2 | 37.87 | 9.6 | 44.5 | 45.8 | |
| Pentlandite | 0.53 | - | - | ~100.0 | 36.07 | - | - | ~100.0 | |
| JC-2 | Pyrrhotite (+Pentlandite) | −0.16 | 51.2 | - | 48.8 | 48.11 | 67.3 | - | 32.7 |
| Chalcopyrite | 0.50 | 6.5 | 89.1 | 4.4 | 31.93 | 6.5 | 89.0 | 4.6 | |
| Pentlandite | 1.05 | - | - | ~100.0 | 34.02 | - | - | ~100.0 | |
| JC-3 | Pyrrhotite | −0.77 | ~100.0 | - | - | 56.79 | ~100.0 | - | - |
| JC-4 | Pyrrhotite (+Pentlandite) | −0.90 | 82.6 | - | 17.4 | 59.23 | 90.2 | - | 9.8 |
| Pentlandite | 1.02 | - | - | ~100.0 | 33.40 | - | - | ~100.0 | |
| Part 2. Pure Sulfide End-Members after Calculation. | |||||||||
| Sample No. | Sulfide Type | A1 = Fe Content of Each Sulfide | δ56Fei | ||||||
| (wt.%, from Table 2) | ‰ | ||||||||
| JC-1 | Pyrrhotite | 59.37 | −1.37 | ||||||
| Chalcopyrite | 30.23 | 0.09 | |||||||
| Pentlandite | 34.04 | 0.53 | |||||||
| JC-2 | Pyrrhotite | 60.01 | −0.74 | ||||||
| Chalcopyrite | 29.65 | 0.56 | |||||||
| Pentlandite | 30.67 | 1.05 | |||||||
| JC-3 | Pyrrhotite | 61.53 | −0.77 | ||||||
| JC-4 | Pyrrhotite | 59.51 | −1.11 | ||||||
| Pentlandite | 30.85 | 1.02 | |||||||
| Sample no. | Ore-bearing Rock Type | Main Minerals Calculated in Order | Unique Element (mol.%) | The Remaining Elements and Their Contents (mol.%) |
|---|---|---|---|---|
| JC-1 | Sulfide-rich dunite | Chalcopyrite | Chalcopyrite = Cu | Fe = Fe − Cu, Cu = 0; |
| Pentlandite | Pentlandite = Pn | Fe = Fe − Ni, Ni = 0; | ||
| Chromite | chromite = Cr | Fe = Fe − Cr, Mg = Mg − Cr, Cr = 0; | ||
| Serpentine | serpentine, olivine = Si, serpentine, olivine = Mg | Fe = Fe − Si (serpentine) − Si (olivine), Si = 0, Mg = 0; | ||
| Olivine | ||||
| Pyrrhotite | pyrrhotite = Fe | Fe = 0. | ||
| JC-2 | sulfide-rich dunite | Chalcopyrite | Chalcopyrite = Cu | Fe = Fe − Cu, Cu = 0; |
| Pentlandite | Pentlandite = Pn | Fe = Fe − Ni, Ni = 0; | ||
| Serpentine | serpentine = Al | Si = Si − Al, Fe = Fe − Al, Cr = Cr − Al, Al = 0; | ||
| Chromite | chromite = Cr | Fe = Fe − Cr, Cr = 0; | ||
| Olivine | olivine = Si | Fe = Fe − Si, Si = 0; | ||
| Pyrrhotite | pyrrhotite = Fe | Fe = 0. | ||
| Only serpentine has a lot of Al in JC-2 (unlike chromite of JC-1, which also has a lot of Al) | ||||
| JC-3 | sulfide-rich lherzolite | Chalcopyrite | Chalcopyrite = Cu | Fe = Fe − Cu, Cu = 0; |
| Pentlandite | Pentlandite = Pn | Fe = Fe − Ni, Ni = 0; | ||
| Chromite | chromite = Cr | Fe = Fe − Cr, Mg = Mg − Cr, Cr = 0; | ||
| Plagioclase | plagioclase = Na | Ca = Ca − Na, Si = Si − Na, Al = Al − Na, Fe = Fe − Na, Na = 0; | ||
| Clinopyroxene | clinopyroxene = Ca | Fe = Fe − Ca, Mg = Mg − Ca, Si = Si − Ca, Al = Al − Ca, Ca = 0; | ||
| Orthopyroxene | orthopyroxene = Al | Fe = Fe − Al, Mg = Mg − Al, Si = Si − Al, Al = 0; | ||
| Serpentine | serpentine, olivine = Si, serpentine, olivine = Mg | Fe = Fe − Si (serpentine) − Si (olivine), Si = 0, Mg = 0; | ||
| Olivine | ||||
| Pyrrhotite | pyrrhotite = Fe | Fe = 0. | ||
| Sample No. | Mineral Type | Mineral Modal Abundance (wt.%, cal.) | Experimental Molecular Formula |
|---|---|---|---|
| JC-1 | Pyrrhotite | 13.43 | Fe0.855S |
| Chalcopyrite | 6.734 | Cu0.944Fe0.959S2 | |
| Pentlandite | 6.816 | (Fe4.531,Ni3.825)8.355S8 | |
| Serpentine | 57.48 | (Mg5.145,Fe0.744,Mn0.060,Ti0.032,Cr0.117)6.099[(Si3.570,Al0.447)4.017O10](OH)8 | |
| Olivine | 13.88 | (Mg1.720,Fe0.330)2.049Si0.975O4 | |
| Chromite | 1.662 | (Mg0.165,Fe2+0.848,Mn0.012)1.024(Cr0.890,Al0.398,Fe3+0.664,Ti0.024)1.976O4 | |
| JC-2 | Pyrrhotite | 14.24 | Fe0.852S |
| Chalcopyrite | 2.945 | Cu0.912Fe0.930S2 | |
| Pentlandite | 10.42 | (Fe4.125,Ni4.038)8.164S8 | |
| Serpentine | 40.92 | (Mg5.353,Fe0.628,Cr0.033)6.014[(Si3.760,Al0.300)4.060O10](OH)8 | |
| Olivine | 29.07 | (Mg1.654,Fe0.355)2.008Si0.996O4 | |
| Chromite | 2.401 | (Mg0.037,Fe2+1.007)1.044(Cr0.409,Al0.01,Fe3+1.503,Ti0.044)1.956O4 | |
| JC-3 | Pyrrhotite | 4.645 | Fe0.889S |
| Chalcopyrite | 3.286 | Cu0.885Fe0.948S2 | |
| Pentlandite | 2.788 | (Fe4.026,Ni3.507)7.533S8 | |
| Serpentine | 8.062 | (Mg4.970,Fe2+0.982,Mn0.021,Ca0.040)6.014[(Si3.894,Fe3+0.132)4.026O10](OH)8 | |
| Olivine | 41.14 | (Mg1.665,Fe0.358)2.024Si0.988O4 | |
| Clinopyroxene | 8.996 | (Na0.021,Ca0.765,Mg1.040,Fe0.180,Cr0.032)2.039[(Si1.859,Al0.158)2.017O6] | |
| Orthopyroxene | 24.65 | (Ca0.085,Mg1.643,Fe0.283,Cr0.018)2.028[(Si1.913,Al0.092)2.004O6] | |
| Chromite | 1.362 | (Mg0.247,Fe2+0.782)1.029(Cr1.000,Al0.622,Fe3+0.320,Ti0.029)1.971O4 | |
| Plagioclase | 5.073 | (Na0.423,K0.016,Ca0.559,Fe0.016)1.014Al1.568Si2.427O8 | |
| JC-4 | Pyrrhotite | - | Fe0.826S |
| Chalcopyrite | - | Cu0.897Fe0.937S2 | |
| Pentlandite | - | (Fe3.997,Ni3.930)7.928S8 | |
| Serpentine | - | (Mg4.688,Fe1.236,Ca0.018,Ni0.014)5.956[Si4.022O10](OH)8 |
| Sample No. | Mineral Type | δ56Fei | B1 = Fe Content of Each Mineral | B2 = Sulfide Content of Bulk-Sulfide Phase | B3 = Fe Content of Bulk-Sulfide Phase | Value of Ci | δ56Fe (Sulfide Liquid) | |||
|---|---|---|---|---|---|---|---|---|---|---|
| ‰, from Part 2 of Table 6 | wt.%, from Table 2 | wt.%, cal. from Table 8 | wt.% | wt.%, Corrected to 100% | Scenario (1), ‰ | Scenario (2), ‰ | Scenario (3), ‰ | Scenario (4), ‰ | ||
| JC-1 | Pyrrhotite | −1.37 | 59.37 | 49.77 | 45.70 | 64.66 | −0.77 | −0.39 | −0.59 | 0.32 |
| Chalcopyrite | 0.09 | 30.23 | 24.96 | 16.52 | ||||||
| Pentlandite | 0.53 | 34.04 | 25.27 | 18.82 | ||||||
| Serpentine | 0.60 | 6.998 | ||||||||
| JC-2 | Pyrrhotite | −0.74 | 60.01 | 51.59 | 45.70 | 67.75 | −0.20 | −0.22 | −0.11 | 0.95 |
| Chalcopyrite | 0.56 | 29.65 | 10.67 | 6.924 | ||||||
| Pentlandite | 1.05 | 30.67 | 37.74 | 25.33 | ||||||
| Serpentine | 0.52 | 6.015 | ||||||||
Publisher’s Note: MDPI stays neutral with regard to jurisdictional claims in published maps and institutional affiliations. |
© 2021 by the authors. Licensee MDPI, Basel, Switzerland. This article is an open access article distributed under the terms and conditions of the Creative Commons Attribution (CC BY) license (https://creativecommons.org/licenses/by/4.0/).
Share and Cite
Wang, P.; Niu, Y.; Sun, P.; Wang, X.; Guo, P.; Gong, H.; Duan, M.; Shen, F.; Shi, Y.; Xue, S.; et al. Iron Isotope Compositions of Coexisting Sulfide and Silicate Minerals in Sudbury-Type Ores from the Jinchuan Ni-Cu Sulfide Deposit: A Perspective on Possible Core-Mantle Iron Isotope Fractionation. Minerals 2021, 11, 464. https://doi.org/10.3390/min11050464
Wang P, Niu Y, Sun P, Wang X, Guo P, Gong H, Duan M, Shen F, Shi Y, Xue S, et al. Iron Isotope Compositions of Coexisting Sulfide and Silicate Minerals in Sudbury-Type Ores from the Jinchuan Ni-Cu Sulfide Deposit: A Perspective on Possible Core-Mantle Iron Isotope Fractionation. Minerals. 2021; 11(5):464. https://doi.org/10.3390/min11050464
Chicago/Turabian StyleWang, Peiyao, Yaoling Niu, Pu Sun, Xiaohong Wang, Pengyuan Guo, Hongmei Gong, Meng Duan, Fangyu Shen, Yining Shi, Song Xue, and et al. 2021. "Iron Isotope Compositions of Coexisting Sulfide and Silicate Minerals in Sudbury-Type Ores from the Jinchuan Ni-Cu Sulfide Deposit: A Perspective on Possible Core-Mantle Iron Isotope Fractionation" Minerals 11, no. 5: 464. https://doi.org/10.3390/min11050464