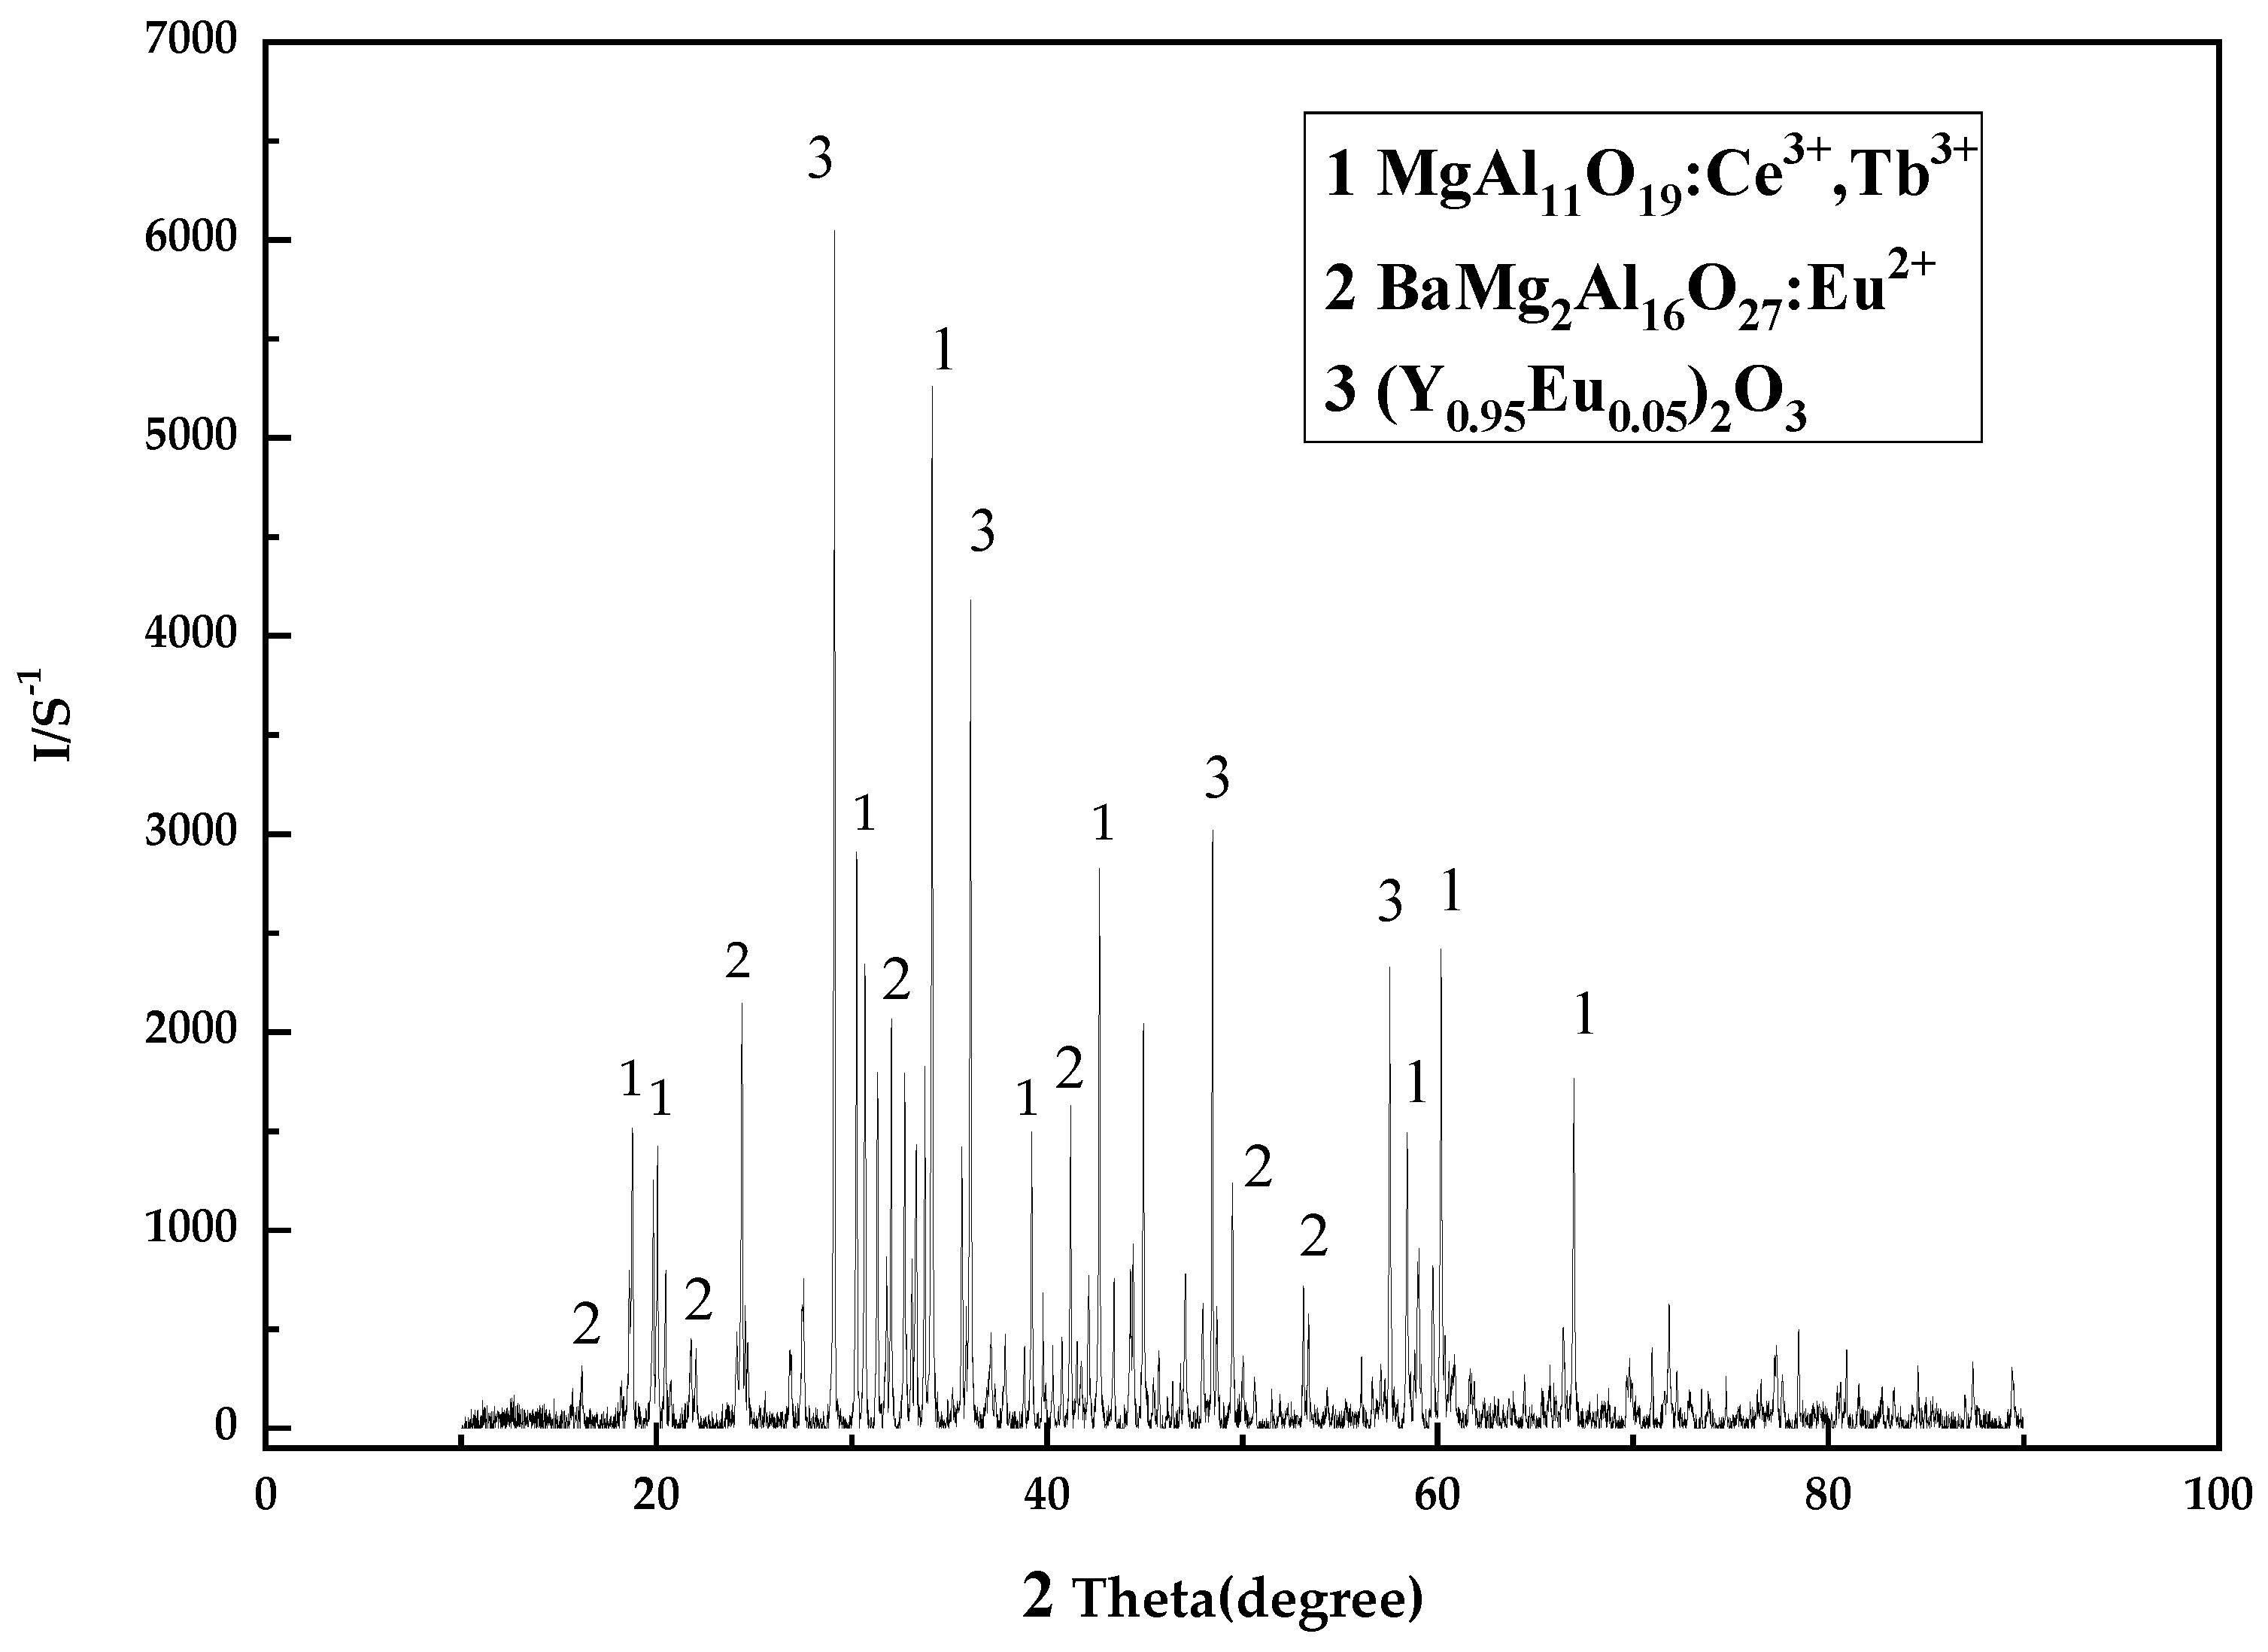
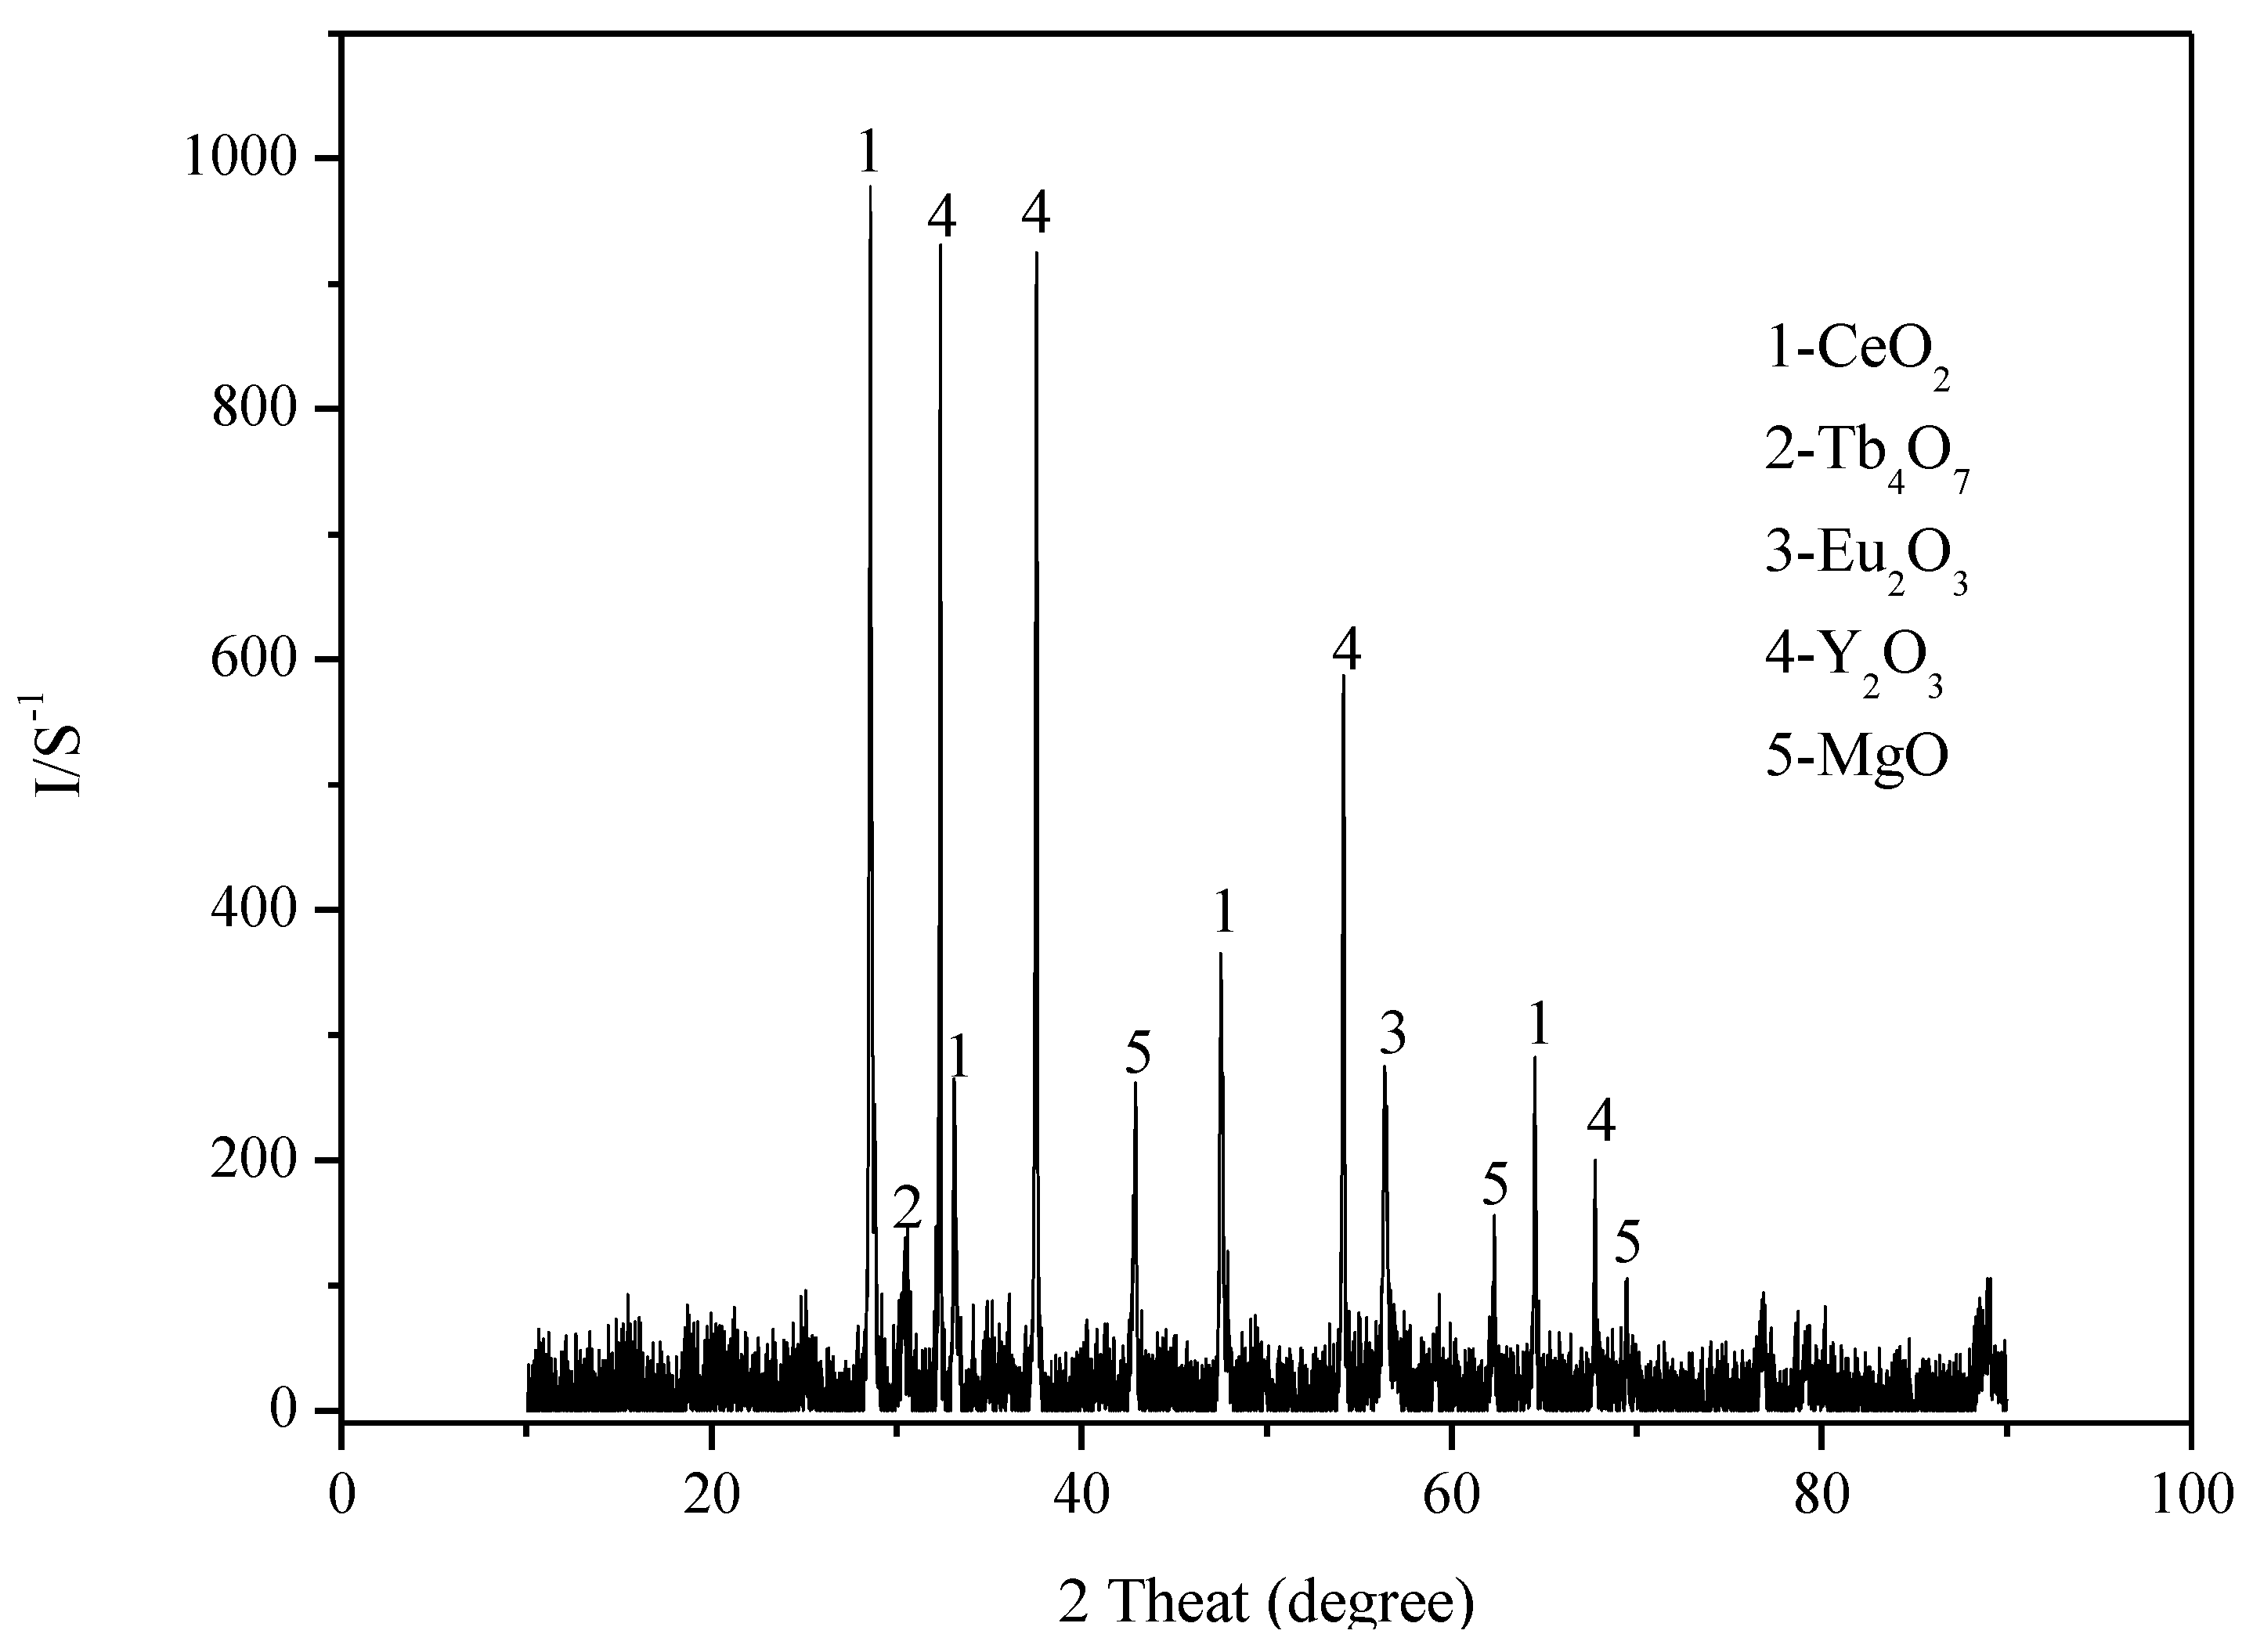
Figure 1.
XRD pattern of the raw material.
Figure 1.
XRD pattern of the raw material.
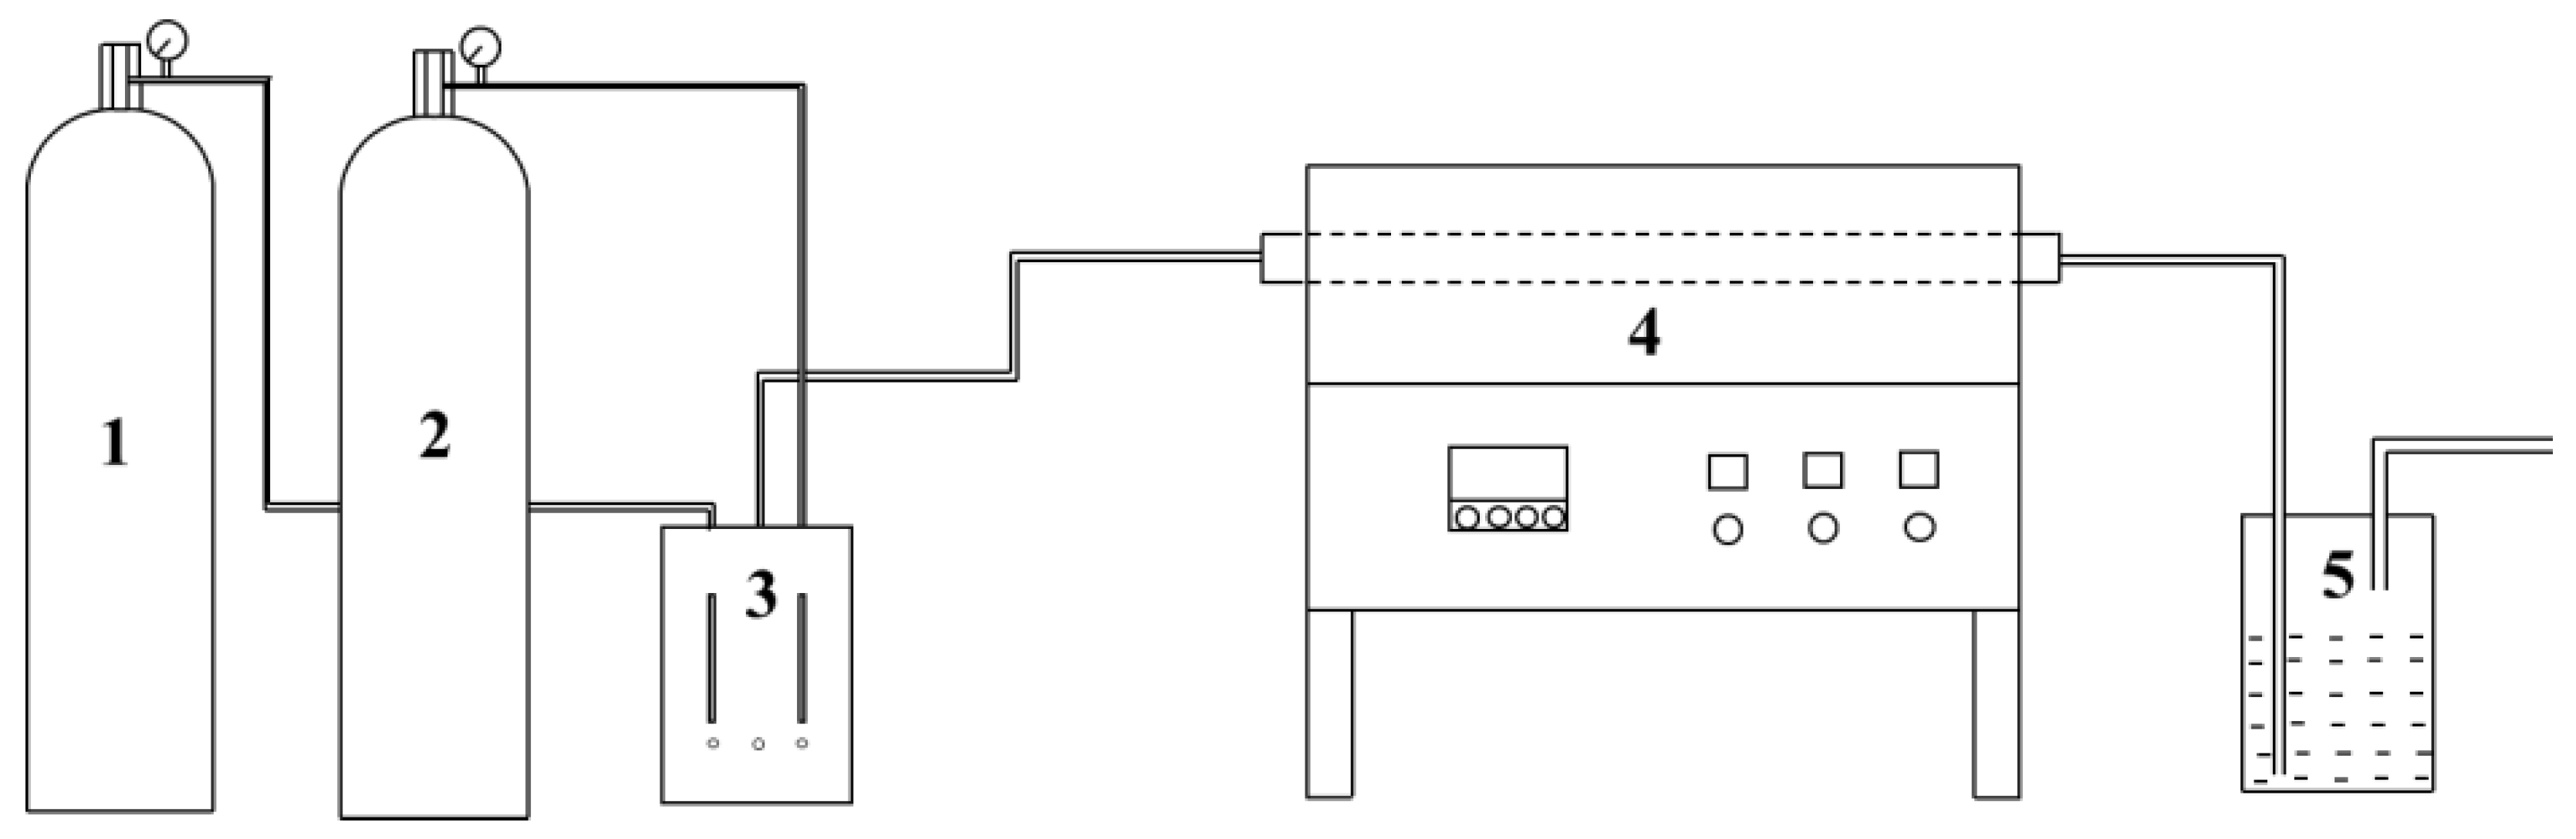
Figure 2.
Schematic diagram of the roasting experimental setup (1. Oxygen cylinder. 2. Argon cylinder. 3. Gas mixing instrument. 4. Tube furnace. 5. Gas recovery device).
Figure 2.
Schematic diagram of the roasting experimental setup (1. Oxygen cylinder. 2. Argon cylinder. 3. Gas mixing instrument. 4. Tube furnace. 5. Gas recovery device).
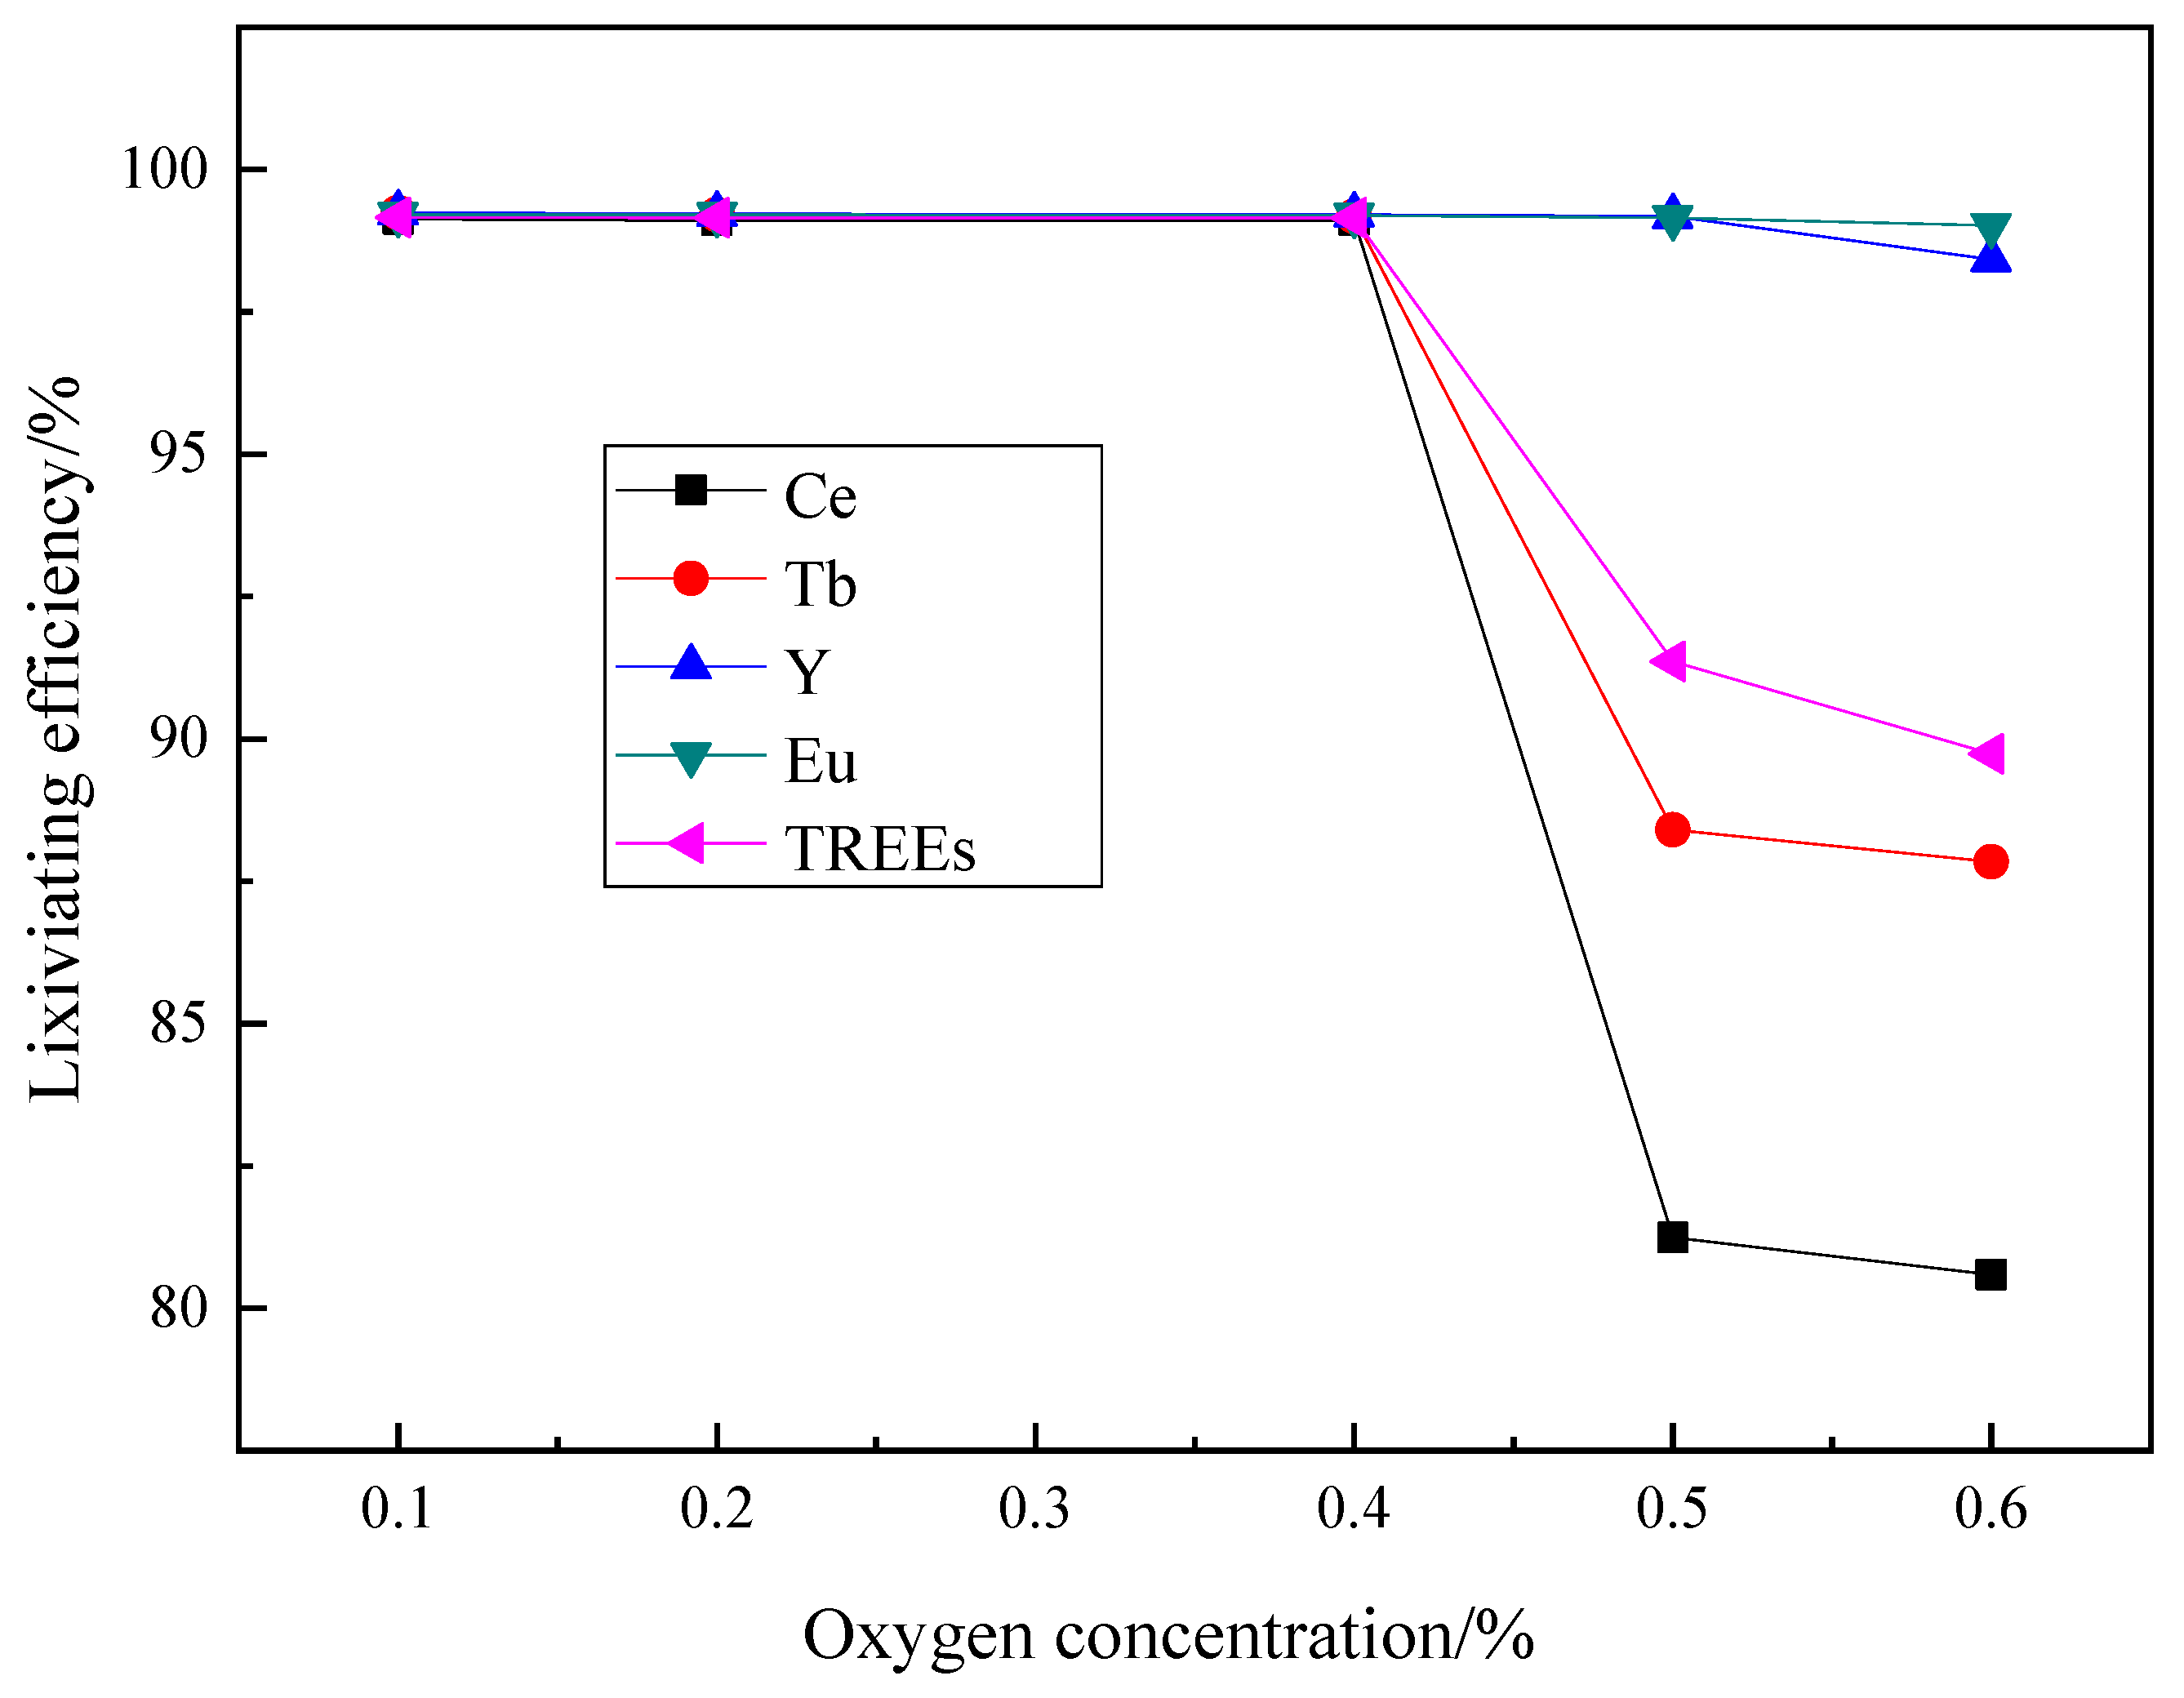
Figure 3.
Influence of the oxygen concentration on the REEs leaching efficiencies (roasting temperature of 700 °C, roasting time of 3 h, mass ratio of phosphor powder to sodium hydroxide 1:3, HCl solution concentration of 8 mol·L−1, acid leaching temperature of 60 °C, acid leaching time of 1 h, and liquid–solid ratio of 10:1).
Figure 4.
XRD pattern of the water-washing residue of the roasting product under the condition of 0.4% oxygen concentration.
Figure 4.
XRD pattern of the water-washing residue of the roasting product under the condition of 0.4% oxygen concentration.
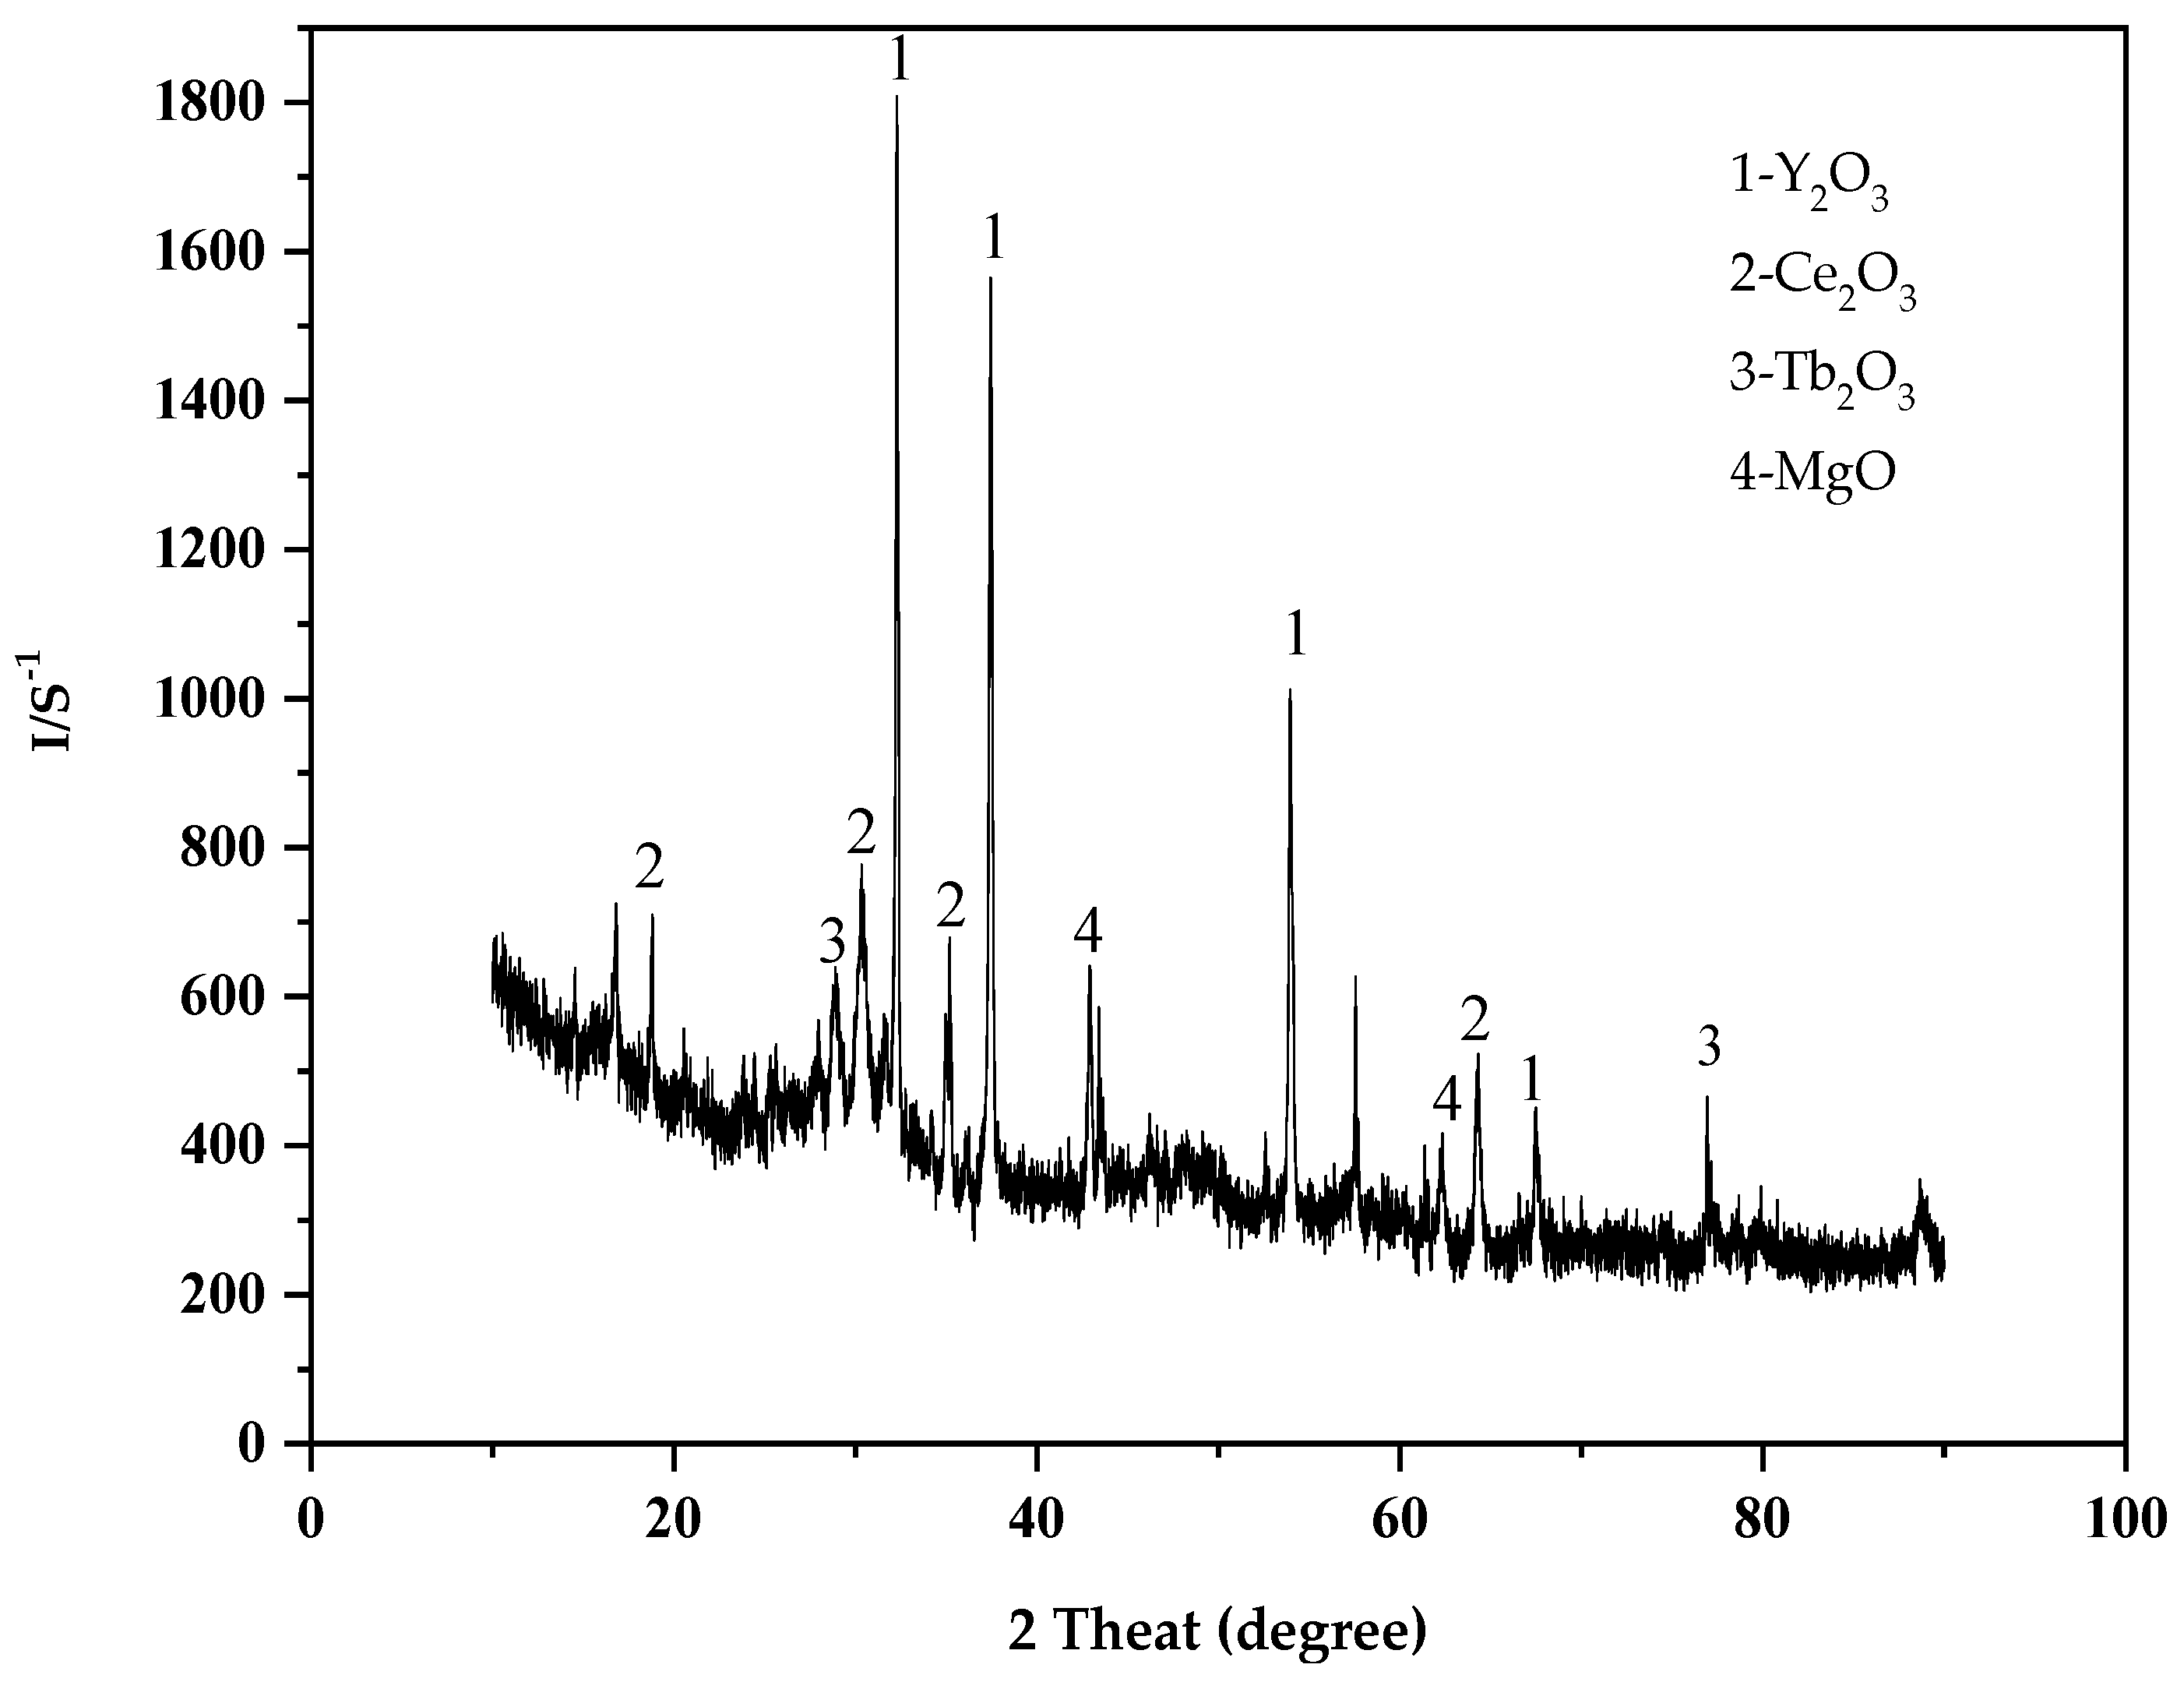
Figure 5.
XRD pattern of the water-washing residue of the roasting product under the condition of 0.5% oxygen concentration.
Figure 5.
XRD pattern of the water-washing residue of the roasting product under the condition of 0.5% oxygen concentration.
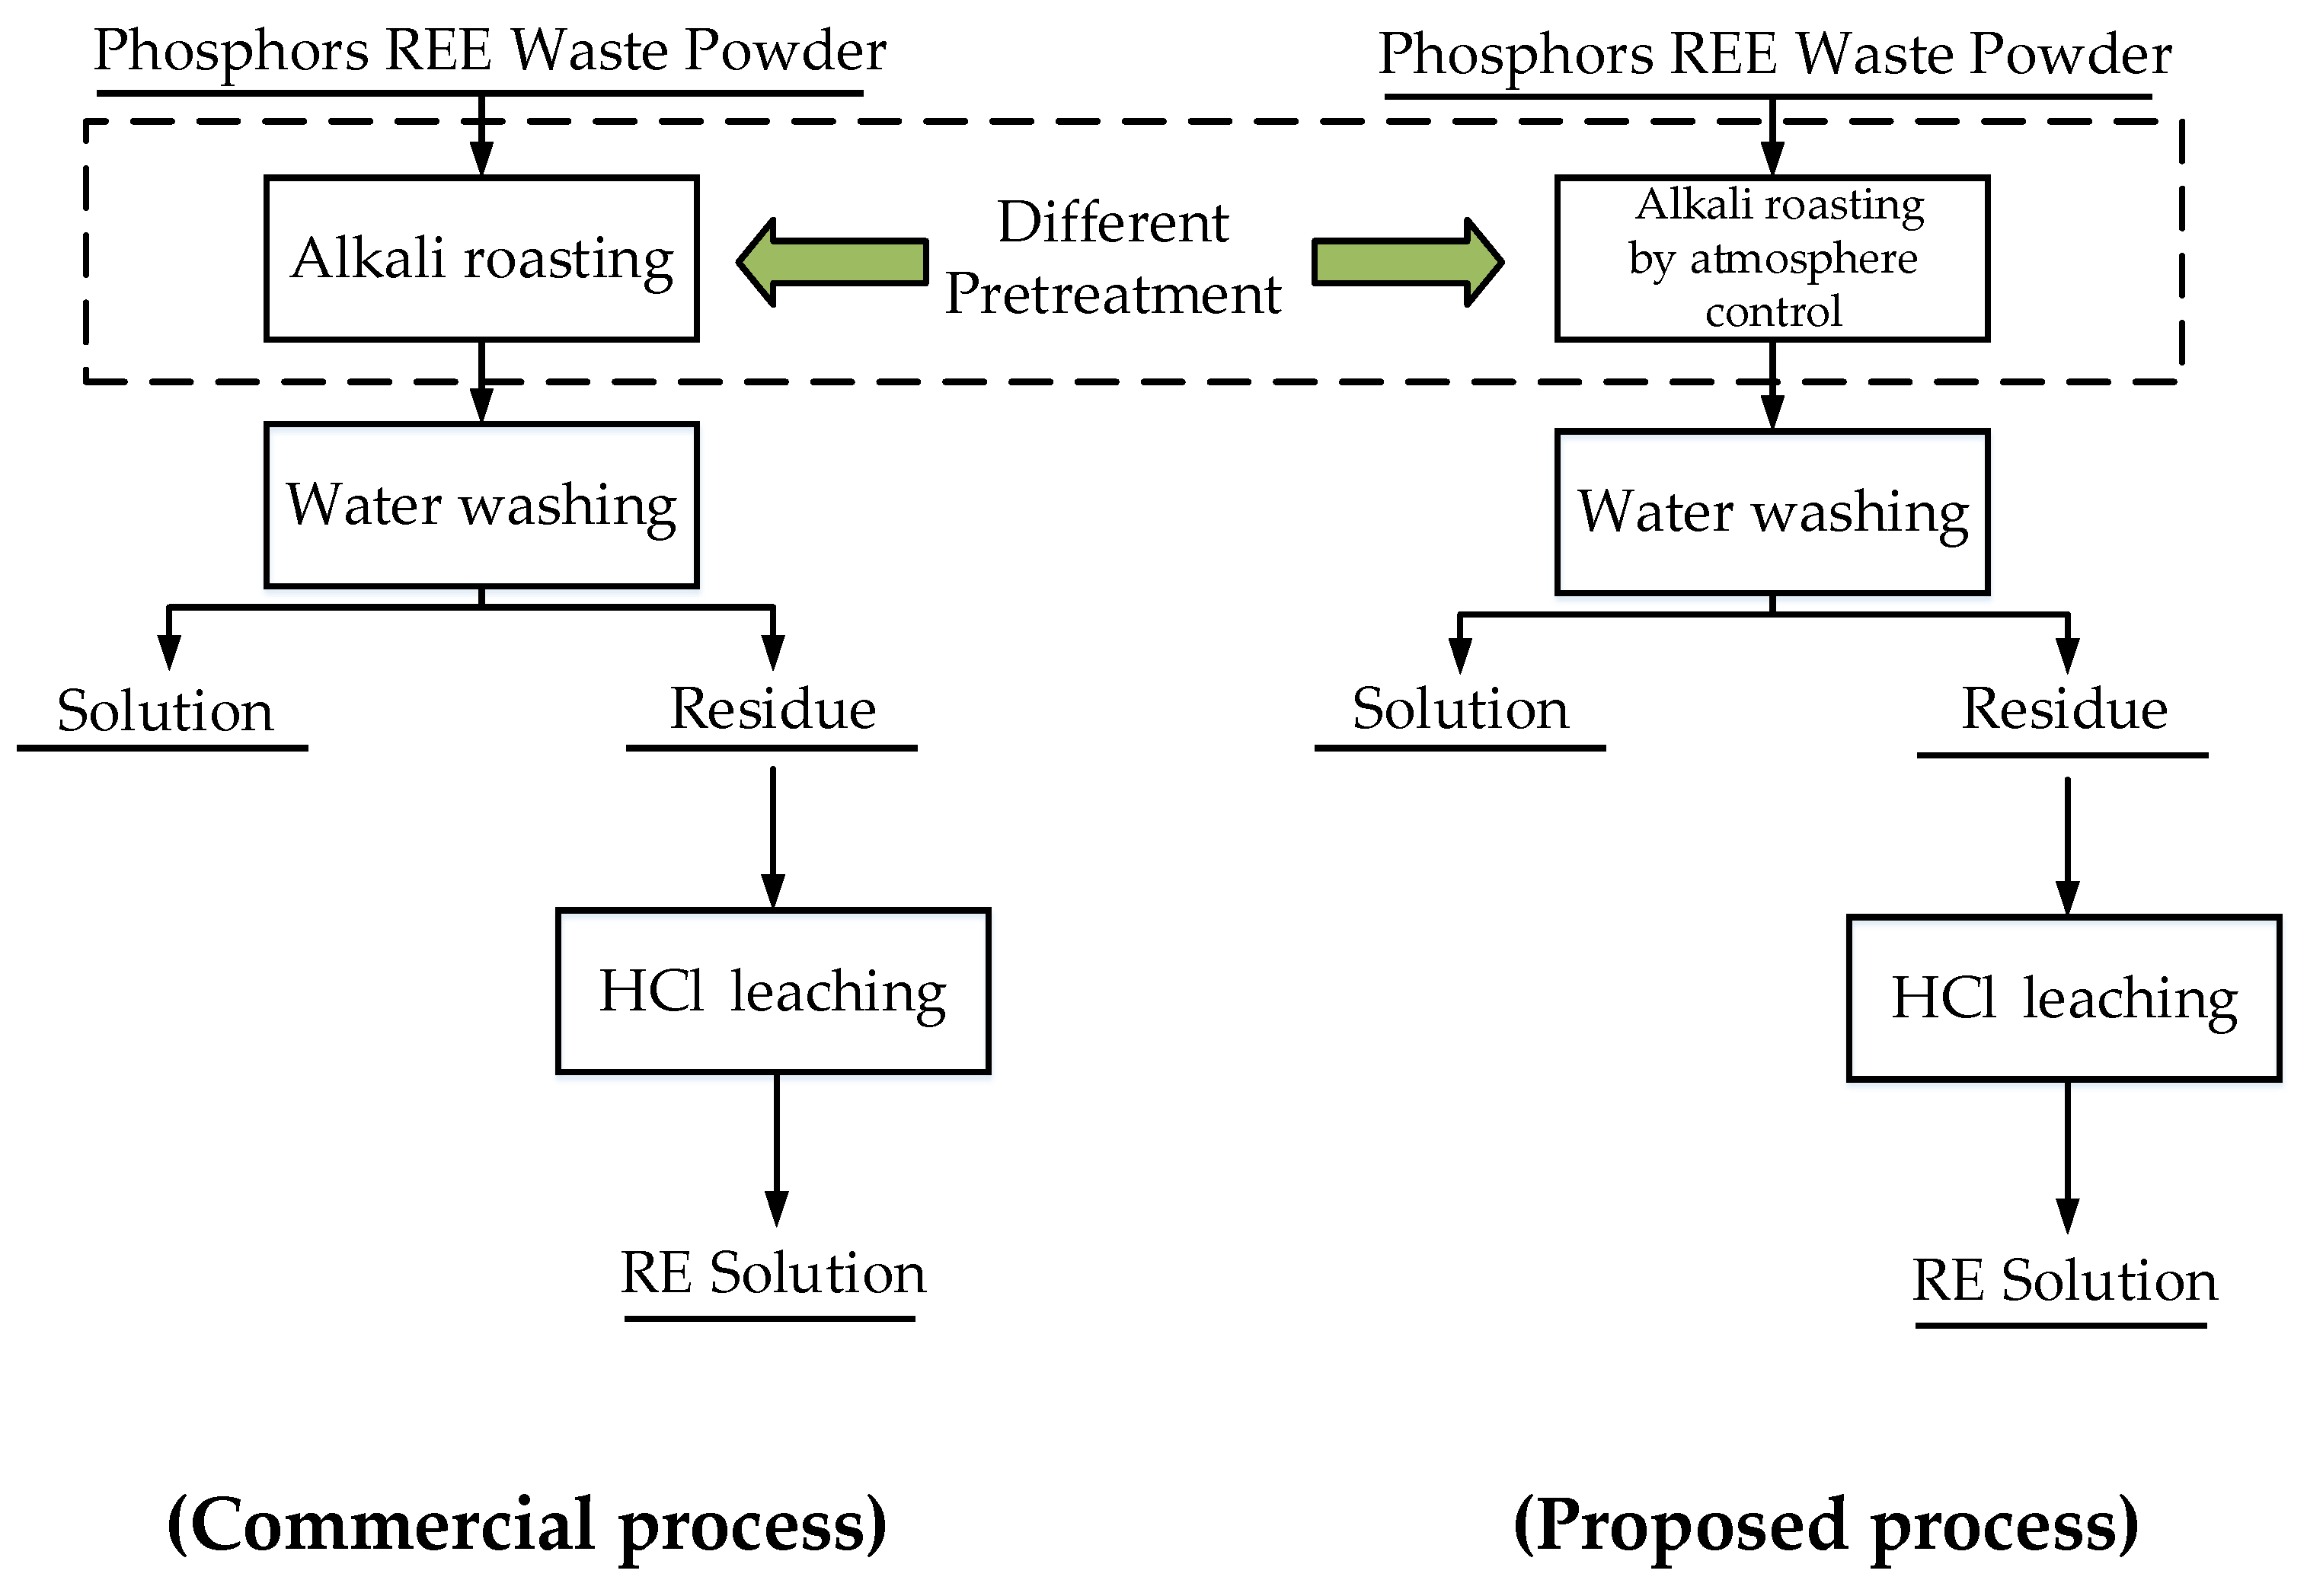
Figure 6.
Flowsheet comparison between the commercial process and proposed process.
Figure 6.
Flowsheet comparison between the commercial process and proposed process.
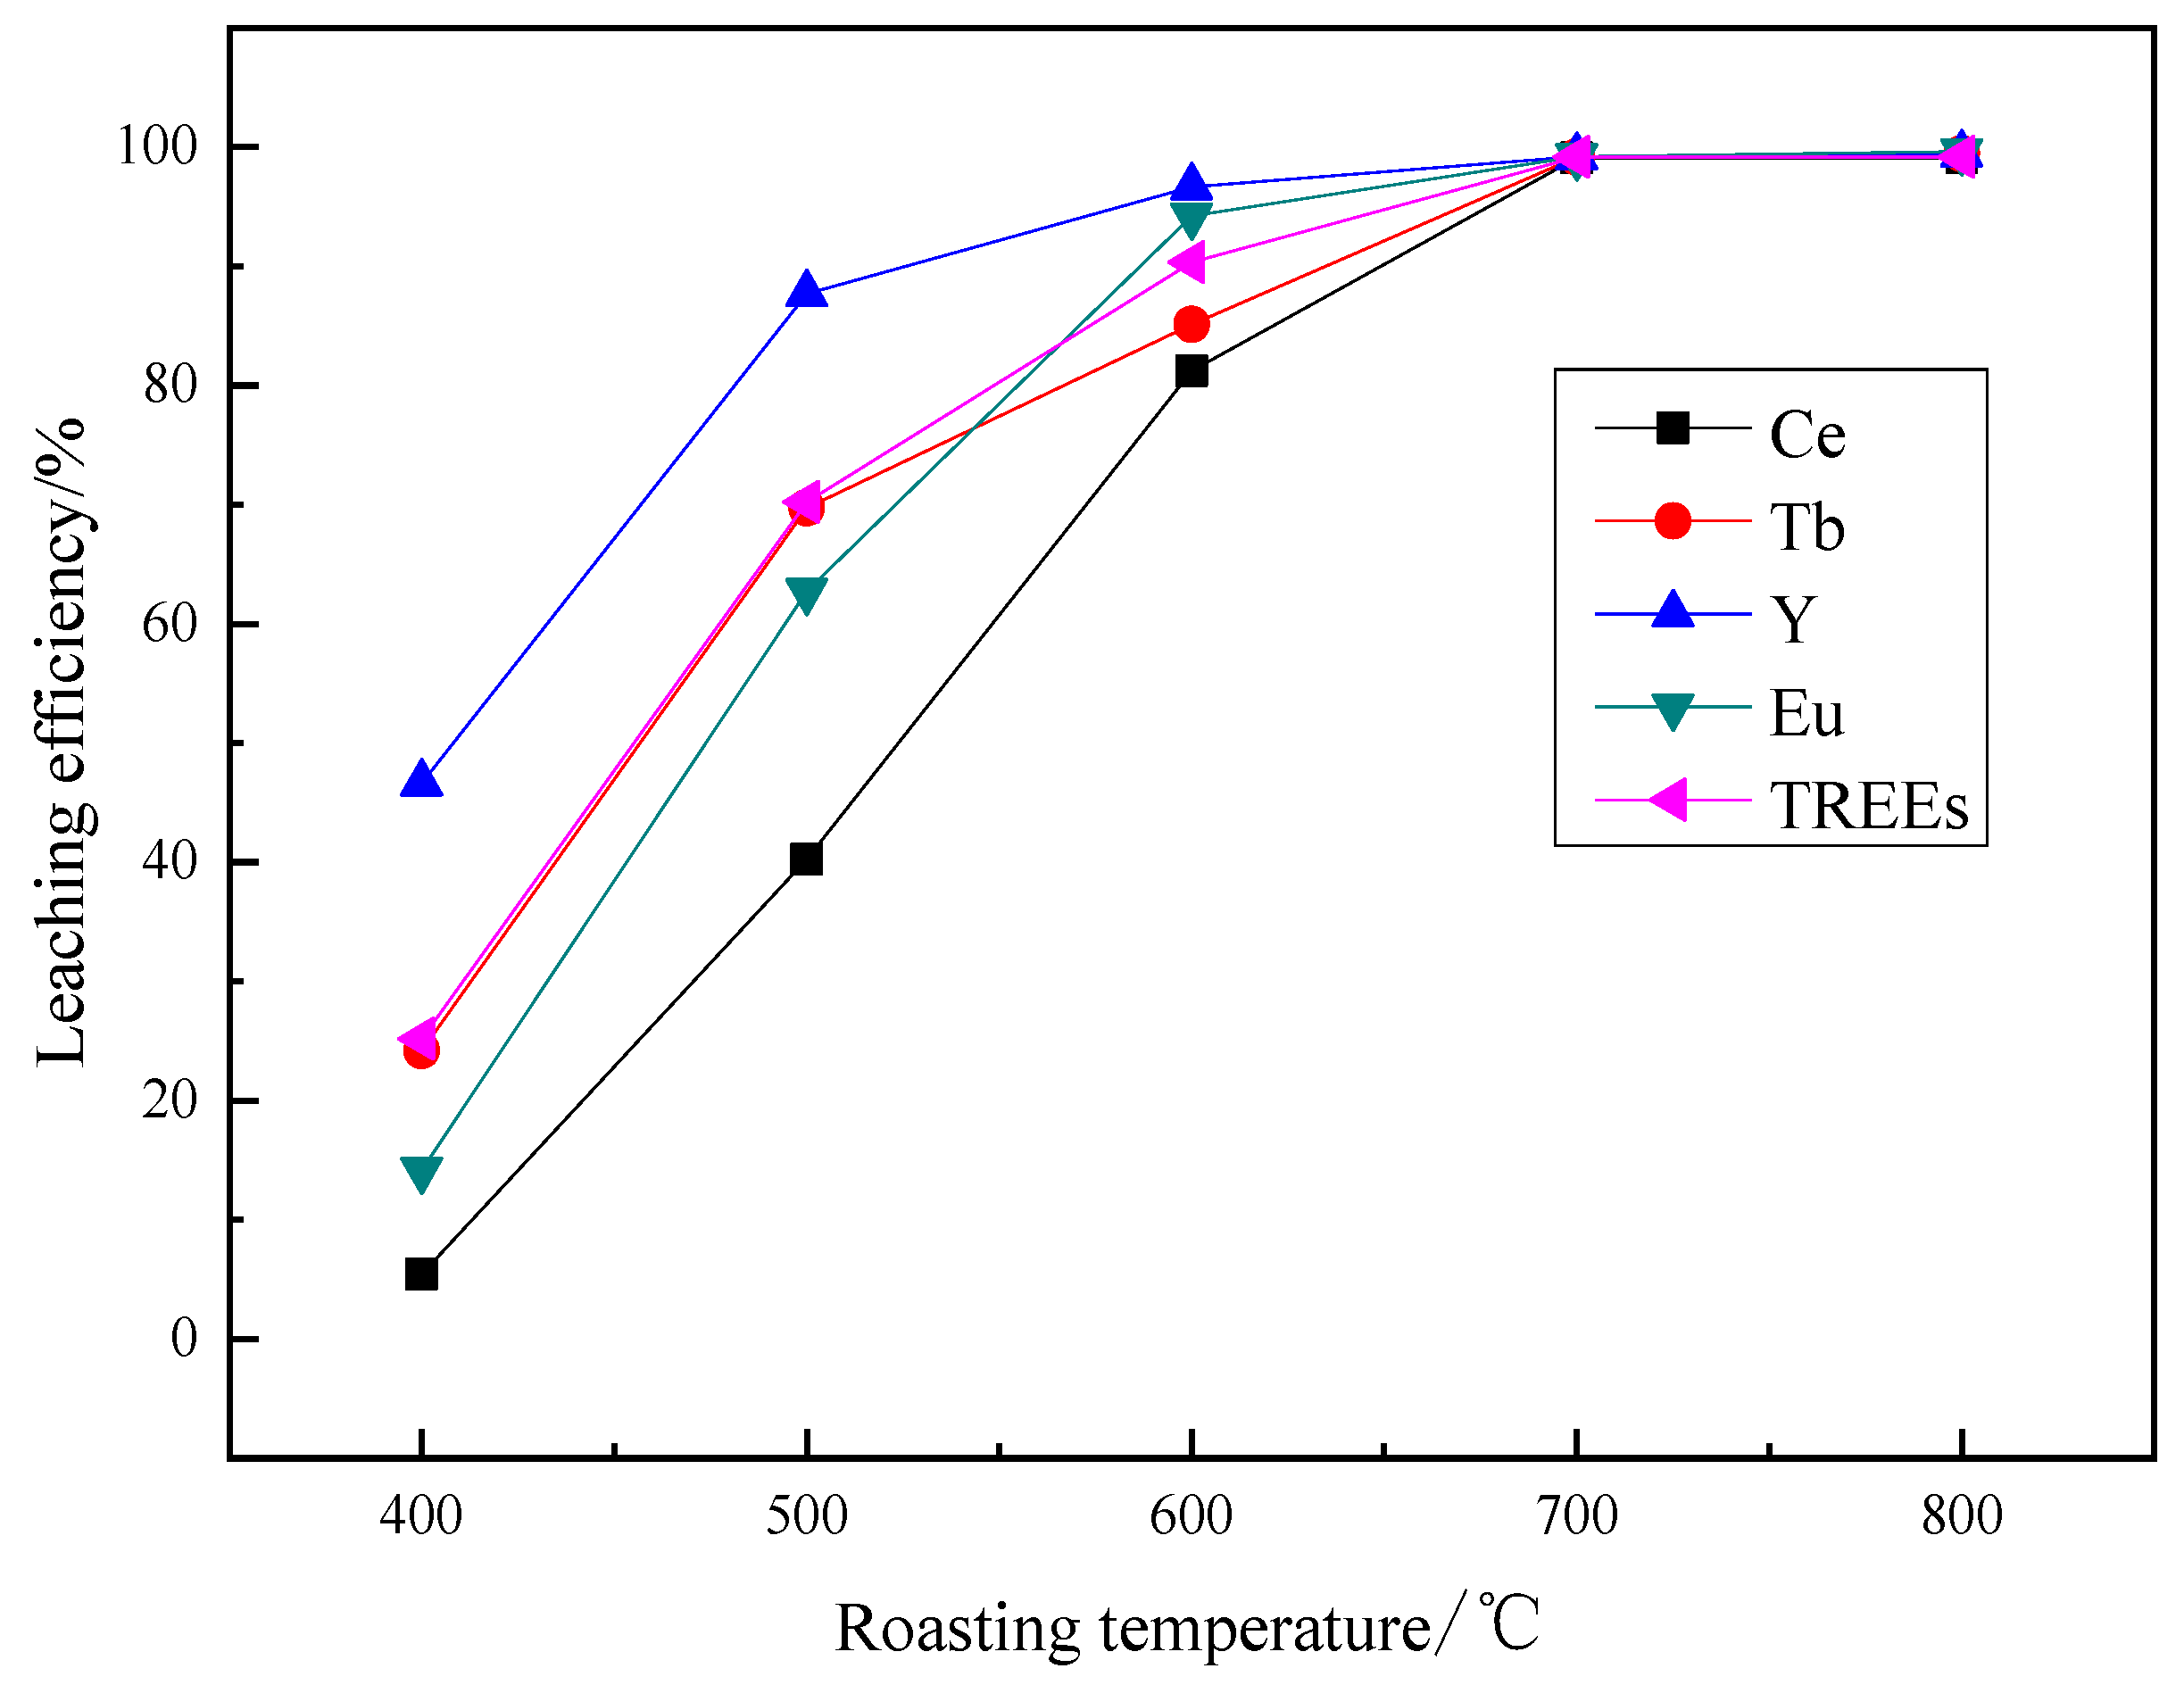
Figure 7.
Influence of the roasting temperature on the REEs leaching efficiencies (oxygen concentration in the mixed gas of 0.4%, roasting time of 3 h, mass ratio of phosphor powder to alkali 1:3, HCl solution concentration of 8 mol·L−1, acid leaching temperature of 60 °C, acid leaching time of 1 h, and liquid–solid ratio of 10:1).
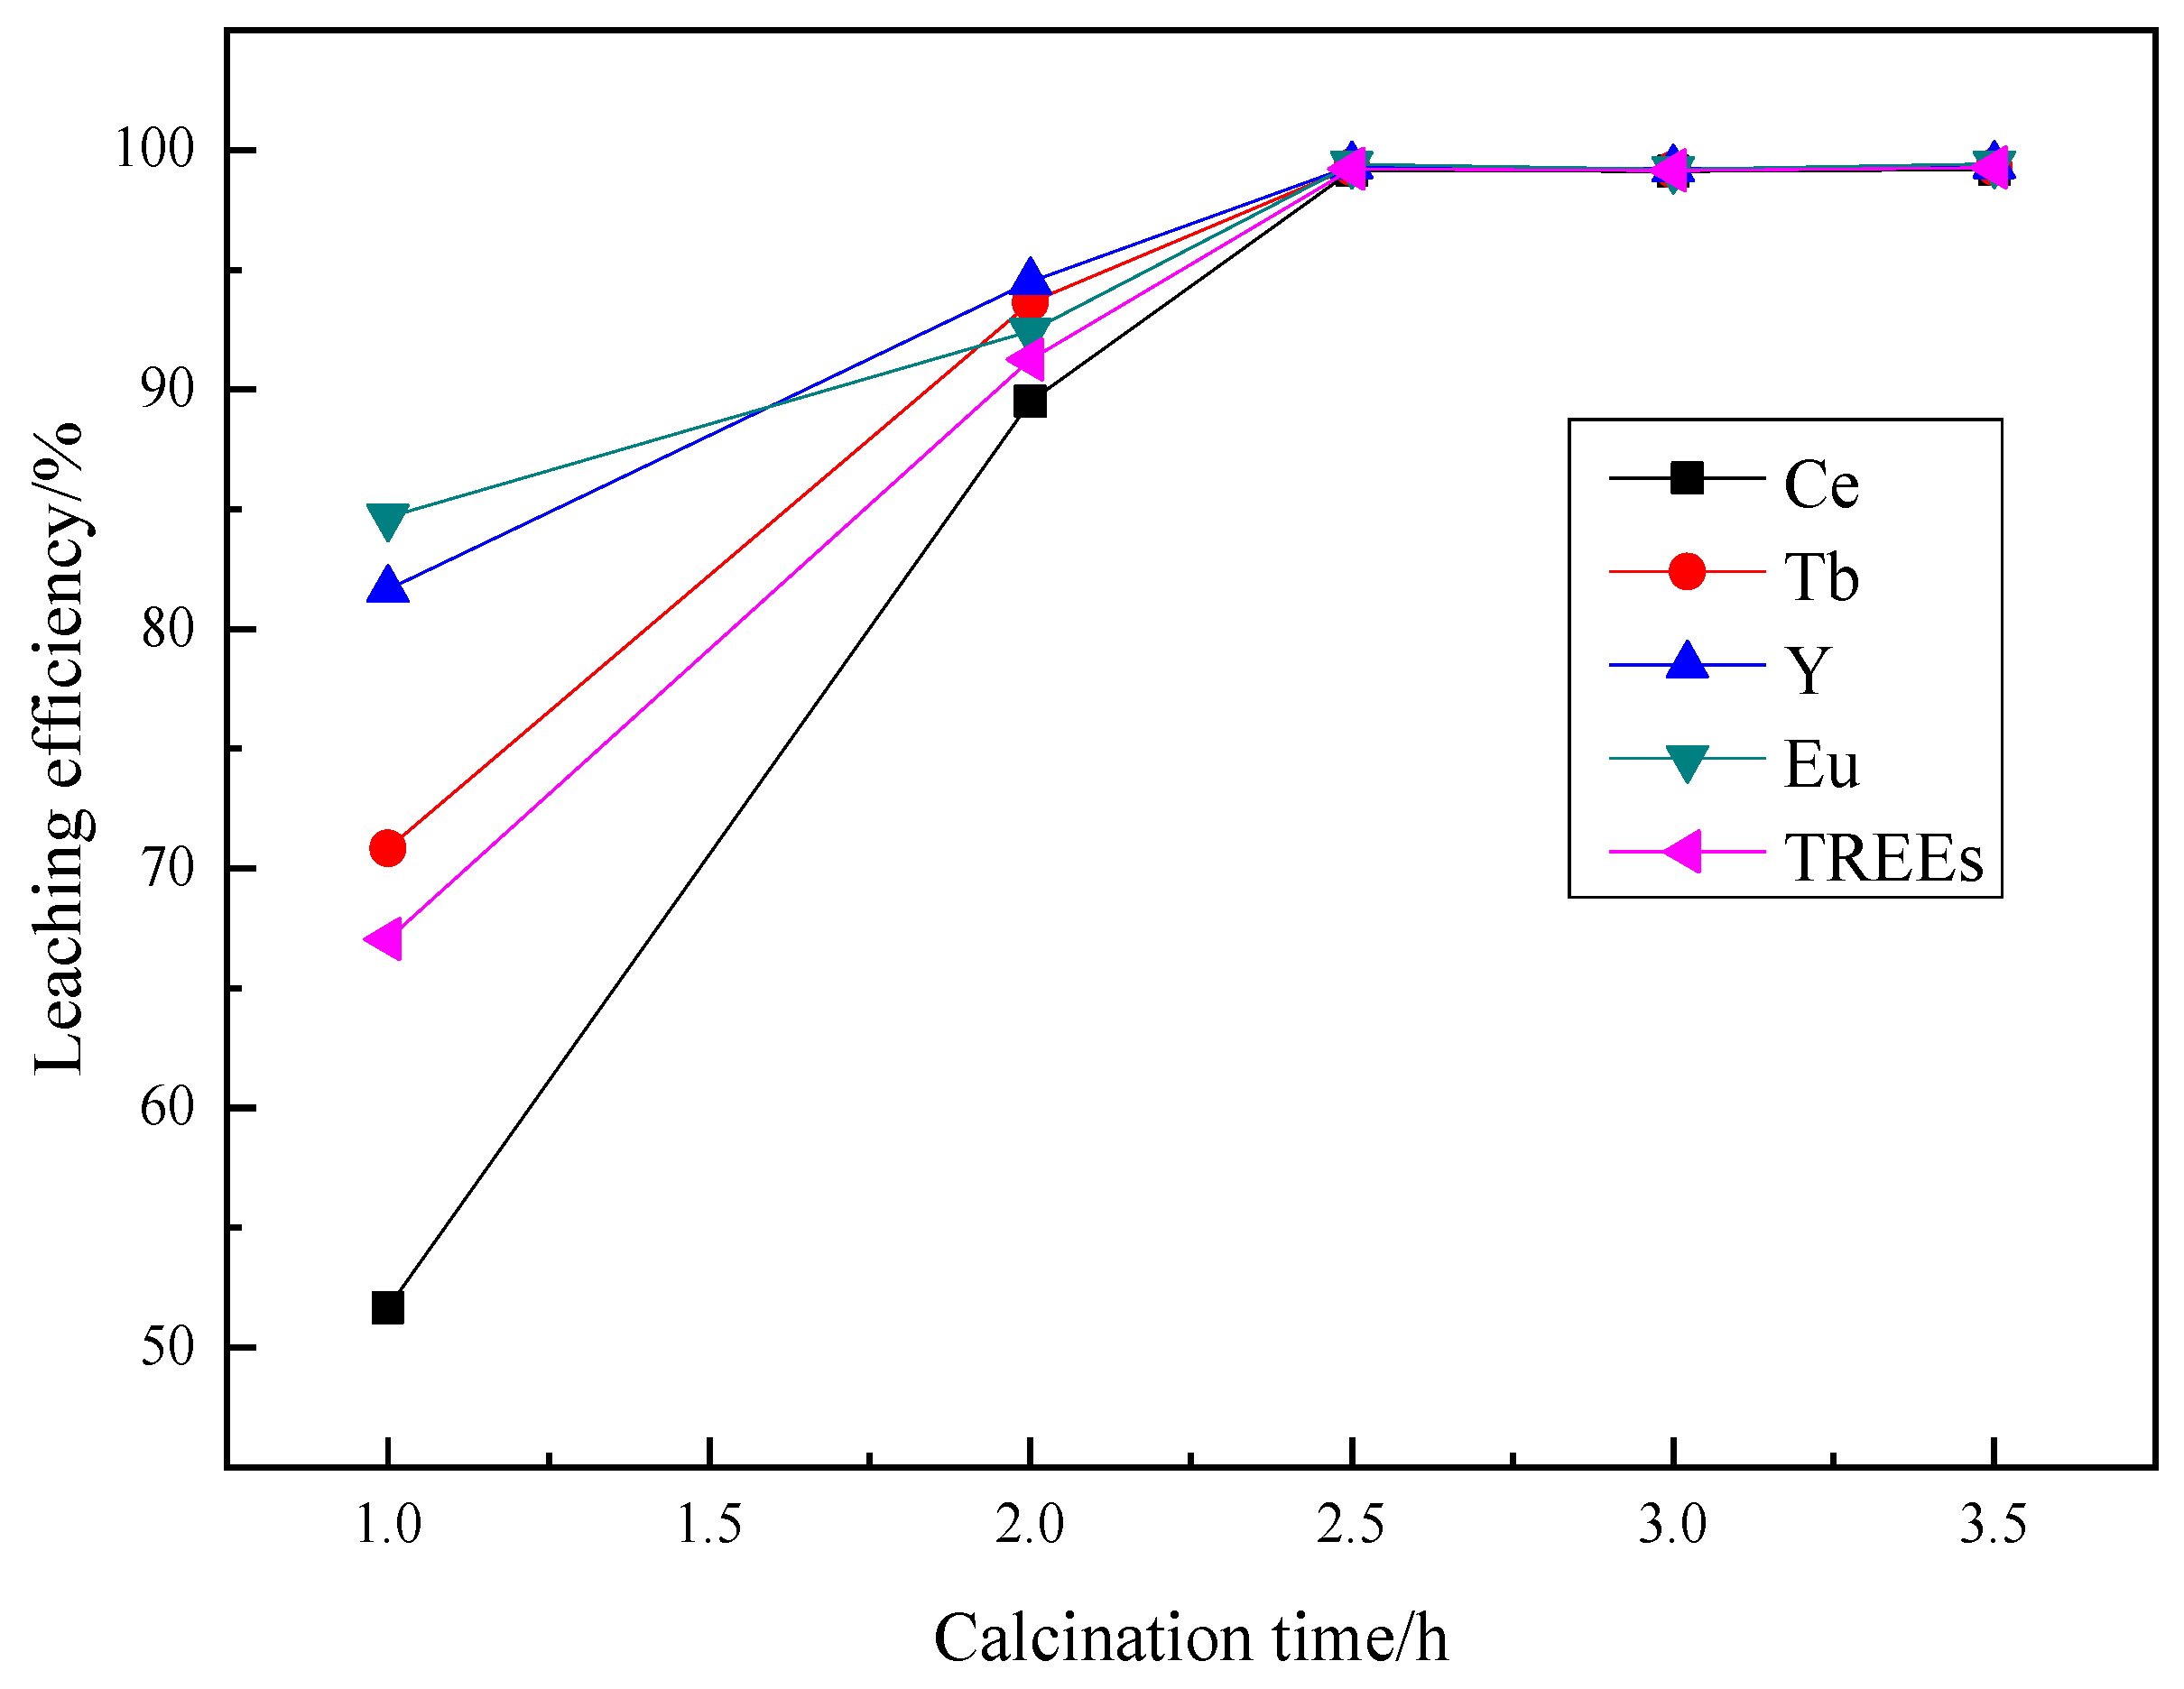
Figure 8.
Influence of the roasting time on the REEs leaching efficiencies (oxygen concentration in the mixed gas of 0.4%, a roasting temperature of 700 °C, a mass ratio of phosphor powder to alkali 1:3, a HCl solution concentration of 8 mol·L−1, an acid immersion temperature of 60 °C, an acid leaching time of 1 h, and a liquid–solid ratio of 10:1).
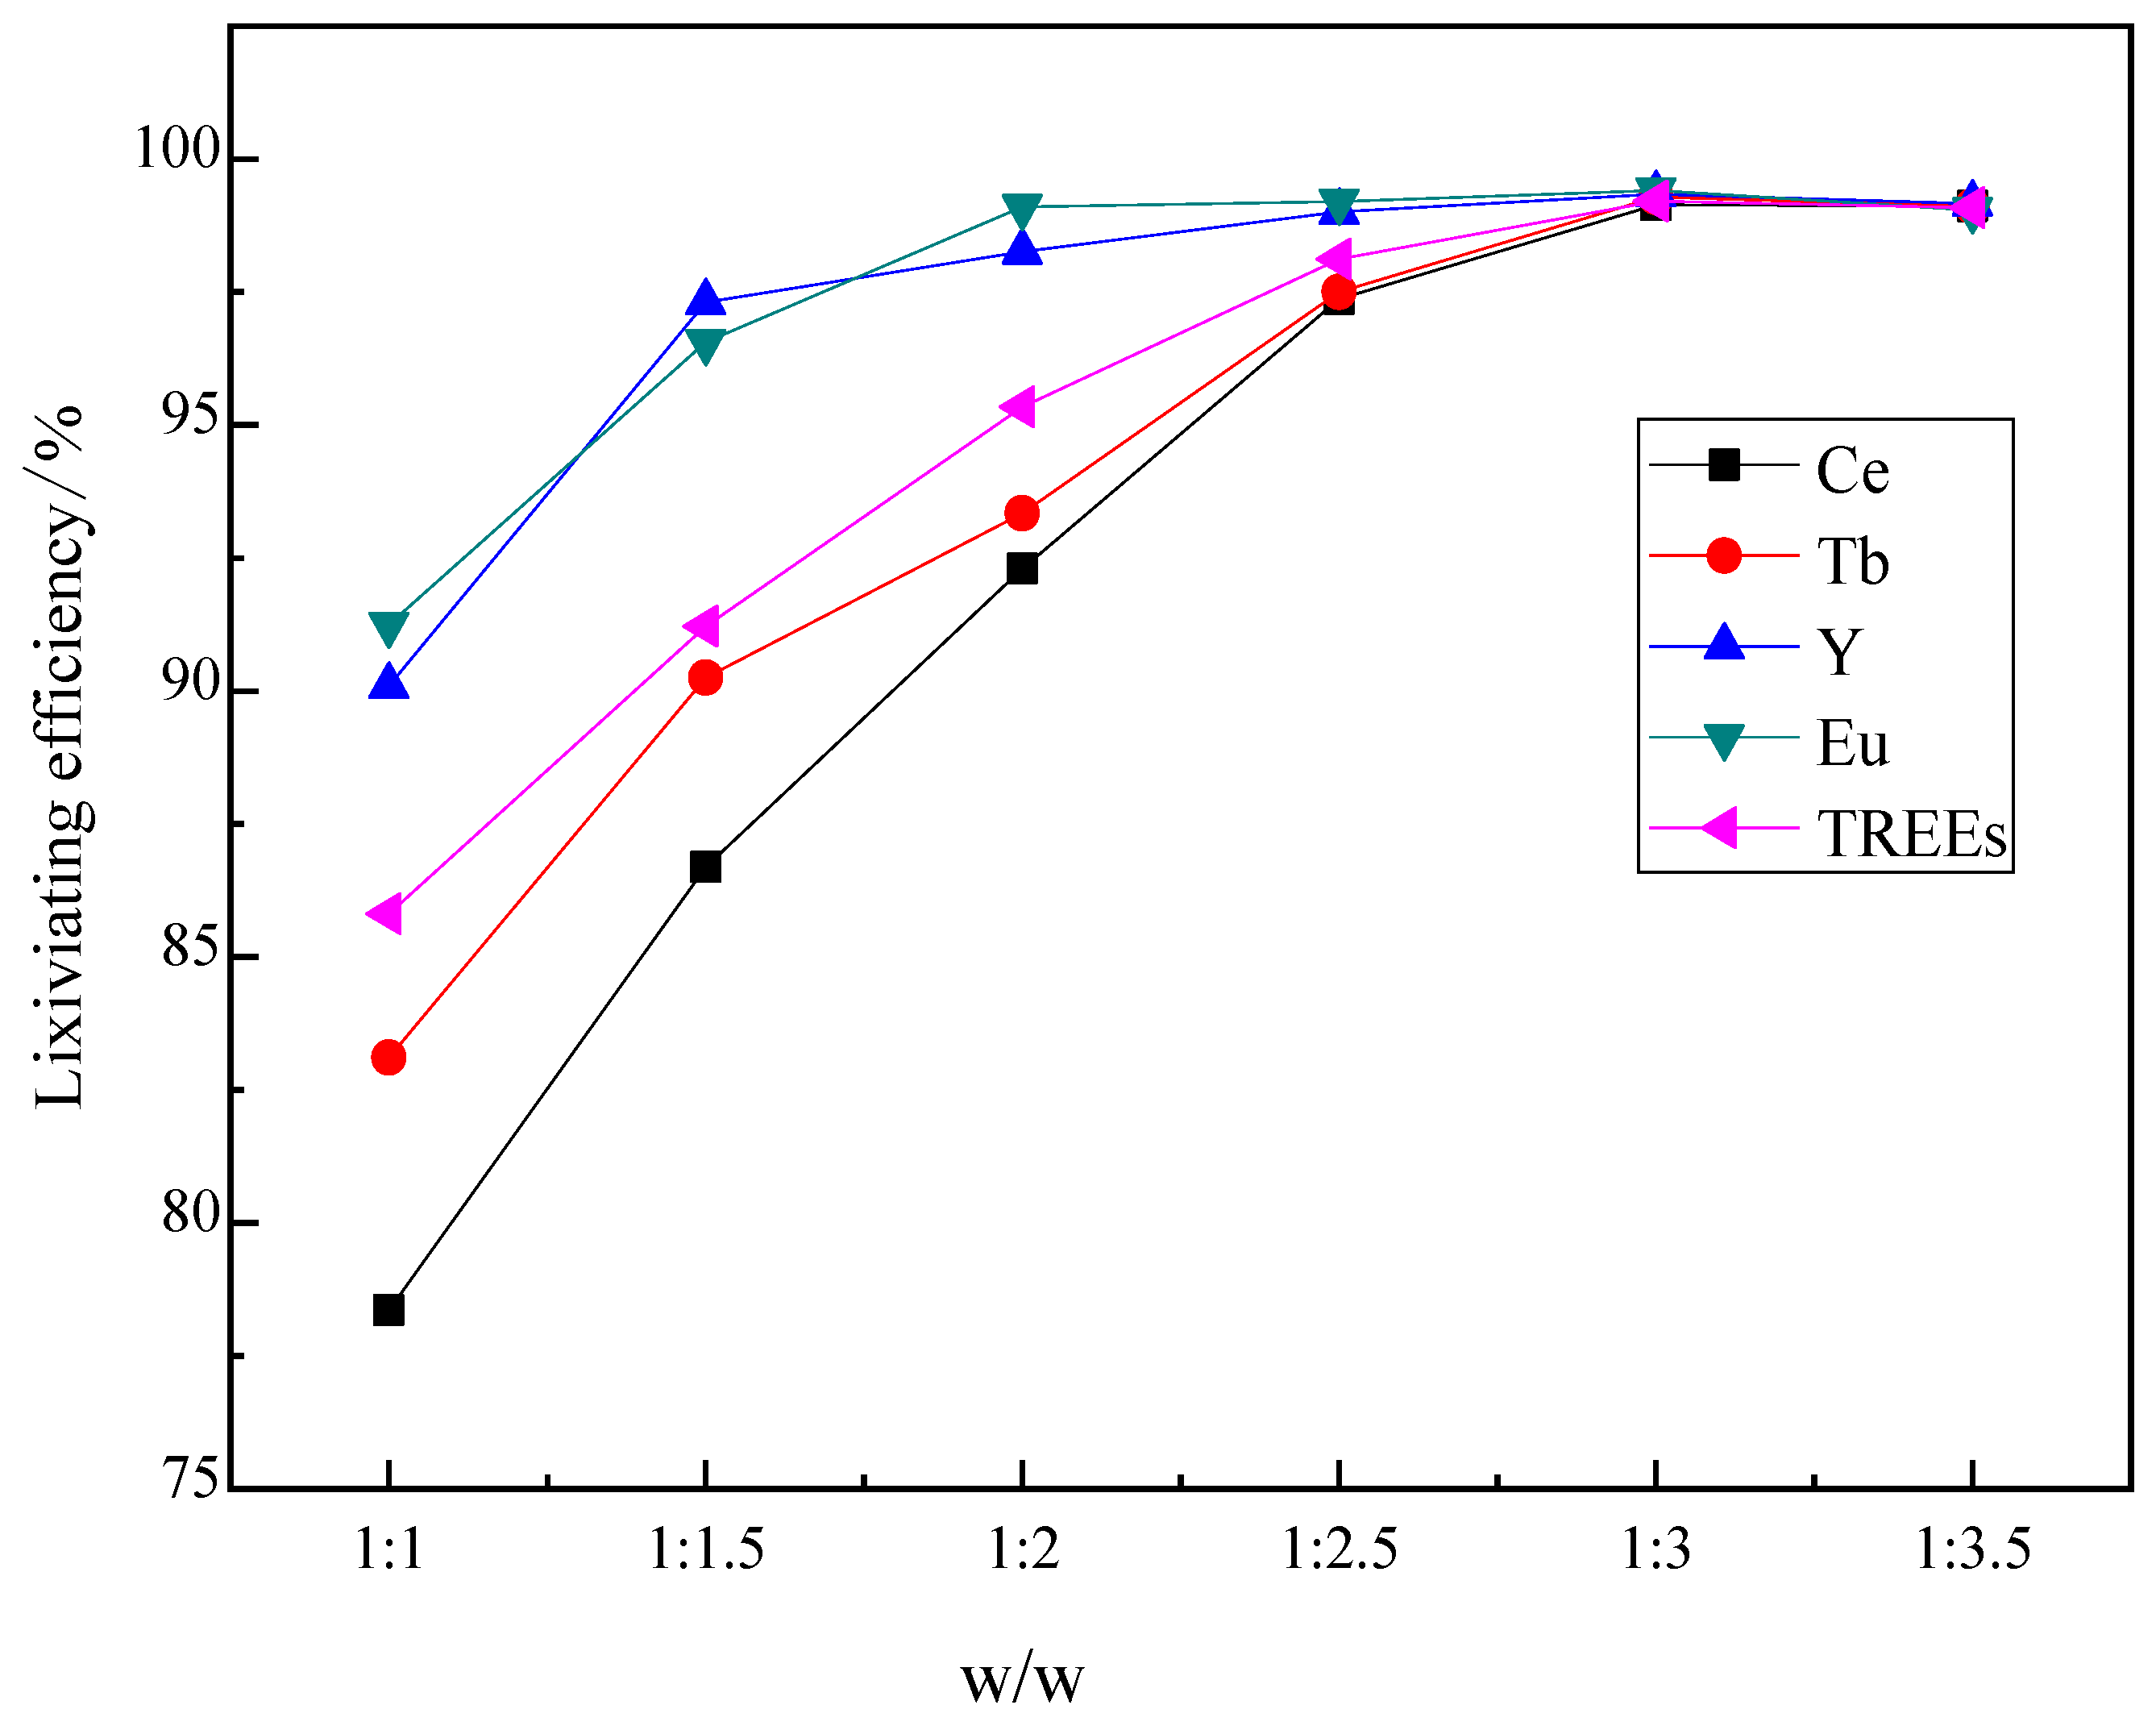
Figure 9.
Influence of the mass ratio on the REEs leaching efficiencies (oxygen concentration in the mixed gas of 0.4%, roasting temperature of 700 °C, roasting time of 2.5 h, HCl solution concentration of 8 mol·L−1, acid leaching temperature of 60 °C, acid leaching time of 1 h, and liquid–solid ratio of 10:1).
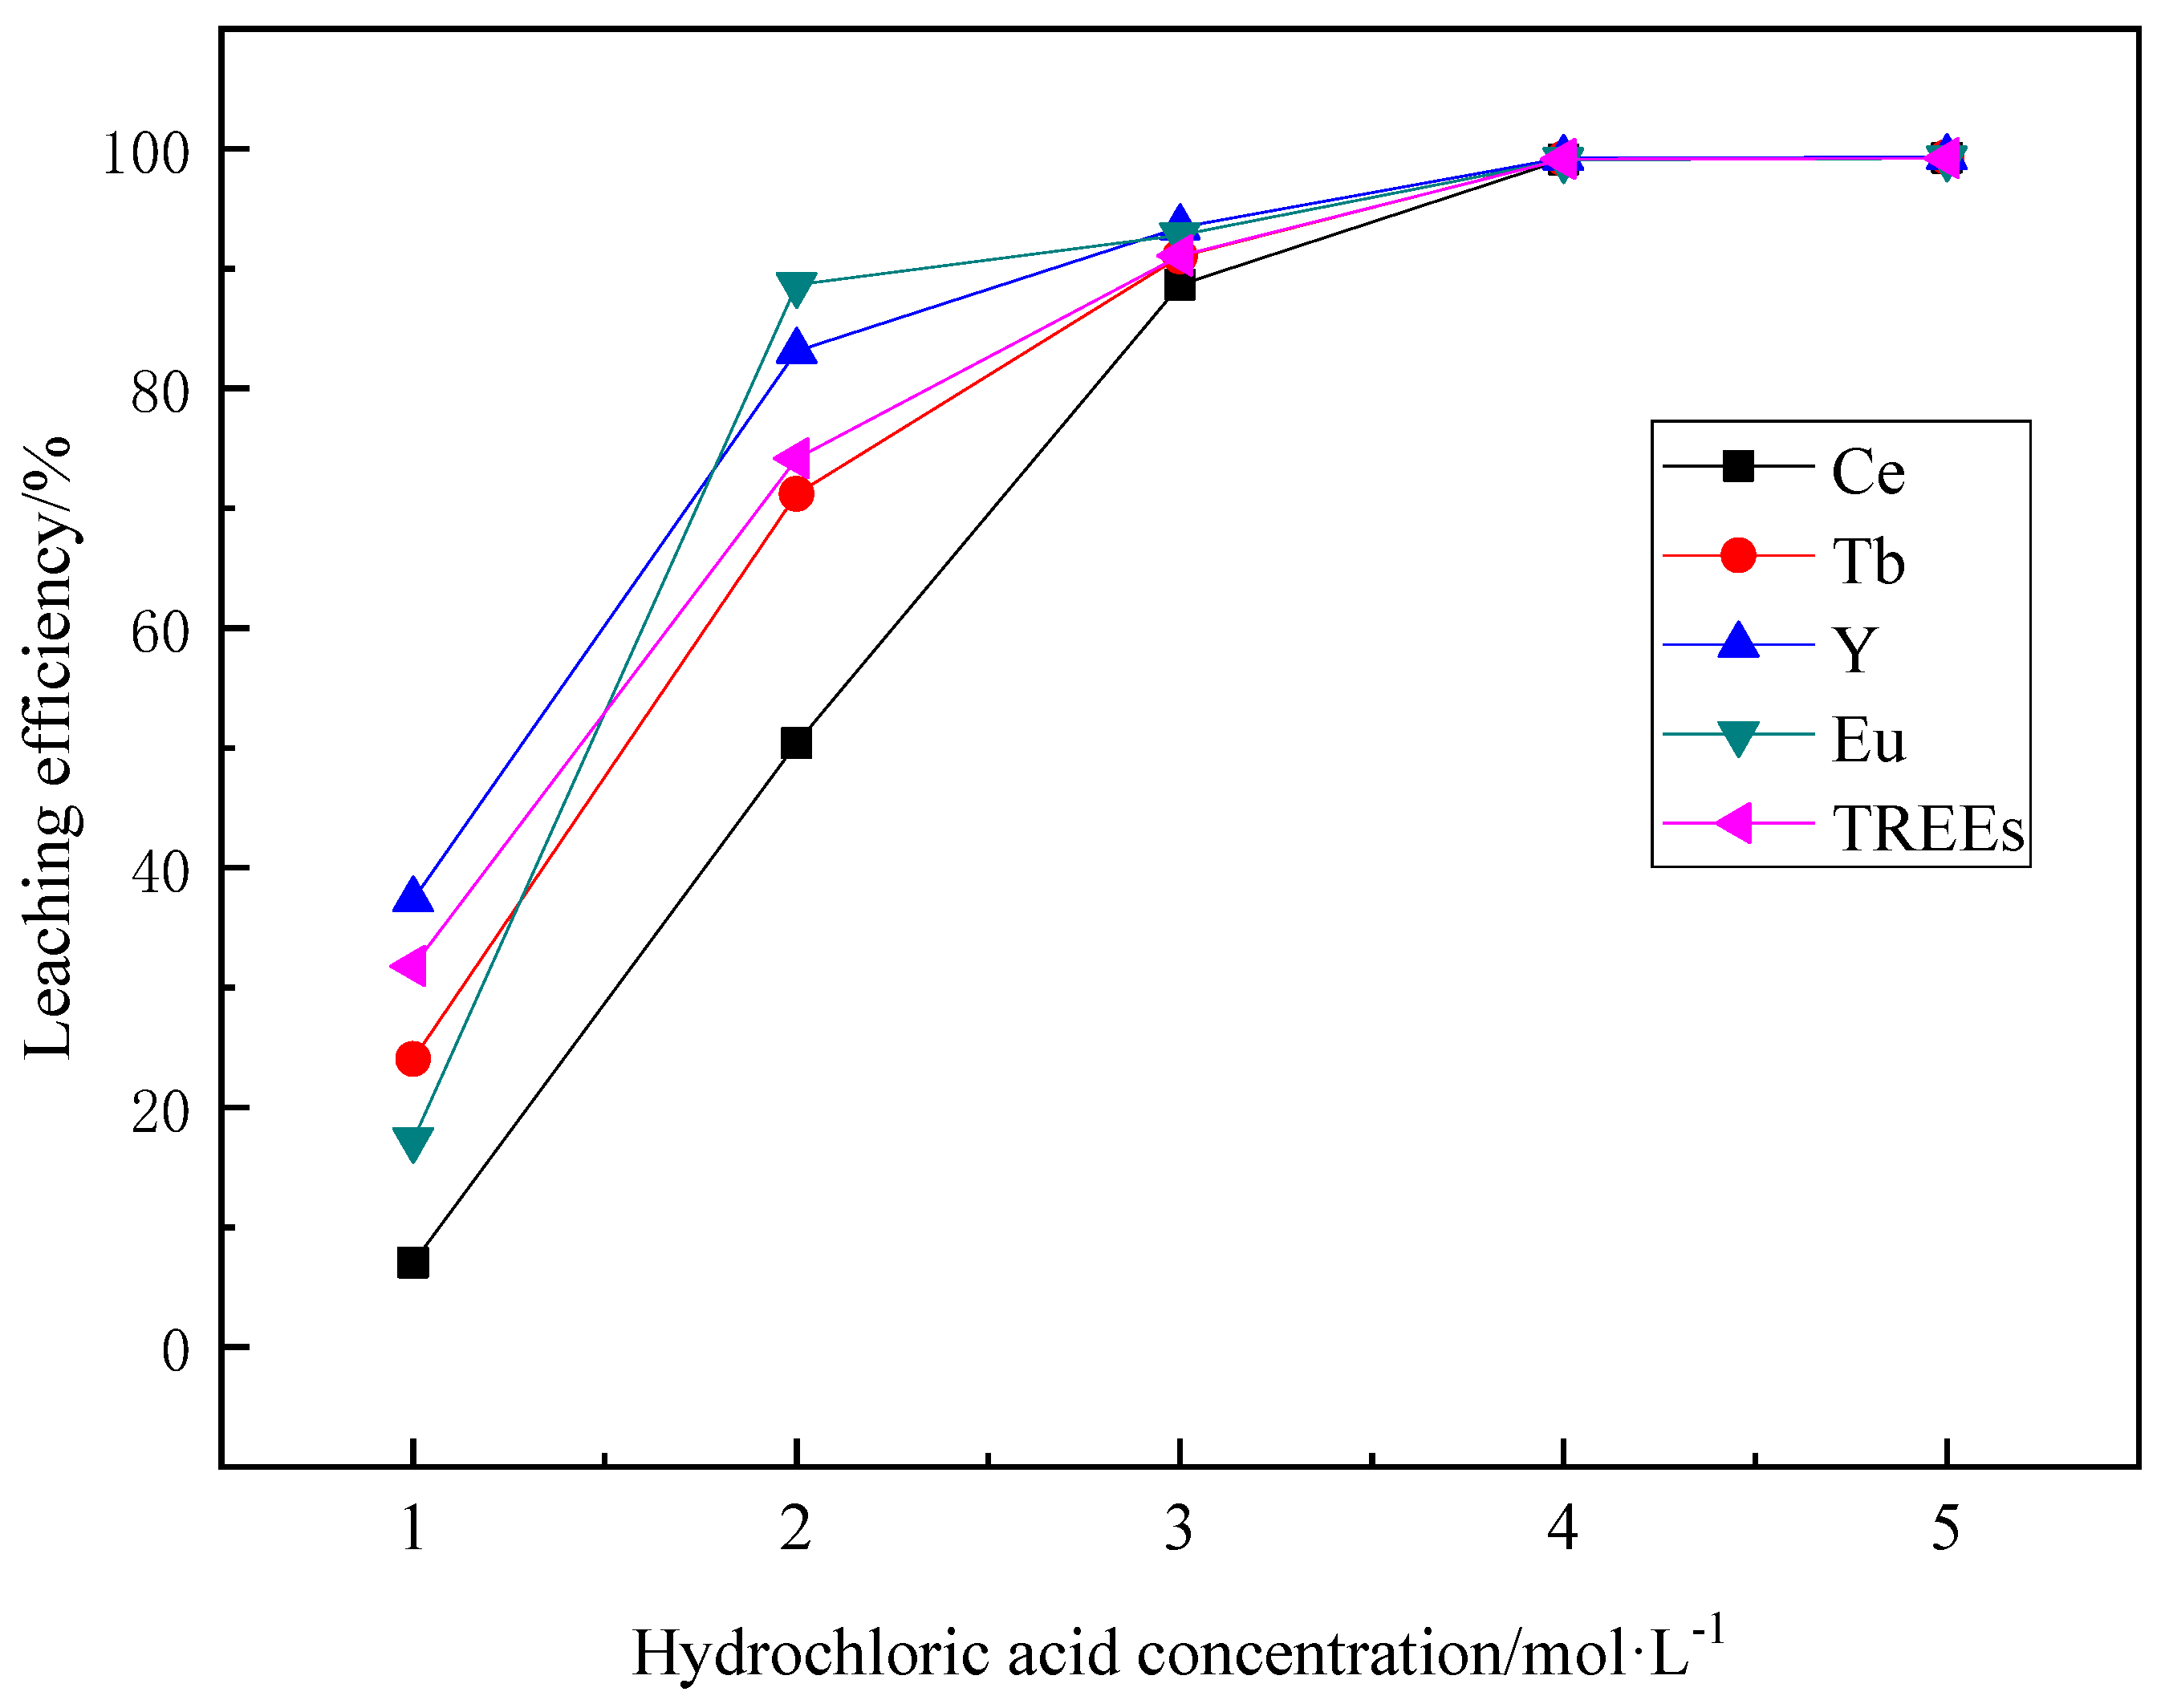
Figure 10.
Influence of the hydrochloric acid concentration on the REEs leaching efficiencies (oxygen concentration in the mixed gas of 0.4%, roasting temperature of 700 °C, roasting time of 2.5 h, mass ratio of phosphor powder to alkali 1:3, acid leaching temperature of 60 °C, acid leaching time of 1 h, and liquid–solid ratio of 10:1).
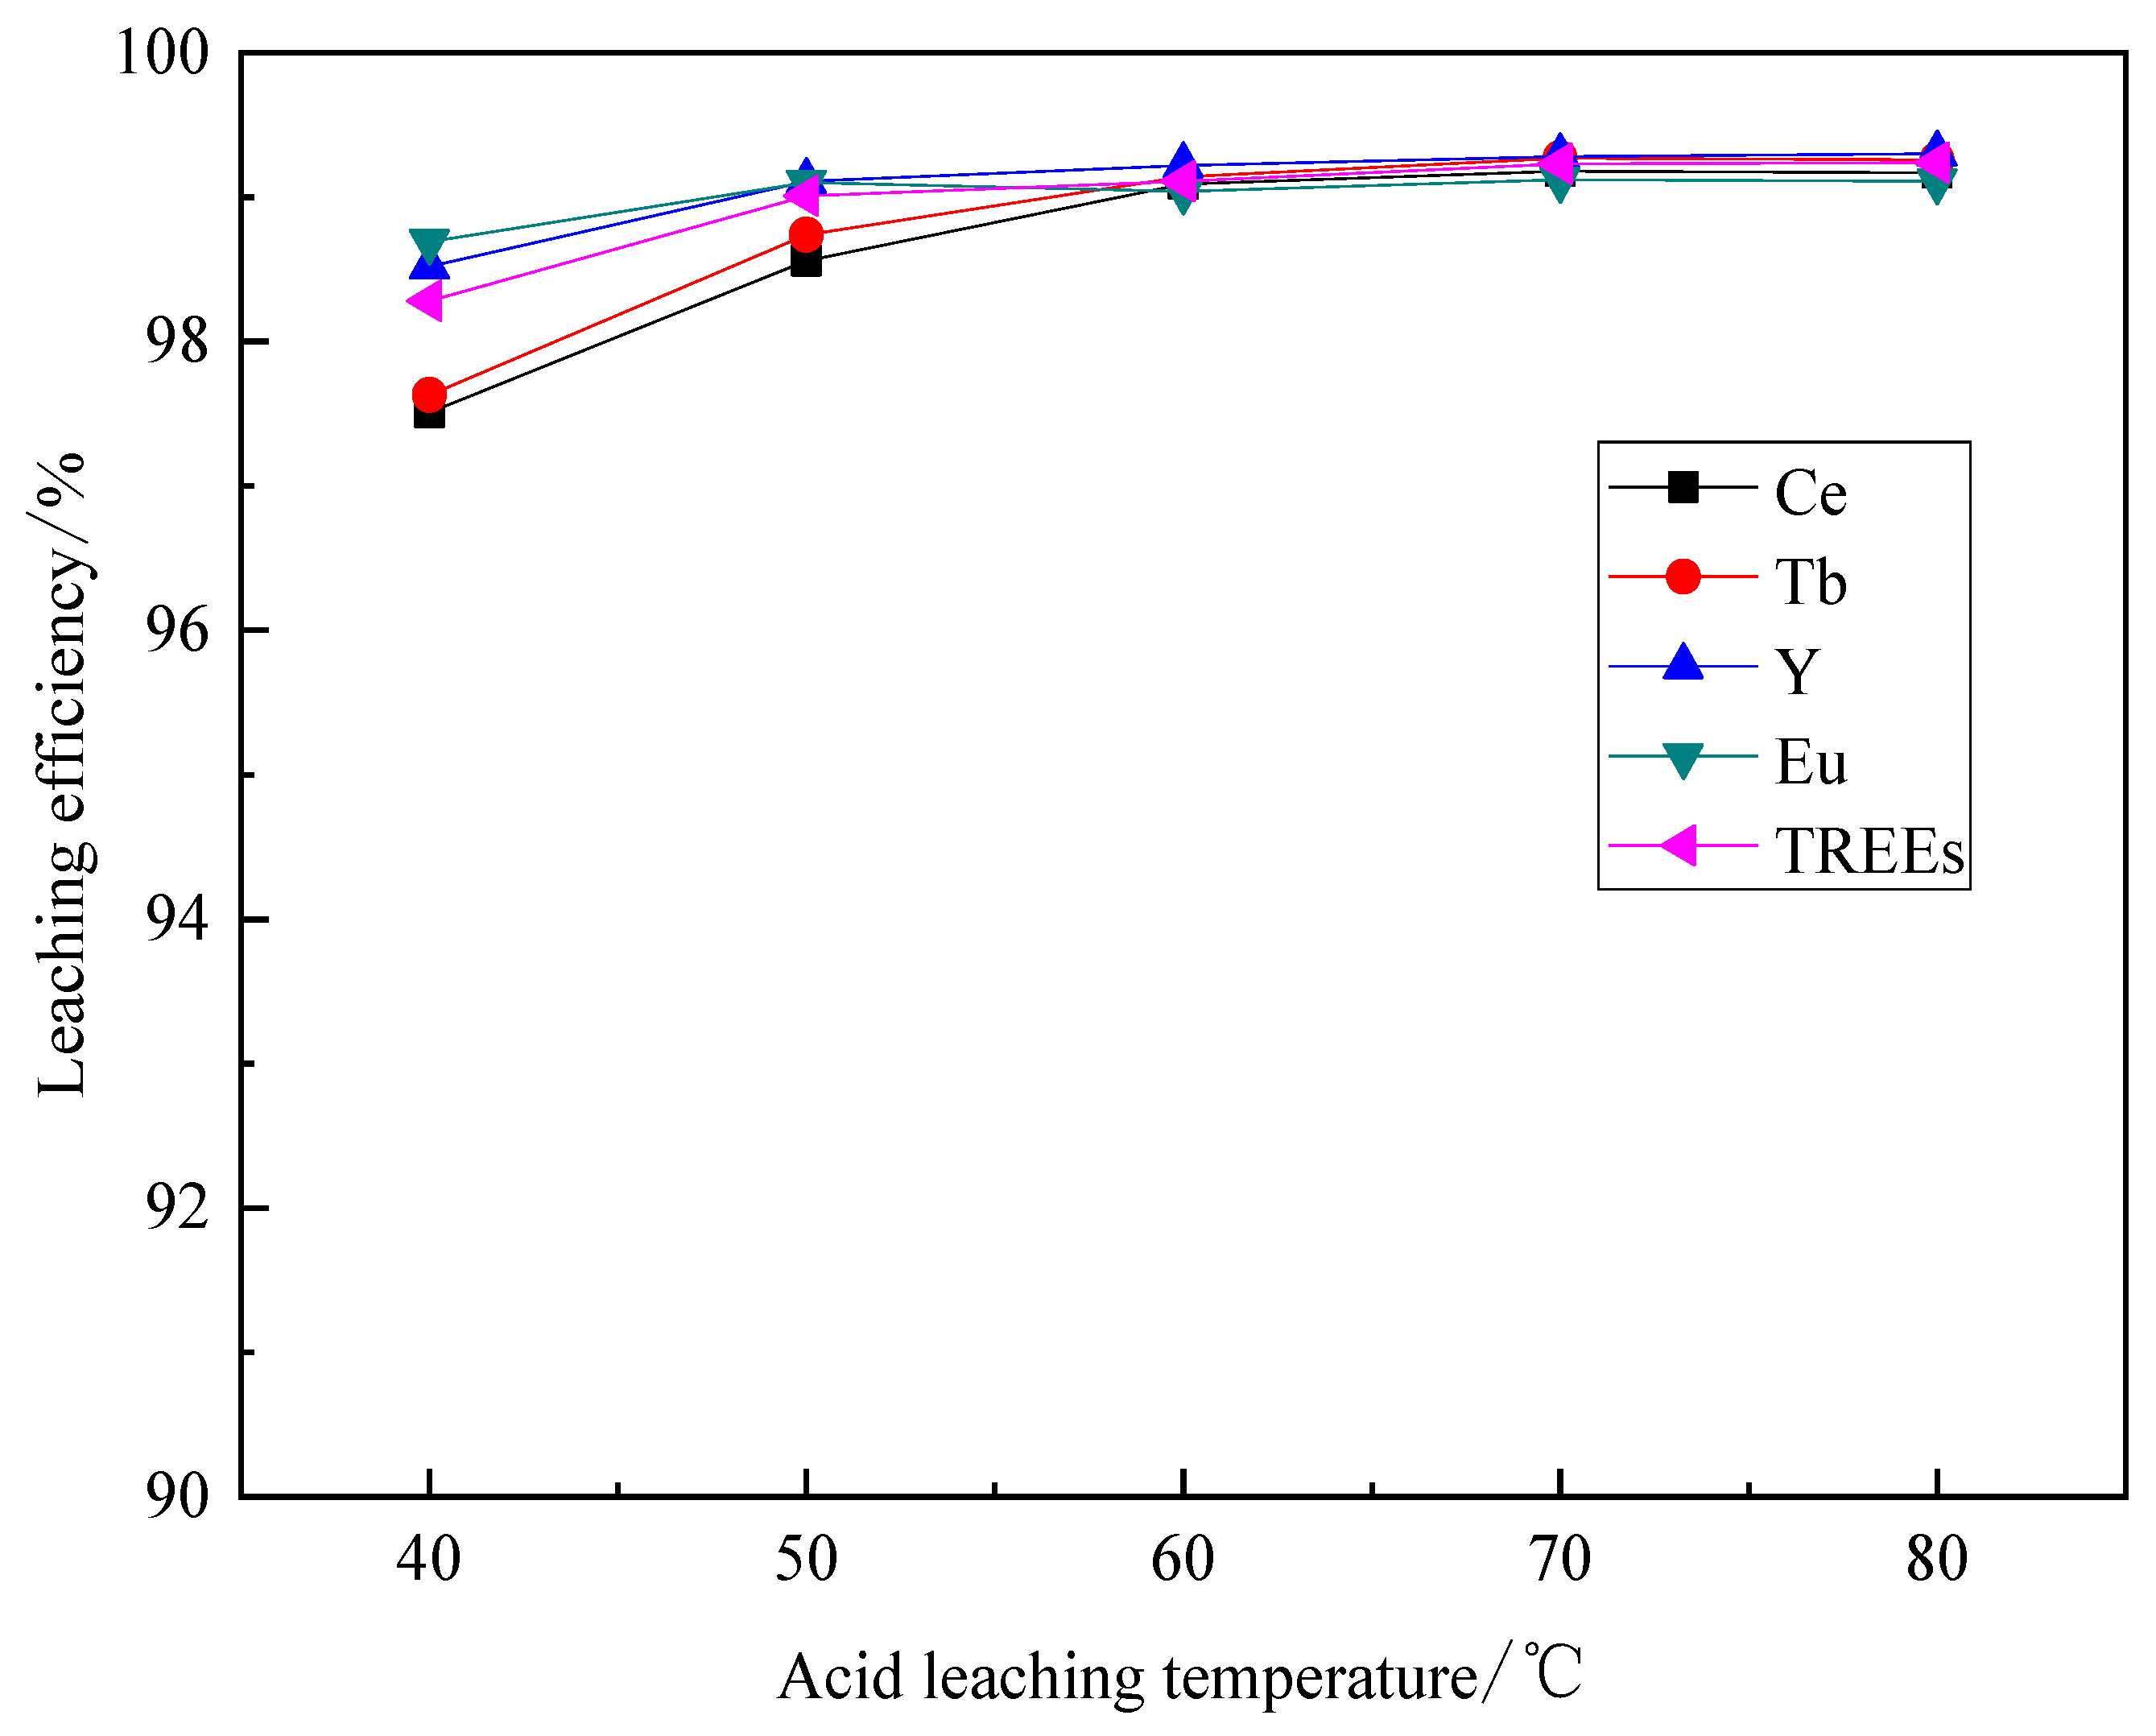
Figure 11.
Influence of the acid leaching temperature on the REEs leaching efficiencies (oxygen concentration in the mixed gas of 0.4%, roasting temperature of 700 °C, roasting time of 2.5 h, mass ratio of phosphor powder to alkali 1:3, HCl solution concentration of 4 mol·L−1, acid leaching time of 1 h, and liquid–solid ratio of 10:1).
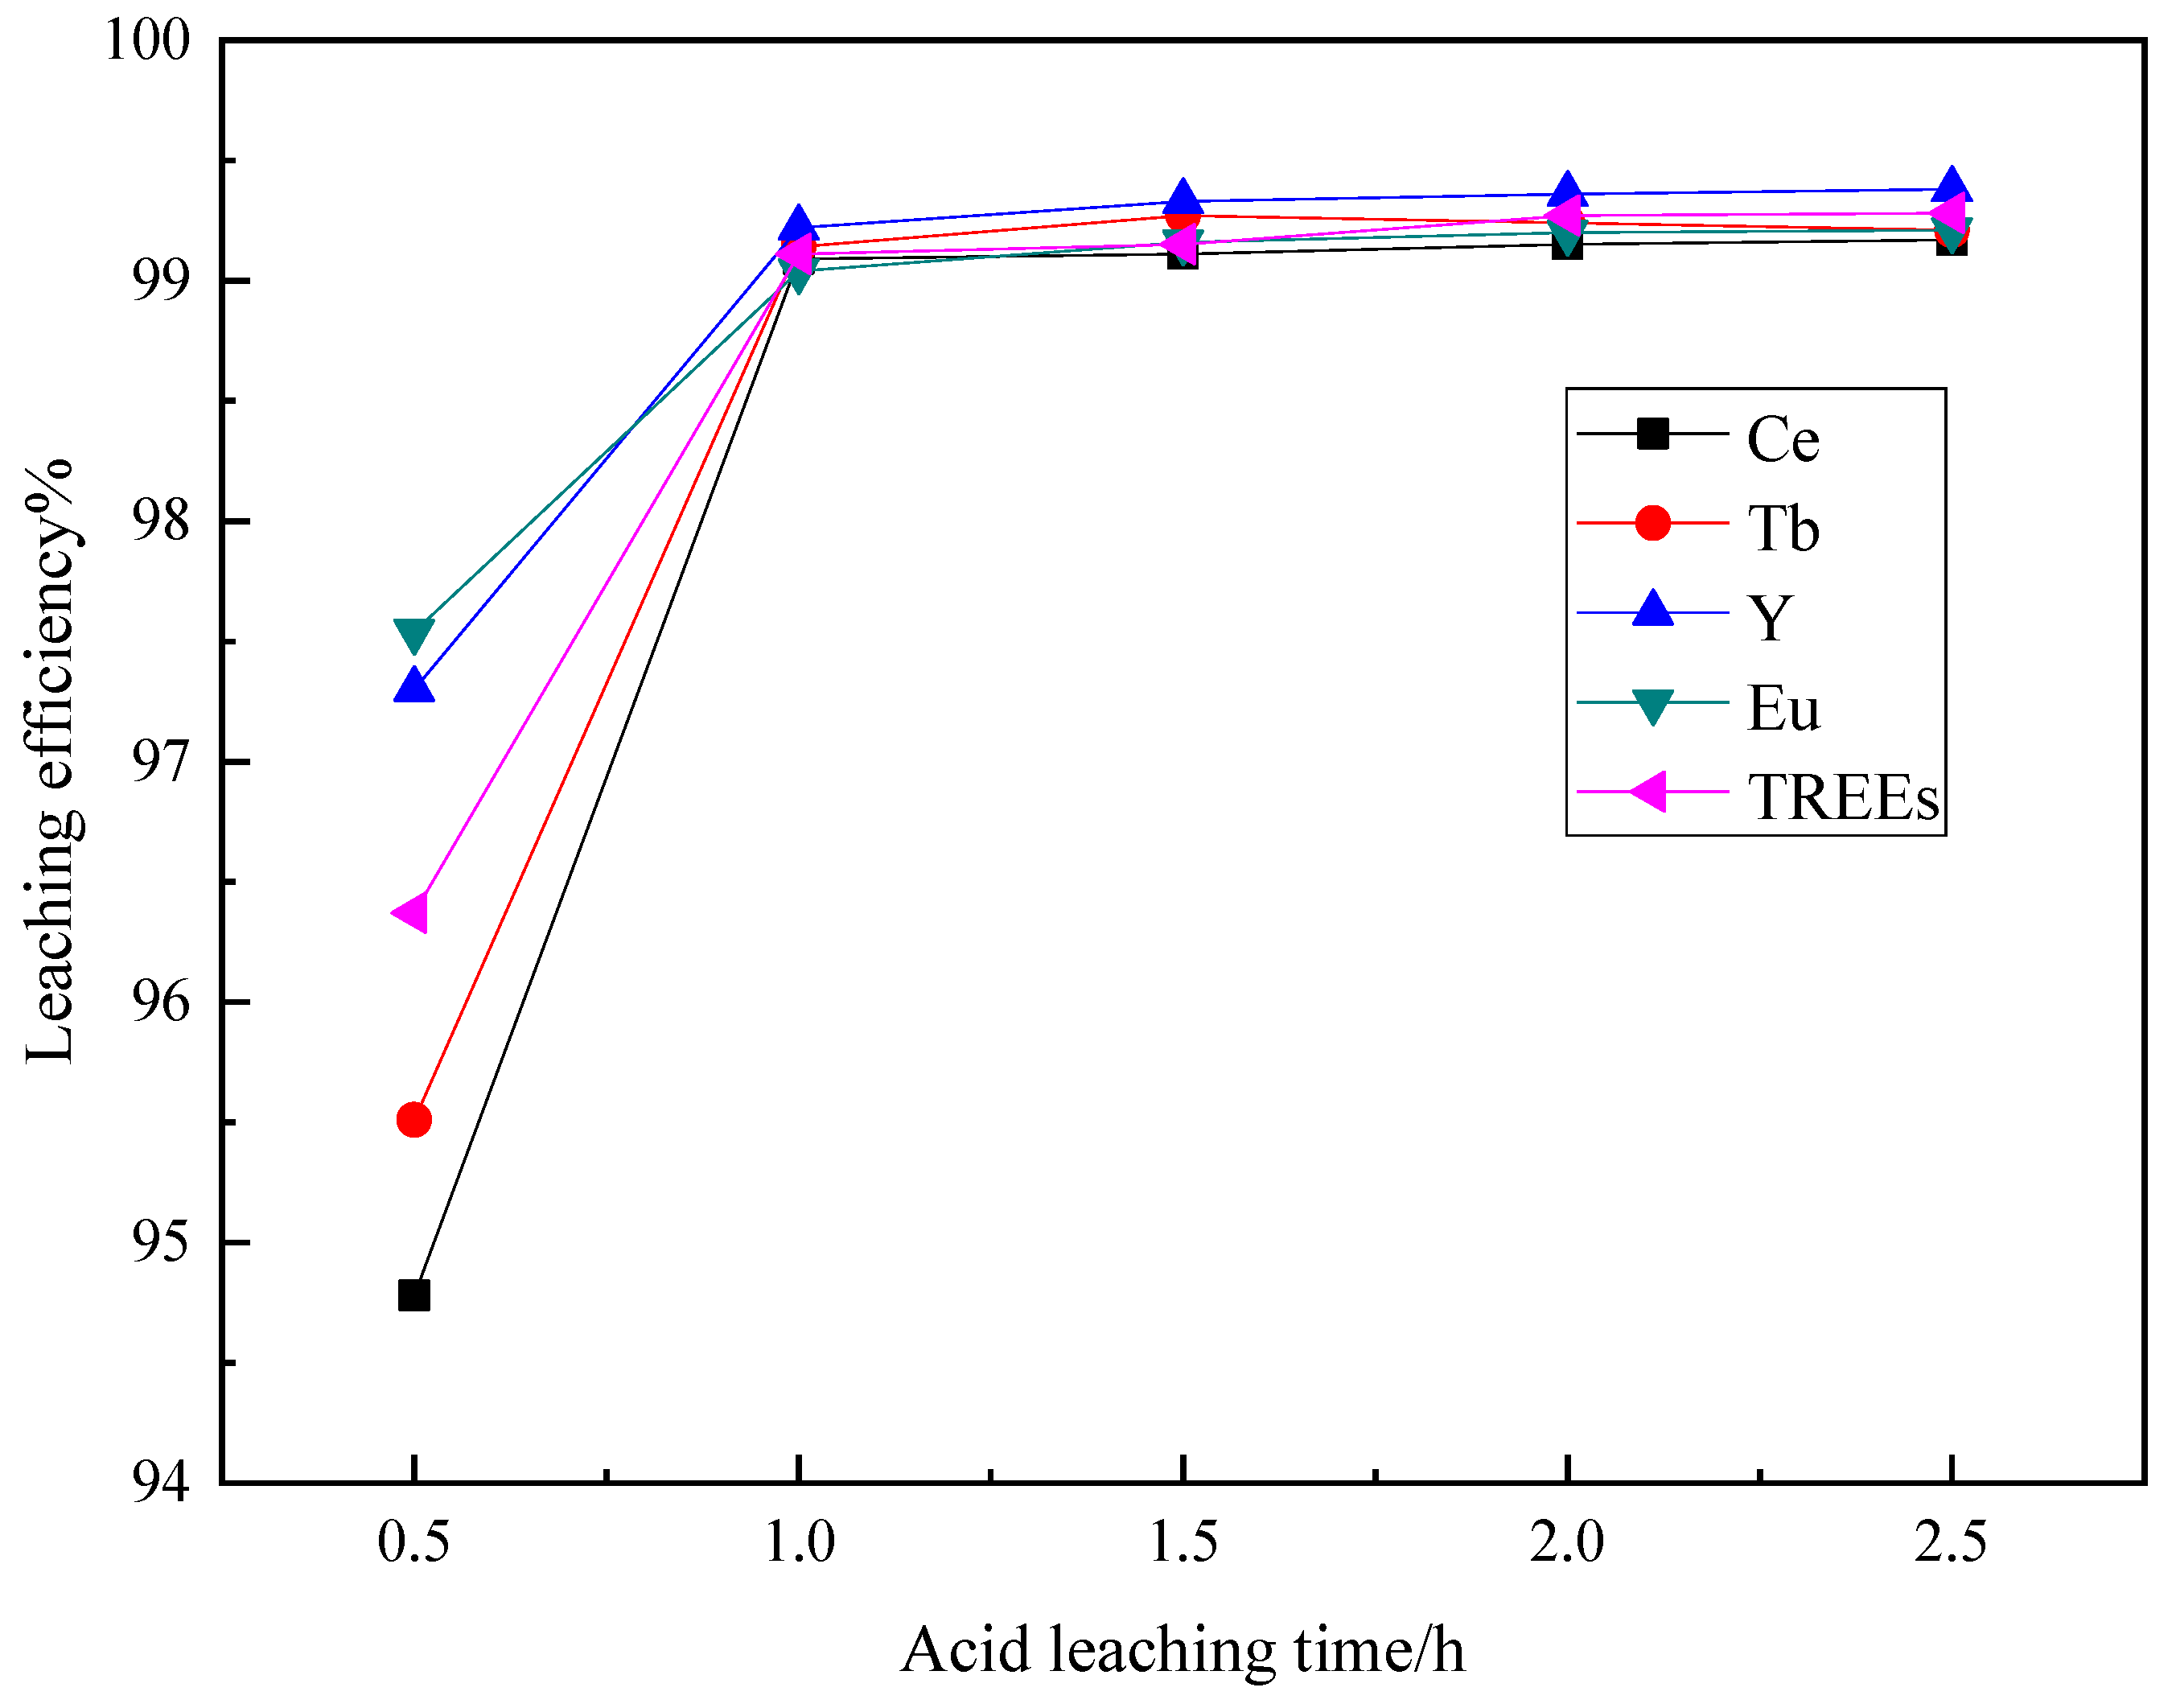
Figure 12.
Influence of the acid leaching time on the REEs leaching efficiencies (oxygen concentration in the mixed gas of 0.4%, roasting temperature of 700 °C, roasting time of 2.5 h, material ratio of phosphor powder to alkali 1:3, HCl solution concentration of 4 mol·L−1, acid leaching temperature of 60 °C, and liquid–solid ratio of 10:1).
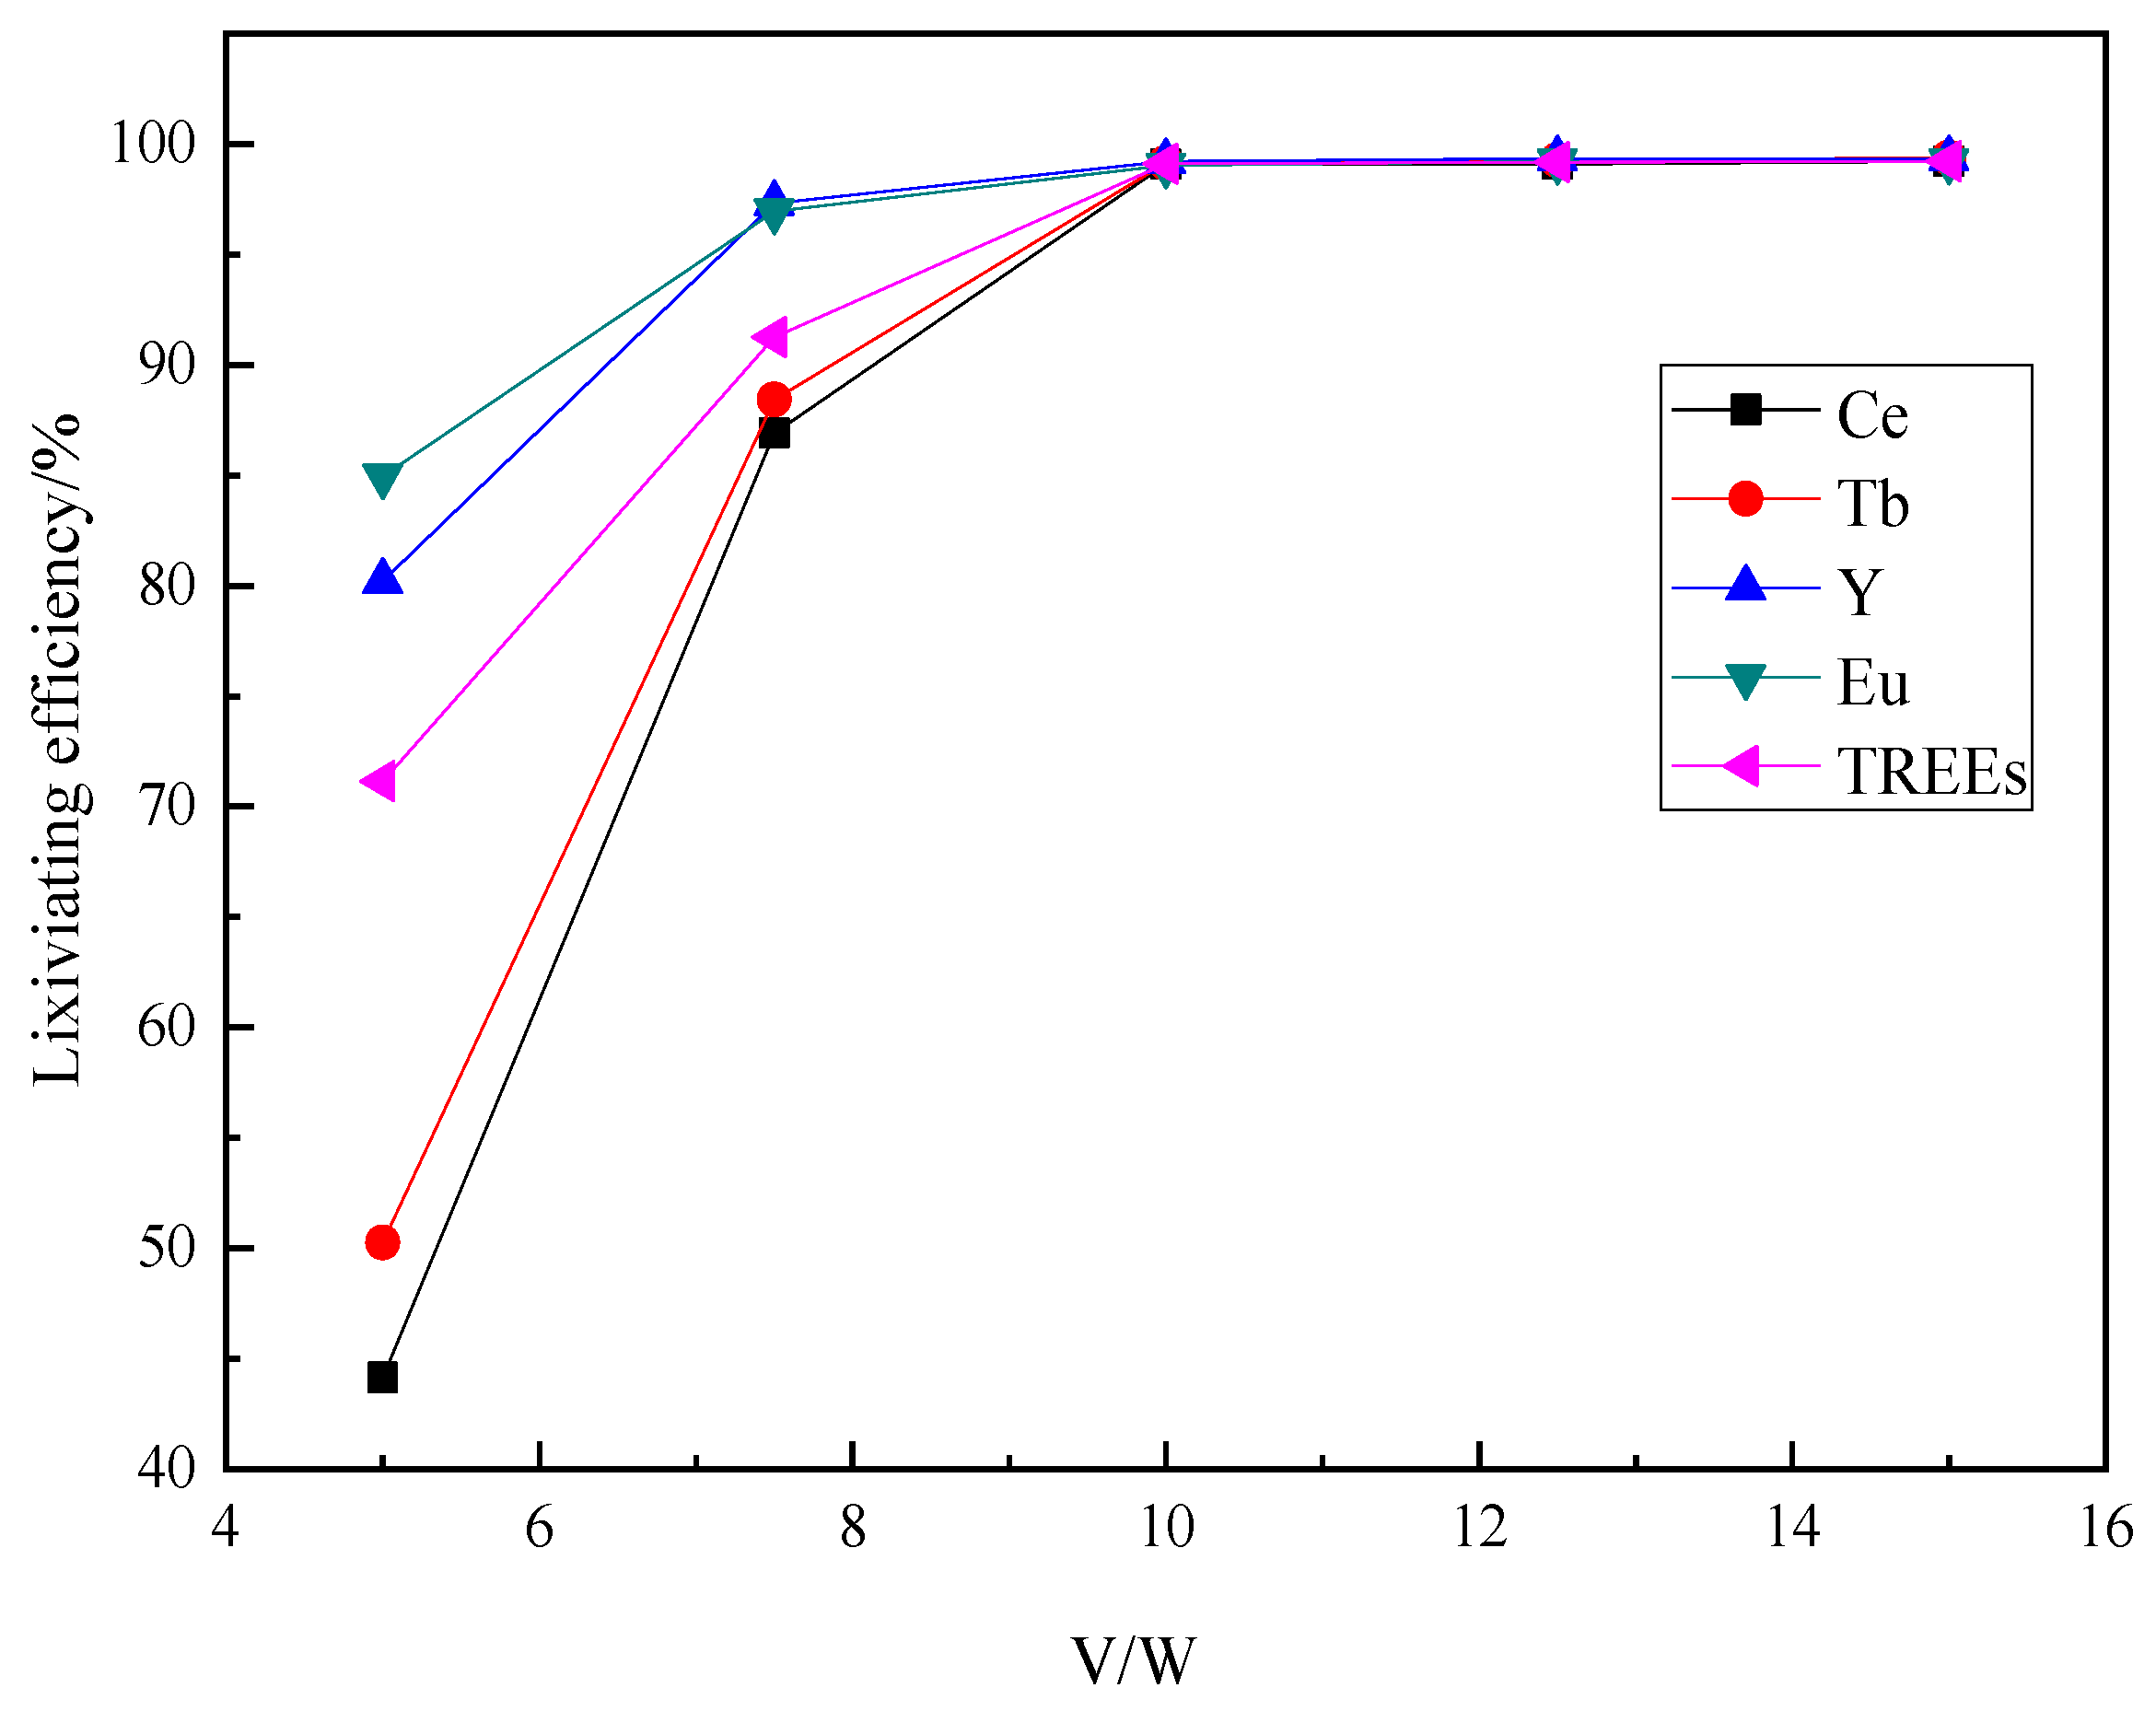
Figure 13.
Influence of the liquid–solid ratio on the REEs leaching efficiencies (oxygen concentration in the mixed gas of 0.4%, roasting temperature of 700 °C, roasting time of 2.5 h, material ratio of phosphor powder to alkali 1:3, HCl solution concentration of 4 mol·L−1, acid leaching temperature of 60 °C, and acid leaching time of 1 h).
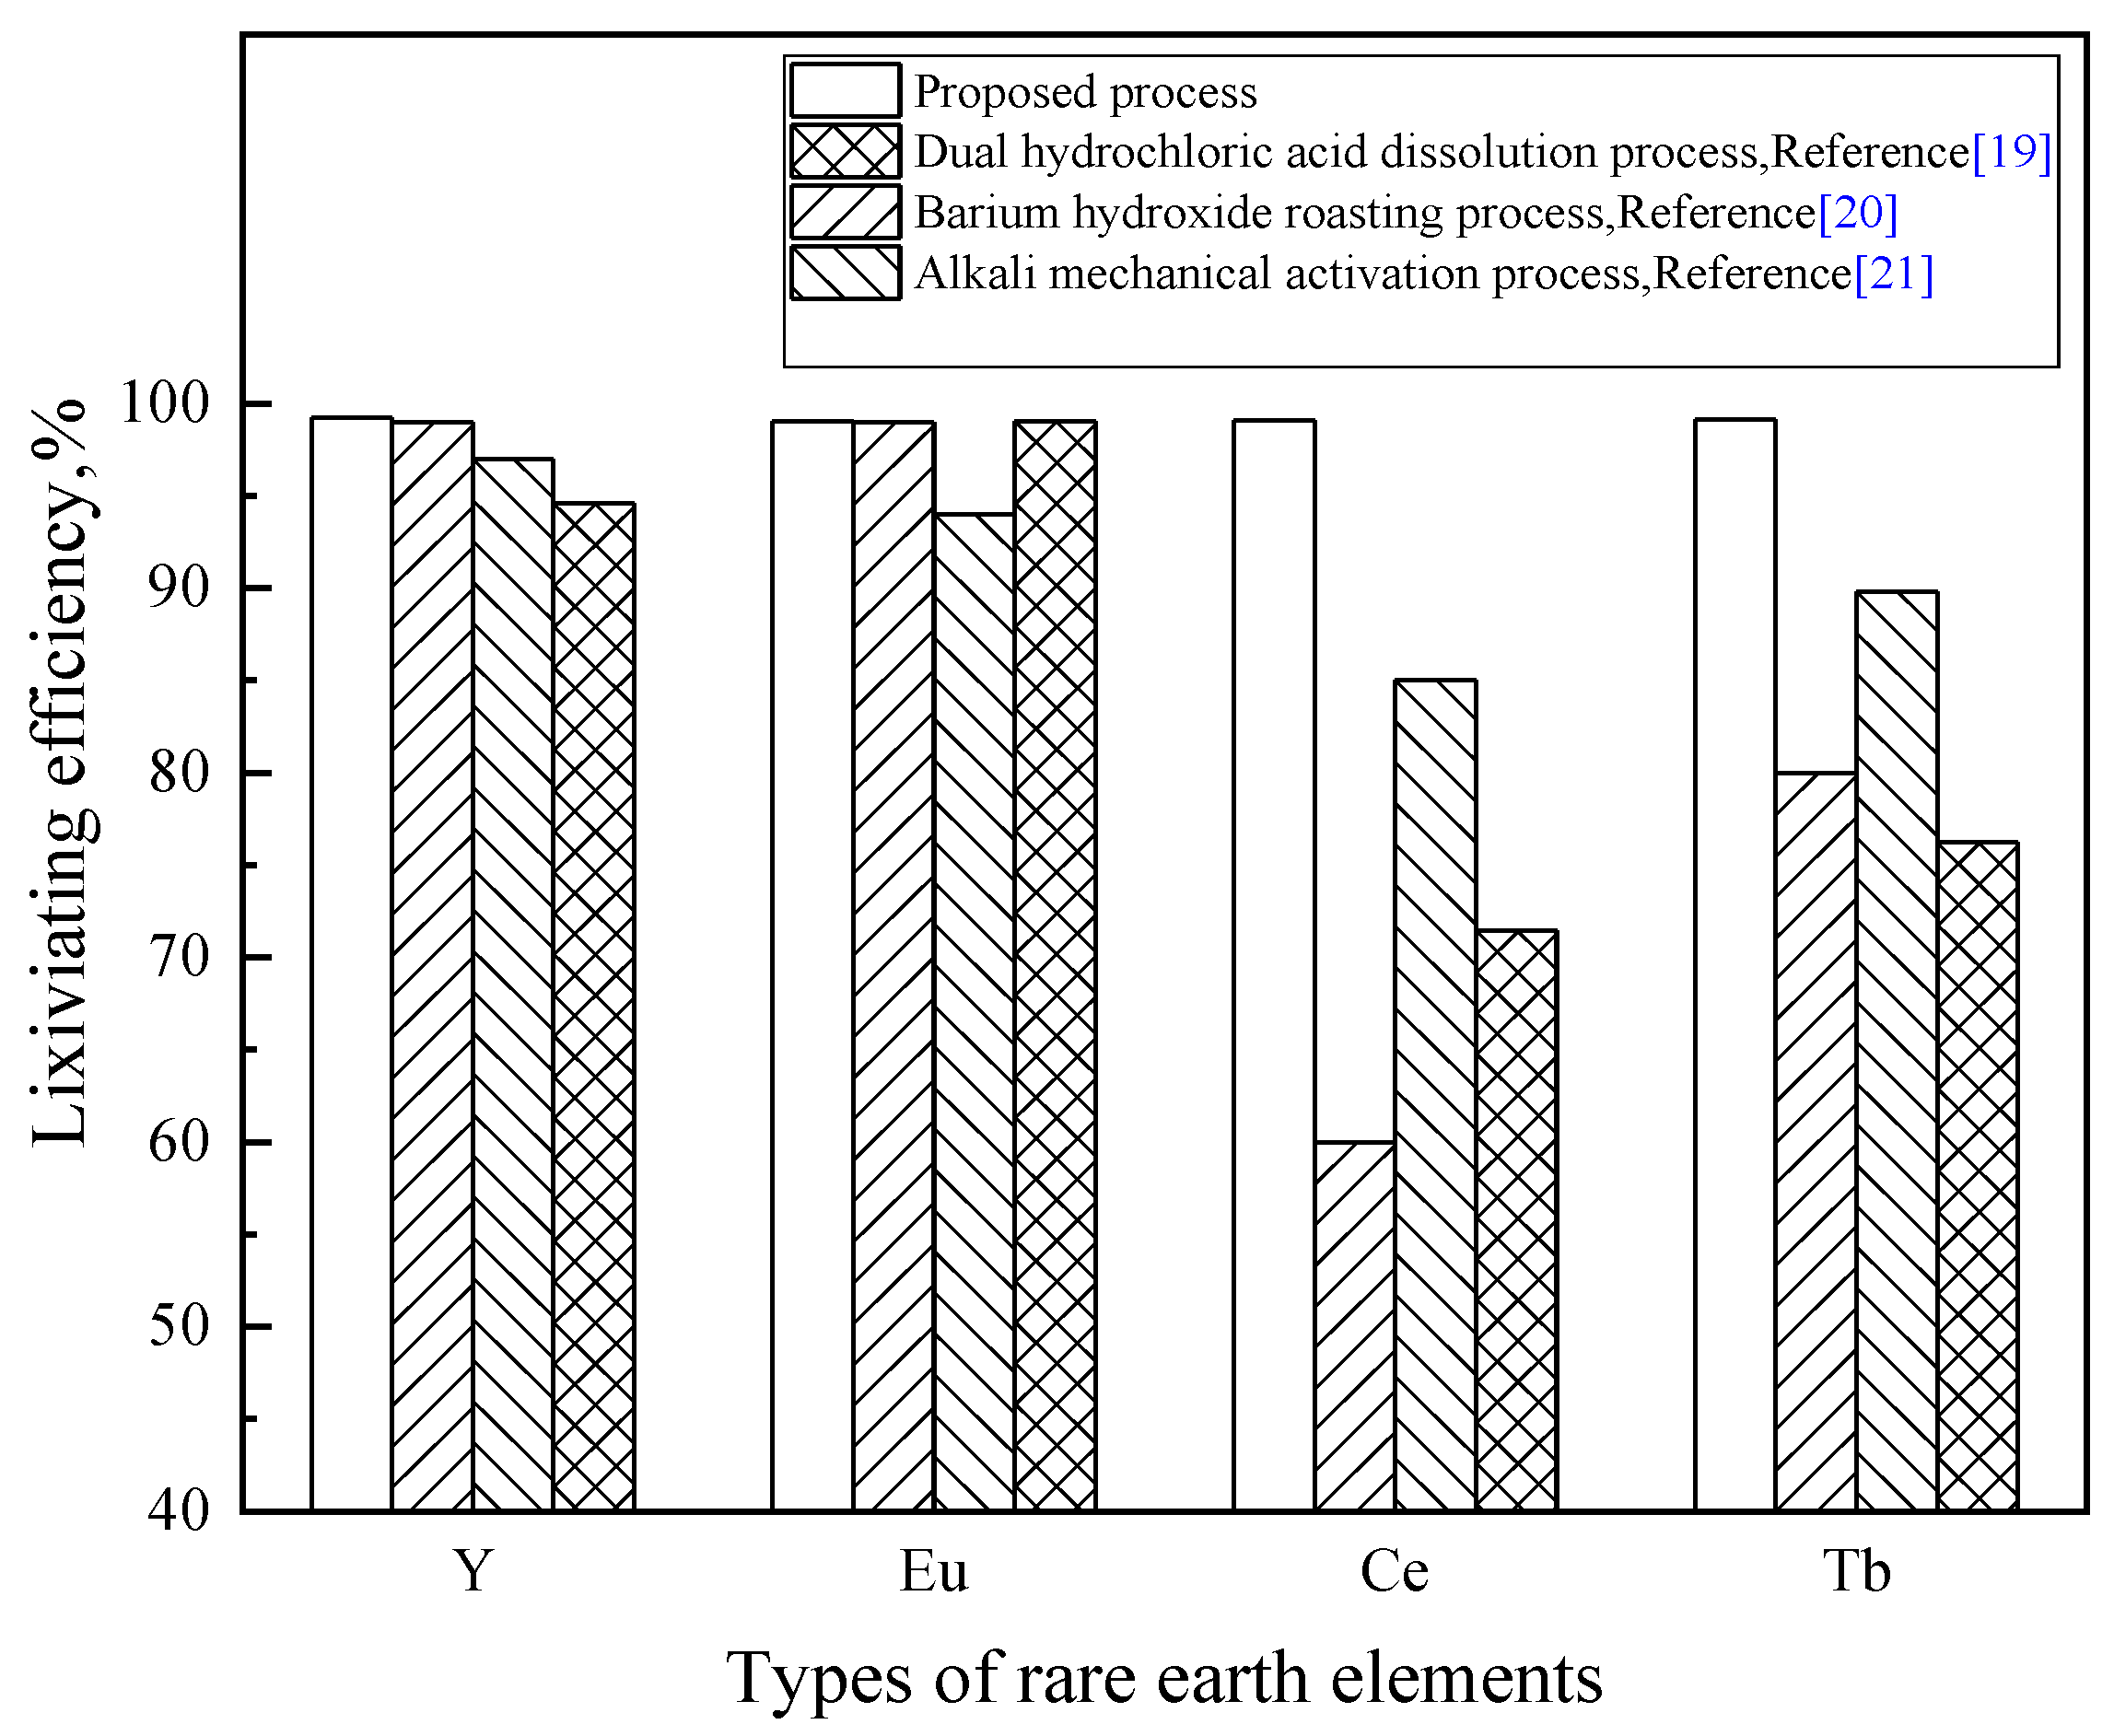
Figure 14.
Leaching efficiency of rare earth elements by different methods [
19,
20,
21].
Figure 14.
Leaching efficiency of rare earth elements by different methods [
19,
20,
21].
Table 1.
Total RE and RE oxide distribution in the raw material.
Table 1.
Total RE and RE oxide distribution in the raw material.
| Element | TREO | CeO2 | Tb4O7 | Y2O3 | Eu2O3 | Others |
|---|
| Content/% | 22.52 | 32.57 | 18.79 | 37.53 | 5.63 | 5.48 |
Table 2.
Extraction efficiency of Ce, Tb, Y, Eu, and total rare earth under different oxygen concentrations (roasting temperature of 700 °C, roasting time of 3 h, mass ratio of phosphor powder to sodium hydroxide 1:3, HCl solution concentration of 8 mol·L−1, acid leaching temperature of 60 °C, acid leaching time of 1 h, and liquid–solid ratio of 10:1).
| Oxygen Concentration/% | Extraction Efficiency/% |
|---|
| Ce | Tb | Y | Eu | TREEs |
|---|
| 0.1 | 99.13 | 99.24 | 99.24 | 99.21 | 99.16 |
| 0.2 | 99.10 | 99.21 | 99.22 | 99.21 | 99.15 |
| 0.4 | 99.11 | 99.18 | 99.21 | 99.19 | 99.15 |
| 0.5 | 81.24 | 88.40 | 99.18 | 99.15 | 91.36 |
| 0.6 | 80.59 | 87.84 | 98.42 | 99.02 | 89.74 |
Table 3.
Extraction efficiency of Ce, Tb, Y, Eu, and total rare earth under different roasting temperatures (oxygen concentration in the mixed gas of 0.4%, roasting time of 3 h, mass ratio of phosphor powder to alkali 1:3, HCl solution concentration of 8 mol·L−1, acid leaching temperature of 60 °C, acid leaching time of 1 h, and liquid–solid ratio of 10:1).
| Roasting Temperature/°C | Extraction Efficiency/% |
|---|
| Ce | Tb | Y | Eu | TREEs |
|---|
| 400 | 5.47 | 24.20 | 46.65 | 14.17 | 25.20 |
| 500 | 40.26 | 69.73 | 87.69 | 62.74 | 70.24 |
| 600 | 81.25 | 85.11 | 96.65 | 94.23 | 90.35 |
| 700 | 99.09 | 95.59 | 99.69 | 99.55 | 99.29 |
| 800 | 99.10 | 99.43 | 99.41 | 99.61 | 99.18 |
Table 4.
Extraction efficiency of Ce, Tb, Y, Eu, and total rare earth under different roasting times (oxygen concentration in the mixed gas of 0.4%, a roasting temperature of 700 °C, a mass ratio of phosphor powder to alkali 1:3, a HCl solution concentration of 8 mol·L−1, an acid immersion temperature of 60 °C, an acid leaching time of 1 h, and a liquid–solid ratio of 10:1).
| Roasting Time/h | Extraction Efficiency/% |
|---|
| Ce | Tb | Y | Eu | TREEs |
|---|
| 1 | 51.65 | 70.83 | 81.65 | 84.67 | 67.05 |
| 2 | 89.50 | 93.63 | 94.50 | 92.44 | 91.25 |
| 2.5 | 99.14 | 99.29 | 99.34 | 99.41 | 99.21 |
| 3 | 99.16 | 99.27 | 99.36 | 99.43 | 99.27 |
| 3.5 | 99.17 | 99.28 | 99.36 | 99.42 | 99.26 |
Table 5.
Extraction efficiency of Ce, Tb, Y, Eu, and total rare earth under different mass ratio of phosphors REE waste to sodium hydroxide (oxygen concentration in the mixed gas of 0.4%, roasting temperature of 700 °C, roasting time of 2.5 h, HCl solution concentration of 8 mol·L−1, acid leaching temperature of 60 °C, acid leaching time of 1 h, and liquid–solid ratio of 10:1).
| Mass Ratio of Phosphors REE Waste to Sodium Hydroxide/(w/w) | Extraction Efficiency/% |
|---|
| Ce | Tb | Y | Eu | TREEs |
|---|
| 1 | 78.36 | 83.11 | 90.10 | 91.25 | 85.81 |
| 1.5 | 86.69 | 90.25 | 97.31 | 96.56 | 91.22 |
| 2 | 92.30 | 93.34 | 98.26 | 99.10 | 95.34 |
| 2.5 | 97.37 | 97.50 | 99.01 | 99.20 | 98.12 |
| 3 | 99.20 | 99.39 | 99.37 | 99.25 | 99.27 |
| 3.5 | 99.12 | 99.11 | 99.16 | 99.04 | 99.09 |
Table 6.
Extraction efficiency of Ce, Tb, Y, Eu, and total rare earth under different hydrochloric acid concentrations (oxygen concentration in the mixed gas of 0.4%, roasting temperature of 700 °C, roasting time of 2.5 h, mass ratio of phosphor powder to alkali 1:3, acid leaching temperature of 60 °C, acid leaching time of 1 h, and liquid–solid ratio of 10:1).
| Hydrochloric Acid Concentration/mol·L−1 | Extraction Efficiency/% |
|---|
| Ce | Tb | Y | Eu | TREEs |
|---|
| 1 | 7.06 | 24.04 | 37.36 | 17.29 | 31.78 |
| 2 | 50.38 | 71.18 | 83.10 | 88.64 | 74.14 |
| 3 | 88.62 | 91.01 | 93.42 | 92.79 | 91.06 |
| 4 | 99.09 | 99.14 | 99.22 | 99.04 | 99.11 |
| 5 | 99.21 | 99.29 | 99.30 | 99.19 | 99.19 |
Table 7.
Extraction efficiency of Ce, Tb, Y, Eu, and total rare earth under different acid leaching temperatures (oxygen concentration in the mixed gas of 0.4%, roasting temperature of 700 °C, roasting time of 2.5 h, mass ratio of phosphor powder to alkali 1:3, HCl solution concentration of 4 mol·L−1, acid leaching time of 1 h, and liquid–solid ratio of 10:1).
| Acid Leaching Temperature/°C | Extraction Efficiency/% |
|---|
| Ce | Tb | Y | Eu | TREEs |
|---|
| 0.5 | 94.78 | 95.51 | 97.30 | 97.54 | 96.37 |
| 1 | 99.09 | 99.14 | 99.23 | 99.37 | 99.12 |
| 1.5 | 99.11 | 99.27 | 99.33 | 99.16 | 99.15 |
| 2 | 99.15 | 99.24 | 99.36 | 99.20 | 99.27 |
| 2.5 | 99.17 | 99.21 | 99.38 | 99.21 | 99.28 |
Table 8.
Extraction efficiency of Ce, Tb, Y, Eu, and total rare earth under different acid leaching times (oxygen concentration in the mixed gas of 0.4%, roasting temperature of 700 °C, roasting time of 2.5 h, material ratio of phosphor powder to alkali 1:3, HCl solution concentration of 4 mol·L−1, acid leaching temperature of 60 °C, and liquid–solid ratio of 10:1).
| Acid Leaching Time/h | Extraction Efficiency/% |
|---|
| Ce | Tb | Y | Eu | TREEs |
|---|
| 0.5 | 94.78 | 95.51 | 97.30 | 97.54 | 96.37 |
| 1.0 | 99.09 | 99.14 | 99.23 | 99.37 | 99.12 |
| 1.5 | 99.11 | 99.27 | 99.33 | 99.16 | 99.15 |
| 2.0 | 99.15 | 99.24 | 99.36 | 99.20 | 99.27 |
| 2.5 | 99.17 | 99.21 | 99.38 | 99.21 | 99.28 |
Table 9.
Extraction efficiency of Ce, Tb, Y, Eu, and total rare earth under different liquid–solid ratios (oxygen concentration in the mixed gas of 0.4%, roasting temperature of 700 °C, roasting time of 2.5 h, material ratio of phosphor powder to alkali 1:3, HCl solution concentration of 4 mol·L−1, acid leaching temperature of 60 °C, and acid leaching time of 1 h).
| Liquid-Solid Ratio/(v/w) | Extraction Efficiency/% |
|---|
| Ce | Tb | Y | Eu | TREEs |
|---|
| 5.0 | 49.15 | 50.26 | 80.21 | 84.95 | 71.14 |
| 7.5 | 86.91 | 88.42 | 97.32 | 96.95 | 91.25 |
| 10.0 | 98.99 | 99.12 | 99.33 | 99.23 | 99.14 |
| 12.5 | 99.09 | 99.26 | 99.34 | 99.21 | 99.17 |
| 15.0 | 99.22 | 99.37 | 99.34 | 99.22 | 99.22 |


