
Sulfidizing Behavior of Complex Lead-Silver Ore: A Flotation Study

1
School of Chemistry and Chemical Engineering, Guangxi University, Nanning 530004, China
2
School of Resources, Environment and Materials, Guangxi University, Nanning 530004, China
3
Guangxi Colleges and University Key Laboratory of Minerals Engineering, Nanning 530004, China
4
Guangxi Key Laboratory of Processing for Non-ferrous Metal and Featured Materials, Guangxi University, Nanning 530004, China
*
Author to whom correspondence should be addressed.
Minerals 2021, 11(4), 434; https://doi.org/10.3390/min11040434
Submission received: 13 March 2021
/
Revised: 13 April 2021
/
Accepted: 15 April 2021
/
Published: 20 April 2021
(This article belongs to the Section Mineral Processing and Extractive Metallurgy)
Abstract
:In this study, we investigate a low-grade oxidized lead ore containing noble metal silver, with complex mineralogy. The sulfurization behaviors of different types of lead-silver minerals at different pH values were analyzed using the chemical phase analysis method. The interactions between different types of lead-silver minerals and different types of collectors were investigated. An effective laboratory process was developed, and closed-circuit tests were carried out at industrial sites. We found that the order of difficulty for sulfidizing various lead minerals and silver minerals was (PbFe6(OH)12SO4)4 < PbCO3 < PbSO4 < Pb5(P/As/VO4)3Cl; Ag2AsS2 < AgCl < natural-Ag. Aerophine 3418A had the best selectivity and capture capacity of the silver minerals. In the laboratory, the total recovery of lead and silver was 65.16% and 87.81%, respectively. In industrial closed-circuit testing, flotation alone was used, which produced a total lead recovery yield of 67.71%, and a total silver recovery yield of 87.64%.
1. Introduction
The Three Rivers (Sanjiang) region, which is one of the sixteen most famous regions in China, is an important source of Chinese nonferrous metals, where hundreds of deposits such as copper, lead, zinc, and silver are found. The so-called Three Rivers refers to China’s Jinsha River, Nu River, and the Lancang River. Mixed sulfide-oxide ores with extremely complex mineralogy are often found near this area. A low-grade complex oxidized lead ore taken from this area is tested in this study. This type of ore is very difficult to deal with from a mineral-processing point of view due to its complex mineralogy. Nevertheless, because of its large reserves, this type of low-grade complex oxidized lead ore is still of great significance [1,2].
It is generally known that sulfide minerals can be effectively recovered by conventional collectors such as xanthate or dithiophosphate. However, the separation between minerals is difficult. In contrast, oxidized minerals are difficult to float directly because of their higher solubilities, as well as the extensive hydration of their surfaces. Under normal conditions, the surfaces of oxidized minerals can be sulfurized by the addition of sulfide salts such as sodium sulfide, thereby reducing their solubility and hydration to facilitate the adsorption of conventional reagents on the surface [3,4,5,6,7,8,9]. The reactions are given as follows:
It has been found that the surfaces of oxidized lead minerals could be converted to a more insoluble lead sulfide by adding sulfide salts. Therefore, oxidized lead minerals could be collected by xanthate, and the consumption of the collectors could be reduced [10]. It is evident that pH, reaction time, and the method of conditioning have a significant impact on the solubility behavior of lead oxide minerals [11,12,13,14,15]. Lead ions in the solution can be reabsorbed as hydroxy complexes on the surface, activating or depressing the mineral As, depending on the pH of the solution [16]. A sulfidization flotation method has been used to investigate the recovery of lead and silver. Moreover, xanthate and dithiophosphate were used as collectors in the studies [17,18,19]. The flotation results indicated that Aerophine 3418A had excellent selectivity, which could dramatically reduce the total consumption of the collectors [19]. The effect of the addition of sodium sulfide on the pulp potential and amyl xanthate flotation of cerussite and galena was reported. It was found that the optimal flotation conditions occurred when the dose of sodium sulfide set the pulp potential in the range from −100 mv to 150 mv [20,21].
Due to the complex mineralogy of the minerals, different separation methods were used at different stages [13,15]. Research on minerals with extremely complex mineralogy is relatively rare, and therefore this study is an attempt to fill this gap.
The paper is organized as follows: In Section 3.1, we describe the sulfurization flotation behavior of lead oxide minerals in lead-silver ore and that of various silver minerals. Sodium sulfide (Na2S) is a typical depressant of sulfide minerals and its depression behavior has been clearly investigated [11,12], therefore, the sulfide minerals that can be easily depressed by Na2S are not analyzed in this part; in Section 3.2, we test the effect of several collectors on the flotation recovery of silver minerals; in Section 3.3, we design a complete flotation process, and then an industrial closed-circuit test is carried out.
2. Materials
2.1. Samples
The complex Pb-Ag ore sample investigated in this study was provided by the Huachangshan Mining Company, which is located in the Three Rivers (Sanjiang) region in LanPing county, Yunnan province, China. The ore of the Huachangshan deposit has laminar structure, banded structure, primary breccia structure, allomorphic granular structure, sulfide mold structure, and characteristics of the development of barite and siliceous rocks with hydrothermal characteristics. The characteristics of trace elements, rare earth elements, mineralogy and petrology of siliceous rocks in the Sanhedong formation of the Upper Triassic show the characteristics of submarine sedimentary hydrothermal (SEDEX) deposits. The wall rock alteration related to lead-silver mineralization is mainly silicification, carbonation, dolomitization, and fluoritization [22,23,24].
An X-ray fluorescence (XRF) spectrometry and chemical phase analysis were used to determine the compositions of the samples, and the results are shown in Table 1 and Table 2, respectively.
X-ray fluorescence (XRF) spectrometry used the original X-ray photons or other microscopic particles to excite the atoms in the substances to be detected, and therefore produced secondary characteristic X-rays (X photofluorescence) for chemical composition analysis and chemical research [25].
Chemical phase analysis was based on the differences of solubility and dissolution rate of various minerals (or compounds) in chemical solvents. Chemical methods were used to determine the percentages of different compounds composed of the same elements in the sample. Different solvents were selected for selective separation of each phase, and then the composition or structure of each phase was determined by chemical or physical methods. We used this analysis method to determine mineral species and found that the chemical phase analysis method was more accurate than XRD spectrometry for determining mineral species [26].
According to the results of XRF spectrometry in Table 1, in general, the sample contained 2.96% Pb, and 177 g/t Ag, from which it could be seen that the main precious metals in this sample were all at a relatively low level. Table 2 shows that the Ag mineral was found mainly in AgCl (63 g/t), Ag2AsS2 (42.5 g/t), SiO2, and silicate (34.2 g/t), natural-Ag (21 g/t), PbS (15 g/t), and CuFeS2 (1.3 g/t). These different Ag minerals accounted for 35.6%, 24%, 19.3%, 11.9%, 8.5%, and 0.7% of the total Ag, respectively. Pb was found mainly in Pb5(P/As/VO4)3Cl (1.24% in content), PbCO3 (1.01% in content), (PbFe6(OH)12SO4)4 (0.46% in content), PbS (0.16% in content) and PbSO4 (0.09% in content). They accounted for 41.9%, 34.2%, 15.5%, 5.4%, and 3% of the total Pb, respectively.
The sample was also analyzed using X-ray diffraction (XRD), and the results revealed that there were 42 types of minerals in this sample. Principal among them were teallite-(Pb,Sn)S, cerussite-syn-PbCO3, vanadinite-Pb5(VO4)3Cl, mimetite-syn-Pb5(AsO4)3Cl, clinomimetite-Pb5(AsO4)3Cl, crocoite-syn-PbCrO4, uchucchacuaite-AgMnPb3Sb5S12, dervillite-Ag2AsS2, chalcopyrite-CuFeS2, calcite-CaCO3, dolomite-CaMg(CO3)2, tachyhydrite-syn-CaMg2Cl6·12H2O, and hemimorphite-Zn4Si2O7(OH)2·H2O.
The above results suggest that the composition of this ore sample is very complex. It is a sulfide-oxidized mixed ore with high oxidation rate.
2.2. Experiments
The sample was wet ground to 88% (w/w) below 0.074 mm in a ball mill. A 300 g ground sample was added to an XFG single-trough flotation machine at a volume of 1.0 dm3, with the impeller speed set at 2000 rpm. All the experiments were conducted under standard atmospheric pressure and an average temperature of 32 °C (the average temperature of the laboratory environment during the test period).
In all flotation tests, Na2SiO3·9H2O (glass water) and Na2CO3 were used as depressants. Sodium sulfide (Na2S) was used as an activator for the oxidized Pb minerals. N-butyl xanthate (NBX) and Aerophine 3418A were used as collectors, and Methyl Isobutyl Carbinol (MIBC) was chosen as frother. All the reagents used or tested (except 3418A) in this study were provided by the Zhuzhou Flotation Reagents Factory in Hunan Province, and 3418A was provided by the Solvay Company, Shanghai, China. All these reagents were analytical grade.
Each group of experiments was repeated twice to ensure the accuracy of the experimental results.
3. Results and Discussion
Ores that have undergone partial or strong oxidation during formation of the orebody usually have the character of containing both sulfide ores and oxidized ores [27]. Dealing with these types of oxidized ores requires a combination of collectors, excessive amounts of reagents, the use of sodium sulfide (Na2S), and also a staged preferential flotation. In industry, the most stable oxidized lead flotation procedure is to sulfurize the ore in advance, and then collect by xanthate, which is called the sulfurization-xanthate method in China [28]. As for the silver mineral, pulp pH and collector types are critical to its recovery. Although some silver ores exist in an elemental state or a combined state, most of them can be found in either lead or both lead and zinc concentrates, or even distributed in gangue.
In this study, the grades of different types of lead and silver minerals are tested by chemical phase analysis, and therefore the recovery rates of different types of minerals can subsequently be calculated.
3.1. Sulfidizing Flotation Behavior
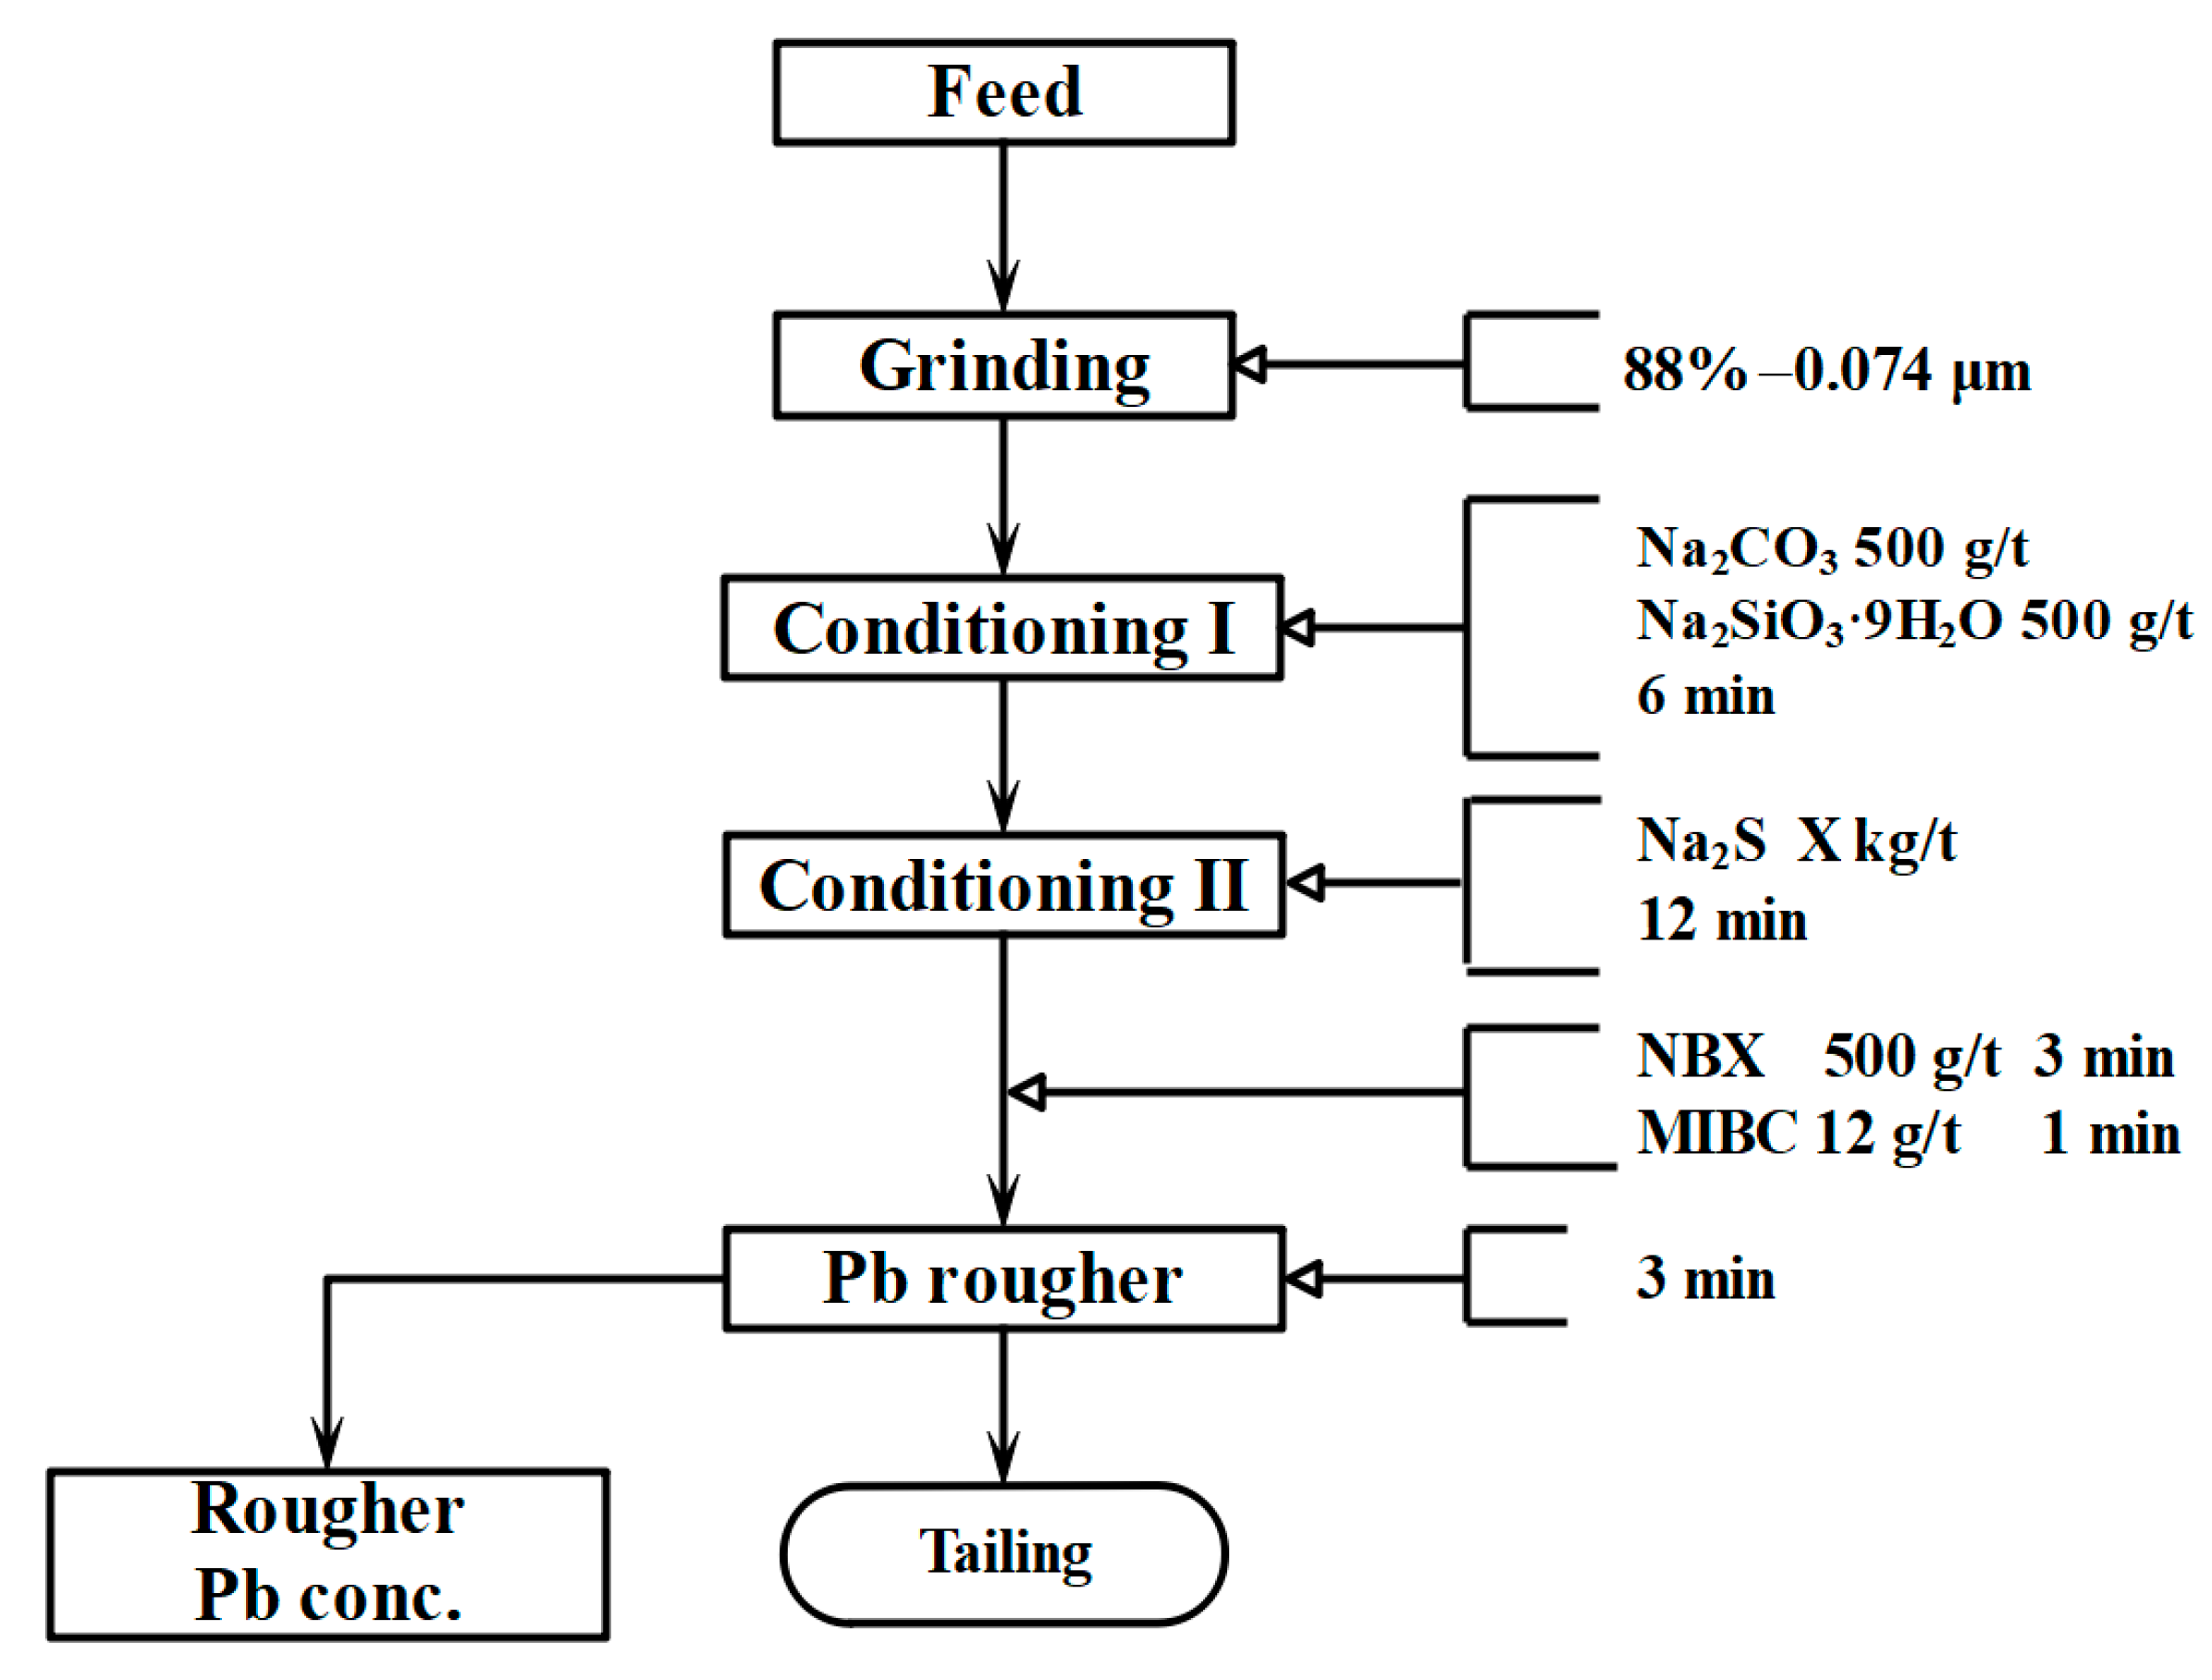
To test the sulfurization behaviors of different types of lead oxide minerals and various silver minerals at different pH values, in these experiments, the dosage of Na2S was gradually increased from 1 to 10 kg/t, and the recovery rates of lead and silver minerals were used to measure the effectiveness of the sulfidizing flotation behavior. Each group of experiments used 300 g of wet-ground sample in a 1.0 dm3 flotation cell, and the same amount of reagent was used in each group. Regular reagents used were 500 g/t Na2SiO3·9H2O and 500 g/t Na2CO3, Na2S was used as an activator, and 500 g/t NBX was used as the collector. The flowchart for the Na2S dosage test is shown in Figure 1. Pulp pH at different dosages of Na2S is displayed in Table A1, Appendix A.
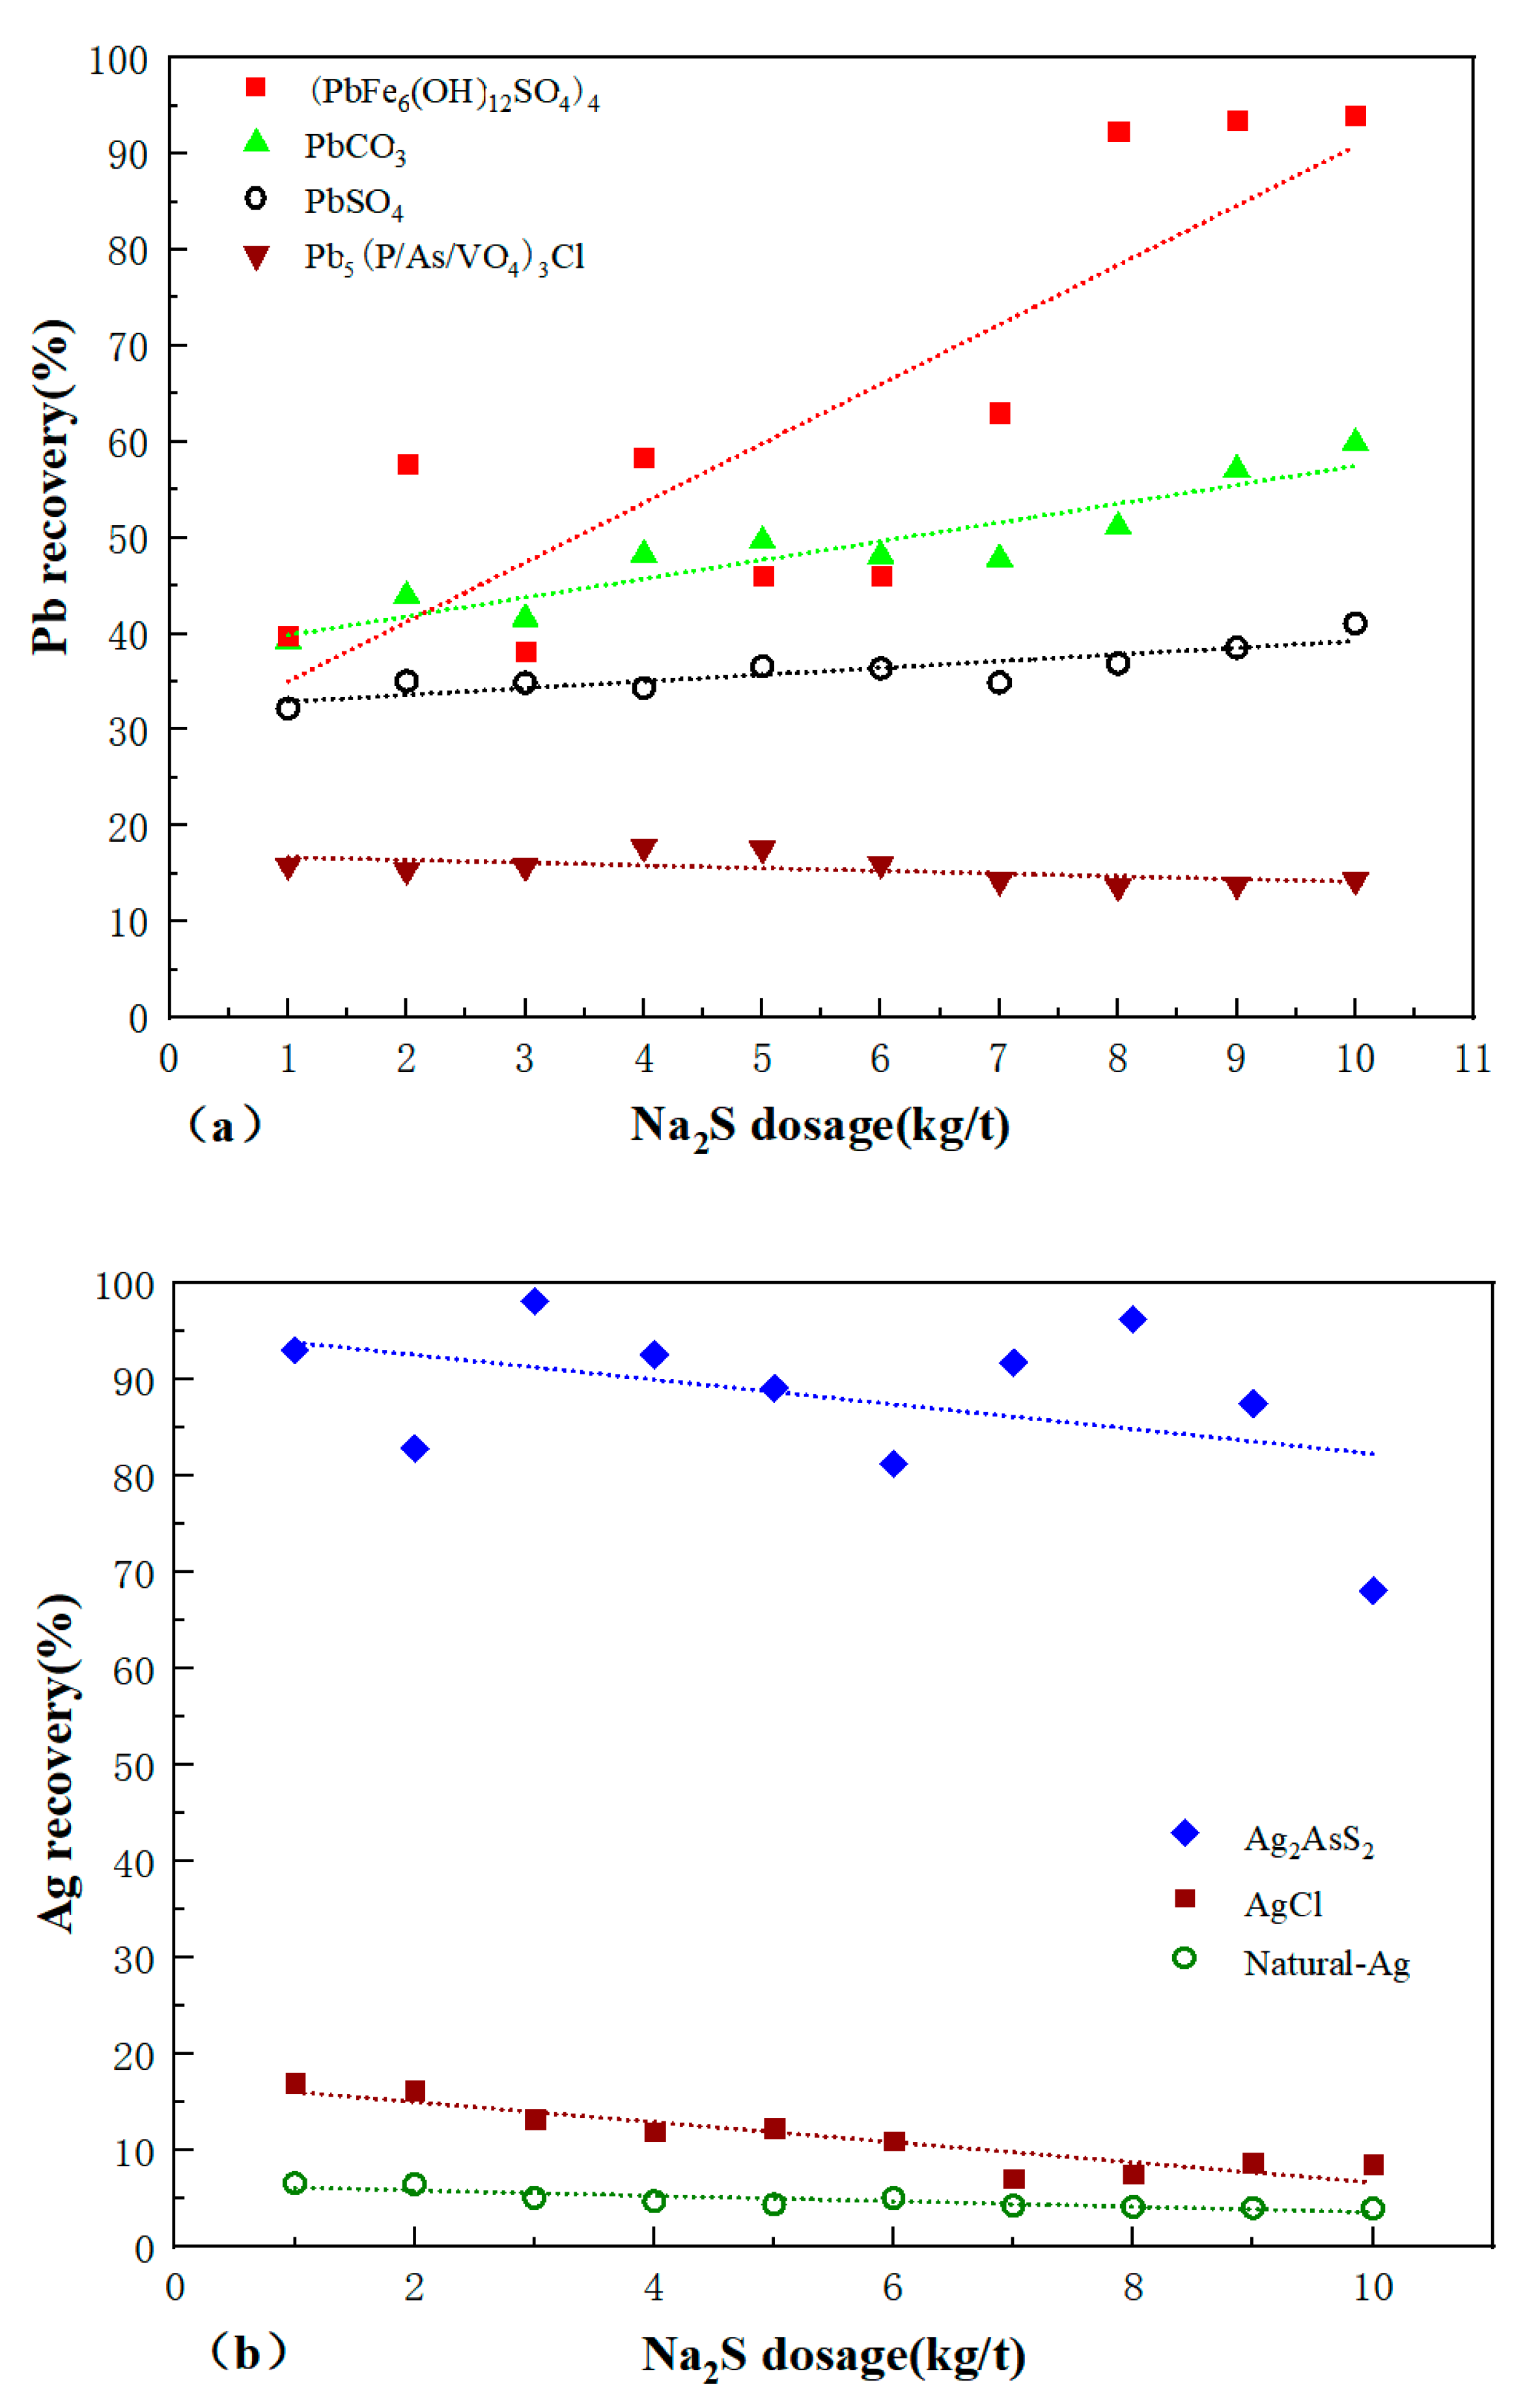
The flotation recovery of lead oxide minerals at different dosages of Na2S are shown in Figure 2a. From Figure 2a, the following can be concluded: (I) The overall trend of the recovery of (PbFe6(OH)12SO4)4 is upward, which suggests that a high dosage of Na2S is beneficial for recovering (PbFe6(OH)12SO4)4; (II) The recovery of PbSO4, PbCO3, and Pb5(P/As/VO4)3Cl are relatively stable. The PbCO3 is on the rise, reaching its peak at 10 kg/t at a recovery rate of 59.86%, while the PbSO4 shows slow growth from 32.21% at 1 kg/t to 41.07% at 10 kg/t, which suggests that the recovery rates of PbSO4 and PbCO3 increase with an increasing Na2S dosage, and PbCO3 is affected more than PbSO4; (III) The recovery rate of Pb5(P/As/VO4)3Cl is the lowest, leveling off below 20%. As for the barely changed curve, the Pb5(P/As/VO4)3Cl recovery has nothing to do with the variance in the Na2S dosage. In summary, the order of difficulty for sulfidizing all types of lead oxide minerals was (PbFe6(OH)12SO4)4 < PbCO3 < PbSO4 < Pb5(P/As/VO4)3Cl.
The flotation recovery of Ag minerals at different dosages of Na2S is shown in Figure 2b. The following is illustrated in Figure 2b: (I) The mineral Ag2AsS2 is relatively easy to recover with a recovery rate that is around 90% below 5 kg/t of Na2S. The overall trend of this curve is a decline, that is to say, a high level of Na2S usage acts as one type of depressant in Ag2AsS2 flotation. (II) Considering AgCl, the recovery rate gradually decreases with an increase in Na2S from a peak of 17% at 1 kg/t, down to 8.55% at 10 kg/t. During this process, it clearly becomes further depressed. (III) In terms of natural-Ag, in spite of an increase in Na2S usage, the recovery rate is constant at about 6%, which suggests that the dosage of Na2S used for the recovery of natural-Ag does not have any impact. Thus, the the order of difficulty for sulfidizing these types of silver minerals was Ag2AsS2 < AgCl < natural-Ag.
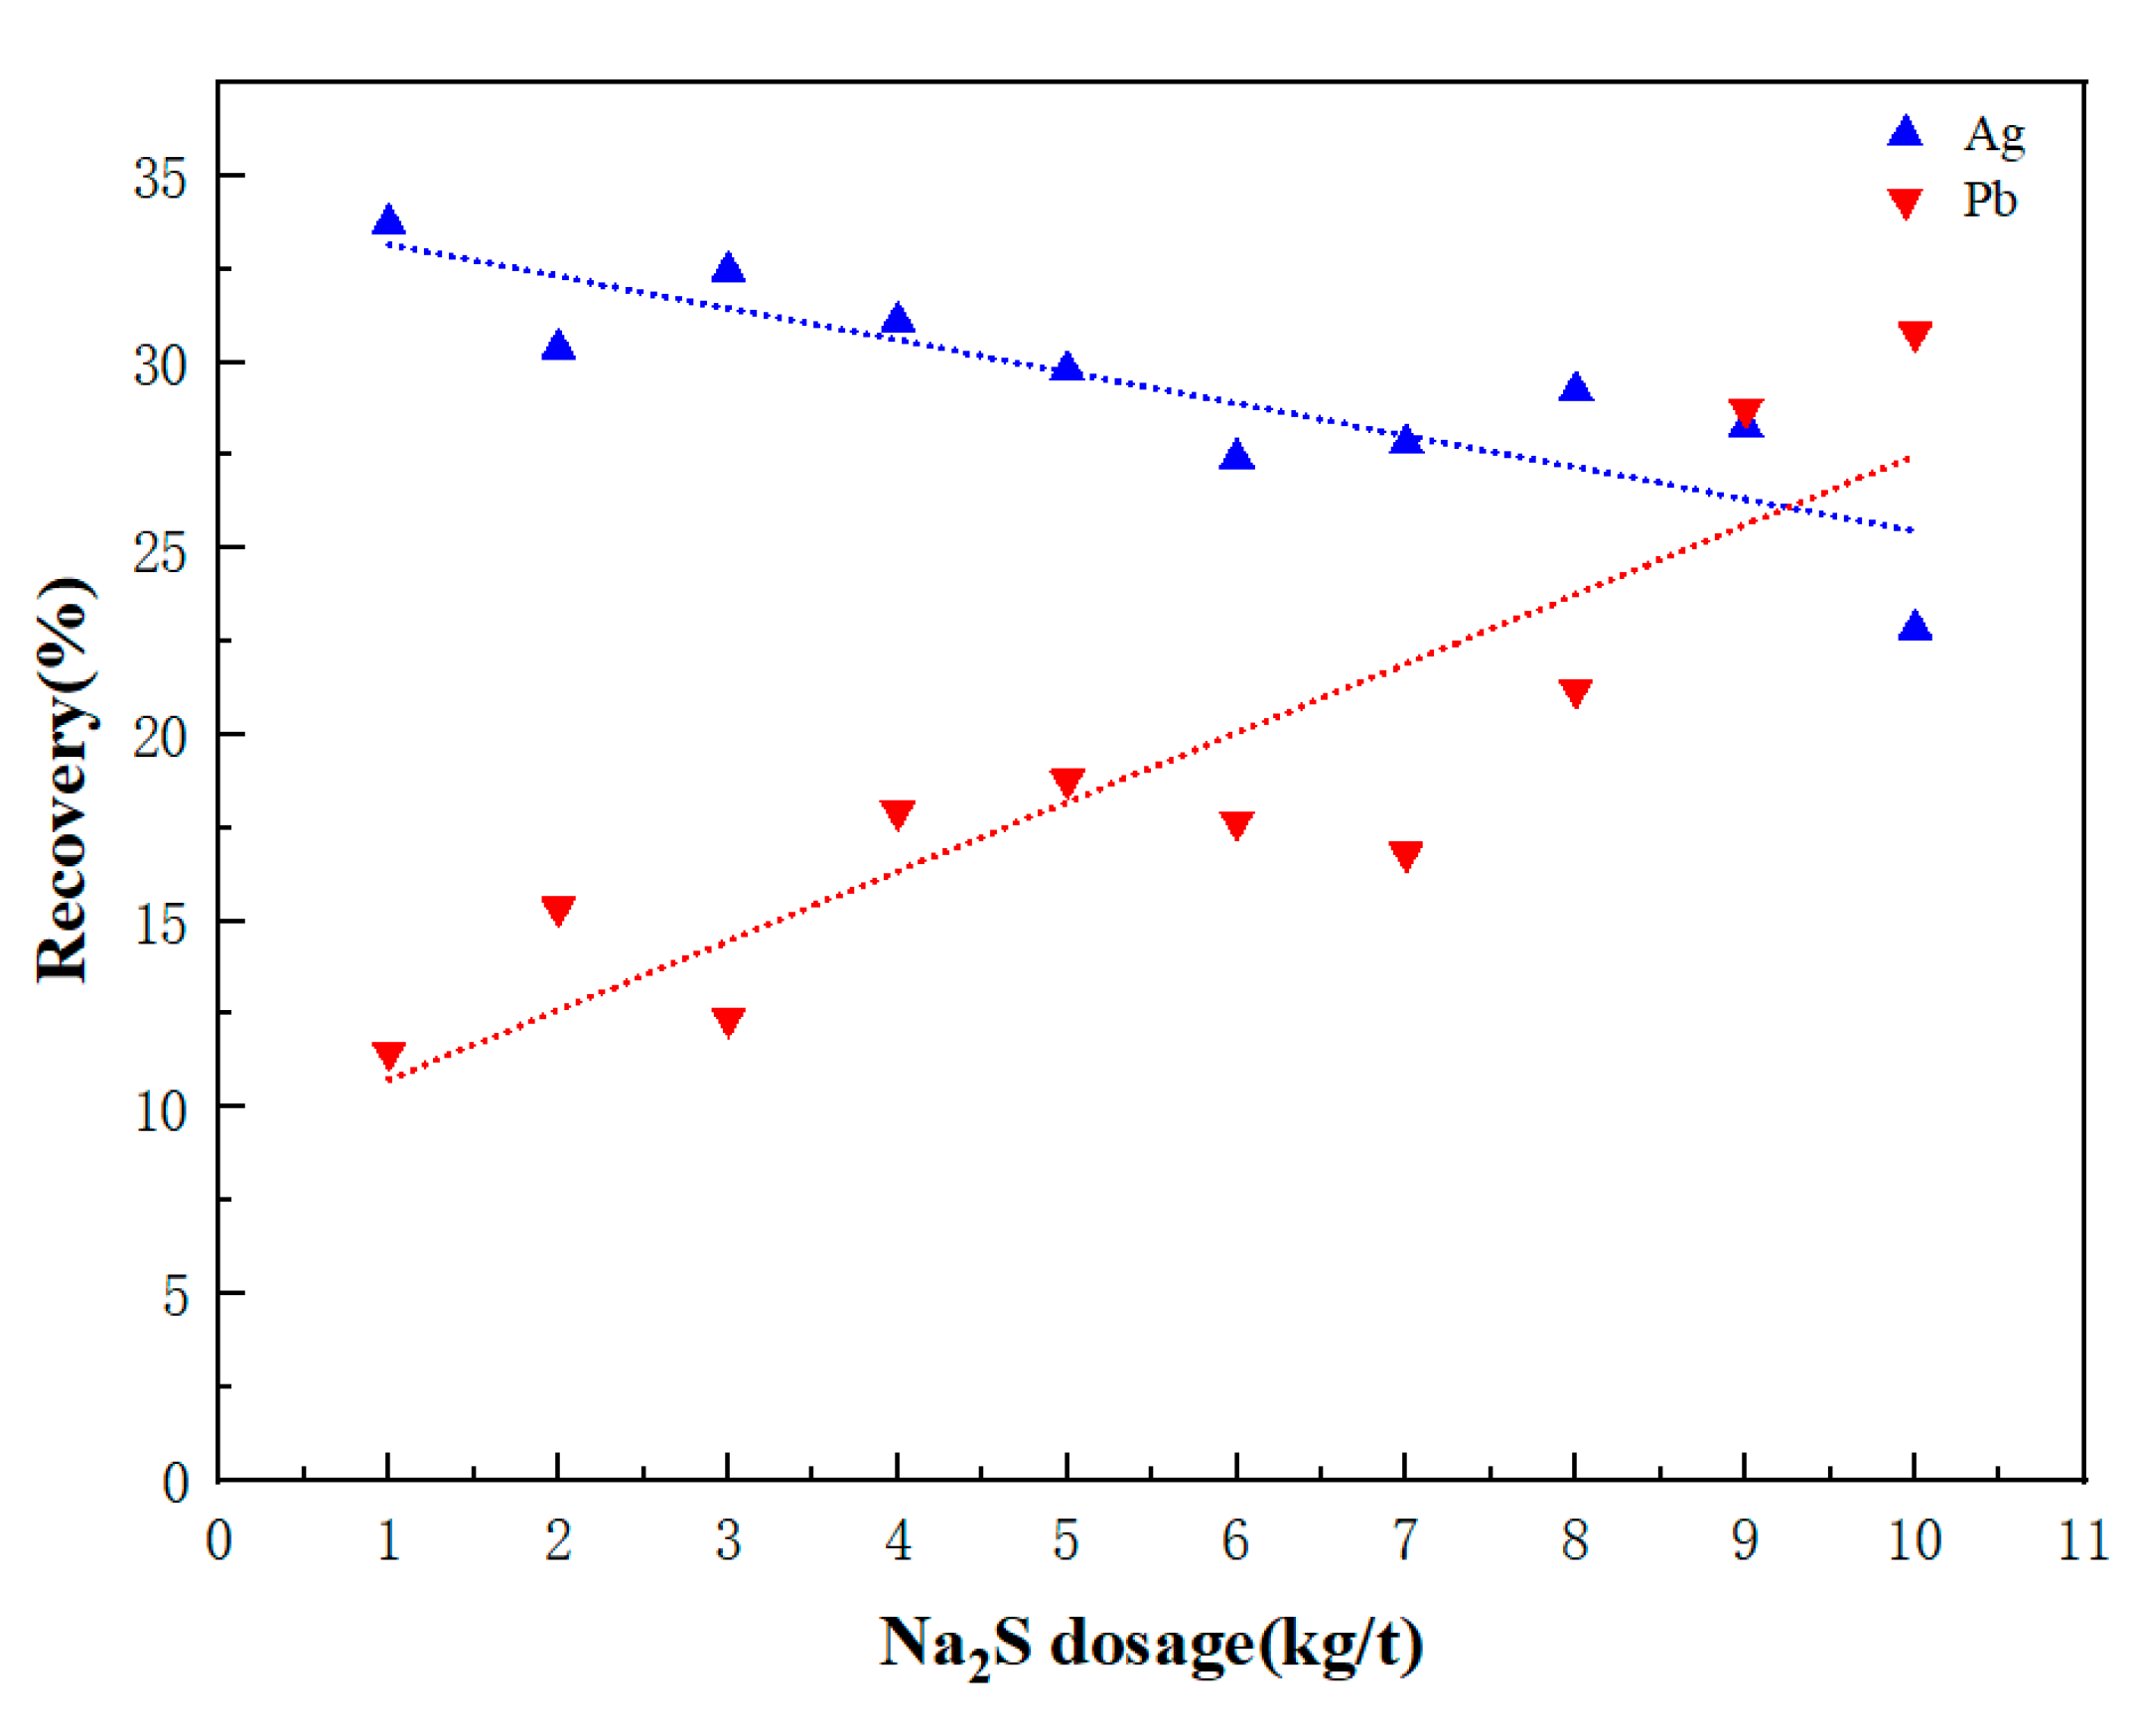
Figure 2 illustrates the recovery rate of different types of Pb minerals and Ag minerals, which change according to the dosage of Na2S. Figure 3 shows the recovery of total Ag and Pb at different dosages of Na2S. The recovery rate of total Pb presents an upward trend overall, from the lowest value of 11.49% to the highest value of 30.79%. On the contrary, it is found that the recovery rate of total Ag overall exhibits a downward trend, from the highest value of 33.73% to a minimum of 22.85%.
The trends of the two curves show that an increase in the dosage of Na2S is beneficial to the recovery of Pb, and detrimental to the recovery of Ag. Whatever reagent dosage is used, these two metals cannot be optimally recovered at the same time. Therefore, the flotation process should be performed in two stages, one each for the recycling of Pb and Ag. The first stage should focus on the recovery of Ag, while the second stage focuses on the recovery of Pb with the sulfurization-xanthate method. In addition, because the two curves intersect at around 9 kg/t, the optimum Na2S dosage for the second stage is 9 kg/t.
3.2. Selection of Ag Flotation Collectors
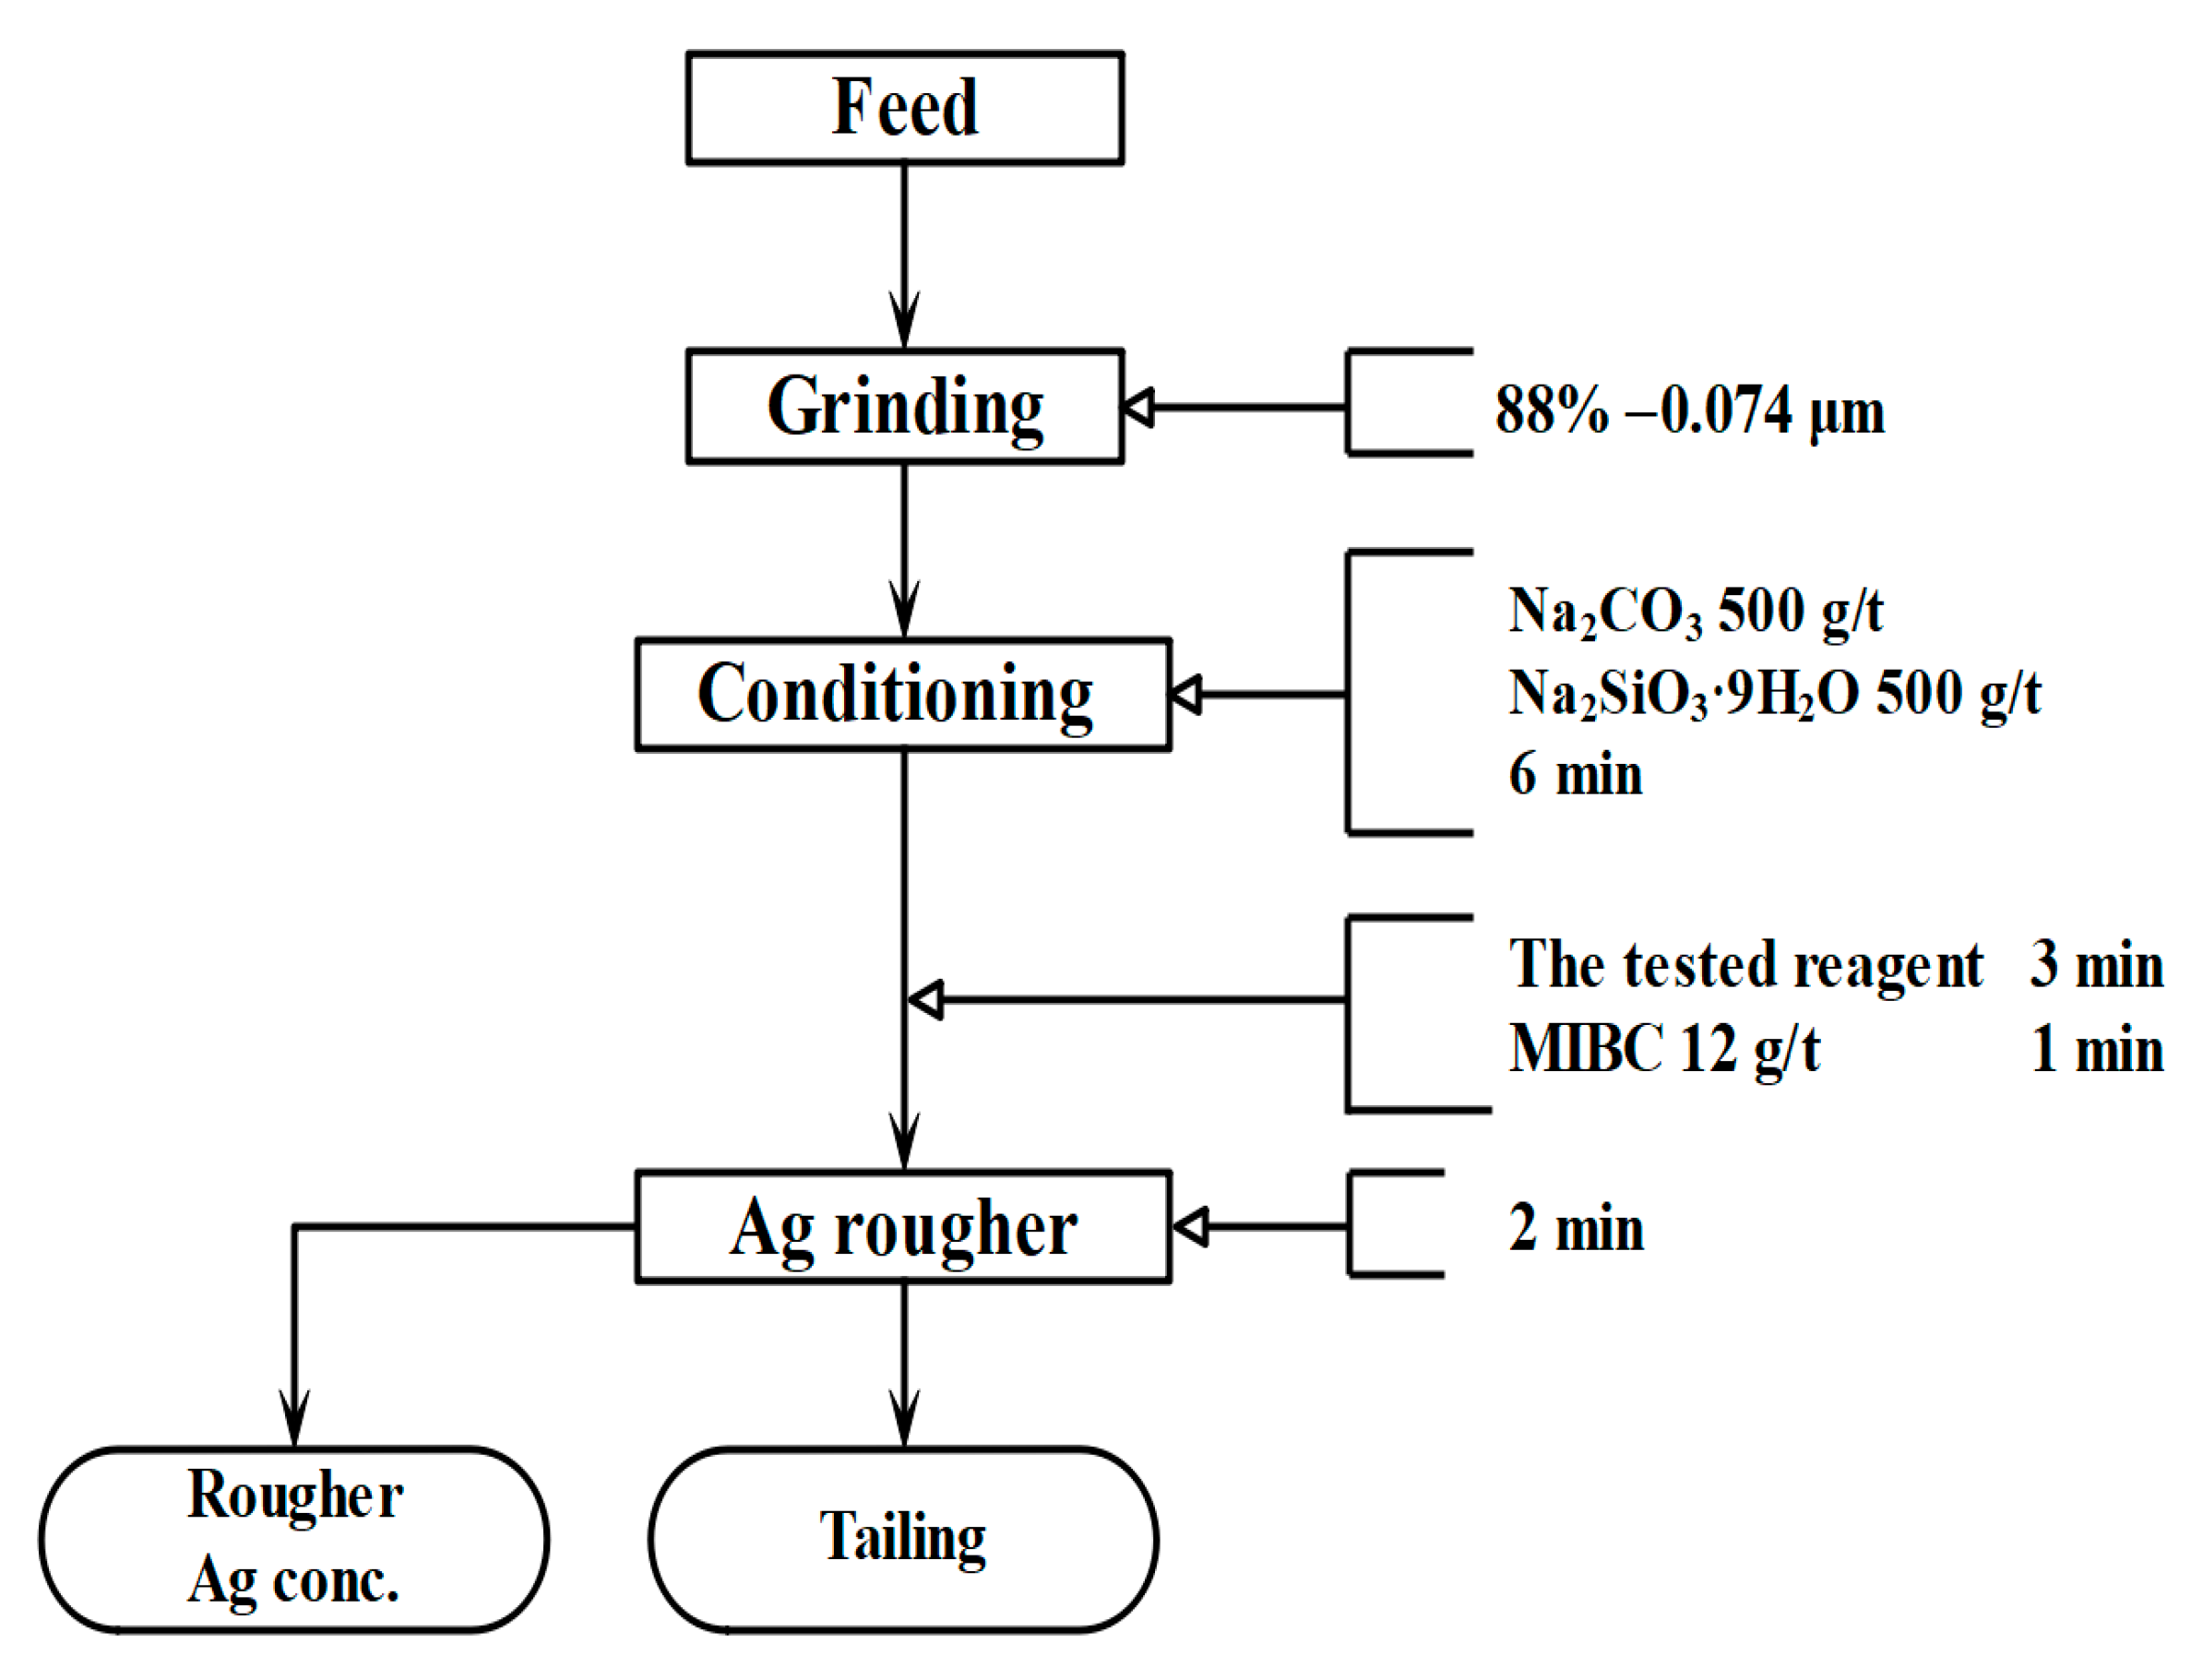
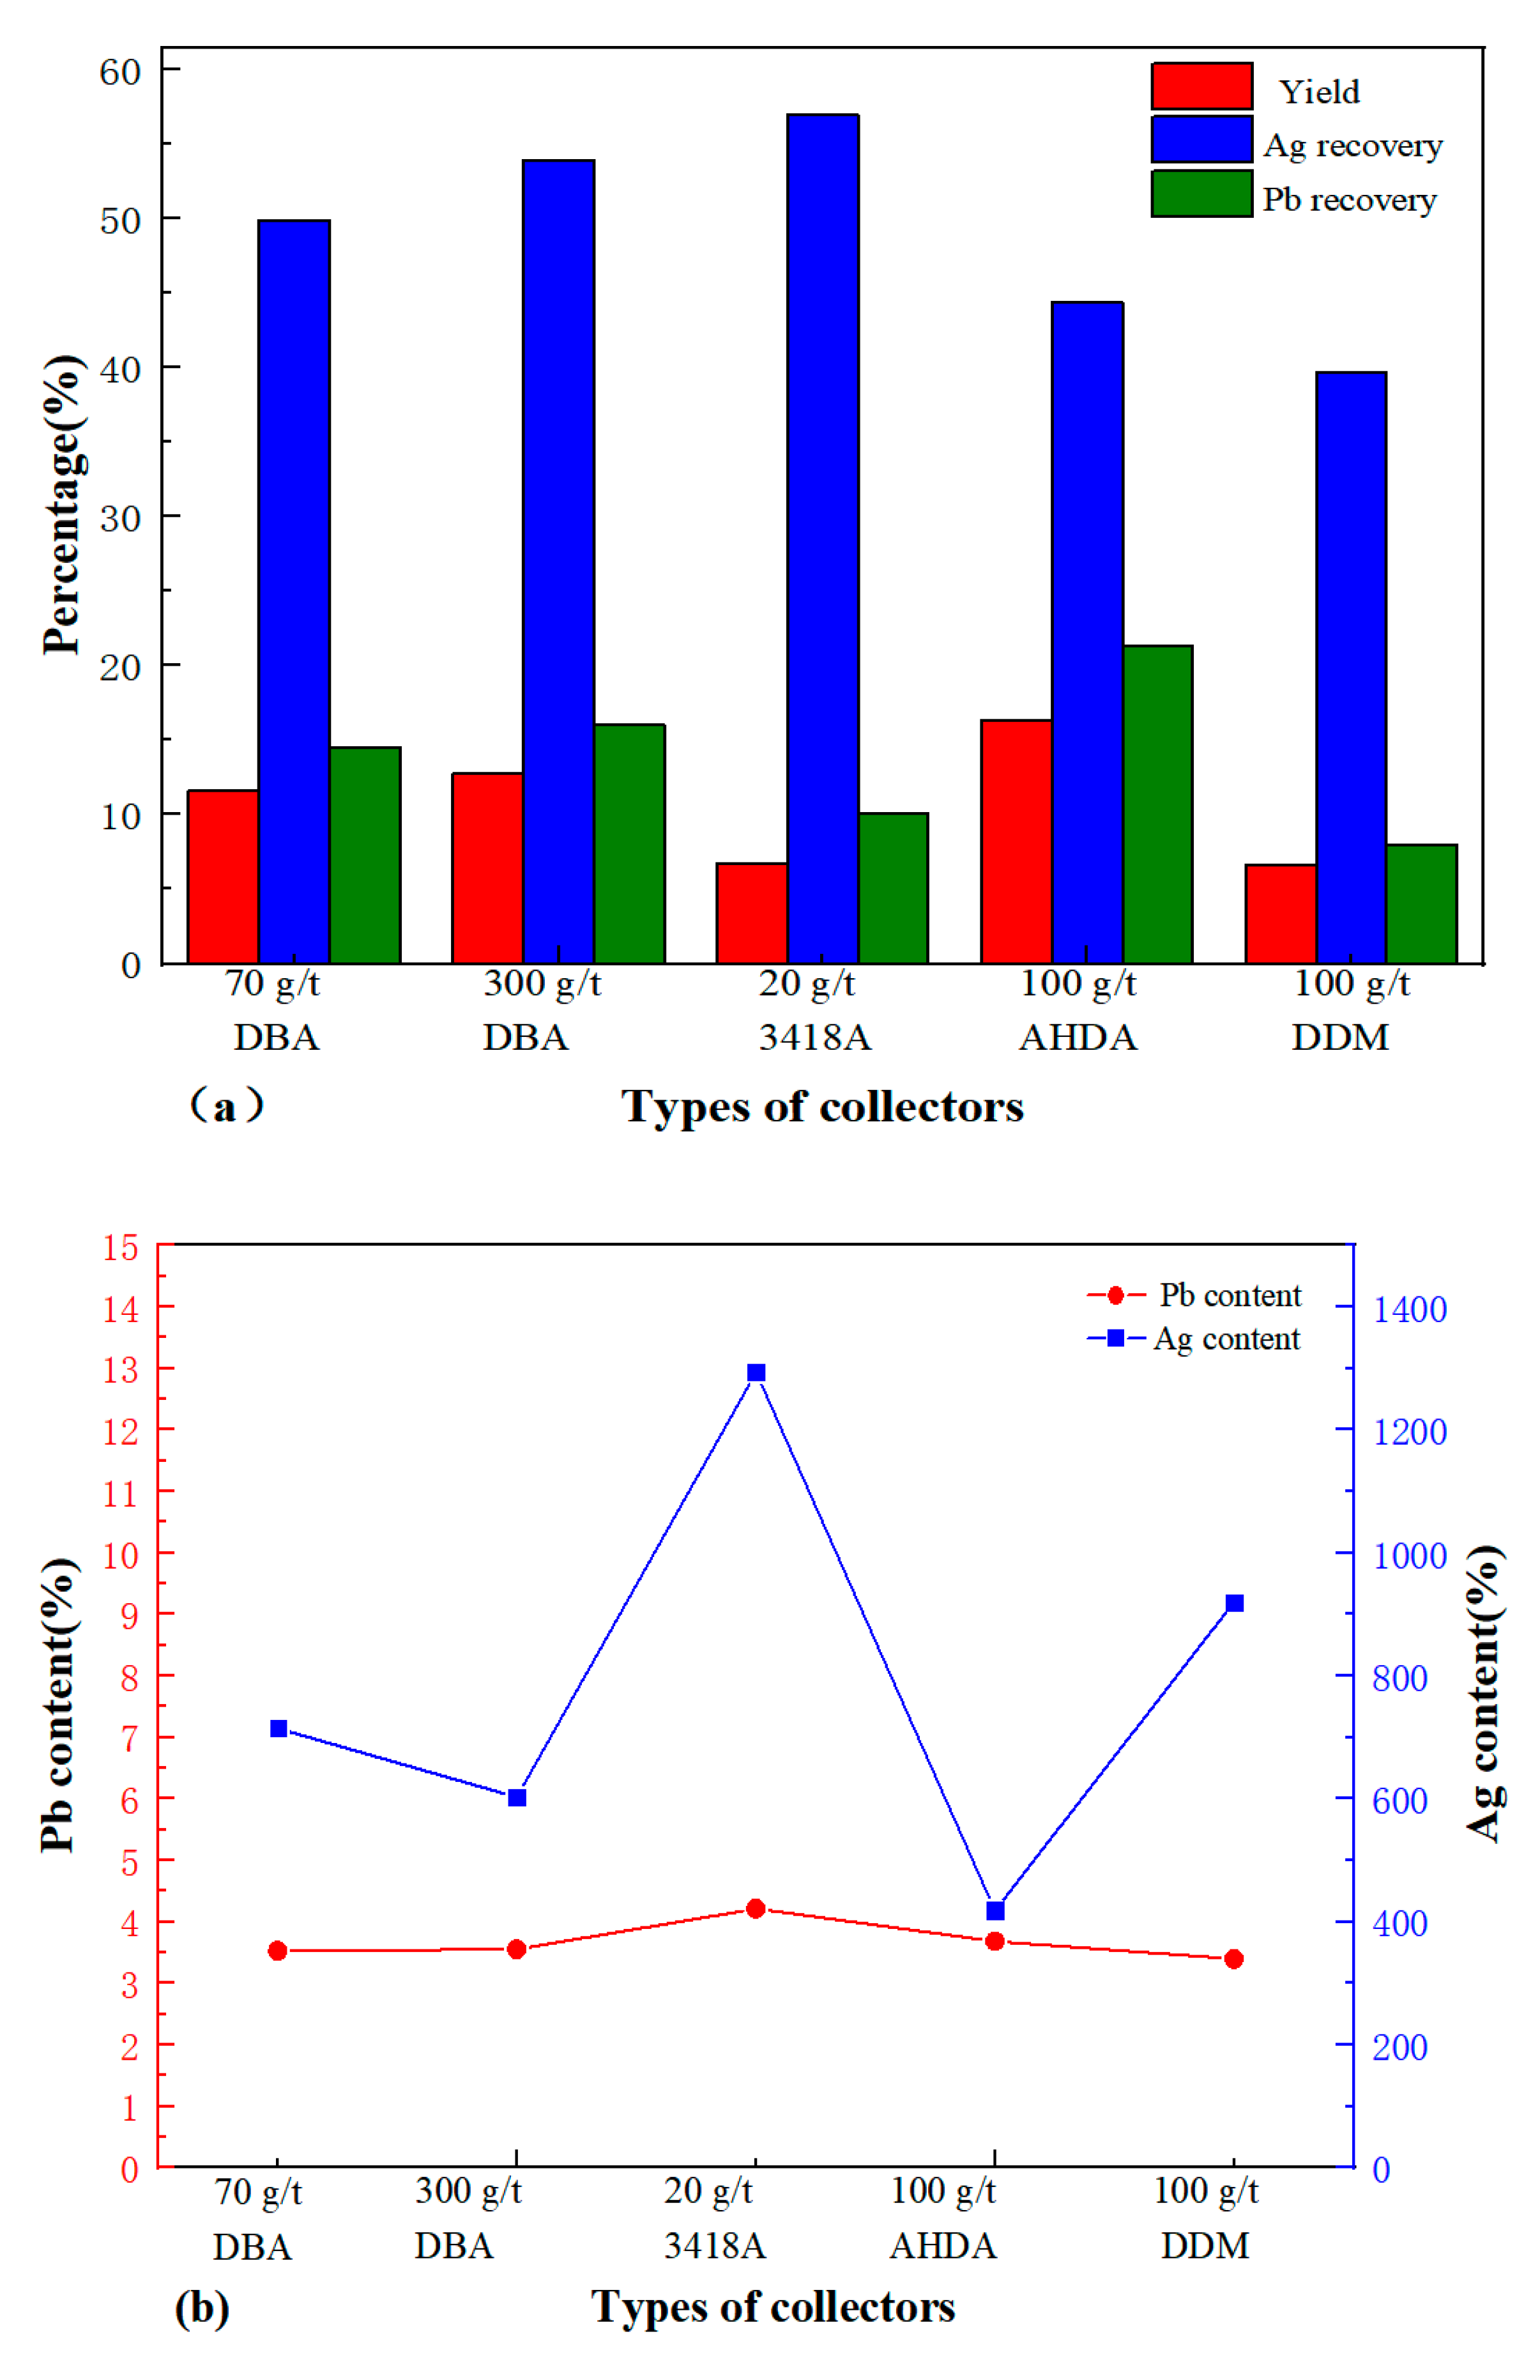
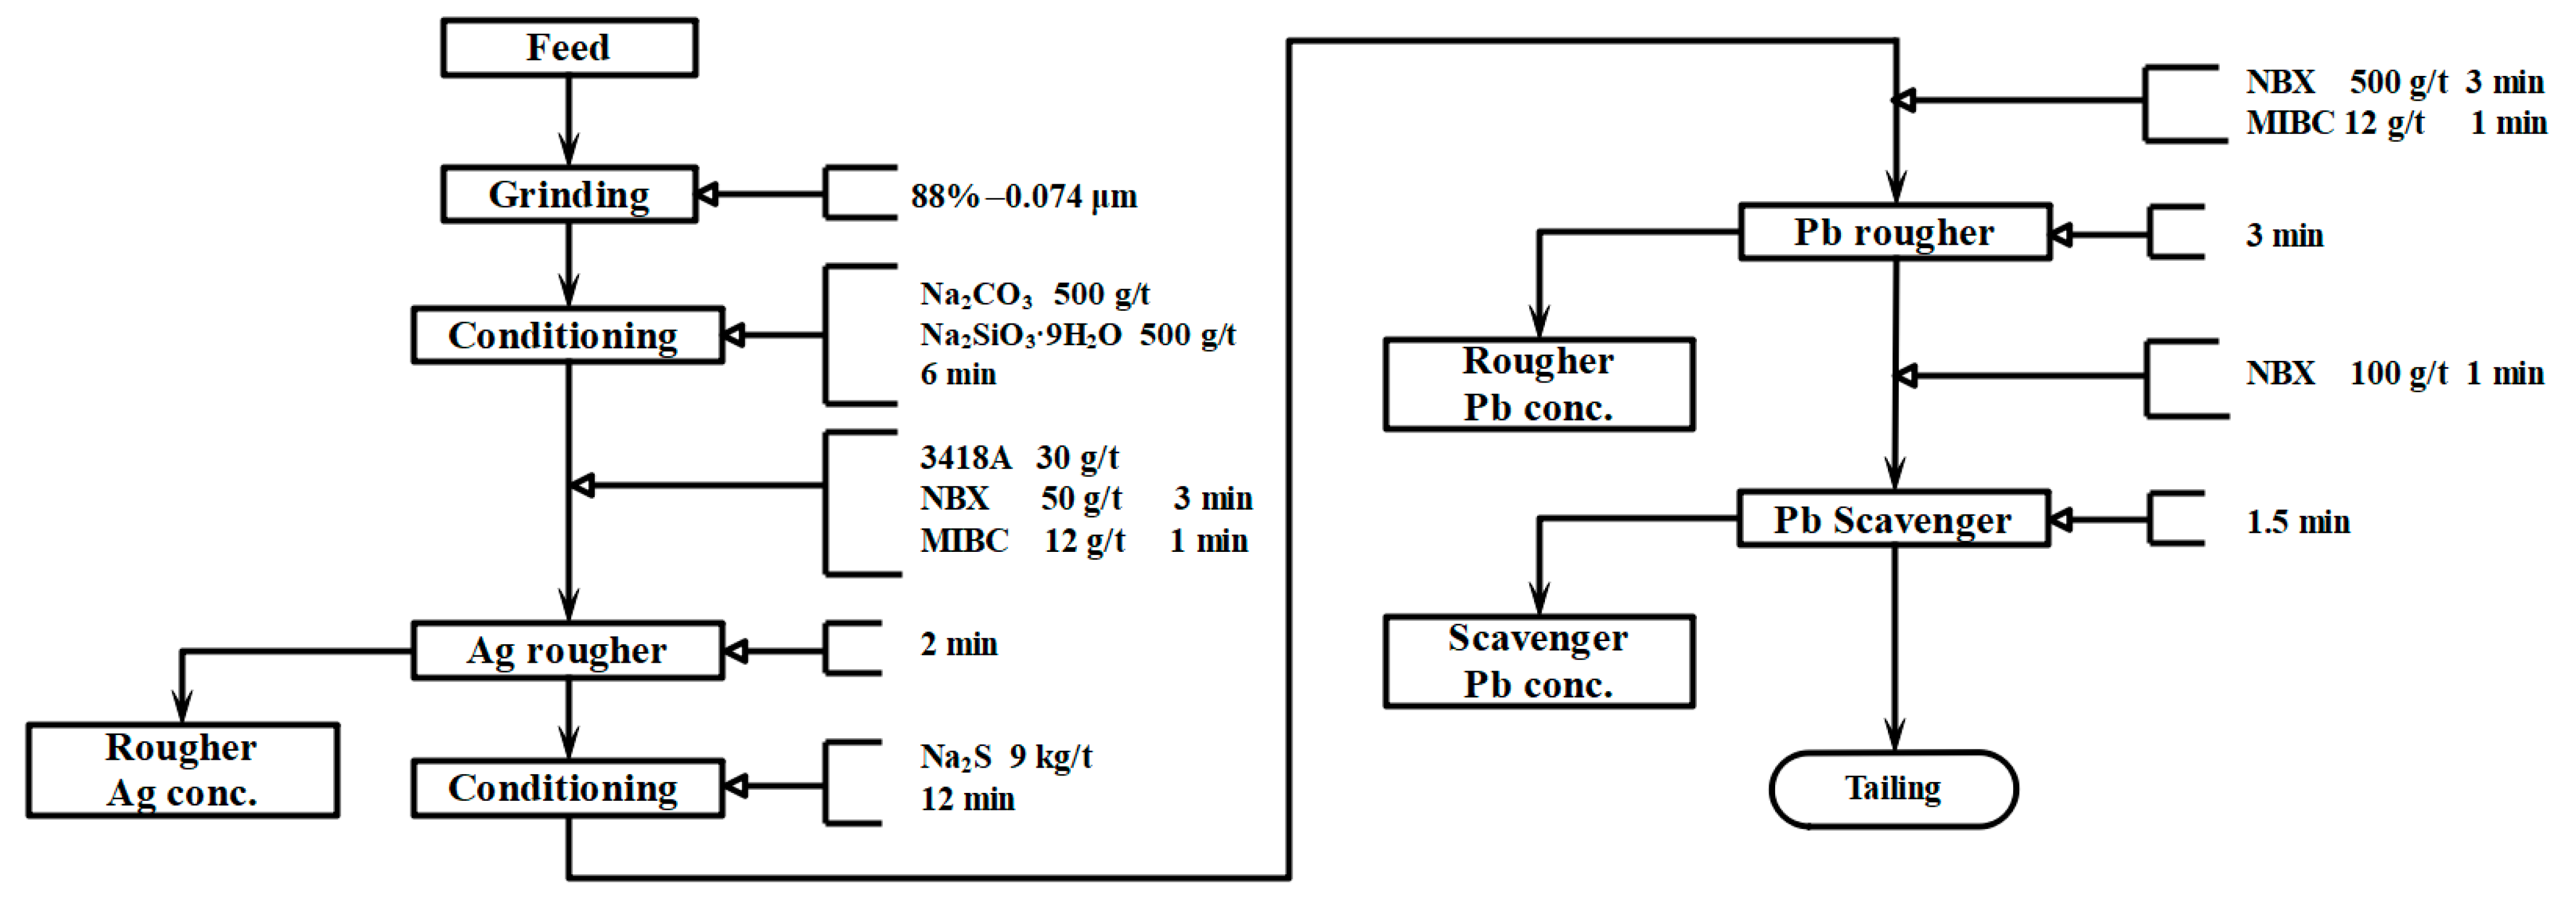
In Section 3.1, it was concluded that the first stage of the flotation process should give priority to silver recovery, thus, nullifying the effect of Na2S on silver recovery in the second stage. After a series of flotation reagents tests, 70 g/t dithiophosphate BA(DBA), 300 g/t dithiophosphate BA(DBA), 20 g/t 3418A, 100 g/t alkyl hydroximic acid (AHDA), and 100 g/t dodecyl mercaptan (DDM) were selected to estimate their collecting capacity and selectivity. The flowchart is shown in Figure 4 and the comparison results are shown in Figure 5. Under the conditions of using these five reagents separately, from Figure 5a,b the following can be observed:
- I
- Ag recovery increased in the order 100 g/t DDM < 100 g/t AHDA < 70 g/t DBA < 300 g/t DBA < 20 g/t 3418A;
- II
- Pb recovery increased in the order 100 g/t DDM < 20 g/t 3418A < 70 g/t DBA < 300 g/t DBA < 100 g/t AHDA;
- III
- The yield of the product increased in the order 100 g/t DDM ≈ 20 g/t 3418A < 70 g/t DBA < 300 g/t DBA < 100 g/t AHDA;
- IV
- The Pb grade showed small difference in these five products, but the Ag grade is the highest when 20 g/t 3418A was used.
When 20 g/t 3418A is used, firstly, the product yield is only half of that using 70 g/t DBA, but the recovery rate of Ag is the highest among the five collectors, and the recovery rate Pb is relatively low; secondly, for these five products, the contents of Pb are similar, while the product of 3418A has an obvious higher grade of Ag than the others. These two points together suggest that 3418A has the best selectivity for Ag, and less selectivity for Pb. The purpose of the first stage of flotation is to strengthen the Ag recovery, as well as weaken the recovery of Pb, which enables the first stage to produce a higher grade of silver concentrate and ensures that the second stage gets a higher grade of lead concentrate at the same time. From the above observations, 3418A is determined to be the primary collector for Ag flotation in the first stage.
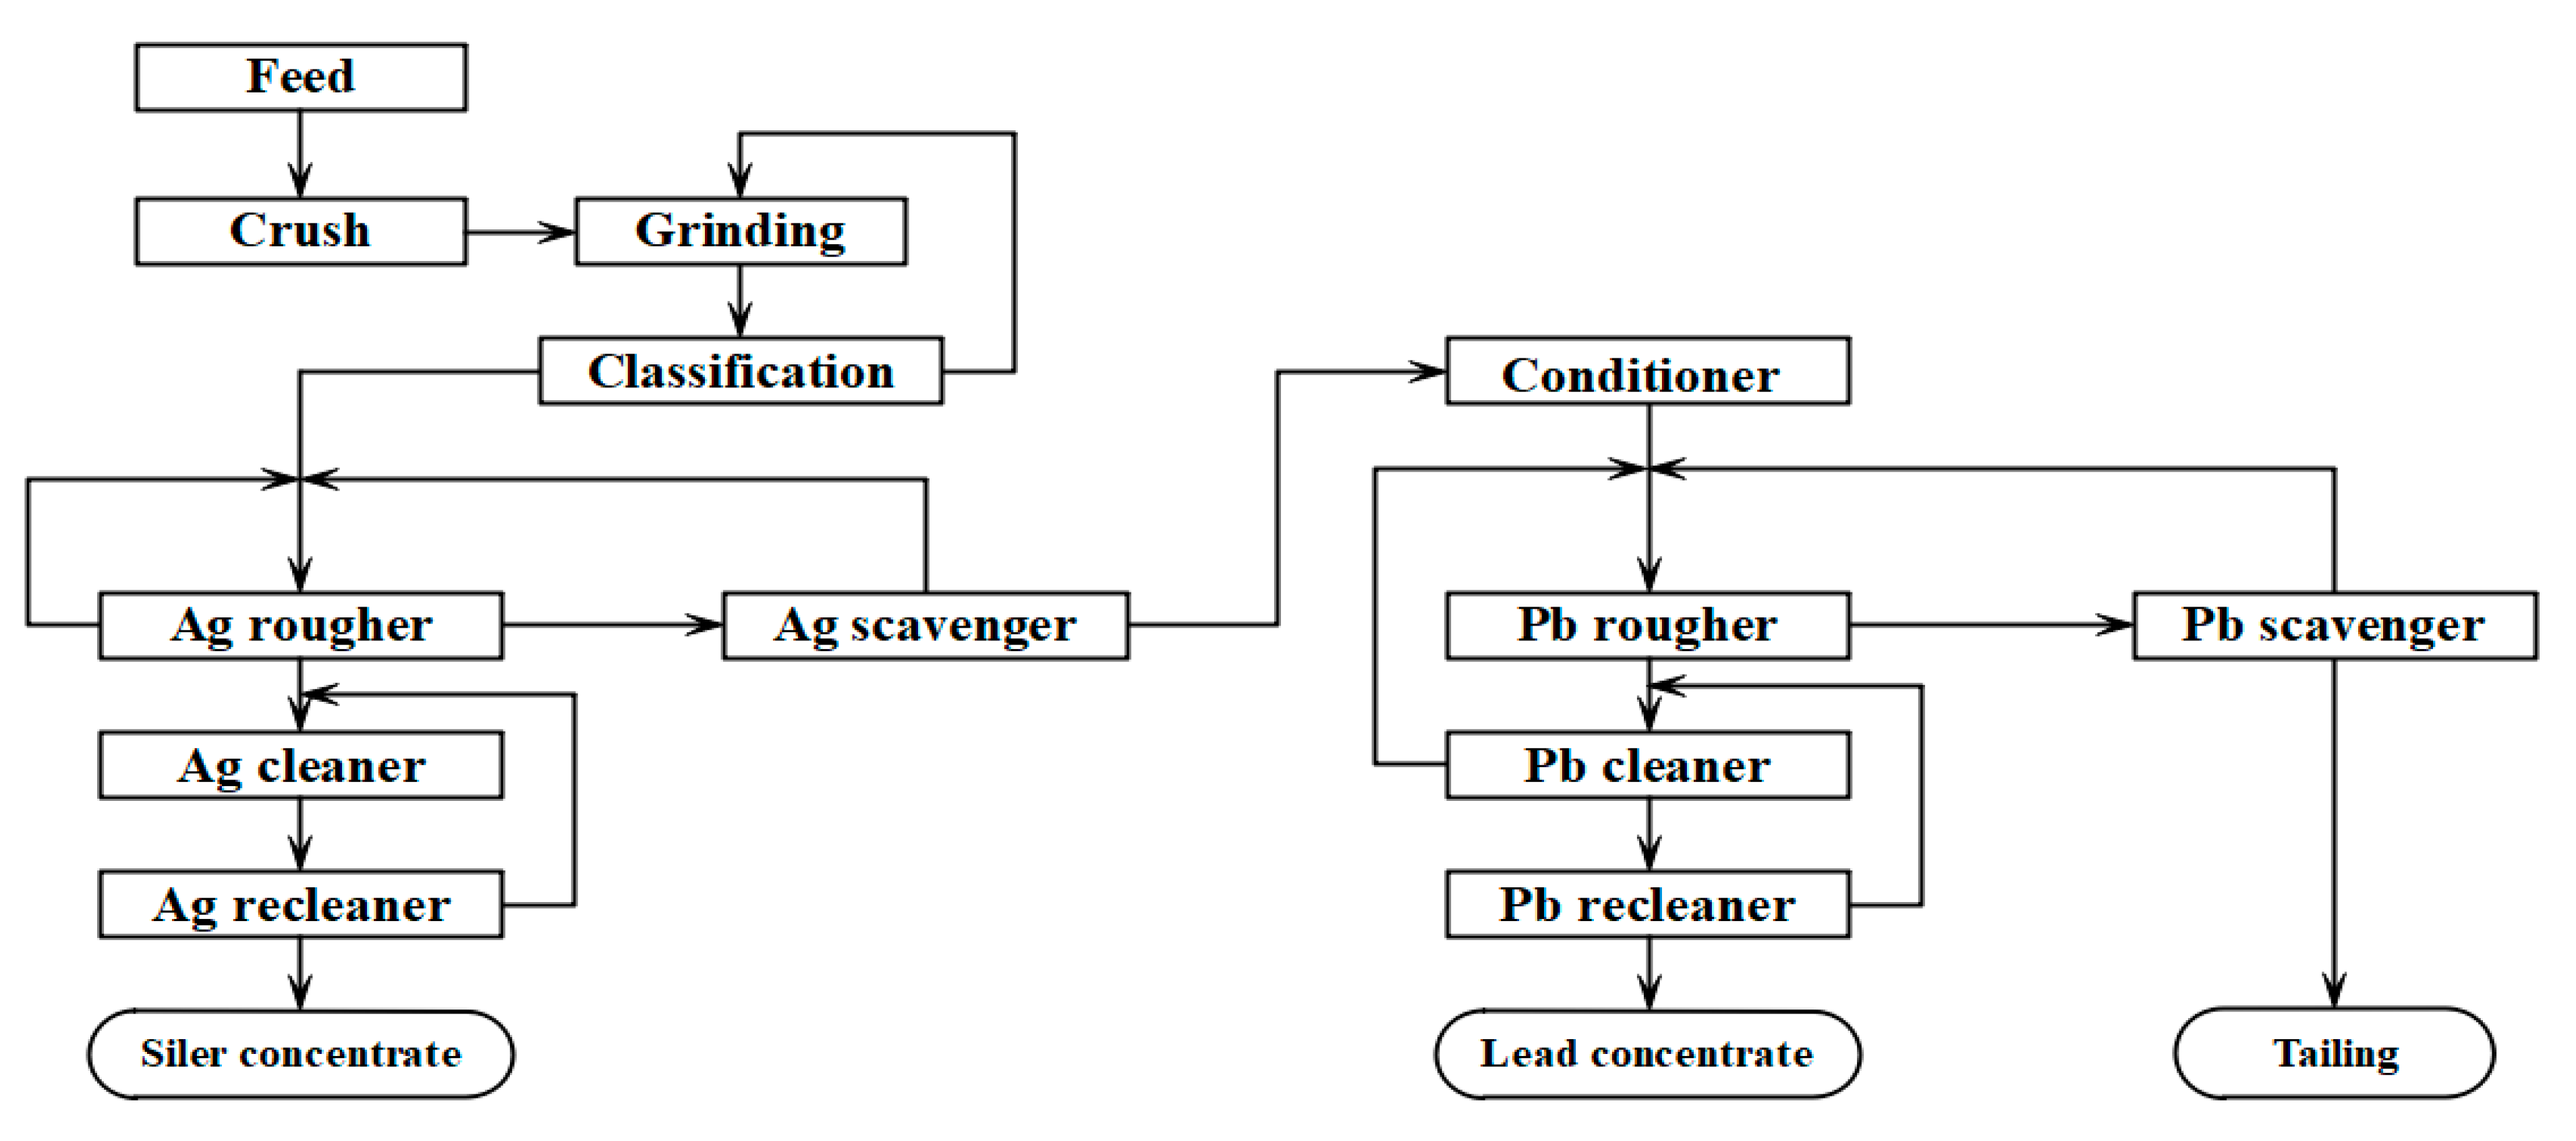
3.3. Laboratory Test and Industrial Closed-Circuit Test
3.3.1. Laboratory Test Results
The laboratory flotation flowchart is shown in Figure 6. After three stages of flotation, four types of products are obtained (rougher Ag concentrate, rougher Pb concentrate, scavenger Pb concentrate, and tailing). NBX at 50 g/t is added to strengthen the recovery of Ag in the Ag flotation stage.
The yield, content, and recovery rate of total Pb and Ag in the obtained products are shown in Table 3. It was found that rougher Ag concentrate contains 1289.28 g/t Ag with 54.98% recovery, and 4.35% Pb with 11.25% recovery. Rougher Pb concentrate contains 475.47 g/t Ag with 23.5% recovery. For the entire process, the recovery rate of total Ag and total Pb are 87.81% and 65.16%, respectively. The grade of Ag and Pb are displayed in Table A2 and Table A3, which can be found in Appendix A.
In practical terms, Table 3 and Table 4 show the following: (I) Ag within natural-Ag, AgCl, and PbS is recovered mainly from the rougher Ag selection. The recovery rates are 91.52%, 94.42%, and 91.62%, respectively. These three types of Ag are relatively easy to recover; (II) Ag within Ag2AsS2 is mainly recovered from the rougher Pb selection with a recovery rate of 56.31%. Moreover, in the products, rougher Ag and scavenger Pb, the recovery rates of Ag within Ag2AsS2 are 16.71% and 18.49%. Its total recovery rate is 91.51%; (III) Ag within SiO2 and Silicate is distributed across the products.
Correspondingly, in Table 5, most of the PbS is collected from the rougher Ag selection with a recovery of 90.39%. On the contrary, PbSO4, PbCO3, and (PbFe6(OH)12SO4)4 are collected from the rougher Pb selection, with recovery rates of 40.81%, 61.87%, and 85.03%, respectively, and their total recovery rates are 68.95%, 81.09%, and 94.85%, respectively. Unlike the above minerals, Pb5(P/As/VO4)3Cl is too hard to be sulfurized, or to be recovered by 3418A or NBX.
3.3.2. Industrial Closed-Circuit Test
An industrial closed-circuit test was carried out by the ore sample provider, Huachangshan Mountain Mining Company, Lanping Bai and Pumi Autonomous County, China. The main flowchart is shown in Figure 7, and the kind of reagent as well as their dosage are the same as in the laboratory flotation test. The grade and recovery rate of Ag concentrate and Pb concentrate are displayed in Table 6. The raw ore contains 3.11% Pb and 205 g/t Ag. Obviously, there are some slight differences between industrial and laboratory samples. This is a normal phenomenon in industrial production.
In Table 6, the Ag concentrate contains 1988 g/t Ag with 57.89% recovery, and the Pb concentrate contains 23.4% Pb with 58.46% recovery.
4. Conclusions
In this study, we investigated a low-grade, mixed sulfide-oxide ore, containing lead and silver minerals, with complex mineralogy. The flotation findings demonstrated the sulfidizing flotation behaviors of these four different types of Pb minerals and three different types of Ag minerals, which provides valuable references for the separation of such minerals in the future. The selectivity of the commonly used silver flotation reagents was compared and a high-efficiency silver collector was found. An effective flotation process was successfully explored for this typical ore and an industrial closed-circuit test verified its feasibility and efficiency.
The main conclusions were as follows:
- For the sulfidizing flotation behaviors of lead minerals, (PbFe6(OH)12SO4)4 and PbCO3 were quite easy to be sulfurized, PbSO4 could not be completely sulfurized, and only a small part of Pb5(P/As/VO4)3Cl could be sulfurized. Therefore, the order of difficulty for sulfidizing all types of lead minerals was (PbFe6(OH)12SO4)4 < PbCO3 < PbSO4 < Pb5(P/As/VO4)3Cl.For silver minerals, Ag2AsS2 could be easily recovered at a lower dosage of Na2S, but with an increase in Na2S dosage, the recovery rate of Ag2AsS2 gradually decreased. In contrast, natural-Ag and AgCl were basically depressed by sodium sulfide. Nevertheless, they were easily collected by xanthate and 3418A. Thus, the order of difficulty for sulfidizing all types of silver minerals was Ag2AsS2 < AgCl < natural-Ag.
- Ag minerals existed in the elemental form, and also in sulfide minerals and oxidized minerals. This made it impossible to effectively recover the silver which was partially present in the sulfide minerals by using only the sulfurization-xanthate method. Therefore, it was necessary to implement two flotation stages, the first stage for the sulfide minerals, and the second stage for the oxidized minerals, with the sulfurization-xanthate method. Most of the lead which existed in the oxidized minerals, could be effectively recovered by the sulfurization-xanthate method.
- In the sulfide ore flotation stage, 3418A had the best selectivity for Ag and the least selectivity for Pb, which was conducive to a higher grade of silver and a lower grade of lead. The yield of the product obtained by 3418A was low, which was favorable for industrial production.
- The results of the laboratory tests showed that the silver found in natural-Ag, AgCl, and PbS were recovered mainly in rougher Ag, and the recovery rates were 84.36%, and 82.14%, and 88.78%, respectively. Ag2AsS2 was mainly recovered in the rougher Pb, and the recovery rate was 56.31%. At the same time, PbSO4, PbCO3, and (PbFe6(OH)12SO4)4 were recovered in the rougher Pb, with recovery rates of 40.81%, 61.87%, and 85.03%, respectively. For lead minerals, the recovery efficiency of Pb5(P/As/VO4)3Cl was quite low, and its recovery in rougher Pb and rougher Ag were 14.51% and 9.92%, respectively, while the total recovery rate was only 38.68%.The final results of the laboratory tests showed that the recovery rate of total Ag was 87.81% and the recovery rate of total Pb was 65.16%. The results of the industrial closed-circuit test showed that the recovery rate of total Ag was 87.64% and the recovery rate of total Pb was 67.71% in lead concentrate.
Author Contributions
Writing—original draft, Y.Z.; Writing—review and editing, J.C. All authors have read and agreed to the published version of the manuscript.
Funding
This research was funded by National Natural Science Foundation of China (NSFC 51864003, NSFC 51874106), State Key program of the Joint Funds of the National Natural Science Foundation of China (Grant No.U20A20269) and Guangxi Natural Science Foundation (2018GXNSFAA050127). The authors are thankful for these supports.
Data Availability Statement
Not applicable.
Conflicts of Interest
The authors declare no conflict of interest.
Appendix A

Table A1.
Pulp pH at different dosages of Na2S.
| Na2S Dosage (g/t) | 0 | 1 | 2 | 3 | 4 | 5 | 6 | 7 | 8 | 9 | 10 |
|---|---|---|---|---|---|---|---|---|---|---|---|
| pH | 6.0 | 6.5 | 7.0 | 7.5 | 8.0 | 8.5 | 9.0 | 9.5 | 10.0 | 11.0 | 12.0 |
Table A2.
The grade of Ag (g/t).
| Rougher Ag Conc. | Rougher Pb Conc. | Scavenger Pb Conc. | Tailing | |
|---|---|---|---|---|
| Natural-Ag | 234.3 | 12.54 | 5.62 | 2.2 |
| Ag2AsS2 | 94 | 273.4 | 100.8 | 2.99 |
| AgCl | 685.06 | 65.56 | 29.14 | 3.8 |
| PbS | 176 | 3.36 | 1.85 | 1.65 |
| SiO2 & Silicate | 91.5 | 116 | 69.8 | 6.4 |
Table A3.
The grade of Pb (%).
| Rougher Ag Conc. | Rougher Pb Conc. | Scavenger Pb Conc. | Tailing | |
|---|---|---|---|---|
| PbSO4 | 0.17 | 0.42 | 0.16 | 0.03 |
| PbS | 1.91 | 0.03 | 0.02 | 0.01 |
| PbCO3 | 0.32 | 7.14 | 2.19 | 0.16 |
| Pb5(P/As/VO4)3Cl | 1.64 | 2.07 | 2.28 | 0.86 |
| (PbFe6(OH)12SO4)4 | 0.31 | 3.98 | 0.22 | 0.02 |
References
- Moradi, S.; Monhemius, A.J. Mixed sulfide-oxide lead and zinc ores: Problems and solutions. Miner. Eng. 2011, 24, 1062–1076. [Google Scholar] [CrossRef]
- Liu, G.L.; Yang, X.L.; Zhong, H. Molecular design of flotation collectors: A recent progress. Adv. Colloid. Interfac. 2017, 246, 181–195. [Google Scholar] [CrossRef]
- Jafari, M.; Shafaei, S.Z.; Abdollahi, H.; Gharabaghi, M.; Chehreh Chelgani, S. Effect of Flotation Reagents on the Activity of L. Ferrooxidans. Min. Proc. Ext. Met. Rev. 2018, 39, 34–43. [Google Scholar] [CrossRef]
- Li, J.M.; Song, K.W.; Liu, D.W.; Zhang, X.L.; Lan, Z.Y.; Sun, Y.L.; Wen, S.M. Hydrolyzation and adsorption behaviors of SPH and SCT used as combined depressants in the selective flotation of galena from sphalerite. J. Mol. Liq. 2017, 231, 485–490. [Google Scholar] [CrossRef]
- Elizondo-Álvarez, M.A.; Dávila-Pulido, G.I.; Bello-Teodoro, S.; Uribe-Salas, A. Roleof pH on the adsorption of xanthate and dithiophosphinate onto galena. Can. Metall. Q. 2019, 58, 107–115. [Google Scholar] [CrossRef]
- Jones, M.H.; Woodcock, J.T. Control of laboratory sulphidization with a sulphide ion-selective electrode before flotation of oxidized lead-zinc-silver dump material. Int. J. Miner. Process. 1979, 6, 17–30. [Google Scholar] [CrossRef]
- Marabini, A.M.; Barbaro, M.; Passariello, B. Flotation of cerussite with a synthetic chelating collector. Int. J. Miner. Process. 1989, 25, 29–40. [Google Scholar] [CrossRef]
- Rey, M.; Chataignon, P.; Formanek, V. Flotation of oxidised ores of lead, copper and zinc. Inst. Min. Metall. Trans. 1954, 63, 541–548. [Google Scholar]
- Zhu, Y.; Sun, C.; Wu, W. A new synthetic chelating collector for the flotation of oxidized-lead mineral. J. Univ. Sci. Technol. Beijing Mineral. Metall. Mater. 2007, 14, 9–13. [Google Scholar] [CrossRef]
- Fleming, M.G. Effects of alkalinity on the flotation of lead minerals. Trans. AIME 1952, 193, 1231–1236. [Google Scholar]
- Chen, J.H.; Sun, C.Y. Study on the mechanism of sodium sulfide in the flotation system of cerusite. Met. Ore. Dress. Abroad 2006, 2, 19–20. [Google Scholar]
- Chen, J.H.; Zhang, F.Q. Electrochemical properties of sulfidizing flotation system for cerusite. Min. Metall. Eng. 2017, 8, 38–40. [Google Scholar]
- Wei, Z.W.; Chen, Y. On Flotation Performance of Cerusite in Xanthate System. Jiangxi Nonferrous Met. 2008, 3, 19–21. [Google Scholar]
- Martha, A.E.; Alejandro, U.S.; Fabiola, N.A. Flotation studies of galena (PbS), cerussite (PbCO3) and anglesite (PbSO4) with hydroxamic acids as collectors. Miner. Eng. 2020, 155, 106456. [Google Scholar]
- Liu, S.Y.; Liu, D.W.; Li, J.L.; Cai, J.P.; Su, C. Progress on the surface sulfidization of cerussite flotation. Nonferrous Met. 2019, 2, 97–102. [Google Scholar]
- Rashchi, F.; Dashti, A.; Arabpour-Yazdi, A.H. Anglesite flotation: A study for lead recovery from zinc leach residue. Miner. Eng. 2005, 18, 205–212. [Google Scholar] [CrossRef]
- Rastas, J.; Nyberg, R. Hydro Metallurgical Process for the Recovery of Lead, Silver and Gold, as well as Zinc, from Impure Jarosite Residues of an Electrolytic Zinc Process. U.S. Patent 4,336,127, 28 December 1982. [Google Scholar]
- Rastas, J.; Saari, M.; Hintikka, V.; Leppinen, J.; Jarvinen, A. Flotation Recovery of Lead, Silver, and Gold as Sulfides from Electrolytic Zinc Process. U.S. Patent 4,385,038, 24 May 1983. [Google Scholar]
- Rastas, J.; Leppinene, J.; Hintikka., V.; Fugleberg, S. Recovery of lead, silver and gold from zinc process residue by a sulfidization flotation method. In The Minerals, Metals and Material Society; Mackey, T.S., Prengaman, R.D., Eds.; A Publication of The Minerals, Metals & Materials Society (TMS): Pittsburgh, PA, USA, 1990; pp. 193–209. [Google Scholar]
- Herrera-Urbina, R.; Sotillo, F.J.; Fuerstenau, D.W. Effect of sodium sulfide additions on the pulp potential and amyl xanthate flotation of cerussite and galena. Int. J. Miner. Process. 1999, 55, 157–170. [Google Scholar] [CrossRef]
- Li, Y.; Wang, J.K.; Wei, C.; Liu, C.X.; Jiang, J.B.; Wang, F. Sulfidation roasting of low grade lead-zinc oxide ore with elemental sulfur. Miner. Eng. 2010, 23, 563–566. [Google Scholar] [CrossRef]
- Fu, X.G. Evolution of Lanping Basin and formation of relevant metal deposits. J. Earth Sci. Environ. 2005, 27, 26–32. [Google Scholar]
- Zhu, D.L. Geological characteristics of the Huachangshan Pb-Zn deposit and prospecting progress. Miner. Explor. 2013, 9, 508–512. [Google Scholar]
- Jiang, B. Mineralization of Sedimentary-Rock-Hosted Lead-Zinc Deposits of the Lanping-Simao Basin in Southern Part of Sanjiang Area. Ph.D. Thesis, China University of Geosciences (Beijing), Beijing, China, May 2014. [Google Scholar]
- Han, P.; Wang, J.H.; Lu, A.X.; Ma, Z.D.; Pan, L.G. Analysis of heavy metal in soil with portable X-ray fluorescence spectrometry. Spectrosc. Spectr. Anal. 2012, 3, 826–829. [Google Scholar]
- Huang, B.G. Advances in Chemical Phase Analysis in China. Anal. Chem. 1991, 19, 1215–1222. [Google Scholar]
- Bulatovic, S.M. Handbook of Flotation Reagents Chemistry, Theory and Practice: Flotation of Sulfide Ores; Elsevier Science & Technology Books Press: Amsterdam, The Netherlands, 2007; pp. 323–365. [Google Scholar]
- Chen, Y.; Wen, S.M.; Wang, Y.J.; Feng, Q.C.; Li, J.L.; Cui, C.F. The Progress of Mineral Processing Technology of Lead-zinc Mine in China. Appl. Mech. Mater. 2014, 737, 874–877. [Google Scholar] [CrossRef]
Figure 1.
The flowchart of the Na2S dosage test.

Figure 2.
Flotation recovery at different dosages of Na2S. (a) Pb recovery of (PbFe6(OH)12SO4)4, PbCO3, PbSO4, and Pb5(P/As/VO4)3Cl; (b) Ag recovery of Ag2AsS2, AgCl, and natural-Ag.
Figure 2.
Flotation recovery at different dosages of Na2S. (a) Pb recovery of (PbFe6(OH)12SO4)4, PbCO3, PbSO4, and Pb5(P/As/VO4)3Cl; (b) Ag recovery of Ag2AsS2, AgCl, and natural-Ag.

Figure 3.
Flotation recovery of total Ag and Pb at different dosages of Na2S.

Figure 4.
Flowchart of the Ag collector test.

Figure 5.
(a) Yield and recovery of products under different collector conditions; (b) content of products under different collector conditions.
Figure 5.
(a) Yield and recovery of products under different collector conditions; (b) content of products under different collector conditions.

Figure 6.
Laboratory flotation flowchart.

Figure 7.
Industrial closed-circuit flotation flowchart.

Table 1.
X-ray fluorescence (XRF) spectrometry results of complex oxidized Pb-Ag ore sample (mass fraction, %).
Table 1.
X-ray fluorescence (XRF) spectrometry results of complex oxidized Pb-Ag ore sample (mass fraction, %).
| Species | Content | Species | Content |
|---|---|---|---|
| CaO | 36.1 | Fe | 1.77 |
| MgO | 5.03 | Mn | 0.12 |
| SiO2 | 4.1 | V | 0.18 |
| Al2O3 | 0.6 | Cd a | 112 |
| K2O | 0.14 | Mo a | 24 |
| Pb | 2.96 | Sb a | 800 |
| Zn | 0.43 | As | 0.66 |
| Ag a | 177 | S | 0.28 |
| Cu | 0.02 |
a Units in g/t (g/t is short for gram per ton).
Table 2.
Chemical phase analysis results of complex sulfide-oxidized mixed Pb-Ag ore sample (mass fraction, g/t, %).
Table 2.
Chemical phase analysis results of complex sulfide-oxidized mixed Pb-Ag ore sample (mass fraction, g/t, %).
| Species | Natural-Ag | Ag2AsS2 | AgCl | CuFeS2 | PbS | SiO2 and Silicate | Total Ag |
|---|---|---|---|---|---|---|---|
| Ag (g/t) | 21 | 42.5 | 63 | 1.3 | 15 | 34.2 | 177 |
| Species | Pb5(P/As/VO4)3Cl | PbCO3 | PbS | PbSO4 | (PbFe6(OH)12SO4)4 | Total Pb | |
| Pb (%) | 1.24 | 1.01 | 0.16 | 0.09 | 0.46 | 2.96 | |
(Pb5(P/As/VO4)3Cl is shorthand for Pb5(PO4)3Cl, Pb5(AsO4)3Cl and Pb5(VO4)3Cl).
Table 3.
The yield, grade, and recovery of total Pb and Ag.
| Rougher Ag Conc. | Rougher Pb Conc. | Scavenger Pb Conc. | Tailing | Total | ||
|---|---|---|---|---|---|---|
| Ag | Yield (%) | 7.57 | 8.76 | 7.8 | 75.87 | 100 |
| Content of total Ag a (g/t) | 1289.28 | 475.47 | 208.38 | 27.1 | 177 | |
| Recovery of total Ag (%) | 54.98 | 23.5 | 9.33 | 12.19 | 100 | |
| Pb | Yield (%) | 7.57 | 8.76 | 7.8 | 75.87 | 100 |
| Content of total Pb (%) | 4.35 | 13.64 | 4.87 | 1.33 | 2.96 | |
| Recovery of total Pb (%) | 11.25 | 40.7 | 13.21 | 34.84 | 100 |
a Units in g/t.
Table 4.
The recovery rate of Ag (%).
| Rougher Ag Conc. | Rougher Pb Conc. | Scavenger Pb Conc. | Tailing | Total | |
|---|---|---|---|---|---|
| Natural-Ag | 84.36 | 5.15 | 2.01 | 8.48 | 100 |
| Ag2AsS2 | 16.71 | 56.31 | 18.49 | 8.49 | 100 |
| AgCl | 82.14 | 8.77 | 3.51 | 5.58 | 100 |
| PbS | 88.78 | 1.92 | 0.92 | 8.38 | 100 |
| SiO2 & Silicate | 21.35 | 31.46 | 16.71 | 30.48 | 100 |
Conc. is short for Concentration.
Table 5.
The recovery rate of Pb (%).
| Rougher Ag Conc. | Rougher Pb Conc. | Scavenger Pb Conc. | Tailing | Total | |
|---|---|---|---|---|---|
| PbSO4 | 14.65 | 40.81 | 13.49 | 31.05 | 100 |
| PbS | 90.39 | 1.87 | 1.00 | 6.74 | 100 |
| PbCO3 | 2.36 | 61.87 | 16.86 | 18.91 | 100 |
| Pb5(P/As/VO4)3Cl | 9.92 | 14.51 | 14.25 | 61.32 | 100 |
| (PbFe6(OH)12SO4)4 | 5.69 | 85.03 | 4.13 | 5.15 | 100 |
Table 6.
Results of the industrial closed-circuit test.
| Ag | Pb | ||||
|---|---|---|---|---|---|
| Yield (%) | Content (g/t) | Recovery (%) | Content (%) | Recovery (%) | |
| Ag conc. | 5.97 | 1988 | 57.89 | 4.8 | 9.25 |
| Pb conc. | 7.76 | 786 | 29.75 | 23.4 | 58.46 |
| Tailing | 86.27 | 29 | 12.36 | 1.2 | 32.29 |
Publisher’s Note: MDPI stays neutral with regard to jurisdictional claims in published maps and institutional affiliations. |
© 2021 by the authors. Licensee MDPI, Basel, Switzerland. This article is an open access article distributed under the terms and conditions of the Creative Commons Attribution (CC BY) license (https://creativecommons.org/licenses/by/4.0/).
Share and Cite
MDPI and ACS Style
Zhang, Y.; Chen, J. Sulfidizing Behavior of Complex Lead-Silver Ore: A Flotation Study. Minerals 2021, 11, 434. https://doi.org/10.3390/min11040434
AMA Style
Zhang Y, Chen J. Sulfidizing Behavior of Complex Lead-Silver Ore: A Flotation Study. Minerals. 2021; 11(4):434. https://doi.org/10.3390/min11040434
Chicago/Turabian StyleZhang, Yibing, and Jianhua Chen. 2021. "Sulfidizing Behavior of Complex Lead-Silver Ore: A Flotation Study" Minerals 11, no. 4: 434. https://doi.org/10.3390/min11040434
Note that from the first issue of 2016, this journal uses article numbers instead of page numbers. See further details here.