Article

Alkali-Hydrothermal Treatment of K-Rich Igneous Rocks for Their Direct Use as Potassic Fertilizers

1
Geology & Sustainable Mining Department, Mohammed VI Polytechnic University, Benguerir 43150, Morocco
2
Geosciences Montpellier, Université de Montpellier & CNRS, 30095 Montpellier CEDEX 05, France
3
Polydisciplinary Faculty of Taza, Sidi Mohamed ben Abdallah University, B.P. 1223 Taza-Gare, Taza, Morocco
*
Author to whom correspondence should be addressed.
Minerals 2021, 11(2), 140; https://doi.org/10.3390/min11020140
Submission received: 1 January 2021 / Revised: 25 January 2021 / Accepted: 26 January 2021 / Published: 30 January 2021

Abstract

:
Due to the increasing demand for conventional sources of potassium (K) and their inaccessibility by African countries, K-rich igneous rocks are increasingly studied as potential alternative sources. In this study, six potassic igneous rocks (syenites and trachytes) from the Tamazeght, Jbel Boho, Ait Saoun, and El Glo’a regions (Morocco) were sampled and characterized. Then they were hydrothermally treated to enhance their K release for potential use as potassic fertilizers. The raw materials are mainly formed by microcline (up to 74%), orthoclase (20–68%), albite (36–57%), biotite-muscovite (15–23%), and titanite, calcite, hematite, and apatite as accessory minerals. These samples were crushed and milled to reach a particle size <150 µm and mixed with 4 N NaOH solution in an autoclave. The liquid/solid (L/S) ratio was about 44 mL/50 g. The powders were allowed to react with the solution at 170 °C for 7 h. For all tests, NaOH reacted completely with the powders and no liquid was observed after the treatment. X-ray diffraction (XRD), thermal gravimetric analysis (TGA), infrared spectroscopy (IRTF), and scanning electron microscopy (SEM-EDS) were carried out on treated samples to characterize the mineralogical and structural changes due to the alkali-hydrothermal treatment. Indeed, the treated samples revealed the presence of sodic neoformed phases such as thermonatrite, sodalite, analcime, and cancrinite. The treated material was leached for a week using deionized water and the elements released were measured using inductively coupled plasma–atomic emission spectroscopy (ICP-AES). The hydrothermal process showed a strong effect on structure breakdown as well as on the release of K and other nutrients such as P, Fe, Si, Mg, and Ca. Therefore, the alkali-hydrothermal treatment allowed the release of 50.5 wt% K. Moreover, the release of Mg, Ca, Fe, P, K, and Si were significantly increased. Mg, Ca, Fe, P, K, and Si release within raw materials was about (0.5–3.6), (3.5–31.4), (0.01–0.4), (0.01–0.3), (20–55), and (4.6–8) mg/kg, respectively, whereas treated samples showed a higher release of these elements. Quantitatively, Mg, Ca, Fe, P, K, and Si releases were about (10–11.8), (60–70), (7–20), (1.2–15), (218–1278), and (1119–2759) mg/kg, respectively. Consequently, the treated igneous rocks (syenite and trachyte) could be directly used as potassic fertilizers that would also be a source of other nutrients.

1. Introduction

Soil fertility decline is increasingly problematic for many countries mainly in Africa by limiting their crop production and endangering their food security [1,2,3]. This major issue is caused mostly by constant nutrient depletion without using enough quantities of fertilizers to replenish soils [3]. Potassium, which is the third essential element for plant growth, tends to be particularly deficient in African soils [4]. Considering that a potassium deficiency can severely affect plant growth through its involvement in root development, plant growth, and the disease resistance of crops [5,6], applying potassium-rich fertilizers becomes extremely vital. However, access to conventional fertilizers is difficult and expensive especially for African countries where small-scale and family agriculture still occupies a large place [7,8]. Indeed, more than 80% of the world’s production of conventional potassium (potash) is provided mainly by five countries (Canada, Belarus, Russia, China, and Germany) [9]. Additionally, conventional fertilizers have a significant environmental footprint due to the huge amount of waste generated during production and the salinity issues caused by their intensive leaching [4,8]. Consequently, these constraints warrant a strong need to explore new sources of potassium as alternatives to potash fertilizer conventionally sourced from evaporite deposits.
The strong need to find unconventional sources is not new. Some researchers have paved the way since 1894 by proposing natural rocks as solutions [10]. Recent research focused on the use of K-bearing silicate rocks such as glauconitic sandstone, mica, sericite, ultrapotassic syenite, and phonolite [9,11,12,13,14,15,16,17]. These K- rich-bearing silicate rocks could serve as “stone foodstuff” because they are composed of minerals containing potassium and other macronutrients—beneficial elements required by plants such as calcium (Ca), magnesium (Mg), silicon (Si), and iron (Fe). However, silicate minerals such as K-feldspar (KAlSi3O8) are characterized by a low dissolution rate that is not only extremely low compared to evaporitic potash but also does not allow having enough bioavailable potassium [18]. Indeed, this is due to their crystalline structure built by silicon-oxygen tetrahedron (SiO4)4− and aluminum-oxygen tetrahedron (AlO4)5− where potassium ions are found within the void structure to preserve the electrical neutrality of the system. Thus, this configuration leads to a solid network structure that inhibits potassium availability [15,19,20,21]. Consequently, to enhance potassium release, the crystal matrix of feldspar must be destroyed or at least altered [9]. Various methods have been proposed from the mechanical process to hydrothermal treatment including bioleaching, chemical leaching, alkali fusion, and roasting [22,23,24,25,26]. Particle size distribution is recognized as a key factor of mineral reactivity [27]. Mechanical activation by grinding increases the specific surface area and may cause lattice distortion, leading to the breakage of mineral structures [28,29,30]. Then, grinding followed by thermal treatment and leaching are the most commonly used methods for potassium extraction from alumina-silicate minerals [18,31]. This method, also called hydrothermal treatment, helps accelerate chemical weathering. Different additives have been used, such as NaNO3, MgSO4, CaCO3, CaCl2, NaCl, NaOH, CaO(OH)2, K2CO3, Ca3(PO4)2, and Na2CO3 [13,32,33,34]. For instance, Liu et al. (2019b) and Wang et al. (2018) studied the recovery of potassium from potassic syenite, which contain 10.38% and 12.46% K2O, respectively [25,35]. Their results demonstrated the effectiveness of NaOH as an additive in an average temperature of 220 °C and particle sizes ranging between 74 and 150 µm. Other authors such as Liu et al. (2012), Su et al. (2015), Ciceri and Allanore (2019), and Ciceri et al. (2020) also led experiments with CaO, NaOH, KOH, CaCO3, and CaSO4 under an average temperature varying between 200 and 290 °C [36,37,38,39] for a reaction time between 0.5 and 8 h and a particle size ranging from 74 to 250 µm. These authors showed that hydrothermal treatment is effective for K release.
To ensure food security and reduce the gap between supply and demand in African countries in particular, igneous rocks are evaluated for application as a fertilizer. It is the first time that these methods are applied in Morocco and Africa in general. Additionally, although many authors used high temperature for hydrothermal treatment and acid decomposition for the leaching test, in this study the effectiveness of the alkali-hydrothermal treatment to enhance K release was investigated at a relatively low temperature and water was used as solvent for the leaching. Potassium-rich silicate rocks from several locations in Morocco (Anti-Atlas and Central High Atlas) were collected. The raw samples were ground and then alkali-hydrothermally treated. The alkali-hydrothermal treatment consisted of heating the mixture of powder rock and NaOH in an autoclave at 170 °C for 7 h. The mass ratio was about 1.87. Later, the contribution of the alkali-hydrothermal treatment was evaluated using mineralogical and chemical characterizations (optical microscopy, XRD, SEM-EDS, TGA, FTIR, X-ray fluorescence (XRF), Inductively coupled plasma-atomic emission spectroscopy (ICP-AES) and leaching tests.

2. Materials and Methods

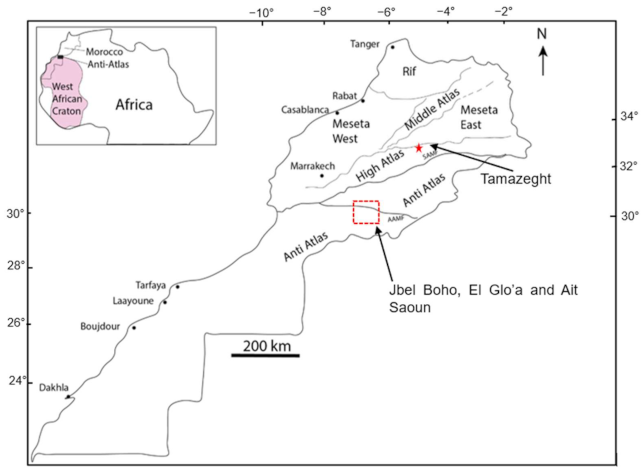
2.1. Geological Description

2.1.1. High Atlas Tamazeght Alkaline Massif

Tamazeght alkaline complex is situated in the northern side of the Central High Atlas 20 km south of the city of Midelt, Morocco (Figure 1). It shows an elliptical massif stretched 17 km over a total area of 70 km2. This Eocene complex (ca. 33–44 Ma) is emplaced into an extensional graben structure and composed of a wide range of lithological facies varying from ultramafic to felsic alkaline-peralkaline rocks that are associated with carbonatites [40,41]. Among these lithologies, potassic-rich rocks can be found such as feldspathoidal syenites and trachytes [42].

2.1.2. Anti-Atlas Jbel Boho, El Glo’a, and Ait Saoun Complexes

The Jbel Boho alkaline magmatic complex is located in the SE part of the Bou-Azzer Precambrian inlier (Moroccan Anti-Atlas; Figure 1). This complex covers an area of about 15 × 5 km that consists of an important alkaline volcanic series from the early Cambrian Age intruded by a significant syenite intrusion attributed to the Cambrian Age as well (ca. 534 Ma) [43,44]. The syenitic body occurs as 0.8–1.5 km-wide and 1.5–2.5 km-long intrusions, trending in a NE–SW direction. This pluton ranges between quartz and olivine syenites. The alkaline volcanic series, on the other hand, varies from basanites/tephrites, trachyandesites, and trachytes-trachydacites to alkaline rhyolites [45].
The volcanic complex of El Glo’a is a volcano-sedimentary series of 100–200 m of thickness that belongs litho-stratigraphically to the Jbel Boho alkaline unit (Figure 1). Various rocks can be found in this complex such as basalt, pyroclastic breccias, pyroclastic tuffs, and trachytes. The pyroclastic tuffs represent the most abundant facies and are present at the base of the dolomitic sequence of the Adoudou formation [46,47]. Syenite occurrences are also reported in the area [48].
Further to the north of Jbel Boho at 30 km, the Ait Saoun sub-alkaline magmatic complex is located at the SW end of the Saghro inlier in the Agdz region (Moroccan Anti-Atlas; Figure 1). The volcanic activity of this complex consists of two lower basaltic and andesitic-basalt flows interbedded in the upper part of the basal massive conglomerate, and upper felsic lavas and tuffs surmounted by the Adoudou formation [48,49]. Ait Saout displays a large variety of rock types, including basalts, andesitic basalts, andesites, porphyritic dacites, rhyolites, and ignimbrites [50,51,52].

2.2. Methods

2.2.1. Petrographic and Mineralogical Characterizations

Six magmatic rock samples of Moroccan magmatic complexes cited above were investigated through integrated petrographic and mineralogical studies (Figure 1). The samples comprise Tamazeght TS01, TS10, and TS14; Jbel Boho JB16; Ait Saoun AS01; and El Glo’a EL01. For the petrographic study of the polished thin sections, we used standard microscope Leica DM 2700P in the laboratory GeoAnalyticLab in the Geology and Sustainable Mining department (UM6P: Mohammed VI Polytechnic University, Benguerir, Morocco). The samples were crushed and thin sections in powders were made to evaluate the petrographic variation between raw and treated material. The mineralogical composition of studied samples was determined by X-ray diffraction using a Bruker D8 Advance diffractometer equipped with two X-ray sources (Cu and Mo) at the MSN-UM6P laboratory. The powders were scanned over a diffraction angle (2θ) ranging between 5 and 70°. The scan steps were 0.02° 2θ step size and 1 s counting time per step. Identification and quantification of major crystalline minerals were done using X’expert Highscore software (3.0.5, Almelo, The Netherlands) with the crystallography open database (COD 2013), and the detection limit was around 1–5% [53,54]. This implies that minerals in lower proportions could be present without being detected by XRD. At the same laboratory, the scanning electron microscopy (SEM) images were obtained at a 10.0 kV accelerating voltage using the Zeiss microscopy EVO 10 model. Rock powder was gold coated and the morphological features of the material were evaluated under secondary electron while BackScattered Electron (BSE) and Energy Dispersive Spectrometry (EDS) modes were used to show the chemical contrast and quantification.

2.2.2. Physical and Chemical Characterization

The particle size distribution of solid samples was analyzed by wet dispersion using Malvern Mastersizer 2000G (Malvern Instruments Ltd., Malvern, UK). The specific surface area was directly determined by the equipment software (version5.12F) and recalculated through Mbonimpa (2002) equations for granular materials. The spread of the particle size curves is given by the coefficient of uniformity (i) whereas the curvature coefficient is used to describe the different shapes of the particle size curves (ii):
Cu = D60/D10
Cc = D302/D10*D60
D10, D30, and D60 effective particle diameters correspond to 10%, 30%, and 60% passing on the cumulative grain size distribution curve, respectively.
The whole-rock major chemical compositions of the studied samples were obtained by X-ray fluorescence (XRF) using a PANalytical Epsilon 4 (Malvern Instruments Ltd., Malvern, UK) spectrometer. Loss on ignition (LOI) was calculated according to the weight before and after samples were burned at (950 °C) for 60 min [55].
LOI950 = 100*[(mo − mf)/mo]; mo is the dry weight of the sample before combustion and mf is the dry weight of the sample after heating.
The chemical index of weathering (CIW) is commonly used to characterize the weathering profile. However, CIW may yield a very high value for K-rich rock whether it is chemically weathered or not, because it does not take into account Al associated with K-feldspar [56]. In this study, CIW was used to determine the alterability of rocks to allow a better understanding and prediction of leaching behavior. This index is calculated through the formula
CIW = [100*(Al2O3)/(Al2O3 + CaO + Na2O)]
Thermogravimetric analysis (TGA) of the hydrothermal product was used to track the material behavior throughout the process. The analysis was conducted in the temperature range of 26–900 °C under nitrogen gas with a heating rate of 10 °C/min using discovery TGA. Fourier-transform infrared spectrometry (FTIR) was conducted using a Perkin Elmer in the range of 650–4000 cm−1 on transmittance mode.

2.2.3. Alkali-Hydrothermal Treatment and Leaching Tests

Alkali-hydrothermal treatment on the studied samples consisted of heating the mixture of NaOH and milled raw samples at 170 °C for 7 h. The mass ratio was about 1.87 and NaOH normality was about 4 N. The mixture was placed in a 100 mL stainless steel autoclave that was internally Teflon coated. After each treatment, the treated sample was deagglomerated using a mortar grinder mill and then dried at 70 °C.
Chemical species release from raw and treated samples was evaluated using leaching tests. Indeed, 4 g of solid samples were leached by 40 mL of deionized water for 1 week. The leachates were filtered to 0.45 µm and then analyzed for their pH and electrical conductivity using a pH and conductivity meter (METTLER TOLEDO, Greifensee, Switzerland). Then the chemical composition of the filtered leachates was analyzed using ICP-AES (Perkin Elmer Optima 3100 RL, Waltham, MA, USA) after sample acidification with 0.3% v/v HNO3.

3. Results

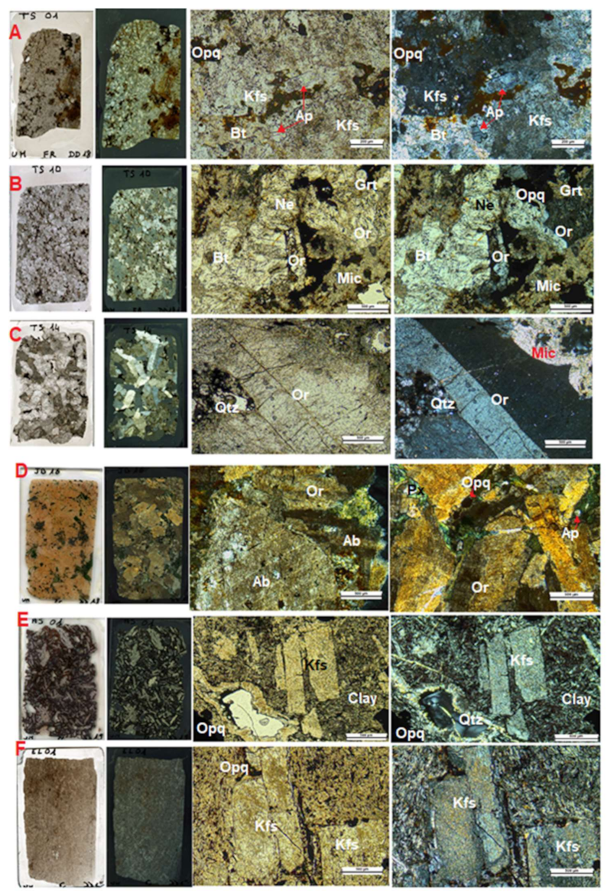
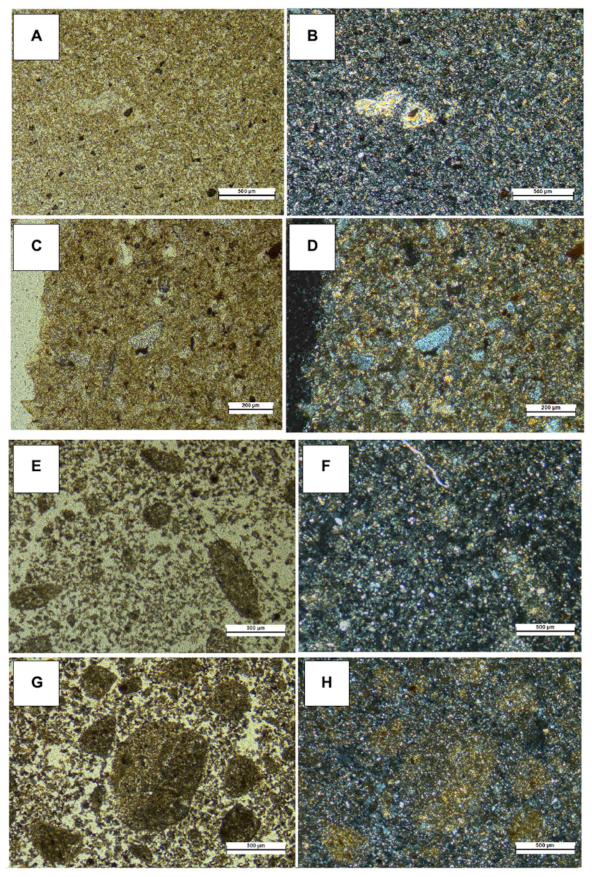
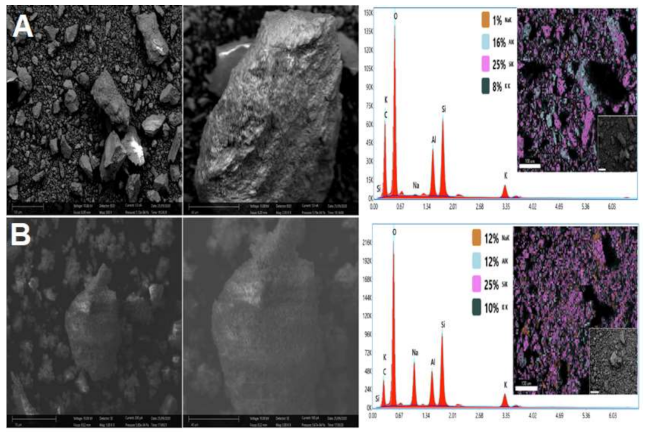
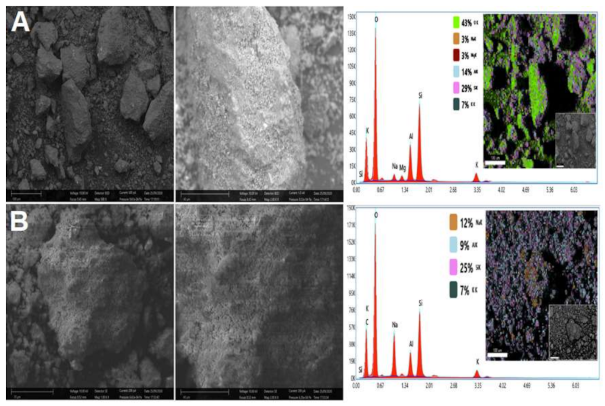
3.1. Petrographic Description

All samples from the Tamazight alkaline complex occurred as coarse-grained syenites, displaying post-magmatic fractures and alteration (Figure 2). The sample TS14 contained mainly euhedral to subhedral K-feldspar crystals (orthoclase: up to 60 vol.% of the rock) up to 1 cm in size, which were slightly altered and fractured. It was also composed of a greyish destabilized mineral phase (up to 25–30 vol.%) (old feldspathoids, e.g., relict nepheline) that was completely transformed to clay minerals. Albite, titanite, quartz, ferri-sodic pyroxene, carbonates, garnet, Fe-Ti oxides, apatite, and zircon were the main accessory minerals. Compared to TS14, TS01 and TS10 were strongly altered syenites in which all ferromagnesian minerals (e.g., pyroxene, biotite) were replaced by Fe-oxides. Subhedral to anhedral crystals of K-feldspar (orthoclase and microcline) were abundant and reached 50–60 vol.% of the rock. These K-bearing minerals were strongly sericitized and kaolinized. Nepheline, biotite, plagioclase, quartz, carbonates, titanite, garnet, Fe-Ti oxides, apatite, and zircon were also present.
On the other hand, the Jbel Boho JB16 was a coarse-to-porphyritic grained reddish syenite (Figure 2, Table 1). About 80 vol.% of the rock was composed of euhedral to subhedral kaolinized and sericitized crystals feldspar centimetric in size, with albite being more abundant than K-felspar. Quartz and ferromagnesian minerals (biotite or pyroxene) were omnipresent. Fe-Ti oxides, carbonate, apatite, and zircon were also present. The Ait Saoun AS01 possessed a porphyritic texture and a potassic trachyte signature (Figure 2, Table 1). It was composed mainly of euhedral K-felspar (microcline), minor euhedral to subhedral quartz, and plagioclase phenocrysts (up to 1 cm in size), which constituted up to 20 vol.% of the rock. Fine-to-coarse-grained groundmass (~80 vol.%) wrapping phenocrysts were made up mainly of microcline ~0.1–0.3 mm in size. Quartz, Fe-Ti oxides, and clay minerals were also observed. There were also some cavities filled by chalcedony.
The El Glo’a was a fine-grained trachyte with rare phenocrysts (Figure 2, Table 1). The sample presented microlites of K-feldspar (orthoclase) and opaque minerals 10–30 μm in size. There were also small brownish relict grains that could be assigned to ancient pyroxene or amphibole.
A thin section was also made for only one finely crushed rock (TS10: raw and hydrothermal material) and the petrographic observation confirmed the major change in terms of grain size, texture, and shape (Figure 3). The raw material exhibited an equigranular fine texture with indeterminable crystal phases. However, the treated material displayed some textural change due to the addition of NaOH; a neoformed subhedral to euhedral mineral appeared in a sandy matrix.

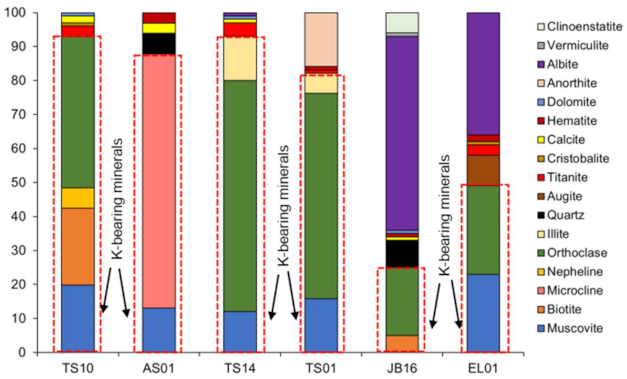
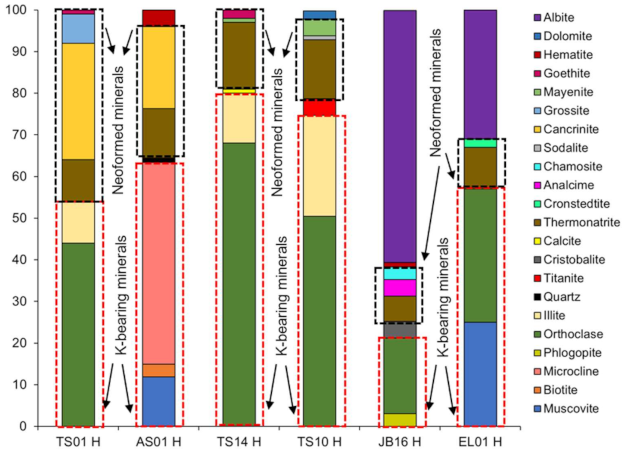
3.2. Mineralogical and Structural Characteristics

The mineralogical composition of the studied samples is presented in Figure 4 (XRD patterns are shown in supplementary materials, Figures S1–S6). The studied samples were composed mainly of orthoclase, microcline, albite, muscovite, biotite, and anorthite, which confirmed the results of the petrographic observations (Figure 2). Based on the profile fitting method, quantitatively the orthoclase content ranged between 20 wt% for JB16 and 68 wt% for TS14. Microcline was only detected in the AS01 sample and account for 74 wt% of the rock. Muscovite was found in all samples and ranged from 12 wt% for TS14 to 23 wt% for EL01, whereas albite represented the major phase in JB16 and EL01. Moreover, titanite, cristobalite, dolomite, and calcite were detected in minor amounts.
The mineralogical composition of the hydrothermally treated rocks is presented in Figure 5. Potassic feldspar (orthoclase, microcline) and sodic feldspar (albite) remained the main phases within the treated samples. However, each sample presented the same new mineral in different proportions: sodium carbonate, called thermonatrite (Na2CO3H2O), whereas zeolites (analcime and sodalite) were detected as a minor phase in JB16H and TS10H. Cancrinite represented a significant constituent of AS01H. Additionally, minor products such as chamosite and cronstedtite resulting from hydrothermal alteration of pyroxene, amphibole, and biotite were found in JB16H and EL01H. Other products such as mayenite and grossite were found in TS10H, TS14H, and TS01H.
SEM photographs (Figure 6 and Figure 7) revealed a significant change in the morphology compared to the original surface of the raw material. K-feldspar exhibited intense alteration, which was confirmed by the EDS spectra of the different samples. For better visualization of the EDS images and a good characterization of the various changes that took place, only some elements are shown even if other elements are present. Going from raw to treated material, both samples became sightly enriched in K but their Na content differed strongly (from 1% to 12% in TS01 and from 3% to 12% in EL01).

3.3. Physical and Chemical Characteristics

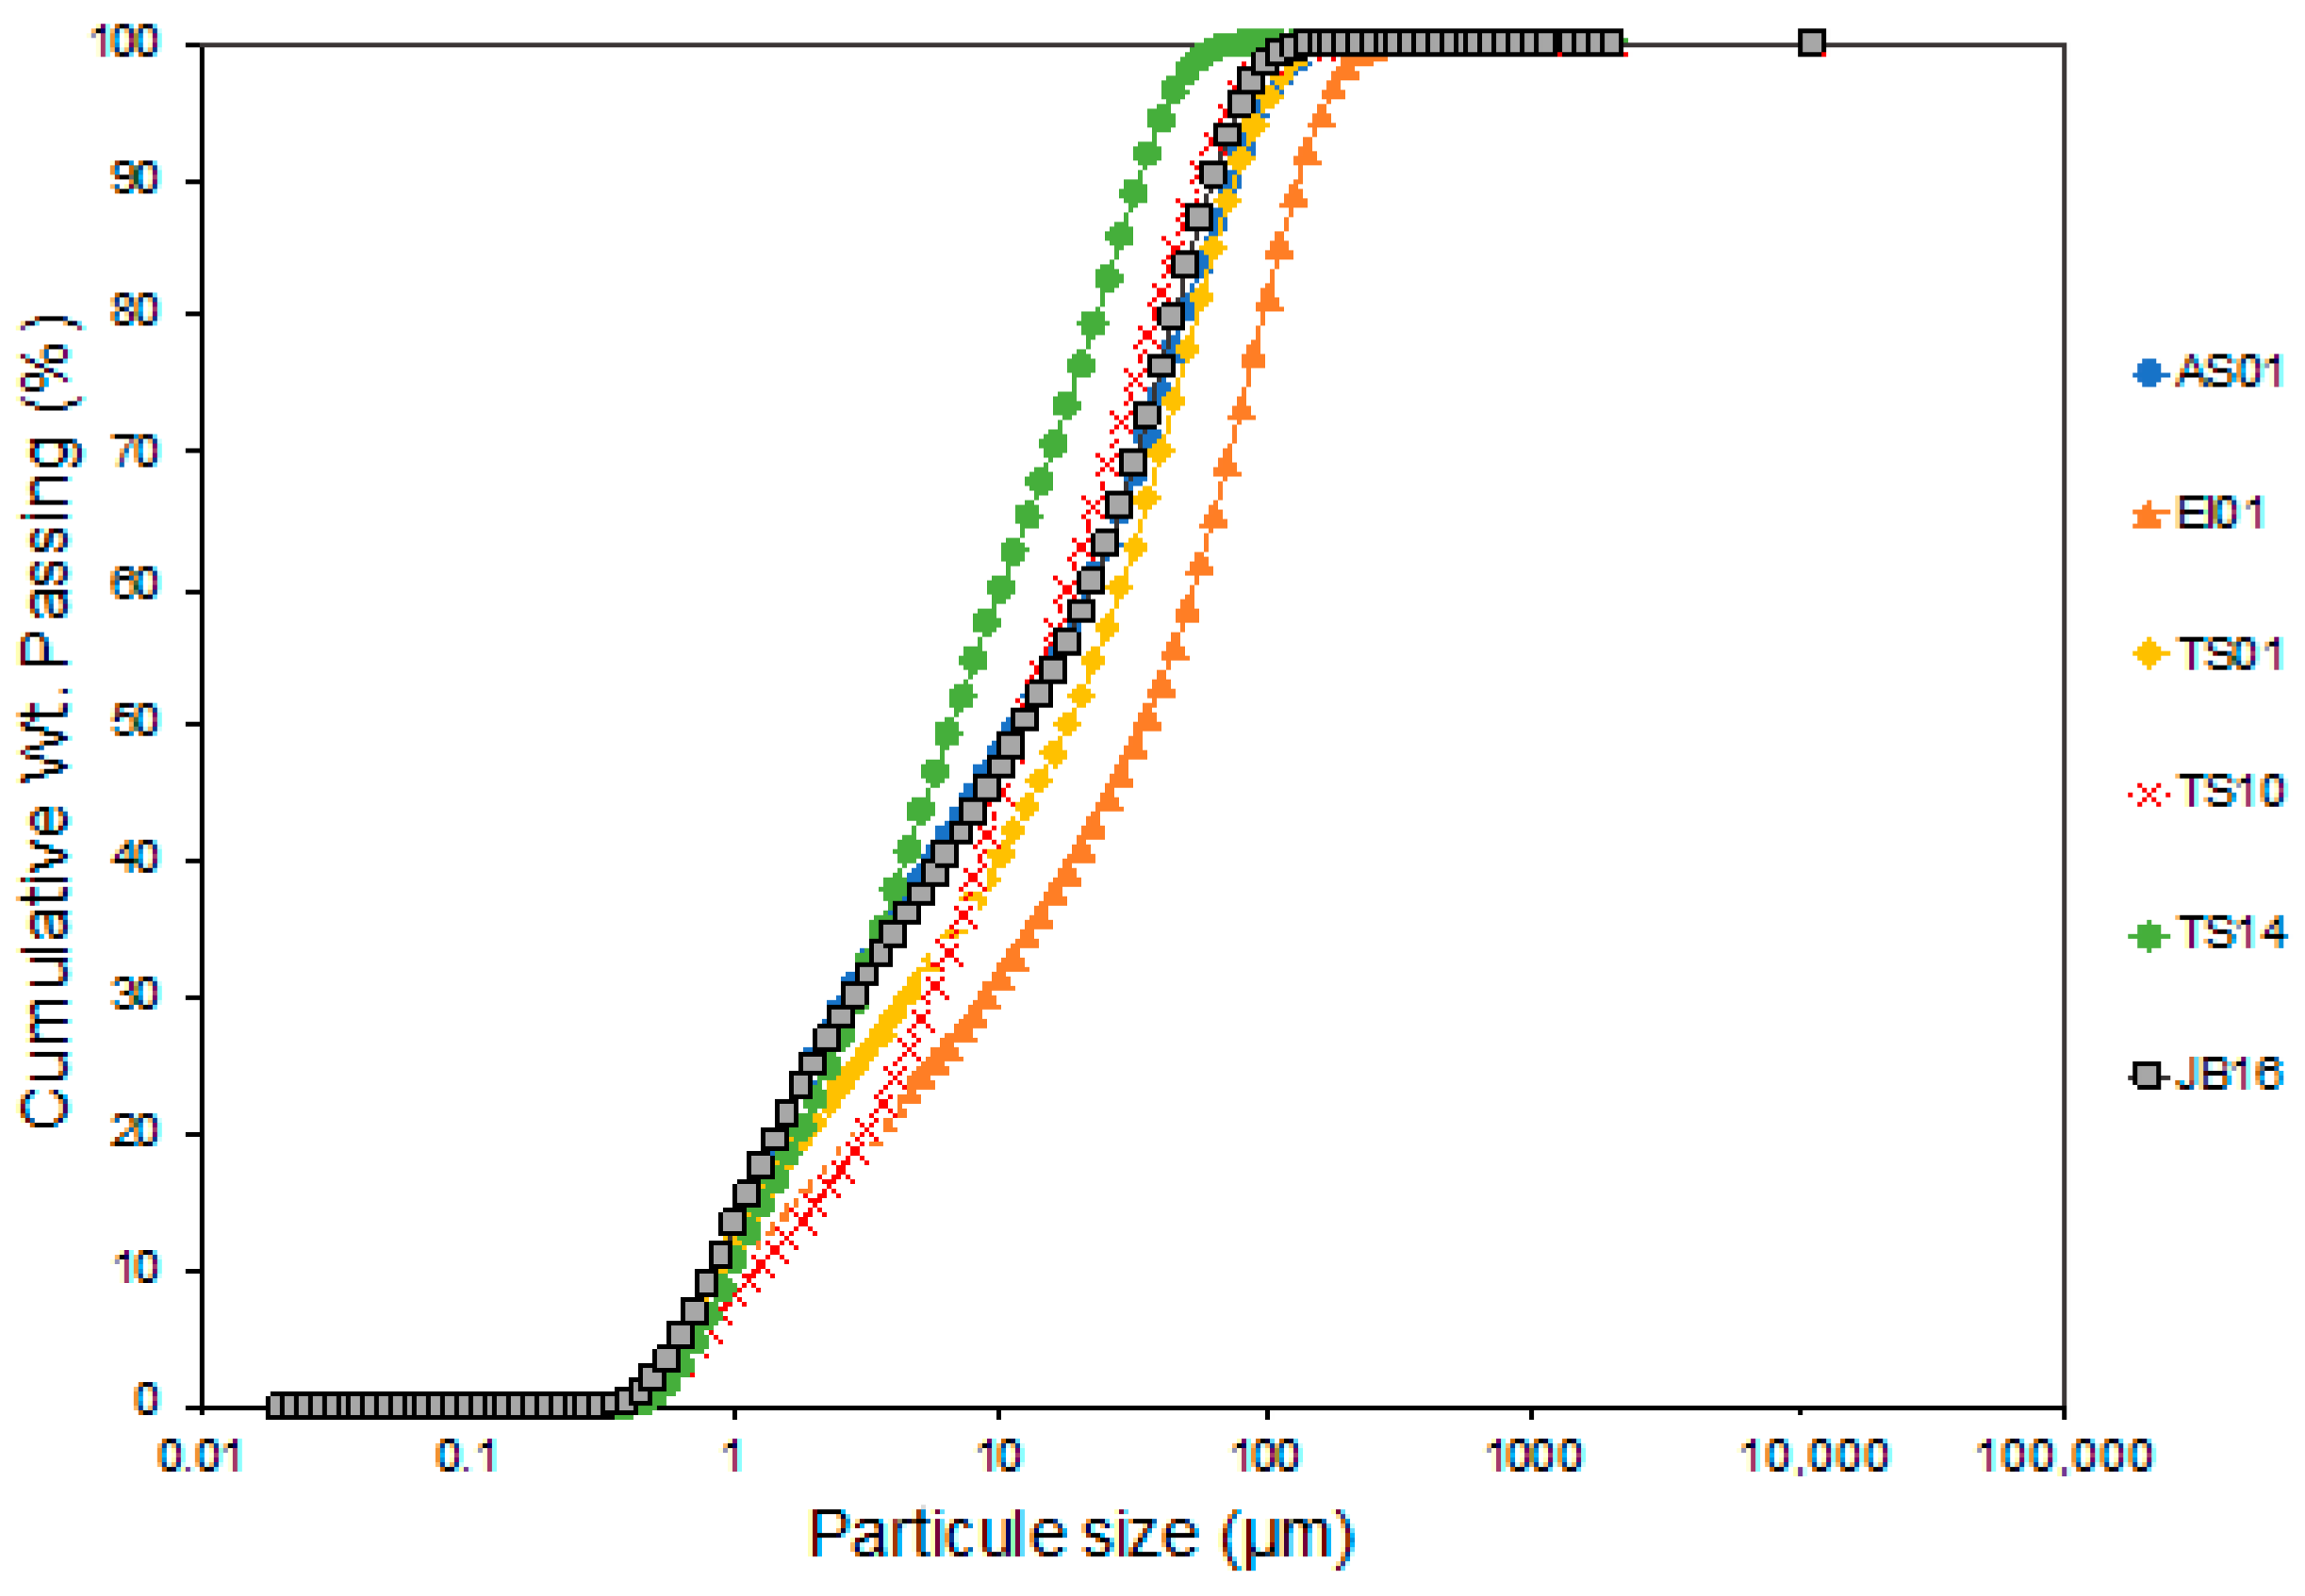
3.3.1. Physical Characteristics

Particle size reduction increases the available specific surface area and consequently the reactivity of solid materials [57]. The particle size distribution (PSD) of raw sample powders is shown in Figure 8. Indeed, D90, which corresponded to 90% passing on the cumulative PSD curve, was about 71.5, 130.9, 62.2, 75.1, 55.1, and 32.8 µm for AS01, EL01, JB16, TS01, TS10, and TS14, respectively. Similarly, D50, which corresponded to 50% passing on the cumulative particle size distribution curve, ranged between 6.5 and 34.3 µm. Consequently, the specific surface area (SSA) ranged from 1.48 to 2.18 m2/g. Similarly, the uniformity coefficient (Cu) ranged between 10 and 50, whereas the curvature coefficient (Cc) was less than 3 for the studied samples. These results show that the particle sizes were well spread, without predominance of any particular fraction. The studied samples also show a relatively similar surface specific area (SSA), uniformity coefficient, and coefficient of curvature, implying that their behavior in these experiments could be comparable.

3.3.2. Chemical Characteristics

The whole-rock geochemistry shows that the rocks were generally peraluminous and the major elements were SiO2 and Al2O3. Other elements such as TiO2, MnO, MgO, CaO, Na2O, and P2O5 were marginally present. SiO2 contents were higher than 50 wt% in all studied samples (Table 2). The K2O content ranged from 5.7 wt% to 13.3 wt%. The chemical index weathering (CIW) showed different alterability of rocks, identifying TS10 followed by TS14 samples to be potentially more alterable than others.
Based on the petrographic observations (Table 1), some factors favored K leaching, such as texture, fracture, weathering, K-bearing mineral content, and particle size. However, all materials had a similar particle size and almost the same texture. Then mineralogy, texture, fracturing, and alterability (CIW) were taken into account for the following proposed leaching ranking Equation (2):
TS10 > TS14 > AS01 > TS01 > EL01 > JB16

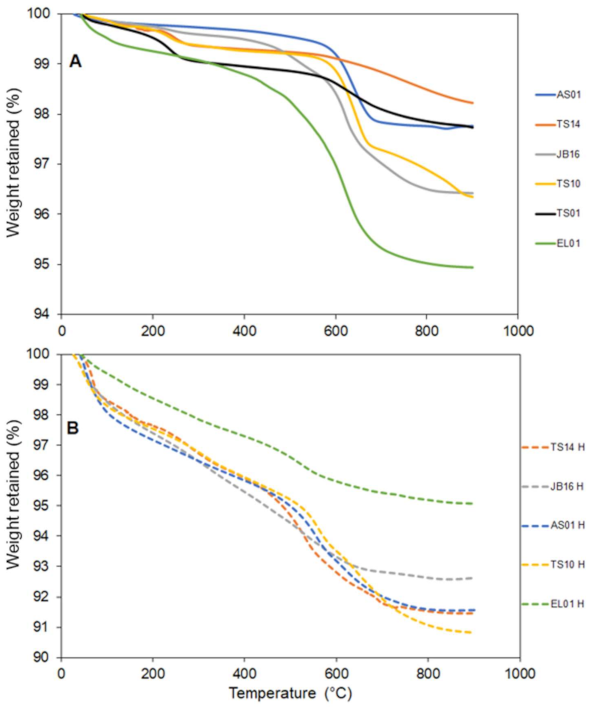
3.4. Thermogravimetry Analysis (TGA)

Thermo gravimetric analysis (TGA) is used to investigate the thermal stability or behavior of a material in different atmospheres (inert in this study). The shown curves (Figure 9) represent the weight change in the samples (TS14, TS10, TS01, AS01, JB16, EL01, and their hydrothermal equivalent) as a function of temperature.
As an overall trend, it can be seen that for all samples, the weight decreased gradually with temperature. However, for raw material different behavior can be distinguished: TS14 and TS01 showed the first loss of 0.8% at 225 °C, followed by a second weight loss of 1.5% from 225 °C to 880 °C. EL01 showed a mass loss of 1.56% at 489 °C, followed by a second weight loss of 3.12% from 489 °C to 720 °C. AS01 and JB16 looked almost similar, with weight losses of 2.37% and 2.8%, respectively. Concerning hydrothermal material, the sample behaviors tended to be more homogenous, except for EL01H, which showed a mass loss of 3.35% at 490 °C and 1.6% from 490 °C to 881 °C. The result of raw materials corroborated the loss of ignition, whereas the mass loss was higher for hydrothermal material. Weight loss can be used as an indirect estimate of the reactions that occur: The greater the loss, the more reaction products are formed. Thus, the significant weight loss of the treated material supports the XRD, which showed a wide variety of neoformed minerals.

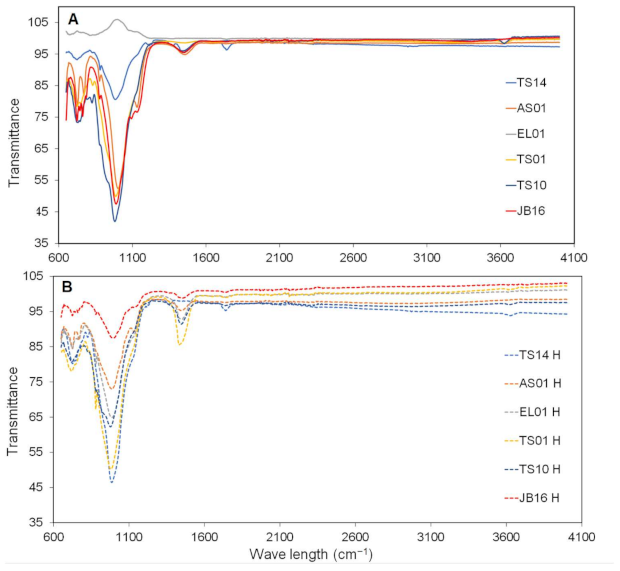
3.5. Fourier-Transform Infrared (FTIR)
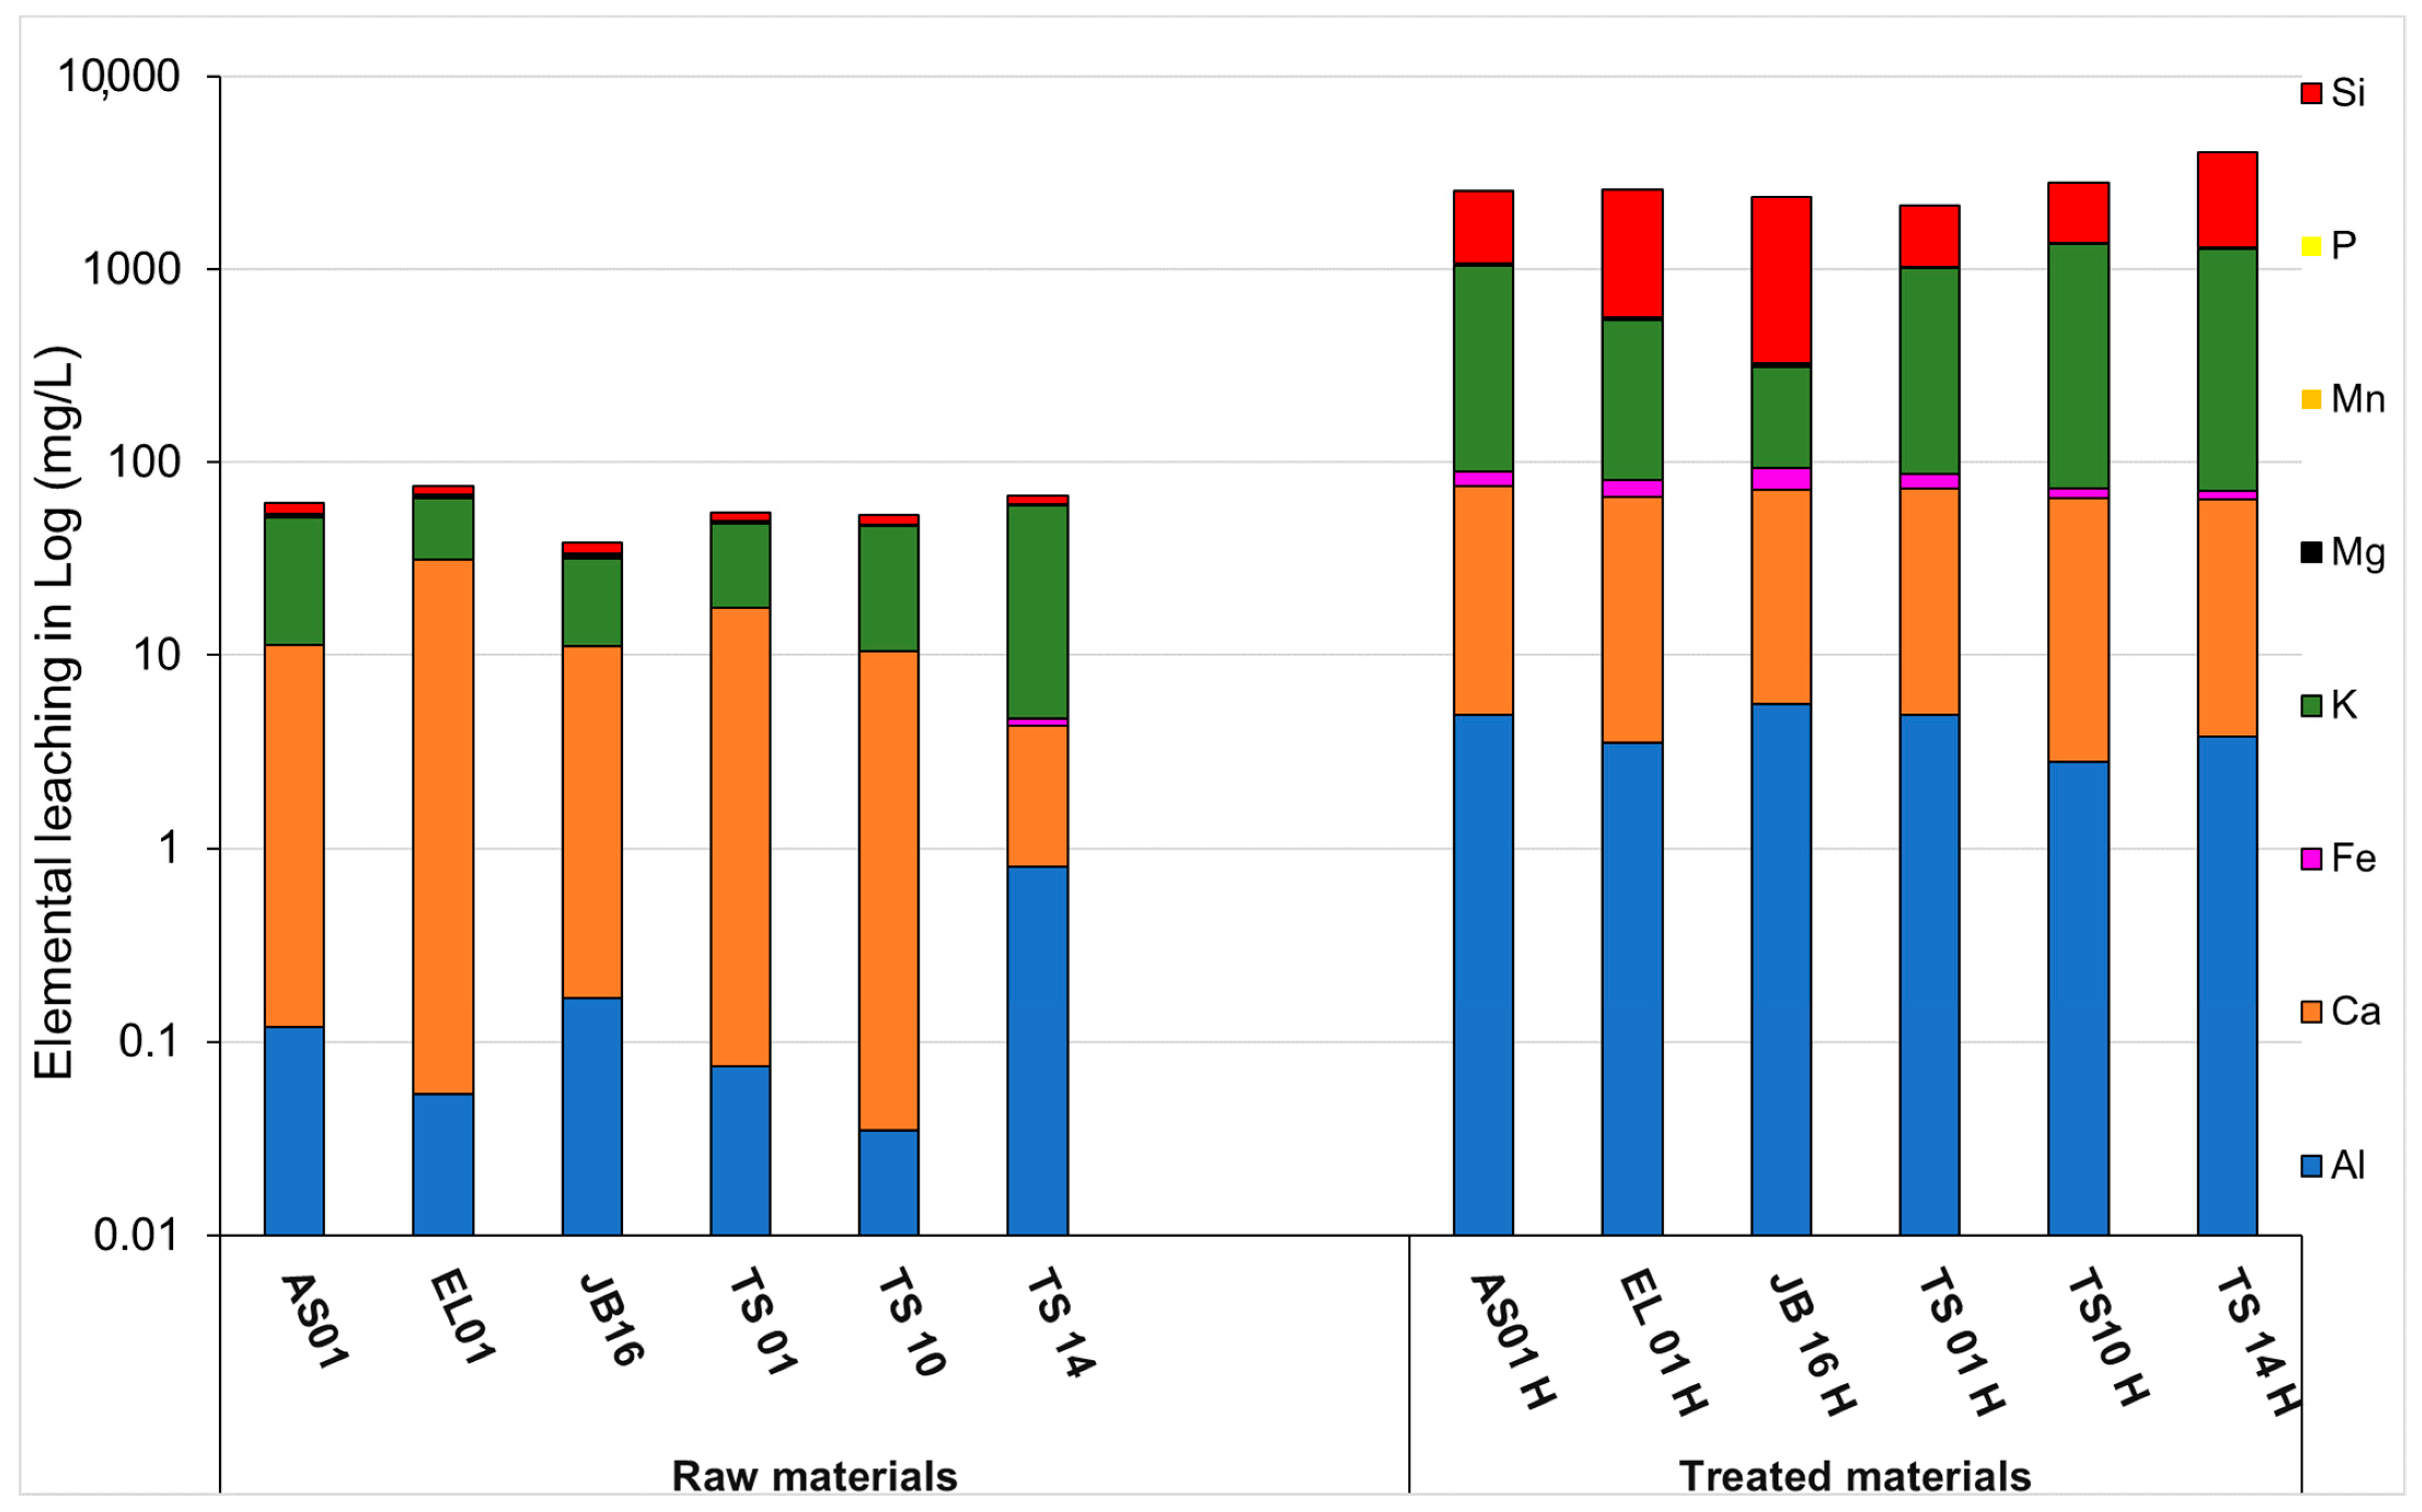
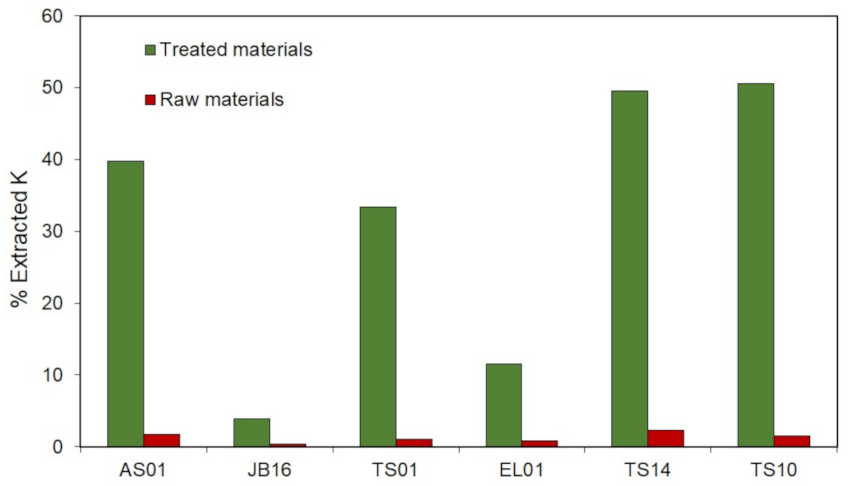
The structural analysis of raw and hydrothermal material done by XRD and TGA was further complemented by detailed FTIR analysis. Spectra of the raw sample powders (TS01, TS10, TS14, JB16, AS01, EL01) and their corresponding treated samples in the wavenumber range of 650–4000 cm−1 are shown in Figure 10. As the samples presented almost the same behavior and deformations occurred at a different wavelength, absorption bands were observed at 727, 1050, 1456, and 1742 cm−1 and were assigned as follows: The bands 727 and 1050 cm−1 were assigned to Si-(Al)Si and Si(Al)-O stretching vibrations, respectively, and 1742 cm−1 bands were attributed to the H-O-H bending mode of molecular water (zeolite water). Blanco (1989), Kanepit (1995), and Brittaposnatzki (2003) [58,59,60] associated this band with the bending vibrations of oxonium ions H3O+ in the cancrinite. Compared to the raw material, the hydrothermal samples exhibited strong peaks at band 1456 cm−1, which can be attributed to the stretching vibration of C=O [61]. The absorption band at 1456 cm−1 in treated material could be attributed to the change in mineral structure and the embedding of NaOH. These results confirm the presence of carbonate groups and are in agreement with the XRD results showing the presence of a thermonatrite phase.

3.6. Leaching Tests

The results of pH and electrical conductivity (EC) analyses of the leachates from the raw and treated samples are presented in Table 3. The treated samples generated basic leachates with pH values ranging between 12.1 and 12.6, whereas the raw materials generated circumneutral leachates with pH values comprising between 8.6 and 9.2. The electrical conductivity was higher for treated samples compared to the raw material. Higher EC indicates higher chemical loads. Indeed, the EC within treated samples was around 19,000 µS/cm. These high values might be explained by the release of chemical species from the treated samples.
The leaching of each sample (mg/L) is graphically displayed in Figure 11 (data in Table S1, Supplementary Materials). The macronutrients released, including Ca, Mg, K, and Si are higher for the treated samples than for the raw samples. The treated material also exhibits the release of Fe, P, and Al in low proportions. Potassium and silicon are the most released elements by the hydrothermal treatments. Quantitatively, raw material shows a Si and K release of about 8.2, 7, 4.6, 5.4, 5.5, and 6.2 (mg/L), and 40.7, 33.3, 20.7, 30.7, 36.7, and 55.3 (mg/L) for AS01, EL01, JB16, TS01, TS10, and TS14, respectively. Concerning the treated samples, Si and K concentrations are about 1483.1, 2018, 2048.1, 1119.6, 1473, and 2759.6 (mg/L) and 959.4, 469.5, 218.6, 932.3, 1278.5, and 1206.5 (mg/L) for AS01H, EL01H, JB16H, TS01H, TS10H, and TS14H, respectively.
Although water might not be similar to realistic soil conditions (less aggressive than soil), both materials were able to release potassium and the extraction percentages are given in Figure 12 (data in Table S2. Potassium extraction efficiency was less than 3% for raw samples but it reached 50.5% for treated samples. It can also be noted that in the leaching for raw samples, potassium release was correlated to initial potassium content; the higher the potassium content is, the higher the release is. However, this correlation was not observed for treated samples.

4. Discussion

Mineralogical characterization showed the formation of a thermonatrite after the hydrothermal treatment. Thermonatrite may indicate carbonation and its major peaks formed at 2θ angles of 32.3 and 37.8°. This mineral resulted from a chemical reaction between sodium hydroxide and carbon dioxide (Equation (3)). It was formed during hydrothermal treatment at a low temperature (100 °C, 130–160 °C) and such peaks were observed in some studies when using kaolinite, fly ash, and volcanic ash [62,63,64,65,66]. Regardless of the used raw aluminosilicate materials, analcime and sodalite are high-temperature zeolites whose formation promotes the release of K in solution (Equations (4) and (5)) [35,37]. However, Hackbarth et al. (1999) proved that an intermediate phase between cancrinite and sodalite can appear with NaOH (C = 4 N) at a low temperature (T = 80 °C) [66].
2NaOH + CO2 → Na2CO3 + H2O
KAlSi3O8 + Na+ + H2O → Na2AlSi2O6H2O + HSiO3 + K+
6KAlSi3O8 + 8Na+ + 14OH- + 2H2O → Na8Al6Si6(OH)2·2H2O + 12HSiO3 + 6K+
From raw to treated materials, samples become highly enriched in Na content, which confirms the formation of thermonatrite. SEM images of hydrothermal samples seem to be similar to the homogenous pseudohexagonal crystal of hydroxy-sodalite generated at almost the same experimental conditions by Esaifan et al. (2017, 2019) [67,68]. However, despite other zeolites having been identified in low amounts by XRD, no clear characteristic morphology of these crystals has been observed in SEM. Some studies already proved that K-feldspar (microcline) forms other phases (well-crystallized zeolite) when hydrothermally treated using NaOH as an additive with various concentrations at high temperatures [35,69]. Chen et al. (2017) and Liu et al. (2019) used natrolite syenite and potassic syenite mainly composed of microcline, biotite, natrolite, muscovite and microcline, plagioclase, quartz, respectively [35,69]. Although their mineralogy was close to our trachyte and syenite composition, zeolites were not well observed probably due to the low concentration of NaOH and the low temperature under which the treatments were carried out.
Chemical species releases from raw and treated samples were variable (Figure 11). This can be explained by variation in terms of particle size distribution, initial rock alteration, initial K content, and mineralogical composition. Concerning the particle size, the uniformity coefficient was chosen because it takes into account two different diameters (D10 and D60), which is more accurate than one particle size for spread distribution. Uniformity coefficient (Cu) showed a strong negative linear correlation with the extracted potassium (Table 4). Potassium release decreased with the increase in particle size. Even though few samples were compared, this result confirms the relationship between grain size and dissolution highlighted by Elghali et al. (2019) [27].
Table 4 presents the correlation matrix between leached K (Ke) and initial K content (Ki), Cu, and CIW. However, it is important to mention that the actual potassium content in the rock takes into account K feldspars (orthoclase, microcline) and other K-bearing minerals such as biotite, illite, nepheline, phlogopite, and muscovite. The prediction of K release was performed using CIW as the alterability parameters and initial potassium content of the samples. The two parameters showed a strong positive correlation, implying that the higher the initial K content (Ki) and alterability are, the higher the K release of a sample is. The observed value shows that going from raw to hydrothermally altered material, the correlation between released potassium (Ke) and CIW increased from 0.81 to 0.91, whereas the correlation between potassium extracted (Ke) and initial K content (Ki) went from 0.9 to 0.96. Thus, the initial content in the rock of minerals bearing K and their alterability have a significant effect on the release of potassium.
Plants require at least six elements for normal growth (primary nutrients: N, P, and K, and secondary elements: Ca, Mg, and S) [70]. However, it is also important to consider not only increasing the amount of nutrients in the soil, but also improving the quality of the soil after applying fertilizer [71]. Indeed, if these hydrothermally treated materials are applied to the soil, Ca, Fe, Mg, and Si are released. Ca has a role in maintaining physical properties of soil and a liming effect in acidic soils [71]. Calcium also contributes to soil fertility by maintaining good aeration [72]. Additionally, Mg behaves as an enzyme activator and constituent of chlorophyll, and silicon (Si) helps to stimulate plant growth and alleviate various biotic–abiotic stresses [70,73]. Silicon also influences the availability and accumulation of mineral nutrients in the soil. Meanwhile, Fe is most beneficial for calcareous and alkaline soils [71,73,74]. Despite the fact that petrography observations and CIW values were not able to accurately predict the leaching behavior of raw samples, they were effective for treated materials that followed the petrography hypothesis proposed in Equation (5). This implies that when hydrothermally treated, some factors favor K leaching. Regarding the thermodynamic stability, Manning (2010) already proved that biotite and phlogopite (K- and Mg-bearing minerals) and muscovite, nepheline, and K-feldspar (K-bearing minerals) have different dissolution rates. Nepheline and biotite present the highest dissolution rates [75]. Therefore, since the kinetics of mineral dissolution reactions control the availability of nutrients, it can be expected that materials that include them will release more K. Textures directly related to nucleation and crystal growth could also affect the rate of K leaching. Thus, a microlitic texture should have a faster leaching rate than coarse grain. The TS10 sample showed the highest leaching result, probably because of its varied mineralogy (Figure 4). Indeed, it contained nepheline and biotite, which are known for their higher dissolution rate than orthoclase or microcline. Kump et al. (2000) and Marshak (2015) highlighted that the degree of polymerization also influences the stability of the mineral structure [76,77]. Consequently, as seen in Table 2, SiO2 content showed good correlation with potassium extracted—the higher the silica content was, the less potassium was released from the samples. Compared to the results reported by other authors, the extraction percentages obtained in this study were low mainly due to the slightly lower temperature, but it is still interesting to take into account that water was used as a solvent and the leaching time was one week [35,78,79].
Furthermore, it must be noted that the products obtained by hydrothermal treatment seem entirely appropriate as fertilizers, providing both essential nutritional needs and improving the quality conditions of soils. In addition to being good nutrients sources, potassic silicate rocks could also be good liming materials. Indeed, soil acidity makes some nutrients less available and Al and Mn mobile and toxic [8,80]. Acidity can also damage the propitious environment for bacteria and other soil organisms, affect the nitrogen fixation, and make the soil exposed to erosion [79]. Left untreated, soil acidification can negatively impact agricultural productivity and sustainable farming systems. Acidification can also spread to the subsoil layers, causing serious problems to the plant roots, thereby affecting the supply of water and nutrients [81]. Thus, to restore acidic soils, liming increases the soil pH and limits Fe, Al, and Mn reactivity; promotes an environment for microbial activity; reduces leaching losses of potassium; stimulates the decomposition of soil organic matter; and enhances nitrogen fixation [81,82]. In this study, aluminum (Al) was also present among the leached elements. In general, Al exists in all soils, but its toxicity is mainly restricted to acid environments. When the pH drops below 5.5, Al3+ ions are dissolved and become highly phytotoxic [83,84]. Although for many plants Al is toxic when its concentration is greater than 2–3 ppm with pH < 5.5, it is also important to mention that Al resistance depends on the type of crop [85,86,87]. For instance, in Brazil, where climatic conditions are similar to those in Africa, a threshold of 45 to 50 ppm has been set as the limit above which no cultivation is possible and 5 to 10 ppm as the limit below which there are practically no issues of toxicity [88]. Therefore, our rocks, although releasing aluminum, were well below the toxicity limit, with 5.6 ppm as the maximum content for JB16H. For raw materials, Al content lay between 0.03 ppm and 0.8 ppm, whereas the treated samples released 4.9, 3.5, 5.6, 4.9, 2.8, and 3.8 ppm of Al for AS01H, EL01H, JB16H, TS01H, TS10H, and TS14H, respectively. Indeed, these fertilizers could be more suitable for tropical regions where soils are acidic, and a humid climate prevails. However, due to the high sodium (Na) content in the treated samples, it would be advisable to explore a new reagent for application as a fertilizer. In fact, Na is harmless in small amounts and can be beneficial for plant metabolism [89]. In contrast, at high levels, Na can affect the soil physical properties by promoting deflocculation and soil dispersion [90]. These issues reduce the permeability of soil to air and water infiltration, increase runoff and soil erosion, and reduce hydraulic conductivity [91,92]. Leonardos (1987, 2000) and Gillman (2001, 2002) demonstrated the positive effects of using potassic and ultra-potassic rocks in degraded soils where long-term benefits are needed [93,94,95,96]. These slow-release rocks could reduce the mineral residue (elements not used by plants) accumulated in the soil. However, consideration should be given to the efficiency of nutrient utilization by plants when applying them. Nevertheless, the effectiveness of these products should be confirmed by conducting agronomic trials at the greenhouse scale in comparison with conventionally used fertilizers. In addition, raw materials (K-rich igneous rocks) offer the advantage of being geographically well distributed compared to conventionally used fertilizers, allowing access to locally available resources.
Moreover, conventional fertilizers cause several issues related to their environmental footprint. Potash resources are mainly located in five countries (Canada, China, Belarus, Russia, and Germany). Consequently, African countries must import their needs, which can have serious environmental impacts. Thus, producing fertilizers based on available and local resources may improve the overall sustainability of agronomic activities [97].

5. Conclusions

Potassium-rich silicate rock could serve as an alternative to conventional potash resources. These rocks are advantageous because they are more locally available and contain macronutrients, micronutrients, and beneficial elements required for plant growth. In addition to K, they also provide the plant and soil with other elements such as Ca, Fe, Mg, S, P, and Si.
In this study, six samples coming from four regions in Morocco (Tamazeght, Jbel Boho, Ait Saoun, and El Glo’a) were investigated. Samples were first crushed and milled at D90 < 130 µm, then mixed with NaOH and treated at T = 170 °C for 7 h. The final product was leached for one week using water as a solvent. The comparison between raw and hydrothermal material was evaluated using various techniques, such as XRD, TGA, FTIR, and SEM-EDS. ICP-MS allowed for the quantification of the potassium released in the solution. The following conclusions can be drawn from these experimental conditions:
1.
These results confirm again the importance of petrography and alterability for predicting the leaching behavior of K-bearing rock;
2.
K-rich rock needs to be hydrothermally treated before any application as fertilizer because hydrothermal treatment significantly enhances the release of potassium and other beneficial elements through the substitution ion mechanism;
3.
Temperature, the initial potassium content of the rock, alterability, and particle size are found to be important factors controlling the K release; and
4.
The approach used in this study provides a significant amount of sodium through the neoformed Na mineral, so it would be interesting to explore additives other than NaOH for further application in the fertilizer industry.

Supplementary Materials

The following are available online at https://www.mdpi.com/2075-163X/11/2/140/s1, Figure S1: XRD pattern of trachyte-treated samples EL01 and EL01H, Figure S2: XRD pattern of trachyte-treated samples JB16 and JB16H, Figure S3: XRD pattern of trachyte-treated samples TS10 and TS10H, Figure S4: XRD pattern of trachyte-treated samples TS14 and TS14H, Figure S5: XRD pattern of trachyte-treated samples TS01 and TS01H, Figure S6: XRD pattern of trachyte-treated samples AS01 and AS01H, and Table S1: Leaching tests results of treated and raw materials. A–B: raw material, C–D: hydrothermal material, and Table S2: Potassium extraction percentage for each material (raw and treated samples).

Author Contributions

Conceptualization, A.M., A.E., and O.R.; methodology, A.E. and O.R.; validation, O.R., A.E., and M.O.; formal analysis, A.M. and A.E.; investigation, A.M., A.E., and O.R.; data curation, A.M. and A.E.; sampling: H.E.M., O.R., and M.O.; writing—original draft preparation, A.M.; writing—review and editing, A.M., O.R., A.E., and M.O.; supervision, J.-L.B., A.E., and O.R.; project administration, J.-L.B. and O.R.; funding acquisition, O.R. All authors have read and agreed to the published version of the manuscript.

Funding

This research was financially supported by the “accord spécifique OCP-UM6P no 23.”

Institutional Review Board Statement

Not applicable.

Informed Consent Statement

Not applicable.

Data Availability Statement

Data is contained in supplementary material.

Acknowledgments

The authors would like to thank all the members of the MSN department (Material Sciences & Nano-engineering) of Mohammed VI Polytechnic University who generously allowed us access to their analytic equipment.

Conflicts of Interest

No potential conflict of interest was reported by the authors.

References

  1. Manning, D.A. How will minerals feed the world in 2050? Proc. Geol. Assoc. 2015, 126, 14–17. [Google Scholar] [CrossRef]
  2. Ciceri, D.; Allanore, A. Local fertilizers to achieve food self-sufficiency in Africa. Sci. Total. Environ. 2019, 648, 669–680. [Google Scholar] [CrossRef]
  3. Nail, K.P. Soil fertility and nutrient management. In Intelligent Soil Management for Sustainable Agriculture: The Nutrient Buffer Power Concept; Springer International Publishing: Cham, Switzerland, 2019; pp. 165–189. [Google Scholar]
  4. Sheldrick, W.F.; Lingard, J. The use of nutrient audits to determine nutrient balances in Africa. Food Policy 2004, 29, 61–98. [Google Scholar] [CrossRef]
  5. Cakmak, I. The role of potassium in alleviating detrimental effects of abiotic stresses in plants. J. Plant Nutr. Soil Sci. 2005, 168, 521–530. [Google Scholar] [CrossRef]
  6. Rawat, J.; Sanwal, P.; Saxena, J. Potassium and Its Role in Sustainable Agriculture. In Potassium Solubilizing Microorganisms for Sustainable Agriculture; Meena, V.S., Maurya, B.R., Verma, J.P., Meena, R.S., Eds.; Springer Science and Business Media LLC: New Delhi, India, 2016; pp. 235–253. Available online: http://link.springer.com/10.1007/978-81-322-2776-2_17 (accessed on 3 July 2020).
  7. Sanchez Pedro, A. Soil Fertility and Hunger in Africa. Science 2002, 295, 1–2. [Google Scholar] [CrossRef] [PubMed] [Green Version]
  8. Van Straaten, P. Farming with rocks and minerals: Challenges and opportunities. Acad. Bras. Ciênc. 2006, 78, 731–747. [Google Scholar] [CrossRef] [PubMed] [Green Version]
  9. Tanvar, H.; Dhawan, N. Kinetic and thermodynamic study of potassium recovery from silicate rocks. Min. Process. Extr. Met. 2019, 1–13. [Google Scholar] [CrossRef]
  10. Hensel, J. Bread from Stones; AJ Tafel: Philadelphia, PA, USA, 1894; 148p. [Google Scholar]
  11. Jena, S.; Dhawan, N.; Rao, D.; Misra, P.; Mishra, B.; Das, D. Studies on extraction of potassium values from nepheline syenite. Int. J. Min. Process. 2014, 133, 13–22. [Google Scholar] [CrossRef]
  12. Jena, S.K.; Misra, P.K.; Das, B. Studies on Extraction of Potassium from Feldspar by Roast-leach Method Using Phosphogypsum and Sodium Chloride. Min. Process. Extr. Met. Rev. 2016, 37, 323–332. [Google Scholar] [CrossRef]
  13. Jena, S.K.; Dash, N.; Samal, A.K.; Misra, P.K. Competency of chlorination roasting coupled water leaching process for potash recovery from K-feldspar: Mechanism and kinetics aspects. Korean J. Chem. Eng. 2019, 36, 2060–2073. [Google Scholar] [CrossRef]
  14. Kumanan, M.; Sathya, G.; Nandakumar, V.; Berchmans, L.J. Extraction of potah from K-Feldspar mineral by acid and molten salt leaching process. Chem. Eng. 2016, 7, 1–10. [Google Scholar]
  15. Kumar, G.; Tanvar, H.; Pratap, Y.; Dhawan, N. Thermal and Mechanical Activation of Sericite for Recovery of Potash Values. Trans. Indian Inst. Met. 2018, 72, 17–25. [Google Scholar] [CrossRef]
  16. Samantray, J.; Anand, A.; Dash, B.; Ghosh, M.K.; Behera, A.K. Nepheline Syenite—An Alternative Source for Potassium and Aluminium. In Rare Metal Technology; Azimi, G., Kim, H., Alam, S., Ouchi, T., Neelameggham, N.R., Baba, A.A., Eds.; Springer International Publishing: Cham, Switzerland, 2019; pp. 145–159. Available online: http://link.springer.com/10.1007/978-3-030-05740-4_15 (accessed on 28 January 2020).
  17. Schimicoscki, R.; Oliveira, K.; Ávila-Neto, C.N. Potassium recovery from a Brazilian glauconitic siltstone via reaction with sulfuric acid in hydrothermal conditions. Hydrometallurgy 2020, 191, 105251. [Google Scholar] [CrossRef]
  18. Ciceri, D.; de Oliveira, M.; Stokes, R.M.; Skorina, T.; Allanore, A. Characterization of potassium agrominerals: Correlations be-tween petrographic features, comminution and leaching of ultrapotassic syenites. Miner Eng. 2017, 102, 42–57. [Google Scholar] [CrossRef]
  19. Chao, J.X.; Xia, J.P.; Yang, C.Q.; Zhang, Z.S.; Ren, X.J. Research on the Thermal Decomposition Process of K-Feldspar-CaSO4-CaO System. Adv. Mater. Res. 2013, 734–737, 916–920. [Google Scholar] [CrossRef]
  20. Jena, S.K.; Dash, N.; Rath, S.S. Effective utilization of lime mud for the recovery of potash from mica scraps. J. Clean. Prod. 2019, 231, 64–76. [Google Scholar] [CrossRef]
  21. Orosco, P.; Barrios, O.; Ojeda, M. Extraction of Potassium from Microcline by Chlorination. Minerals 2019, 9, 295. [Google Scholar] [CrossRef] [Green Version]
  22. Rajagopala, J.; Nayak, R.; Suryanarayana, R.A. Feldspar for potassium, fertilizers, catalysts and cement—Review. Asian J. Chem. 1998, 10, 690–706. [Google Scholar]
  23. Hongwen, M.A.; Jing, Y.A.N.G.; Shuangqing, S.U.; Meitang, L.I.U.; Hong, Z.H.E.N.G.; Yingbin, W.A.N.G.; Hongbin, Q.I.; Pan, Z.H.A.N.G.; Wengui, Y.A.O. 20 Years advances in preparation of potassium salts from potassic rock: A review. Geol. Soc. China 2015, 89, 2058–2071. [Google Scholar] [CrossRef]
  24. Zhong, Y.; Gao, J.; Chen, P.; Guo, Z. Recovery of Potassium from K-Feldspar by Thermal Decomposition with Flue Gas Desul-furization Gypsum and CaCO3: Analysis of Mechanism and Kinetics. Energy Fuels 2017, 31, 699–707. [Google Scholar] [CrossRef]
  25. Wang, Z.; Zhang, Q.; Yao, Y.; Jia, Y.; Xie, B. The extraction of potassium from K-feldspar ore by low temperature molten salt method. Chin. J. Chem. Eng. 2018, 26, 845–851. [Google Scholar] [CrossRef]
  26. Haseli, P.; Majewski, P.; Christo, F.C.; Hammond, B.; Bruno, F. Thermochemical and Experimental Kinetic Analysis of Potassium Extraction from Ultrapotassic Syenite Using Molten Chloride Salts. Ind. Eng. Chem. Res. 2019, 58, 7397–7407. [Google Scholar] [CrossRef]
  27. Elghali, A.; Benzaazoua, M.; Bussière, B.; Bouzahzah, H. Determination of the available acid-generating potential of waste rock, part II: Waste management involvement. Appl. Geochem. 2019, 100, 316–325. [Google Scholar] [CrossRef]
  28. Kleiv, R.; Thornhill, M. Production of mechanically activated rock flour fertilizer by high intensive ultrafine grinding. Min. Eng. 2007, 20, 334–341. [Google Scholar] [CrossRef] [Green Version]
  29. Zhang, Y.; Asselin, E.; Li, Z. Laboratory and Pilot Scale Studies of Potassium Extraction from K-feldspar Decomposition with CaCl2 and CaCO3. J. Chem. Eng. Jpn. 2016, 49, 111–119. [Google Scholar] [CrossRef]
  30. Singh, Y.P.; Tanvar, H.; Kumar, G.; Dhawan, N. Investigation of planetary ball milling of sericite for potash recovery. Powder Technol. 2019, 351, 115–121. [Google Scholar] [CrossRef]
  31. Wahyudi, A.; Wahyudi, T. A Literature Study of benefiting k-bearing silicate rocks as raw materials for potas-sium fertilizer. Indones. Min. J. 2013, 16, 10. [Google Scholar]
  32. Liu, J.-N.; Zhai, Y.-C.; Wu, Y.; Zhang, J.; Shen, X.-Y. Kinetics of roasting potash feldspar in presence of sodium carbonate. J. Cent. South Univ. 2017, 24, 1544–1550. [Google Scholar] [CrossRef]
  33. Miao, S.; Liu, Z.; Ma, H.; Han, B.; Du, J.; Sun, Z.; Miao, Z. Synthesis and characterization of mesoporous aluminosilicate molecular sieve from K-feldspar. Microporous Mesoporous Mater. 2005, 83, 277–282. [Google Scholar] [CrossRef]
  34. Santos, W.O.; Mattiello, E.M.; Da Costa, L.M.; Abrahão, W.A.P. Characterization of verdete rock as a potential source of potassium. Rev. Ceres 2015, 62, 392–400. [Google Scholar] [CrossRef] [Green Version]
  35. Liu, C.; Ma, H.; Gao, Y. Hydrothermal processing on potassic syenite powder: Zeolite synthesis and potassium release kinetics. Adv. Powder Technol. 2019, 30, 2483–2491. [Google Scholar] [CrossRef]
  36. Liu, Y.Q.; Xia, H.T.; Ma, H.W. Kinetics of Hydrothermal Decomposition of Potassium Feldspar with Calcium Hydroxide. Adv. Mater. Res. 2012, 549, 65–69. [Google Scholar] [CrossRef]
  37. Su, S.; Ma, H.; Chuan, X. Hydrothermal decomposition of K-feldspar in KOH–NaOH–H2O medium. Hydrometallurgy 2015, 156, 47–52. [Google Scholar] [CrossRef]
  38. Ciceri, D.; Allanore, A. Nutrient release from K-feldspar ore altered in hydrothermal conditions. Chem. Pap. 2019, 74, 431–440. [Google Scholar] [CrossRef]
  39. Ciceri, D.; De Oliveira, M.; Chen, D.P.; Allanore, A. Role of Processing Temperature and Time on the Hydrothermal Alteration of K-Feldspar Rock in Autoclave. Min. Met. Explor. 2020, 37, 955–963. [Google Scholar] [CrossRef]
  40. Marks, M.A.W.; Schilling, J.; Coulson, I.M.; Wenzel, T.; Markl, G. The Alkaline-Peralkaline Tamazeght Complex, High Atlas Mountains, Morocco: Mineral Chemistry and Petrological Constraints for Derivation from a Compositionally Heteroge-neous Mantle Source. J. Pet. 2008, 49, 1097–1131. [Google Scholar] [CrossRef] [Green Version]
  41. Bouabdellah, M.; Hoernle, K.; Kchit, A.; Duggen, S.; Hauff, F.; Klügel, A.; Lowry, D.; Beaudoin, G. Petrogenesis of the Eocene Tamazert Continental Carbonatites (Central High Atlas, Morocco): Implications for a Common Source for the Tamazert and Canary and Cape Verde Island Carbonatites. J. Pet. 2010, 51, 1655–1686. [Google Scholar] [CrossRef]
  42. Marks, M.A.W.; Neukirchen, F.; Vennemann, T.; Markl, G. Textural, chemical, and isotopic effects of late-magmatic carbonatitic fluids in the carbonatite–syenite Tamazeght complex, High Atlas Mountains, Morocco. Min. Pet. 2009, 97, 23–42. [Google Scholar] [CrossRef]
  43. Álvaro, J.J.; Ezzouhairi, H.; Vennin, E.; Ribeiro, M.; Clausen, S.; Charif, A.; Ayad, N.A.; Moreira, M. The Early-Cambrian Boho volcano of the El Graara massif, Morocco: Petrology, geodynamic setting and coeval sedimentation. J. Afr. Earth Sci. 2006, 44, 396–410. [Google Scholar] [CrossRef]
  44. Blein, O.; Baudin, T.; Chevremont, P.; Soulaimani, A.; Admou, H.; Gasquet, D.; Cocherie, A.; Egal, E.; Youbi, N.; Razin, P.; et al. Geochronological constraints on the polycyclic magmatism in the Bou Azzer-El Graara inlier (Central Anti-Atlas Morocco). J. Afr. Earth Sci. 2014, 99, 287–306. [Google Scholar] [CrossRef]
  45. Benaouda, R.; Holzheid, A.; Schenk, V.; Badra, L.; Ennaciri, A. Magmatic evolution of the Jbel Boho alkaline complex in the Bou Azzer inlier (Anti-Atlas/Morocco) and its relation to REE mineralization. J. Afr. Earth Sci. 2017, 129, 202–223. [Google Scholar] [CrossRef]
  46. Ducrot, J.; Lancelot, J.R. Problème de la limite Précambrien–Cambrien: Étude radiochronologique par la méthode U–Pb sur zircons du volcan du Jbel Boho (Anti-Atlas marocain). Can. J. Earth Sci. 1977, 14, 2771–2777. [Google Scholar] [CrossRef]
  47. Soulaimani, A.; Egal, E.; Razin, P.; Youbi, N.; Admou, H.; Blein, O.; Barbanson, L.; Gasquet, D.; Bouabdelli, M. Notice explicative carte géol. Maroc (1/50,000), feuille Al Glo"a. In Notes et Mémoires Serv. Géol. Maroc, N°532 bis; Soulaimani, A., Admou, H., Fekkak, A., Egal, E., Roger, J., Youbi, N., Razin, P., Blein, O., Baudin, T., Eds.; Anzar Conseil: Rabat, Maroc, 2013. [Google Scholar]
  48. Ait, A.; Ribeiro, M.L.; Charif, A.; Moreira, M.E.; Ezzouhairi, H.; Coke, C. Les volcanites d’Agdz (Ait Saoun, Anti-Atlas Central) et du Haut-Atlas occidental (Azegour et Adassil) marqueurs de l’extension crustale au passage precambrien termi-nal/cambrien au Maroc. Agadir 2005. Available online: https://www.researchgate.net/profile/Carlos_Coke/publication/266737089_Les_volcanites_dAgdz_Ait_Saoun_Anti_Atlas_Central_et_du_Haut_Atlas_Occidental_Azegour_et_Adassil_marqueurs_de_l’extension_crustale_au_passage_Precambrien_terminalCambrien_au_Maroc/links/5439d0300cf24a6ddb95dd19/Les-volcanites-dAgdz-Ait-Saoun-Anti-Atlas-Central-et-du-Haut-Atlas-Occidental-Azegour-et-Adassil-marqueurs-de-lextension-crustale-au-passage-Precambrien-terminal-Cambrien-au-Maroc.pdf (accessed on 18 August 2020).
  49. Boubker, C. Metallogenie Du Cuivre Associe Aux Roches Volcaniques D’age Precambrien Iii Superieur Dans L’anti-Atlas Marocain. 1996. Available online: https://www.unil.ch/files/live/sites/iste/files/shared/X.Library/PhD%20theses/Chebbaa%20Boubker%20(1996).pdf (accessed on 18 August 2020).
  50. Letsch, D.; Large, S.J.; Bernasconi, S.M.; Bernasconi, S.M.; Blattmann, T.M.; Klug, C.; Von Quadt, A. Northwest Africa’s Ediacaran to early Cambrian fossil record, its oldest metazoans and age constraints for the basal Taroudant Group (Morocco). Precambrian Res. 2019, 320, 438–453. [Google Scholar] [CrossRef]
  51. Ezzouhairi, H.; Ribeiro, M.L.; Ayad, N.A.; Moreira, M.E.; Charif, A.; Ramos, J.M.F.; De Oliveira, D.P.S.; Coke, C. The magmatic evolution at the Moroccan outboard of the West African craton between the Late Neoproterozoic and the Early Palaeozoic. Geol. Soc. Lond. Spéc. Publ. 2008, 297, 329–343. [Google Scholar] [CrossRef]
  52. Gasquet, D.; Levresse, G.; Cheilletz, A.; Azizi-Samir, M.R.; Mouttaqi, A. Contribution to a geodynamic reconstruction of the An-ti-Atlas (Morocco) during Pan-African times with the emphasis on inversion tectonics and metallogenic activity at the Pre-cambrian–Cambrian transition. Precambrian Res. 2005, 140, 157–182. [Google Scholar] [CrossRef]
  53. Nowak, S.; Lafon, S.; Caquineau, S.; Journet, E.; Laurent, B. Quantitative study of the mineralogical composition of mineral dust aerosols by X-ray diffraction. Talanta 2018, 186, 133–139. [Google Scholar] [CrossRef] [PubMed]
  54. Vollprecht, D.; Berger, M.; Altenburger-Junker, I.; Neuhold, S.; Sedlazeck, K.P.; Aldrian, A.; Dijkstra, J.J.; van Zomeren, A.; Raith, J.G. Mineralogy and Leachability of Natural Rocks–A Comparison to Electric Arc Furnace Slags. Minerals 2019, 9, 501. [Google Scholar] [CrossRef] [Green Version]
  55. Lechler, P.; Desilets, M. A review of the use of loss on ignition as a measurement of total volatiles in whole-rock analysis. Chem. Geol. 1987, 63, 341–344. [Google Scholar] [CrossRef]
  56. Price, J.R.; Velbel, M.A. Chemical weathering indices applied to weathering profiles developed on heterogeneous felsic met-amorphic parent rocks. Chem. Geol. 2003, 202, 397–416. [Google Scholar] [CrossRef]
  57. Priyono, J.; Gilkes, R.J. High-Energy Milling Improves the Effectiveness of Silicate Rock Fertilizers: A Glasshouse Assessment. Commun. Soil Sci. Plant Anal. 2008, 39, 358–369. [Google Scholar] [CrossRef]
  58. Blanco, C.; González, F.; Pesquera, C.; Benito, I.; Mendioroz, S.; Pajares, J.A. Differences Between One Aluminic Palygorskite and Another Magnesic by Infrared Spectroscopy. Spectrosc. Lett. 1989, 22, 659–673. [Google Scholar] [CrossRef]
  59. Kanepit, V.N.; Rieder, E.É. Neutron diffraction study of cancrinite. J. Struct. Chem. 1995, 36, 694–696. [Google Scholar] [CrossRef]
  60. Brittaposnatzki, M.F.; Buhl, J.-C. Characterization of basic cancrinite synthesized in a butanediol-water system. Eur. J. Min. 2003, 15, 589–598. [Google Scholar] [CrossRef]
  61. Nath, S.; Maitra, S.; Mukherjee, S.; Kumar, S. Microstructural and morphological evolution of fly ash based geopolymers. Constr. Build. Mater. 2016, 111, 758–765. [Google Scholar] [CrossRef]
  62. Wernert, V.; Schaef, O.; Aloui, L.; Chassigneux, C.; Ayari, F.; Chehimi, D.B.H.; Denoyel, R. Cancrinite synthesis from natural kao-linite by high pressure hydrothermal method: Application to the removal of Cd2+ and Pb2+ from water. Microporous Mesoporous Mater. 2020, 301, 110209. [Google Scholar] [CrossRef]
  63. Tchakoute, H.K.; Elimbi, A.; Kenne, B.D.; Mbey, J.A.; Njopwouo, D. Synthesis of geopolymers from volcanic ash via the alkaline fusion method: Effect of Al2O3/Na2O molar ratio of soda–volcanic ash. Ceram Int. 2013, 39, 269–276. [Google Scholar] [CrossRef]
  64. Marsh, A.; Heath, A.; Patureau, P.; Evernden, M.; Walker, P. Phase formation behaviour in alkali activation of clay mixtures. Appl. Clay Sci. 2019, 175, 10–21. [Google Scholar] [CrossRef]
  65. Kumar, S.; Kristály, F.; Mucsi, G. Geopolymerisation behaviour of size fractioned fly ash. Adv. Powder Technol. 2015, 26, 24–30. [Google Scholar] [CrossRef]
  66. Hackbarth, K.; Gesing, T.M.; Fechtelkord, M.; Stief, F. Synthesis and crystal structure of carbonate cancrinite Na8[AlSiO4]6COH3(H2O3)4, grown under low-temperature hydrothermal conditions. Microporous Mesoporous Mater. 1999, 30, 12. [Google Scholar] [CrossRef]
  67. Esaifan, M.; Hourani, M.; Khoury, H.N.; Rahier, H.; Wastiels, J.; Khoury, H.N. Synthesis of hydroxysodalite zeolite by alkali-activation of basalt powder rich in calc-plagioclase. Adv. Powder Technol. 2017, 28, 473–480. [Google Scholar] [CrossRef]
  68. Esaifan, M.; Warr, L.N.; Grathoff, G.; Meyer, T.; Schafmeister, M.T.; Kruth, A.; Testrich, H. Synthesis of Hydroxy-Sodalite/Cancrinite Zeo-lites from Calcite-Bearing Kaolin for the Removal of Heavy Metal Ions in Aqueous Media. Minerals 2019, 9, 484. [Google Scholar] [CrossRef] [Green Version]
  69. Chen, J.; Ma, H.; Liu, C.; Yuan, J. Synthesis of Analcime Crystals and Simultaneous Potassium Extraction from Natrolite Syenite. Adv. Mater. Sci. Eng. 2017, 2017, 1–9. [Google Scholar] [CrossRef] [Green Version]
  70. Korndörfer, G.; Lepsch, I. Chapter 7 Effect of silicon on plant growth and crop yield. In Studies in Plant Science; Elsevier: Amsterdam, The Netherlands, 2001; pp. 133–147. Available online: https://linkinghub.elsevier.com/retrieve/pii/S0928342001800112 (accessed on 23 December 2020).
  71. Henry, D.F. Fundamentas of Soils Science, 8th ed.; Library of congress cataloging in publication data; Michigan State University: East Lansing, MI, USA, 1991; 382p. [Google Scholar]
  72. Candito, M.D.; Silvestri, G.P. Calcium and Magnesium Fertilization of Processing Tomatoes; Advances in Horticultural Sciences, Vol.7; University of Florence: Florence, Italy, 1993; p. 5. [Google Scholar]
  73. Etesami, H. Can interaction between silicon and plant growth promoting rhizobacteria benefit in alleviating abiotic and biotic stresses in crop plants? Agric. Ecosyst. Environ. 2018, 253, 98–112. [Google Scholar] [CrossRef]
  74. Greger, M.; Landberg, T.; Vaculík, M. Silicon Influences Soil Availability and Accumulation of Mineral Nutrients in Various Plant Species. Plants 2018, 7, 41. [Google Scholar] [CrossRef] [PubMed] [Green Version]
  75. Manning, D.A. Mineral sources of potassium for plant nutrition. A review. Agron. Sustain. Dev. 2010, 30, 281–294. [Google Scholar] [CrossRef] [Green Version]
  76. Kump, L.R.; Brantley, S.L.; Arthur, M.A. Chemical Weathering, Atmospheric CO2, and Climate. Annu. Rev. Earth Planet. Sci. 2000, 28, 611–667. [Google Scholar] [CrossRef] [Green Version]
  77. Marshak, S. Earth: Portrait of A Planet, 5th ed.; W.W. Norton & Company: New York, NY, USA, 2015; 1p. [Google Scholar]
  78. Ma, X.; Yang, J.; Ma, H.; Liu, C.; Zhang, P. Synthesis and characterization of analcime using quartz syenite powder by alka-li-hydrothermal treatment. Microporous Mesoporous Mater. 2015, 201, 134–140. [Google Scholar] [CrossRef]
  79. Ma, X.; Yang, J.; Ma, H.; Liu, C. Hydrothermal extraction of potassium from potassic quartz syenite and preparation of alumi-num hydroxide. Int. J. Miner. Process. 2016, 147, 10–17. [Google Scholar] [CrossRef]
  80. Encyclopedia of Agrophysics. In Encyclopedia of Petroleum Geoscience; Springer Science and Business Media LLC: Berlin/Heidelberg, Germany, 2011.
  81. Curtin, D.; Smillie, G.W. Effects of liming on soil chemical characteristics and grass growth in laboratory and long-term field-amended soils. Plant Soil 1986, 95, 23–31. [Google Scholar] [CrossRef]
  82. Zdenko, R. Role of calcium in aluminium toxicity. New Phytol. 1992, 121, 499–513. [Google Scholar]
  83. Shen, R.F. Aluminum–Nitrogen Interactions in the Soil–Plant System. Front Plant Sci. 2018, 9, 15. [Google Scholar]
  84. Sade, H.; Meriga, B.; Surapu, V.; Gadi, J.; Sunita, M.S.L.; Suravajhala, P.; Kishor, P.B.K. Toxicity and tolerance of aluminum in plants: Tailoring plants to suit to acid soils. BioMetals 2016, 29, 187–210. [Google Scholar] [CrossRef] [PubMed]
  85. Rout, G.R.; Samantaray, S.; Das, P. Aluminium toxicity in plants: A review. Agronomie 2001, 21, 3–21. [Google Scholar] [CrossRef]
  86. Famoso, A.N.; Clark, R.T.; Shaff, J.E.; Craft, E.; McCouch, S.R.; Kochian, L.V. Development of a Novel Aluminum Tolerance Pheno-typing Platform Used for Comparisons of Cereal Aluminum Tolerance and Investigations into Rice Aluminum Tolerance Mechanisms. Plant Physiol. 2010, 153, 14. [Google Scholar] [CrossRef] [Green Version]
  87. Zhao, X.Q.; Chen, R.F.; Shen, R.F. Coadaptation of Plants to Multiple Stresses in Acidic Soils. Soil Sci. 2014, 179, 503–513. [Google Scholar] [CrossRef]
  88. Boyer, J. L’aluminium échangeable: Incidences agronomiques, évaluation et correction de sa toxicité dans les sols tropicaux. Cah. ORSTOM Ser. Pédol 1976, 14, 11. [Google Scholar]
  89. Maathuis, F.J.M. Sodium in plants: Perception, signalling, and regulation of sodium fluxes. J. Exp. Bot. 2014, 65, 849–858. [Google Scholar] [CrossRef]
  90. Nikos, J.; Bauder James, W.; Pearson, K. Basics of Salinity and Sodicity Effects; Department of Land Resources and Environmental Sciences: Montanta State University-Bozeman, Bozeman, MT, USA, 2002; p. 29. [Google Scholar]
  91. Agassi, M.; Shainberg, I.; Morin, J. Effect of Electrolyte Concentration and Soil Sodicity on Infiltration Rate and Crust For-mation. Soil Sci. Soc. Am. J. 1981, 45, 848–851. [Google Scholar] [CrossRef]
  92. Shainberg, I.; Letey, J. Response of soils to sodic and saline conditions. Hilgardia 1984, 52, 1–57. [Google Scholar] [CrossRef] [Green Version]
  93. Leonardos, O.H.; Fyfe, W.S.; Kronberg, B.I. The use of ground rocks in laterite systems: An improvement to the use of conven-tional soluble fertilizers? Chem. Geol. 1987, 60, 361–370. [Google Scholar] [CrossRef]
  94. Leonardos, O.H.; Theodoro, S.H.; Assad, M.L. Remineralization for sustainable agriculture: A tropical perspective from a Brazil-ian viewpoint. Nutr. Cycl. Agroecosystems 2000, 56, 2. [Google Scholar] [CrossRef]
  95. Gillman, G.; Burkett, D.C.; Coventry, R.J. A laboratory study of application of basalt dust to highly weathered soils: Effect on soil cation chemistry. Soil Res. 2001, 39, 799. [Google Scholar] [CrossRef]
  96. Gillman, G.; Burkett, D.; Coventry, R. Amending highly weathered soils with finely ground basalt rock. Appl. Geochem. 2002, 17, 987–1001. [Google Scholar] [CrossRef]
  97. Bartzas, G.; Zaharaki, D.; Komnitsas, K. Life cycle assessment of open field and greenhouse cultivation of lettuce and barley. Inf. Process. Agric. 2015, 2, 191–207. [Google Scholar] [CrossRef] [Green Version]
Figure 1. Map showing the location of the study areas: Tamazeght, Jbel Boho, El Glo’a, and Ait Saoun magmatic complexes. SAMF (South Atlas Major Fault) and AAMF (Ati-Atlas Major Fault).
Minerals 11 00140 g001
Figure 2. Photo showing the petrography of Tamazeght, Jbel Boho, El Glo’a, and Ait Saoun, samples respectively: (A)-TS01, (B)-TS10, (C)-TS14, (D)-JB16, (E)-AS01, and (F)-EL01 samples. Or: orthoclase, Bt: biotite, Qtz: quartz, Ap: apatite, Ne: nepheline, Ab: albite, Kfs: potassic feldspar, Px: pyroxene, Opq: opaque, and Grt: garnet. Scale bars for (A): 200 μm and (BF): 500 μm.
Minerals 11 00140 g002
Figure 3. Petrography of the TS10 sample: crushed raw material (A–D) and crushed treated material (E–H). Scale bars: 500 μm.
Minerals 11 00140 g003
Figure 4. Mineralogical composition of the raw samples using XRD analysis.
Minerals 11 00140 g004
Figure 5. Mineralogical composition of the treated samples using XRD analysis.
Minerals 11 00140 g005
Figure 6. SEM-EDS of the raw material indicating the elemental distribution: (A) TS01 and (B) TS01H observed at 100 µm and 40 µm. (K: potassium, Si: Silicium, Na: Sodium, Mg: Magnesium, Al: Aluminium, C: Carbon and O: Oxygen).
Minerals 11 00140 g006
Figure 7. SEM-EDS of the treated materials indicating their elemental distribution: (A) EL01 and (B) EL01H observed at 100 µm and 40 µm. (K: potassium, Si: Silicium, Na: Sodium, Mg: Magnesium, Al: Aluminium and O: Oxygen).
Minerals 11 00140 g007
Figure 8. Particle size distributions of the studied samples.
Minerals 11 00140 g008
Figure 9. Thermal gravimetric analyses (TGA) of TS01, TS10, TS14, JB06, AS01, and EL01 samples (A) and their hydrothermal equivalent (B) from room temperature to 900 °C.
Minerals 11 00140 g009
Figure 10. FTIR spectrum of raw (A) and hydrothermal (B) samples.
Minerals 11 00140 g010
Figure 11. Leaching (mg/L) of the raw and hydrothermal materials after one week.
Minerals 11 00140 g011
Figure 12. Potassium extraction percentage for raw and treated samples.
Minerals 11 00140 g012
Table 1. Mineral composition and brief description of the selected samples based on petrographical observation. Nepheline (Ne), garnet (Grt), biotite (Bt), Mica (Mic) Fe-Ti oxides (Opq), orthoclase (Or), apatite (Ap), chlorite (Chc), quartz (Qtz), albite (Ab), potassic feldspar (Kfs), pyroxene (Px), amphibole (Amph), titanite (Ttn), zircon (Zrc), plagioclase (Pl), carbonates (Carb), microcline (Mc), and clay minerals (Clay).
SampleTextureAlterationFracturingMineral ContentsLithology DescriptionRock Nature
TS10Coarse-grainedHighHighOr, Ne, Bt, Mic, Px, Grt, Opq, Ap, Clay, Ttn, ZrcHighly weathered rock with centimetric Kfs and Ne mineralsNepheline syenite
AS01MicroliticMedium to highLowKfs (Or/Mc), Qtz, Opq, ClayLess weathered, mainly composed of centimetric Kfs. Chalcedony and quartz are also presentTrachyte
TS14Coarsed-grained, porphyriticMediumMediumOr, Ne, Ab, Px, Clay, Carb, Qtz, Opq, Ap, ZrcHighly weathered rock with centimetric Kfs mineralsSyenite
TS01CoarseHighLowKfs (Or/Mc), Pl, Bt, Px, Clay, Opq, Ttn, Ap, ZrcKfs highly altered, biotite and apatite are presentSyenite
JB16Coarse-grainedMediumMediumAb, Or, Qtz, Bt, Px, Ap, OpqIodomorphic centimetric and
altered Kfs. Apatite and quartz are also present
Syenite
EL01MicroliticMediumLow to mediumOr, Opq, Px/AmphWeathered rockTrachyte
Table 2. X-ray fluorescence analysis for selected samples and chemical index weathering values (CIW).
SamplesSiO2TiO2Al2O3Fe2O3MnOMgOCaONa2OK2OP2O5LOITotalCIW
AS0155.11.515.89.70.20.11.30.113.30.42.499.991.9
EL-0159,60.316.24.70.10.80.527.90.12.494.686.6
JB-1660.70.516.760.10.91.24.95.70.22.699.573.2
TS1053.10.524.33.30.10.10.90.112.70.13.89996.4
TS1453.90.723.23.80.20.10.80.313.20.11.79895.5
TS0157.91.417.25.10.20.410.211.50.22.99893.5
Table 3. pH and electrical conductivity data of the selected sample.
SamplesTS01TS10TS14EL01JB16AS01
pH (raw material)8.68.99.28.58.88.9
pH (treated material)12.412.312.212.112.312.6
Electricla conductivity (µS·cm−1) (raw samples)249.8196.2249.2377.4297.1243.3
Electrical conductivity (µS·cm−1) (treated samples)20947.423281.819790.517631.318368.719524.3
Table 4. The coefficient of correlation (Pearson’s r) between the extracted Ke and the other parameters. Uniformity coefficient (Cu), chemical index of weathering (CIW), and initial K (Ki).
VariablesKeRaw MaterialsCIWKi
Cu
Ke1---
Cu−0.641--
CIW0.81−0.371-
Ki0.90−0.570.921
VariablesKeTreated MaterialsCIWKi
Cu
Ke1---
Cu−0.721--
CIW0.91−0.371-
Ki0.96−0.570.921
Publisher’s Note: MDPI stays neutral with regard to jurisdictional claims in published maps and institutional affiliations.

