1. Introduction
Heap leaching is one of the most validated technologies to extract copper from different ore types, such as oxides and sulfides. In 2018, around 25% of the copper produced from Chile, the major copper producer worldwide, was generated from heap leaching plants [
1], reaching 1.5 Mt. Even though the copper production expected from heap leaching in Chile will decline up to around 10% in 2030 (0.75 Mt), this technology allows the treatment of low-grade ores, generating a high-purity product [
2]. Heap leaching can be applied to copper ores previously crushed and agglomerated, or copper ores that have a much larger particle size, such as the run of mine (ROM) ores extracted directly from the mine. A heap leaching process is based on the ore stacking placed in an impermeable pad, typically distributed in different lifts, where its height can range between 2 and 10 m for crushed ores, and even 75 m for ROM ores [
3]. The heap pad is irrigated through the top surface, usually with irrigation rates in the range of 2–15 L/(h × m
2) [
3]. The solution leaches copper mineral species while it flows downward along the ore bed, and is finally collected in perforated tubes placed at the bottom of the heap for that purpose. In the case of heap bioleaching, a supply of air could be included through tubes located at the bottom of the heap, but above the phreatic level. The simplicity and low cost of this technology has promoted its use at large scale for the extraction of different metals [
2]. However, the high variability of particle size distribution, ore mineralogy, and stacking methods determine a variable bulk porosity distribution along the heap, promoting channeling and preferential flows in the heap [
4]. These consequences not only affect the wetting uniformity of the ore, reducing the metal extraction, but it could also promote saturated zones that can increase the risk of landslide stability. In this regard, different methods have been studied and applied to monitoring the fluid flow, moisture distribution, and liquid spread in heap leaching, such as electrical resistivity [
5], X-ray computed tomography imaging [
6], or UV fluorescence-based image analysis [
7]. However, these techniques are still limited to application at the laboratory scale (X-ray tomography and UV fluorescence) and the possibility to have results in real time, dynamically (electrical resistivity), in order to have results that allow the taking of operational decisions immediately. In order to tackle these problems, an alternative method is the monitoring and control of irrigation on the surface of the heap during operation.
Irrigation systems consist of a network of pipes that are evenly distributed on the heap surface, usually placed some centimeters inside the ore surface. The pipe diameters and pressure distribution of the system are designed so that the leaching solution is evenly distributed among all the drippers. In practice, however, during operation, a fraction of the dripper becomes partially or totally clogged, due to obstruction of the exit orifice by salt precipitation or other types of obstructing phenomena. Obstruction of some drippers naturally will lead to an excess of flow in others, and result in an uneven distribution flow of leaching solution. Therefore, the irrigation monitoring method presents challenges, due to the large extent of the irrigated zones, and the large number of irrigation drippers involved.
One way to monitor and control these phenomena is by using thermal cameras, along with image processing and analysis. There are mainly two ways such monitoring and control can be done; one by the installation of thermal cameras placed on fixed posts or towers over the perimeter of a pile [
8], and the other by a thermal camera mounted on a drone [
9,
10]. According to the first case, cameras are installed at a tilt and pan angle with respect to the pile, producing distortion, and consequently, penalizing image resolution. As the orthogonality between the surface of the heap pile and the thermal camera can be completely achieved, thermal images acquired by a drone have much better resolution [
9,
10], compared to the monitoring system with fix posts mentioned before. Nevertheless, for larger piles, especially in length and width, the need for a drone for monitoring becomes even more evident, given the lower resolution of the monitoring system with thermal cameras mounted on fixed towers or posts [
10].
Moreover, thermal image analysis could be applied on oxides or sulfide ores, or even to the leaching of other metals, such as gold [
11]. In the case of sulfide leaching, the heat generation could increase the heap surface temperature [
11,
12,
13], increasing the temperature gradient difference between solid and liquid phases on the heap surface. In this regard, the advances and results of heap leaching modeling [
11,
12,
13] could be synergically enhanced by the use of temperature sensing on the heap surface.
The present work presents a methodology developed for characterizing the distribution of leaching solution on a heap based on monitoring the thermal distribution on the heap surface. Thermal monitoring is conducted with an infrared camera that can be placed on an automatized drone. Image processing and analysis of thermal distribution along with statistical classification enable the rapid identification of the zones of the heap surface that present either deficient, adequate, or excessive irrigation flow. A full understanding of these zones can be useful to make metal extraction more efficient, as well as keep the risk of landslide stability monitored and bounded.
2. Materials and Methods
The main scope of this method was controlling the irrigation in heap leaching, in order to avoid saturation zones that can compromise the stability of the pile and the leaching performance. In order to address the early detection of the conditions in the saturation zones, it was necessary to survey and monitor the pile, especially during irrigation. However, this system was also intended to recognize the zones that were not irrigated, in order to improve the leaching process there as well. This monitoring action was conducted by a thermal camera attached to a hexacopter (see
Figure 1). The idea was to detect the saturation zones, as well as those that were not irrigated by thermal analysis along with image processing techniques. For instance, as the saturation zones were detected, suitable control actions in the irrigation system could be performed; for instance, if there is an excess of solution, the corresponding valves should be closed.
2.1. Heap Leaching Characteristics
The heap leach pile under analysis was that at El Soldado mine, which has the following characteristics:
Length: 48.4 m. Width: 24.4 m. Height: 2.5 m.
Separation of the drip irrigation grid: 3 m.
Separation of the drip irrigation line: 3 m.
Leaching flow: 23 m3/h.
Application rate: 14 L/m2.
Temperature of the leaching solution: 30 °C.
Temperature gradient: 20 °C.
- −
Dry zone temperature: 40 °C.
- −
Wet zone temperature: 20 °C.
Leaching cycle: 15 days. Irrigation time: 8 days.
Material: Leached ore; 100% under 1/2 inch.
Type of leaching: Acid leaching with H2SO4.
Chemical composition of the solution:
- −
Irrigation: 0.2 g/L Cu and 10 g/L H2SO4.
- −
Drainage: 1.5 g/L Cu and 3 g/L H2SO4.
2.2. UAV and Thermal Camera Integration
The mechatronic system was composed of a hexacopter and a thermal camera. The hexacopter (see
Figure 2a) is very stable, highly maneuverable, can fly in an open space, has fast deployment, and is able to carry heavy payloads. These features make x-copters a very good choice for a lot of applications (from 3D mapping to atmospheric measurements). The basic flying principle is an arrangement of electric motors and propellers that provide thrust in a configuration that neutralizes rotation (yaw). Half of the motors turn clockwise and the other half turn counterclockwise. Yaw, height, speed, and direction were controlled by varying the thrust. There was a microcontroller on the machine driving each of the motors so it could fly according to the instructions. This flight controller receives data from an IMU, GPS, barometer, radio receiver, and RF link. The hexacopter was commanded by radio control (see
Figure 2b). The radio controller was a Hitec Optic 6 with a FrSky DF 2.4 GHz RF module.
The flight control board was an ArduPilot Mega 2.0. It offered both remote control and autonomous flight, including waypoints, mission planning, and telemetry that can be displayed on a ground station. The microcontroller used was an Atmel ATMEGA2560, a Honeywell HMC5883L-TR digital compass, on-board GPS (Mediatek MT3329 module), an Invensense 6 DoF Accelerometer/Gyro MPU-6000, and a barometric pressure sensor (MS5611-01BA03, from Measurement Specialties). For the telemetry link, we used an XbeePro. The brushless motors were Turnigy L2215J-900 and they were controlled by the Turnigy Basic 25A Brushless Speed Controller. The total weight of the Hexacopter was around 1 kg and the expected payload was around 800 gr. The battery used in the Hexacopter was a lithium polymer battery with the following characteristics:
The thermal camera was mounted under the hexacopter’s framework as the camera needs to point down onto the ground. The thermal images were acquired using a 9 mm-f1.25 FLIR 320 TAU Thermal Camera, with a sensitivity in the range 7.5–13.5 µm, an image resolution of 324 × 256 pixels, a thermal resolution of 0.007 °C, and a range of −40 to 80 °C.
2.3. Image Processing and Analysis
Computer-assisted classification of the thermal images was used for identifying the zones of the heap surface that present either deficient, adequate, or excessive irrigation flow. The idea was to convert the thermal images taken by the thermal camera, into solid information by automatically categorizing all pixels of the thermal image into classes, as shown by the block diagram in
Figure 3.
The classification process followed these three steps:
Training Stage: The process of defining criteria by which patterns were recognized and developing a numerical description for each class.
Classification Stage: Each pixel in the image data set was categorized and placed into the class it most closely resembles based on a mathematical decision rule.
Output Stage: Results were commonly presented through tables, graphics, etc.
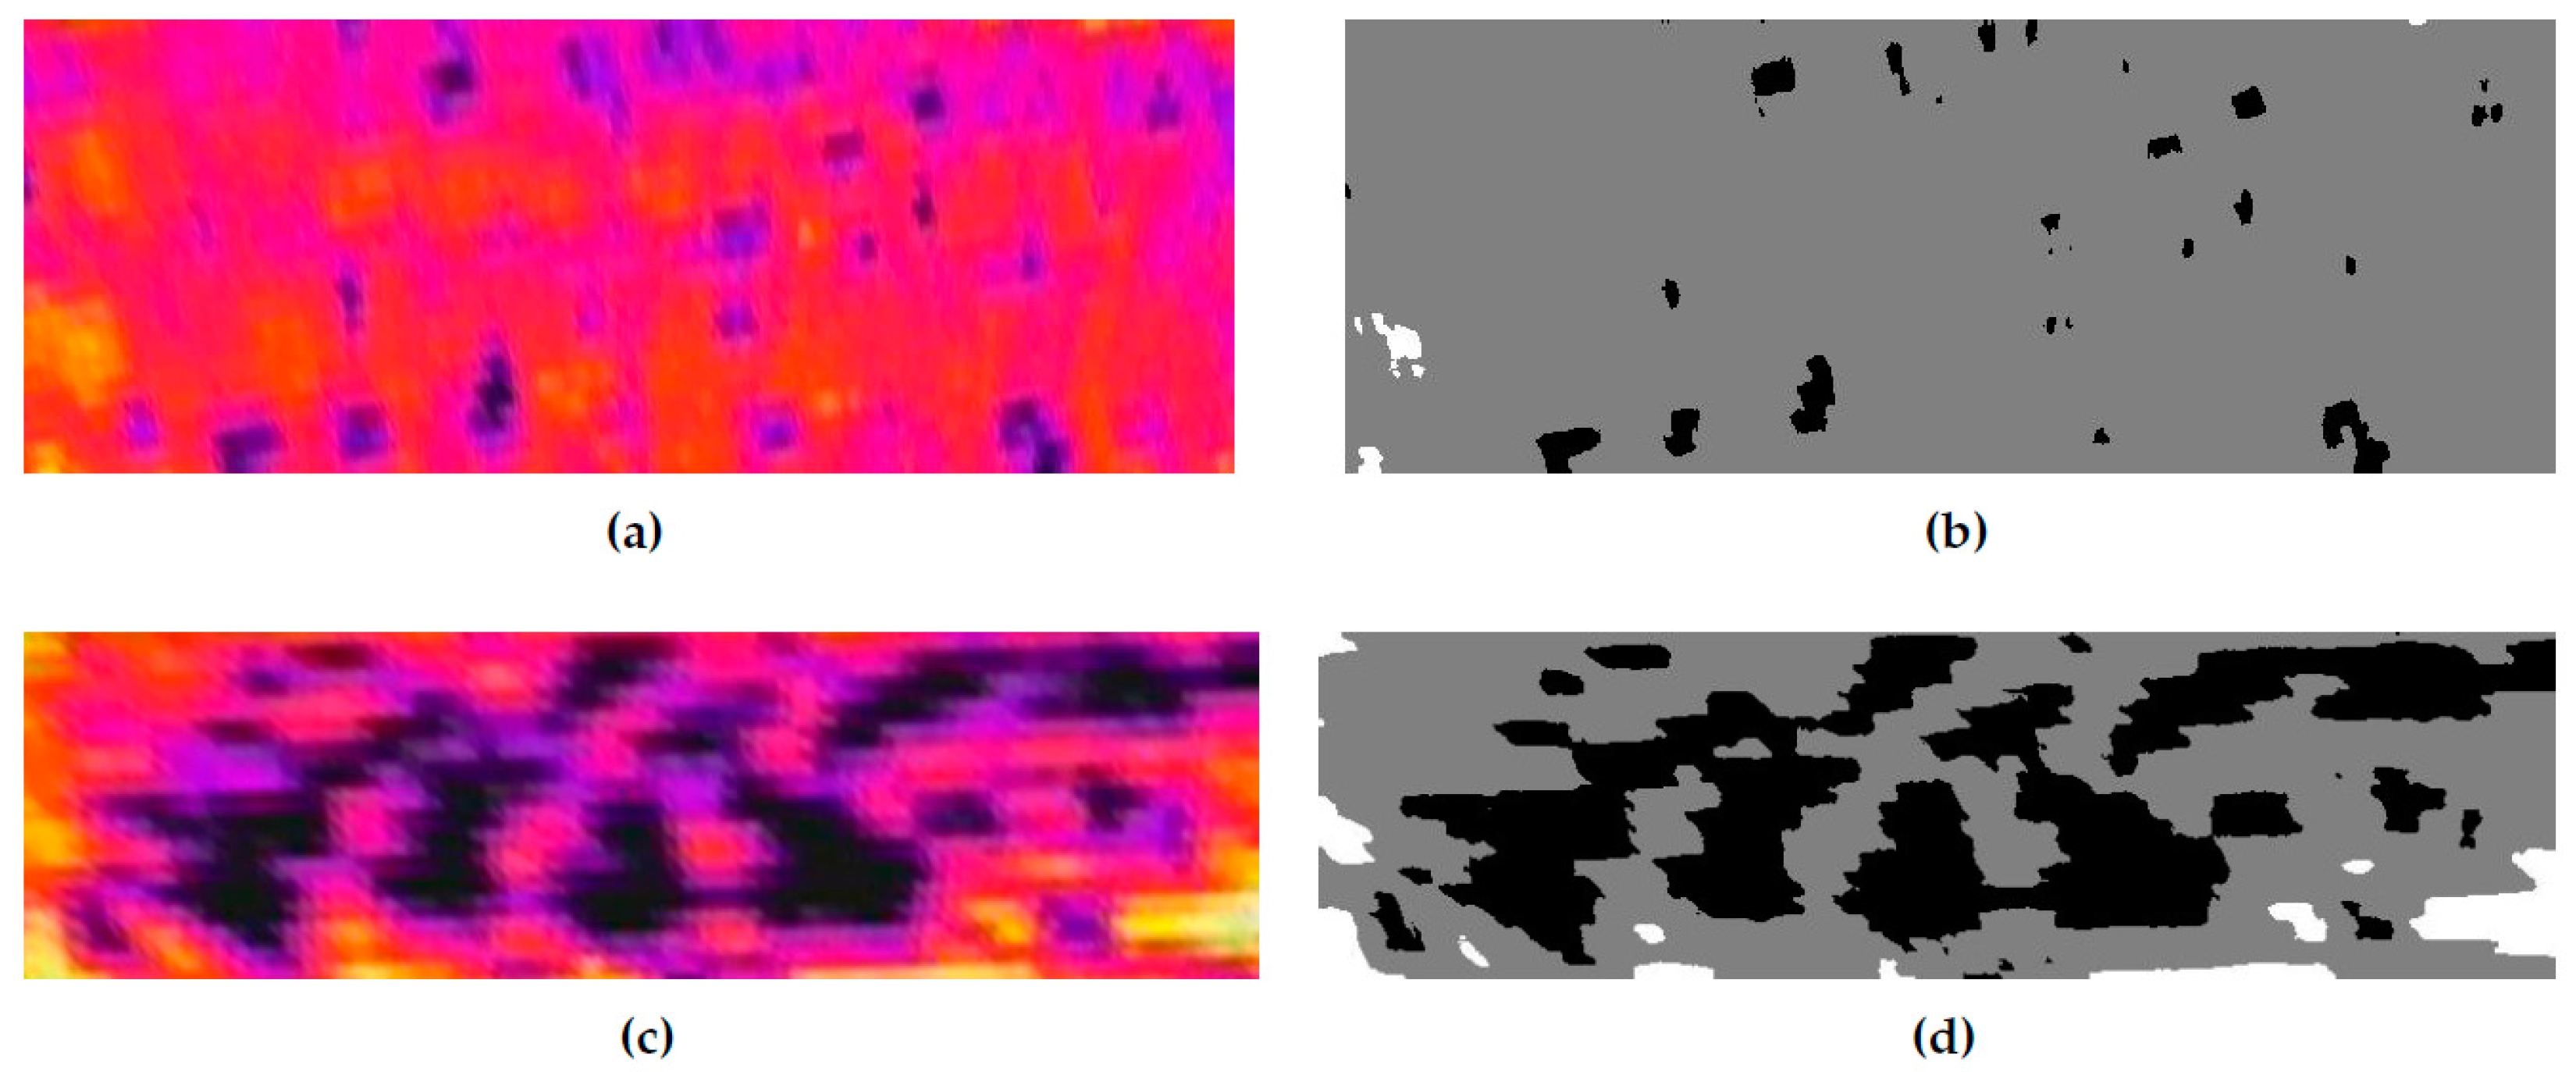
Therefore, three classes were defined using the different zones of the irrigation inside the heap leach pile: The saturated zone, the irrigated zone, and the dry zone. Two sets of images were generated from the thermal images, obtained by the thermal camera (see
Figure 4).
Figure 4 is an example of the images the proposed system could acquire and process. This thermal image was used to give information—by manual marking—to the classifier about the classes they belong to. The first set was used for training (such set has a large amount of thermal images that were recorded during experiments from several piles), while the second set was for evaluation. From those images, corresponding to the training set, several crops for each class were selected. The value of each pixel was used as the data [
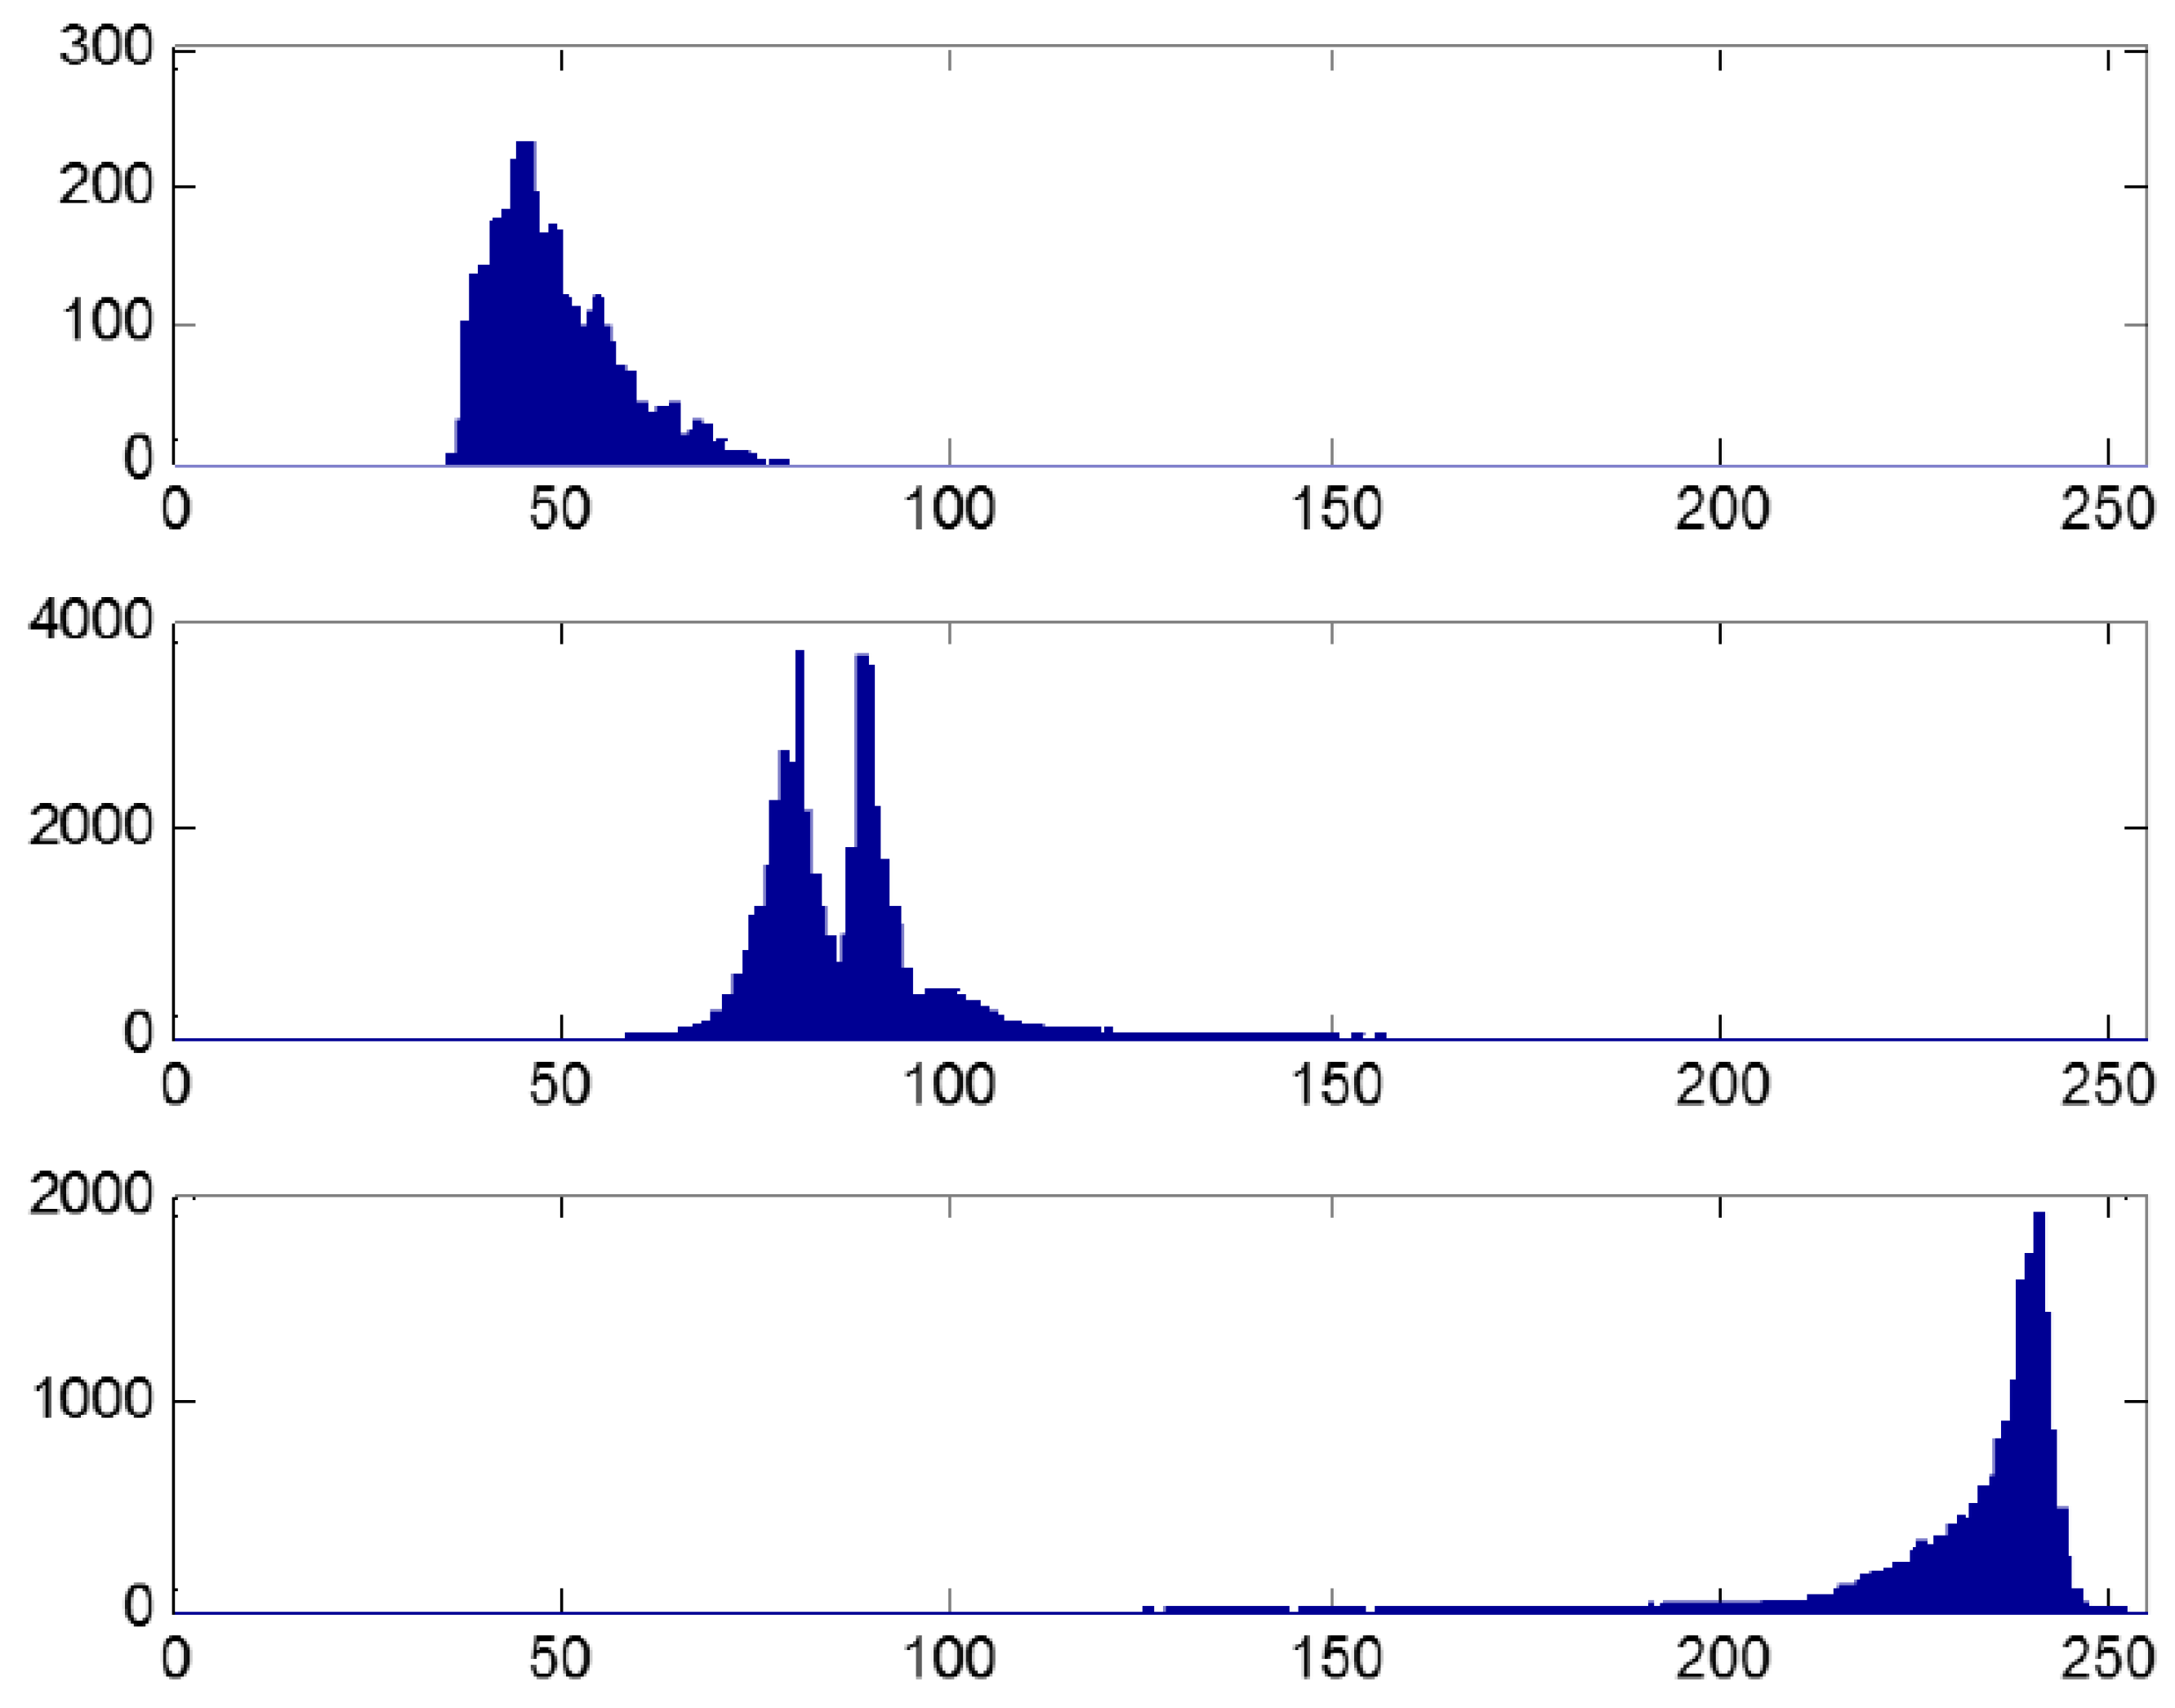
14]. With these data, three histograms were calculated (see
Figure 5).
Figure 5 shows the result of the histograms that was calculated using the training images previously marked.
Three Gaussian models were estimated, given the data distribution in the histograms (see
Figure 6).
Figure 6 shows the classifiers (Gaussian models) obtained from the training images. These models were used to classify the evaluation images. Naive Bayes is a robust classifier based upon the principle of maximum a posteriori (MAP), and for this reason, Bayes was used in order to determine the class of each pixel [
15]. Given a problem with
K classes {
C1,…,
CK} with so-called prior probabilities
P(
C1),…,
P(
CK) [
16], the class label c can be assigned to an unknown example with features X = (
x1,…,
xN) such that:
In other words, choose the class with the maximum a posterior probability given the observed data [
17]. This a “posterior” probability can be formulated, using Bayes theorem, as follows:
As the denominator was the same for all classes, it could be dropped from the comparison. Now, the so-called class conditional probabilities of the features should be computed given the available classes. This can be quite difficult when taking into account the dependencies between features. The Naive Bayes approach assumes class conditional independence, i.e.,
x1,…,
xN, which is independent given the class. This simplifies the numerator to become:
and then chooses the class c that maximizes this value over all the classes
c = 1,…,
K. Clearly, this approach is naturally extensible to the condition of having more than two classes, and was shown to function well in spite of the underlying simplifying assumption of conditional independence. In this case, we have three classes that are independent. If it is assumed that any class c has the same probability, then
P(
C = 1) =
P(
C = 2) =
P(
C = 3) = 1/3. Again, the denominator is the same for all classes, and therefore, it can be dropped from the comparison.
Finally, the class is given by c = argmaxcP(x1,‖C = c) for each pixel.
4. Discussion
Based on the results, the segmentation of the thermal images was successfully conducted, yielding solid information about the classified zones. Through image processing, it is possible to detect specifically the location of the saturated and/or the dry zones, as well as the properly irrigated zones.
Such information could be used to recognize the zones, specifically those in which the pile is saturated. Moreover, as the irrigation system follows an irrigation line, which can be controlled automatically, it can be recognized easily, as this image processing system can feed the programmable logic controller (PLC) that controls irrigation with this kind of information. Thus, if a saturation zone is detected though thermography, the PLC is fed with this information and can compute a correcting action, e.g., the corresponding valves should be closed until the saturation is gone. Taking the opposite case into account, in which some zones of the pile are dry, then the irrigation control system must send a higher flow and/or open the valve more in order to increase the flux flow.
“As an excess of humidity can put the stability in the heap leach pile seriously in danger, which would raise the risk of collapse exponentially because of liquefaction,” such a monitoring system helps to avert this by maintaining the stability of the pile, and also contributes a better lixiviation process. These lead to having a better lixiviation rate, and also to increasing safety during the leaching process, as no human operator needs to be in the immediate surroundings, where these collapses can injure or even endanger the life of the operator.
This method can be also applied for the application of sulfide ore leaching. Even though the dissolution of sulfide minerals increases the temperature of the heap [
11,
12,
13], with the risk of heating the pile surface and even the wetted zones on the pile, the irrigation flow is typically fed at lower temperature with respect to dry zones. In addition, the precision of thermal monitoring can detect low-temperature gradients (0.007 ℃), retaining the accuracy of the method. A validation in real sulfide heap leaching should be conducted to validate this statement. In this context, there is an interesting opportunity to apply the thermal image not only as irrigation monitoring, but also to heap temperature monitoring, in order to improve the metal recovery, as a consequence of the kinetic improvement by the rise in temperature.
5. Conclusions
The thermal images are an efficient way of controlling the irrigation system in heap leach piles as they give valuable information about the zones, i.e., if they are being irrigated correctly or not.
As this algorithm permits the classification in order to separate and segment different zones of the heap leach pile under irrigation successfully, the loop can be closed as the irrigation system can be controlled automatically. Such irrigation control provides the opportunity to monitor the pile in order to avoid collapse because of liquefaction. In addition, the possibility to have results about the saturated zones distributed on the surface pile could allow the control of the irrigation performance in terms of ensuring the wettability of the ore, therefore improving the leaching performance.
As this approach is noninvasive, this system can be adapted for an unmanned aerial vehicle, which can be autonomous or tele-operated, making it unnecessary for the plant operator to go and check inside the heap leach pile for this information as it is registered from the thermal camera. This kind of approach reduces the risk for the operators dramatically, as they are neither exposed directly to the solution nor do they need to be above the pile.


