Review

Spectroscopic Studies of Synthetic and Natural Saponites: A Review

by
J. Theo Kloprogge
1,2,* and
Concepcion P. Ponce
1
1
Department of Chemistry, College of Arts and Sciences, University of the Philippines, Miag-ao, Iloilo 5023, Philippines
2
School of Earth and Environmental Sciences, The University of Queensland, Brisbane, QLD 4072, Australia
*
Author to whom correspondence should be addressed.
Minerals 2021, 11(2), 112; https://doi.org/10.3390/min11020112
Submission received: 7 November 2020 / Revised: 18 January 2021 / Accepted: 20 January 2021 / Published: 23 January 2021

Abstract

:
Saponite is a trioctahedral 2:1 smectite with the ideal composition MxMg3AlxSi4−xO10(OH,F)2.nH2O (M = interlayer cation). Both the success of the saponite synthesis and the determination of its applications depends on robust knowledge of the structure and composition of saponite. Among the routine characterization techniques, spectroscopic methods are the most common. This review, thus, provides an overview of various spectroscopic methods to characterize natural and synthetic saponites with focus on the extensive work by one of the authors (JTK). The Infrared (IR) and Raman spectra of natural and synthetic saponites are discussed in detail including the assignment of the observed bands. The crystallization of saponite is discussed based on the changes in the IR and Raman spectra and a possible crystallization model is provided. Infrared emission spectroscopy has been used to study the thermal changes of saponite in situ including the dehydration and (partial) dehydroxylation up to 750 °C. 27Al and 29Si magic-angle-spinning nuclear magnetic resonance spectroscopy is discussed (as well as 11B and 71Ga for B- and Ga-Si substitution) with respect to, in particular, Al(IV)/Al(VI) and Si/Al(IV) ratios. X-ray photoelectron spectroscopy provides chemical information as well as some information related to the local environments of the different elements in the saponite structure as reflected by their binding energies.

1. Introduction

Clay minerals can be found as colloidal particles in sediments and soils. They consist mainly of hydrated phyllosilicates that contain variable amounts of aluminum, iron, magnesium, titanium, alkali metals, alkaline earths, and other cations. Because they constitute a substantial portion of the Earth’s crust, they are readily available. Their importance dates to prehistoric times, as they are seen in ancient pottery and mud huts. Modern applications include the fields of construction engineering, petroleum exploration, recovery and refining, process chemistry and engineering, pharmaceuticals, agriculture, and arts, among others. As the eventual applications of clays are determined by their structure, composition and sizes—the characterization of these properties is of the utmost importance.
Among the clay minerals of interest is saponite, which has applications as: adsorbents for the removal of heavy metal ions [1,2] and carcinogenic compounds [3]; control agents of the aggregation of luminescent dyes [4,5]; matrices for controlled release of drugs [6]; catalysts for industrially important reactions [7,8,9] and for prebiotic chemistry [10,11]; immobilization supports for various catalysts [12,13,14,15], and many more. These applications depend on properties such as size, cation-exchange capacity, plasticity, catalytic activity, swelling behavior, permeability, and substitutions in the saponite structure.
Saponite is a trioctahedral 2:1 smectite with the ideal composition MxMg3AlxSi4−xO10(OH,F)2, where M signifies the interlayer cation, e.g., Na+, K+, Rb+, NH4+, or 1/2Ca2+, 1/2Ba2+, l/2Mg2+, or even 1/3A13+; where x can range between approximately 0.3 and 0.6. A single 2:1 layer normally consists of a central sheet of octahedrally coordinated Mg2+ sandwiched between two sheets of tetrahedrally coordinated Si4+ (Figure 1). The partial substitution of Si4+ by Al3+ results in an overall negative charge on the tetrahedral sheets, which is compensated by exchangeable interlayer cations. Substitution of Al3+ can also occur at octahedral and interlayer sites, resulting in a lower overall layer charge. The name Saponite is derived from Latin, sap, and Greek, sapoun, both meaning soap, alluding to its greasy or soapy feel and appearance. Saponite was first described in 1840 from Lizard Point, Landewednack, Cornwall, England. Saponite occurs as soft, massive, and plastic masses, and can be found in hydrothermal veins, basalt vesicles, and fissures cutting calc-silicates, iron-rich skarns, amphibolites, and serpentinites.
A number of different saponite synthesis methods with adjustable compositions and physicochemical properties have been described over the decades. These methods can be divided into sol-gel methods under mild temperatures and pressures [16,17,18,19,20], hydrothermal methods which are carried out at relatively higher temperatures and pressures [8,21,22,23,24,25,26], and microwave-assisted hydrothermal synthesis [15,27,28,29,30,31], which permits crystallization to take place at lower temperatures than typical for hydrothermal processes and with strongly reduced synthesis times. The hydrothermal methods are the most commonly used synthesis methods to form saponite. Kloprogge and his coresearchers published a number of papers on the hydrothermal synthesis methods [24,25,26,32] and their results indicate that these techniques can be successfully applied to obtain phase-pure saponite. This is seen as a result of the high hydrolysis rates of the octahedral cations precursors at high temperature and increased pressure, which support nucleation and both lateral growth and stacking of the layers of the saponite crystals. Hydrothermal methods generally involve a starting gel consisting of a stoichiometric mixture of silica, Al and Mg salts and a source of interlayer cations (typically sodium or ammonium, but other cations have also been reported, see, e.g., [24]) which is allowed to react under hydrothermal conditions at temperatures between 150 and 450 °C under autogenous water vapor pressures for variable time periods from as short as 5 min up to 3 months.
The mild nonhydrothermal saponite synthesis method using urea described by Vogels et al. is worth noting [18]. It presents a simple method to prepare large volumes of saponites with extensive control on the texture in addition to the composition, though the crystallinity was generally lower compared to hydrothermally formed saponite. The saponites were synthesized at a constant mild temperature of 90 °C. The starting Si/Al gel was prepared using a simple procedure of diluting Na2SiO3 solution in demineralized water and slowly adding (under continuous stirring) Al(OH)4 to form the gel. The gels were then added to demineralized water and heated to 90 °C. The required masses of nitrates of the divalent octahedral M2+ cations (M2+ = Mg2+, Ni2+, Zn2+, Co2+, and Cu2+) and urea were dissolved in water and added to the gel–water mixture afterwards (maintained at 90 °C) after which the synthesis started.
The success of the saponite synthesis process and the determination of its applications depends on robust knowledge of the various characterization techniques of the structure and composition of saponite. Among the routine characterization techniques for the composition–structure–properties relationship in saponite, spectroscopy is the most common. This review, thus, provides an overview of various spectroscopic methods to characterize natural and synthetic saponites with focus on the extensive work performed by Kloprogge and coworkers in various research groups over the past 25–30 years. Infrared (IR) spectroscopy is clearly the most important and common spectroscopic technique to investigate saponite. Raman spectroscopy can also provide valuable information about the low-wavenumber region of saponite, which is difficult to obtain with IR spectroscopy (far-IR region below 400 cm−1). The information obtained from mid-IR (MIR) spectroscopy is not the same as that from Raman spectroscopy, as the physics involved in Raman spectroscopy are very different from those of IR spectroscopy and these two techniques are often used in complement to each other. Solid-state magic-angle-spinning nuclear magnetic resonance (MAS-NMR) spectroscopy is a method that uses the magnetic properties of certain elements, here in particular 27Al and 29Si, to obtain detailed information concerning the local environment of Si and Al in the tetrahedral and octahedral sheets of the saponite structure (coordination, influence of nearest and next-nearest neighbor atoms), though other elements have also been studied (see, e.g., 23Na NMR of synthetic beidellite, a smectite closely related to saponite [33]). For clay minerals, this includes especially the local environments of Si and Al in the tetrahedral and octahedral sheets. Finally, the application of X-ray photoelectron spectroscopy (XPS) to study saponite is reviewed.

2. Materials and Methods

The materials and methods described in this section are from the works of Kloprogge and coresearchers in various research laboratories over the past 25–30 years.

2.1. Hydrothermal Synthesis

Kloprogge and coworkers synthesized ammonium saponite by preparing a homogeneous powder mixture of amorphous silica (SiO2), aluminum triisopropylate (AI[OCH(CH3)2]3), and magnesium acetate-tetrahydrate ([CH3COO]2Mg.4H2O) mixed with aqueous ammonium hydroxide solution [25]. When different interlayer cations such as Na+, K+, Rb+, Ca2+, Ba2+, or Ce4+ were desired, the homogenous powder was mixed with a solution comprising the preferred cation in the form of a hydroxide or fluoride salt. The subsequent stoichiometric gel had the theoretical saponite formula M0.6Mg3Al0.6Si3.4O10(OH)2, where M signifies the interlayer cation [24,25]. Approximately 125 g of the above gel was hydrothermally treated for 72 h at 200 °C under autogenous water pressure. Kloprogge et al. [24] have shown that a crystalline yield near 100% is possible under these conditions. The resulting crystalline saponites were cooled, separated from the coexisting hydrothermal fluid, washed twice with distilled water to remove possible free salts, centrifuged, and dried overnight at 120 °C. The suite of ammonium-saponites discussed in this review were synthesized and extensively characterized by Kloprogge and coworkers [24,25,34].

2.2. Urea-Assisted Synthesis

A Si/Al gel with a Si/Al molar ratio of 5.67 (x = 1.2) was prepared by diluting 40 g of a Na2SiO3 solution (27 wt% SiO2) in 100 mL demineralized water. This Si-containing solution was slowly mixed to a previously prepared Al(OH)4 solution made by dissolving 11.9 g Al(NO3)3.9H2O in a 80 mL 2 M NaOH solution. This mixing turned an initially clear solution cloudy with subsequent formation into a gel. When the gel formed, stirring was stopped and the mixture was allowed to stand for one hour prior to further use. The gels formed from this process did not contain excess liquid and were not further treated. Gels with different Si/Al molar ratios were prepared in a similar way by altering the amounts of aluminum nitrate and sodium silicate. The total amount of Si + Al was kept constant. A gel with a Si/Al ratio of 39.0 (x = 0.2) was prepared in a somewhat different way, since after mixing the Si- and Al-containing solutions no gelation occurred. After addition of 10 mL HNO3 (65%), though, a stable white gel was formed. Gels with an extremely low Si/Al ratio of 2.33 (x = 2.4) were prepared in the same way as the other Si/Al gels, but without NaOH addition to the Al-containing solutions. This had to be performed to reduce the rate of gelation. In total, 1000 mL of demineralized water was added to the final gel and heated to 90 °C. For Ga-containing saponites, instead of Al(OH)4, Ga(OH)4 was used. The Ga(OH)4 solution was prepared by diluting an 8M GaCl3 stock solution with a 2M NaOH solution. B-containing saponites were synthesized following two different methods: the “fused silica” and the “sodium silicate gel” methods described above. The fused silica method involved mixing approximately 10g fused silica (380V, Aerosil, Evonik, formerly Degussa, Essen, Germany) and an amount of borax (Na2B4O7) corresponding to a Si/B molar ratio of 2.9–12.3 in 1500 mL demineralized water.
The required amounts of Mg(NO3)2.6H2O, Ni(NO3)2.6H2O, Zn(NO3)2.4H2O, Co(NO3)2.6H2O, and/or Cu(NO3)2.3H2O, and typically 36.0 g urea, were dissolved in 500 mL water and added to the gel–water mixture (maintained at 90 °C) after which the synthesis started. Addition of the above solution resulted in a slight temperature drop of the synthesis mixture by about 10 °C. No acidification of the synthesis mixture was performed before the start of the synthesis procedure since the gels were not stable in acidified solutions. Saponites with octahedral sheets consisting of two metals were prepared by using the required combination of the divalent metal nitrate salts, with the ratio between the cations varied between 1 to 29 in the synthesis mixture. A set of experiments for the Zn-saponite preparation were also carried out with variable amounts of urea to investigate the effect of the concentration of the hydrolyzing urea on saponite formation. The amounts of urea in the starting mixture were 0.0, 18.0, and 72.1 g. An additional synthesis was performed using 36.0 g urea together with additional NaOH, which raised the pH to a level of 8 in the initial mixture. The synthesis duration was kept constant at 20 h unless otherwise indicated. After the desired synthesis period, the cloudy suspensions were filtered. The white (Zn, Mg), light green (Ni), pink (Co), or light blue (Cu) filtrates were washed thoroughly with demineralized water and dried overnight at 130 °C before characterization. The suite of saponites discussed in this review was extensively characterized by Vogels and coworkers [18,35,36,37].

2.3. Natural Saponites

Four different natural saponites were used in this study: SapCa-1 and SapCa-2 (Clay Minerals Society source clay, Ballarat, Ca, contains less than 3% diopside), 1433 (Ruduo, Poland, sample from the collection of Prof. van der Marel, courtesy Sjerry van der Gaast, NIOZ, The Netherlands) and Ca-saturated saponite from Milford, Utah (sample from CSIRO Adelaide, Australia, courtesy Phil Slate). X-ray diffraction was used to verify the trioctahedral saponitic nature of the natural samples and ascertain the absence of major impurities.

2.4. Spectroscopic Methods

2.4.1. Mid-Infrared Spectroscopy

All saponites were oven-dried in an oven set typically at 100 °C to remove any adsorbed water and stored in a desiccator. For each sample, 1 mg was finely mixed with 250 mg of oven-dried spectroscopic grade KBr having a refractive index of 1.559 and a particle size of 5–20 μm and pressed into a disc using 8 ton of pressure for 5 min under vacuum. Kloprogge and coworkers used a Perkin-Elmer 1600 series FT-IR spectrometer to record in triplicate the spectrum of each sample. The settings used were 64 scans at 4 cm−1 resolutions between 400 and 4000 cm−1.

2.4.2. Raman Spectroscopy

The FT-Raman spectroscopic analyses were performed on a Perkin-Elmer System 2000 FT spectrometer equipped with a Raman accessory comprised of a Spectron Laser Systems (GSI Lumonics, Rugby, England) SL301 Nd:YAG laser operating at a wavelength of 1064 nm. For the natural saponites, 275 scans were obtained at a spectral resolution of 4 cm−1 between 200 and 4000 cm−1, whereas for the synthetic samples, 1000 scans were necessary in order to obtain an acceptable signal/noise ratio.

2.4.3. Infrared Emission Spectroscopy (IES)

Infrared emission spectroscopy is becoming an important technique for measuring discrete vibrational frequencies emitted by thermally excited molecules. The IES measurements featured in this review were performed on a Digilab FTS-60A spectrometer modified by replacing the original IR source with an emission cell. For a detailed description of the cell and the principles of the experiment, the reader is directed to [38]. In this technique, the sample preparation involved spreading as a thin layer about 0.2 mg of the clay saponite on a 6 mm diameter platinum surface while keeping an inert atmosphere within a nitrogen-purged cell during heating. The platinum disk served as a hot plate to heat the sample and was placed on the graphite rod. The infrared emission cell was composed of a modified atomic absorption graphite rod furnace driven by a thyristor-controlled AC power supply capable of delivering up to 150 amps at 12 volts. The thermocouple junction was held at less than 0.2 mm below the surface of the platinum by an insulated 125 μm type R thermocouple embedded inside the platinum plate. A Eurotherm Model 808 proportional temperature controller, coupled to the thermocouple, maintained the temperature at ± 2 °C of the operating temperature of the saponite sample. The layout of the IES facility was based on an off axis paraboloidal mirror with a focal length of 25 mm mounted above the heater capturing the emitted infrared radiation and directing this radiation into the spectrometer. The assembly of the heating block and platinum hot plate was located such that the surface of the platinum was slightly above the focal point of the off axis paraboloidal mirror. In this way the geometry was such that a roughly 3 mm diameter area is sampled by the spectrometer. The original spectrometer was adapted for IES by the removal of the original source assembly and mounting a gold-coated mirror, which was drilled through the center to allow the passage of the laser beam. The mirror was mounted at a 45° angle so that the IR radiation was directed into the FTIR spectrometer. In a normal set of experiments, 3 sets of spectra were collected: (l) the black body radiation over the temperature range selected at the various temperatures; (2) the platinum plate radiation was collected at the same temperatures; (3) the spectra from the Pt plate covered with the sample were also acquired at the same temperatures. Normally, a single set of black body and Pt radiation is required per day. The emittance spectrum at a particular temperature can be calculated by first subtracting the single beam spectrum of the Pt backplate from that of the Pt + sample, and secondly the resulting difference spectrum was ratioed to the single beam spectrum of the approximate blackbody (graphite). This spectral manipulation was performed after all the spectra had been collected. The emission spectra were collected at intervals of 50 °C over a temperature range from 200 to 750 °C. The time between scans (while the temperature was raised to the next hold point) was ±100 s. This was considered a sufficient time for the heating block and the powdered sample to reach temperature equilibrium. The spectra were acquired by coaddition of 64 scans for the whole temperature range (approximate scanning time 45 s), with a nominal resolution of 4 cm−1 in a range between 4000 and 400 cm−1. Good quality spectra could be obtained provided the sample thickness was not too large. If too large (i.e., too thick a layer) a sample was used, then the spectra become difficult to interpret because of effects related to self-absorption.

2.4.4. Spectral Manipulation

Spectral manipulation for mid-infrared, Raman and IES, such as baseline adjustment, smoothing, and normalization, was performed using the Spectracalc software package (Galactic Industries Corporation, Salem, NH, USA).

2.4.5. Magic-Angle-Spinning Nuclear Magnetic Resonance Spectroscopy (MAS-NMR)

The synthetic NH4-saponites were analyzed by MAS-NMR by Kloprogge, et al. [39] at Shell Research Laboratory in Amsterdam, The Netherlands. 29Si solid-state MAS-NMR spectra of the hydrothermal saponites were recorded at 59.62 MHz on a Bruker CXP-300 spectrometer (magnetic field 7.05 T). 27A1 solid-state MAS-NMR spectra of the hydrothermal saponites were obtained on a Bruker WM-500 spectrometer (130.32 MHz, magnetic field 11.7 T). Both instruments apply a sample spinning rate of approximately 14 kHz. Approximately 4500 Free Induction Decays (FIDs) accumulated at a repetition time of 12 s (pulse width 3.25 μs) for the 29Si spectra and 3000 FIDs accumulated at a repetition time of 0.8 s (pulse width 3.0 μs) for the 27A1 spectra. Chemical shifts were given in ppm relative to tetramethylsilane (TMS) and [Al(H2O)6]3+, respectively. Upfield shifts were taken to be negative. Since the spectra were recorded with a shielded aluminum-free probe, no correction was needed for background signals. Deconvolution of the spectra was obtained by fitting the signals to independent Gaussian lines using a least-squares method.
Vogels et al. [18] performed high-resolution solid-state MAS-NMR measurements on the urea synthesized saponites with a Bruker AM-500 spectrometer (117 T) at the SON HF-NMR facility, University of Nijmegen, Nijmegen, The Netherlands. 27Al MAS-NMR experiments were conducted at 130.321 MHz with a pulse length of l µs and a pulse interval of 1 s. 29Si MAS-NMR experiments were run at 99.364 MHz with a pulse length of 6.5 µs and a pulse interval of 40s. Chemical shifts (δ) of 27Al and 29Si are reported in ppm relative to [Al(H2O)6]3+ and [(CH3)4Si], respectively.

2.4.6. X-ray Photoelectron Spectroscopy (XPS)

The clay minerals were analyzed in freshly powdered form in order to prevent surface oxidation changes. Prior to the analysis, the samples were outgassed under vacuum for 72 h. The XPS analyses were performed on a Kratos AXIS Ultra with a monochromatic Al X-ray source at 150 W under ultrahigh vacuum conditions (10−9 to 10−10 Torr). Each analysis started with a survey scan from 0 to 1200 eV with a dwell time of 100 ms, pass energy of 160 eV at steps of 1 eV with 1 sweep. For the high-resolution analyses, the number of sweeps was increased, the pass energy was lowered to 20 eV at steps of 100 meV and the dwell time was changed to 250 ms. In order to account for the possibility of heterogeneity in the clay samples, three different analyses were performed for each clay sample. The Kratos Axis Ultra, XPS used for the analysis, has a built-in patented coaxial low energy electron charge compensation system which provides a high flux of electrons of uniform charge density. It uses a magnetic immersion lens situated below the sample and the low energy electrons from a filament located at the base of the photoelectron input lens are injected into the magnetic field. It is operated in such a way that “overcompensation” occurs, which results in full charge neutralization and the photoelectron peaks moving down scale a few eV. The spectra were charge corrected using the adventitious C 1s signal at 285 eV. Band component analysis was undertaken using the Jandel “Peakfit” software package, which enabled the type of fitting function to be selected and allows specific parameters to be fixed or varied accordingly. Band fitting was performed using a Lorentz–Gauss cross-product function with the minimum number of component bands used for the fitting process. The Gaussian–Lorentzian ratio was maintained at values greater than 0.7 and fitting was undertaken until reproducible results were obtained with correlations of r2 greater than 0.995.

3. Mid-Infrared and Raman Spectroscopy

3.1. General Characterization of the IR and Raman Spectra of Saponite

Generally, octahedrally coordinated Mg dominates in natural saponite; a partial substitution of Al3+ for Si4+ in the tetrahedral sheets and Al3+, Fe2+ or Fe3+ for Mg2+ in the octahedral sheet is frequently observed. Partly due to these tetrahedral and octahedral substitutions, the mid-IR spectra of both natural and synthetic saponites are significantly different from that of talc, Mg3Si4O10(OH)2—i.e., the bands are broader and slightly shifted (Figure 2). In the KBR transmission spectra, the OH-stretching region of saponite (Ballarat, California) shows a characteristically weak ν(Mg3-OH) band near 3680 cm−1 with a satellite, very weak band near 3720 cm−1. This band cannot be observed in ATR spectra as shown in Figure 2. This weak satellite band is believed to be due to a KBr matrix effect. From the works of Russel and Fraser in 1994, as cited in a book chapter by Madejova [40], and the book by Repacholi [41], when a KBr pellet containing saponite was heated (to eliminate adsorbed H2O), K+ ions from the KBr repels the proton of the saponite OH group, affecting its orientation and resulting in the appearance of a high-wavenumber ν(Mg3-OH) satellite [42,43]. Pelletier et al. [44] strengthened this observation by collecting the spectra of saponite in a CaF2 diluting matrix and found no band near 3720 cm−1. The main Si-O stretching vibration of saponite is found at 1006 cm−1, slightly lower than for hectorite due to Al for Si substitution in the tetrahedral sheet (Figure 3). Likewise, as for talc, the bands at 691 and 661 cm−1 for saponite consist of the contributions of the perpendicular Si-O and bending Mg3-OH vibrations. These bands show broadening similar to the dioctahedral smectites (with trivalent metals in the octahedral sheet) caused by local disorder. The band around 530 cm−1 belongs to the perpendicular Mg-O vibrational mode. Finally, the spectra of saponites exhibit two bands at 460 and 443 cm−1, assigned to the OH translation and Si-O-Si bending vibrational modes, respectively (Table 1).
For smectites, the OH-stretching region in the MIR spectra exhibits not only the bands associated with the hydroxyl groups of the octahedral sheets but also by physisorbed and interlayer water. In the equivalent Raman spectra, the effect of physisorbed and interlayer water is far more challenging to detect. Obtaining Raman spectra of smectites is usually complicated by the occurrence of strong fluorescence, and consequently meticulous experimentation is necessary to acquire useful spectra. The main Raman bands for saponite occur around 3680 and 3420 cm−1 [45,46]. The sharp intense band around 3680 cm−1 has been assigned to the ν(Mg3-OH) vibrational mode, similar to the IR band at this position, and the broad band around 3420 cm−1 to the ν(H2O) vibrational mode of interlayer water. To gain a better understanding of the changes of octahedral ν(M32+-OH) modes (M2+ here is a divalent atom in the octahedral sheet, in saponite mainly Mg2+) as affected by increasing tetrahedral layer charge, IR and Raman spectra were obtained of a number of synthetic saponites by Pelletier et al. [44]. With increasing layer charge, the IR and Raman spectra both exhibited a continuous shift of the ν(M2+3-OH) from about 3678 to about 3686 cm−1. In the IR and Raman spectra of K-saponites, two principal bands were found at 3683 and 3720 cm−1. With an increasing layer charge, the intensity of the latter band increased, and the relative integrated intensity was basically proportionate to the layer charge, suggesting interlayer K+ was positioned near the isomorphic substitution sites in the tetrahedral sheet and affected the structural hydroxyl groups. In addition, this demonstrates that the structural hydroxyl groups may form hydrogen bonds across the ditrigonal cavity where the isomorphic tetrahedral substitutions are located. The band at about 3720 cm−1 has been attributed to structural OH groups affected by the existence of K+ ions above or within the ditrigonal cavity of the tetrahedral sheet [42], whereas the ~3683 cm−1 band has been assigned to unperturbed hydroxyl groups. To interpret the spectra measured for hydrated Na+-saponites in the OH-stretching region, the Raman spectra were deconvoluted into four ν(M2+3-OH) bands at about 3675, 3680, 3685 and 3690 cm−1. The changes with layer charge of the relative percentages of these four bands were explained by accounting for the position of the hydrated interlayer cations associated with the distribution of the isomorphic tetrahedral substitutions. This hypothesis was verified by applying a straightforward statistical model, which produced four different types of OH groups in the octahedral sheet of hydrated Na-saponites [44].
Rinnert et al. [45] demonstrated that Na-saponite still had a substantial amount of interlayer water (equivalent to 1 H2O molecule per 2 Na+ cations) even after dehydration at 100 °C at 0.1 Pa. The Raman spectrum in the range between 3600 and 3750 cm−1 exhibited two broad bands at around 3675 and 3712 cm−1. The band at 3675 cm−1 was assigned to unperturbed hydroxyl groups, whereas the other band at 3712 cm−1 was attributed to hydroxyl groups perturbed by nearby Na+ cations, positioned near the ditrigonal cavity consistent with the analysis by Pelletier et al. [44]. Rinnert, et al. [47] indicated that in the dehydrated state, every interlayer Na+ ion perturbs up to two structural hydroxyl bands, the band width showing the variation in relative influence of perturbation. This would, though, greatly hinge on how well individual layers are stacked. Because the isomorphic tetrahedral substitutions are random in smectites, such as saponite, the ideal fitting necessary for proper crystalline stacking is not present. For partial pressures between 0.06 and 0.18, the amount of adsorbed water increased significantly up to 4.5 mmol/g, which is equivalent to around 1.5 H2O molecule per interlayer cation. Under these conditions, the basal spacing increased to 12.3 Å, which is historically attributed to a one-layer hydrate state (1-LHS). This proved that the change to the full 1-LHS was linked to the solvation of the interlayer Na+ by three H2O molecules, similar to what was determined before for hectorite by MIR spectroscopy [48].
Farmer [48] explained the pseudo-hexagonal tetrahedral sheet in layer silicates centered around the highest possible symmetry (C6v) for the SiO4 tetrahedron as a separate unit. The vibrational modes can subsequently be categorized into five species: 2A1 + 3B1 + 1B2 + 3E1, and 3E2. Of these species, just A1 and E1 are IR active, whereas A1, E1 and E2 are in theory Raman active. Calculations suggest that the following modes 902 ( a 1 1 ), 611 ( a 1 2 ), 130 (b2), 915 ( b 1 1 ), 779 ( b 1 2 ), 319 ( b 1 3 ), 1015 ( e 1 1 ), 543 ( e 1 2 ), 285 ( e 1 3 ), 695 ( e 2 1 ), 499 ( e 2 2 ), and 127 cm−1 ( e 2 3 ) are likely. Nevertheless, when the SiO4 tetrahedron is examined within the tetrahedral sheet of clay minerals a reduction in symmetry must be taken into account. Still, the C6v approximation forms a logical starting point for understanding the lower wavenumber region in the Raman and IR spectra of smectites, such as saponite.
The Raman spectrum of saponite in the region below 1200 cm−1, where Mg2+ cations form the octahedral cations and tetrahedral substitution Al3+ for Si4+ is typical, exhibits a relatively simple spectrum. Most of the bands are vibrational modes associated with distorted (Si,Al)O4 tetrahedra. The strongest bands are the Si–O vibrational modes at 1082, 683, 464, 432, and 360 cm−1 (Figure 4). Furthermore, two less intense bands at 1051 and 998 cm−1 along with a band at 288 cm−1 have been attributed to the vibrational modes of the SiO4 tetrahedra [49,50]. In the very low-wavenumber region, only one vibrational mode of the distorted MgO6 at 201–202 cm−1 has been detected. Wang et al. [45,46] described some bands for a greyish green saponite found in fine-grained weathered basalt matrix. This saponite exhibited major Raman bands around 680, 355, 295 and 190 cm−1 with the 190 cm−1 band attributed to the ν1(A1g) (Al,Mg)O6. It exhibited only a low-intensity band in the 1000 cm−1 region of the Raman spectrum. A Raman band in the range between 370 and 330 cm−1 found for trioctahedral smectites (i.e., smectites with divalent metals in the octahedral position) has tentatively been attributed to SiO4 bending vibrations [34]; nevertheless, the involvement of the MgO6 unit [51] should also be taken into consideration.

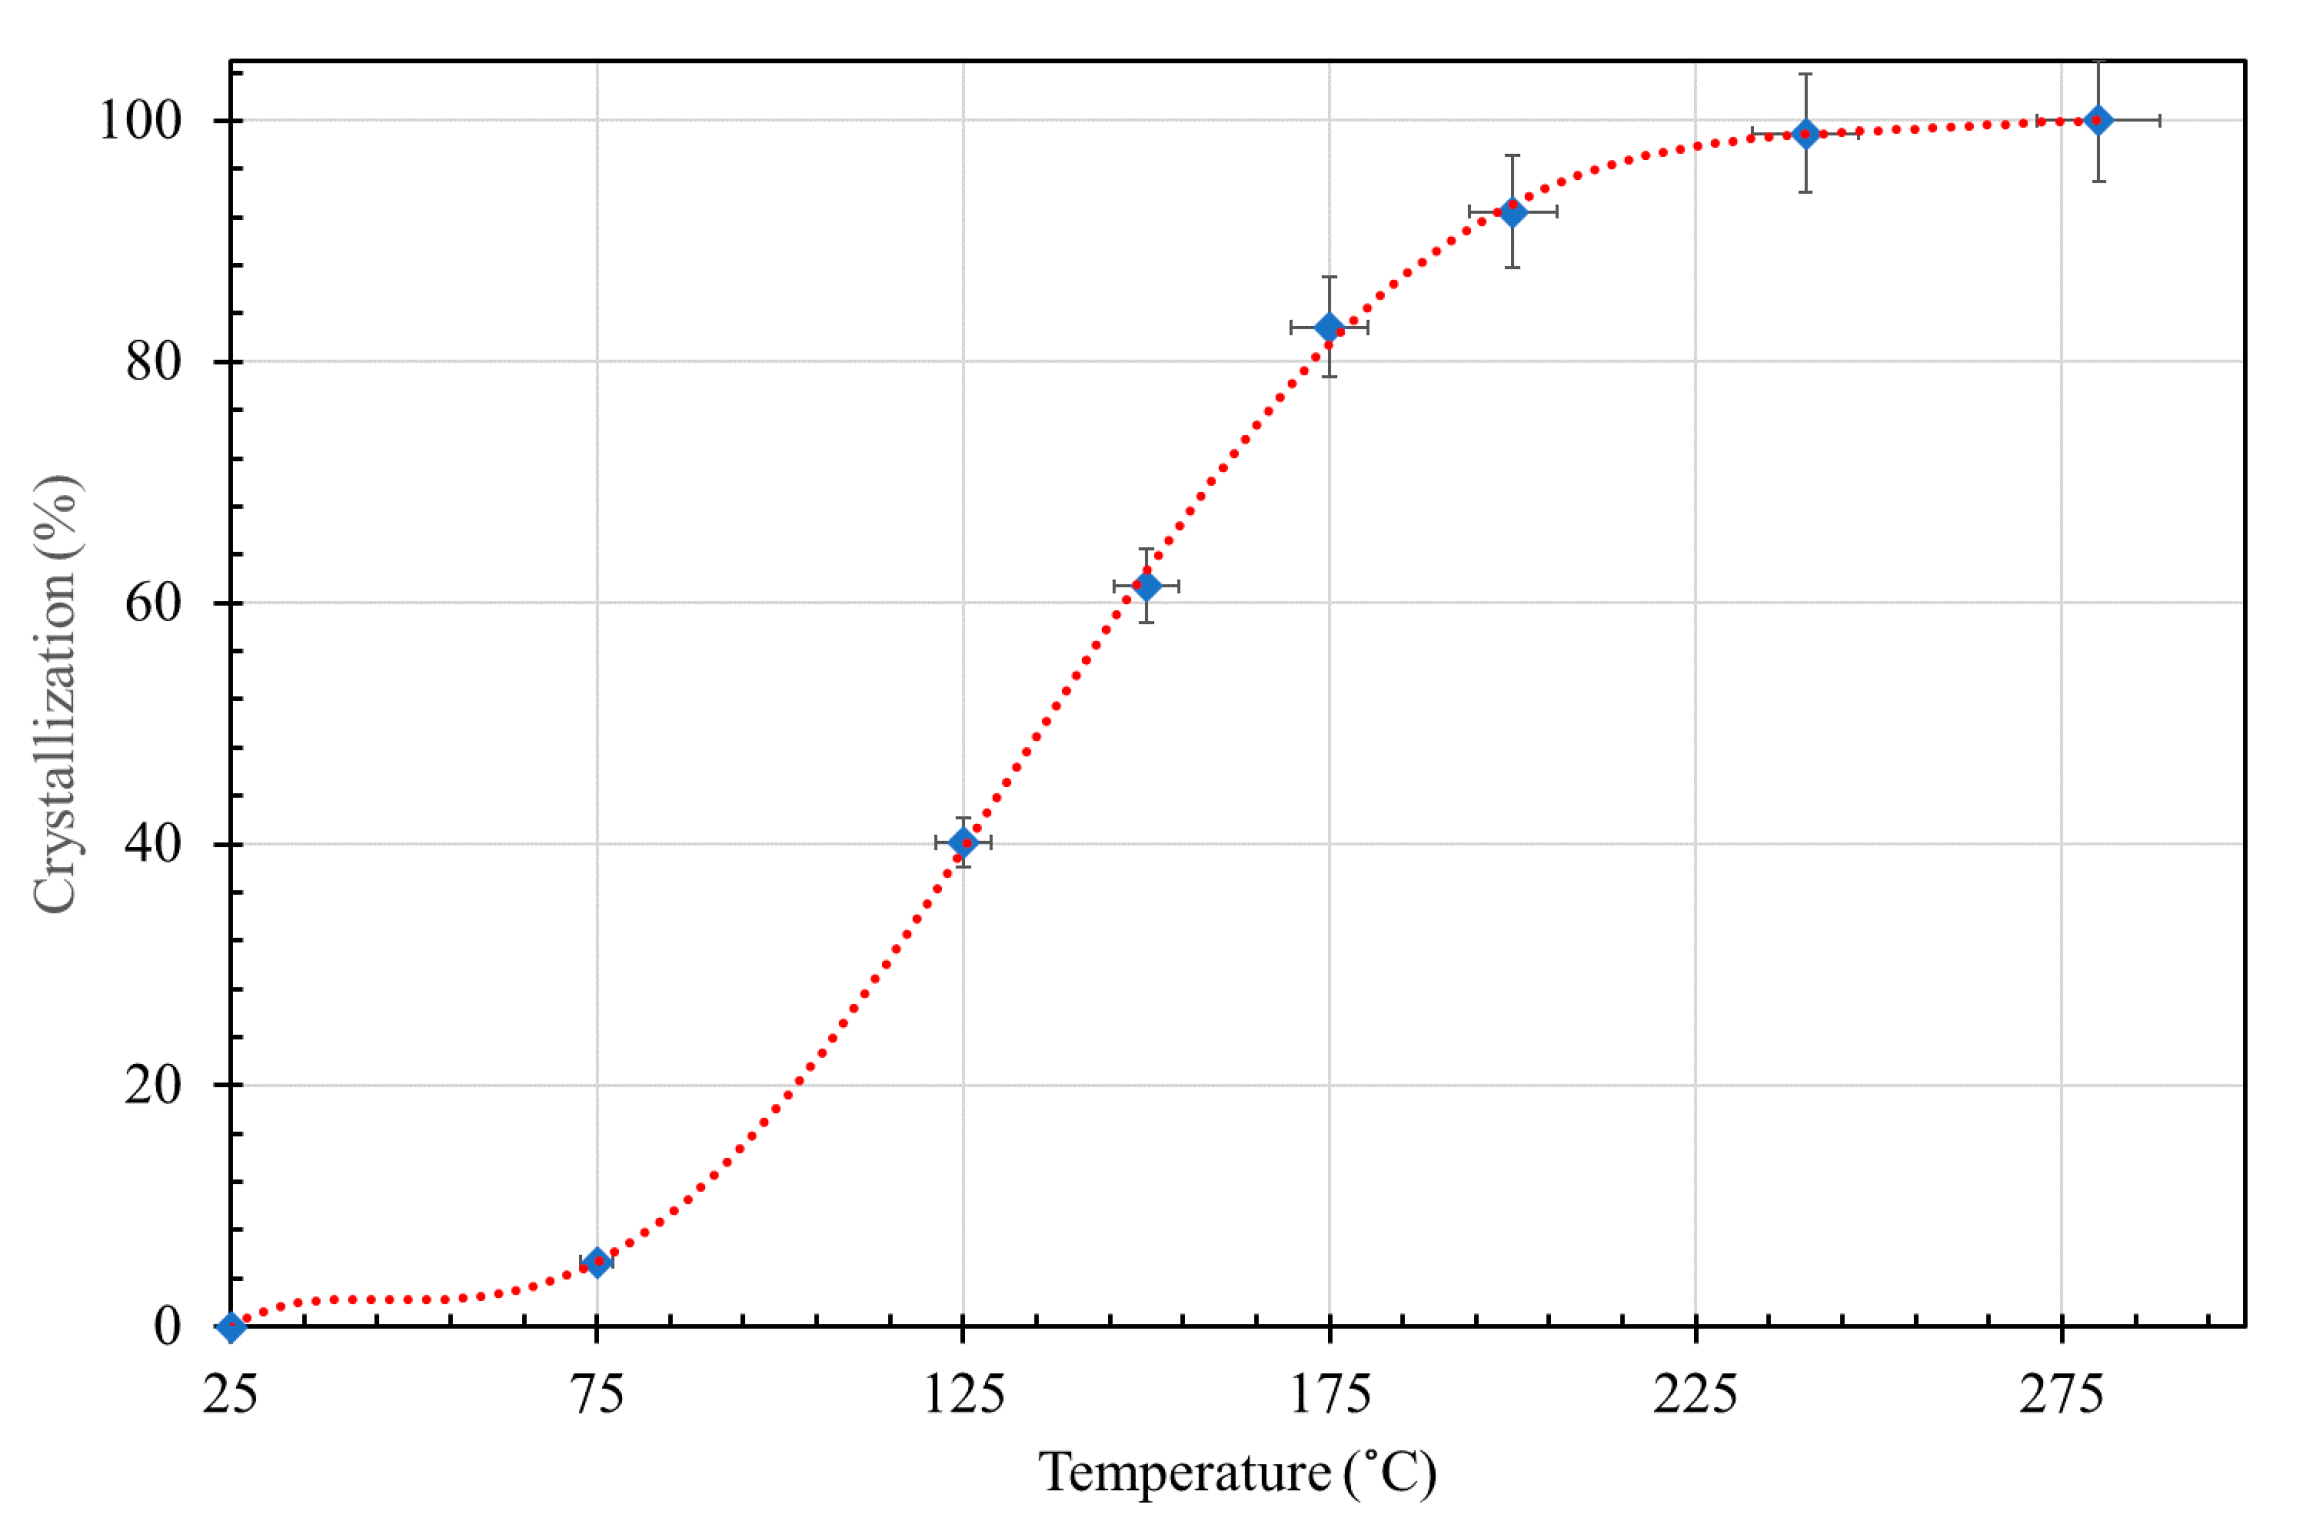
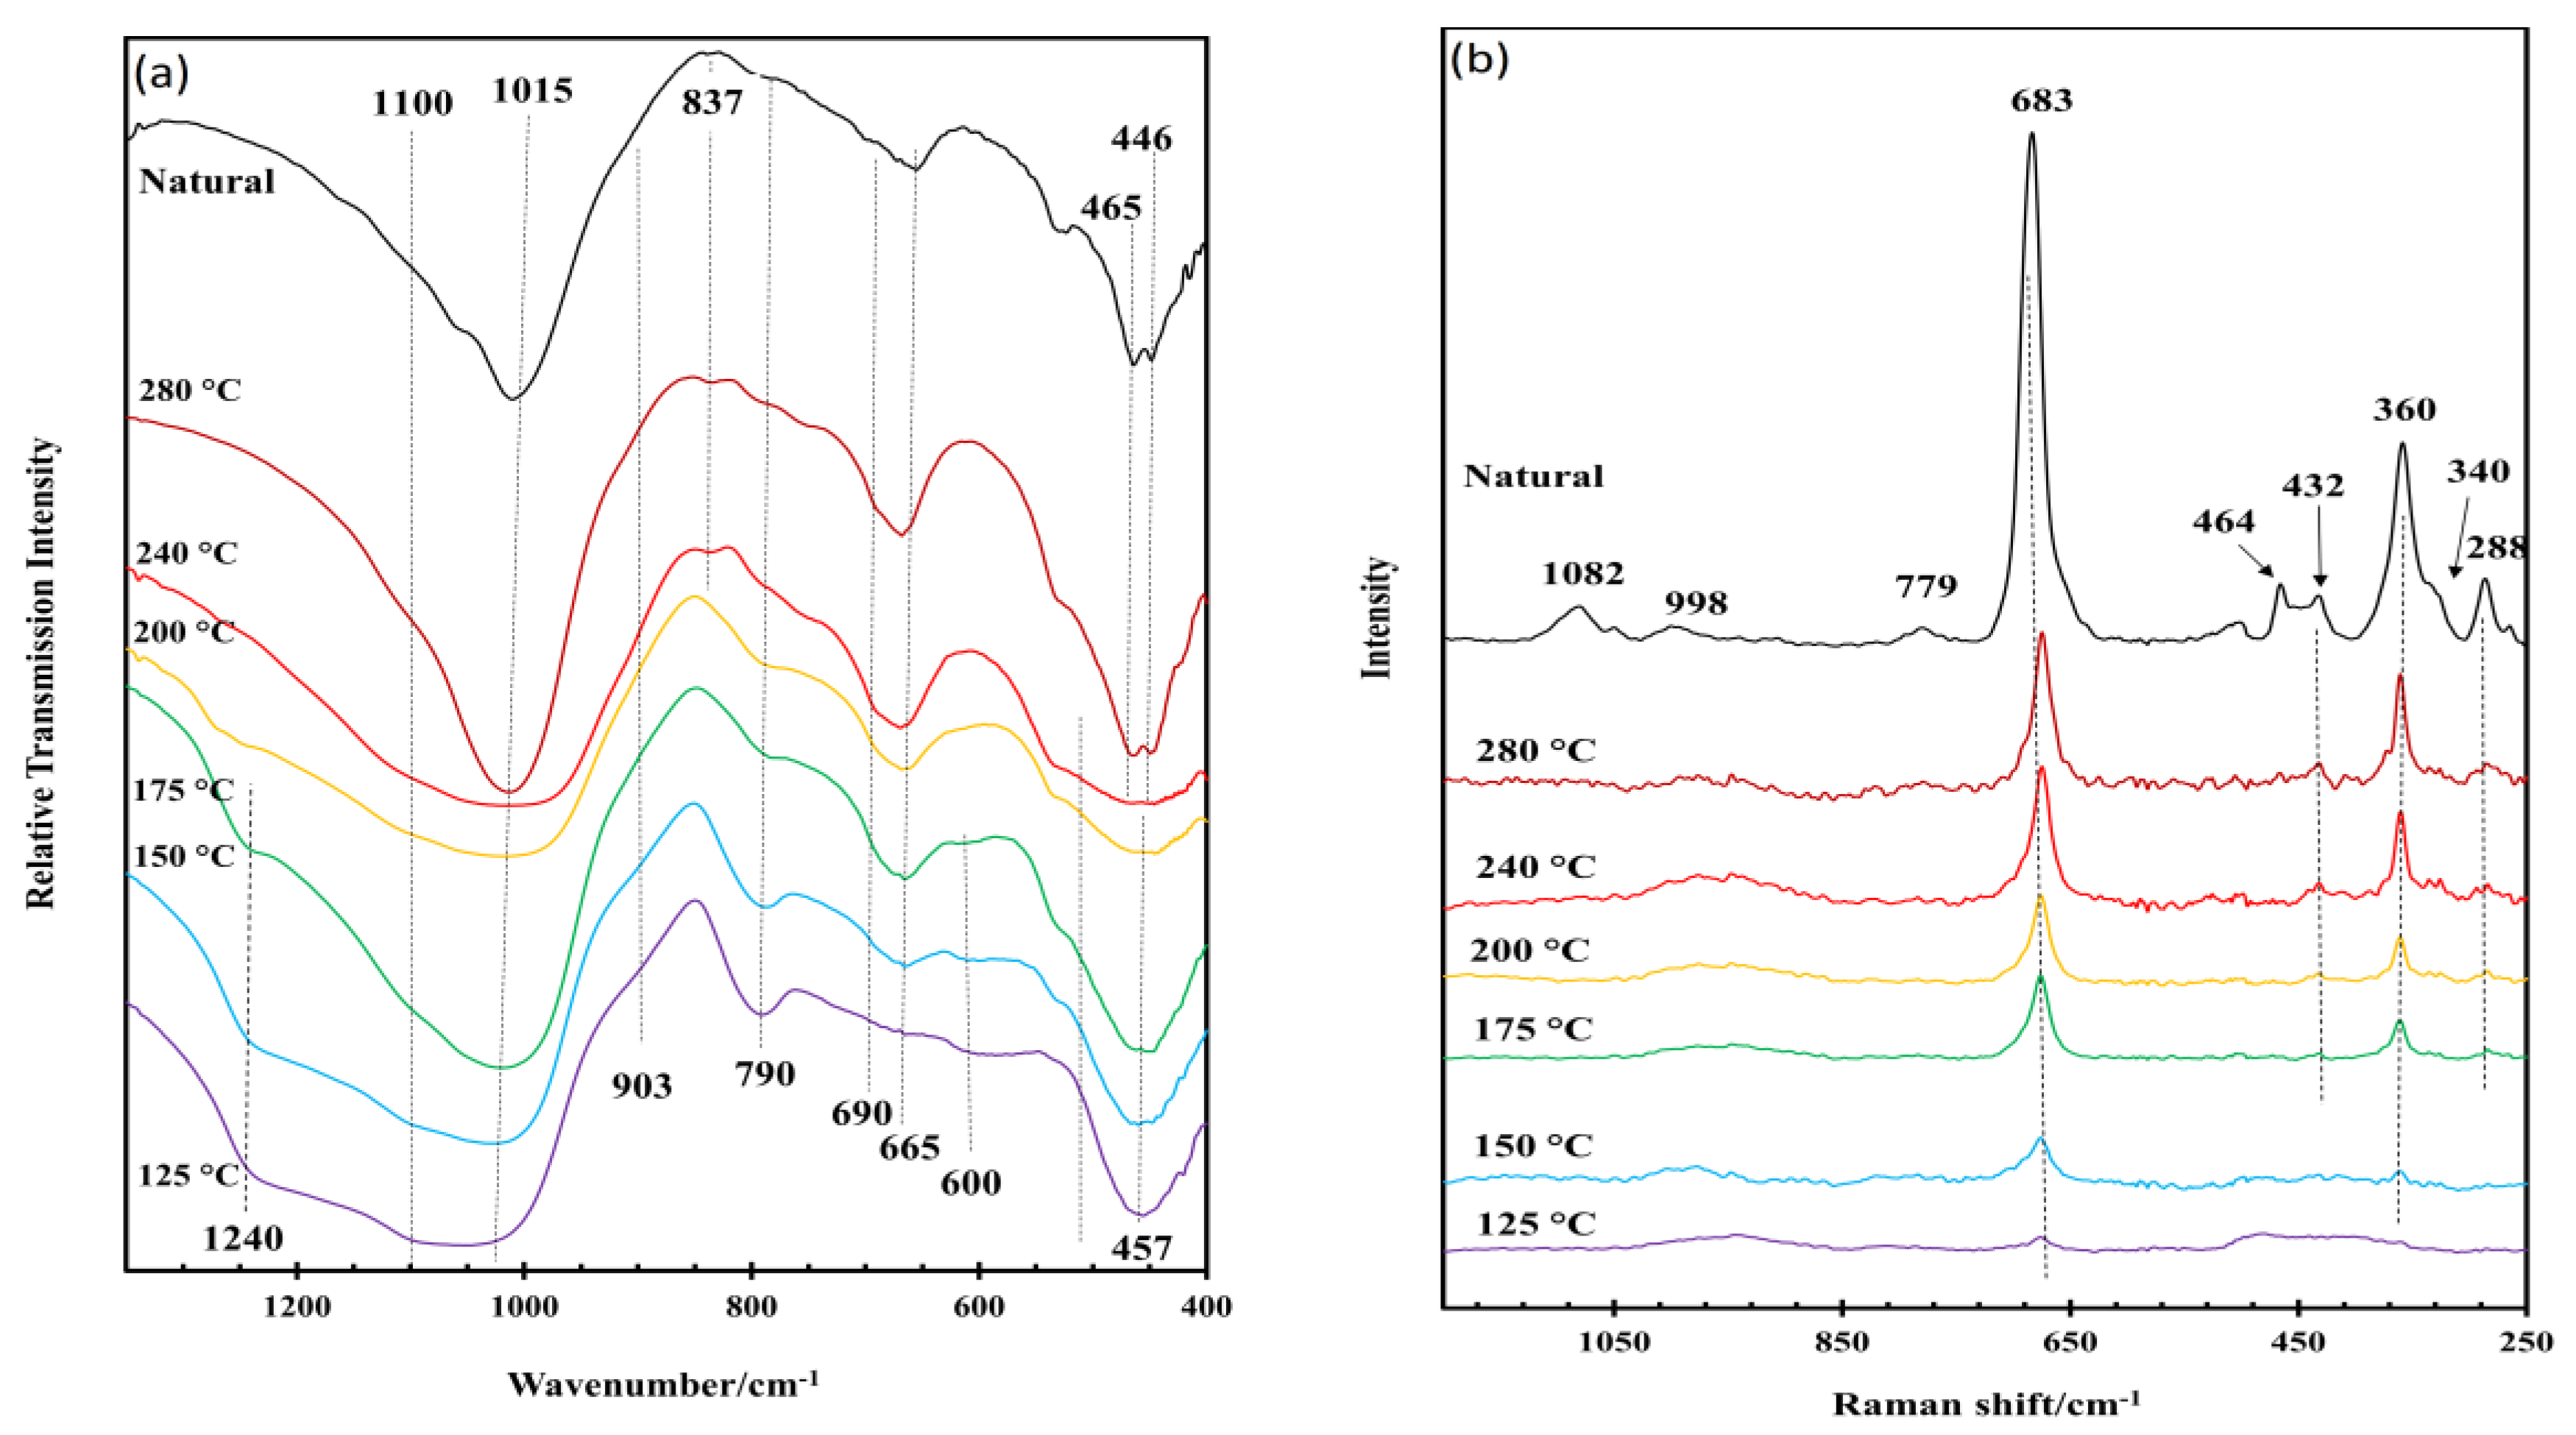
3.2. Effect of Hydrothermal Synthesis Temperature

Generally, the crystallization of clay minerals from dilute solution is assumed to start with the formation of octahedral sheets to which, at the same time or shortly after the octahedral sheets are formed, the tetrahedral sheets are attached to form single layers (e.g., [32]). This mechanism is centered around the notion that SiO4 tetrahedra will never freely polymerize into a two-dimensional network in solution, but instead will form a three-dimensional network. The formation of a two-dimensional silica tetrahedral network, as found in the tetrahedral sheets of clay minerals, is believed to require some sort of template to attach to, most probably to the initially formed octahedral sheets of low-solubility Al3+ hydroxides near neutral pH values. The results published by Kloprogge et al. [25] and Vogels et al. [26] on the synthesis of saponites indicate a mechanism initiating as slow transformations within the amorphous starting gel [34,54,55,56,57,58,59]. Figure 5 shows the progress of the saponite crystallization as a function of synthesis temperature under hydrothermal conditions, with the initial slow crystallization followed by a rapid increase between 75 and 200 °C, until all amorphous material has reacted at around 240 °C. Their crystallization mechanism was centered around the low solubility of silica in the pH range found during the crystallization. The existence of amorphous silica was easily observed in the FTIR spectra with broad bands in the 1000–1250 cm−1 region (Figure 6a). During crystallization, the SiO2 configuration changed from a disordered, three-dimensional network in the amorphous state to a more ordered, maybe already two-dimensional, structure as typically present in the tetrahedral sheets of clay minerals such as saponite, as shown by the disappearance of the bands at 900–910 and 1225 cm−1 and the continuous shift to lower wavenumbers of the initial 1043 cm−1 band. Since two overlapping bands around 660 and 690 cm−1 were determined to appear almost at the same time as the disappearance of the wide band at about 1250 cm−1 associated with amorphous silica, it is plausible that the octahedral and tetrahedral sheets in the saponite structure formed nearly at the same time. Sharpening of the other vibrations related to the various ν(SiO) modes was not found until the temperature reached about 200 °C. The presence of tetrahedral Al3+ substitution for Si4+ was only observed in saponites synthesized at 240 °C and 280 °C with the appearance of a new band at 837 cm−1. The formation of the octahedral sheets with both Mg2+ and Al3+ was revealed by the presence of bands due to both Mg2+ and Al3+ still bonded to hydroxyl groups at higher temperatures. This concurs with earlier studies by Kloprogge et al. [24,25] and Vogels et al. [26] who found that Al3+ initially stayed in solution until the pH dropped to values near neutral, forcing the Al3+ to substitute into the saponite structure at a later stage of the crystallization.
Vogels et al. [18] showed that substitution of other divalent cations for octahedral Mg2+ shifted the IR bands to lower values from those reported in natural saponite from Krugersdorp [60]. The ν(Mg3-OH) band at 3670 cm−1 for natural Mg2+-saponite moved to 3632 (Zn2+-saponite), 3620 (Co2+-saponite), and finally 3616 cm−1 (Ni2+-saponite). All these synthetic saponites showed sharp bands between 3600 and 3800 cm−1. (Note that the positions of the ν(Mg3-OH) band of Ballarat saponite is slightly different from the Krugersdorp saponite. Nevertheless, the effect discussed vide supra and in this paragraph still applies.) Partially or completely dehydrated natural and synthetic saponites typically exhibited two characteristic ν(M3-OH) modes and calcination at temperatures up to 500 °C did not visibly alter their positions. The position of the other ν(M3-OH) band varies with the compensating cation [43,44] and is shifted because of electronegativity differences of these octahedral cations [61]. Synthetic Ni-saponites also showed a minor third band at about 3700 cm−1, the origin of which was not clear at the time. Distinguishing between these bands is complicated when the saponites are hydrated caused by overlap with the broad ν(H2O) band of physisorbed and interlayer H2O. The ν2(OH) band in this region, associated with “free” OH groups [43,44], was hardly observed as a separate shoulder in hydrated saponites, but after partial dehydration of the saponite the band at 3732 cm−1 became distinctly visible. Farmer [49] originally ascribed this band to M3-(OH) units within the octahedral sheets influenced by the electric field related to the interlayer cations; however, Pelletier et al. [43,44] found the ν2(M3-OH) band position to be independent from the Si4+/Al3+ ratio and the type of octahedral or interlayer cation. Consequently, this band may alternatively come from hydroxyl groups coordinated to the tetrahedral sheets at the external surface of the clay particle such as Si–OH (silanol). The stretching vibration of similar terminal silanol groups in zeolites has been observed at similar wavenumbers [62].
Baldermann et al. [63] investigated the Fe–Mg-saponite solid solution series and found the ν(Mg3-OH) and ν(Mg2Al-OH) bands to be of relatively weak intensities (3680 cm−1) or even absent (3630 cm−1) in the synthesized ferrous saponite. When Mg-rich clay minerals have substantial iron substitutions, the ν(Mg3-OH) is normally shifted to lower wavenumbers. The synthetic Fe-Mg-saponites exhibited an intense IR band at about 3560 cm−1, which was interpreted as Fe2+ and Fe3+ substitutions for Mg2+ in the octahedral sheets [63,64]. Such an attribution is validated by the observation of a band at 816 cm−1 corresponding to Fe-OH-Fe bending [63]. Nevertheless, the δ(Mg3-OH) bands at 680 cm−1 present in all spectra of the Fe-Mg-saponites distinctly suggest the dominance of trioctahedral structural units. The IR bands below 500 cm−1, which could help to differentiate between trioctahedral and dioctahedral structural units in the octahedral sheet, were not well resolved and consequently could not be used.
The microwave-assisted crystallization of saponite was described by Vicente et al. [31] and Trujillano et al. [28], where the emergence of one intense band around 1105 cm−1 in combination with a shoulder at 1200 cm−1 verified the presence of the amorphous silica phase, as also determined by XRD, which was a function of the Mg2+ source and the corresponding pH in the starting material. The presence of a single band at 1027 cm−1 attributed to the ν(SiO) ordered within layers for the saponites formed under neutral to slightly basic (7–8) conditions using Mg(CH3COO)2. Three other IR bands were found at 1401, 3675 and 666 cm−1, which are due to the NH4+ bending, ν(Mg3-OH), and δ(Mg3-OH) vibrational modes, respectively [31]. Trujillano et al. [28] described two shoulders at 3650 and 3630 cm−1 attributed to ν(Mg3-OH), and signify the trioctahedral character of the saponite layers formed [65]. The ~3440 cm−1 band was assigned to the ν(OH) of physisorbed/interlayer water molecules with the associated bending vibration at 1635 cm−1. The shoulder at about 3220 cm−1 was interpreted as the O–H stretching vibrational mode involving hydrogen bonding. The spectra also exhibited lattice vibrations at 1010, 815, 660 and 450 cm−1 attributed to, ν(SiO), apical δ(AlO) in AlO4 units, δ(Mg3-OH), and δ(Si–O–Mg) bending modes, respectively.
Hydrothermally synthesized (from 125 up to 280 °C) saponites were studied by FT-Raman and FTIR spectroscopy and related to naturally occurring saponite by Kloprogge and Frost [34]. FTIR spectra with increasing synthesis temperatures provided information about a possible crystallization scheme from an amorphous starting gel (Figure 6a). A band at 457 cm−1 corresponding to the amorphous gel changed, at 280 °C, into two distinct bands at 447 and 465 cm−1, respectively, which was attributed to e 1 2 translational modes of SiO2 and AlOH of the saponite. Above 150 °C, a small band associated with the octahedral sheet in the saponite structure appeared at about 530 cm−1 (δ(M3-OH) perpendicular mode), followed by a band around 750 cm−1 (δ(AlMg-OH) deformation mode) above 200 °C. At 200 °C, two bands attributed to the a 1 2 SiO2 and apical Al–O bond of AlO4 in the tetrahedral sheet were observed at 691 and 837 cm−1, respectively. The most intense SiO2 band showed a continuous shift from 1043 to 1013 cm−1 with an increasing synthesis temperature. Two overlapping bands at about 660 and 690 cm−1 became visible before the loss of the wide band around 1240 cm−1 attributed to amorphous starting gel ν(SiO), suggesting that the octahedral and tetrahedral sheets formed nearly at the same time during crystallization of saponite. Sharpening of other bands associated with various ν(SiO) modes was not visible until the synthesis temperature reached 200 °C. The corresponding FT-Raman spectra suggested that with an increasing temperature, the first internal tetrahedral vibrational mode to become visible was at 683 cm−1 (at 150 °C), followed by the band at 360 cm−1 (175 °C). Finally, at about 240–280 °C, two bands around 430–465 cm−1 became visible (Figure 6b).

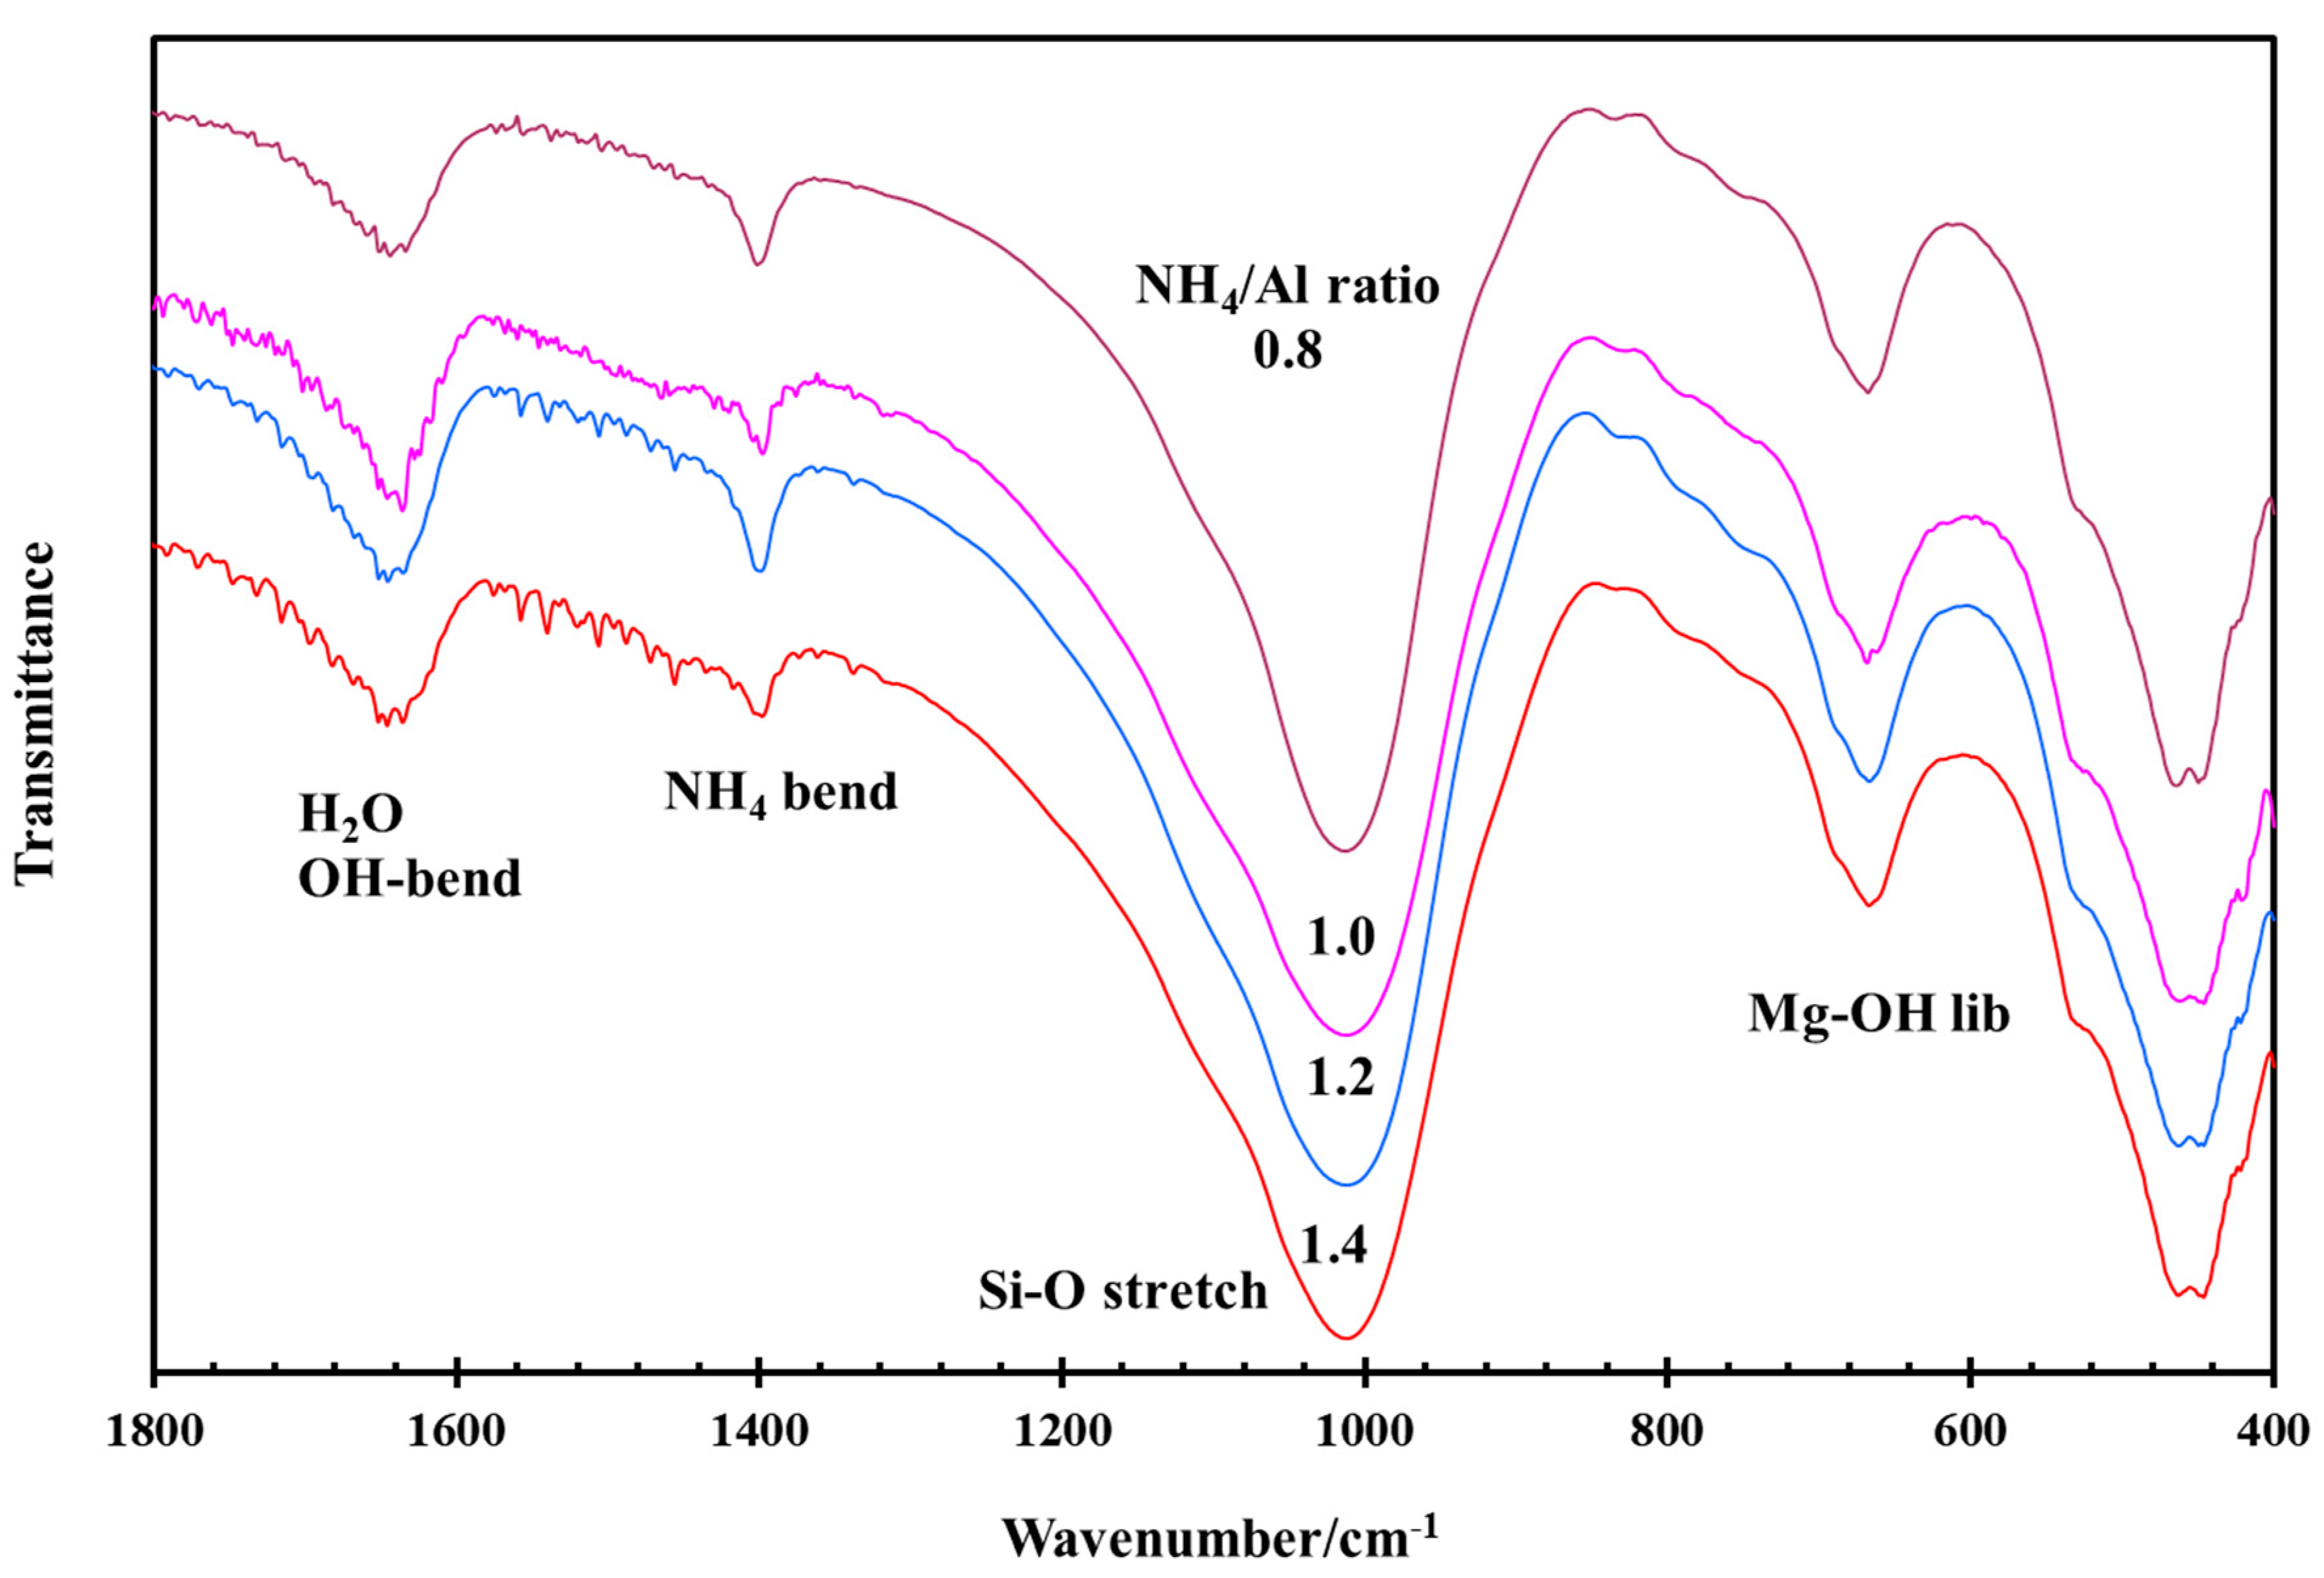
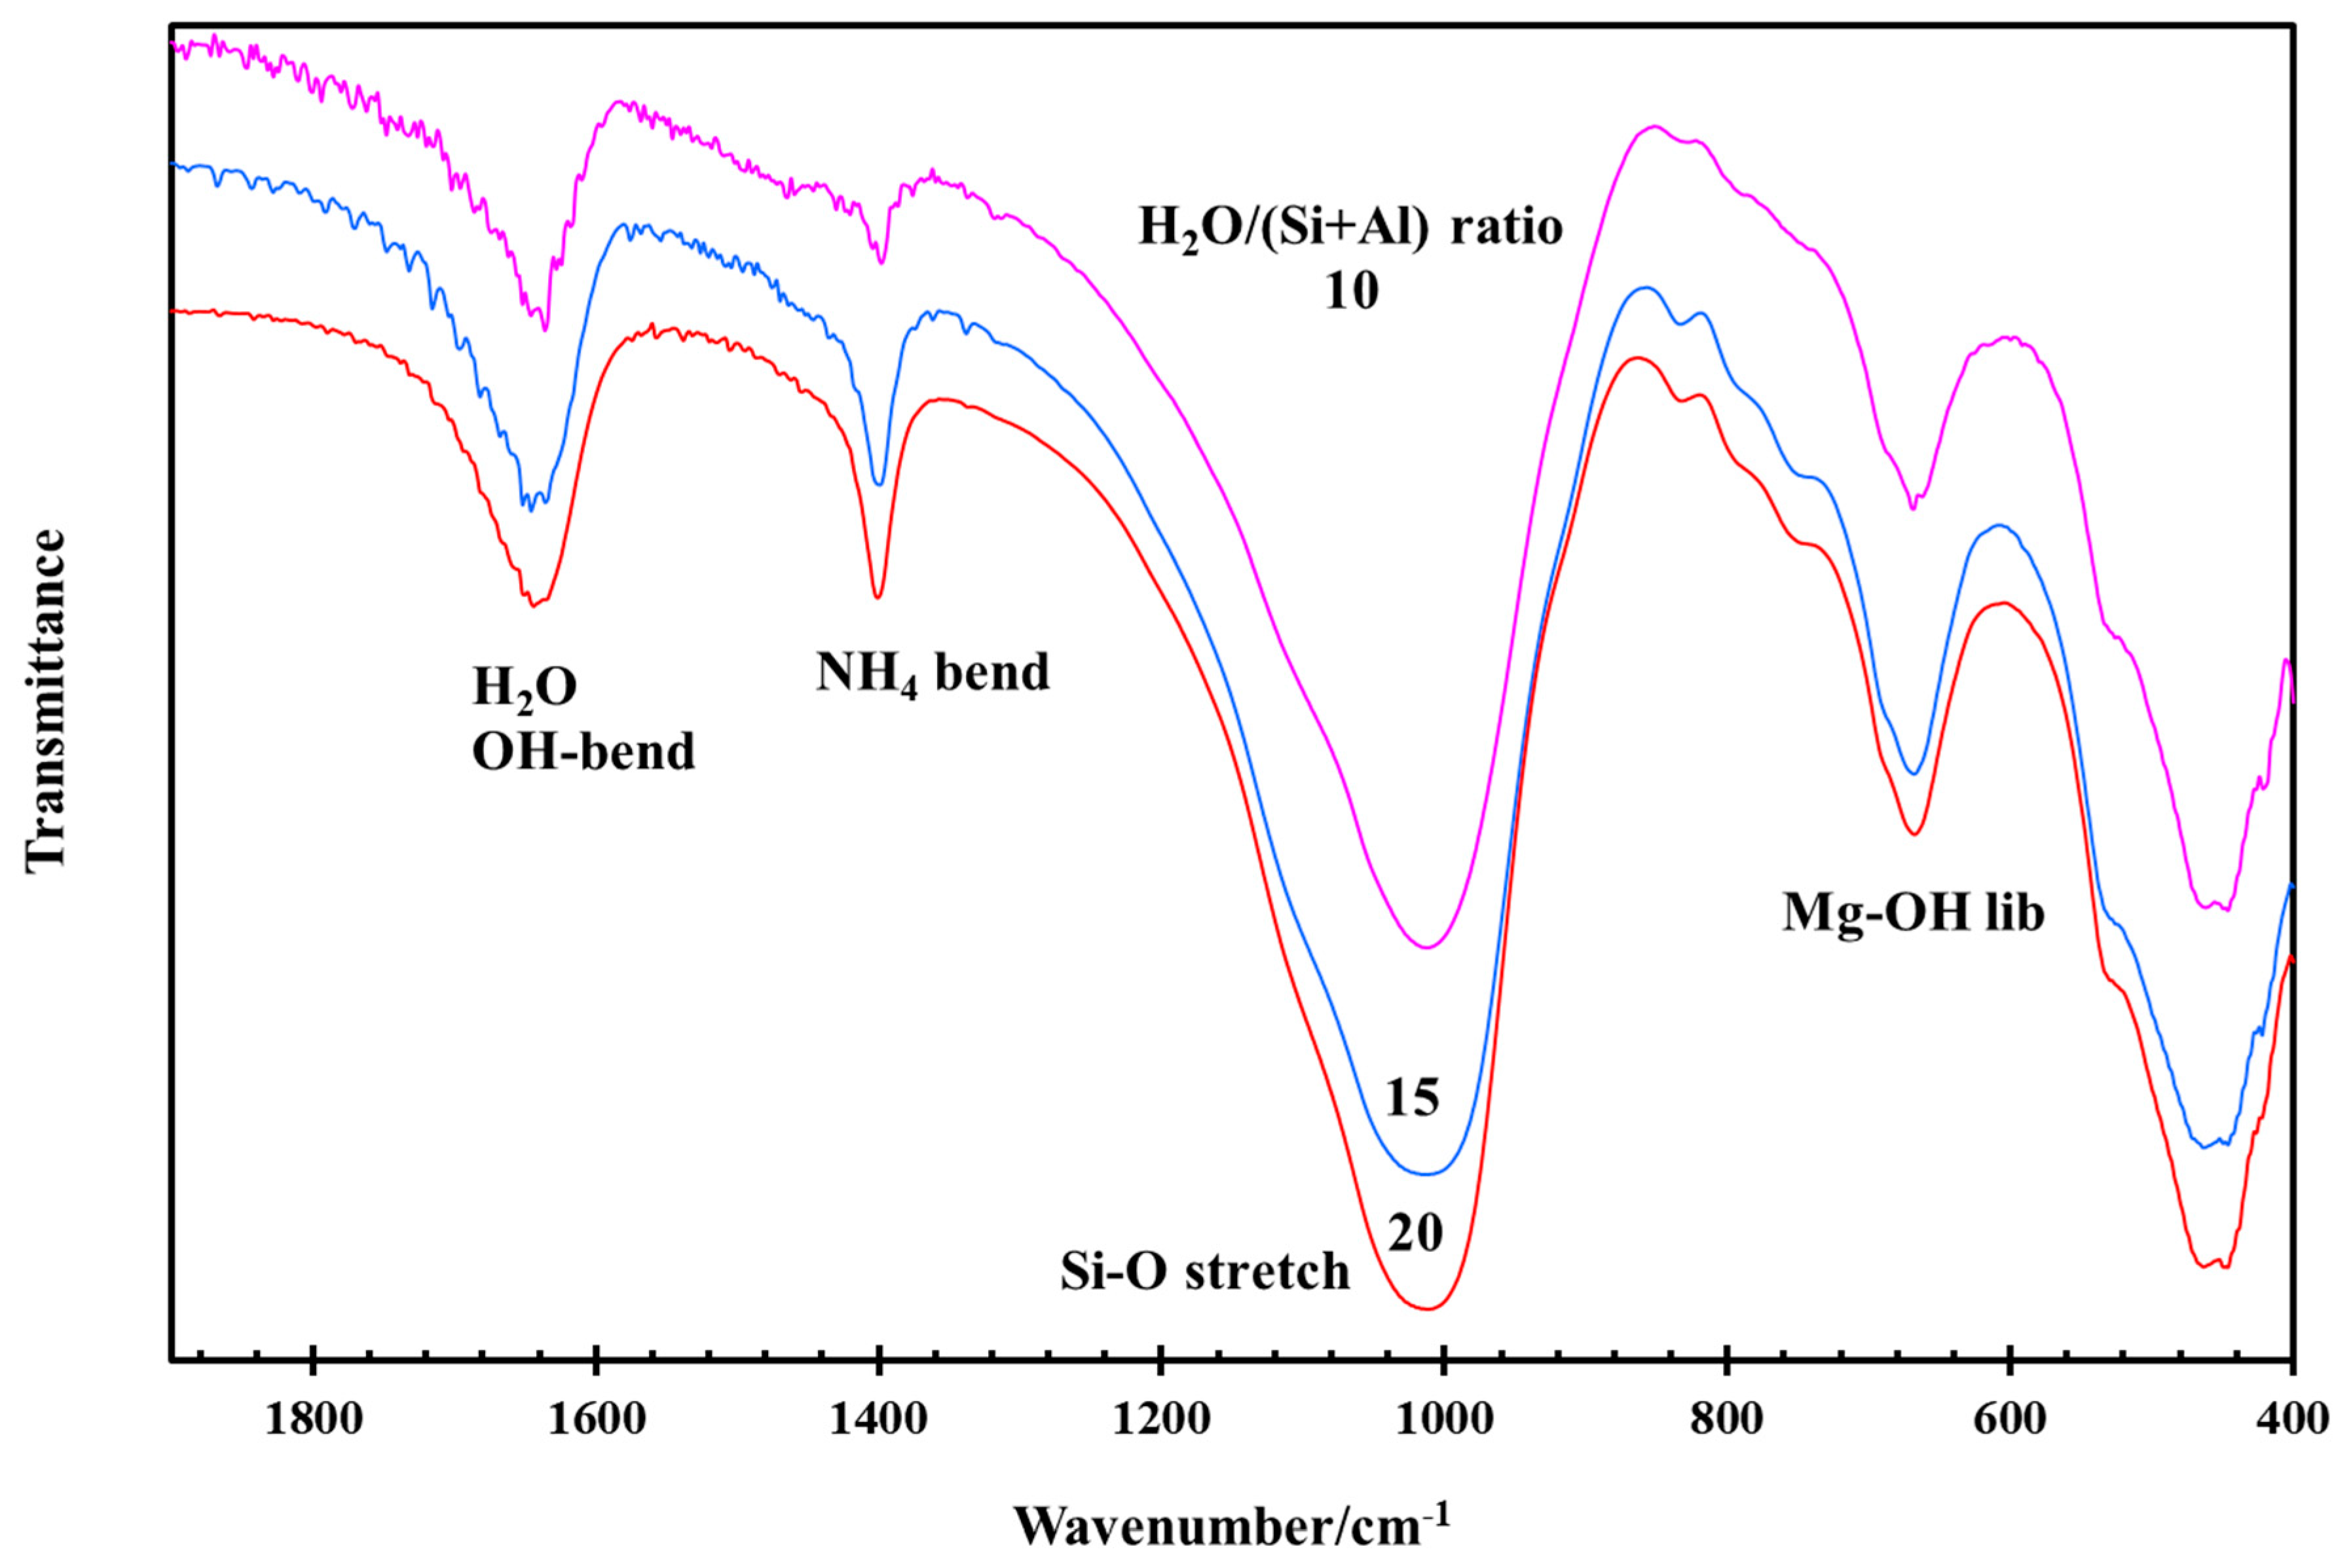
3.3. Effect of NH4/Al and H2O/(Si + Al) Ratios during Hydrothermal Synthesis

Figure 7 shows a significant similarity in the MIR spectra in the region from 1800 to 400 cm−1 of saponites hydrothermally synthesized from amorphous starting gels with an increasing NH4/Al ratio at 280 °C [25,57]. Only minor differences were observed in the band positions and intensities. The bands determined in the MIR spectra of these synthetic saponites are very similar to those of natural saponites, even though some Si-O vibrational modes have very low intensities or are absent from the spectra of the synthetic saponites. The band at 1430 cm−1 associated with the exchangeable interlayer cation NH4+ is similar to the band observed at 1435 cm−1 for the synthetic NH4-mica tobelite [66], though the band is slightly shifted towards lower wavenumbers possibly as a result of the hydration and higher degree of freedom of NH4+ in the interlayer space of saponite. A very small amount of amorphous material was detected in the MIR spectra as low intensity bands at about 1254, 912 (shoulder), 779, and 446 cm−1. Increasing the initial NH4/Al ratio in the starting amorphous gel had only a small influence on the pH during the synthesis and on the cation exchange capacity (between 33 and 45 meq/100 g), but no distinct influence was observed in the MIR spectra. No intensity increase in the NH4 band at about 1430 cm−1 was detected. The incorporation of only a very small amount of NH4+ in the interlayer space of the synthetic saponites was due to the fact that under the hydrothermal synthesis conditions a significant portion of total ammonium will be present in the vapor phase and not in the reaction mix and consequently the ammonium was not included in the saponite structure as the interlayer cation.
Figure 8 shows the low-wavenumber region of the synthetic NH4-saponites as a function of the H2O/(Si + Al) ratio in the amorphous starting gel. The crystalline structure of the saponite was not influenced but the volume of water present in the saponite interlayer space increased from H2O/(Si + Al) ratio of 10 to 15 and then appeared to remain constant. This indicates that at a H2O/(Si + Al) ratio of 15 the saponite interlayer space was saturated with water. The water OH-stretching modes at about 3220 and 3430 cm−1 likewise showed this. In an earlier publication, it was determined that the amount of water present during the hydrothermal synthesis of NH4-saponite affected the average saponite particle size, saponite crystallinity, and the remaining amount of amorphous material [25]. This is visible in Figure 8 by the increased definition of the different bands in the region from 400 to around 1200 cm−1, which are associated with vibration modes within the saponite layer structure. Very distinct examples are the bands at 740, 779, 836, and 912 cm−1, attributed to Al-OH deformation, amorphous, Al-O apical AlO4, and amorphous vibrational modes, respectively. The amorphous bands point to a small increase in the amount of amorphous material remaining with increasing water content, which was not detected earlier using XRD and TEM [25]. Moreover, with an increasing H2O/(Si + Al) ratio, the amount of NH4+ present in the interlayer space appeared to increase marginally, which agrees with the very minor increase in the CEC from 46 to 47 meq/100 g, even though the CEC measurements included all possible exchangeable cations (Mg2+, Al3+ and NH4+) and perhaps underestimated the increase in NH4+ relative to Mg2+ and Al3+. Band deconvolution showed the presence of a minor amount of NH4+ by the 3118 cm−1 band (Table 2). The other NH4 -stretching bands at 3300 and 2850 cm−1 observed for tobelite [66] were not observed in the NH4-saponite MIR spectrum. The other bands are vibrational modes attributed to the OH-stretching modes of physisorbed and interlayer water, Al-OH, Mg-OH, and Si-OH. Here, once more, similar to the 1430 cm−1 vibration, there was no distinct proof for any influence of the NH4/Al ratio on the amount of NH4+ determined in the saponite interlayer space.

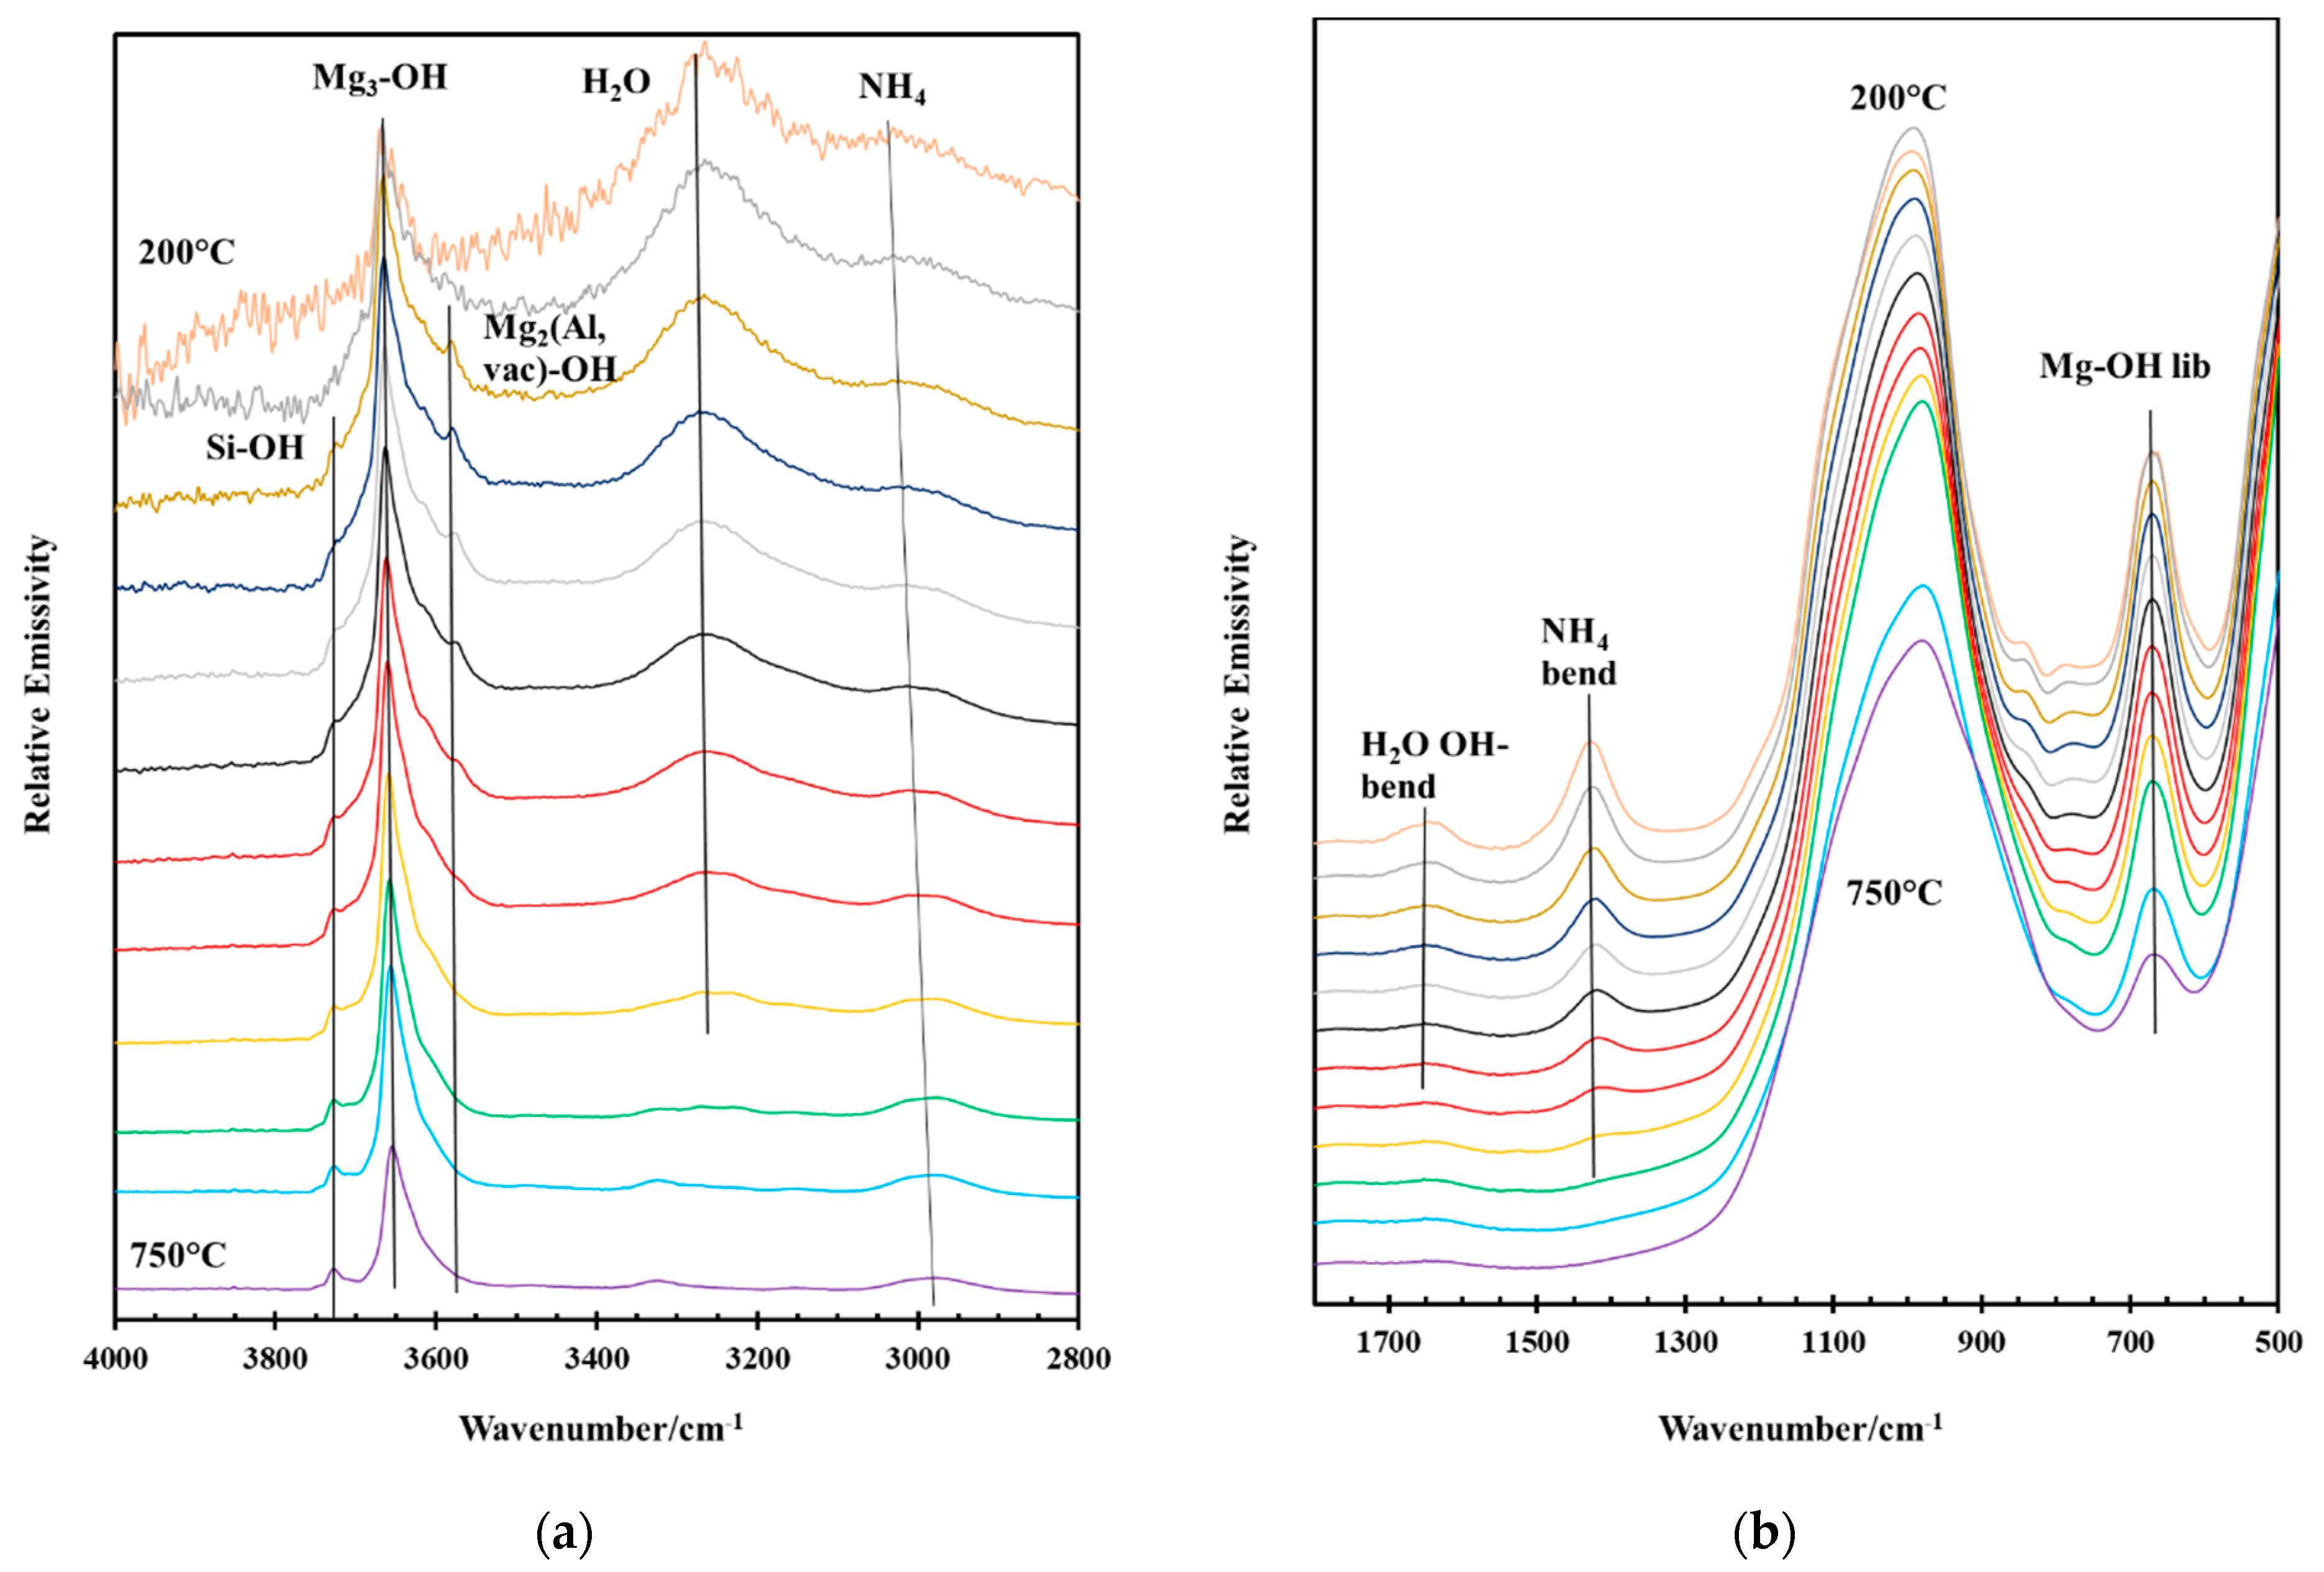
3.4. Thermal Decomposition of Natural and Synthetic Saponites

The study of thermal changes of saponite (dehydration, dehydroxylation) using in-situ spectroscopic techniques has been rather limited. The method of measuring discrete vibrational wavenumbers emitted by thermally excited molecules, called Fourier Transform Infrared Emission Spectroscopy (FTIR ES, or shortly IES) has not been extensively employed to study the thermal behavior of minerals but in recent years our research group has published extensively on this topic, focusing, in particular, on clay minerals [38,52,67,68,69,70,71,72,73,74,75]. The key benefits of IES can be summarized as: (1) the sample spectra are obtained in situ at increasing temperatures; (2) IES requires no sample treatment other than preparing the sample with submicron particle size as a thin layer on the sample holder. In addition, IES eliminates the problems of heating the samples followed by quenching before measuring an IR spectrum, since IES measures the thermal decomposition process as it is actually occurring.
The IES spectra are similar to the infrared absorption spectra (see Section 3.1), though they exhibit a distinct broadening of all bands. Since the first IES spectrum was measured at 200 °C, the water OH-bending and OH-stretching modes are less intense and exhibit more noise caused by partial dehydration and the presence of water vapor in the IES cell. Upon heating to 750 °C, important differences appear associated with changes in the saponite structure (Figure 9).
The water OH-bending and OH-stretching modes can no longer be distinguished from the background. Upon heating, the Si-O stretching modes exhibited a broadening. More important are the changes of the OH modes, and in the synthetic saponite also the exchangeable cation NH4 modes, related to the octahedral sheets of the saponites. Thermal analysis of the synthetic saponites provided evidence that dehydroxylation begins around 525 °C, where it overlaps with the loss of ammonia and the last step of the dehydration (strongly bonded interlayer water), and reaches a maximum between 750 and 860 °C [52]. This agrees well with the dehydroxylation behavior of natural saponites, which typically dehydroxylate above 500 °C and the crystallization of enstatite, Mg2Si2O6, around 740 °C [76]. This implies that the dehydroxylation based on the thermal analysis will not be completely finished in the IES. This is rather obvious in Figure 9. The 4000–2800 cm−1 region exhibits, first of all, the loss of the interlayer water OH-stretching modes and furthermore an intensity decrease in the OH band attributed to the Mg2(Al,vac)-OH mode. On the other hand, the OH band attributed to the Mg3-(OH) mode showed a much lower intensity decrease. Comparable observations were made by Frost et al. [77], with the dehydroxylation for Milford saponite at approximately 900 °C. This implies that the OH groups linked to the minor amounts of aluminum or vacancies in the octahedral sheet are not as stable as those linked only to magnesium. Contrary to previous studies on the infrared emission spectroscopy of hectorites and beidellites where silanol, Si-OH, groups were created once the dehydroxylation process started and disappeared after dehydroxylation was finished [73,78], a silanol band is present at 25 °C in the mid-IR spectra of all saponites, which can be observed up to 750 °C in all samples.
The changes in the OH-stretching region are complemented by comparable changes in the region between 1800 and 500 cm−1, where the Mg2Al-OH translation vibrational mode at about 450 cm−1 and the corresponding deformation vibrational mode at about 750 cm−1 show an intensity reduction and have disappeared in the 700 °C spectrum. In its place, another band is formed at about 730–740 cm−1. This band can be assigned to the partial restructuring within the saponite’s original octahedral sheet and the development of a new Al-O bond after dehydroxylation. This is similar to the formation of a new Al-O band around 722 cm−1 observed in dehydroxylated beidellite [73]. Since the dehydroxylation process has not finished at 700–750 °C, no different bands pointing to the creation of other Mg-O-Mg, Mg-O-Al or Mg-O-Si bonds can be detected. Only an intensity loss of the Mg3-OH vibrational modes is visible.
Changes in the IES spectra allow the modelling of the dehydroxylation process of saponite. Generally, dehydroxylation of clay minerals, including smectites such as saponite, entails the release of hydroxyl groups in the original octahedral sheet through the reaction of two OH groups forming one H2O molecule and a proton, while at the same time forming a new metal–oxygen bond in the octahedral sheet. This change in the saponite crystal structure is visible in the IES spectra through the decrease and in the end the loss of the bands attributed to the Mg-OH-stretching and Mg-OH-bending modes. Kloprogge, Komarneni, Yanagisawa, Fry, and Frost [73] observed that beidellite dehydroxylation took place through the creation of edge Si-OH groups at temperatures over 400 °C, i.e., the liberated OH and H+ moved from the octahedral sheet to the Si(edge) of the tetrahedral sheet during heating, forming temporarily Si-OH groups before being lost as water vapor. This was reinforced by the disappearance of the Si-OH-stretching mode after the dehydroxylation process had finished. The IES spectra of both natural and synthetic saponites do not present support for this model as the Si-OH-stretching modes are already present at 25 °C in the MIR spectra and did not substantially alter throughout the dehydroxylation up to 750 °C. Nevertheless, one cannot exclude the possibility that the Si-OH groups act as an active intermediate in the process of dehydroxylation.

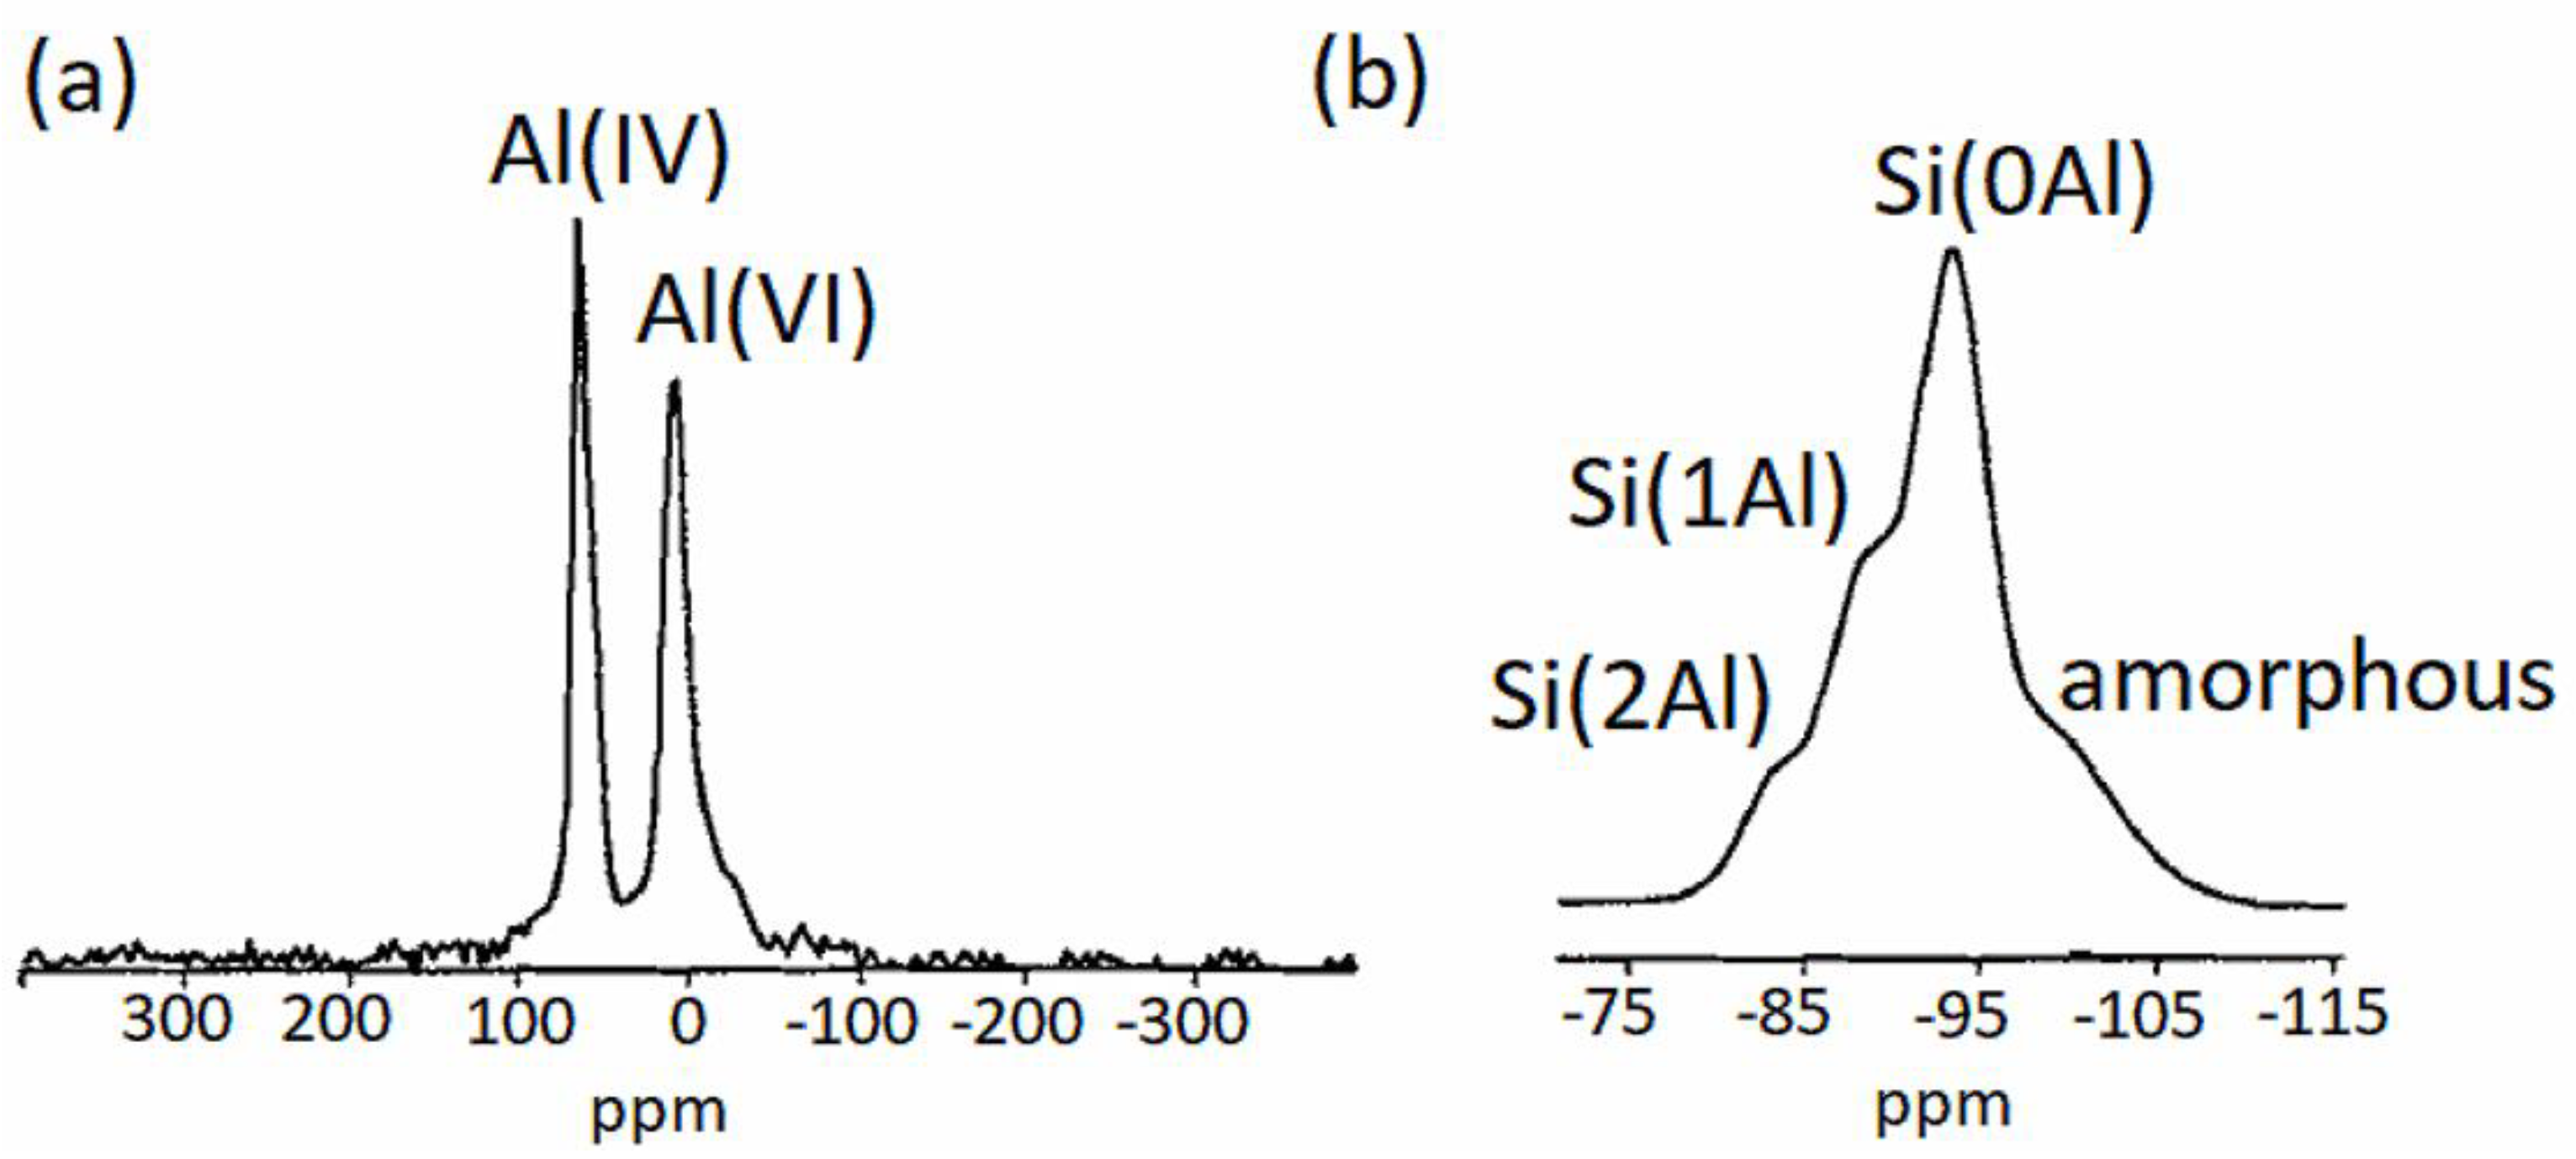
4. MAS-NMR of Synthetic Saponites

Theoretically, the synthetic saponite should contain only Al(IV) substituted for Si in the tetrahedral sheet of the saponite structure, while only Mg is present on the octahedral positions. Based on the 27Al MAS-NMR results of the hydrothermally synthesized saponites (Figure 10a), this is clearly not the case as a distinct resonance is observed for Al(VI). This resonance was interpreted as largely being due to substitution of Al in the octahedral sheet for Mg, hence lowering the amount of Al substitution for Si in the tetrahedral sheet and consequently lowering the layer charge. Exchange experiments of ammonium-saponite with Al(NO3)3 have proven that, although a small increase in Al content and minor change in chemical shift was detected, 27Al MAS-NMR cannot quantitatively differentiate between Al on octahedral sites and on interlayer sites caused by the overlap of the signals. The initially observed 58.3 ppm resonance, which diminished with increasing synthesis temperature, is comparable to the tetrahedral resonance at 57.3 ppm of the starting gel and was attributed to Al present in the amorphous phase (in accordance with the increase in crystallization as shown in Figure 5). Because Al has a quadrupolar nucleus, the Al(IV):Al(VI) ratio at low magnetic field will be less precise than the Si/Al(IV) ratio based on 29Si MAS-NMR. Fortunately, the error due to spinning sidebands can be excluded in a high magnetic field (11.7 T) and with a high sample spin frequency (14 kHz). The saponites show an increase in Al(IV) to Al(VI) ratio from 1.5 to 3.8 with a hydrothermal synthesis temperature increase from 125 to 280 °C—i.e., with increasing temperature less Al is incorporated in the octahedral sheet, moving closer to the ideal saponite composition.
29Si MAS-NMR spectra showed three resonances of Si atoms coordinated with one or more of the next-nearest tetrahedral Al atoms in the tetrahedral sheets of the saponite structure. The resonance with the highest intensity was observed at −93.1 + 0.4 ppm, assigned to Si(0Al). Furthermore, a shoulder at −88.5 + 0.4 ppm and a small shoulder at −83.2 + 1.2 ppm were distinctly present, and were attributed to Si(1Al) and Si(2Al), respectively [79] (Figure 10b). An additional resonance was initially observed at 102 ppm, which is due to amorphous material, and diminished with increasing synthesis temperature. The fraction of tetrahedral Al(1Al) linkages and Si(2Al) linkages can be calculated [79] from the resonance intensities. If Loewenstein’s avoidance principle is true [80], the fraction of tetrahedral Al(1Al) linkages should be zero. The tetrahedral Al substitution can be calculated directly from the 29Si MAS- NMR spectra using the equation [81]:
( Si / Al ) IV   =   n   =   0 3 I S i ( n A l ) n   =   0 3 ( n 3 ) I S i ( n A l )
An average Si/Al(IV) ratio of 5.5 was observed for all saponites, which is very close to the theoretical value of the saponites based on the Si/Al ratio of the starting material (3.4/0.6 = 5.67) (Table 3). The very small fraction of Al(1Al) linkages indicates that the distribution of aluminum in the tetrahedral sheet is close to a statistical distribution [82]. The results of the 27Al MAS-NMR results indicate that, despite the significant substitution of Al for Mg in the saponite structure, the overall Al for Si substitution remained nearly constant, but the layer charge increased with the increase in synthesis temperature.
The observed 29Si chemical shifts δ are linked to both the overall layer charge and the SiO4 tetrahedral rotation within the a-b plane of the saponite layer structure. The rotation of SiO4 tetrahedra within the tetrahedral sheet was caused by a mismatch in the lateral dimensions between the tetrahedral and octahedral sheets. The b-axis length of the tetrahedral sheet was systematically affected by Al(IV) for Si(IV) substitution. The calculation of these parameters from solid-state NMR allows one to gain information that cannot be determined from standard powder XRD patterns. The relationship between the chemical shift δ of Si(0Al) and average Si-O-(Si,Al) bond angle θ can be represented as:
δSi(0Al)(ppm) = −0.619θ − 18.7
The average deviation of the Si-O-Si bond angle θ from hexagonal symmetry (θ = 109.47°) allows the determination of the b-axis parameter bNMR using Equation (3) [83]. An α of 0° signifies an undistorted tetrahedral sheet and may increase to a theoretical maximum of 30°:
cos   α   =   b NMR b ideal
with bideal being given by Guggenheim [84] as:
b(Si1−xAlx) = 9.15 − 0.74x
An alternative method to calculate bideal was published by Suquet et al. [85]:
bideal = 9.174 + 0.079Al(IV) − 007Al(VI)
The bNMR values based on the 29Si and 27Al NMR data obtained by Kloprogge et al. [39] with both equations were noticeably smaller than the b-values observed by XRD (Table 4). Equation (5) is based on the hypothesis that substitution in the octahedral sheet takes place as one-to-one Mg2+-Al3+ substitution rather than the usually occurring muscovite substitution of 3Mg2+ for 2Al3+ + 1 vacancy. Recalculation of α based on bXRD and bideal (Equation (4)) produced a minor correction of Equation (2):
δ Si ( 0 Al ) ( ppm )   =   0.691 θ     20.6   ±   0.4
while recalculation using bideal (Equation (5)) produced s a somewhat larger change in Equation (2):
b ideal   =   0691 θ     22.2   ±   0.5
The determined α values were similar to those calculated for other trioctahedral phyllosilicates with average values from 6° to 10° though slightly larger than the values obtained from structural refinements [83]. The slightly smaller correction in Equation (6) supports the application of the muscovite substitution rather than the one Mg to one Al substitution as used by Suquet et al. [85]. This different substitution mechanism has a substantial effect on the charge of the saponite layers and, consequently, on the interlayer composition.
In contrast to the 27Al MAS-NMR results for hydrothermally synthesized saponites, the saponites synthesized using the urea method by Vogels, Kloprogge, and Geus [18], though of lower crystallinity, mainly showed Al(IV) in their structures with resonances at about 56 ppm. Only a very weak resonance at 9 ppm was observed for Al(VI). The use of urea in the synthesis clearly had a distinct influence on the coordination of Al during the crystallization, limiting the amount of Al(VI) that could substitute for Mg in the octahedral sheets. 27Al and 29Si MAS-NMR experiments were also performed by Vogels et al. [18] to determine the influence of the Si/Al ratio on the incorporation of Al3+ in the saponite structure. Lowering the concentration of Al3+ in the starting material caused a decrease in the Q3 Si(1Al) resonance, and to a smaller extent the Q3 Si(2Al) resonance. The relatively high intensity of the resonance observed at around −86 ppm in saponites synthesized from a gel with a Si/Al ratio of 39.0 is most likely not caused by the Q3 Si(2Al) considering the low concentration of Al3+ and the nearly complete disappearance of the Q3 Si(1Al) resonance. A better interpretation for the resonance at −86 ppm is Q2 Si(0Al) found at the saponite crystal edges. The synthetic saponites formed with the urea method are composed of extremely small particles (much smaller compared to hydrothermal methods such as the one used by Kloprogge et al. [39]) with a high amount of Si4+ at the clay edges. The fact that this Q2 Si resonance in 29Si MAS-NMR spectra of clay minerals is generally not detected may be ascribed to the relatively large particle size of these (natural) samples compared to the saponite samples synthesized by the urea method.
Vogels et al. [86] also studied the substitution of Ga for Al as well as B for Si substitution in the saponite structure. It is expected that Ga3+, the same as Al3+, can be situated within both tetrahedral, Ga(IV), and octahedral, Ga(VI), coordination sites in the saponite structure. The 71Ga MAS-NMR spectra of Ga3+ substituted Mg- and Zn-saponites showed two broad resonances at around 25 and 180–195 ppm, assigned to Ga(VI) and Ga(IV), respectively [87]. For the synthetic Mg-saponites the position of the Ga(IV) resonance was shifted by around +10ppm compared to the Ga(IV) resonance in Zn-saponites. The more positive shift is the result of the higher ditrigonal rotation angle α in the tetrahedral sheets caused by the smaller octahedral sheets in Mg-saponites compared to Zn-saponites. An increase in the rotation angle α has been demonstrated to cause a shift of the resonances of the tetrahedral cations to higher values for related Al3+ containing 2:1 phyllosilicates including hydrothermally synthesized saponites [39,81]. Compared to the Al-substituted saponites synthesized with the urea method, much more Ga(VI) was formed and substituted in the saponite octahedral sheet.
For most minerals, 11B MAS-NMR spectra show a resonance found at about 19 ppm associated with trigonal B3+ (BO3), whereas tetrahedrally coordinated B3+ (BO4) exhibits a resonance at around 2 ppm [87]. Because of the variations in quadrupole coupling constants the BO3 units are generally observed as broad doublets, while BO4 resonances are sharp. Substitution of B3+ for Si4+ in silicate lattices causes a shift to higher field of the BO4 resonance. The Si/B starting gel for the saponite synthesis only exhibited a sharp resonance around 1.7 ppm, probably due to BO4 coordinated with SiO4 tetrahedra. The hydration state did not substantially change the 11B MAS-NMR spectrum of the Si/B gel. The small though noteworthy shift of the BO4 resonance of the synthetic saponite relative to the gel was assigned to the substitution of B3+ for Si4+ in the saponite’s tetrahedral sheet. Heating to 300 °C distinctly proved the transformation of BO4 units to BO3. Rehydration of the calcined saponite overnight at 25 °C in a desiccator in the presence of water caused a complete reversal of BO3 back to BO4.

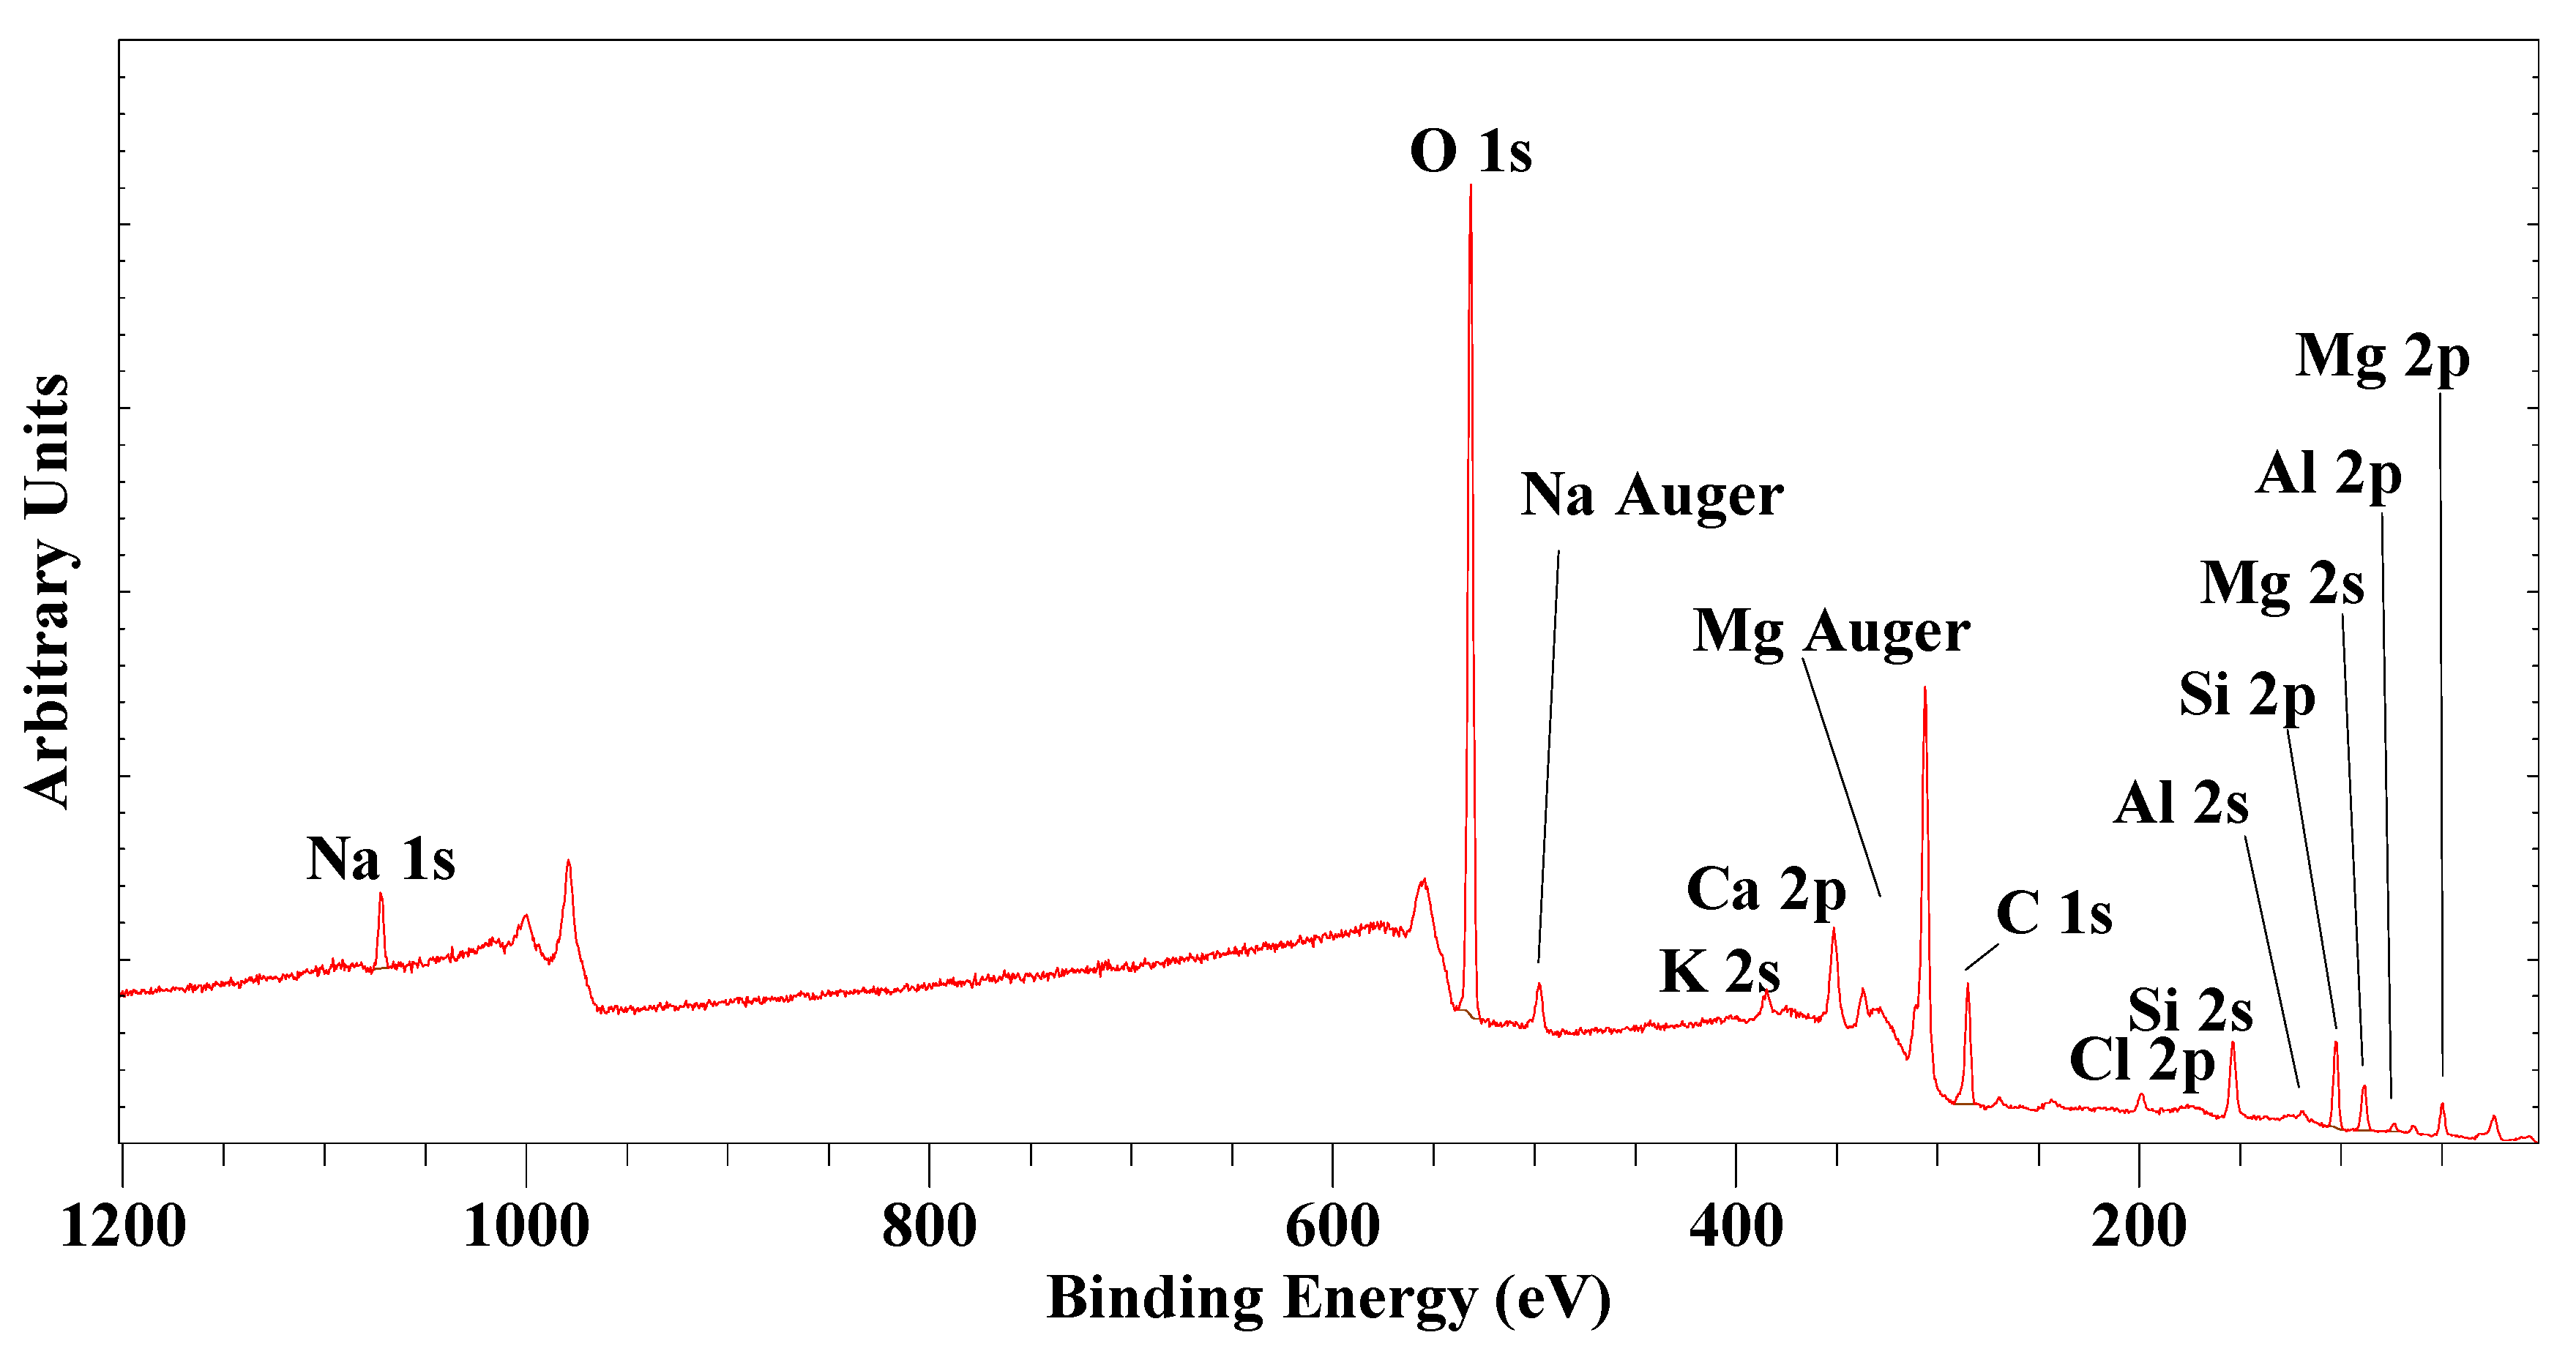
5. XPS Characterization of Natural Saponite

Figure 11 gives the survey scan of natural saponite SapCa-2, identifying all the peaks observed. Since XPS is an elemental analysis technique that can independently analyze O, the chemical analysis is reported in atom percentages and not in percentages of the oxides as is commonly used in geology. The oxygen content is a function of not only the saponite structure but also of water adsorbed or in the interlayer of the saponite. The XPS results are in good agreement with earlier published chemical analysis, although there are a couple of marked differences. Due to the rather low signal strength of iron (Fe 2p), it is difficult to get a very reliable iron analysis and here no iron was observed, though other methods did report a trace of iron. Chlorine (2.2 at%) was observed for SapCa-2, which has not been observed before (Table 5).
The Si atoms in saponite are tetrahedrally bonded to O atoms, and form Si–O–Si and Si–O–Al linkages within the tetrahedral sheet and (Al, Fe, Mg)–O–Si linkages between the tetrahedral and octahedral sheets. The binding energy of the Si 2p3/2 is 102.75 eV (line width of about 1.3 eV), which is considerably shifted compared to quartz (α-SiO2). Kloprogge and Wood [90,91] and Vantelon et al. [92] have shown that the effect of charge and the location of the charge (e.g., tetrahedral substitution of Si4+ by Al3+ or octahedral substitution of Mg2+ by Li2+) triggers an increase in the electronegativity of SiO4 which causes the decrease in the observed binding energies. In general terms, an increase in the Si/Al ratio and the positive shift in binding energy can be correlated with the relative degree of ionicity of the oxide bonds. The Si–O bond is considerably more covalent than the Al–O bond and the relative degree of covalency/ionicity of saponite is altered by the substitution of Al3+ for Si4+ [93]. Even the position and nature of the exchangeable interlayer cations have a small effect on the electronegativity of the SiO4 tetrahedra in the tetrahedral sheets. Earlier work in our group on the exchange of Na+ by an organic surfactant in the interlayer of montmorillonite caused a reduction in the binding energy of about 1 eV together with an increase in the basal spacing from 12.4 to 17.8 Å. This suggests that the binding energy decreases when compensating charges are located further away from the surface in the interlayer space [94]. Other changes in the composition of the octahedral sheet on the Si 2p binding energies are in the order of 0.1 to 0.3 eV, which is not much more than the typical precision of the XPS instrument.
In saponites, aluminum can be found both in six-fold coordination in the octahedral sheets and in four-fold coordination in the tetrahedral sheet when substituting for silicon (see previous section on MAS-NMR). According to the Loewenstein avoidance rule, no further splitting can be observed as Al atoms are always surrounded by three next-nearest neighboring Si atoms in the tetrahedral sheet or three other metal atoms (e.g., Mg, Fe, Li) in the octahedral sheet, preventing the occurrence of Al–O–Al linkages [95,96]. Hence, the Al 2p peak is reasonably symmetric with a relatively narrow width. Curve fitting results in two peak maxima at 73.95 (AlIV 90%) and 74.91 (AlVI 10%) eV with a linewidth of about 1.35 eV. Earlier publications support this assignment with the binding energy for octahedral Al larger than that of tetrahedral Al [97,98]. Saponite SapCa-2 clearly shows that the majority of the aluminum is present as tetrahedrally coordinated Al and only a fraction is present as octahedrally coordinated Al. These results agree well with other results published for a number of other phyllosilicates [91,92,98,99]. Since the octahedral sheet structure in clay minerals resembles that observed in aluminum hydroxides such as gibbsite, it is not unexpected that the observed binding energy for saponite is indeed similar to those observed for gibbsite and bayerite, (both Al(OH)3) and boehmite (AlOOH) [93,100].
Even though magnesium is one of the major divalent metals in a large number of clay minerals and other phyllosilicates, there are very few papers with Mg 2p and 1s binding energy data for phyllosilicates. Both the Mg 1s and the Mg 2p transitions in the montmorillonite and vermiculite spectra show the presence of two slightly different environments [90]. The ratio of the signals seems to indicate that either 75 or 85% is present in one structural environment and 25 or 15% in the other. Based on the similarity in the positions of the largest peak around 1303 eV in the montmorillonites compared to the saponite, this was interpreted as being associated with Mg in octahedral coordination in the clay layers whereas the smaller peak at around 1304 eV is associated with a relatively small amount of interlayer Mg2+. These results contradict earlier results by Vantelon et al. [92], who only observed a single Mg 2p peak for saponite. An alternative interpretation is that the two peaks are due to Mg in both cis- and trans-sites in the octahedral sheet. There would be a 2:1 ratio of the two peaks if the Mg was evenly distributed between these sites. Generally, however, it is expected that Mg occupies the cis-sites preferentially because of its smaller size relative to the optimal divalent octahedral cation. If this is correct, then the 1303 eV peak would be associated with Mg occupying the cis-site.
The O 1s was observed as a strong peak around 532 eV in agreement with other studies of different clay minerals [93,101,102,103] and micas [104,105]. Notwithstanding the fact that high-resolution XPS scans of the O 1s core spectra are sensitive to the local environment within minerals with octahedral Al structures (see, e.g., the difference between O and OH in boehmite [100]), they have not been employed to study clay minerals such as saponite in detail. Because of the ultrahigh vacuum in the XPS instrument, no or very little interlayer water can be observed. A split has been found for the smectite group minerals (montmorillonite, beidellite, saponite, hectorite, nontronite) between O and OH with a theoretical ratio of 5:1. For saponite, two bands are observed at 531.76 (O 85%) and 533.62 (OH 15%) eV, which are very close to the theoretical value. In reality, the O 1s component is much more complex and consists of, besides OH, multiple components associated with what is generally known within silicate structures as bonding and nonbonding oxygen atoms in the layer structure [91,106].
Notwithstanding the relatively low amounts of exchangeable cations in the saponite interlayer spaces compared to the major elements forming the saponite layers and the corresponding lower signal to noise ratio, the exchangeable cations can be easily observed. For Na 1s, a single Gaussian band around 1072 eV was detected, which is close to the values reported by Ebina et al. [98]. The Ca 2p for exchangeable Ca2+ is split in two Gaussian shaped bands Ca 2p1/2 and Ca 2p3/2 bands at 350.7 eV and 347.2 eV. Similarly, K was detected as the K 2p transitions K 2p1/2 around 297.2 eV and K 2p3/2 around 294.3 eV but due to the very low intensity to noise ratio the bands were difficult to accurately fit. Saponite SapCa-2 showed the partial substitution of hydroxyl groups with chlorine. The chlorine was observed as the Cl 2p1/2 and 2p3/2 transitions at 200.58 and 198.94 eV.

6. Final Remarks

Saponites—i.e., trioctahedral 2:1 smectites with the ideal composition MxMg3AlxSi4−xO10(OH,F)2.nH2O (M = exchangeable interlayer cation, e.g., Na+, NH4+, K+, Ca2+), are easy to synthesize in variable compositions and physicochemical properties, making them attractive for numerous industrial applications including as catalysts, catalysts supports, adsorbents, active ingredient carriers, etc. Since the success of the synthesis and the determination of suitable application for the synthetic saponites depends on strong knowledge of the various characterization techniques to ascertain both the saponite structure and properties, this review provides information on the distinguishing characteristics of saponites as determined by a variety of spectroscopic methods. IR and Raman spectroscopy provided information on the positions of the vibrational excitations in saponites and how these are affected by substitutions in the composition and structure of the mineral, as well as during the crystallization and thermal decomposition (dehydration, dehydroxylation, and structural reorganization); MAS-NMR allowed for observation of the Si and Al local environments, in particular the Al(IV)/Al(VI) ratio and Si/Al(IV) ratio; XPS provided information on the chemistry and nature of the local environment of the elements present in the saponite structure and binding energies of these elements of saponites.
This review intends to equip the readers with the knowledge and skills to easily prepare functional saponites in one-pot and mild conditions and with the techniques to ascertain the success of such preparations. Applications in catalysis and catalyst supports, adsorbents, active ingredient carriers etc. may require fine tuning of the synthesis parameters. Nevertheless, the guidance provided by the spectroscopic techniques discussed here should enable the researchers to optimize the parameters needed to obtain the desired saponite. As the effect of metal substitutions on the saponite tetrahedral and octahedral sites have been detailed, new saponite materials exhibiting multifunctionality can be developed and characterized. In addition, this review shows that extensive literature is available applying mid-infrared and Raman spectroscopy to study natural and synthetic clay minerals such as saponite. However, far less is known in terms of other spectroscopic techniques such as far-infrared, near-infrared, MAS-NMR, and especially XPS to study the effects of different substitutions and the changes taking place during crystallization.

Author Contributions

Conceptualization, C.P.P. and J.T.K.; methodology, J.T.K.; validation, J.T.K.; formal analysis, J.T.K.; investigation, J.T.K.; resources, J.T.K.; data curation, J.T.K.; writing—original draft preparation, C.P.P. and J.T.K.; writing—review and editing, C.P.P. and J.T.K.; visualization, J.T.K.; supervision, J.T.K. All authors have read and agreed to the published version of the manuscript.

Funding

This research received no external funding.

Acknowledgments

The authors acknowledge the facilities, and the scientific and technical assistance of the Australian Microscopy and Microanalysis Research Facility at the Centre for Microscopy and Microanalysis, The University of Queensland.

Conflicts of Interest

The authors declare no conflict of interest.

References

  1. Yang, F.; Sun, S.; Chen, X.; Chang, Y.; Zha, F.; Lei, Z. Mg–Al layered double hydroxides modified clay adsorbents for efficient removal of Pb2+, Cu2+ and Ni2+ from water. Appl. Clay Sci. 2016, 123, 134–140. [Google Scholar] [CrossRef]
  2. Franco, F.; Benítez-Guerrero, M.; Gonzalez-Triviño, I.; Pérez-Recuerda, R.; Assiego, C.; Cifuentes-Melchor, J.; Pascual-Cosp, J. Low-cost aluminum and iron oxides supported on dioctahedral and trioctahedral smectites: A comparative study of the effectiveness on the heavy metal adsorption from water. Appl. Clay Sci. 2016, 119, 321–332. [Google Scholar] [CrossRef]
  3. Seki, Y.; Ide, Y.; Okada, T.; Ogawa, M. Concentration of 2-phenylphenol by organoclays from aqueous sucrose solution. Appl. Clay Sci. 2015, 109–110, 64–67. [Google Scholar] [CrossRef] [Green Version]
  4. Epelde-Elezcano, N.; Martínez-Martínez, V.; Duque-Redondo, E.; Temiño, I.; Manzano, H.; López-Arbeloa, I. Strategies for modulating the luminescence properties of pyronin Y dye–clay films: An experimental and theoretical study. Phys. Chem. Chem. Phys. 2016, 18, 8730–8738. [Google Scholar] [CrossRef] [PubMed]
  5. Matejdes, M.; Himeno, D.; Suzuki, Y.; Kawamata, J. Controlled formation of pseudoisocyanine J-aggregates in the interlayer space of synthetic saponite. Appl. Clay Sci. 2017, 140, 119–123. [Google Scholar] [CrossRef]
  6. Kumaresan, S.; Rama Pawar, R.; Kevadiya, B.D.; Bajaj, H.C. Synthesis of Saponite Based Nanocomposites to Improve the Controlled Oral Drug Release of Model Drug Quinine Hydrochloride Dihydrate. Pharmaceuticals 2019, 12, 105. [Google Scholar]
  7. Vogels, R.J.M.J.; Kloprogge, J.T.; Geus, J.W. Catalytic activity of synthetic saponite clays: Effects of tetrahedral and octahedral composition. J. Catal. 2005, 231, 443–452. [Google Scholar] [CrossRef] [Green Version]
  8. Kawi, S.; Yao, Y.Z. Saponite catalysts with systematically varied Mg/Ni ratio: Synthesis, characterization, and catalysis. Micropor. Mesopor. Mater. 1999, 33, 49–59. [Google Scholar] [CrossRef]
  9. Mata, G.; Trujillano, R.; Vicente, M.A.; Belver, C.; Fernandez-Garcia, M.; Korili, S.A.; Gil, A. Chromium-saponite clay catalysts: Preparation, characterization and catalytic performance in propene oxidation. Appl. Catal. A 2007, 327, 1–12. [Google Scholar] [CrossRef] [Green Version]
  10. Ménez, B.; Pisapia, C.; Andreani, M.; Jamme, F.; Vanbellingen, Q.P.; Brunelle, A.; Richard, L.; Dumas, P.; Réfrégiers, M. Abiotic synthesis of amino acids in the recesses of the oceanic lithosphere. Nature 2018, 564, 59–63. [Google Scholar] [CrossRef]
  11. Ponce, C.P.; Kloprogge, J.T. Urea-Assisted Synthesis and Characterization of Saponite with Different Octahedral (Mg, Zn, Ni, Co) and Tetrahedral Metals (Al, Ga, B), a Review. Life 2020, 10, 168. [Google Scholar] [CrossRef] [PubMed]
  12. Nityashree, N.; Price, C.A.H.; Pastor-Perez, L.; Manohara, G.V.; Garcia, S.; Maroto-Valer, M.M.; Reina, T.R. Carbon stabilised saponite supported transition metal-alloy catalysts for chemical CO2 utilisation via reverse water-gas shift reaction. Appl. Catal. B Environ. 2020, 261, 118241. [Google Scholar] [CrossRef]
  13. Gebretsadik, F.B.; Cesteros, Y.; Salagre, P.; Gimenez-Manogil, J.; Garcia-Garcia, A.; Bueno-Lopez, A. Potential of Cu-saponite catalysts for soot combustion. Catal. Sci. Technol. 2016, 6, 507–514. [Google Scholar] [CrossRef] [Green Version]
  14. Minz, S.; Gupta, R.; Garg, S. Al–Fe and Al–Ti Pillared Saponite Clay Catalysts: Preparation and Characterization. In Proceedings of the Sustainable Engineering, Singapore, 5 April 2019; pp. 37–48. [Google Scholar]
  15. Vicente, I.; Salagre, P.; Cesteros, Y. Ni nanoparticles supported on microwave-synthesised saponite for the hydrogenation of styrene oxide. Appl. Clay Sci. 2011, 53, 212–219. [Google Scholar] [CrossRef]
  16. Besselink, R.; Stawski, T.M.; Freeman, H.M.; Hövelmann, J.; Tobler, D.J.; Benning, L.G. Mechanism of Saponite Crystallization from a Rapidly Formed Amorphous Intermediate. Cryst. Growth Design 2020, 20, 3365–3373. [Google Scholar] [CrossRef] [Green Version]
  17. Schumann, D.; Hartman, H.; Eberl, D.D.; Sears, S.K.; Hesse, R.; Vali, H. Formation of replicating saponite from a gel in the presence of oxalate: Implications for the formation of clay minerals in carbonaceous chondrites and the origin of life. Astrobiology 2012, 12, 549–561. [Google Scholar] [CrossRef]
  18. Vogels, R.J.M.J.; Kloprogge, J.T.; Geus, J.W. Synthesis and characterization of saponite clays. Am. Mineral. 2005, 90, 931–944. [Google Scholar] [CrossRef]
  19. Xue, S.; Pinnavaia, T.J. Porous synthetic smectic clay for the reinforcement of epoxy polymers. Micropor. Mesopor. Mater. 2008, 107, 134–140. [Google Scholar] [CrossRef]
  20. Sychev, M.; Prihod’ko, R. Characterization and catalytic activity of non-hydrothermally synthesized saponite-like materials. Stud. Surf. Sci. Catal. 1998, 118, 967–974. [Google Scholar]
  21. Bisio, C.; Gatti, G.; Boccaleri, E.; Marchese, L.; Superti, G.B.; Pastore, H.O.; Thommes, M. Understanding physico–chemical properties of saponite synthetic clays. Micropor. Mesopor. Mater. 2008, 107, 90–101. [Google Scholar] [CrossRef]
  22. Carniato, F.; Bisio, C.; Gatti, G.; Roncoroni, S.; Recchia, S.; Marchese, L. On the Properties of a Novel V-Containing Saponite Catalyst for Propene Oxidative Dehydrogenation. Catal. Lett. 2009, 131, 42–48. [Google Scholar] [CrossRef]
  23. Higashi, S.; Miki, H.; Komarneni, S. Mn-smectites: Hydrothermal synthesis and characterization. Appl. Clay Sci. 2007, 38, 104–112. [Google Scholar] [CrossRef] [Green Version]
  24. Kloprogge, J.T.; Breukelaar, J.; Geus, J.W.; Jansen, J.B.H. Characterization of Mg-Saponites Synthesized from Gels Containing Amounts of Na+, K+, Rb+, Ca2+, Ba2+, or Ce4+ Equivalent to The CEC of the Saponite. Clays Clay Miner. 1994, 42, 18–22. [Google Scholar] [CrossRef]
  25. Kloprogge, J.T.; Breukelaar, J.; Jansen, J.B.H.; Geus, J.W. Development of Ammonium-Saponites from Gels with Variable Ammonium Concentration and Water Content at Low Temperatures. Clays Clay Miner. 1993, 41, 103–110. [Google Scholar] [CrossRef]
  26. Vogels, R.J.M.J.; Breukelaar, J.; Kloprogge, J.T.; Jansen, J.B.H.; Geus, J.W. Hydrothermal Crystallization of Ammonium-Saponite at 200 °C and Autogenous Water Pressure. Clays Clay Miner. 1997, 45, 1–7. [Google Scholar] [CrossRef]
  27. Gebretsadik, F.B.; Mance, D.; Baldus, M.; Salagre, P.; Cesteros, Y. Microwave synthesis of delaminated acid saponites using quaternary ammonium salt or polymer as template. Study of pH influence. Appl. Clay Sci. 2015, 114, 20–30. [Google Scholar] [CrossRef]
  28. Trujillano, R.; Rico, E.; Vicente, M.A.; Herrero, M.; Rives, V. Microwave radiation and mechanical grinding as new ways for preparation of saponite-like materials. Appl. Clay Sci. 2010, 48, 32–38. [Google Scholar] [CrossRef]
  29. Trujillano, R.; Rico, E.; Vicente, M.A.; Rives, V.; Ciuffi, K.J.; Cestari, A.; Gil, A.; Korili, S.A. Rapid microwave-assisted synthesis of saponites and their use as oxidation catalysts. Appl. Clay Sci. 2011, 53, 326–330. [Google Scholar] [CrossRef]
  30. Trujillano, R.; Rico, E.; Vicente, M.A.; Rives, V.; Sobrados, I.; Sanz, J. Saponites containing divalent transition metal cations in octahedral positions—Exploration of synthesis possibilities using microwave radiation and NMR characterization. Appl. Clay Sci. 2015, 115, 24–29. [Google Scholar] [CrossRef]
  31. Vicente, I.; Salagre, P.; Cesteros, Y.; Medina, F.; Sueiras, J.E. Microwave-assisted synthesis of saponite. Appl. Clay Sci. 2010, 48, 26–31. [Google Scholar] [CrossRef]
  32. Kloprogge, J.T.; Komarneni, S.; Amonette, J.E. Synthesis of Smectite Clay Minerals: A Critical Review. Clays Clay Miner. 1999, 47, 529–554. [Google Scholar] [CrossRef]
  33. Kloprogge, J.T.; Jansen, J.B.H.; Schuiling, R.D.; Geus, J.W. The interlayer collapse during dehydration of synthetic Na0.7-beidellite: A sodium-23 solid-state magic-angle spinning NMR study. Clays Clay Miner. 1992, 40, 561–566. [Google Scholar] [CrossRef]
  34. Kloprogge, J.T.; Frost, R.L. The effect of synthesis temperature on the FT-Raman and FT-IR spectra of saponites. Vibr. Spectrosc. 2000, 23, 119–127. [Google Scholar] [CrossRef]
  35. Vogels, R.J.M.J.; Kerkhoffs, M.J.H.V.; Geus, J.W. Non-hydrothermal synthesis, characterization and catalytic properties of saponite clays. Stud. Surf. Sci. Catal. 1995, 91, 1153–1161. [Google Scholar]
  36. Vogels, R.J.M.J.; Kloprogge, J.T.; Geus, J.W. Homogeneous forced hydrolysis of aluminum through the thermal decomposition of urea. J. Coll. Interf. Sci. 2005, 285, 86–93. [Google Scholar] [CrossRef] [Green Version]
  37. Vogels, R.J.M.J.; Kloprogge, J.T.; Geus, J.W.; Beers, A.W.F. Synthesis and characterization of saponite clays: Part 2. Thermal stability. Am. Mineral. 2005, 90, 945–953. [Google Scholar] [CrossRef]
  38. Kloprogge, J.T.; Frost, R.L. Infrared emission spectroscopy of clay minerals. CMS Workshop Lect. 2005, 13, 99–124. [Google Scholar]
  39. Kloprogge, J.T.; Breukelaar, J.; Wilson, A.E.; Geus, J.W.; Jansen, J.B.H. Solid-state nuclear magnetic resonance spectroscopy on synthetic ammonium /aluminum-saponites. Clays Clay Miner. 1994, 42, 416–420. [Google Scholar] [CrossRef]
  40. Madejová, J.; Gates, W.P.; Petit, S. Chapter 5—IR Spectra of Clay Minerals. In Developments in Clay Science; Gates, W.P., Kloprogge, J.T., Madejová, J., Bergaya, F., Eds.; Elsevier: Amsterdam, The Netherlands, 2017; Volume 8, pp. 107–149. [Google Scholar]
  41. Repacholi, M.H. Clay Mineralogy: Spectroscopic and Chemical Determinative Methods; Springer: Berlin/Heidelberg, Germany, 2012. [Google Scholar]
  42. Russell, J.D.; Fraser, A. Infrared methods. In Clay Mineralogy: Spectroscopic and Chemical Determinative Methods; Wilson, M.J., Ed.; Chapman and Hall: London, UK, 1994; pp. 11–67. [Google Scholar]
  43. Pelletier, M.; Michot, L.J.; Barres, O.; Humbert, B.; Petit, S.; Robert, J.-L. Influence of KBr conditioning on the infrared hydroxyl-stretching region of saponites. Clay Miner. 1999, 34, 439–445. [Google Scholar] [CrossRef]
  44. Pelletier, M.; Michot, L.J.; Humbert, B.; Barres, O.; d’Espinose de la Caillerie, J.-B.; Robert, J.-L. Influence of layer charge on the hydroxyl stretching of trioctahedral clay minerals: A vibrational study of synthetic Na- and K-saponites. Am. Mineral. 2003, 88, 1801–1808. [Google Scholar] [CrossRef]
  45. Wang, A.; Jolliff, B.L.; Haskin, L.A. Raman spectroscopic characterization of a highly weathered basalt: Igneous mineralogy, alteration products, and a microorganism. J. Geophys. Res. Planets 1999, 104, 27067–27077. [Google Scholar] [CrossRef] [Green Version]
  46. Wang, A.; Freeman, J.J.; Jolliff, B.L. Understanding the Raman spectral features of phyllosilicates. J. Raman Spectrosc. 2015, 46, 829–845. [Google Scholar] [CrossRef]
  47. Rinnert, E.; Carteret, C.; Humbert, B.; Fragneto-Cusani, G.; Ramsay, J.D.F.; Delville, A.; Robert, J.-L.; Bihannic, I.; Pelletier, M.; Michot, L.J. Hydration of a synthetic clay with tetrahedral charges: A multidisciplinary experimental and numerical study. J. Phys. Chem. B 2005, 109, 23745–23759. [Google Scholar] [CrossRef] [PubMed]
  48. Farmer, V.C.; Russell, J.D. Interlayer complexes in layer silicates. The structure of water in lamellar ionic solutions. Trans. Faraday Soc. 1971, 67, 2737–2749. [Google Scholar] [CrossRef]
  49. Farmer, V.C. The layer silicates. In The Infrared Spectra of Minerals; Farmer, V.C., Ed.; Mineralogical Society: London, UK, 1974; pp. 331–363. [Google Scholar]
  50. Loh, E. Optical vibrations in sheet silicates. J. Phys. C 1973, 6, 1091–1104. [Google Scholar] [CrossRef]
  51. Arab, M.; Bougeard, D.; Smirnov, K.S. Experimental and computer simulation study of the vibrational spectra of vermiculite. Phys. Chem. Chem. Phys. 2002, 4, 1957–1963. [Google Scholar] [CrossRef]
  52. Kloprogge, J.T.; Frost, R.L. Infrared emission spectroscopic study of the dehydroxylation of some natural and synthetic saponites. Neues Jahrb. Fuer Mineral. Mon. 2001, 446–463. [Google Scholar]
  53. Kloprogge, J.T. Raman spectroscopy of clay minerals. In Infrared and Raman Spectroscopies of Clay Minerals; Gates, W.P., Kloprogge, J.T., Madejova, J., Bergaya, F., Eds.; Elsevier: Amsterdam, The Netherlands, 2017; Volume 8, pp. 150–199. [Google Scholar]
  54. Kloprogge, J.T.; Hammond, M.; Frost, R.L. Low temperature synthesis and characterisation of pecoraite, a nickel containing phyllosilicate. Neues Jahrb. Fuer Mineral. Mon. 2000, 5, 193–206. [Google Scholar]
  55. Kloprogge, J.T.; Hammond, M.; Hickey, L.; Frost, R.L. A new low temperature synthesis route of fraipontite (Zn,Al)3(Si,Al)2O5(OH)4. Mater. Res. Bull. 2001, 36, 1091–1098. [Google Scholar] [CrossRef]
  56. Kloprogge, J.T.; Hammond, M.; Hickey, L.; Frost, R.L. Low temperature synthesis of cobalt clays. J. Mater. Sci. Lett. 2002, 21, 931–933. [Google Scholar] [CrossRef] [Green Version]
  57. Kloprogge, J.T.; Frost, R.L.; Fry, R. Infrared emission study of the thermal transformation mechanism of Al13-pillared clay. Analyst 1999, 124, 381–384. [Google Scholar] [CrossRef]
  58. Kloprogge, J.T.; Jansen, J.B.H.; Geus, J.W. Characterization of synthetic sodium-beidellite. Clays Clay Miner. 1990, 38, 409–414. [Google Scholar] [CrossRef]
  59. Kloprogge, J.T.; Komarneni, S.; Yanagisawa, K.; Frost, R.L.; Fry, R. Infrared study of some synthetic and natural beidellites. J. Mater. Sci. Lett. 1998, 17, 1853–1855. [Google Scholar] [CrossRef]
  60. Van der Marel, H.W.; Beutelspacher, H. Atlas of Infrared Spectroscopy of Clay Minerals and Their Admixtures; Elsevier: Amsterdam, The Netherlands, 1974; p. 396. [Google Scholar]
  61. Velde, B. Infrared OH-stretch bands in potassic micas, talcs and saponites; influence of electronic configuration and site of charge compensation. Am. Mineral. 1983, 68, 1169–1173. [Google Scholar]
  62. Borade, R.B.; Clearfield, A. Characterization of acid sites in Beta and ZSM-20 zeolites. J. Phys. Chem. C 1992, 96, 6729–6737. [Google Scholar] [CrossRef]
  63. Baldermann, A.; Dohrmann, R.; Kaufhold, S.; Nickel, C.; Letofsky-Papst, I.; Dietzel, M. The Fe-Mg-saponite solid solution series—A hydrothermal synthesis study. Clay Miner. 2014, 49, 391–415. [Google Scholar] [CrossRef]
  64. Dill, H.G.; Dohrmann, R.; Kaufhold, S. Disseminated and faultbound autohydrothermal ferroan saponite in Late Paleozoic andesites of the Saar-Nahe Basin, SW Germany: Implications for the economic geology of intermediate (sub)volcanic rocks. Appl. Clay Sci. 2011, 51, 226–240. [Google Scholar] [CrossRef]
  65. Madejová, J. FTIR techniques in clay mineral studies. Vibr. Spectrosc. 2003, 31, 1–10. [Google Scholar] [CrossRef]
  66. Voncken, J.H.L.; Wevers, J.M.A.R.; van der Eerden, A.M.J.; Bos, A.M.J.; Jansen, J.B.H. Hydrothermal synthesis of tobelite, NH4Al2Si3AlO10(OH)2, from various starting materials and implications for its occurrence in nature. Geol. Mijnb. 1987, 66, 259–269. [Google Scholar]
  67. Kloprogge, J.T.; Frost, R.L. Infrared emission spectroscopy of Al-pillared beidellite. Appl. Clay Sci. 1999, 15, 431–445. [Google Scholar] [CrossRef]
  68. Kloprogge, J.T.; Frost, R.L. Infrared emission spectroscopic study of some natural and synthetic paragonites. Appl. Spectrosc. 1999, 53, 1071–1077. [Google Scholar] [CrossRef]
  69. Kloprogge, J.T.; Frost, R.L. An infrared emission spectroscopic study of synthetic and natural pyrophyllite. Neues Jahrb. Fuer Mineral. Mon. 1999, 2, 62–74. [Google Scholar]
  70. Kloprogge, J.T.; Frost, R.L.; Hickey, L. Infrared absorption and emission study of synthetic mica-montmorillonite in comparison to rectorite, beidellite and paragonite. J. Mater. Sci. Lett. 1999, 18, 1921–1923. [Google Scholar] [CrossRef]
  71. Kloprogge, J.T.; Frost, R.L.; Kristof, J. Application of infrared emission spectroscopy for the study of the dehydroxylation of synthetic paragonite. Can. J. Anal. Sci. Spectrosc. 1999, 44, 33–36. [Google Scholar]
  72. Kloprogge, J.T.; Fry, R.; Frost, R.L. An Infrared Emission Spectroscopic Study of the Thermal Transformation Mechanisms in Al13-Pillared Clay Catalysts with and without Tetrahedral Substitutions. J. Catal. 1999, 184, 157–171. [Google Scholar] [CrossRef]
  73. Kloprogge, J.T.; Komarneni, S.; Yanagisawa, K.; Fry, R.; Frost, R.L. Infrared Emission Spectroscopic Study of the Dehydroxylation via Surface Silanol Groups of Synthetic and Natural Beidellite. J. Coll. Interf. Sci. 1999, 212, 562–569. [Google Scholar] [CrossRef]
  74. Kloprogge, J.T.; Frost, R.L. Infrared emission spectroscopy study of the dehydroxylation of 10 Å halloysite from a Neogene cryptokarst of southern Belgium. Geol. Belg. 2000, 2, 213–220. [Google Scholar] [CrossRef]
  75. Kloprogge, J.T.; Hickey, L.; Frost, R.L. Heating stage Raman and infrared emission spectroscopic study of the dehydroxylation of synthetic Mg-hydrotalcite. Appl. Clay Sci. 2001, 18, 37–49. [Google Scholar] [CrossRef]
  76. Newman, A.C.D. Chemistry of Clay and Clay Minerals; Longman Scientific & Technical: Harlow, UK, 1987; p. 480. [Google Scholar]
  77. Frost, R.L.; Collins, B.M.; Finnie, K.; Vassallo, A.J. Infrared emission spectroscopy of clay minerals and their thermal transformations. In Proceedings of the 10th International Clay Conference, Adelaide, Australia, 18–23 July 1993; pp. 219–224. [Google Scholar]
  78. Kloprogge, J.T.; Frost, R.L.; Hickey, L. Infrared emission spectroscopic study of the dehydroxylation of some hectorites. Thermochim. Acta 2000, 345, 145–156. [Google Scholar] [CrossRef]
  79. Lipsicas, M.; Raythatha, R.H.; Pinnavaia, T.J.; Johnson, I.D.; Giese, R.F., Jr.; Costanzo, P.M.; Roberts, J.L. Silicon and aluminium site distributions in 2:1 layered silicate clays. Nature 1984, 309, 604–607. [Google Scholar] [CrossRef]
  80. Loewenstein, W. The distribution of aluminum in the tetrahedra of silicates and aluminates. Am. Mineral. 1954, 39, 92–96. [Google Scholar]
  81. Sanz, J.; Serratosa, J.M. 29Si and 27Al high resolution MAS-NMR spectra of phyllosilicates. J. Amer. Chem. Soc 1984, 106, 4790–4793. [Google Scholar] [CrossRef]
  82. Alma, N.C.M.; Hays, G.R.; Samoson, A.V.; Lippmaa, E.T. Characterization of synthetic dioctahedral clays by solid-state silicon-29 and aluminum-27 nuclear magnetic resonance spectrometry. Anal. Chem. 1984, 56, 729–733. [Google Scholar] [CrossRef]
  83. Weiss, C.A.; Altaner, S.P.; Kirkpatrick, R.J. High resolution 295i NMR spectroscopy of 2:1 layer silicates: Correlation among chemical shift, structural distortions, and chemical variations. Am. Mineral. 1987, 72, 935–942. [Google Scholar]
  84. Guggenheim, S. The brittle micas. In Micas; Bailey, S.W., Ed.; Mineralogical Society of America: Chantilly, VA, USA, 1984; Volume 13, pp. 61–104. [Google Scholar]
  85. Suquet, H.; Malard, C.; Copin, E.; Pezerat, H. Variation du parametre bet de la distance basale d001 dans une serie de saponites a charge croissante. I. Etats hydrates. Clay Miner. 1981, 16, 53–67. [Google Scholar] [CrossRef]
  86. Vogels, R.J.M.J.; Kloprogge, J.T.; Geus, J.W. Synthesis and characterization of boron and gallium substituted saponite clays below 100˚C at one atmosphere. Micropor. Mesopor. Mater. 2005, 77, 159–165. [Google Scholar] [CrossRef] [Green Version]
  87. Bradley, S.M.; Howe, R.F.; Kydd, R.A. Correlation between 27Al and 71Ga NMR chemical shifts. Magn. Reson. Chem. 1993, 31, 883–886. [Google Scholar] [CrossRef]
  88. Van Olphen, H.; Fripiat, J.J. Data handbook for Clay Minerals and other Non-Metallic Materials; Pergamon Press: Oxford, UK, 1979; p. 346. [Google Scholar]
  89. Kogel, J.E.; Lewis, S.A. Baseline Studies of the Clay Minerals Society Source Clays: Chemical Analysis by Inductively Coupled Plasma-Mass Spectroscopy (ICP-MS). Clays Clay Miner. 2001, 49, 387–392. [Google Scholar] [CrossRef]
  90. Kloprogge, J.T.; Wood, B.J. Baseline studies of the Clay Minerals Society Source Clays by X-Ray Photoelectron Spectroscopy. Clay Sci. 2018, 22, 85–94. [Google Scholar]
  91. Kloprogge, J.T.; Wood, B.J. Handbook of Mineral Spectroscopy Volume 1. X-Ray Photoelectron Spectra; Elsevier: Amsterdam, The Netherlands, 2020; p. 505. [Google Scholar]
  92. Vantelon, D.; Belkhou, R.; Bihannic, I.; Michot, L.J.; Montarges-Pelletier, E.; Robert, J.-L. An XPEEM study of structural cation distribution in swelling clays. I. Synthetic trioctahedral smectites. Phys. Chem. Miner. 2009, 36, 593–602. [Google Scholar] [CrossRef]
  93. Barr, T.L.; Seal, S.; He, H.; Klinowski, J. X-ray photoelectron spectroscopic studies of kaolinite and montmorillonite. Vacuum 1995, 46, 1391–1395. [Google Scholar] [CrossRef]
  94. He, H.; Zhou, Q.; Frost, R.L.; Wood, B.J.; Duong, L.V.; Kloprogge, J.T. A X-ray photoelectron spectroscopy study of HDTMAB distribution within organoclays. Spectrochim. Acta A 2007, 66, 1180–1188. [Google Scholar] [CrossRef] [Green Version]
  95. Dove, M.T.; Thayaparam, S.; Heine, V.; Hammonds, K.D. The phenomenon of low Al-Si ordering temperatures in aluminosilicate framework structures. Am. Mineral. 1996, 81, 349–362. [Google Scholar] [CrossRef]
  96. Palin, E.J.; Dove, M.T.; Redfern, S.A.T.; Bosenick, A.; Sainz-Diaz, C.I.; Warren, M.C. Computational study of tetrahedral Al-Si ordering in muscovite. Phys. Chem. Miner. 2001, 28, 534–544. [Google Scholar] [CrossRef]
  97. Gonzales-Elipe, A.R.; Espinos, J.P.; Munuera, G.; Sanz, J.; Serratosa, J.M. Bonding-state characterization of constituent elements in phyllosilicate minerals by XPS and NMR. J. Phys. Chem. B 1988, 92, 3471–3476. [Google Scholar] [CrossRef]
  98. Ebina, T.; Iwasaki, T.; Chatterjee, A.; Katagiri, M.; Stucky, G.D. Comparative study of XPS and DFT with reference to the distribution of Al in tetrahedral and octahedral sheets of phyllosilicates. J. Phys. Chem. B 1997, 101, 1125–1129. [Google Scholar] [CrossRef]
  99. Kloprogge, J.T. Spectroscopic studies of synthetic and natural beidellites: A review. Appl. Clay Sci. 2006, 31, 165–179. [Google Scholar]
  100. Kloprogge, J.T.; Duong, L.V.; Wood, B.J.; Frost, R.L. XPS study of the major minerals in bauxite: Gibbsite, bayerite and (pseudo-)boehmite. J. Coll. Interf. Sci. 2006, 296, 572–576. [Google Scholar]
  101. Mosser, C.; Mosser, A.; Romeo, M.; Petit, S.; Decarreau, A. Natural and synthetic copper phyllosilicates studied by XPS. Clays Clay Miner. 1992, 40, 593–599. [Google Scholar] [CrossRef]
  102. He, H.; Barr, T.L.; Klinowski, J. ESCA and Solid-State NMR studies of allophane. Clay Miner. 1995, 30, 201–209. [Google Scholar] [CrossRef]
  103. Johns, W.D.; Gier, S. X-ray photoelectron spectroscopic study of layer-charge magnitude in micas and illite-smectite clays. Clay Miner. 2001, 36, 355–367. [Google Scholar] [CrossRef]
  104. Bhattacharyya, K.G. XPS study of mica surfaces. J. Electron Spectrosc. Rel. Phenom. 1993, 63, 289–306. [Google Scholar] [CrossRef]
  105. Liu, Z.H.; Brown, N.M.D. XPS characterization of mica surfaces processed using a radio-frequency (rf) argon plasma. J. Phys. D Appl. Phys. 1998, 31, 1771–1781. [Google Scholar] [CrossRef]
  106. Nessbitt, H.W.; Bancroft, G.M. High Resolution Core- and Valence-Level XPS Studies of the Properties (Structural, Chemical and Bonding) of Silicate Minerals and Glasses. In Spectroscopic Methods in Mineralogy and Materials Sciences; Henderson, G.S., Neuville, D.R., Downs, R.T., Eds.; Mineralogical Society of America: Chantilly, VA, USA, 2014; Volume 78, pp. 271–329. [Google Scholar]
Figure 1. Ideal structure of saponites showing the tetrahedral (Si, Al) and octahedral (Mg) sheets and interlayer space with interlayer cations (Na, K, Ca, etc.).
Minerals 11 00112 g001
Figure 2. Infrared (IR) ATR spectra of saponite (Ballarat, CA, USA) and synthetic talc showing the broader and slightly shifted bands for saponite in comparison to talc.
Minerals 11 00112 g002
Figure 3. Mid-IR absorption spectra of 3 natural (1433, SapCa-1, Milford) and 1 synthetic NH4-saponites.
Minerals 11 00112 g003
Figure 4. Raman spectrum of natural saponite (Milford) in the region between 1200 and 200 cm−1.
Minerals 11 00112 g004
Figure 5. Percentage of saponite crystallization as a function of synthesis temperature (modified after [25]).
Minerals 11 00112 g005
Figure 6. (a) Mid-IR spectra of of synthetic NH4-saponite synthesized at temperatures between 125 and 280 °C in comparison to Milford saponite between 1350 and 400 cm−1; (b) Raman spectra of the same samples in the region between 1200 and 250 cm−1 (modified after [34]).
Minerals 11 00112 g006
Figure 7. Mid-IR spectra in the region between 1800 and 400 cm−1 of NH4-saponites synthesized with different NH4/Al ratios at 280 °C (modified after [57]).
Minerals 11 00112 g007
Figure 8. Mid-IR spectra in the region between 1900 and 400 cm−1 of NH4-saponites synthesized with different H2O/(Si + Al) ratios (modified after [57]).
Minerals 11 00112 g008
Figure 9. Infrared emission spectra of synthetic saponite HTSap1a between 200 and 750 °C at 50 °C intervals in the regions 4000–2800 cm−1 (a) and 1800–500 cm−1 (b) (modified after [52]).
Minerals 11 00112 g009
Figure 10. (a) 27A1 magic-angle-spinning nuclear magnetic resonance (MAS-NMR) spectrum of synthetic NH4-saponite and (b) 29Si MAS-NMR spectrum of synthetic NH4-saponite (modified from [39]).
Minerals 11 00112 g010
Figure 11. X-ray photoelectron spectroscopy (XPS) survey scan from 1200 to 0 eV of natural saponite SapCa1.
Minerals 11 00112 g011
Table 1. Raman and mid-IR band positions and suggested assignments for Milford and synthetic NH4-saponite.
RamanIRIRAssignment [34,52,53]
Milford SaponiteNH4-saponite
202 ν1(A1g) (Mg,Al)O6
229
265 A11) OH-O triangle
288 e 1 3 SiO4
340 ν2(e) SiO4 or b 1 3 SiO4
360 ν5(e) SiO4, MgO6
424422? SiO4
432 ν3(a1) SiO4 or e 1 2 SiO4
447449 e 2 1 SiO4
464465461ν6(e) SiO4 (R), Mg2Al-OH translation (IR)
494–540528529 e 1 2 SiO4 (R), Mg3-OH perpendicular (IR)
659654665Mg3-OH libration
683696691ν2(a1) SiO4 (R), e 2 1 SiO4 (IR)
740Mg2Al-OH deformation
776787779 b 1 2
838836δ(AlMgOH) (R), Al-O apical AIO4 (IR)
918 912δ(Al2OH), b 1 1
99810101020ν1(a1) SiO4 (R), e 1 1 SiO4 (IR)
1050 ν4(e) SiO4
108211101111ν3(f2) SiO4 (R), Si-O stretch (IR)
1165 Si-O stretch
1430NH4 bend
1635water OH-bend
3118NH4 stretch
32223218water OH stretch
34203431water OH stretch
36253589Mg2(Al,vac)-OH stretch
36743662Mg3-OH stretch
3778Si-OH stretch
Table 2. Band positions (cm−1) based on band deconvolution and suggested assignments for the hydroxyl-stretching region of the infrared spectra of synthetic NH4-saponite in comparison to natural saponite and tobellite.
NH4-SaponiteNatural SaponiteTobelliteAssignment [60,66]
2850NH4 stretch
3118 3070NH4 stretch
32193222 H-O-H stretch
3300NH4 stretch
34323420 H-O-H stretch
359036253630Al-OH
36623680 Mg-OH
3780 Si-OH
Table 3. Si/Al(IV) ratio and Al(1Al) fraction in the saponite tetrahedral sheets based on. 29Si MAS-NMR resonance intensities.
Synthesis Temperature (°C)Si/Al(IV)Al(1Al) Fraction
1255.60.05
1755.90.04
2005.10.06
2405.60.05
2805.30.05
Table 4. 29Si MAS-NMR data and structural parameters, based on the Equations (2)–(5) of synthetic NH4-saponites prepared with increasing hydrothermal temperatures (modified after [39]).
Synthesis Temperature (°C)θobservedαobservedbideal (Å)bNMR (Å)bXRD (Å)
Equation (4)Equation (5)Equation (4)Equation (5)
125120.68°11.21°9.2619.2129.0849.0369.175
175120.03°10.56°9.2549.2089.0979.0529.175
200121.16°10.69°9.2709.2209.0789.0299.184
240119.71°10.24°9.2619.2179.1139.0709.174
280119.39°9.92°9.2679.2199.1289.0819.188
Table 5. Chemical composition of saponite SapCa-2 (in atom %) based on survey XPS analyses with Si as reference in comparison to data (in atom %) from Data handbook for Clay Minerals and Other Non-metallic Minerals [88] and Clays and Clay Minerals Special Issue 49 (5) Source Clays (2001) [89]. Oxygen is not included.
ElementXPSData Handbook/CCM
Si22.422.39
Al2.42.21
Mg16.415.74
Fe 0.46
Na3.62.02
K0.50.32
Ca0.50.64
Cl2.2
Ti 0.02
Publisher’s Note: MDPI stays neutral with regard to jurisdictional claims in published maps and institutional affiliations.

