
A Fundamental Economic Assessment of Recovering Rare Earth Elements and Critical Minerals from Acid Mine Drainage Using a Network Sourcing Strategy


Abstract
:1. Introduction
2. Materials, Process, and Methods
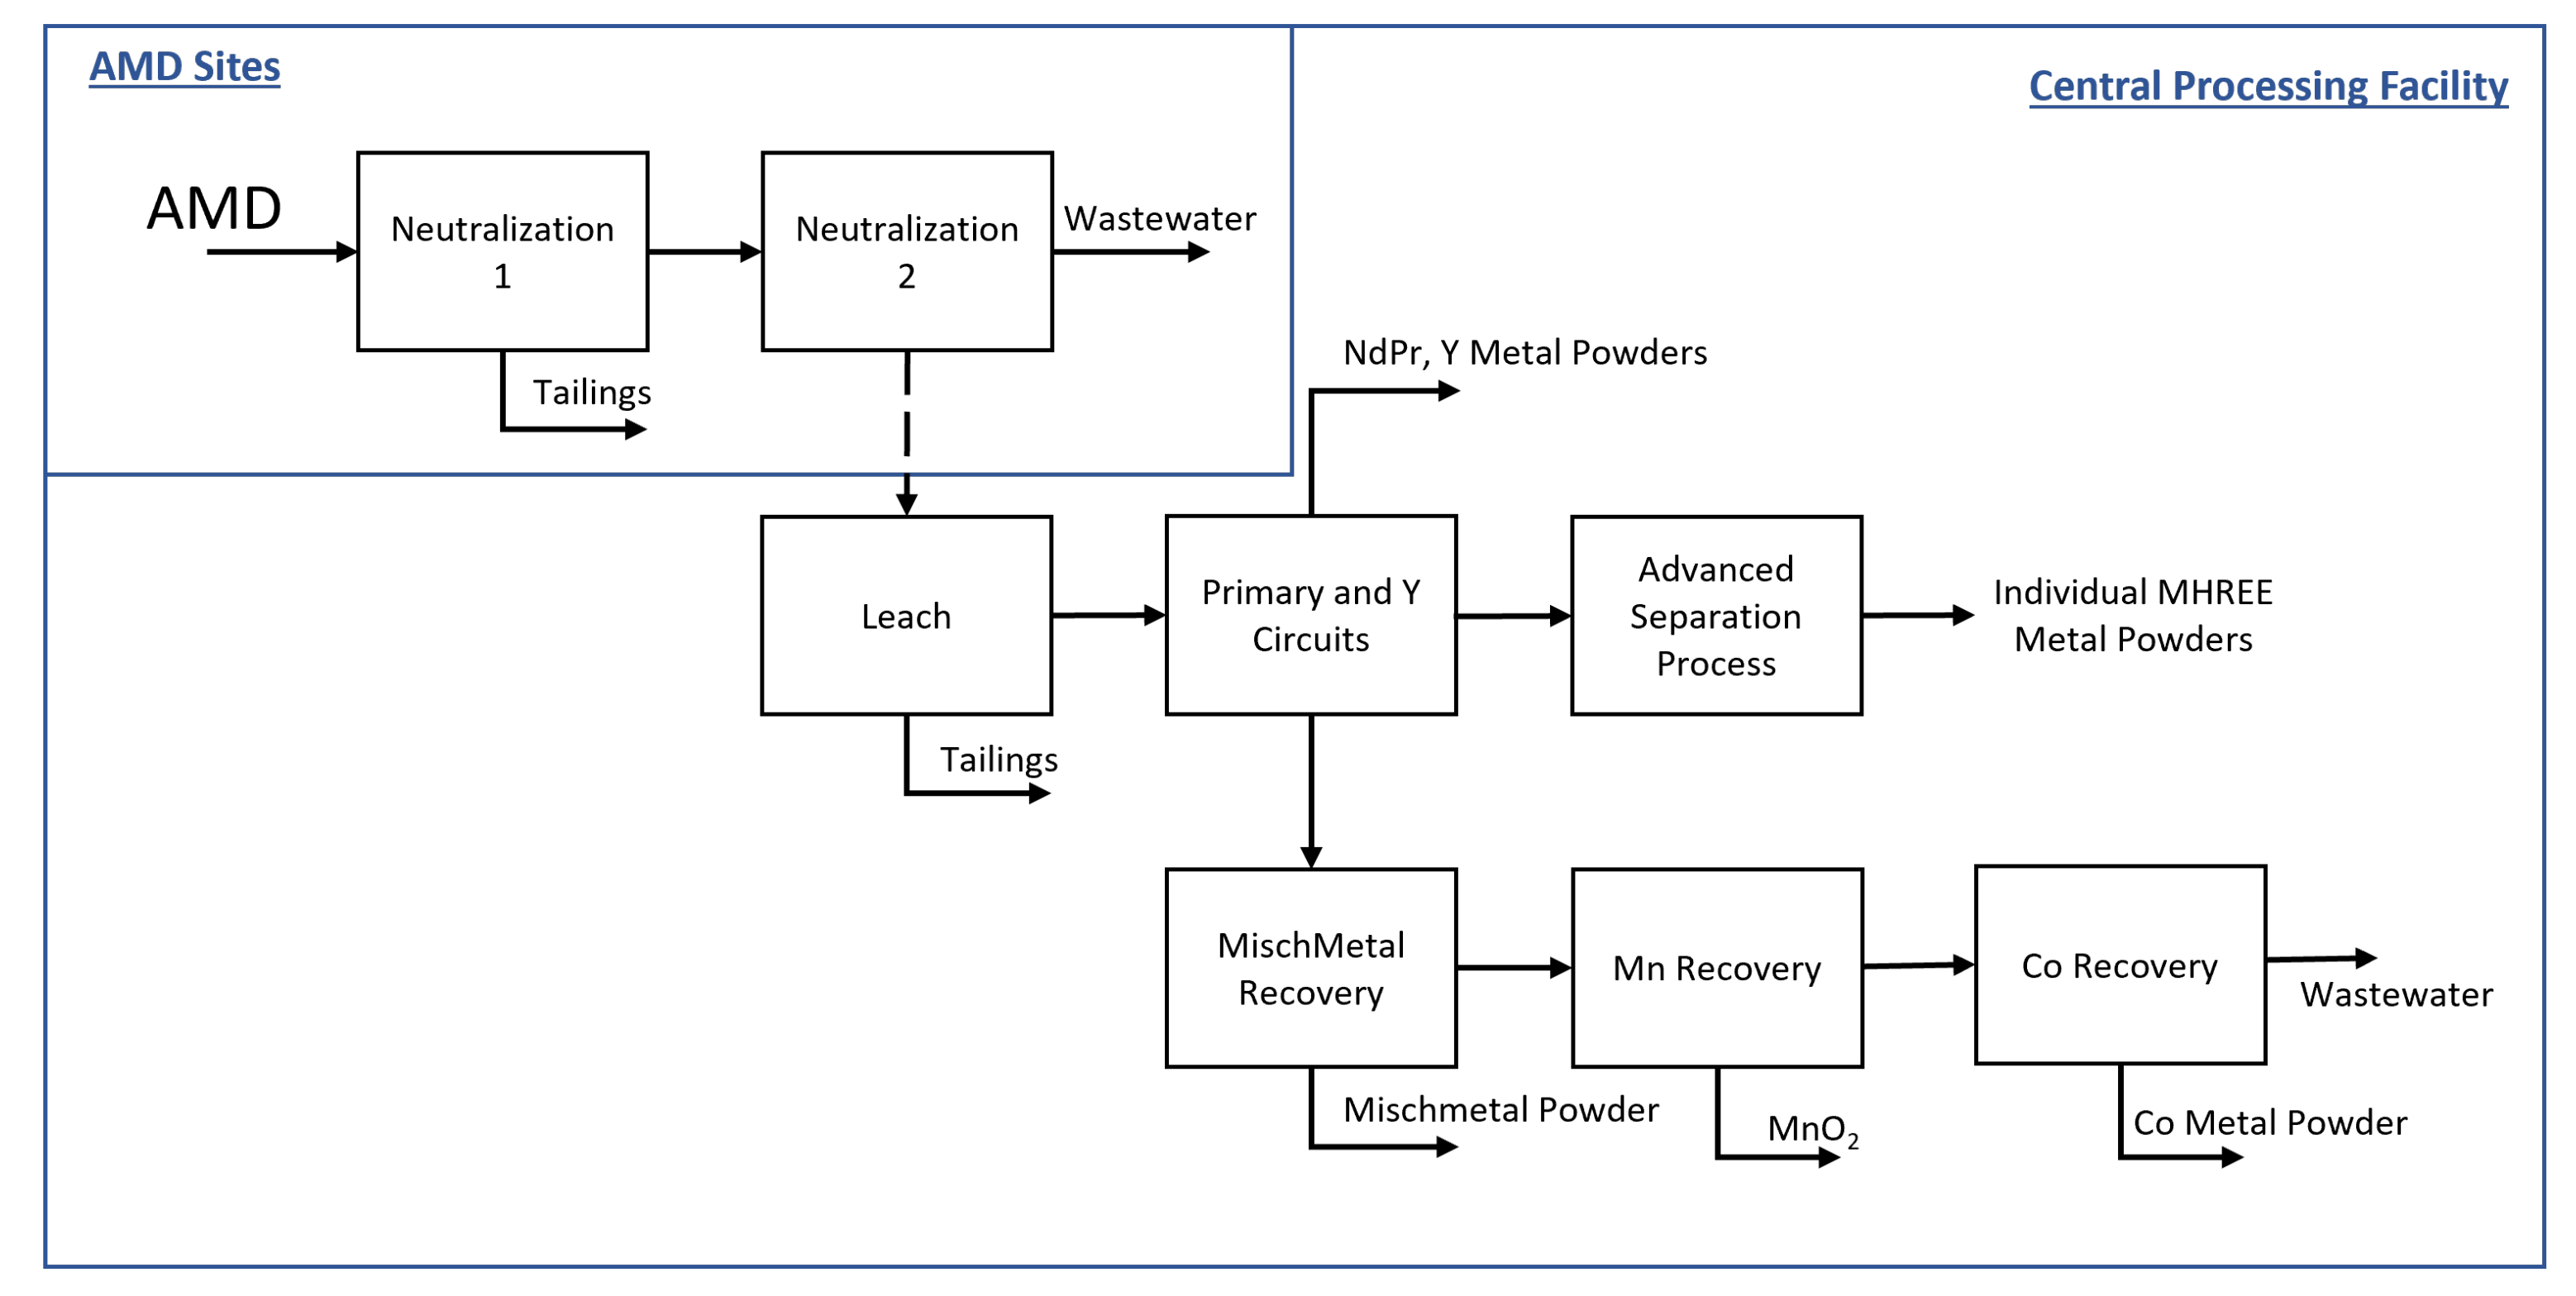
2.1. Process Description
2.2. Techno-Economic Analysis for the Recovery of REEs and CMs from AMD
- All amounts are in USD.
- The total operational period for the plant is 20 years.
- Inflation was applied to sales revenue and operating costs using a fixed rate of 3% per year.
- Capital costs are spread over a period not to exceed three years, and the allocation between those three years is 10%, 60%, and 30% for years one through three, respectively. Thus, the total analysis period (capital purchase plus operating) is not to exceed 23 years.
- During the capital expenditure period, capital costs escalate at a constant rate of 3.6% per year.
- The project is debt financed for 50% of the total overnight capital requirement; the remaining 50% is financed by equity.
- The debt repayment terms include: 6% interest rate, 10-year loan period, and no grace period on debt repayment. The re-payment uses a standard amortization schedule with constant payments throughout the payoff period.
- Working capital is not included in this estimate and will instead be borne by the operating entity at no cost to the project.
- The combined federal and local tax rate is fixed at 26%.
- All capital is depreciable, using a 150% declining balance depreciation schedule over 20 years. The depreciation method was not changed to straight line when conditions favored the switch.
- The mineral depletion rate for REEs is 14%. Depletion is charged at the appropriate rate times the net sales revenue after deducting royalties and any severance tax, provided that the total amount calculated by depletion rates does not exceed 50% of the taxable income before depletion.
- The plant is part of a larger commercial entity with sufficient revenue to offset negative taxable income. Thus, losses are not carried forward and are instead calculated as a “negative tax” that indicates the reduction in tax burden required for overall entity.
- No royalties are charged for the productions of REEs, as this cost is assumed to be borne with the feedstock acquisition costs.
- All production is assumed to be sold.
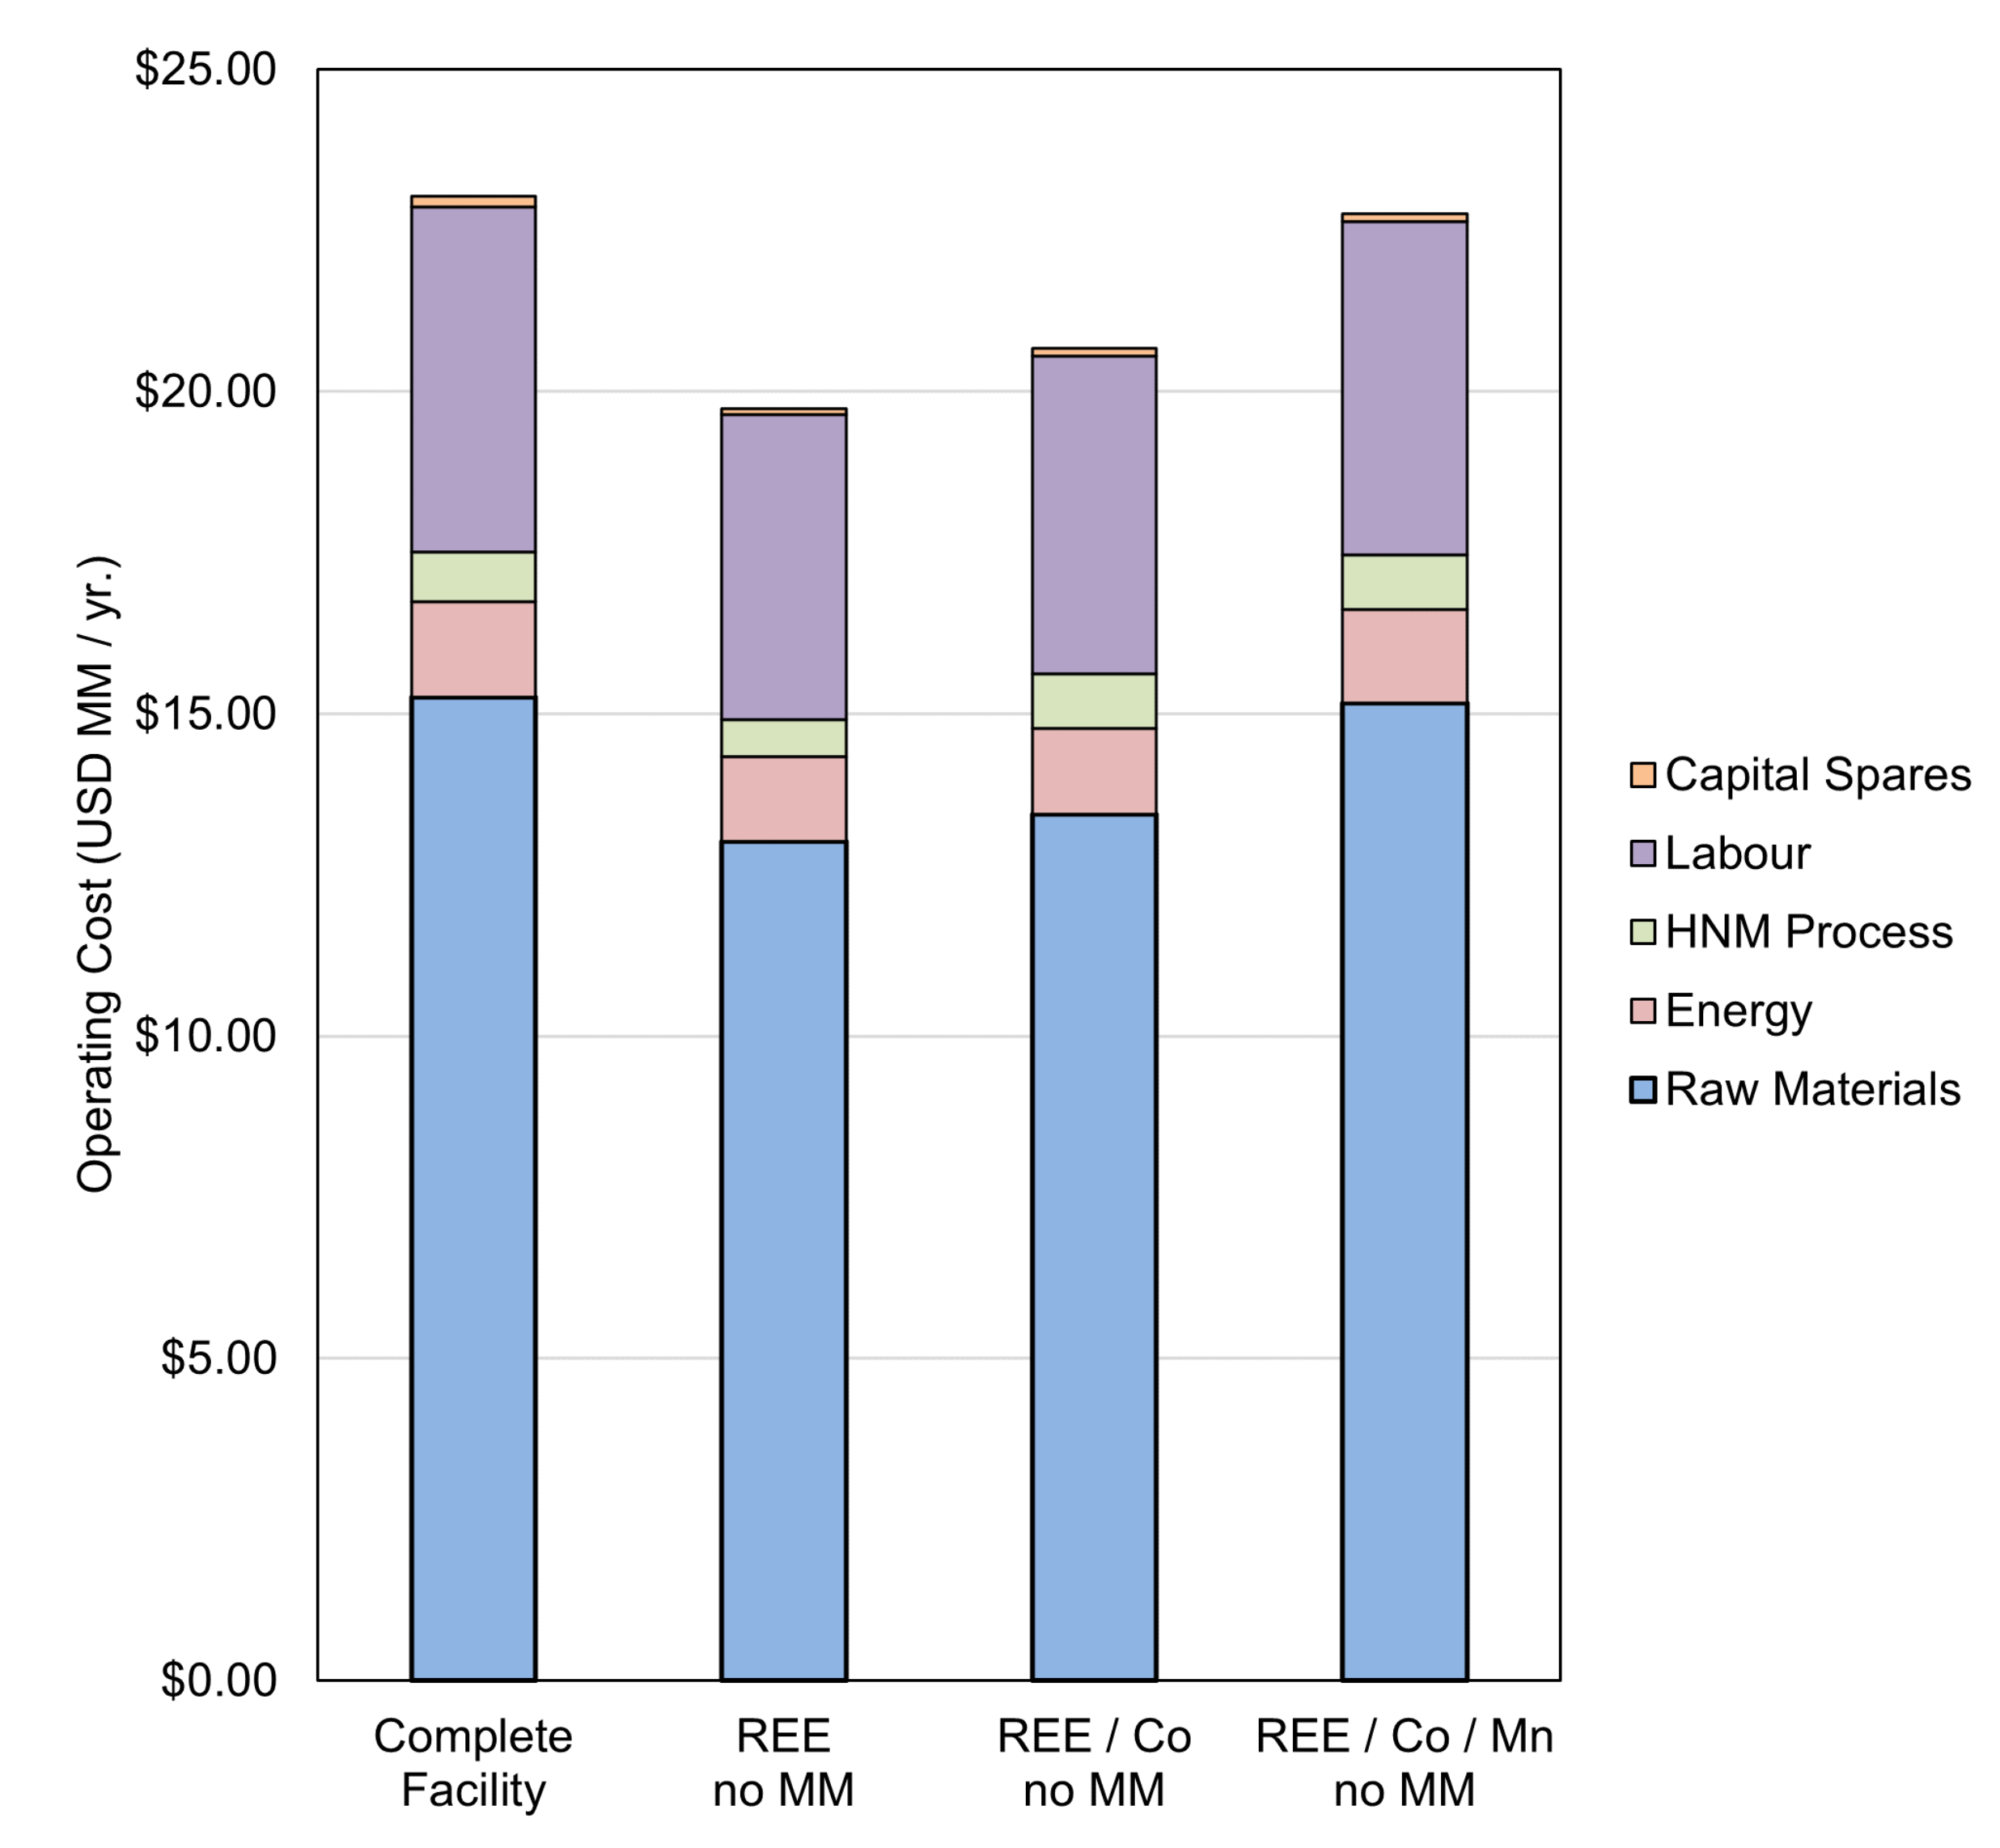
2.2.1. Operating Cost Estimate
- Materials, Reagents, and Consumables;
- Energy;
- Labor;
- Capital Spares.
2.2.2. Capital Cost Estimate
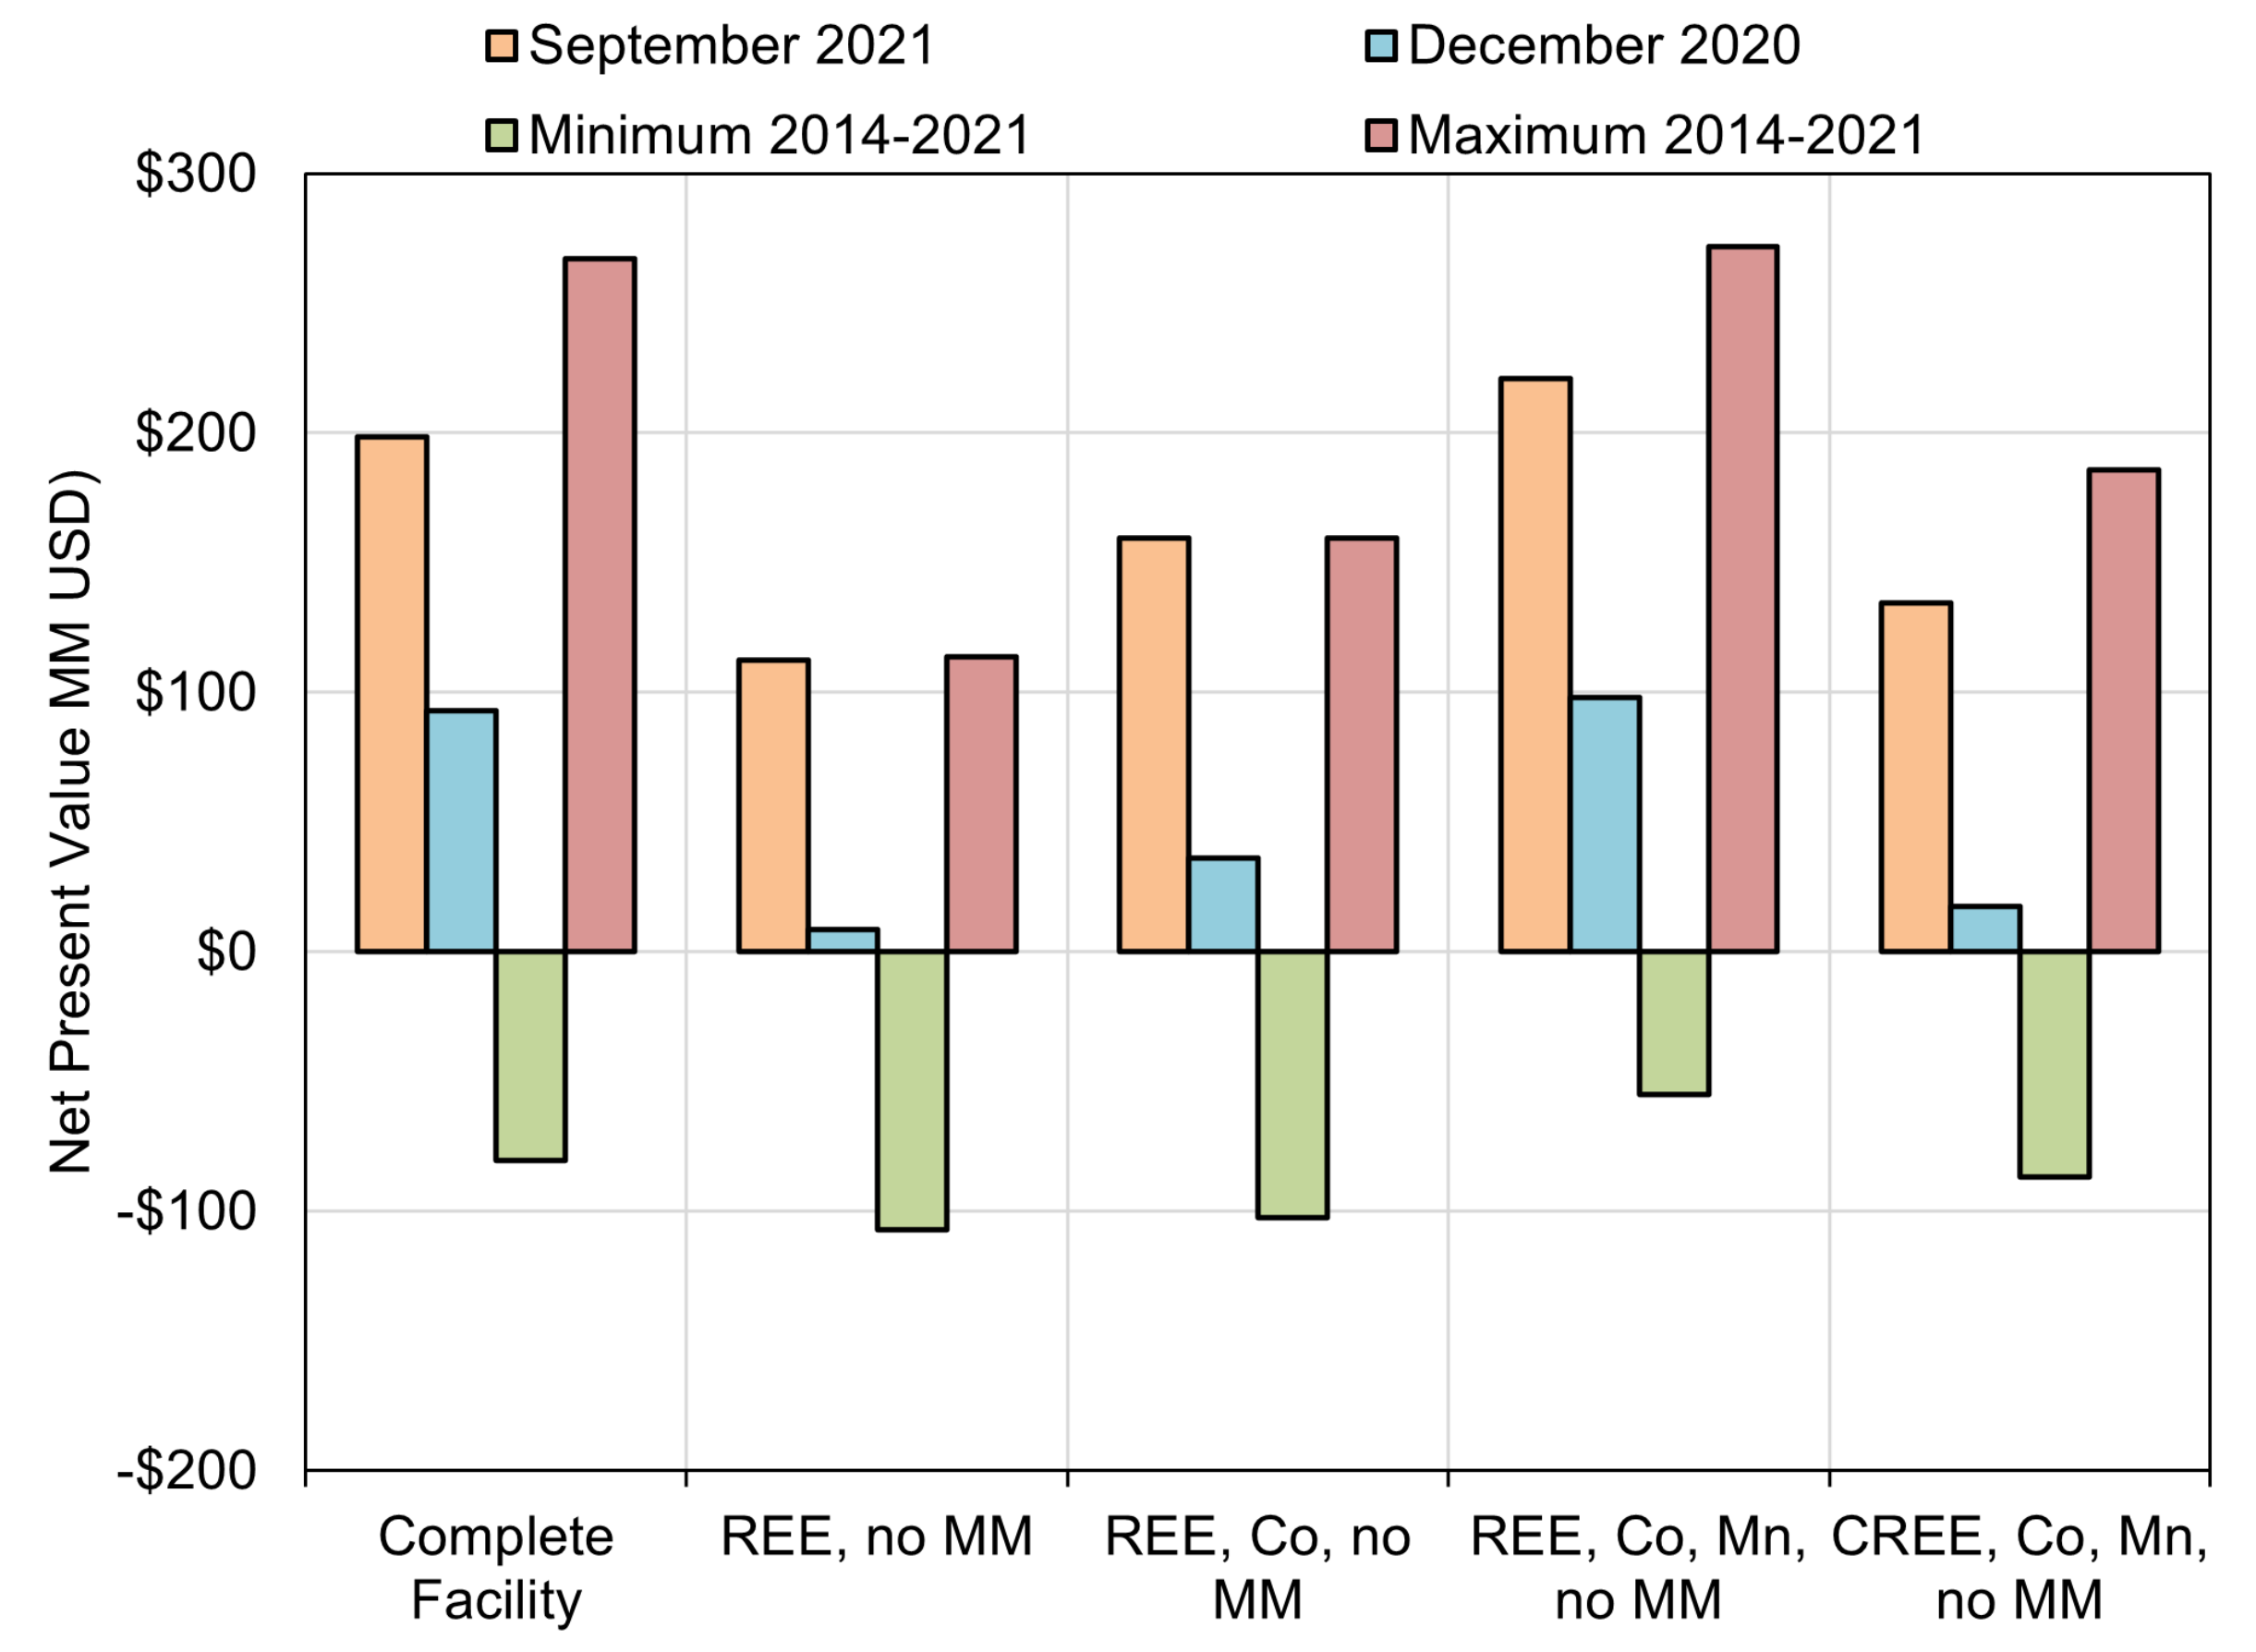
2.2.3. Financial and Sensitivity Analysis
- Complete Processing Plant (REEs, Co, Mn, and mischmetal);
- REE plant, with no mischmetal;
- REE, Co plant, with no mischmetal;
- REE, Co, Mn plant, with no mischmetal;
- Only salable products are the magnet REEs (Pr, Nd, Tb, Dy), Y, Sc, Co and Mn.
- September 2021 Pricing;
- December 2020 Pricing;
- Minimum Pricing, Period 2014–2021;
- Maximum Pricing, Period 2014–2021.
3. Results, Discussion, and Recommendations
3.1. Engineering Study Summary
3.2. Financial Analysis
3.3. Sensitivity Analysis
3.4. Implication of the Results
4. Conclusions
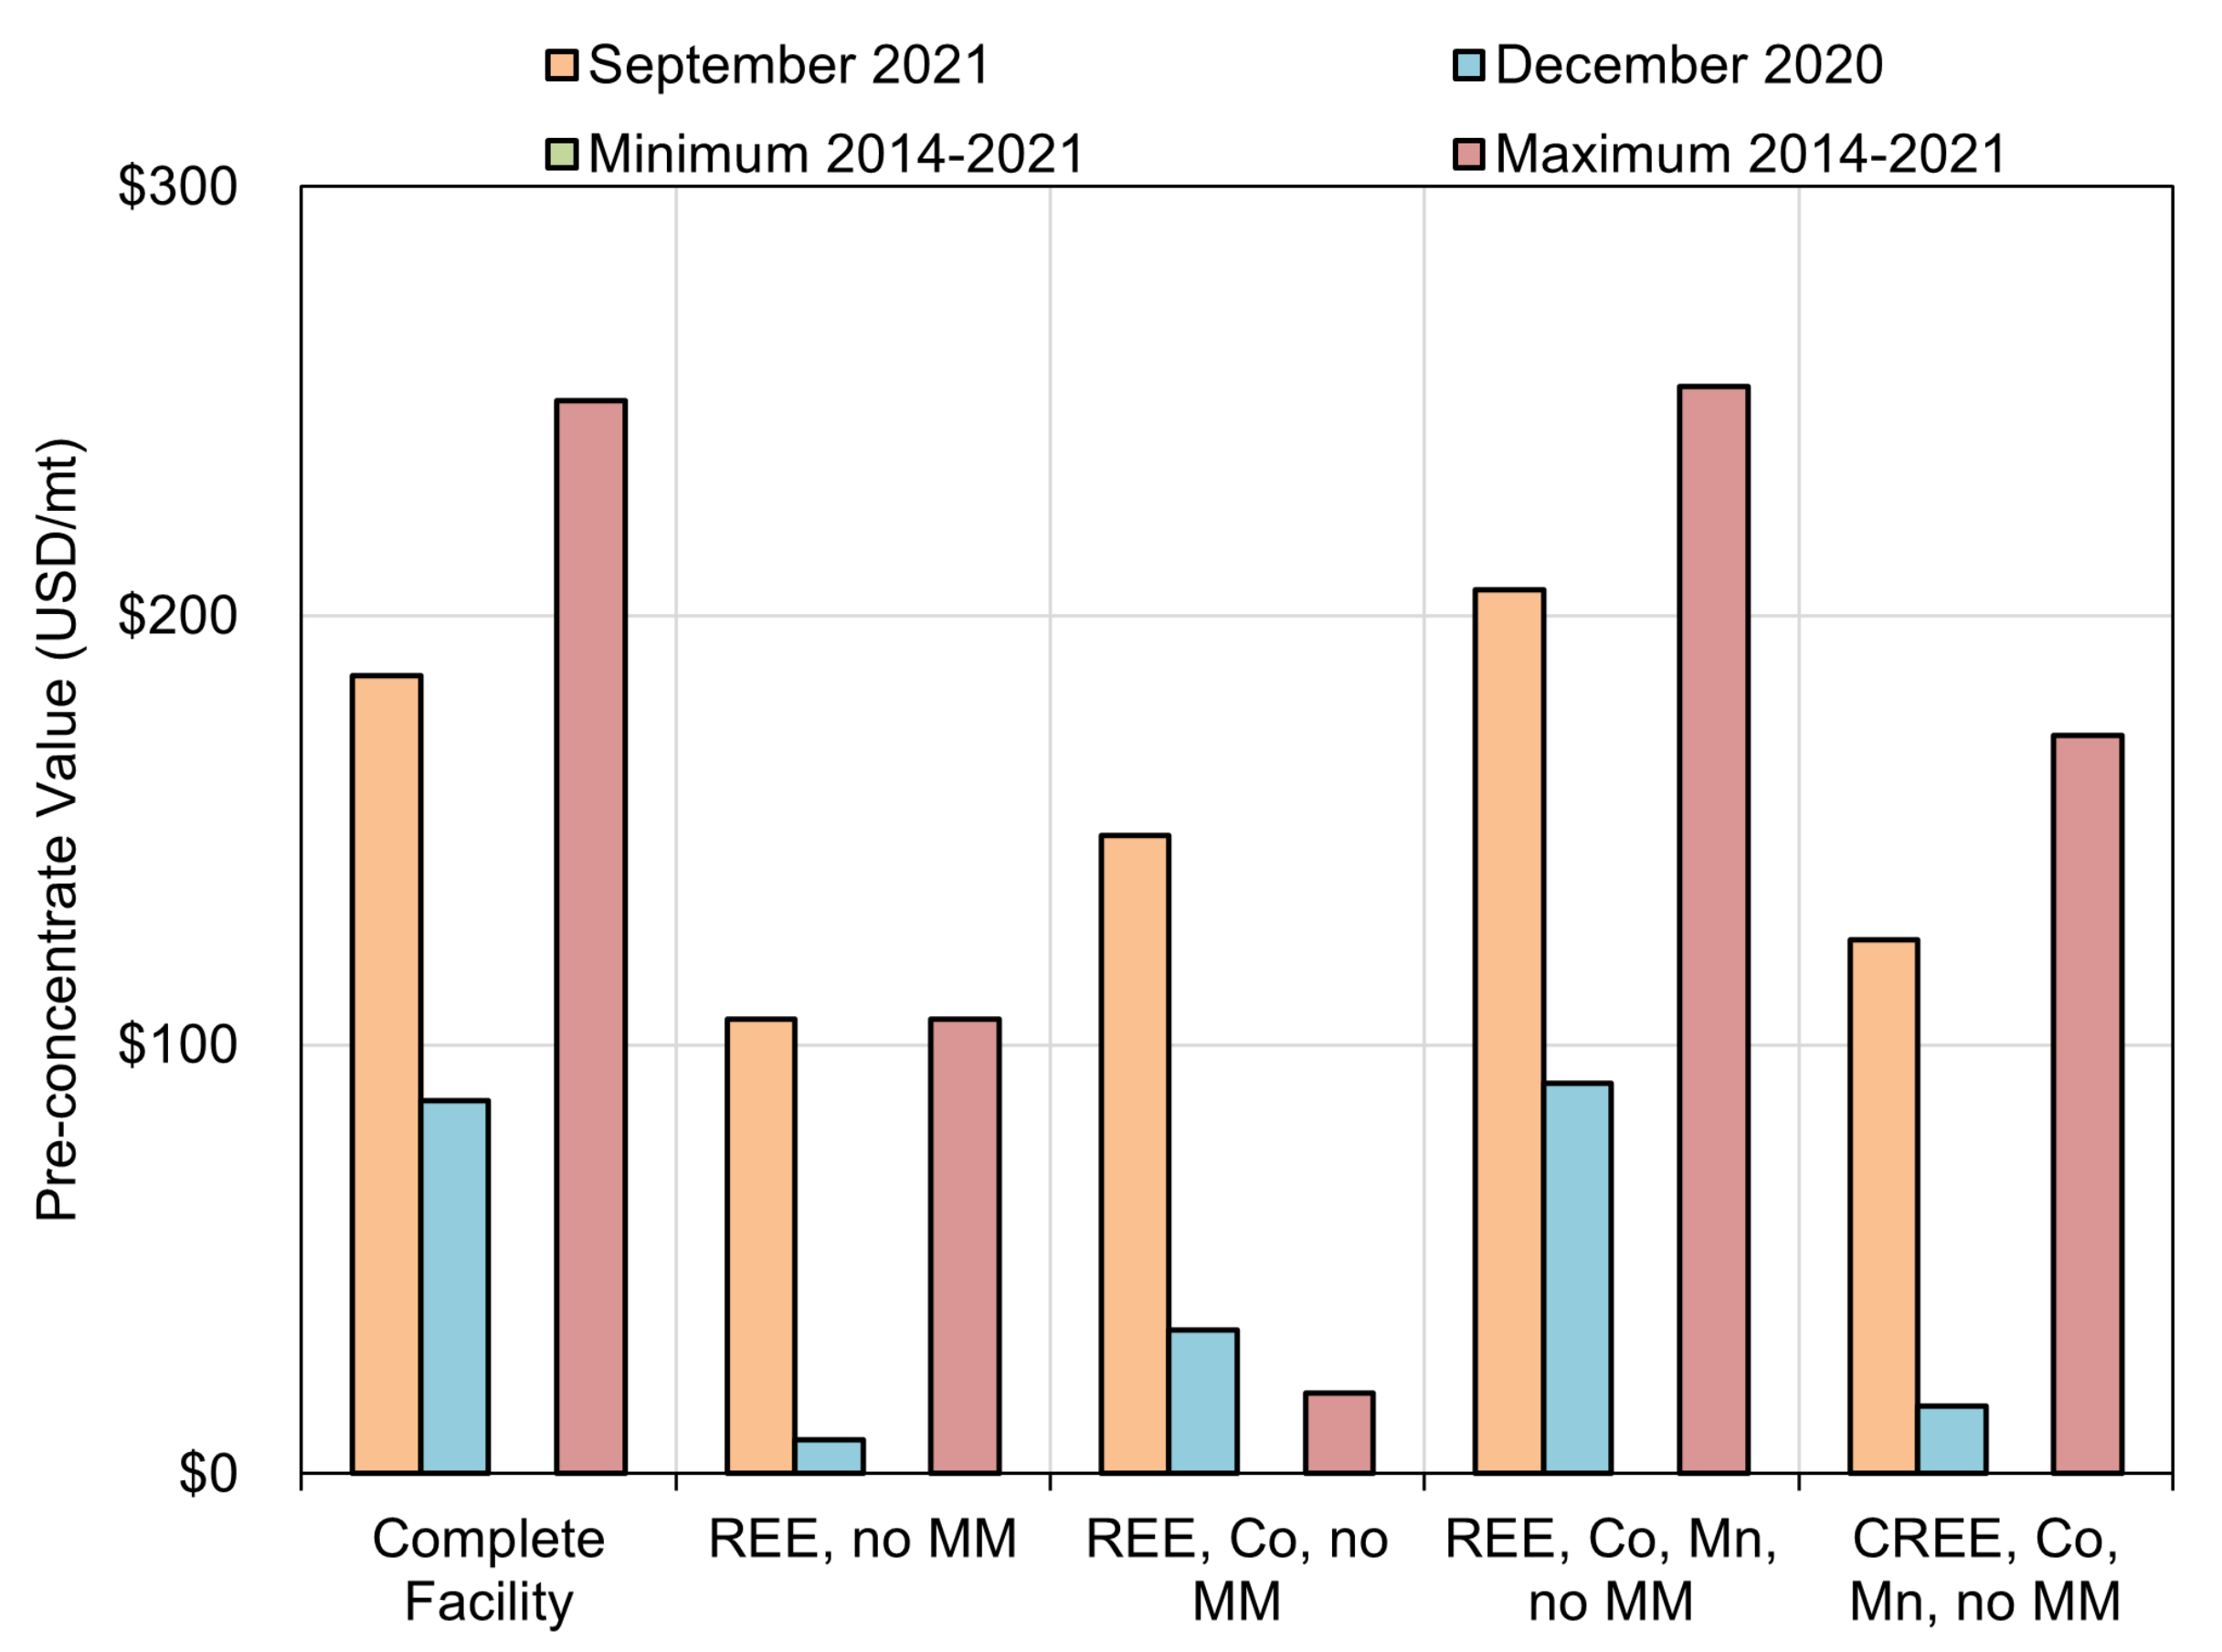
- The contained value of pre-concentrated AMD produced from passive two-stage precipitation (US 2021/0017625 A1) ranged from USD 751 to USD 1786 per metric ton when using the minimum and maximum prices over the last decade. The contained value was determined to be USD 1575 per metric ton using contemporary (September 2021) prices. These values are commensurate with or even superior to conventional REE ore deposits currently under consideration.
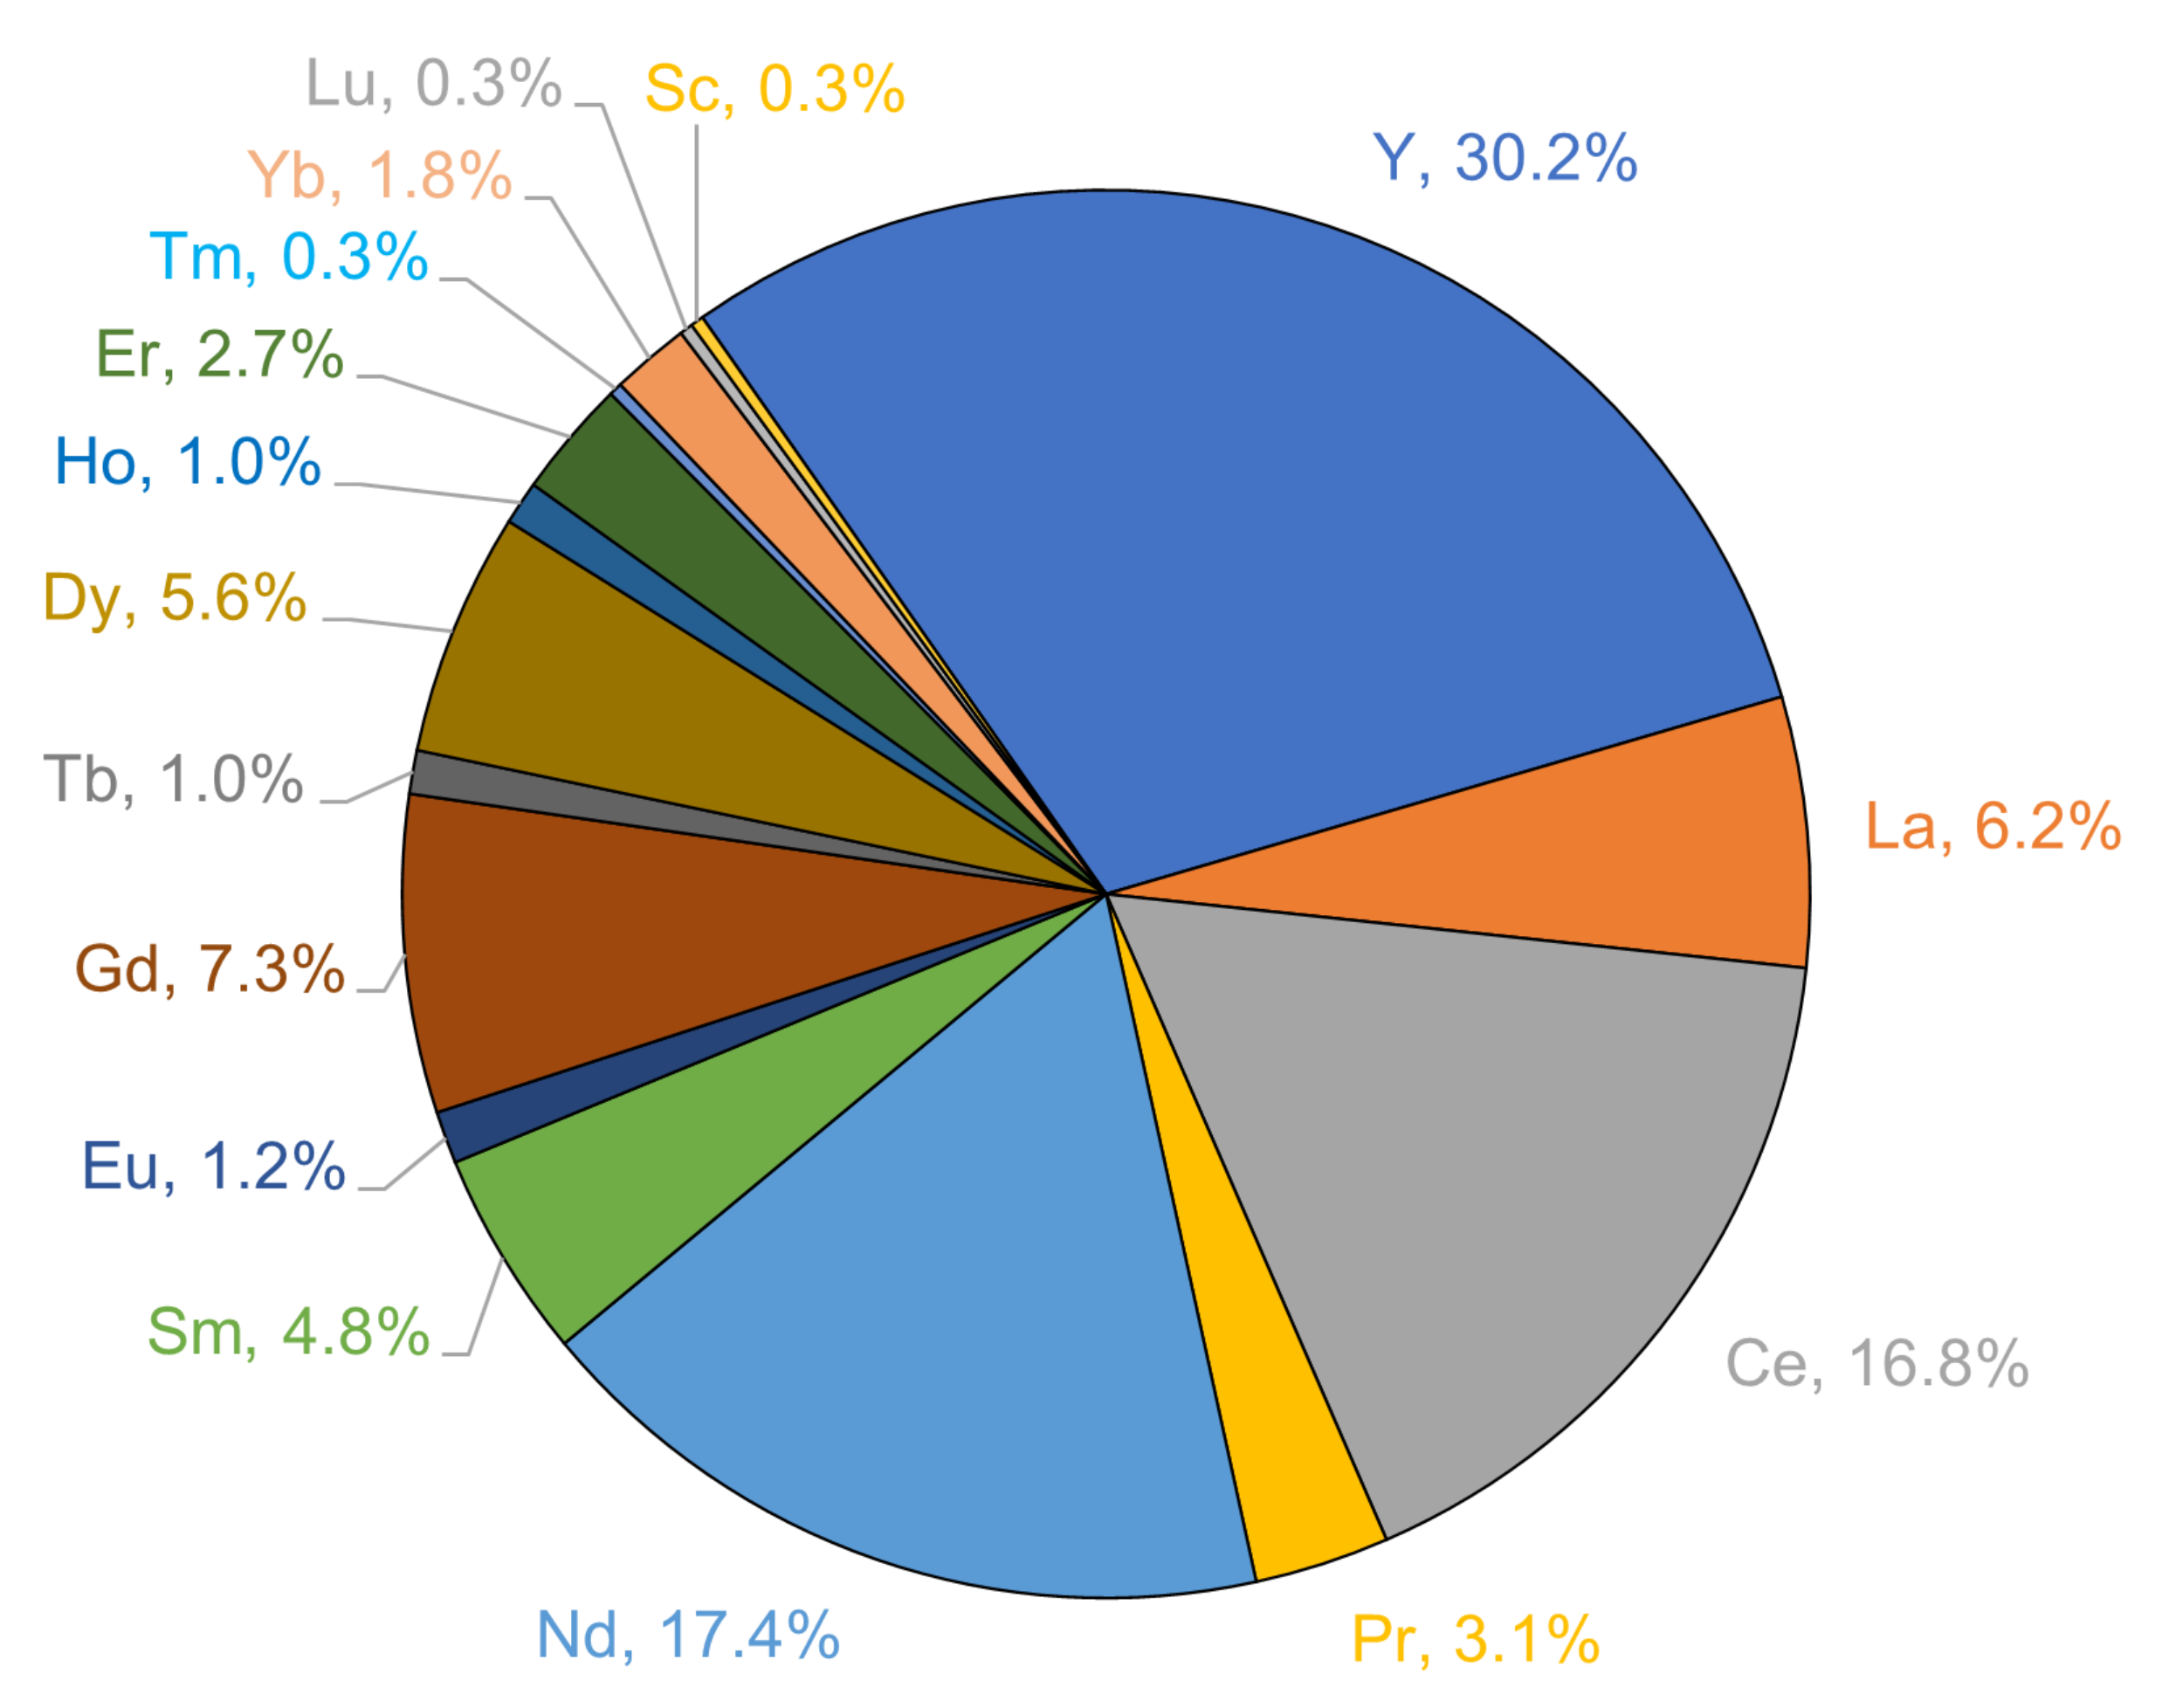
- The REE basket price of AMD pre-concentrate was determined to be USD 60.76/kg REE when using contemporary oxide prices. This value is nearly two times that of conventional REE sources, including ion adsorption clays found in South China [60]. This value is largely due to the high content of critical and magnet REEs, including Y, Nd, Pr, and Tb, which collectively constitute over 54% of the total REE content.
- Depending on the plant configuration, the production capacity ranges from 212 to 444 mtpy REE, 157 mtpy Co, and 5653 mtpy Mn. This value is significantly below that of conventional REE separation plants; however, this level of production may be crucial in establishing a baseline for national security purposes. An assessment of the pre-concentrate feed requirements needed for this level of production show that the volume is well within the estimated flows of AMD within the Appalachian region.
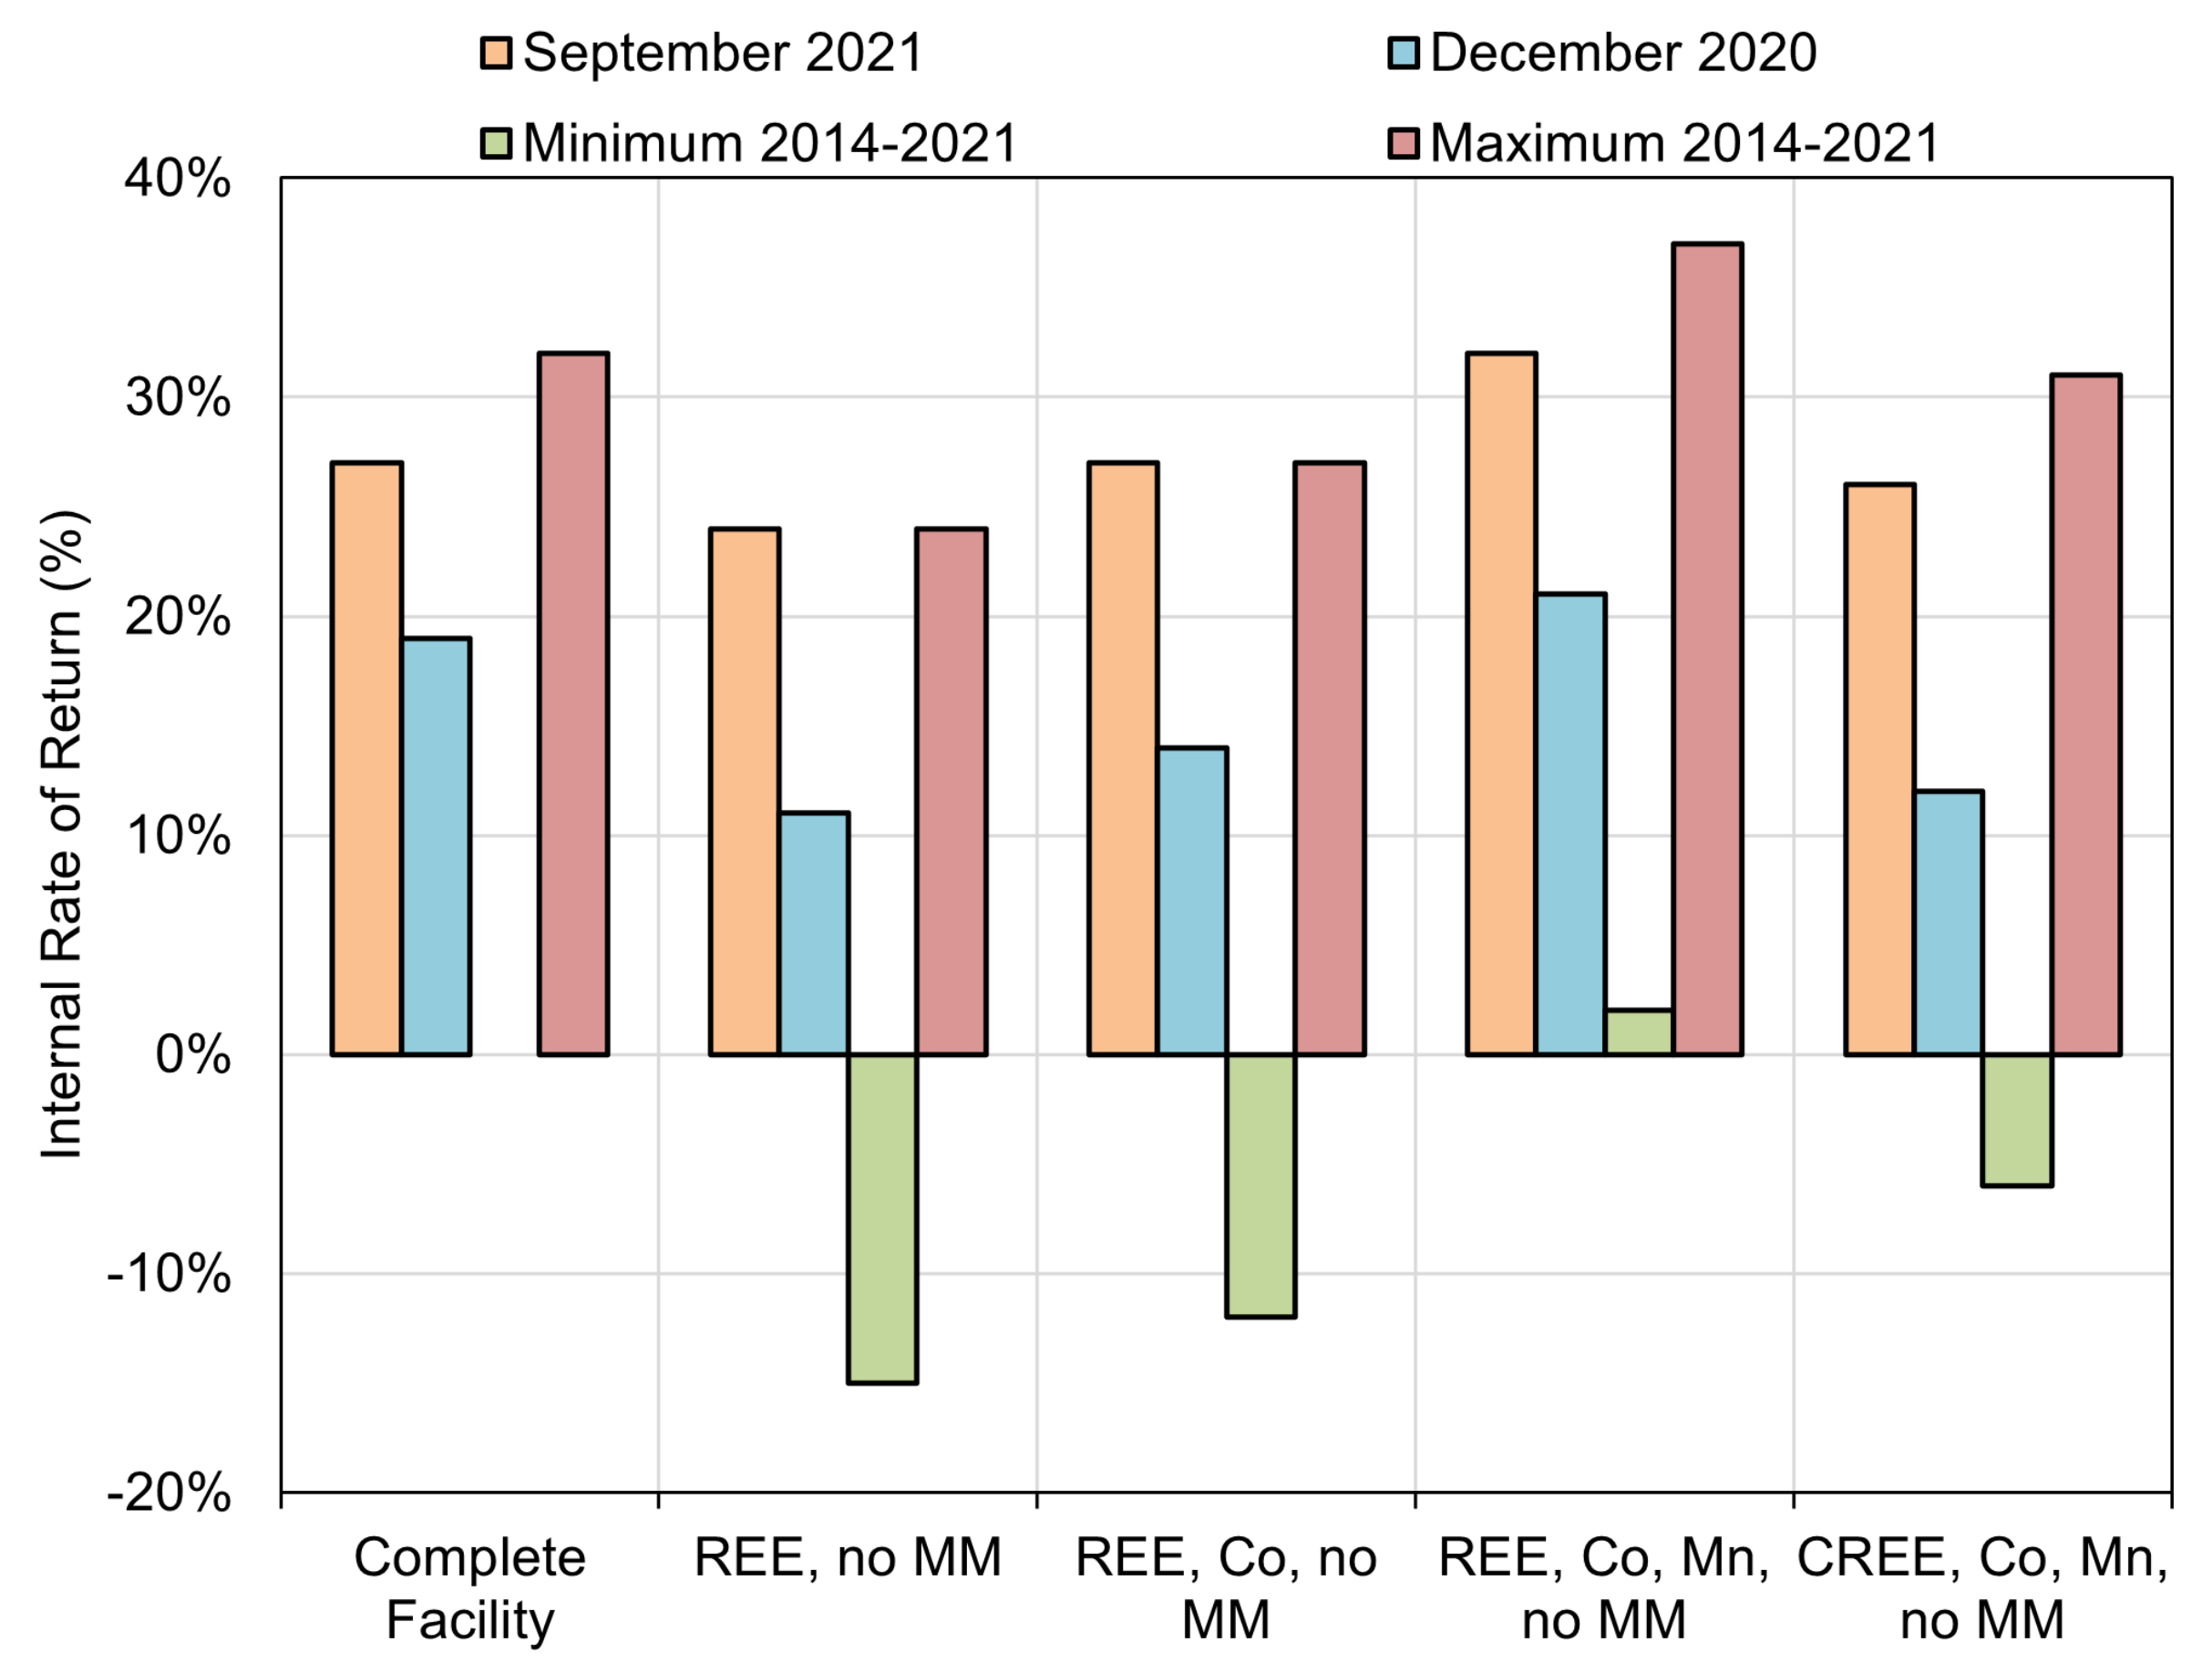
- The results of this analysis show that, with the exception of the minimum price scenario, all operational configurations have positive economic indicators with rates of return varying from 25% to 32% for the contemporary price scenario. The optimal configuration was determined to include production Co, Mn, and all REEs except for mischmetal, which is not recovered. The magnet REE, Sc, Y, and CM-only configuration, which is deemed to be the most likely given future demand scenarios, yielded a positive rate of return in all scenarios.
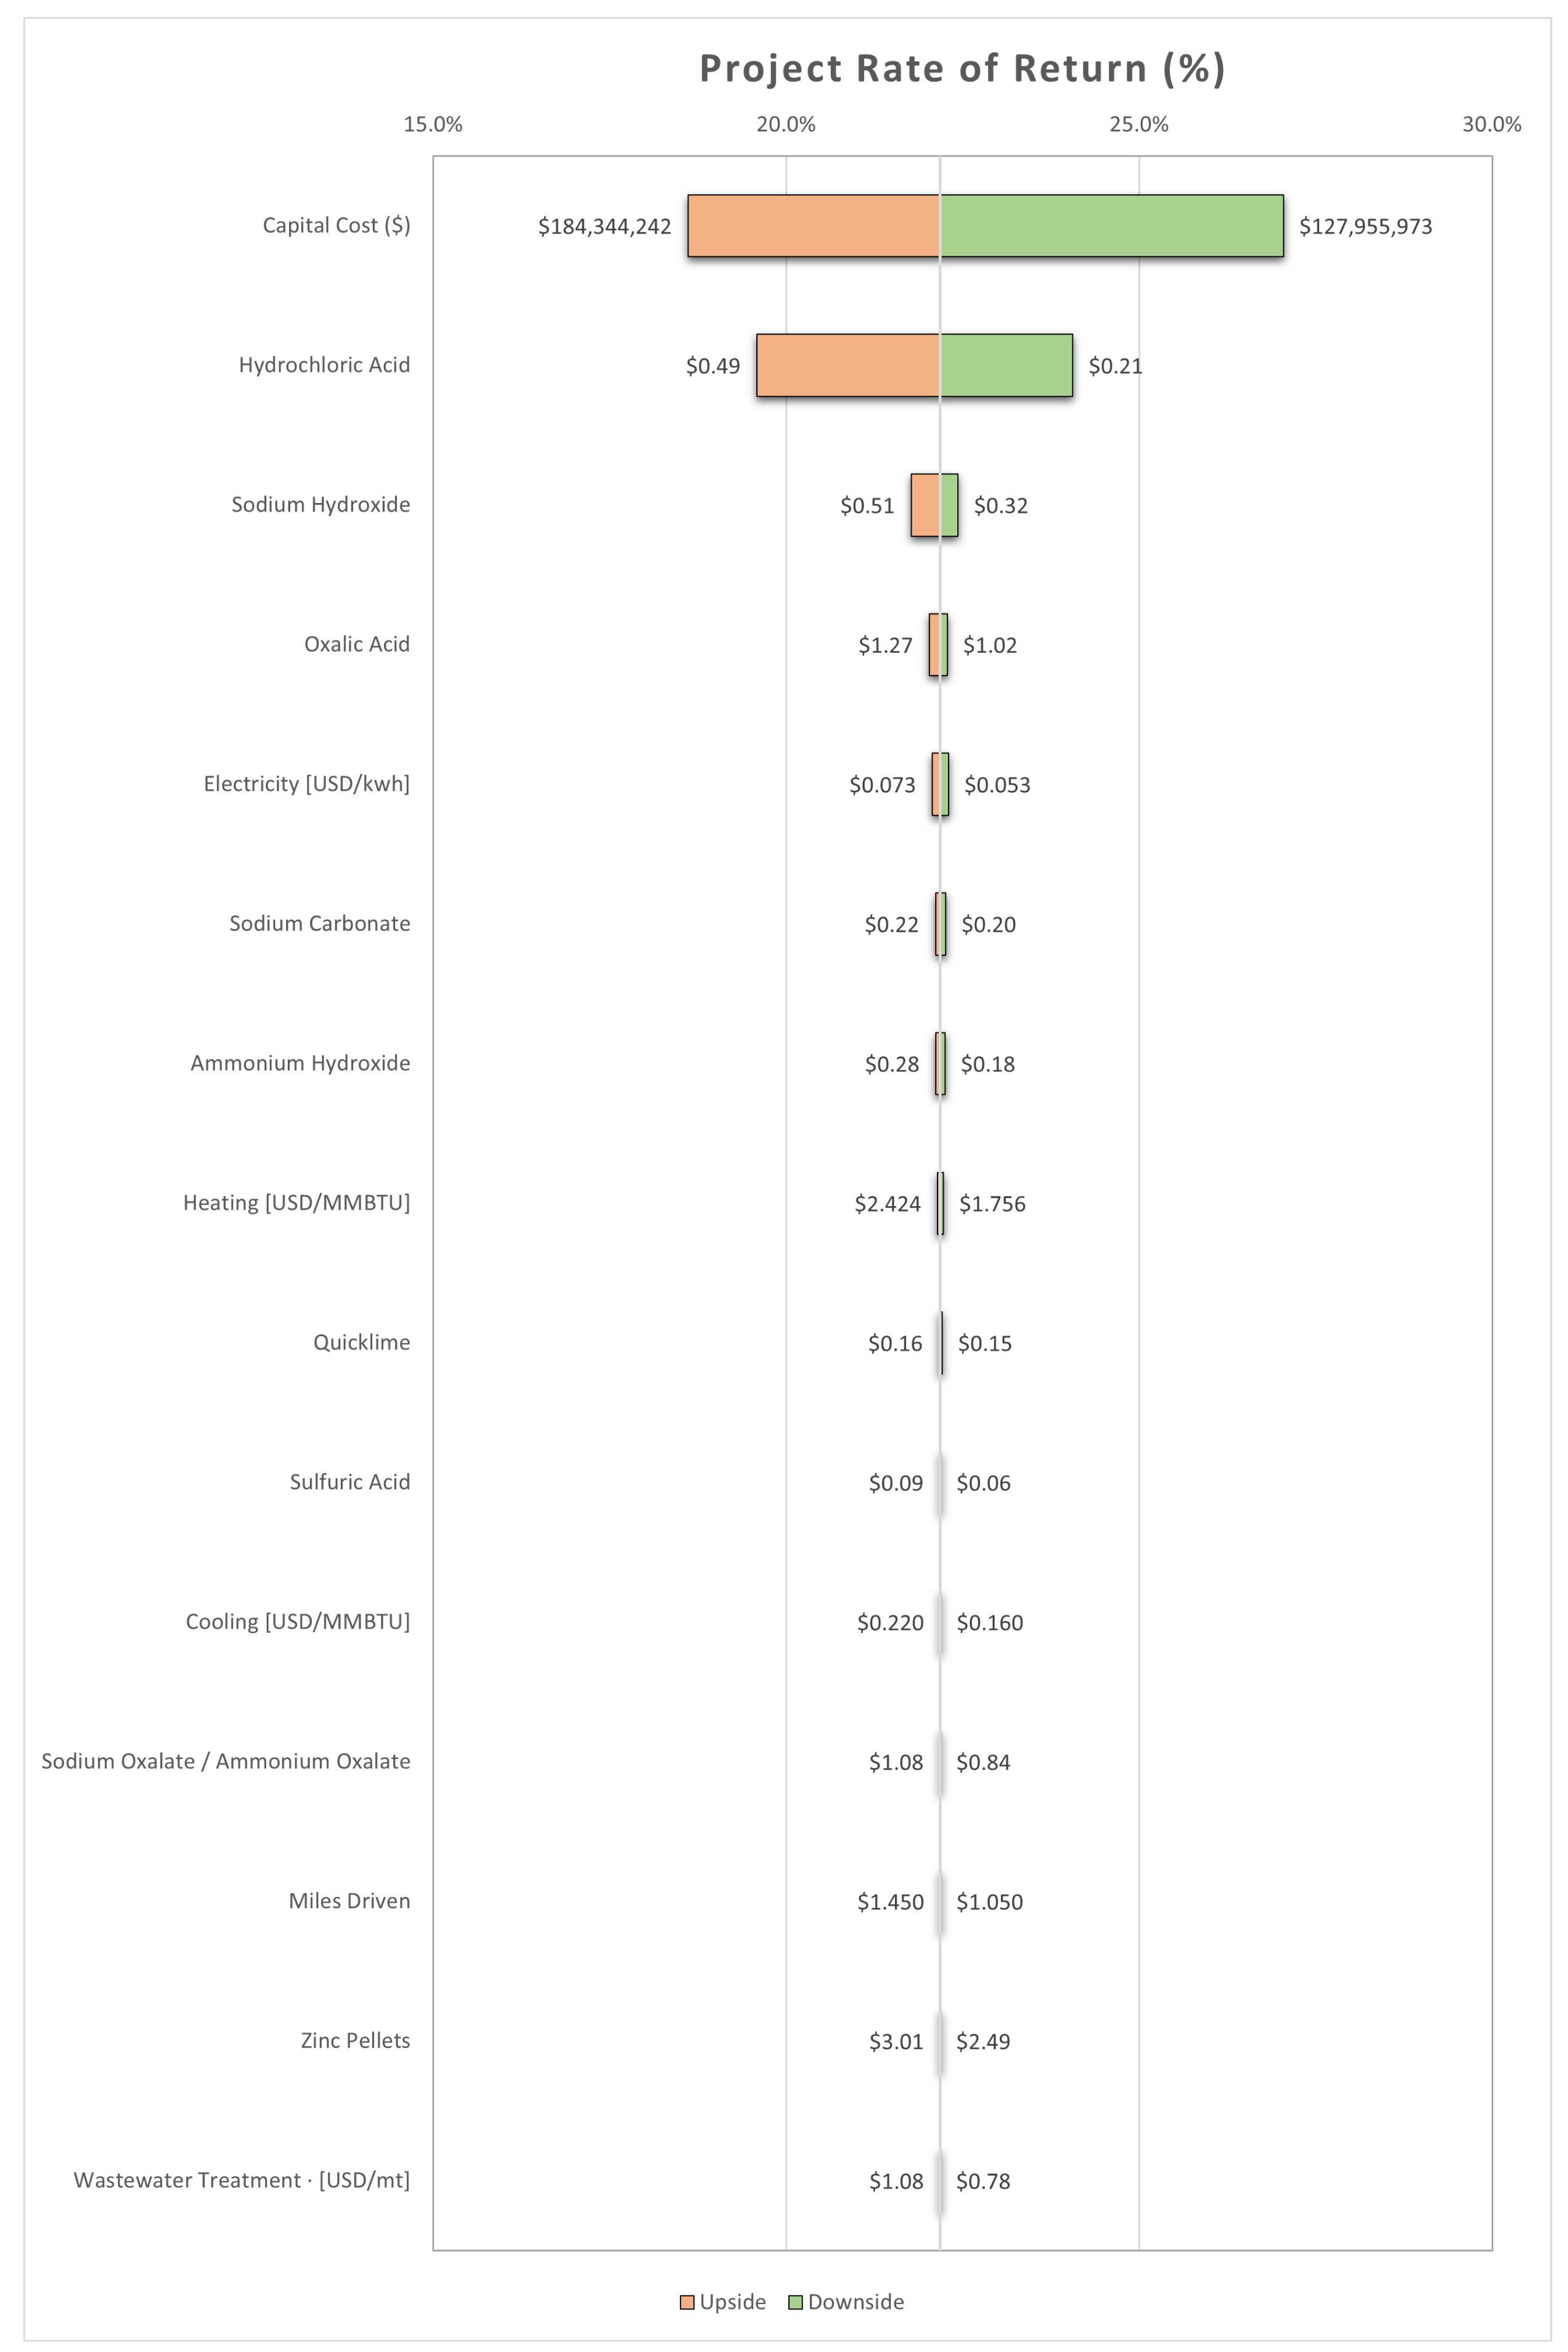
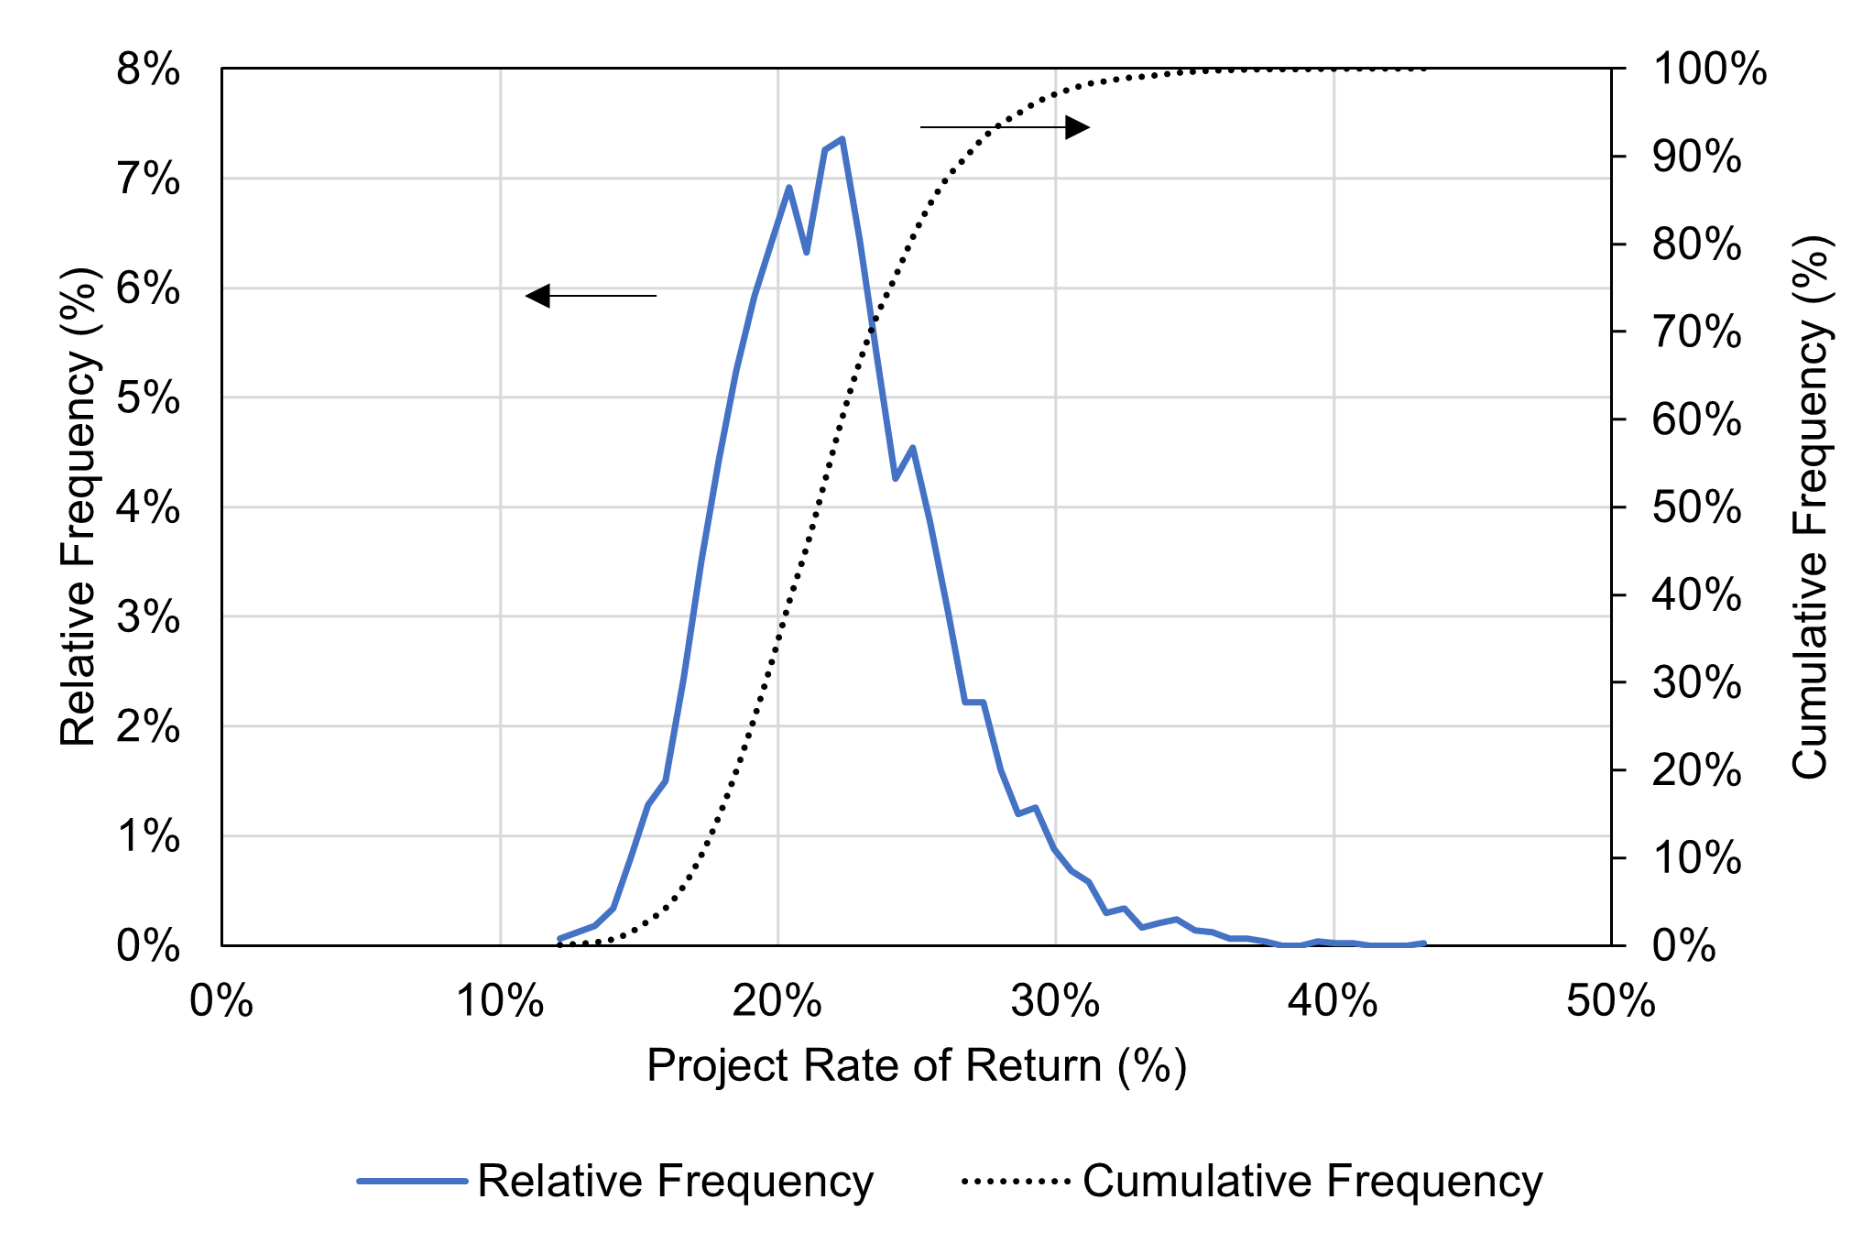
- Sensitivity analysis and Monte Carlo simulation demonstrate that the project capital cost and HCl consumption were the only two project parameters that produced a significant impact on overall profitability. This result suggests that further optimization of process design may impart significant financial gains to the enterprise (i.e., the low capital cost estimate produce a 5 percentage point increase to rate of return). Notably, additional research and development on the use of ionic liquids [59], rather than solvent-based extractants may produce simultaneous and synergistic improvement of these two parameters.
- While the economic results are moderately favorable under most scenarios, the level of project risk is significant, particularly considering the possibility of prolonged price disruptions. To mitigate this risk, one option could re-frame the sourcing strategy to one of supplier-buyer cooperative whereby the profits are shared between the investor, the operator, and the feedstock suppliers. Given the nature of AMD treatment in the US, which can often include a mix of government and private liability holders, this approach would inevitably require strong public-private partnerships. Nevertheless, this approach will both incentivize AMD treatment and promote economic development in regions that have been most impacted by declining coal production, while mitigating a national security need.
- To better identify and quantify the environmental, social, and governance, benefit of the proposed approach, additional study should address stakeholder assessments, regional economic impact, environmental justice considerations, product life cycle analysis, and legal implications and barriers. Given the promising economic indicators identified at this stage, the research team will evaluate these and other factors as the project progresses.
Author Contributions
Funding
Conflicts of Interest
References
- U.S. Department of Energy. Critical Materials Strategy; Technical Report; U.S. Department of Energy: Washington, DC, USA, 2011.
- U.S. Department of Energy. Critical Minerals and Materials; Technical Report; United States Department of Energy: Washington, DC, USA, 2021.
- U.S. Department of Commerce. A Federal Strategy to Ensure Secure and Reliable Supplies of Critical Minerals Contents; Technical Report; United States Department of Commerce: Washington, DC, USA, 2019.
- The White House. Building Resilient Supply Chains, Revitalizing American Manufacturing, and Fostering Braod-Based Growth: 100-Day Reviews under Executive Order 14017; Technical Report; The White House: Washington, DC, USA, 2021.
- Blengini, G.; Mathieux, F.; Mancini, L.; Nyberg, M.; Salminen, J.; Garbarino, E.; Orveillon, G.; Saveyn, H.; Mateos Aquilino, V.; Llorens González, T.; et al. Recovery of Critical and Other Raw Materials from Mining Waste and Landfills: State of Play on Existing Practices; Technical Report; European Commission Joint Research Center: Luxembourg, 2019. [Google Scholar]
- International Energy Agency (IEA). The Role of Critical Minerals in Clean Energy Transitions; IEA Publications: Paris, France, 2021. [Google Scholar]
- Mudd, G.; Werner, T.; Weng, Z.; Yellishetty, M.; Yaun, Y.; McAlpine, S.; Skirrow, R.; Czarnota, K. Critical Minerals in Australia: A Review of Opportunities and Research Needs; Technical Report; Geoscience Australia: Canberra, Australia, 2018.
- Hans Wedepohl, K. The composition of the continental crust. Geochim. Cosmochim. Acta 1995, 59, 1217–1232. [Google Scholar] [CrossRef]
- Hu, Z.; Gao, S. Upper crustal abundances of trace elements: A revision and update. Chem. Geol. 2008, 253, 205–221. [Google Scholar] [CrossRef]
- Roskill. Rare Earths: Outlook to 2030; Technical Report; Roskill: London, UK, 2021. [Google Scholar]
- S.1317—116th Congress (2019–2020): American Mineral Security Act, S.1317, 116th Cong. 2019. Available online: https://www.congress.gov/bill/116th-congress/senate-bill/1317 (accessed on 3 October 2021).
- Cox, C.; Kynicky, J. The Extractive Industries and Society The rapid evolution of speculative investment in the REE market before, during, and after the rare earth crisis of 2010–2012. Extr. Ind. Soc. 2017, 5, 8–17. [Google Scholar] [CrossRef]
- Roskill. Rare Earths: Global Industry, Markets and Outlook to 2026; Technical Report; Roskill: London, UK, 2016. [Google Scholar]
- Granite, E.; Alvin, M.; Roth, E. Brief Overview of NETL RIC Rare Earth Efforts-Presented by NETL at. In Proceedings of the AICHE National Meeting, San Francisco, CA, USA, 16 November 2016. [Google Scholar]
- Granite, E.; Alvin, M.; Roth, E. NETL RIC Rare Earth Element Coal Research; Technical Report; NETL: Pittsburgh, PA, USA, 2016.
- Ziemkiewicz, P.; He, T.; Noble, A.; Liu, X. Recovery of Rare Earth Elements (REEs) from Coal Mine Drainage; West Virginia Mine Drainage Task Force Symposium: Morgantown, WV, USA, 2016. [Google Scholar]
- Skousen, J.G. Acid mine drainage. Green Lands 1995, 25, 52–55. [Google Scholar]
- Skousen, J.G.; Ziemkiewicz, P.F.; McDonald, L.M. Acid mine drainage formation, control and treatment: Approaches and strategies. Extr. Ind. Soc. 2019, 6, 241–249. [Google Scholar] [CrossRef]
- Vass, C.R.; Noble, A.; Ziemkiewicz, P.F. The occurrence and concentration of rare earth elements in acid mine drainage and treatment byproducts: Part 1—Initial survey of the northern Appalachian Coal Basin. Min. Eng. 2019, 71, 49–50. [Google Scholar] [CrossRef]
- Vass, C.R.; Noble, A.; Ziemkiewicz, P.F. The Occurrence and Concentration of Rare Earth Elements in Acid Mine Drainage and Treatment Byproducts. Part 2: Regional Survey of Northern and Central Appalachian Coal Basins. Min. Metall. Explor. 2019, 36, 917–929. [Google Scholar] [CrossRef]
- León, R.; Macías, F.; Cánovas, C.R.; Pérez-López, R.; Ayora, C.; Nieto, J.M.; Olías, M. Mine waters as a secondary source of rare earth elements worldwide: The case of the Iberian Pyrite Belt. J. Geochem. Explor. 2021, 224. [Google Scholar] [CrossRef]
- Migaszewski, Z.M.; Gałuszka, A.; Dołȩgowska, S. Extreme enrichment of arsenic and rare earth elements in acid mine drainage: Case study of Wiśniówka mining area (south-central Poland). Environ. Pollut. 2019, 244, 898–906. [Google Scholar] [CrossRef]
- Akcil, A.; Koldas, S. Acid Mine Drainage (AMD): Causes, treatment and case studies. J. Clean. Prod. 2006, 14, 1139–1145. [Google Scholar] [CrossRef]
- Taylor, J.; Pape, S.; Murphy, N. A Summary of Passive and Active Treatment Technologies for Acid and Metalliferous Drainage (AMD). In Proceedings of the 5th Australian Workshop on Acid Drainage, Fremantle, Australia, 29–31 August 2005; pp. 1–49. [Google Scholar]
- Aubé, B.C.; Zinck, J.M. Comparison of AMD Treatment Processes and Their Impact On Sludge Characteristics. In Proceedings of the Sudbury’99, Mining and the Environment II, Sudbury, ON, Canada, 13–17 September 1999. [Google Scholar]
- Masindi, V.; Tekere, M. Innovative Routes for Acid Mine Drainage (AMD) Valorization. In Recovery of Byproducts from Acid Mine Drainage Treatment, 1st ed.; Fosso-Kankeu, E., Wolkersdorfer, C., Burgess, J., Eds.; Scrivener Publishing LLC: Beverly, MA, USA, 2020; pp. 189–218, Chapter 7. [Google Scholar] [CrossRef]
- Skousen, J.G.; Sexstone, A.; Ziemkiewicz, P.F. Acid mine drainage control and treatment. Reclam. Drastically Disturb. Lands 2000, 41, 131–168. [Google Scholar]
- Korhonen, J.; Honkasalo, A.; Seppälä, J. Circular Economy: The Concept and its Limitations. Ecol. Econ. 2018, 143, 37–46. [Google Scholar] [CrossRef]
- Geissdoerfer, M.; Savaget, P.; Bocken, N.M.; Hultink, E.J. The Circular Economy—A new sustainability paradigm? J. Clean. Prod. 2017, 143, 757–768. [Google Scholar] [CrossRef] [Green Version]
- Stahel, W.R. The circular economy. Nature 2016, 531, 435–438. [Google Scholar] [CrossRef] [Green Version]
- Nordstrom, D.K.; Bowell, R.J.; Campbell, K.M.; Alpers, C.N. Challenges in Recovering Resources from Acid Mine Drainage. In Mine Water and Circular Economy; LUT Scientific and Expertise Publications: Lappeenranta, Finland, 2017; Volume II, pp. 1138–1146. [Google Scholar]
- Tayebi-Khorami, M.; Edraki, M.; Corder, G.; Golev, A. Re-thinking mining waste through an integrative. Minerals 2019, 9, 286. [Google Scholar] [CrossRef] [Green Version]
- Wei, X.; Viadero, R.C.; Buzby, K.M. Recovery of iron and aluminum from acid mine drainage by selective precipitation. Environ. Eng. Sci. 2005, 22, 745–755. [Google Scholar] [CrossRef]
- Silva, R.d.A.; Secco, M.P.; Lermen, R.T.; Schneider, I.A.H.; Hidalgo, G.E.N.; Sampaio, C.H. Optimizing the selective precipitation of iron to produce yellow pigment from acid mine drainage. Miner. Eng. 2019, 135, 111–117. [Google Scholar] [CrossRef]
- Akinwekomi, V.; Maree, J.P.; Masindi, V.; Zvinowanda, C.; Osman, M.S.; Foteinis, S.; Mpenyana-Monyatsi, L.; Chatzisymeon, E. Beneficiation of acid mine drainage (AMD): A viable option for the synthesis of goethite, hematite, magnetite, and gypsum—Gearing towards a circular economy concept. Miner. Eng. 2020, 148, 106204. [Google Scholar] [CrossRef]
- Ayora, C.; Macías, F.; Torres, E.; Lozano, A.; Carrero, S.; Nieto, J.M.; Pérez-López, R.; Fernández-Martínez, A.; Castillo-Michel, H. Recovery of Rare Earth Elements and Yttrium from Passive-Remediation Systems of Acid Mine Drainage. Environ. Sci. Technol. 2016, 50, 8255–8262. [Google Scholar] [CrossRef]
- Felipe, E.C.; Batista, K.A.; Ladeira, A.C. Recovery of rare earth elements from acid mine drainage by ion exchange. Environ. Technol. 2021, 42, 2721–2732. [Google Scholar] [CrossRef]
- Wei, X.; Zhang, S.; Shimko, J.; Dengler, R.W. Mine drainage: Treatment technologies and rare earth elements. Water Environ. Res. 2019, 91, 1061–1068. [Google Scholar] [CrossRef] [Green Version]
- Royer-Lavallee, A.; Neculita, C.M.; Coudert, L. Removal and potential recovery of rare earth elements from mine water. J. Ind. Eng. Chem. 2020, 89, 47–57. [Google Scholar] [CrossRef]
- Zhang, W.; Honaker, R.Q. Rare earth elements recovery using staged precipitation from a leachate generated from coarse coal refuse. Int. J. Coal Geol. 2018, 195, 189–199. [Google Scholar] [CrossRef]
- Zhang, W.; Honaker, R. Process development for the recovery of rare earth elements and critical metals from an acid mine leachate. Miner. Eng. 2020, 153, 106382. [Google Scholar] [CrossRef]
- Honaker, R.Q.; Zhang, W.; Yang, X.; Rezaee, M. Conception of an integrated flowsheet for rare earth elements recovery from coal coarse refuse. Miner. Eng. 2018, 122, 233–240. [Google Scholar] [CrossRef] [Green Version]
- Zhang, W.; Noble, A.; Yang, X.; Honaker, R. A comprehensive review of rare earth elements recovery from coal-related materials. Minerals 2020, 10, 451. [Google Scholar] [CrossRef]
- Fritz, A.G.; Tarka, T.J.; Mauter, M.S. Technoeconomic Assessment of a Sequential Step-Leaching Process for Rare Earth Element Extraction from Acid Mine Drainage Precipitates. ACS Sustain. Chem. Eng. 2021, 9, 9308–9316. [Google Scholar] [CrossRef]
- Ziemkiewicz, P.; Noble, A.; Vass, C. Systems and Processes for Recovery of High—Grade Rare Earth Concentrate from Acid Mine Drainage. U.S. Patent US 2021/0207241 A1, 8 July 2021. [Google Scholar]
- Moraes, M.L.B.; Murciego, A.; Álvarez-ayuso, E.; Ladeira, A.C.Q. The role of Al13-polymers in the recovery of rare earth elements from acid mine drainage through pH neutralization. Appl. Geochem. 2020, 113, 104466. [Google Scholar] [CrossRef]
- Kasaini, H. Methods for the Production of fine Metal Powders from Metal Compounds. U.S. Patent Application No. 16/427,310, 13 February 2020. [Google Scholar]
- Larochelle, T.; Kasaini, H. Predictive modeling of rare earth element separation by solvent extraction using metsim. In Proceedings of the IMPC 2016—28th International Mineral Processing Congress, Quebec City, QC, Canada, 11–15 September 2016. [Google Scholar]
- Spangler, R.C. Front End Loading (FEL) and Process Engineering Workflow. Ph.D. Thesis, The University of Kansas, Lawrence, KS, USA, 2005. [Google Scholar]
- Batavia, R. Front-End Loading for Life Cycle Success. In Proceedings of the Offshore Technology Conference, Houston, TX, USA, 30 April–3 May 2001. [Google Scholar] [CrossRef]
- Quinn, J.E.; Soldenhoff, K.H.; Stevens, G.W.; Lengkeek, N.A. Solvent extraction of rare earth elements using phosphonic/phosphinic acid mixtures. Hydrometallurgy 2015, 157, 298–305. [Google Scholar] [CrossRef]
- Wang, Y.; Liao, W.; Li, D. A solvent extraction process with mixture of CA12 and Cyanex272 for the preparation of high purity yttrium oxide from rare earth ores. Sep. Purif. Technol. 2011, 82, 197–201. [Google Scholar] [CrossRef]
- Nie, H.; Wang, Y.; Wang, Y.; Zhao, Z.; Dong, Y.; Sun, X. Recovery of scandium from leaching solutions of tungsten residue using solvent extraction with Cyanex 572. Hydrometallurgy 2018, 175, 117–123. [Google Scholar] [CrossRef]
- Couper, J.R. Process Engineering Economics, 1st ed.; CRC Press: New York, NY, USA, 2003; p. 420. [Google Scholar]
- Cravotta, C.A. Dissolved metals and associated constituents in abandoned coal-mine discharges, Pennsylvania, USA. Part 1: Constituent quantities and correlations. Appl. Geochem. 2008, 23, 166–202. [Google Scholar] [CrossRef]
- Lefticariu, L.; Klitzing, K.L.; Kolker, A. Rare Earth Elements and Yttrium (REY) in coal mine drainage from the Illinois Basin, USA. Int. J. Coal Geol. 2020, 217, 103327. [Google Scholar] [CrossRef]
- Egiebor, N.O.; Oni, B. Acid rock drainage formation and treatment: A review. Asia-Pac. J. Chem. Eng. 2007, 2, 47–62. [Google Scholar] [CrossRef]
- Lee, J.C.; Wen, Z. Rare Earths from Mines to Metals: Comparing Environmental Impacts from China’s Main Production Pathways. J. Ind. Ecol. 2017, 21, 1277–1290. [Google Scholar] [CrossRef]
- Liu, Y.; Chen, J.; Li, D. Application and Perspective of Ionic Liquids on Rare Earths Green Separation. Sep. Sci. Technol. 2012, 47, 223–232. [Google Scholar] [CrossRef]
- Goode, J.R. Rare Earth Elements. In SME Mineral Processing and Extractive Metallurgy Handbook; Dunne, R.C., Kawatra, S.K., Young, C.A., Eds.; Society for Mining, Metallurgy and Exploration: Englewood, CO, USA, 2019; pp. 2049–2075, Chapter 12.32. [Google Scholar]


| EHEHPA | CA-12 | CA-12,C272 | C-572 | |
|---|---|---|---|---|
| Source | [51] | [52] | [52] | [53] |
| Reference Element | La | Y | Y | La |
| La | 1 | * | * | 1 |
| Ce | 6.8 | * | * | 5.9 |
| Pr | 13.9 | * | * | 9.5 |
| Nd | 21.5 | * | * | 14.6 |
| Sm | 227.8 | * | * | 101 |
| Eu | 341.7 | * | * | 189 |
| Gd | 1982 | 3.73 | 1.97 | 252 |
| Tb | >2000 | 3.09 | 1.86 | 612 |
| Dy | >2000 | 2.44 | 1.75 | 1014 |
| Ho | >2000 | 1.73 | 1.41 | 1308 |
| Er | >2000 | 1.67 | 1.65 | 2013 |
| Tm | >2000 | 1.36 | 2.51 | 3961 |
| Yb | >2000 | 1.25 | 5.09 | 5611 |
| Lu | >2000 | 1.06 | 6.55 | 9583 |
| Y | >2000 | 0.15 | 0.05 | 1713 |
| Sc | >2000 | 8.00 | 8.00 | 38,334 |
| Direct Cost | Typical Range | Selected Factor |
|---|---|---|
| Instrumentation and Controls | 10%–20% | 10% |
| Piping | 20%–70% | 15% |
| Electrical | 10% | 10% |
| Building and Structure | 20%–30% | 20% |
| Property Improvements | 10% | 10% |
| Utilities | 20%–50% | 20% |
| Product | 2020 Price | 2021 Price | Min Price | Max Price |
|---|---|---|---|---|
| MREO | $26.65 | $39.05 | $16.13 | $47.46 |
| M-HREO | $73.22 | $117.47 | $46.93 | $143.12 |
| Nd(Pr) micro powder | $69.65 | $129.11 | $51.60 | $129.11 |
| Y Metal micro powder | $39.77 | $40.13 | $24.72 | $40.13 |
| Mischmetal micro powder | $20.45 | $4.89 | $3.27 | $20.45 |
| Cobalt micro powder | $41.67 | $58.60 | $23.77 | $58.60 |
| Sm micro powder | $18.40 | $15.01 | $13.25 | $15.01 |
| Crude EuSO4 | $7.50 | $7.87 | $7.45 | $7.87 |
| Gd metal micro powder | $56.81 | $72.31 | $24.21 | $72.31 |
| Tb metal micro powder | $738.58 | $1867.41 | $511.19 | $1867.41 |
| Dy metal micro powder | $340.88 | $579.23 | $251.59 | $579.23 |
| Ho metal micro powder | $695.03 | $768.62 | $315.14 | $768.62 |
| Er metal micro powder | $107.95 | $116.66 | $39.24 | $116.66 |
| Tm metal micro powder | $857.29 | $925.77 | $379.57 | $925.77 |
| Yb metal micro powder | $228.28 | $229.18 | $93.96 | $229.18 |
| Lu metal micro powder | $3298.76 | $3451.32 | $1415.04 | $3451.32 |
| Sc metal micro powder | $3976.99 | $3314.83 | $1359.08 | $3314.83 |
| Manganese oxide | $1.97 | $1.97 | $1.58 | $3.20 |
| Element | Composition |
|---|---|
| Al | 5.03% |
| Si | 19.03% |
| S | 3.93% |
| Ca | 4.92% |
| Sc | 0.002% |
| Mn | 13.32% |
| Fe | 8.62 × 10% |
| Co | 0.390% |
| Y | 0.219% |
| La | 0.077% |
| Ce | 0.220% |
| Pr | 0.030% |
| Nd | 0.148% |
| Sm | 0.038% |
| Eu | 0.010% |
| Gd | 0.053% |
| Tb | 0.008% |
| Dy | 0.046% |
| Ho | 0.009% |
| Er | 0.022% |
| Tm | 0.0028% |
| Yb | 0.016% |
| Lu | 0.002% |
| 2020 Price | 2021 Price | Min Price | Max Price | |
|---|---|---|---|---|
| Pre-Concentrate Contained Value | $1242 | $1575 | $751 | $1786 |
| Plant Configuration | Capital Cost | Operating Cost |
|---|---|---|
| MM USD | MM USD/Year | |
| Complete Facility | $185.81 | $21.35 |
| REE, w/no Mischmetal | $130.79 | $17.54 |
| REE, Co, w/no Mischmetal | $148.60 | $18.50 |
| REE, Co, Mn, w/no Mischmetal | $154.83 | $20.47 |
| Magnet REE, Y, Sc, Co, Mn | $142.20 | $20.47 |
| Plant Configuration | REE | Co | Mn |
|---|---|---|---|
| mtpy | mtpy | mtpy | |
| Complete Facility | 444 | 157 | 5653 |
| REE, w/no Mischmetal | 290 | - | - |
| REE, Co, w/no Mischmetal | 290 | 157 | - |
| REE, Co, Mn, w/no Mischmetal | 290 | 157 | 5653 |
| Magnet REE, Y, Sc, Co, Mn | 212 | 157 | 5653 |
| Plant Configuration | September | December | Minimum | Maximum |
|---|---|---|---|---|
| (in MM USD) | 2021 | 2020 | 2014–2021 | 2014–2021 |
| Complete Facility | $70.46 | $56.07 | $33.39 | $79.83 |
| REE, w/no Mischmetal | $49.42 | $35.26 | $20.25 | $49.42 |
| REE, Co, w/no Mischmetal | $58.59 | $41.78 | $23.97 | $58.59 |
| REE, Co, Mn, w/no Mischmetal | $69.70 | $52.92 | $32.89 | $76.68 |
| Magnet REE, Y, Sc, Co, Mn | $56.58 | $40.77 | $27.58 | $63.55 |
Publisher’s Note: MDPI stays neutral with regard to jurisdictional claims in published maps and institutional affiliations. |
© 2021 by the authors. Licensee MDPI, Basel, Switzerland. This article is an open access article distributed under the terms and conditions of the Creative Commons Attribution (CC BY) license (https://creativecommons.org/licenses/by/4.0/).
Share and Cite
Larochelle, T.; Noble, A.; Ziemkiewicz, P.; Hoffman, D.; Constant, J. A Fundamental Economic Assessment of Recovering Rare Earth Elements and Critical Minerals from Acid Mine Drainage Using a Network Sourcing Strategy. Minerals 2021, 11, 1298. https://doi.org/10.3390/min11111298
Larochelle T, Noble A, Ziemkiewicz P, Hoffman D, Constant J. A Fundamental Economic Assessment of Recovering Rare Earth Elements and Critical Minerals from Acid Mine Drainage Using a Network Sourcing Strategy. Minerals. 2021; 11(11):1298. https://doi.org/10.3390/min11111298
Chicago/Turabian StyleLarochelle, Tommee, Aaron Noble, Paul Ziemkiewicz, David Hoffman, and James Constant. 2021. "A Fundamental Economic Assessment of Recovering Rare Earth Elements and Critical Minerals from Acid Mine Drainage Using a Network Sourcing Strategy" Minerals 11, no. 11: 1298. https://doi.org/10.3390/min11111298