Progressive Damage of a Canadian Granite in Laboratory Compression Tests and Underground Excavations

Canadian Nuclear Safety Commission (CNSC), Ottawa, ON K1P 5S9, Canada
Minerals 2021, 11(1), 10; https://doi.org/10.3390/min11010010
Submission received: 18 November 2020
/
Revised: 16 December 2020
/
Accepted: 18 December 2020
/
Published: 24 December 2020
(This article belongs to the Special Issue The Hydro-Mechanics of Crystalline Rocks)
Abstract
:The crystalline rock formations of the Canadian Shield are currently one candidate rock type for the geological disposal of radioactive waste in Canada. This article starts with a critical review of past research results on the geomechanical behaviour of Lac du Bonnet granite, a rock type found at an Underground Research Laboratory (URL) in Pinawa, Manitoba, Canada. Based on the published data, a constitutive model was developed, based on Mohr-Coulomb plasticity, which includes the concept of asynchronous degradation of cohesion and mobilization of friction with progressive damage, as well as time-dependent degradation of strength. The constitutive model was used to simulate laboratory compression tests. It was then implemented in a coupled hydro-mechanical model to simulate the response of the rock mass induced by excavation of a test tunnel at 420 m depth at the URL.
1. Introduction
In Canada and many other countries, geological disposal is being considered for the long-term management of high-level radioactive waste e.g., [1,2,3]. Geological disposal consists of emplacing the waste in a deep geological repository (DGR) at depths of hundreds of metres in a suitable rock formation. The objective of a DGR is to contain and isolate [4] the wastes for periods up to one million years in order to protect the near-surface environment. Although many variants of the concept of geological disposal exist, the common feature among them is the use of a multibarrier system with multiple safety functions, which should be sufficiently robust to resist human-induced and natural perturbations that can occur within that long time frame. The multibarrier system consists of engineered components, mainly the waste container and the sealing system in and around galleries, shafts and waste emplacement rooms. The ultimate barrier is the host rock formation, whose main functions are to limit the movement of radionuclides, if and when the engineered barriers are breached, and to physically isolate the wastes from the surface environment.
In Canada as of 2020, the Nuclear Waste Management Organization (NWMO) is performing site characterization at two sites [5] in order to ultimately select one final site for the disposal of Canada’s used nuclear fuel from nuclear power plants. One site is located in the Paleozoic sedimentary rock formations of the Michigan Basin, in Southern Ontario. The other site is located in crystalline rock of the Canadian Shield, in Northern Ontario. The geological characteristics and thermal-hydro-mechanical-chemical (THMC) behaviour of both types of rock should be characterized and understood to help inform the NWMO’s decision to proceed with geological disposal in either type of rock. The potential host rock in Paleozoic rock, the Cobourg limestone, has been the focus of many studies e.g., [6,7]. The study of crystalline rock in the area under current consideration in Northern Ontario has started only recently. However, up to 2002, Atomic Energy of Canada Limited (AECL) operated an Underground Research Laboratory (URL) in Pinawa, Manitoba, Canada, in a similar crystalline rock formation of the Canadian Shield, called Lac du Bonnet (LdB) granite [8]. The geomechanical behaviour of LdB granite from the URL was the subject of intensive study as reported in [9] and summarized in [10], with surface-laboratory testing [11,12], excavation damage experiments [13,14] and permeability measurements [10] being performed. Based on extensive rock mass characterization, it was found at the URL site that at depths of more than 300 m, large blocks of intact rocks with a limited number of visible fractures could be found [8,14]. A potential DGR located in crystalline rock of the Canadian Shield would be at a minimal depth of 500 m and waste emplacement rooms would preferentially be located in massive rock domains at a distance from the main fracture zones. These massive rock domains would contain fractures at certain frequencies and distributions. In order to understand the behaviour of the whole rock mass, it is necessary to start with the intact rock. Intact rock in general has high strength and low permeability and would be a robust barrier against potential radionuclide migration from the wastes. However, excavation of the rooms, galleries and shafts disturbs the existing mechanical, hydrological and chemical regimes in the host rock. Near the excavated openings, damaged zones with decreased strength and increased permeability might form [13,14] and become preferential pathways for radionuclide migration from the wastes. The excavation damaged zones (EDZ) can further develop with additional loads resulting from processes that are expected during the time frame of the DGR. For example, the heat generated from the waste can induce a substantial increase in pore pressure that not only perturbs the hydraulic regime in the rock mass, but also creates a potential for hydrofracturing [15]. Earthquakes or future glaciation can trigger shear displacement of joints that exist near waste emplacement rooms and affect the structural integrity of waste containers. Joints are also preferential pathways for radionuclide migration; therefore, their hydro-mechanical behavior needs to be investigated [16]. In North America, a new glacial cycle is expected to occur in the next 60,000–100,000 years [17]. At the glacial maximum, the ice cap can impose loads of up to 30–40 MPa on the surface and substantially perturb the thermal-hydrological-mechanical-chemical regime in the host rock of a DGR [18]. It is therefore important for proponents of geological disposal concepts to be able to characterize and evaluate the response of the rock mass due to the above perturbations. This in turn will allow either the assessment of the implications of the damage zone on the safety of the facility or the design of sealing systems to minimize its impact if necessary.
The Canadian Nuclear Safety Commission (CNSC) is the regulatory authority of nuclear activities in Canada. When a final site is selected, the NWMO will be required to apply to the CNSC for a licence at each stage of the DGR development, which would include site preparation, construction, operation and decommissioning. The CNSC must make its licensing decisions on the safety of the proposed DGR based on objective and independent scientific evidence. In order to keep abreast of scientific developments, the CNSC has been conducting independent regulatory research, focusing on key safety aspects of the deep geological disposal of radioactive waste [19]. The present paper shows one example of the CNSC regulatory research, where the formation, extent and hydro-mechanical characteristics of the EDZ in intact granitic rock at the AECL’s URL are critically reviewed and interpreted with mathematical models. Data from laboratory compression tests were first reviewed in order to develop a mechanical constitutive model for the rock. The above constitutive model was then used to simulate the EDZ and the hydro-mechanical response of the rock mass around a test tunnel at the URL.
2. A Review of the Mechanical Behaviour of LdB Granite from Laboratory Uniaxial and Triaxial Tests
2.1. Crack Initiation, Propagation and Coalescence
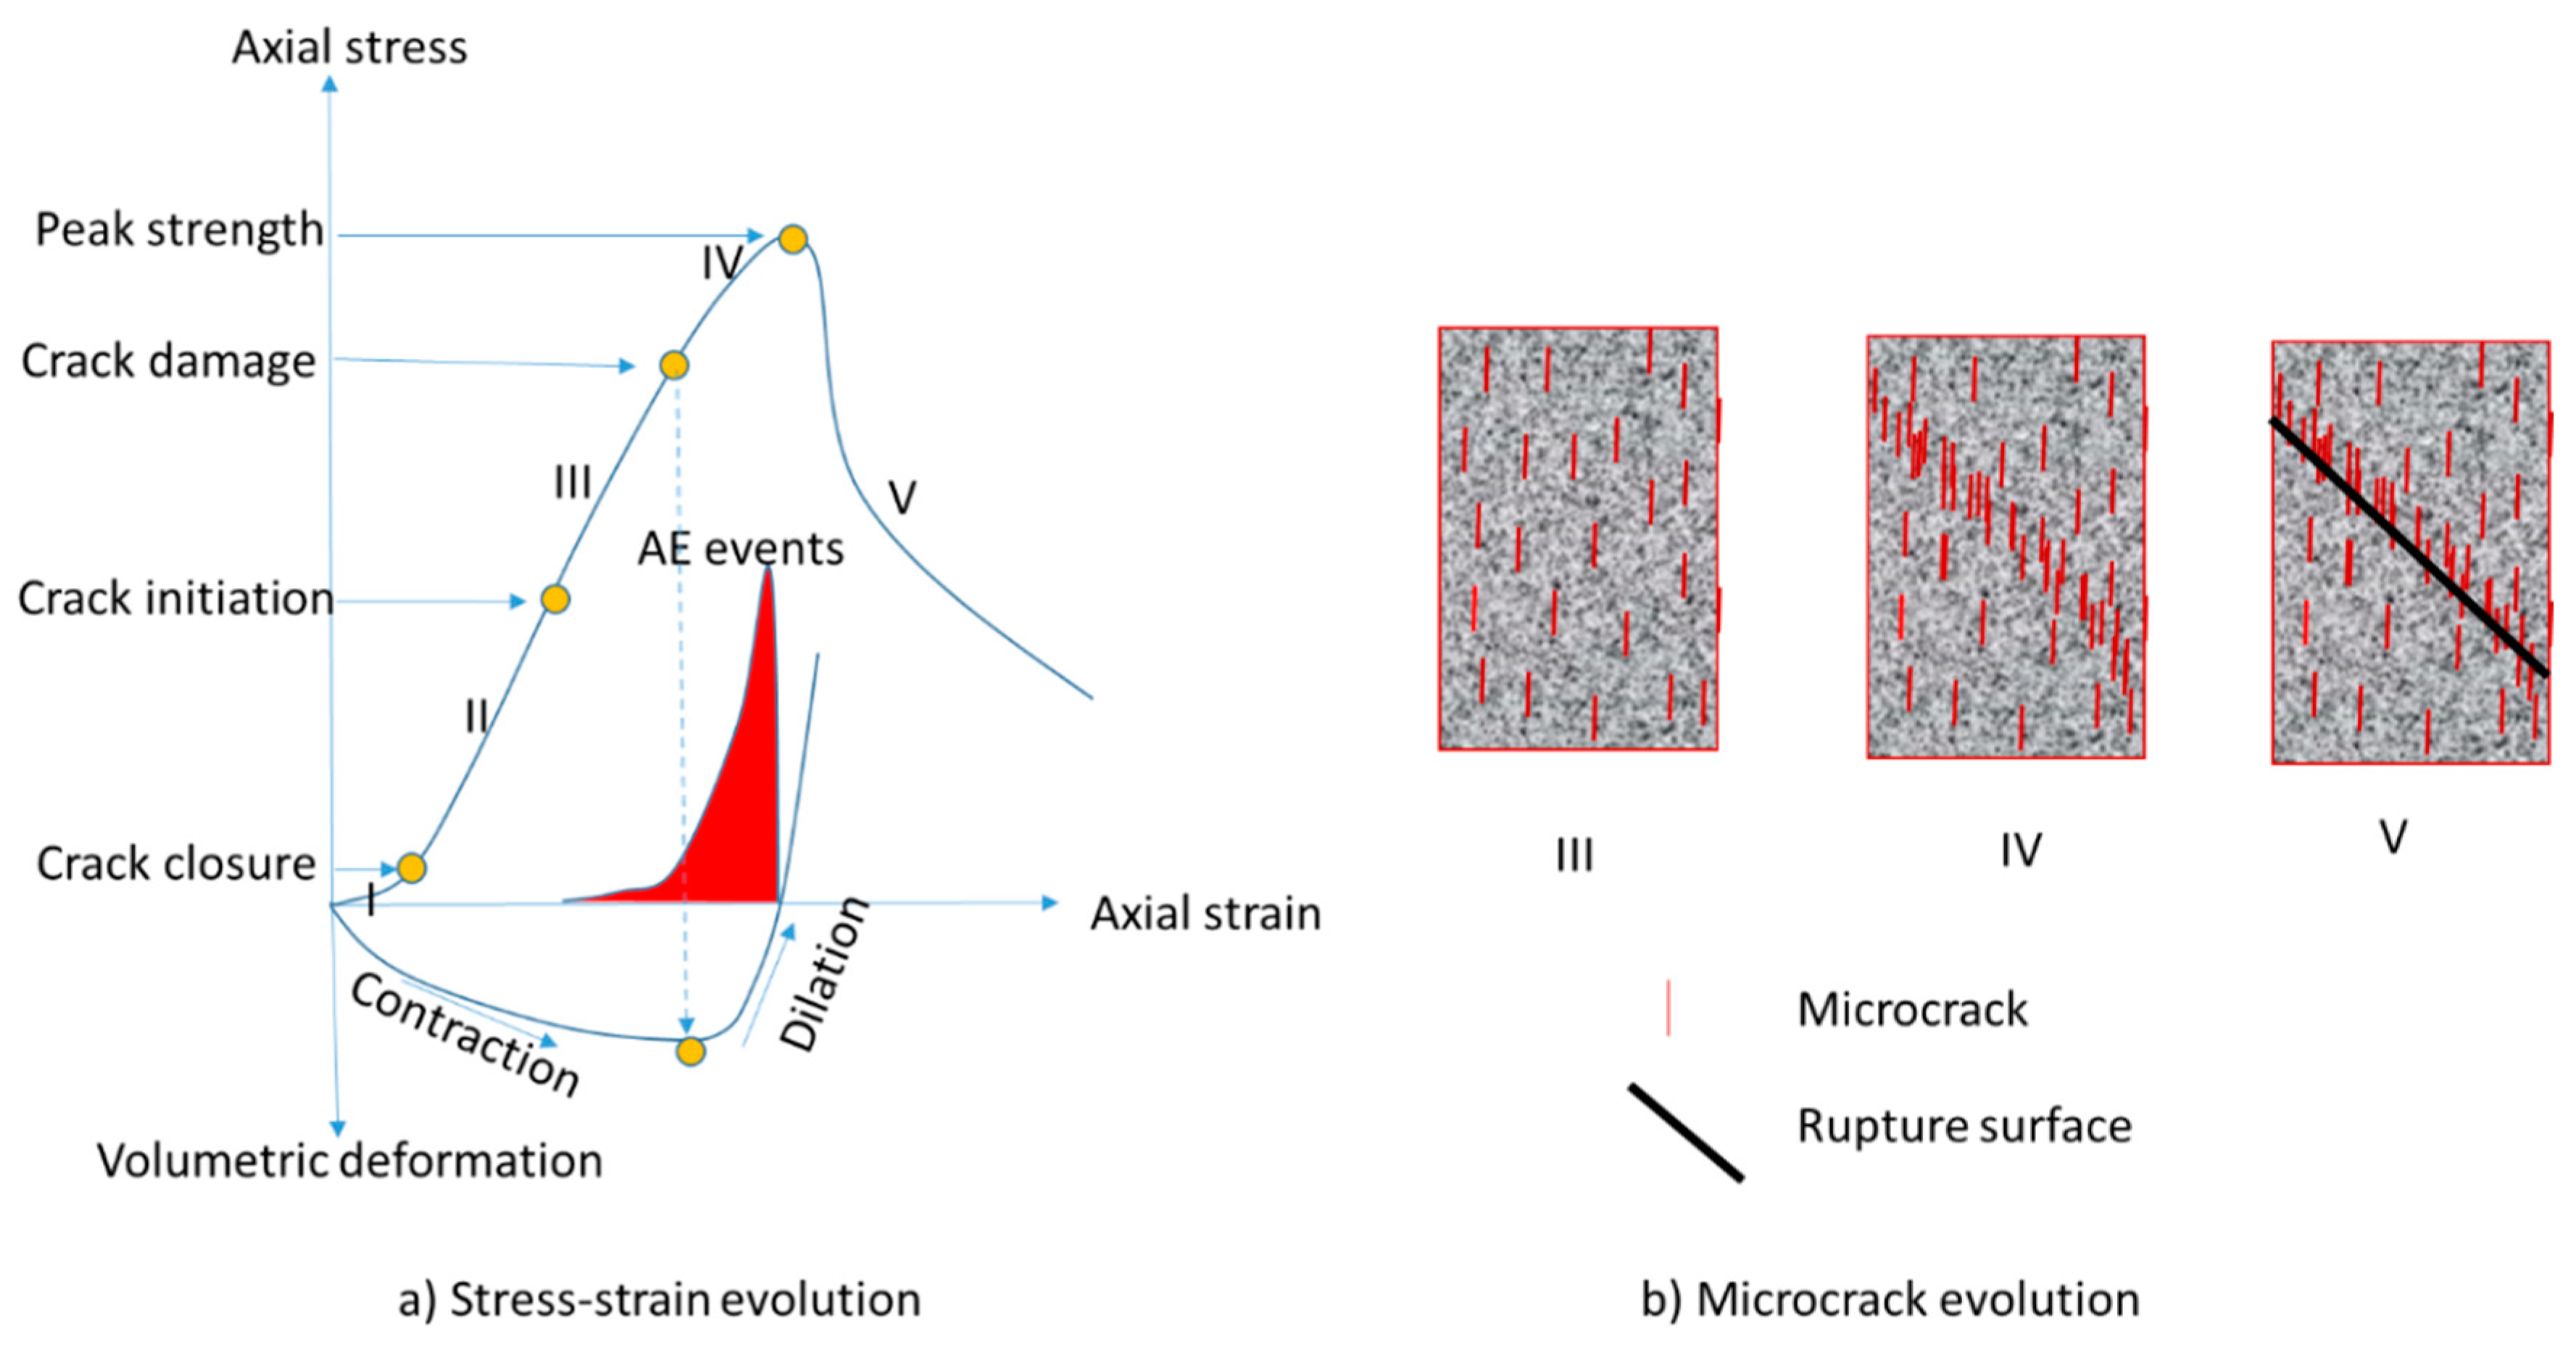
In a crystalline rock sample that appears intact to the naked eye, microscopic cracks and flaws exist. Quantitative microscopy and image analysis [20] of an intact LdB granite sample taken at the 420 m level of the URL shows that the median grain size is of the order of 0.54 mm, and the crack length is of the order of hundreds of microns. Cracks exist mainly at the boundaries of the grains, and more rarely through grains (intragranular cracks) or across several grains (transgranular cracks) [20]. Under increasing external loads, the existing microcracks propagate, new microcracks are formed, and eventually microcracks coalesce leading to strain localization and brittle failure of the sample. The change in the structure of a rock sample due to the formation, propagation and coalescence of microcracks is usually referred to as damage. Macroscopically, damage results in a degradation of the elastic modulus, a progressive decrease in strength and an increase in permeability. The deformation and strength characteristics of brittle rocks have been extensively studied by many researchers since the 1960s e.g., [21,22,23,24,25,26,27,28,29,30,31,32,33]. A literature review on the topic has also been recently conducted by Hoek and Martin [31]. These studies built on the early work of Griffith [32] to come to a general consensus that damage in brittle rock is initiated at the tips of microcracks and defects in the rock microstructure, such as in the ones at the grain boundaries. During a triaxial or uniaxial compression test, the stress-strain response of a brittle rock specimen such as LdB granite typically shows five stages e.g., [27,28,31], as illustrated in Figure 1: (I) crack closure, (II) linear elastic deformation, (III) crack initiation and stable crack growth, (IV) unstable crack growth, and (V) failure and post-peak behaviour. In stage I, the applied stress results in a closure of pre-existing cracks in the sample. This is followed in stage II by quasilinear elastic behaviour. The onset of microcracking starts at the beginning of stage III. In stage III, crack growth is stable, meaning that crack propagation would stop if the load were removed. The microcracks in stage III are mostly oriented in the direction of the major principal stress (Figure 1b). In stage IV, unstable crack growth would start. This stage is marked by the onset of dilatancy. As shown in Figure 1a, the volumetric strain curve starts to show negative slopes at the onset of stage IV, indicating dilatant incremental volumetric strain. In addition to cracks parallel to the direction of the applied load, transgranular inclined cracks are formed. In the post-peak stage (V), macrocracks develop and eventually lead to a sudden failure of the rock specimen. Martin [27] determined that the onset of stage III starts at approximately 40% of the peak axial stress; he called that the crack initiation stress. The onset of stage IV starts at what was called the crack damage stress, at approximately 70–80% of the peak stress. Eberhardt et al. [29] monitored Acoustic Emissions (AE) and found that although AE activity occurs continuously throughout compression tests, significant activity in terms of event count, duration and ring event counts only starts at the crack initiation stress level, then drastically increases at the crack damage level (Figure 1a).
2.2. Strength Criteria and Damage
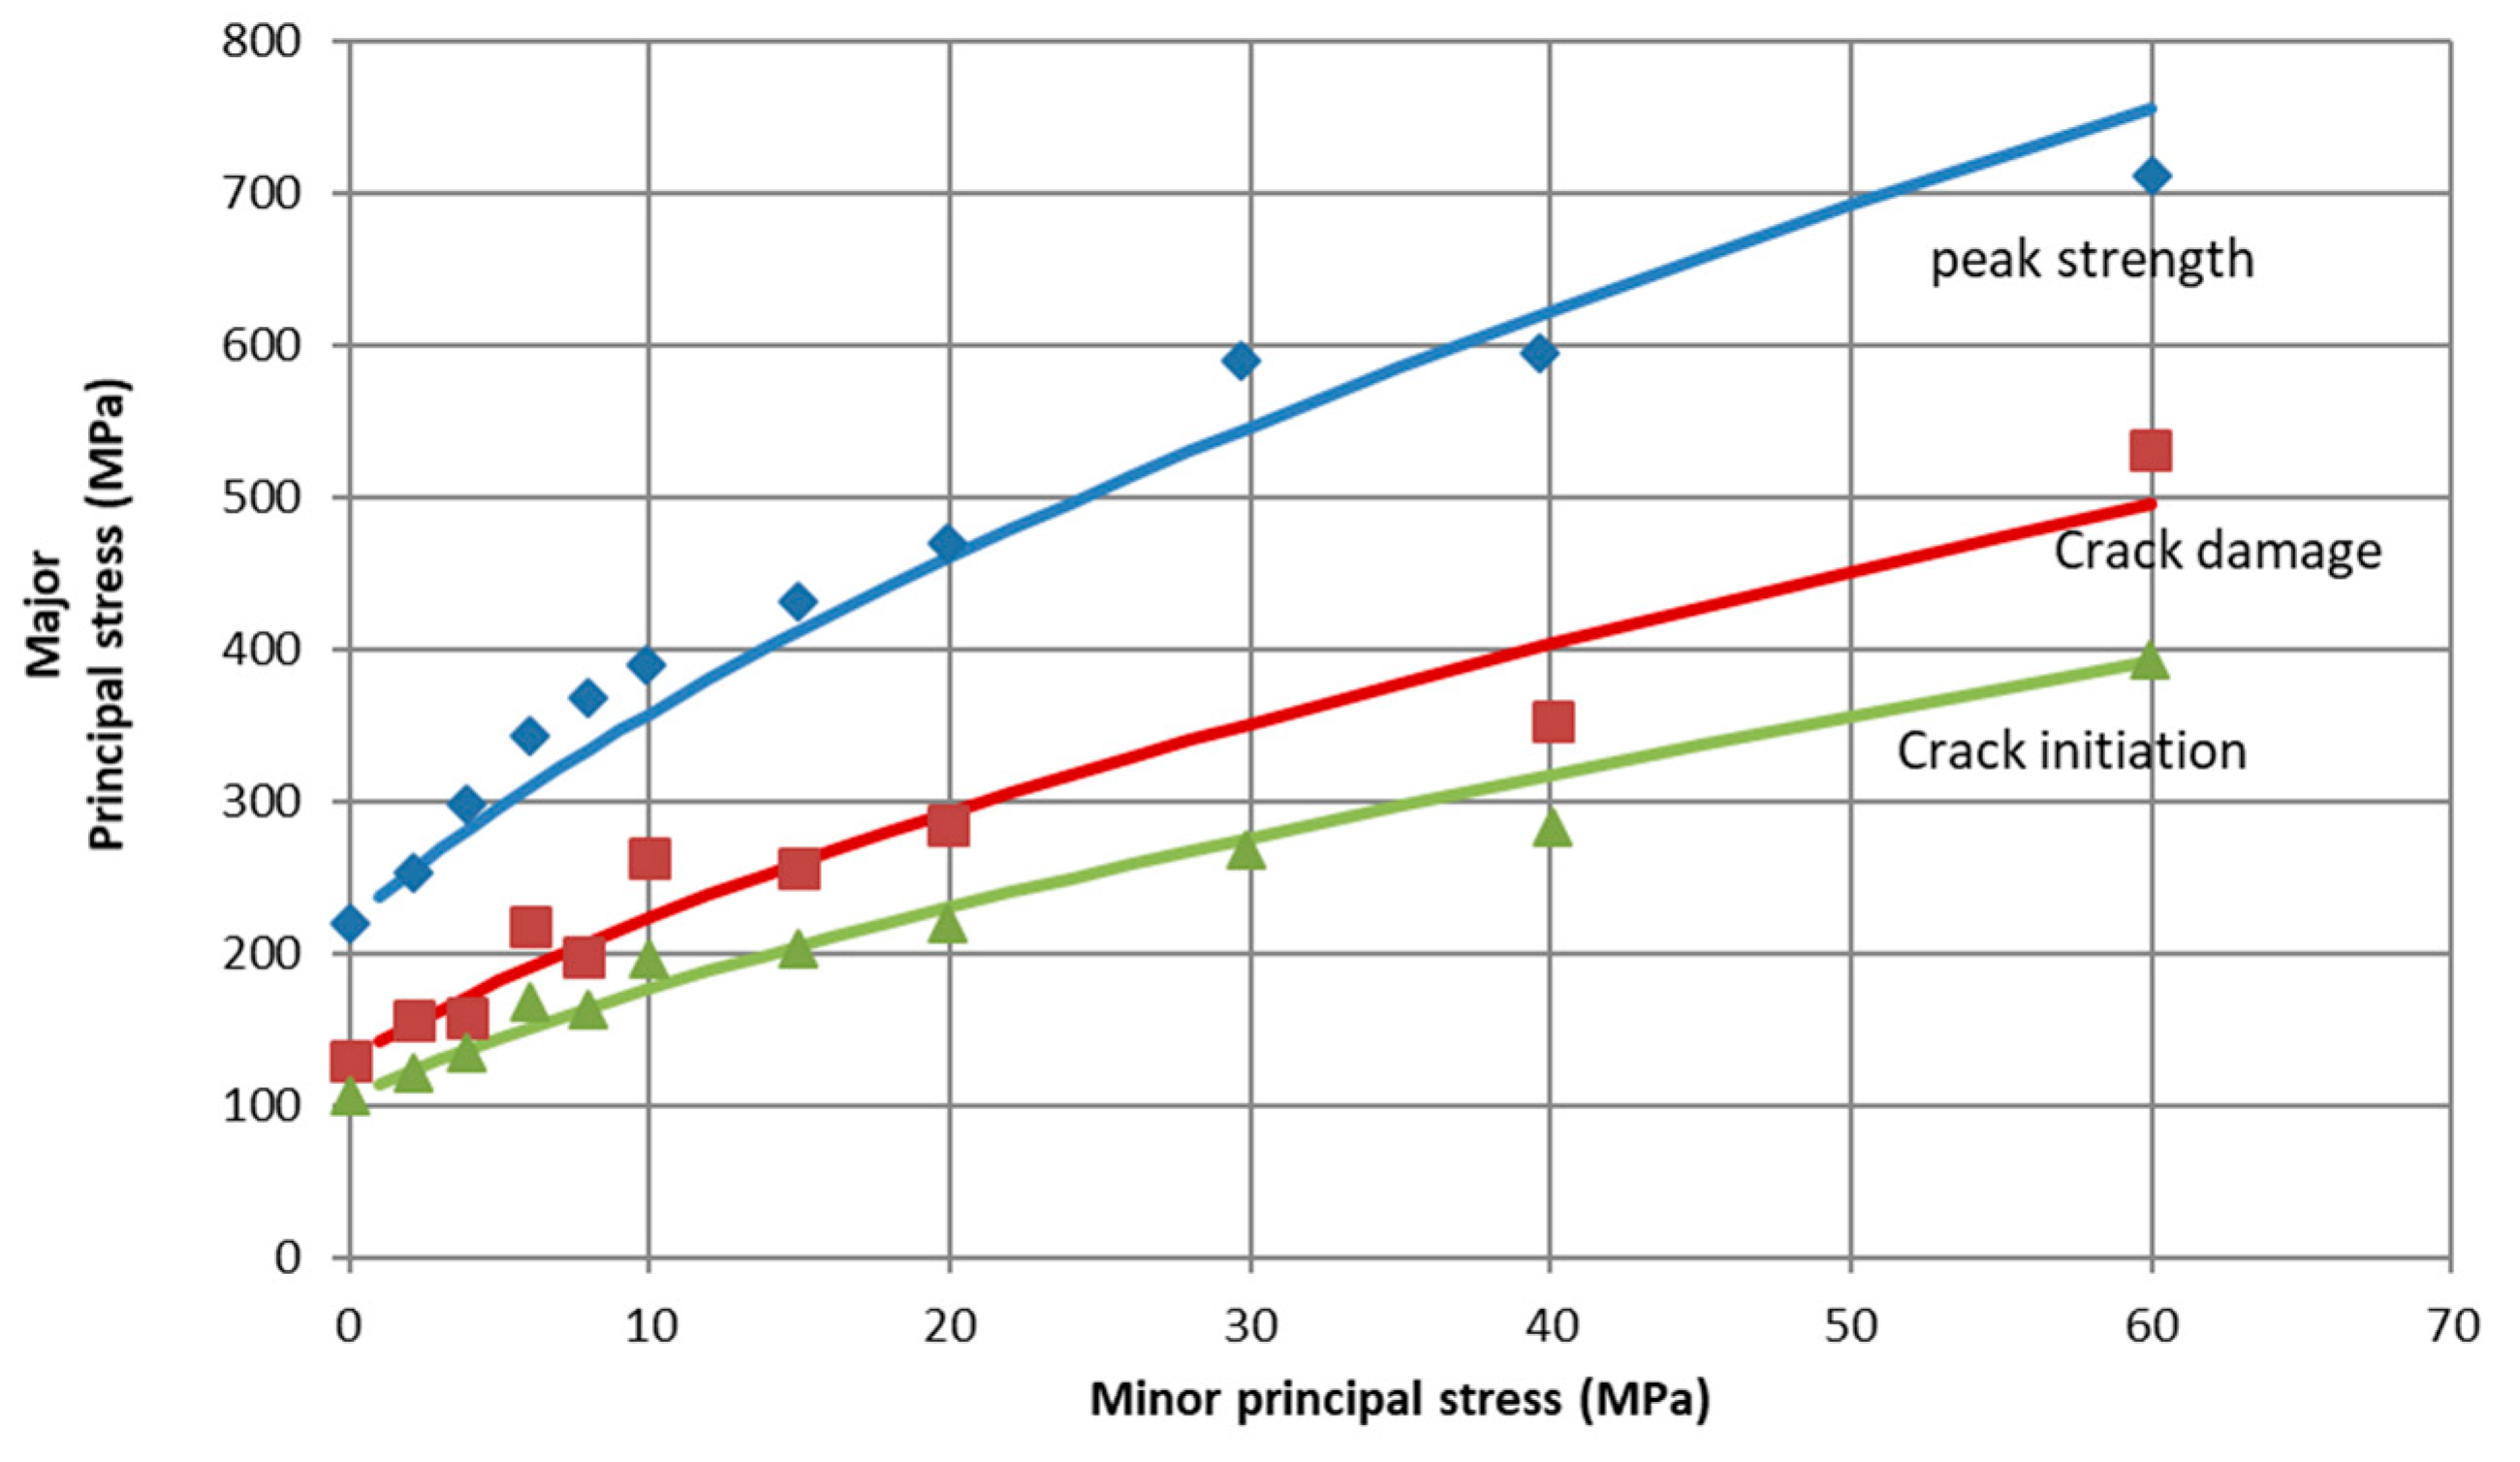
Experimental data from laboratory uniaxial and triaxial compression tests on LdB granite [11,12] were used by Martin [27], Martin and Chandler [28] in order to provide envelopes for the crack initiation stress (onset of stage II), the crack damage stress (onset of stage III), and the peak strength (Figure 2, as reported in Hoek and Martin [31]). These stress levels are given as functions of the minor principal stress, thereby neglecting the influence of the intermediate principal stress.
Excavation of rooms and galleries in a DGR will change the stress state in the surrounding rock. Near the face of the excavation, the minor principal stress will decrease to zero at the face, and the stress state, which originally shows a stable configuration, will move to the left towards one of the strength envelopes shown in Figure 2. The important issue to be addressed in the design and safety assessment of a DGR relates to the choice of strength criterion to be used—the crack initiation, the crack damage or the peak strength—in order to ensure stable excavations and also to minimize the extent of excavation damage. It is well accepted that the peak strength is not the true strength of the rock e.g., [27,28,31]. The peak strength attained in laboratory uniaxial and triaxial tests is a combination of sample scale, test machine stiffness and mainly loading rate. The peak strength can only be attained at a standard loading rate of 0. 75 MPa/s. At a loading rate 1000 times slower, the sample fails at the crack damage level [28]. During a compression test, the energy provided to the test sample by the loading machine is converted into elastic strain energy in the sample (and also in the loading machine, since it is not infinitely stiff), energy dissipated in the sample for crack initiation and propagation, and also kinetic energy. Therefore, at a higher loading rate, stress higher than the true strength of the sample could be applied, and the excess energy is converted into kinetic energy, as evidenced by the increased AE events as shown in Figure 1a. This kinetic energy could be released in an explosive manner at failure of the sample. Based on these observations, it was believed that the crack damage level is the true strength of the rock [27,28]. Furthermore, while the peak strength is scale-dependent and decreases with increasing sample size, the crack damage and crack initiation levels are shown to be independent of scale for the LdB granite [28].
The time-dependent behaviour of the LdB granite was investigated by Schmidtke and Lajtai [34] by performing creep tests on 140 specimens with a constant axial load at 65–95% of the mean compressive strength. All samples subjected to stress levels higher than 70% (corresponding to the crack damage level) would fail within one day. Samples subjected to stress levels between the crack initiation and crack damage levels would take a longer time to fail. The longest duration for these creep tests was approximately 42 days, for an axial load of approximately 60% of the peak strength. The latest sample did not fail during that period of time. A time frame of hundreds of thousands to one million years is associated with a DGR. Extrapolation of short-term creep tests to a DGR time frame, in order to estimate the limiting value to which the rock strength will decrease, needs to be justified with a combination of multiple arguments. From the previous discussion, it could be concluded with confidence that the true short-term strength of LdB granite is the crack damage stress. This strength can degrade as a function of time. However, due to the relatively short durations of the creep tests reported in [34], there were no definite conclusions on whether that degradation would stabilize to a threshold level and at what time. A more recent study (Damjanac and Fairhurst [35]) based on interpretation of the results of short-term creep tests, numerical analysis of the effect of decrease in fracture toughness due to stress corrosion on strength, evidence from plate tectonics and observations of in situ rock stress in granite quarries concluded that the threshold strength of crystalline rocks would be at 40% of the peak strength.
2.3. Cohesion Loss and Friction Mobilization
As cracks develop, grow and coalesce with increased loading, permanent changes in mechanical and hydraulic properties occur in the rock sample [11,12]. Using data from cyclic compression tests on LdB granite, Lau and Chandler [12] plotted the Young’s modulus, the peak strength, the crack damage and crack initiation stress as a function of permanent shear strain accumulated after each reversal cycle (Figure 3). The most important degradation of the Young’s modulus occurs after the peak stress, due to strain localization. Its degradation before the peak stress is much less pronounced. Figure 3 shows that the degradation of the crack damage and crack initiation stresses is significant even before the peak stress is reached. As previously discussed, the degradation of strength and stiffness is due to the initiation and propagation of microcracks and flaws. Using energy considerations, Cook [22] proposed a strength criterion which depends on the size of these cracks and their surface energy as well as the friction coefficient across the crack faces. The Cook criterion can be written in the same form as the Mohr-Coulomb criterion and the empirical cohesion; c is shown to depend on the size of the cracks or flaws and the surface energy, while the friction angle φ is directly related to the friction coefficient [27,28]. Using the above concept, evolution laws for cohesion degradation and friction mobilization were proposed [12,27,28,36] where the accumulated irrecoverable strain is used as a damage indicator. These evolution laws are based on the assumptions that cohesion loss is related to crack initiation and propagation, and friction is gradually mobilized along these cracks after they are initiated and propagated. Therefore, cohesion and friction are not mobilized at the same time to contribute to the overall strength of the rock. Cohesion and friction laws were derived from the experimentally derived evolution of the peak strength, the crack damage and crack initiation stresses shown in Figure 3. The cohesion and friction laws vary among different researchers [12,27,28,36] depending on the assumed relationships between the above parameters, and the peak strength, crack damage and crack initiation stresses. Evolution laws for cohesion and friction will be proposed and justified in the next section.
3. Constitutive Model for the Mechanical Behaviour of LdB
Currently, there are two approaches for the mathematical modelling of the mechanical behaviour of crystalline rocks. In the discrete approach, the Distinct Element technique is used to generate deformable polygonal grain-like structures to simulate the fabric of the rock (e.g., Lan et al. [22]; Patel and Martin [37]). The individual elements are assumed to be elastic or rigid, and their contacts are elastoplastic. The actual grain structure measured through microscopy could be imported to the numerical model. However, the number of elements could be very large, even for simulating laboratory compression tests, with typical height of 100 mm and diameter of 50 mm, while the grain size is of the order of a few mm. The number of discrete elements required for large-scale field tests, with characteristic dimensions of tens of metres, becomes enormous. The approach that is adopted in this work is the continuum approach, where the hydro-mechanical response of the rock sample or rock mass to external solicitations is governed by considerations of mass and momentum conservations, together with assumed constitutive relationships on the material hydro-mechanical behaviour. In this study, a constitutive elastoplastic model for the mechanical behaviour of LdB is proposed. The model is based on experimental data from laboratory uniaxial and triaxial tests previously reviewed and on the concept of cohesion degradation and friction mobilization. The main assumptions of the model are as follows:
- Plastic strain (irrecoverable strain) is due to crack initiation and propagation. The effective plastic strain, as defined in Equation (5), is assumed to be a damage indicator.
- The Drucker-Prager yield criterion is used to define the onset of plastic deformation. The cohesion and friction angle associated with the yield criterion are not constant but are also function of the effective plastic strain. Furthermore, they are not mobilized simultaneously.
- The ultimate strength of the rock corresponds to the crack damage level. This strength will degrade as a function of time to a threshold level, as suggested by Damjanac and Fairhurst [35].
- Strain localization in the post-failure stage is not considered in this study.
The elastoplastic constitutive model the rock material is a functional relationship between stress and strain of the form:
where σ is the increment of the effective stress tensor, dε is the increment of total strain tensor, and dεp is the increment of the plastic strain tensor.
Plastic strain occurs when the yield criterion is reached. The Drucker-Prager yield criterion matching the Mohr-Coulomb criterion at the compressive meridians is adopted and can be written in the following form:
where I1 is the first invariant of the stress tensor; J2 is the second invariant of the deviatoric stress tensor; c is the cohesion; and φ is the friction angle.
A nonassociative flow rule is used, with the plastic potential taking the same form as the yield criterion where the friction angle is replaced by the dilation angle ψ:
The increment of plastic strain is given by
where λ is the consistency parameter.
The effective plastic strain can be defined as:
It is assumed that the effective plastic strain can be used as a measure of damage. The degradation of the Young’s modulus with increasing plastic strain seems to be limited up to the crack damage level, as indicated in Figure 3. Therefore, the Young’s modulus was assumed to remain constant at a value of 48 GPa. The cohesion and friction angle, however, are significantly affected by the accumulated damage.
Evolution Laws for Cohesion and Friction
In order to derive the evolution of cohesion and friction with increasing damage, the experimental data from uniaxial compression of LdB granite were used. These data for the evolution of the crack damage and crack initiation stresses with the effective plastic strain are illustrated in Figure 3. The Mohr-Coulomb criterion for uniaxial compression is:
where σα is the axial stress.
Damage starts at the crack initiation stress, σci, at which point friction is not yet mobilized. Therefore, the initial cohesion c0 could be obtained from Equation (9) by substituting the crack initiation stress into the axial stress and assuming friction to be zero at this point. This gives:
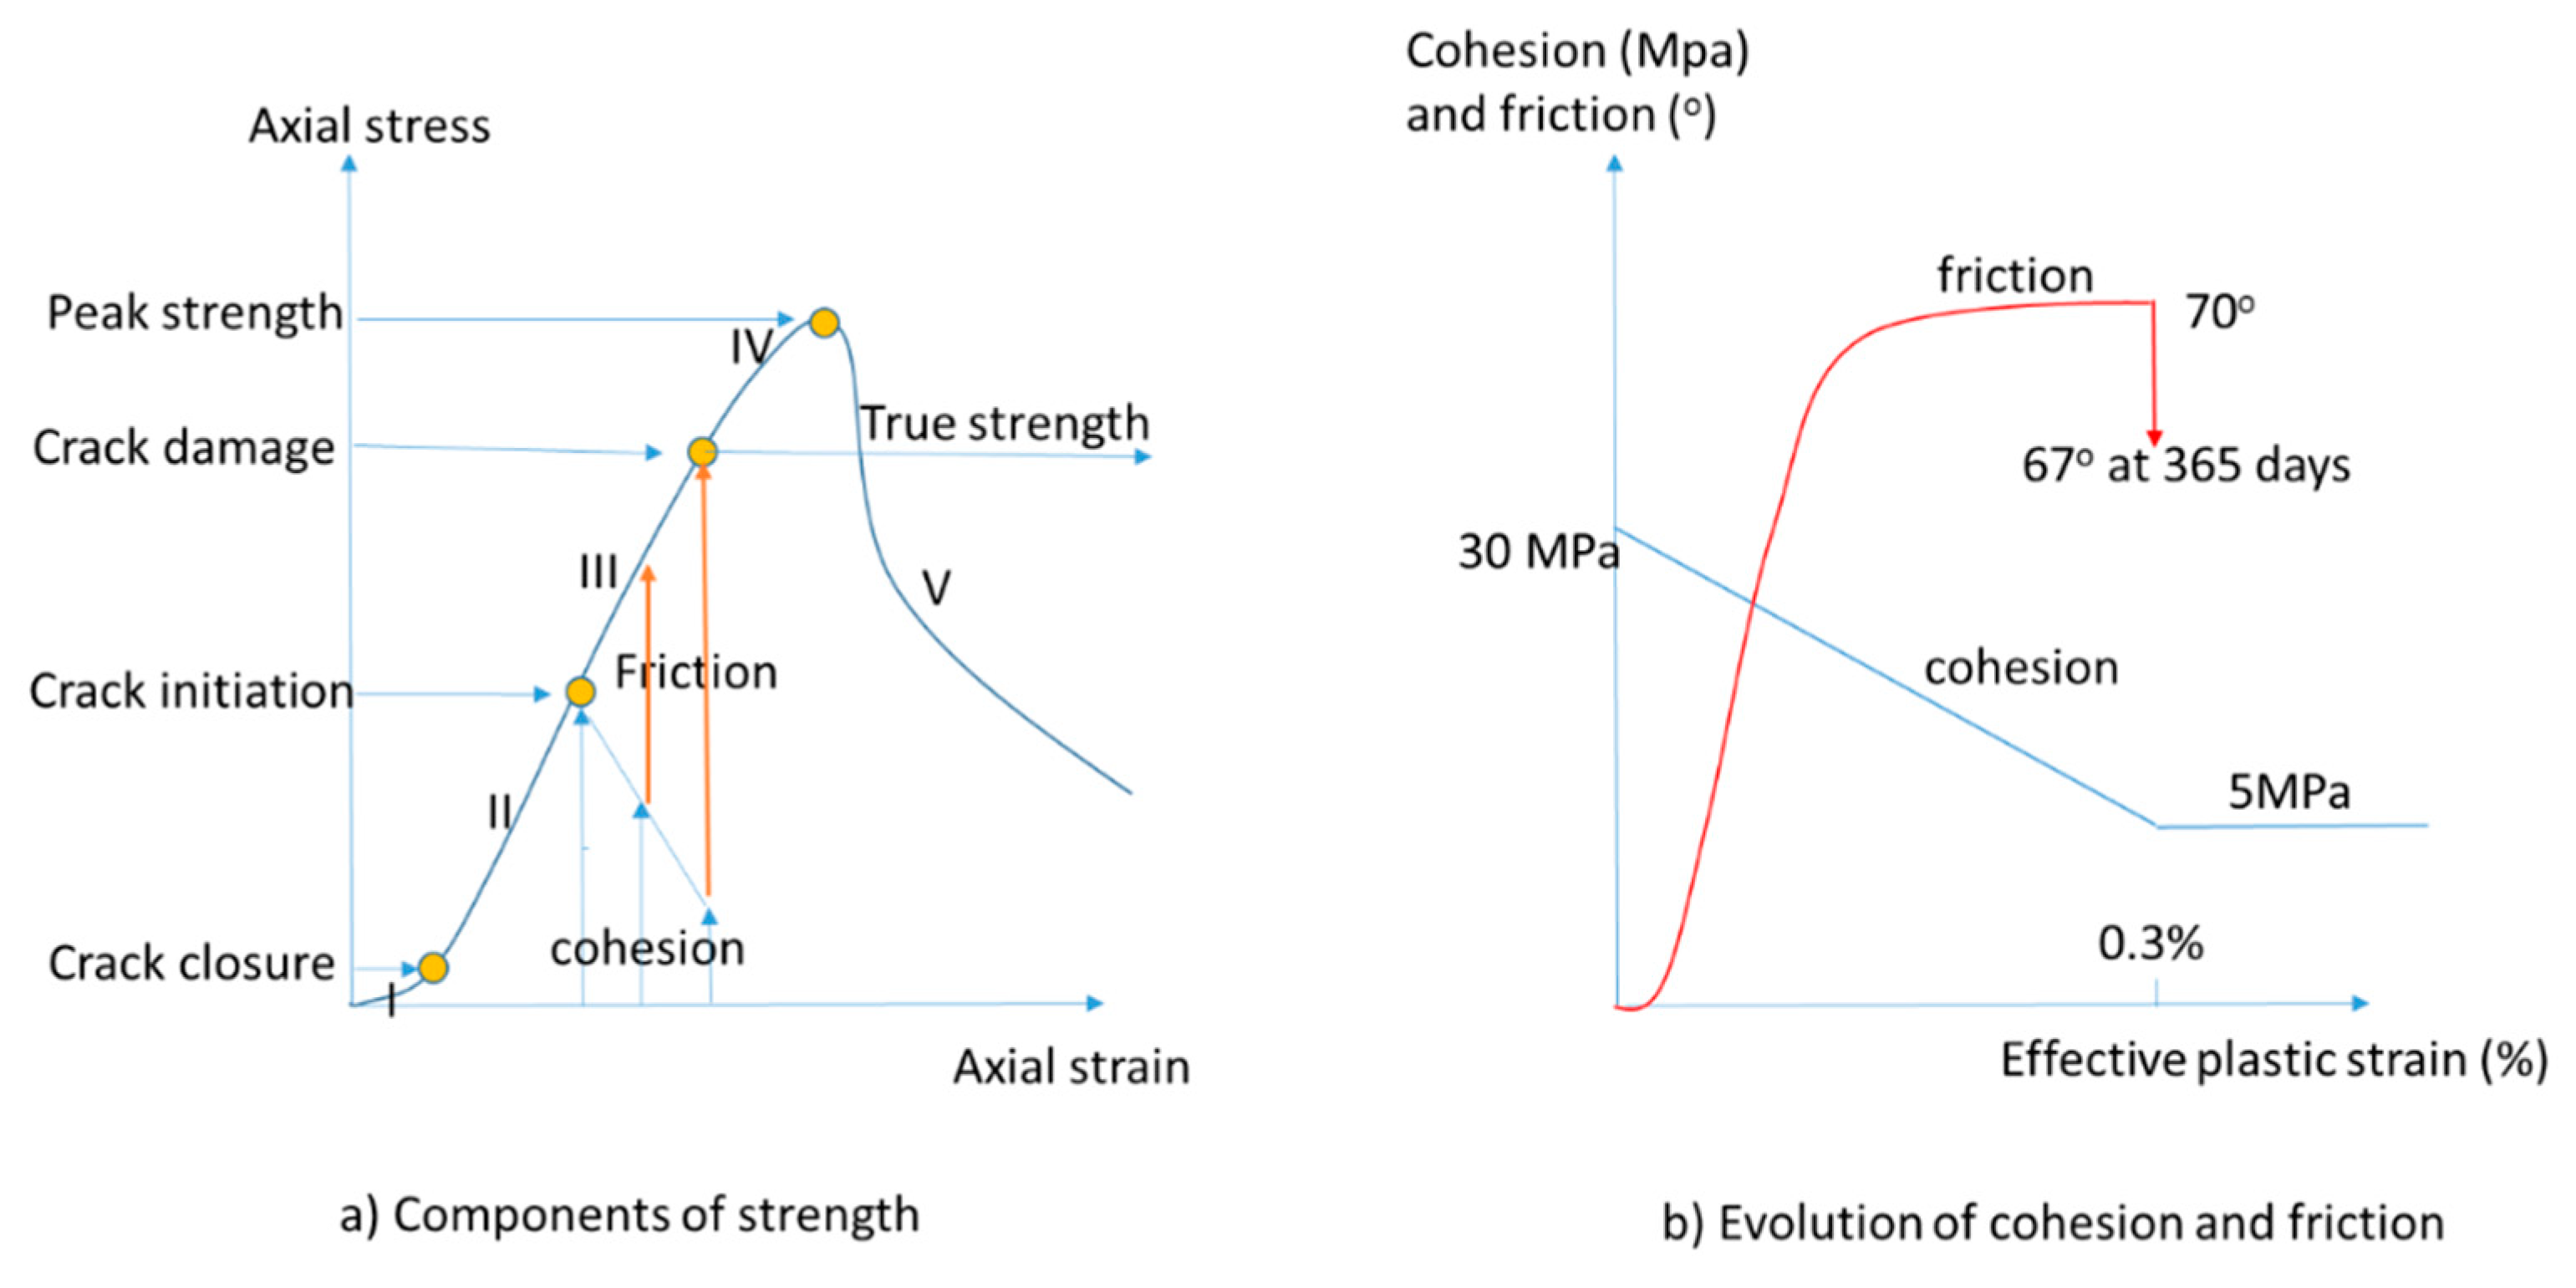
Using Equation (7) and the evolution with the effective plastic strain of σci as shown in Figure 3, the evolution of cohesion is shown in Figure 4, from which a residual value cr of cohesion could be inferred. From the data shown in Figure 3, the maximum crack initiation level is approximately 60 MPa, from which a maximum cohesion is estimated at 30 MPa. The residual cohesion is estimated at 5 MPa.
When the axial stress increases to the crack damage stress, σcd, cohesion decreases, while friction is mobilized. Assuming that cohesion decreases to the residual value cr when the stress increases from the crack initiation level to the crack damage level, the friction angle that is mobilized at the crack damage level would be:
The initial crack damage level is approximately at 125 MPa as indicated on Figure 3. Therefore, the maximum value of mobilized friction is estimated at 72°. The strength degrades with time [34]. Following [35], the asymptotic value under uniaxial compression is assumed to be at 40% of the peak strength, which corresponds approximately to 64 MPa. Assuming that cohesion is reduced to the residual level of 5 Mpa, the friction angle would ultimately reduce to 67°. The time to reach this value is assumed to be 365 days, and for simplicity, a linear relationship is assumed for the time variation of the friction angle.
The evolution of the cohesion and friction angle estimated according to the above method is shown in Figure 4b and is used in the modelling of the triaxial tests and the in-situ excavation tests to be discussed next.
4. Simulation of Laboratory Compression Tests
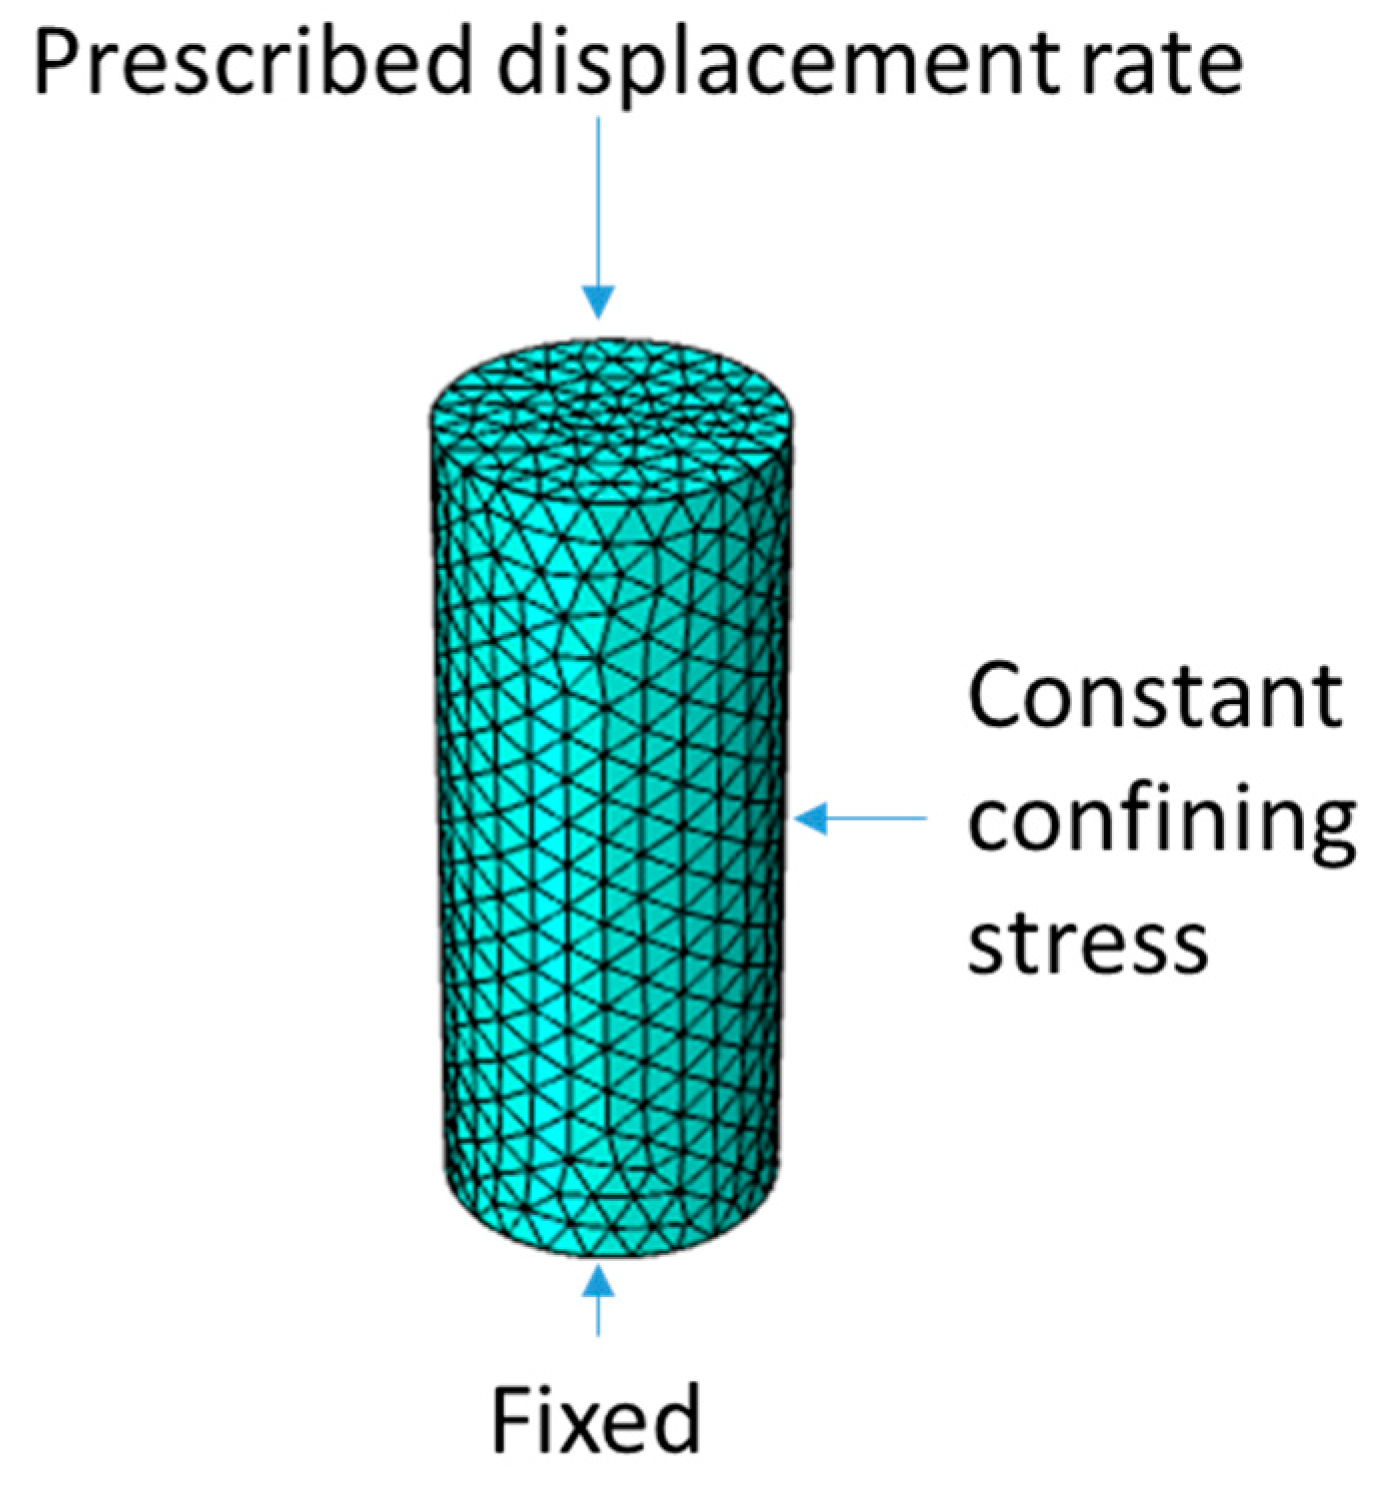
The above constitutive model was implemented in a commercial finite element (FE) software, COMSOL Multiphysics, to simulate laboratory compression tests reported in [11,12,27,28]. The tests were simulated as boundary problems by solving the equation of quasi-static equilibrium. The FE representation is shown in Figure 5, along with the boundary conditions. As described in [12], the test sample has a diameter of 61 mm and a height of 152 mm.
The material properties used in the simulation are summarized in Table 1.
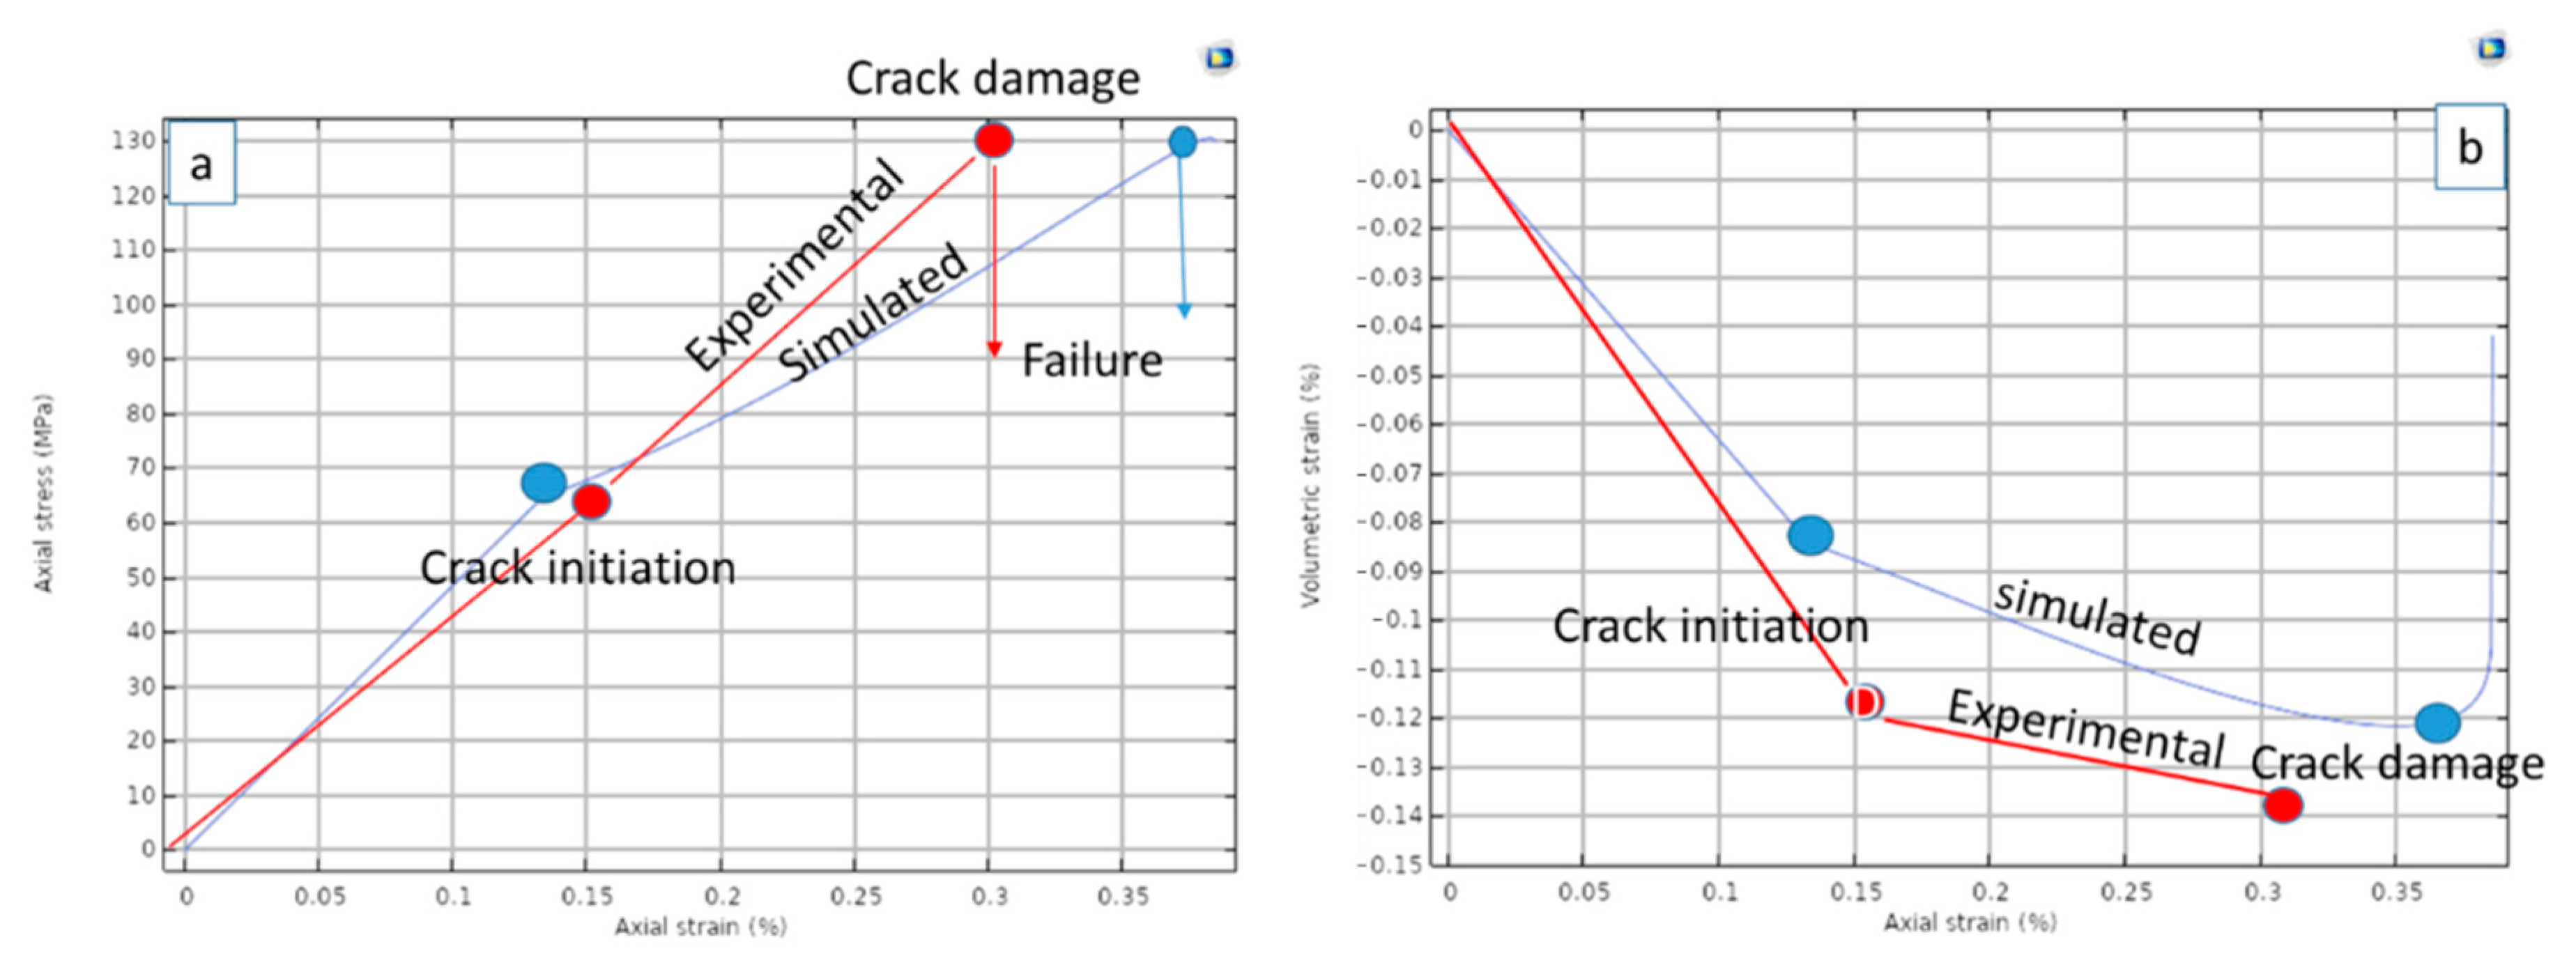
The simulation results for the uniaxial tests are compared to the experimental results in Figure 6. The agreement is good in absolute values and trends. The model does not take into account the crack closure stage. This resulted in an underestimation of the volume contraction and a crack initiation stage that occurs earlier as compared to the experimental results. The crack initiation stress estimated at approximately 65 MPa is close to the experimental value at around 62 MPa, and the crack damage stress estimated at 130 MPa is at the same value as the experimental result. In particular, the model is successful in predicting the reversal of the volumetric strain at the crack damage level, going from contraction to dilation.
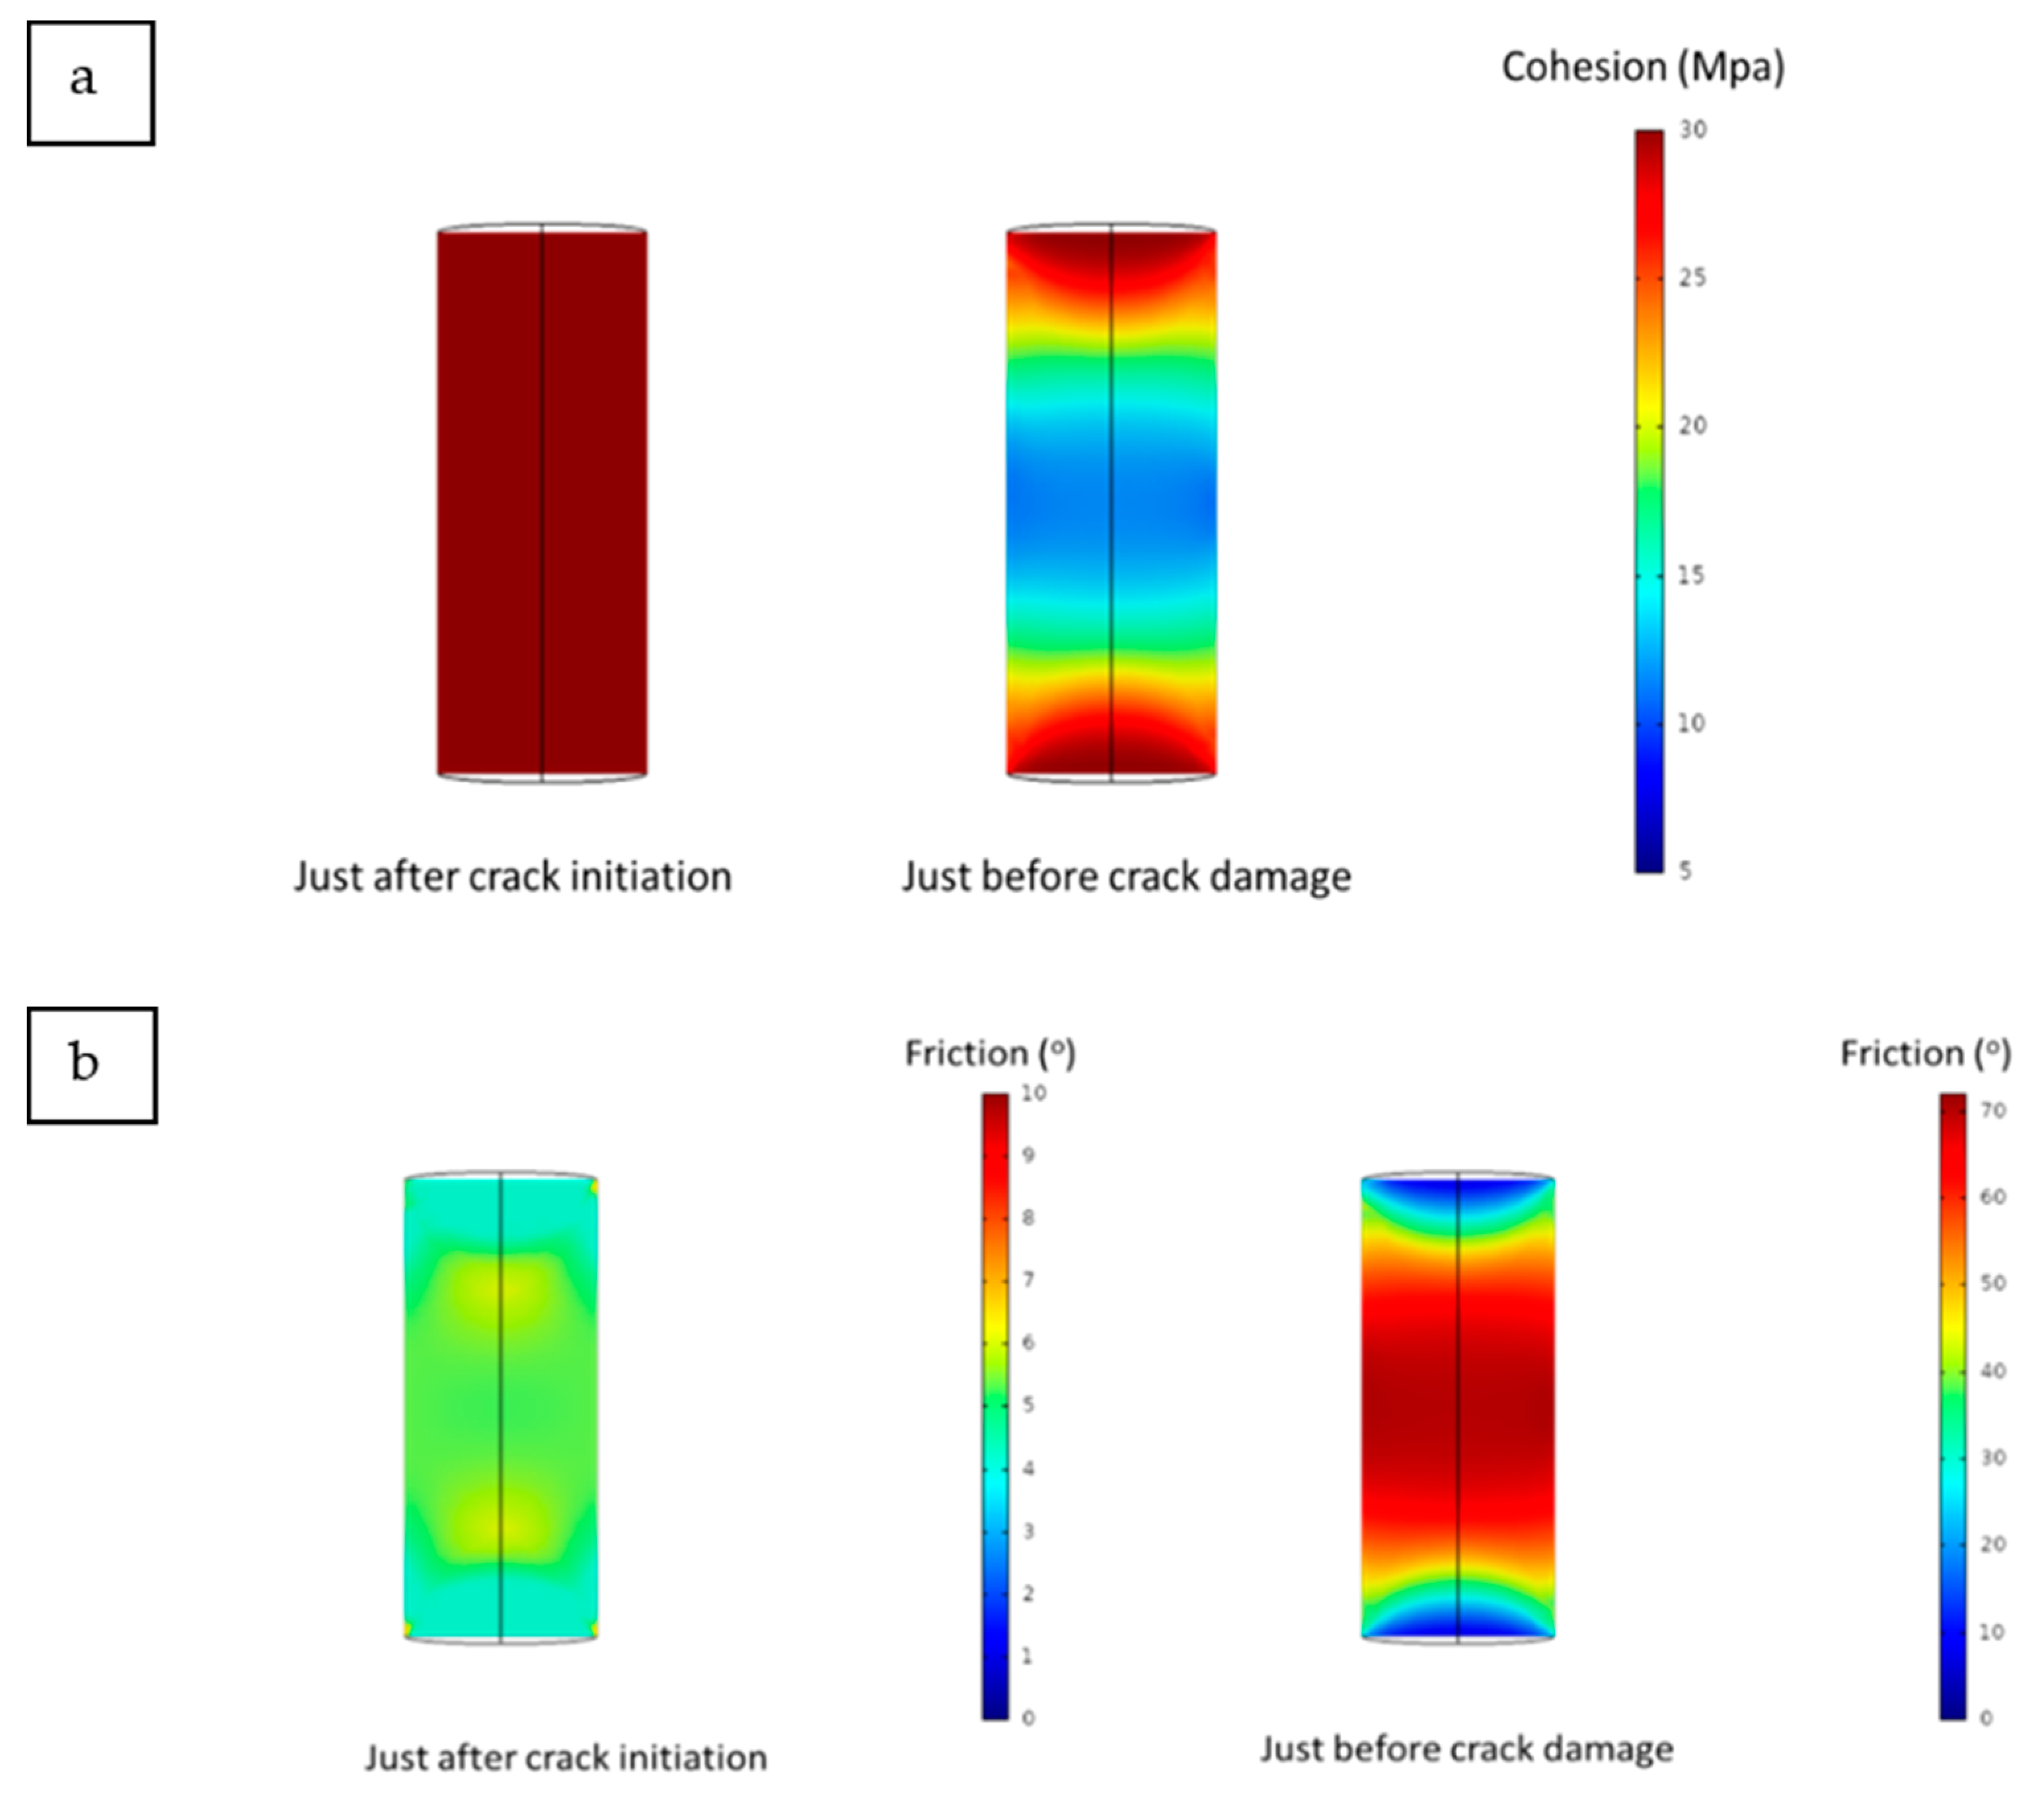
It is interesting to look at the simulated evolution of cohesion and friction in the sample at different stress levels. Figure 7 shows the simulated evolution of cohesion and friction with increased loading. When the axial stress is slightly above the crack initiation level, cohesion locally decreases in the interior of the sample, while friction starts to mobilize at the same locations. Near the crack damage level, cohesion decreases throughout the whole sample with a corresponding mobilization of friction to the maximum value. It is noted that the simulated damage is diffuse, and the current model could not predict strain localization. Strain localization is the subject of ongoing research and is outside the scope of this study.
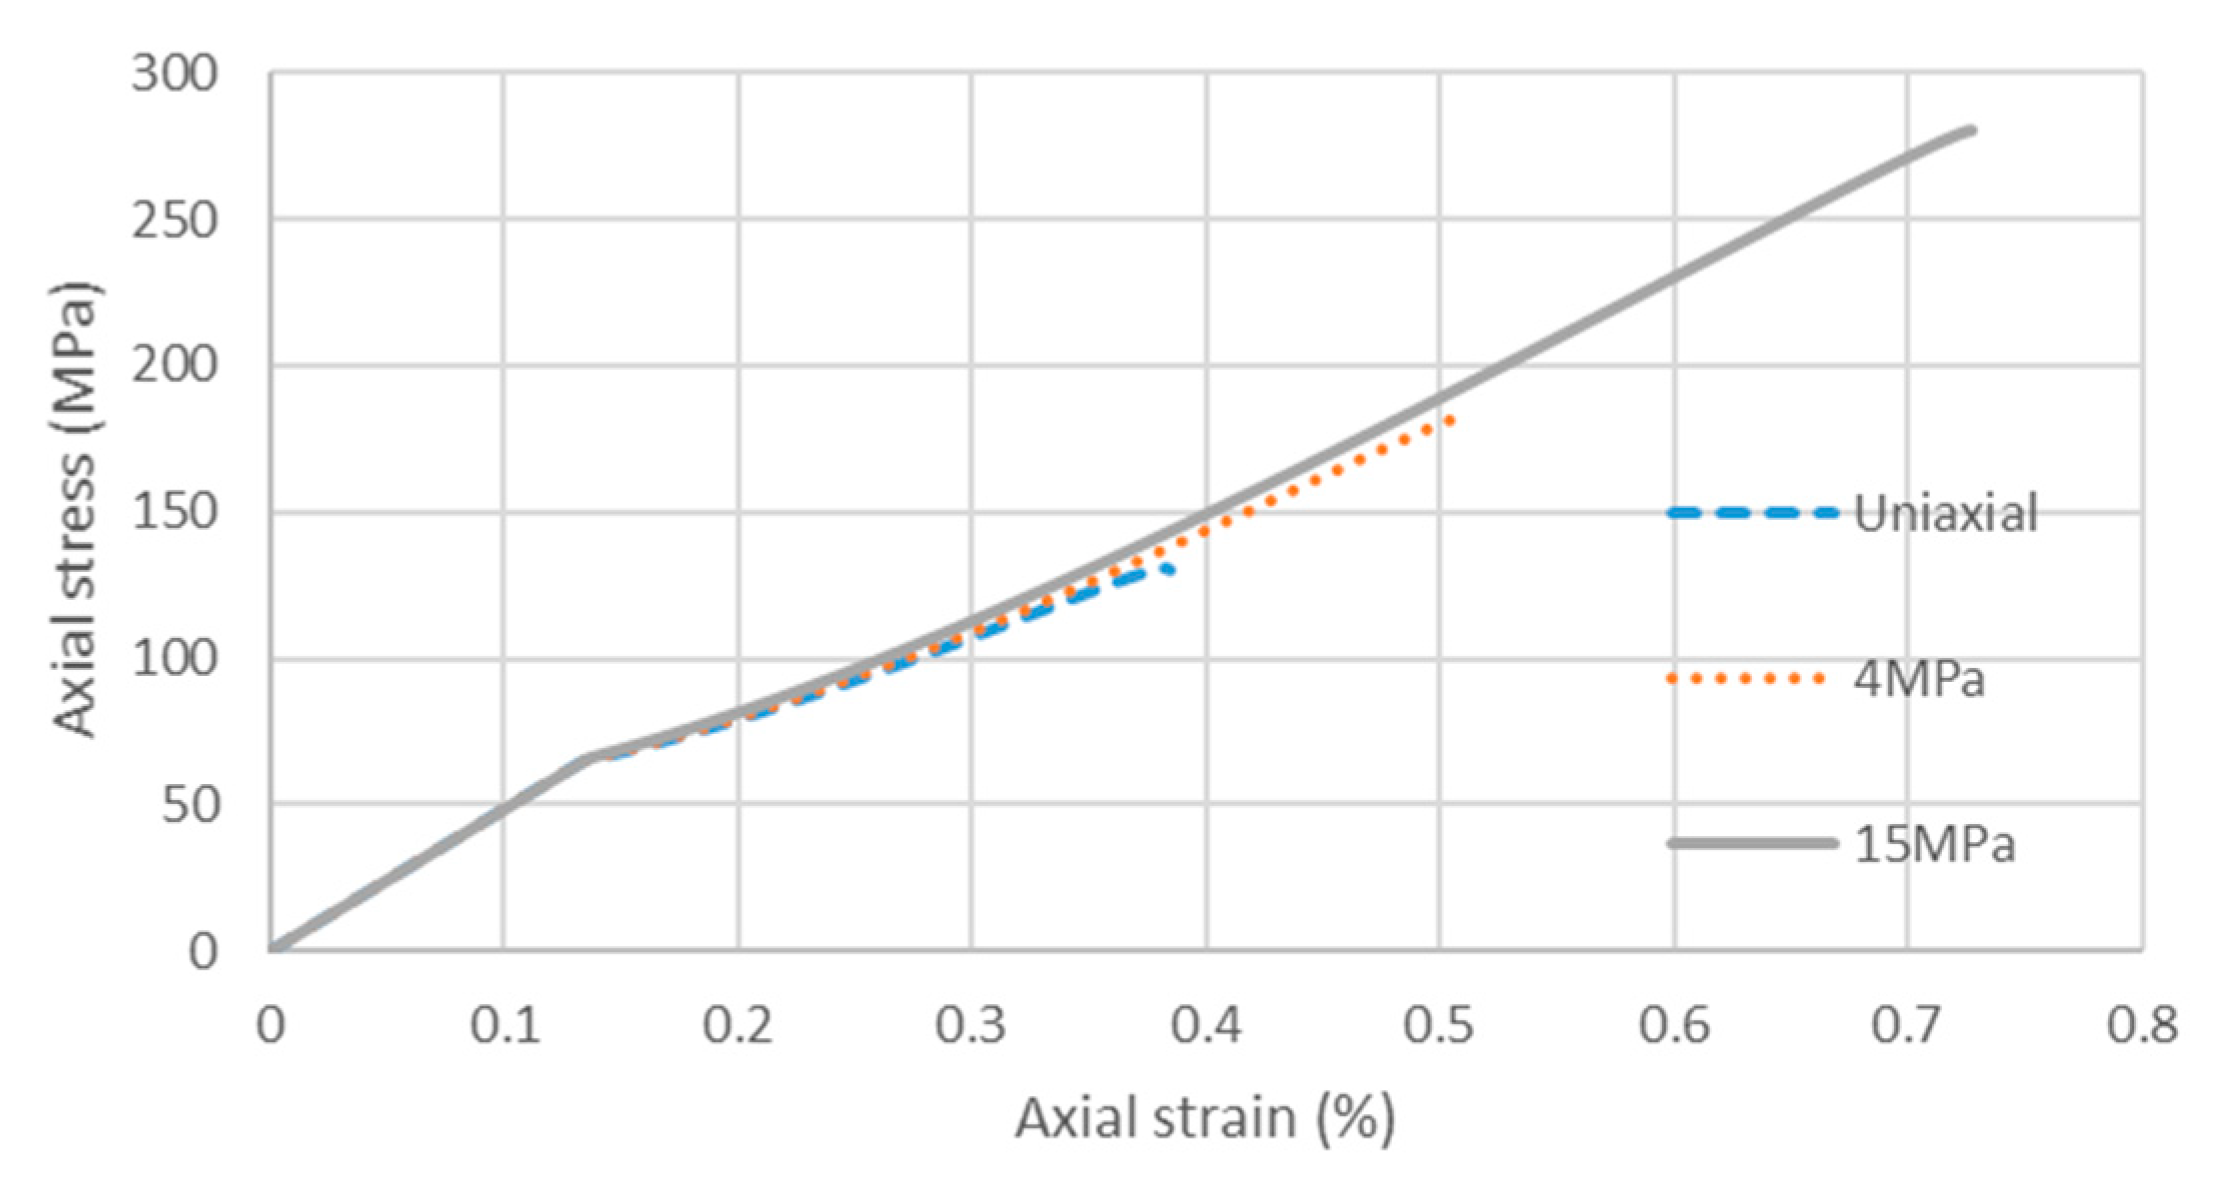
The effect of confinement is examined by the simulation of triaxial compression tests, with confining pressure of 4 and 15 MPa. The results are shown in Figure 8. The simulated strength increases with confinement and is comparable to the crack damage stresses inferred from Figure 2 corresponding to the same confining stress. It should be noted that strength envelopes as shown in Figure 2 are nonlinear; therefore, in this simulation, the peak friction angle is assumed to decrease with confining stresses to 68° (at 4MPa) and 62° (at 15 MPa) from a maximum value of 72° in uniaxial conditions.
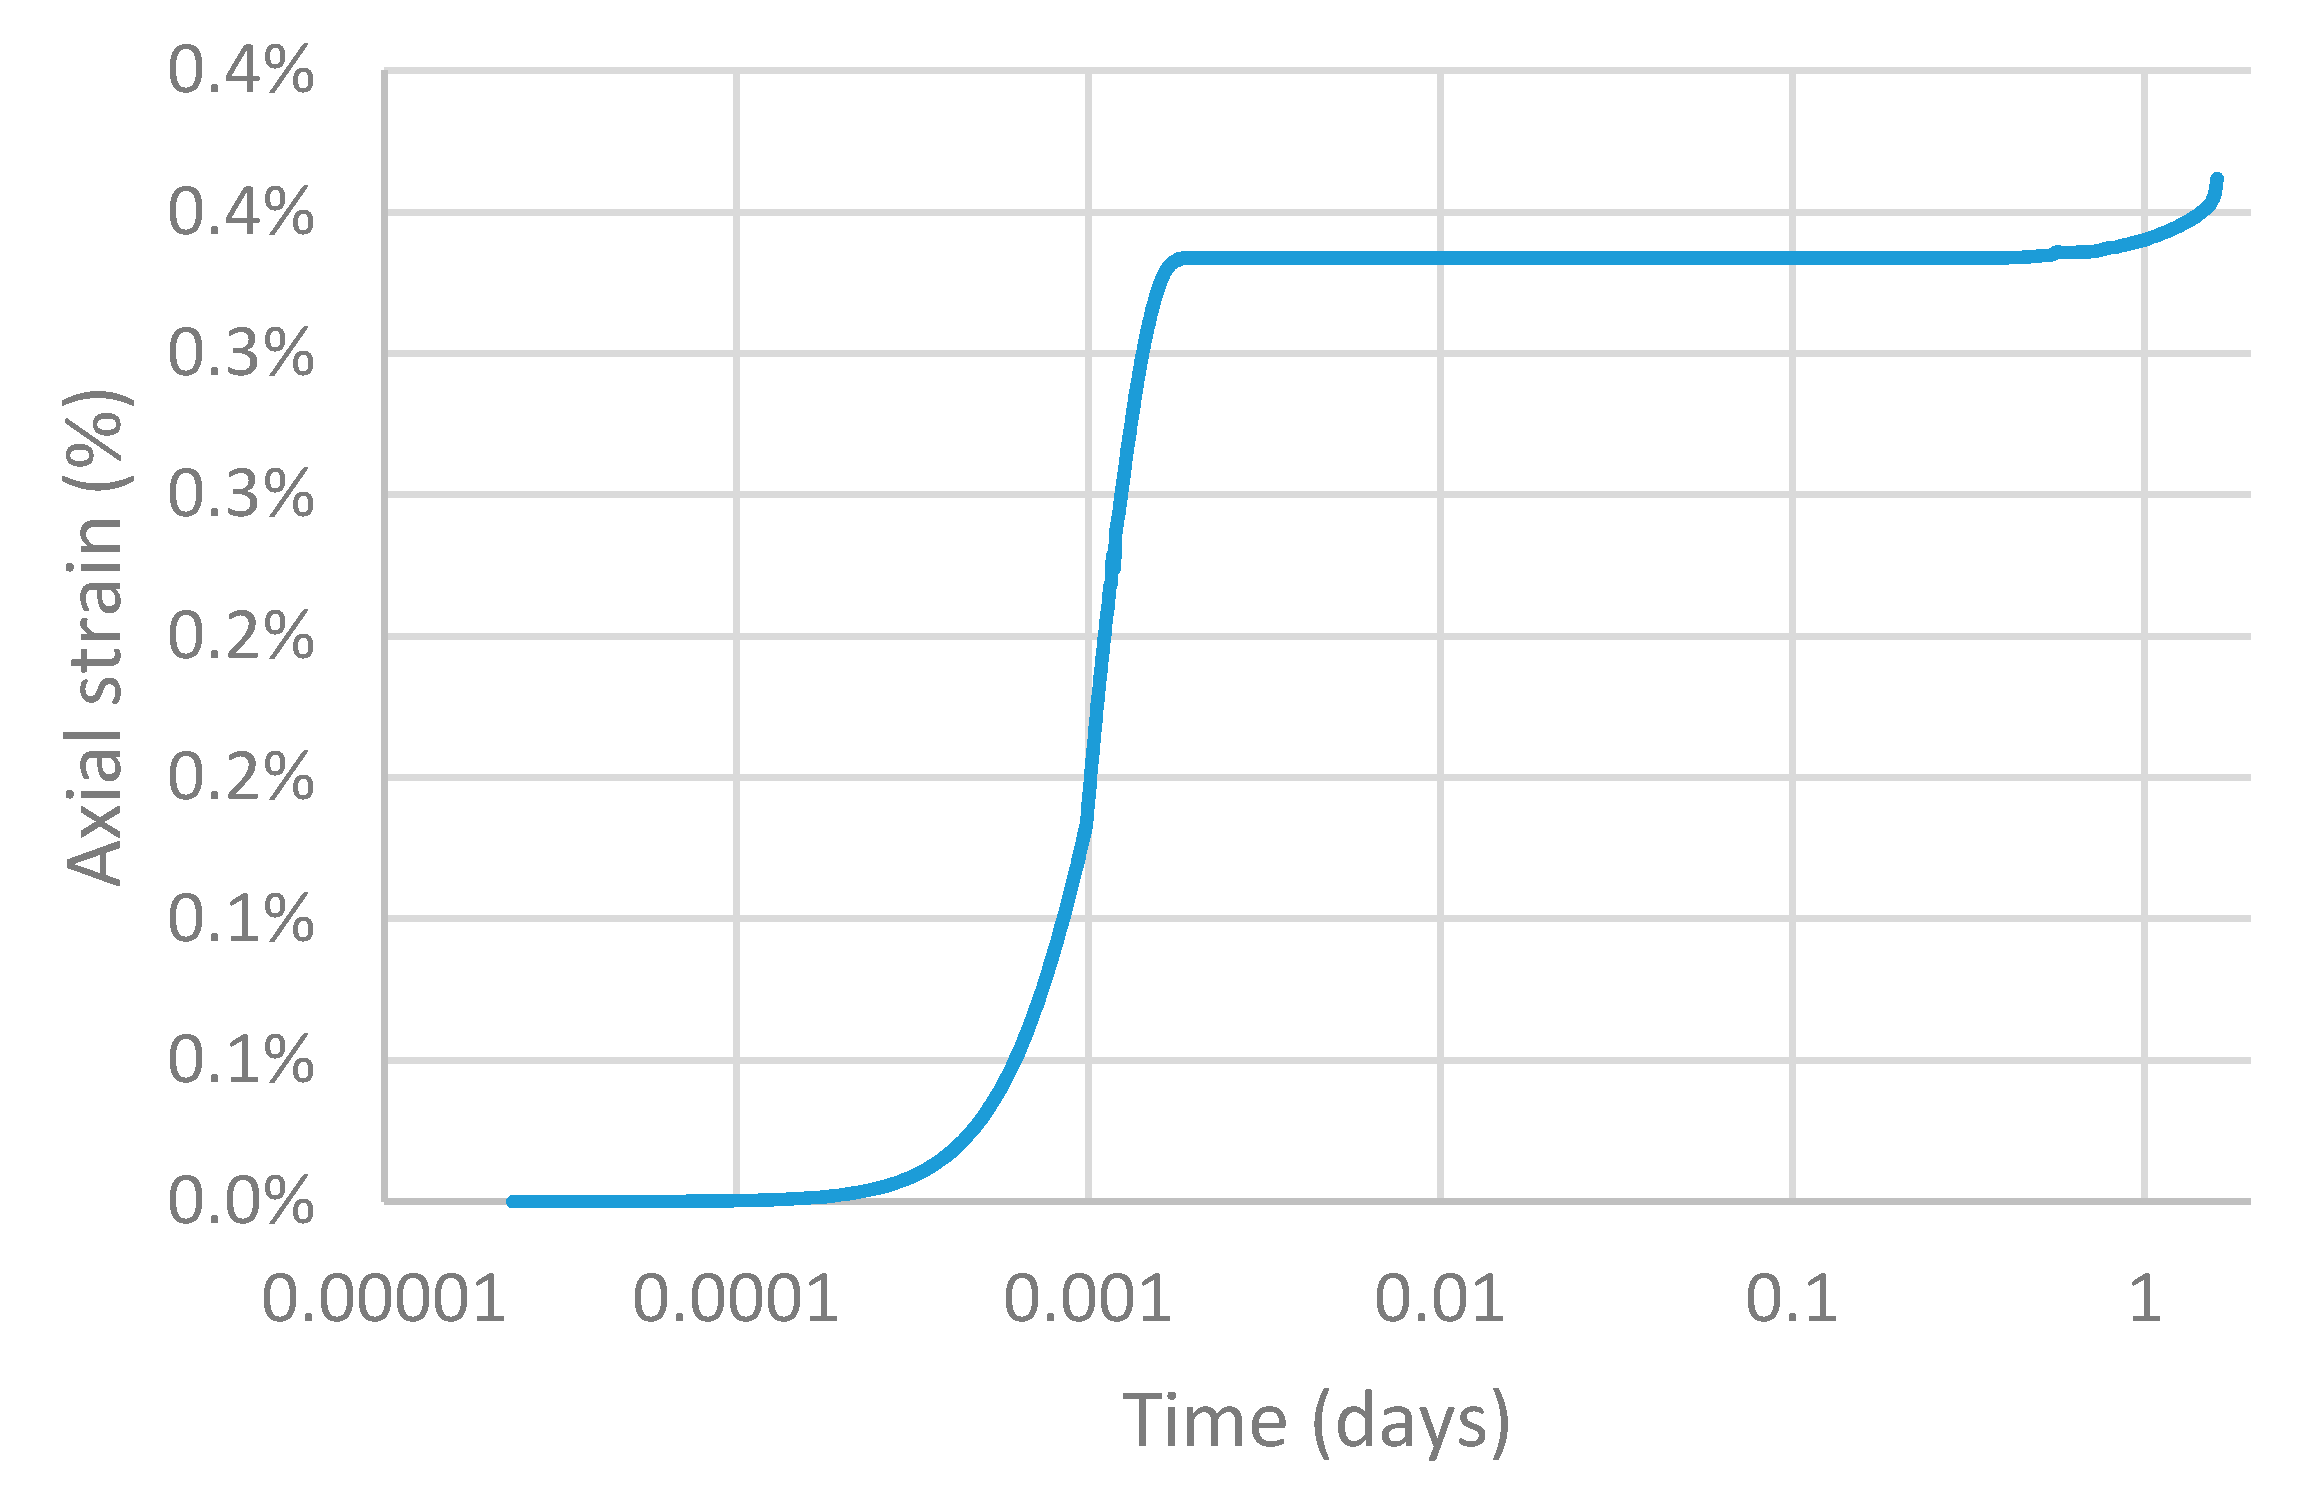
The effects of strength degradation as a function of time were also examined. As previously discussed, strength degradation is simulated by a decrease of the mobilized friction angle from 72° to 67° in 365 days, and this is what will be used in the analysis of the test tunnel discussed in the next section. For the current example of a hypothetical laboratory uniaxial creep test, in order to save computing time, the degradation process was arbitrarily “accelerated” to 2 days. In this situation, the sample is axially loaded to 115 MPa, at a rate of 0.75 MPa/s. The axial load is then maintained constant and the deformation is monitored. The simulation shows (Figure 9) that the deformation remains nearly constant up until approximately 1.6 day, when it rapidly increases indicating failure. No experimental data were available to compare with the modelling results. However, the stress-strain evolution shown in Figure 9 seems to be consistent with typical behaviour found in creep tests.
5. Simulation of Excavation Damage and Pore Pressure Evolutions around a Test Tunnel in LdB Granite
5.1. The Tunnel Sealing Experiment (TSX)
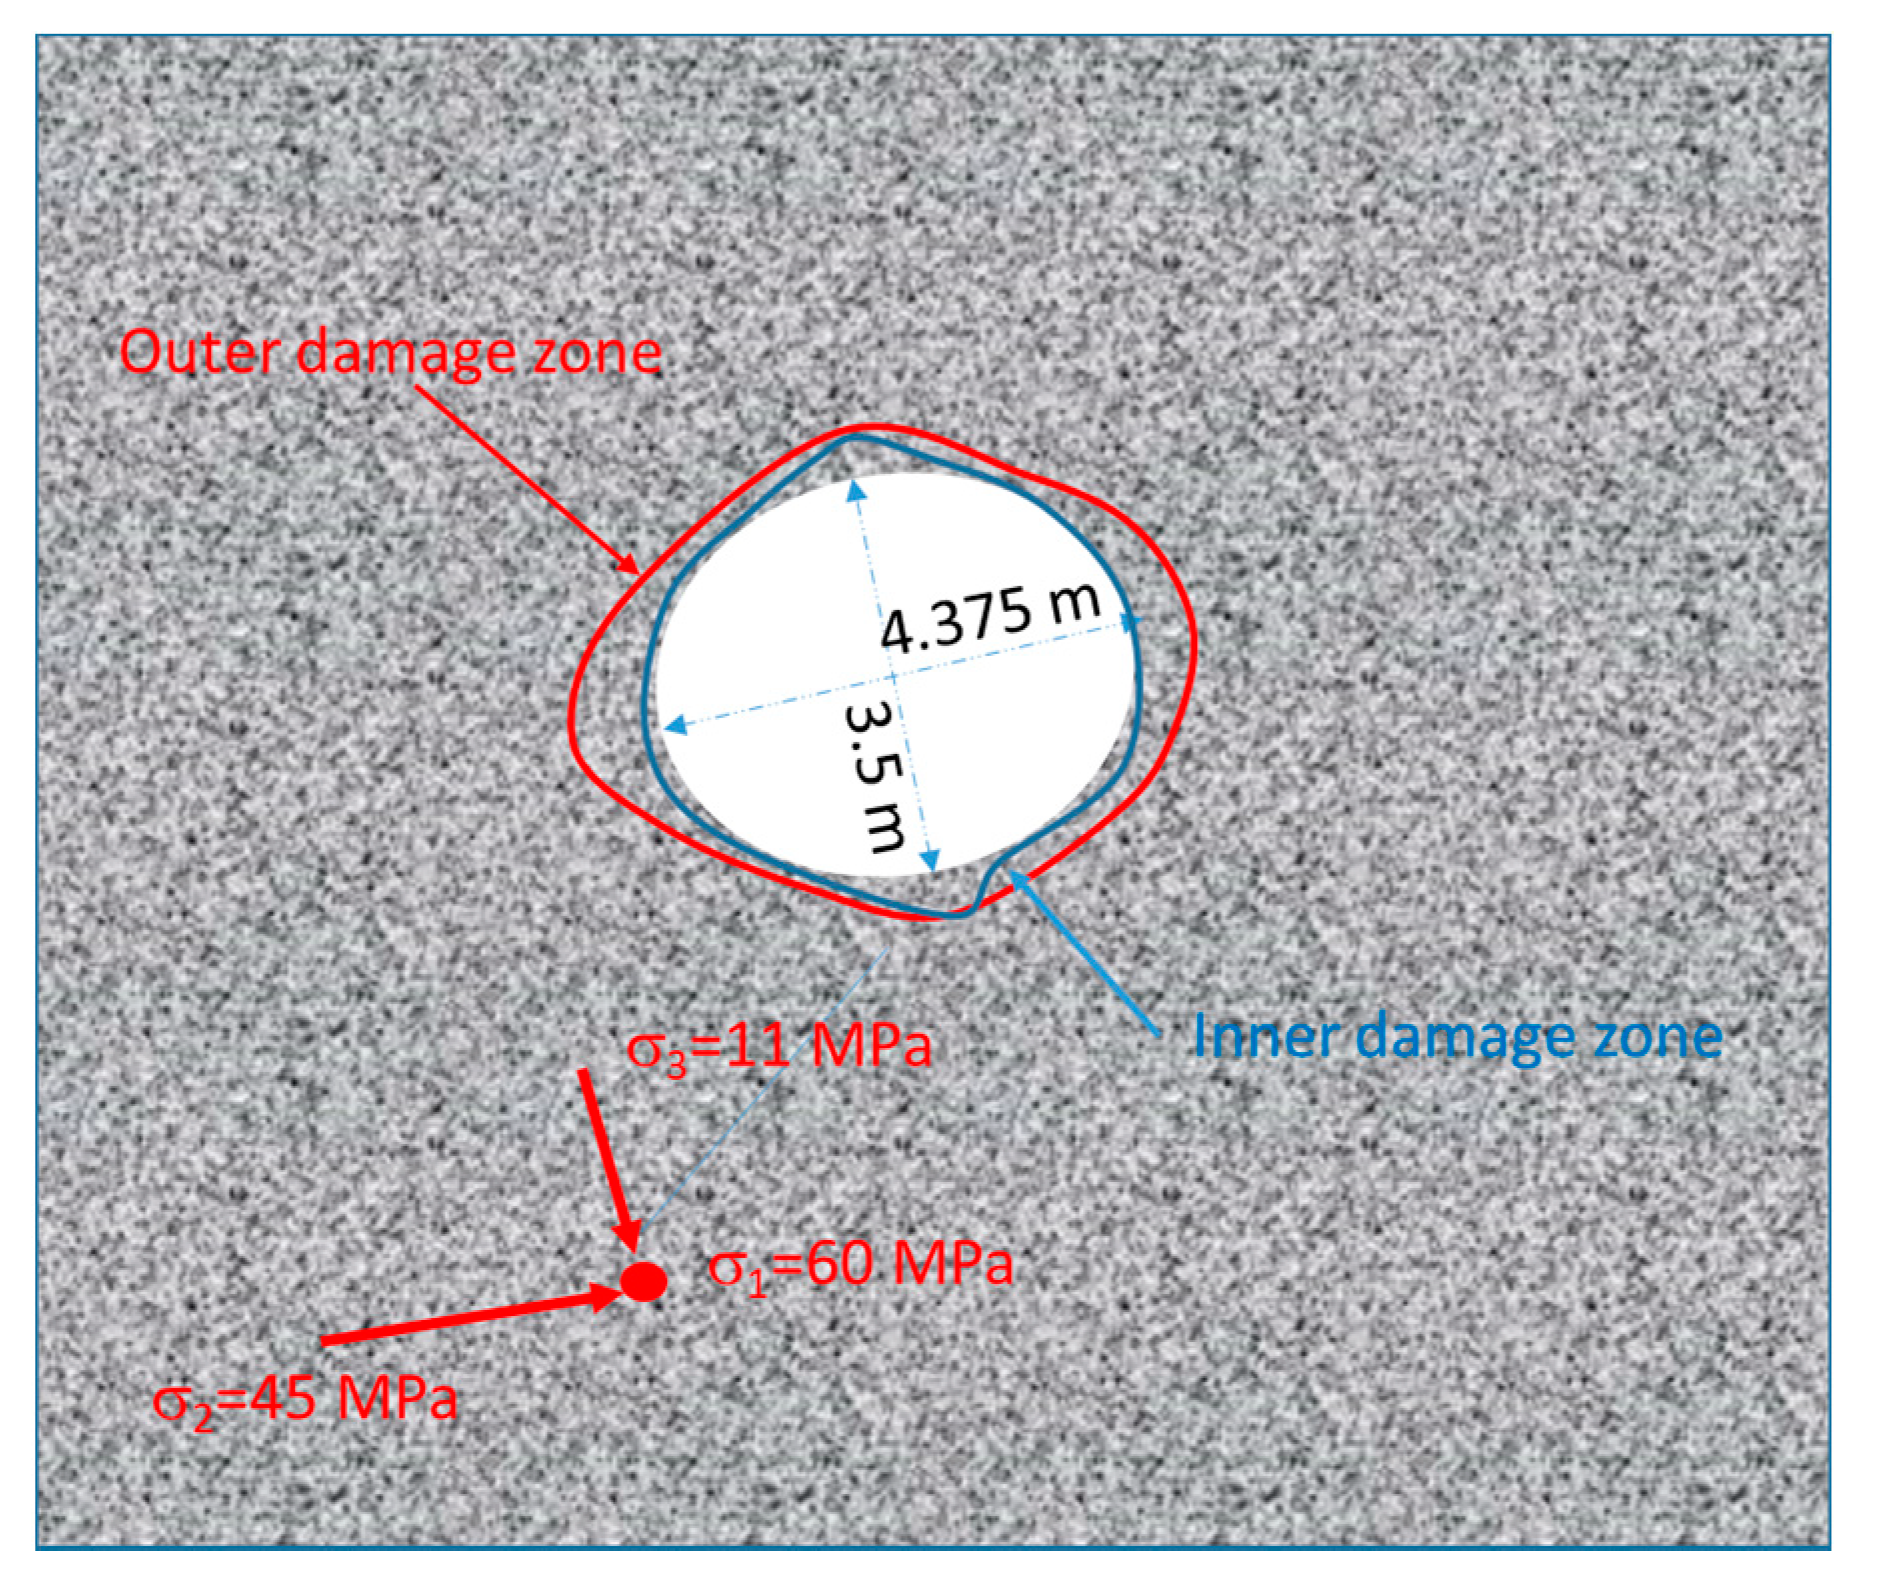
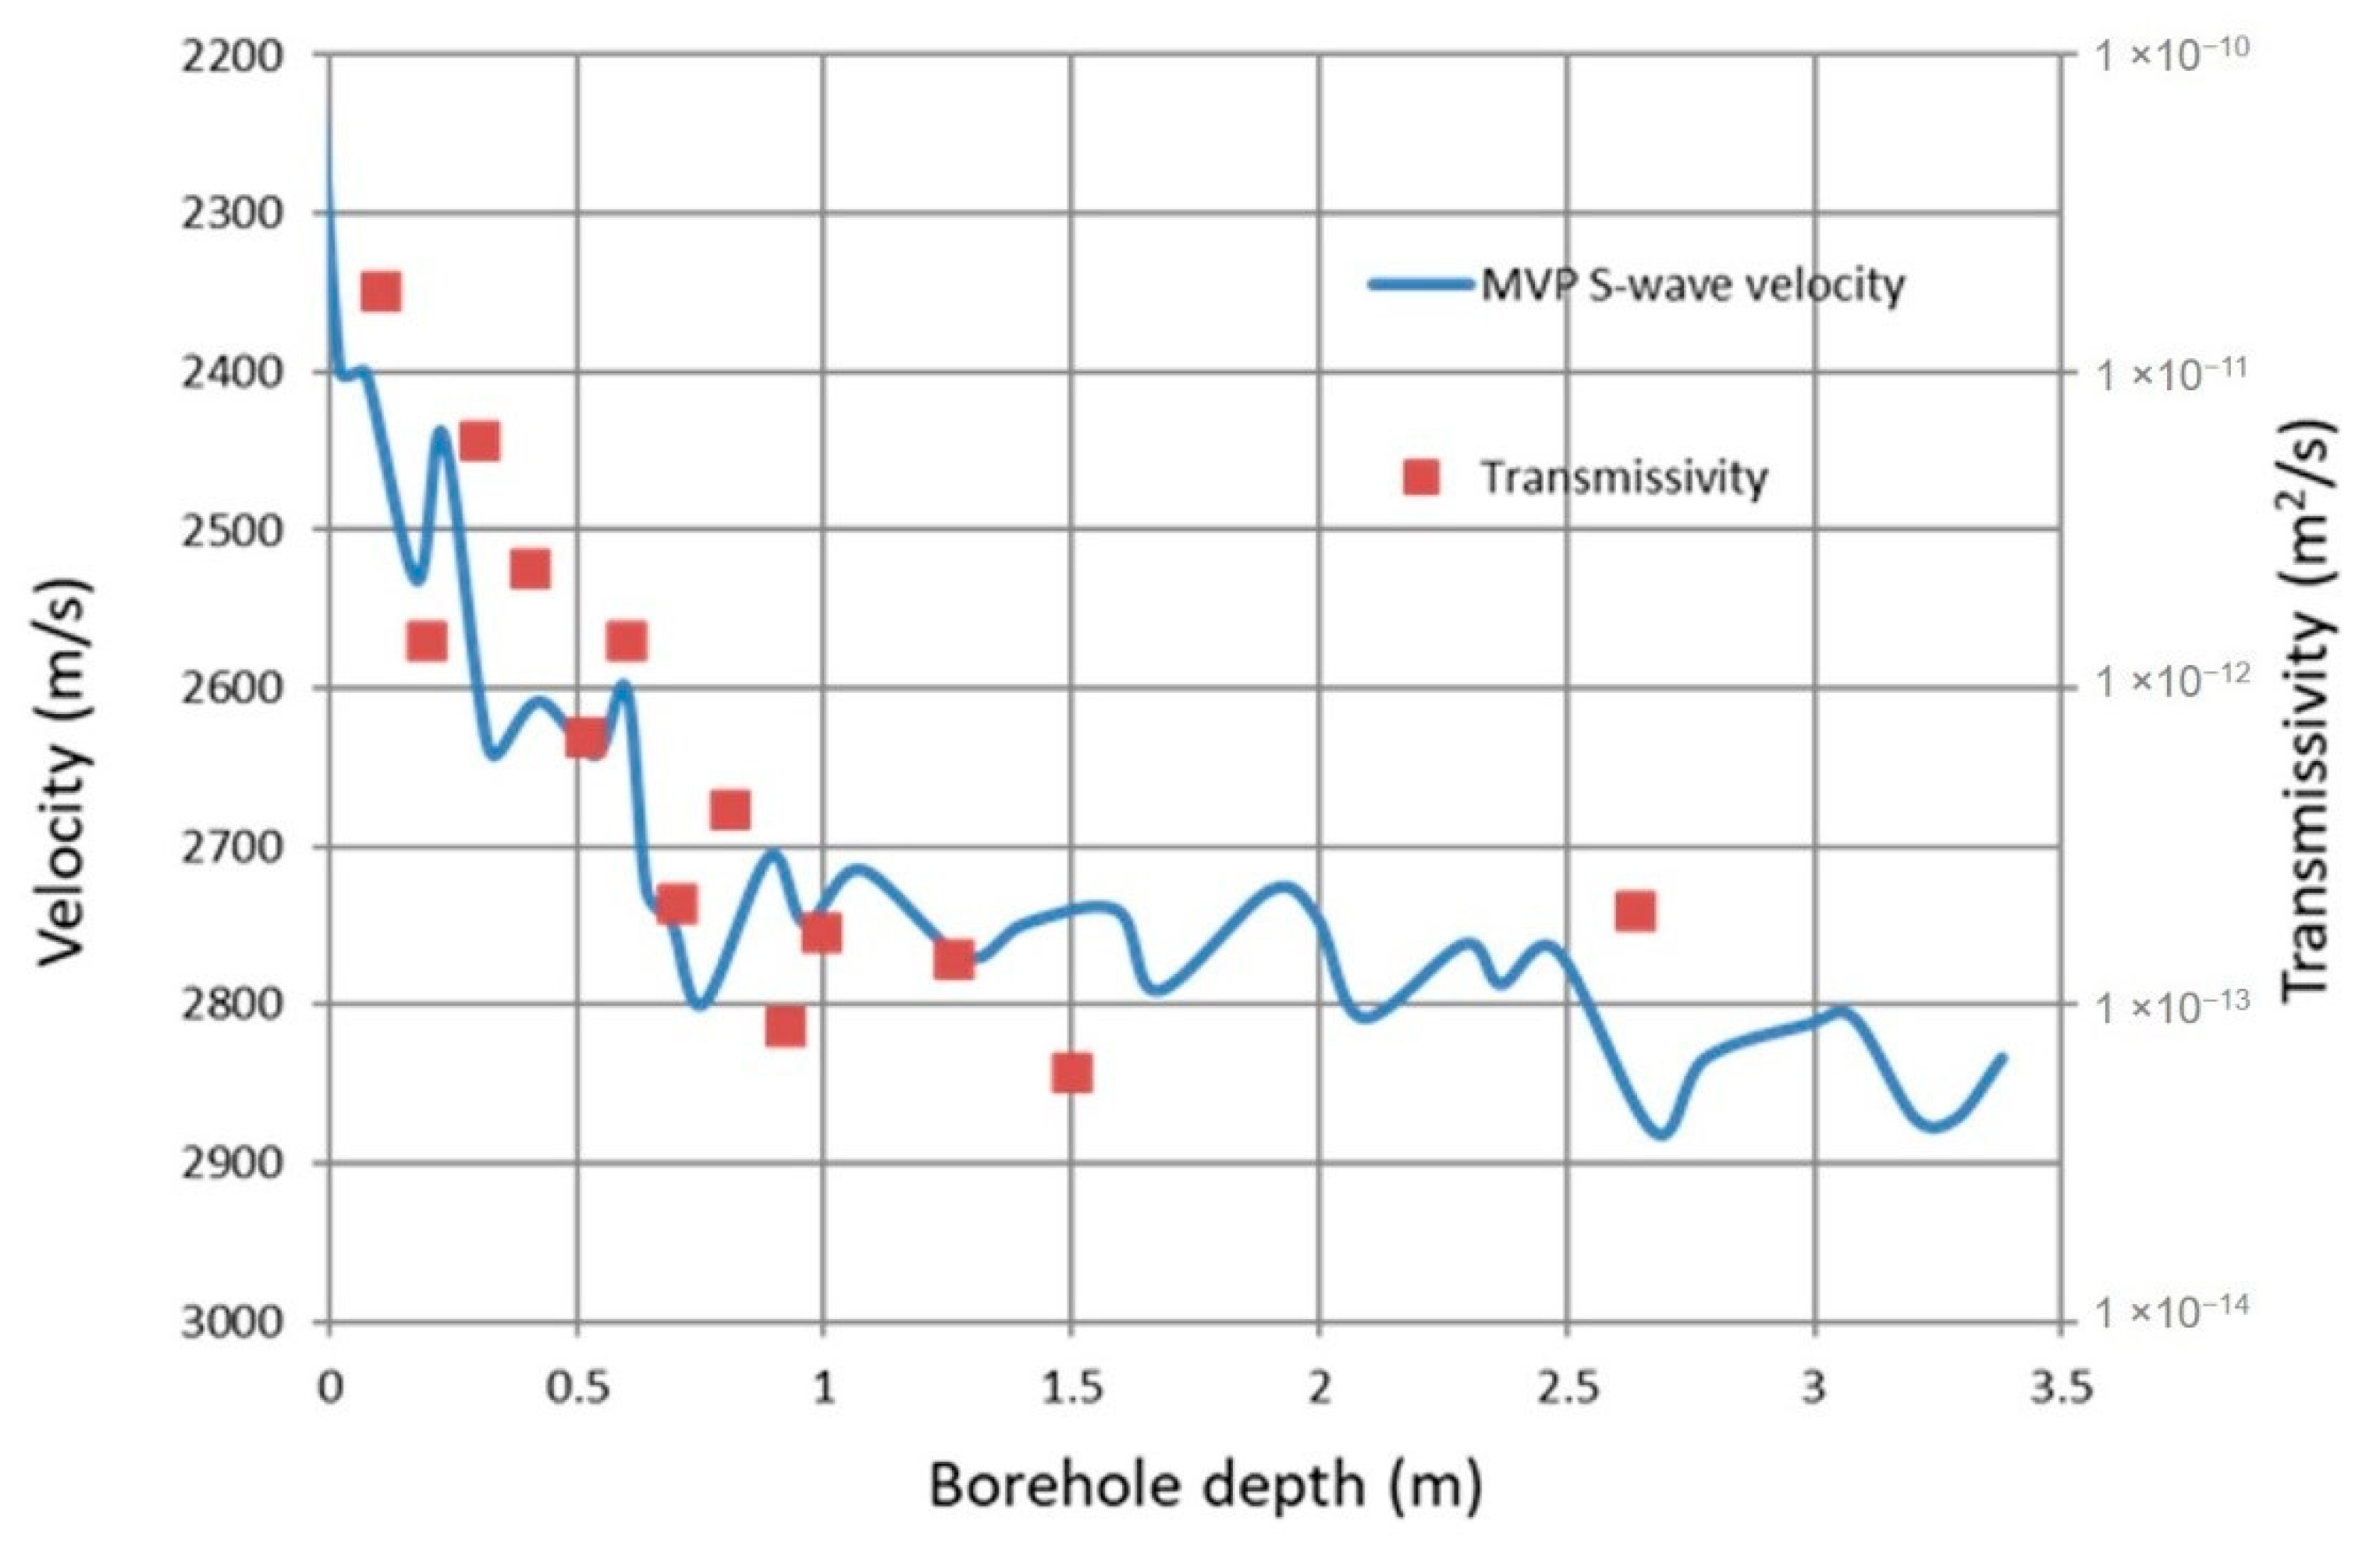
The AECL’s URL is located approximately 120 km NE of Winnipeg, Manitoba, Canada, within the LdB granite formation at the Western edge of the Canadian Shield [14]. There were four experimental levels, at depths of 130, 240, 300 and 420 m. Subvertical joint sets and several major low dipping thrust faults were found within the first few hundred metres from the surface. Below the first few hundred metres, the rock is sparsely fractured. The TSX tunnel was excavated in sparsely fractured rock at the 420 level, with a longitudinal axis oriented in the direction of the major principal stress (Figure 10). A controlled drill and blast excavation method was used in order to minimize damage due to blasting. The Tunnel Sealing Experiment (TSX) was an international project funded by nuclear waste management organizations from Canada, Japan, France and the United States [42]. The primary objective of the experiment was to study the performance of two types of bulkhead designs to seal preferential flow paths that will potentially form along the tunnel because of the EDZ. The TSX tunnel has an elliptical cross-section, 3.5 m high, with a horizontal to vertical aspect ratio of 1.25. The length of the room is approximately 40 m. Before the installation of the bulkheads, the EDZ was characterized by a variety of methods and the hydraulic response of the rock mass was monitored [42]. The present study focuses on the evolution of the EDZ and the hydro-mechanical response of the rock surrounding the tunnel during and after its excavation. Pore pressure was monitored in the central section of the room at points along the roof and along the sides. The methods for EDZ characterization include the micro velocity probe (MVP) method and the SEPPI method. The MVP provides quick measurements of travel time between transmitter and receiver over a designated separation distance in a single borehole. The velocity can be calculated from these travel times. The SEPPI probe provides a measure of the transmissivity of the rock in small intervals in a single borehole. The EDZ forming around the TSX tunnel is shown in Figure 10. Chandler et al. [42] defined (i) an inner damage zone, where there is a sharp change of the values of the velocity and transmissivity in the radial direction, and (ii) an outer damage zone, with a more gradual change of these properties before ambient values are obtained (Figure 10). Visible fracturing characterized the inner zone, resulting in the formation of v-shaped notches at the roof and ceiling of the TSX tunnel. These notches are oriented in the direction of the minor principal stress, which make an angle of 11° with the vertical direction. No visible fractures were detected in the outer zone. However, the difference in hydraulic (permeability or transmissivity) and mechanical properties (elastic moduli which could be correlated to the MVP velocity) with respect to ambient values is still substantial in the outer zone, as shown in Figure 11.
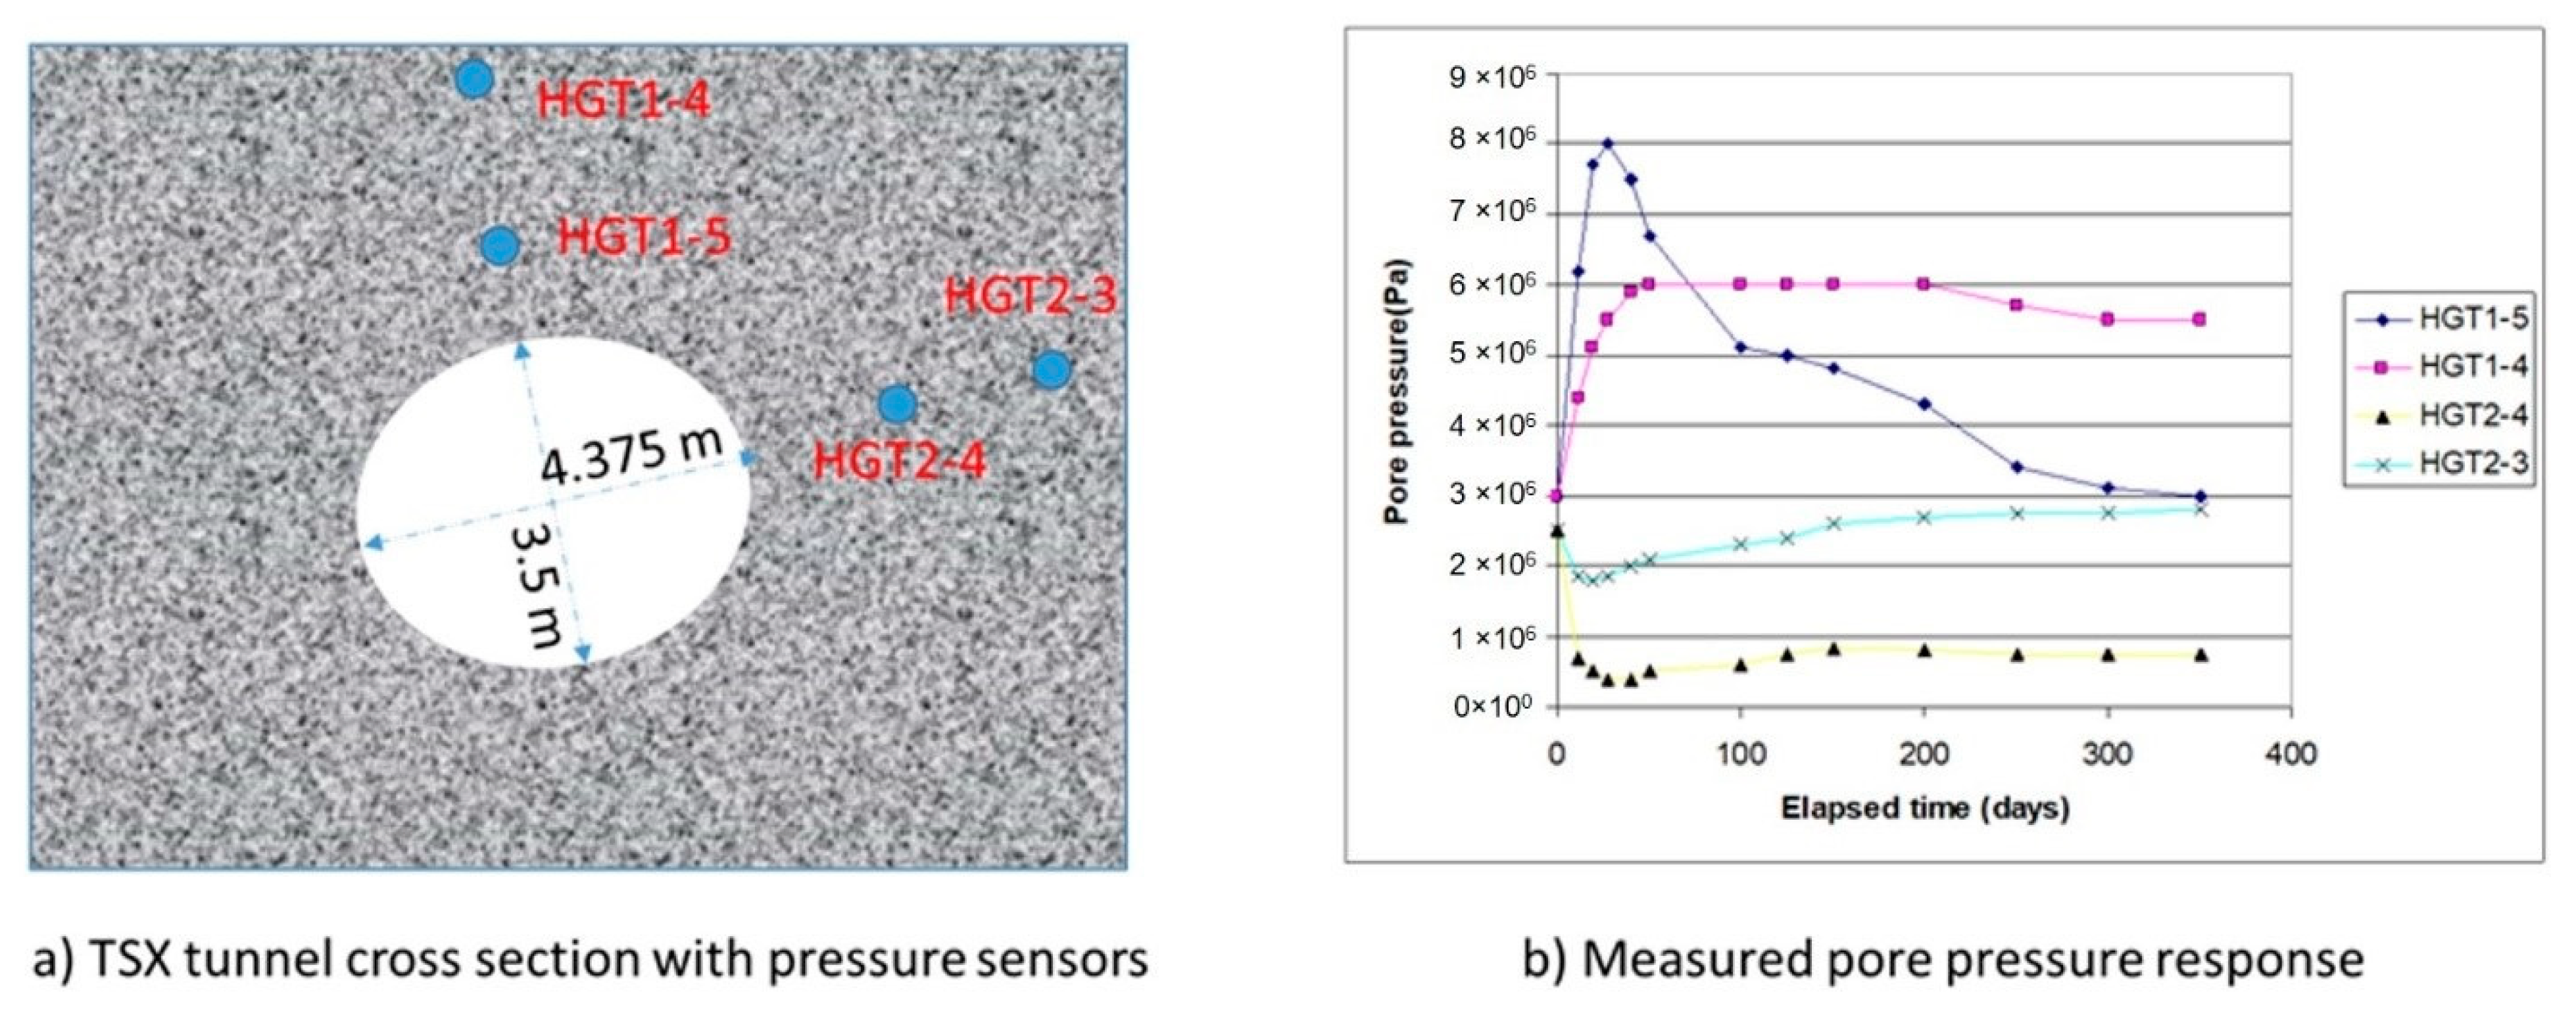
The excavation of the tunnel also results in a change in the hydraulic regime of the rock mass, as evidenced by the response of the pressure sensors (Figure 12). The hydrostatic pressure at a depth of 420 m is approximately 4 MPa. However, due to the presence of existing tunnels, the pre-excavation pressure around the TSX tunnel was of the order of 3 MPa. The excavation of the tunnel creates a sink with atmospheric pressure conditions. At steady state, there should be a general decrease in pore pressure surrounding the tunnel, resulting in hydraulic gradients oriented towards the centre of the tunnel. However, in a transient time period, pressure along the roof (HGT1-5; HGT1-4) temporarily increased before gradually decreasing towards steady state values. Along the sides of the tunnel (HGT2-4; HGT2-3), pressure decreased sharply, before gradually increasing towards the steady state values.
5.2. Hydro-Mechanical Model of LdB Granite
A model to simulate the hydro-mechanical response of the intact LdB granite due to the excavation of the TSX tunnel was developed within the theoretical framework of poromechanics, where the stress-strain behaviour follows the constitutive model previously described. The parameters of the constitutive model were calibrated with laboratory compression tests, as shown in Table 1, and are used without modification in the simulation of the TSX excavation.
Using the classical concept of poromechanics as in [5], the governing equations of the model were derived:
Equation (9) expresses mass conservation of the pore fluid. In Equation (9), p is the pore pressure, κ is the permeability tensor, n is the porosity, Kf is the bulk modulus of the fluid, Ks is the bulk modulus of the solid minerals, t is the time, is the volumetric strain, and g is the acceleration due to gravity. Equation (10) expresses the quasi-static equilibrium of the porous skeleton. In Equation (13), is the effective stress tensor, I the Kronecker delta and α is Biot’s coefficient.
The constitutive relationship expresses the increment of the effective stress to the increment of strain and can be written as:
where is the increment of the effective stress tensor, dε is the increment of total strain tensor, dεp is the increment of the plastic strain tensor, and D is the elastic stiffness tensor. The constitutive relationship was described in the previous section; the required parameters are the Young’s modulus, the Poisson’s ratio, cohesion, friction and dilatancy angles, and the tensile strength as shown in Table 1. Other parameters needed for the simulation of the hydro-mechanical response are the permeability, the porosity, the bulk modulus of the fluid and solid grains, and Biot’s coefficient. The values used are from [12]:
n = 0.2%, Kf = 22.2 GPa and Ks = 50 GPa, and α = 0.73
The most important property for the flow process is the permeability. We assume the permeability to be isotropic, with a value equal to 5 × 10⁻²¹ m2 for the undamaged, undisturbed rock. This value is of the same order of magnitude as the one suggested in [42]. Due to damage, the permeability increases. In order to simulate the increase in permeability due to damage, similarly to [43,44,45], we assume that the permeability increases with the equivalent deviatoric strain according to the following equation:
where the equivalent deviatoric strain is given by:
5.3. Modelling Results for the Hydro-Mechanical Response of the LdB Granite to Tunnel Excavation
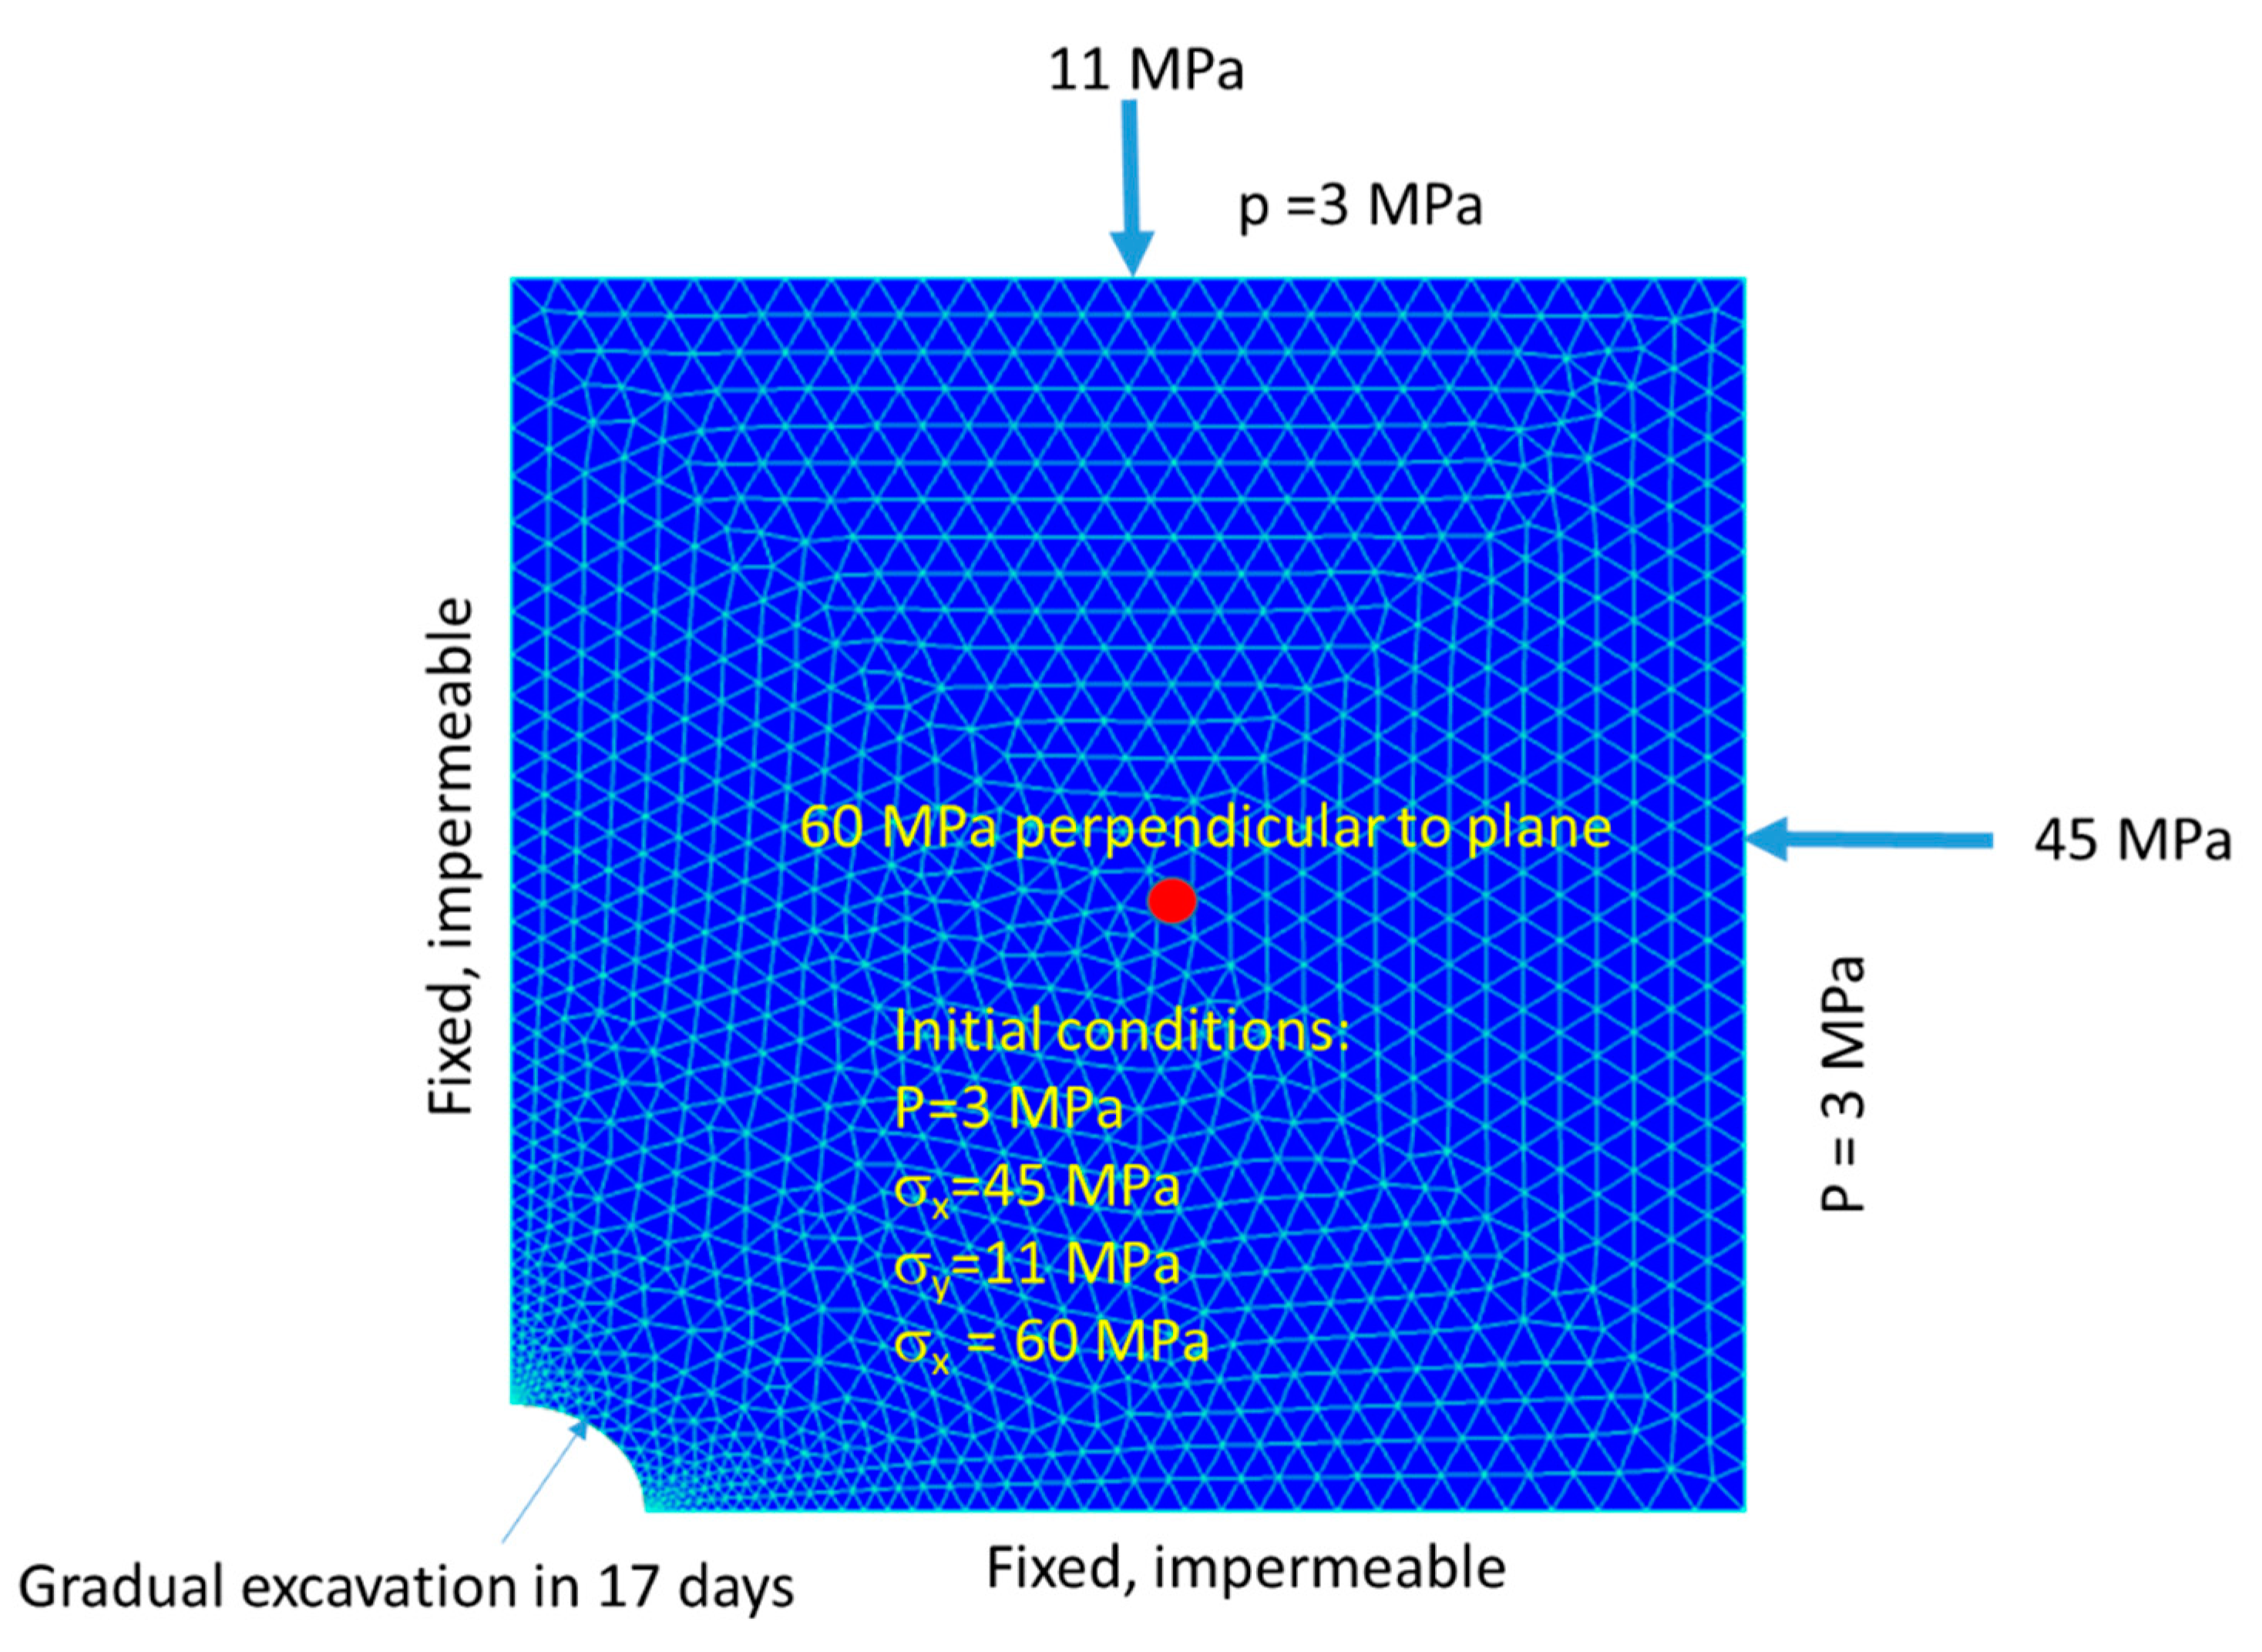
The governing equations for the hydro-mechanical behaviour of the LdB granite, along with the assumed boundary conditions are numerically solved with the FE software COMSOL Multiphysics. The FE model with the boundary and initial conditions is shown in Figure 13. Since the TSX tunnel is relatively long (40 m), plane strain conditions were assumed, and one cross-section of the tunnel is represented in the FE model. Furthermore, assuming symmetry, only one quarter of the cross section is considered, with the x-axis oriented in the direction of the intermediate principal stress, the y-axis in the direction of the minor principal stress, and the major principal stress is oriented in the direction of the tunnel longitudinal axis. Following Chandler et al. [42], the values of these stresses are assumed to be 11 MPa (minor principal stress), 45 MPa (intermediate principal stress) and 60 MPa (major principal stress). The initial pore pressure is assumed to be 3 MPa. Excavation of the tunnel was completed in 17 days. The excavation process was simulated by defining time-dependent tractions on the tunnel face that are in initial equilibrium with the in-situ stresses (at time 0), then decrease at a constant rate to zero at 17 days. Similarly, the pore pressure on the tunnel face was set at 3 MPa in the beginning and gradually decreases to zero at 17 days.
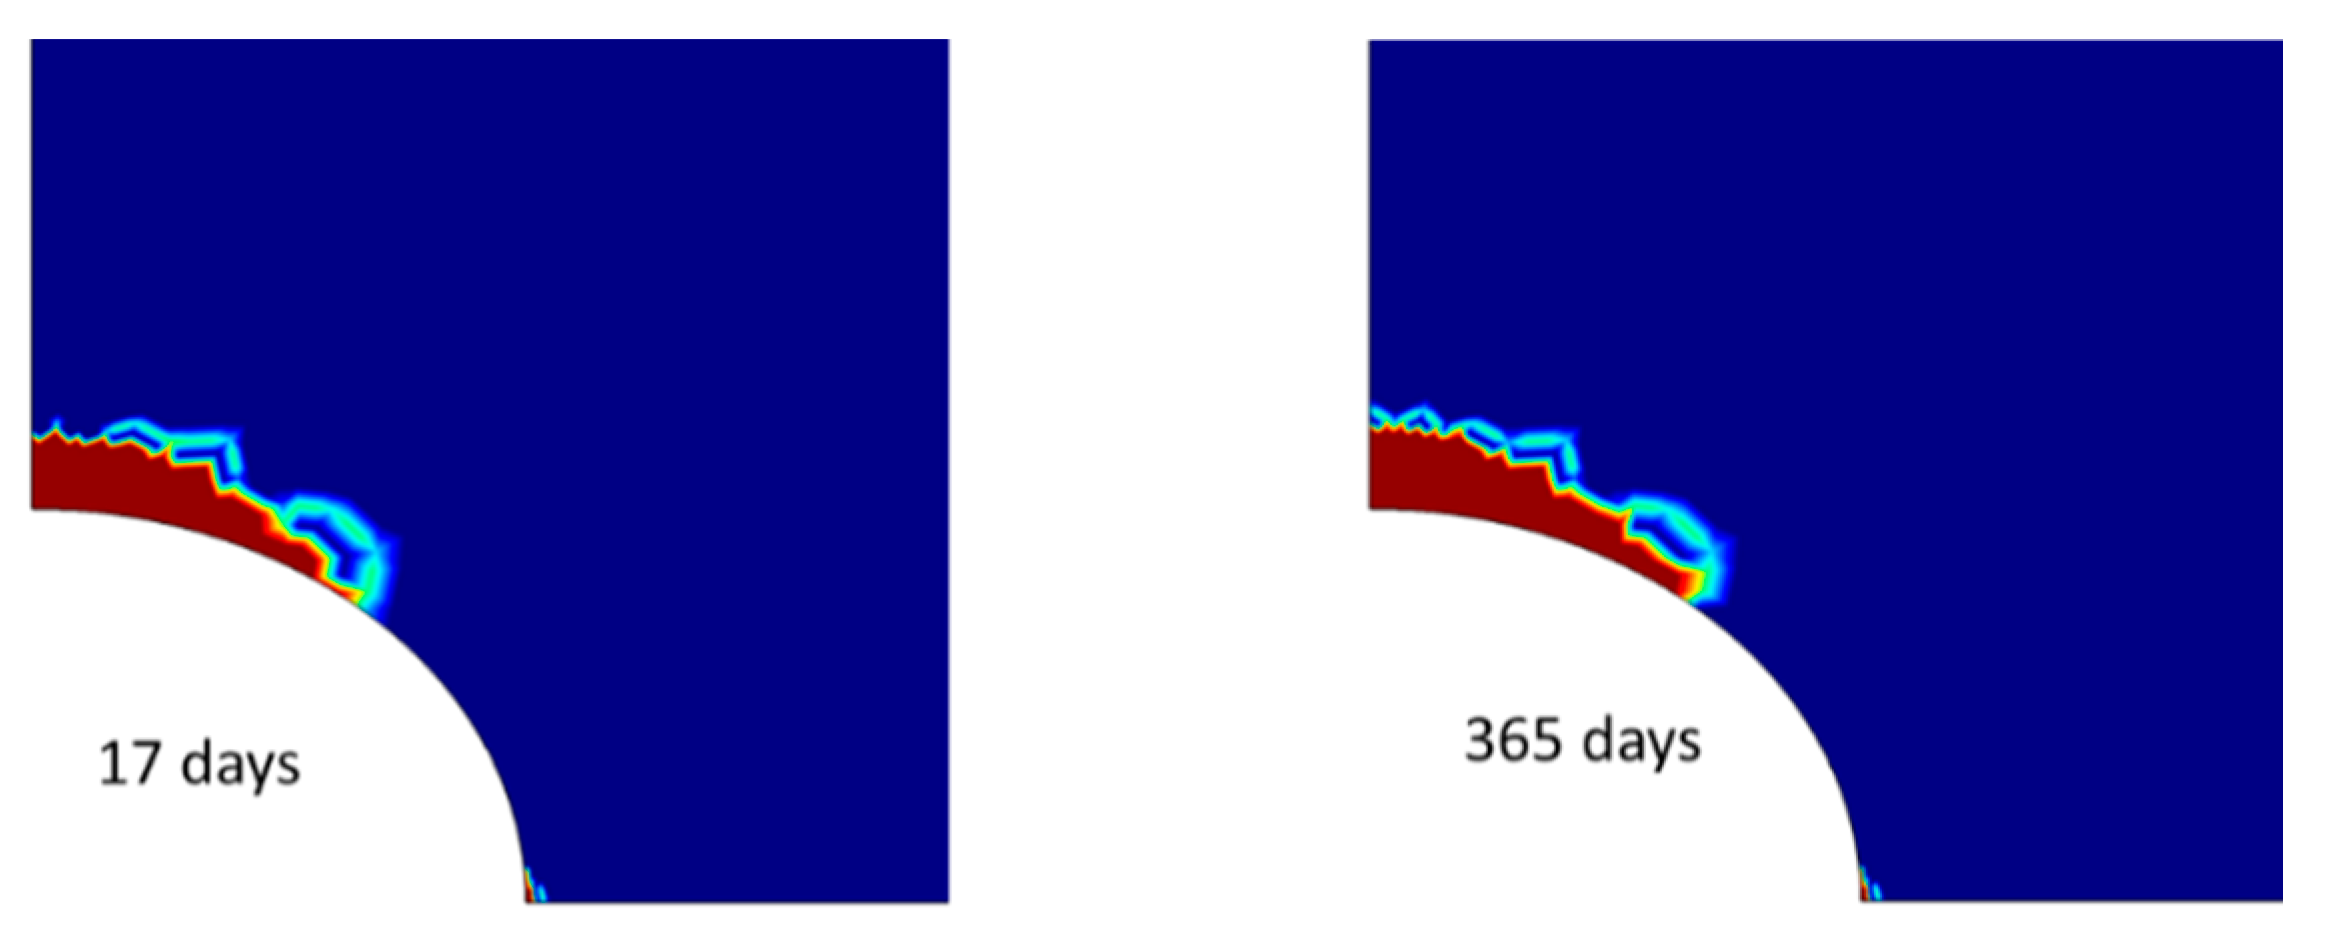
The simulation was performed for a period of 365 days, where t = 0 corresponds to the start of excavation and t = 17 days corresponds to the end of excavation. The excavation damage zone (EDZ), as indicated by the effective plastic strain, is shown in Figure 14, at time t = 17 and 365 days. The simulation shows that the EDZ reached almost its full extent at the end of excavation (17 days). Due to the effects of pore pressure, and time-degradation of the strength, the extent of the EDZ slightly increased at 365 days. The shape and extent of the simulated EDZ is shown to be comparable to the inner damage zone estimated in–situ, as shown in Figure 10. Along the roof, damage extended approximately 0.3 m into the rock, while damage due to tensile strength exceedance is more limited by the side.
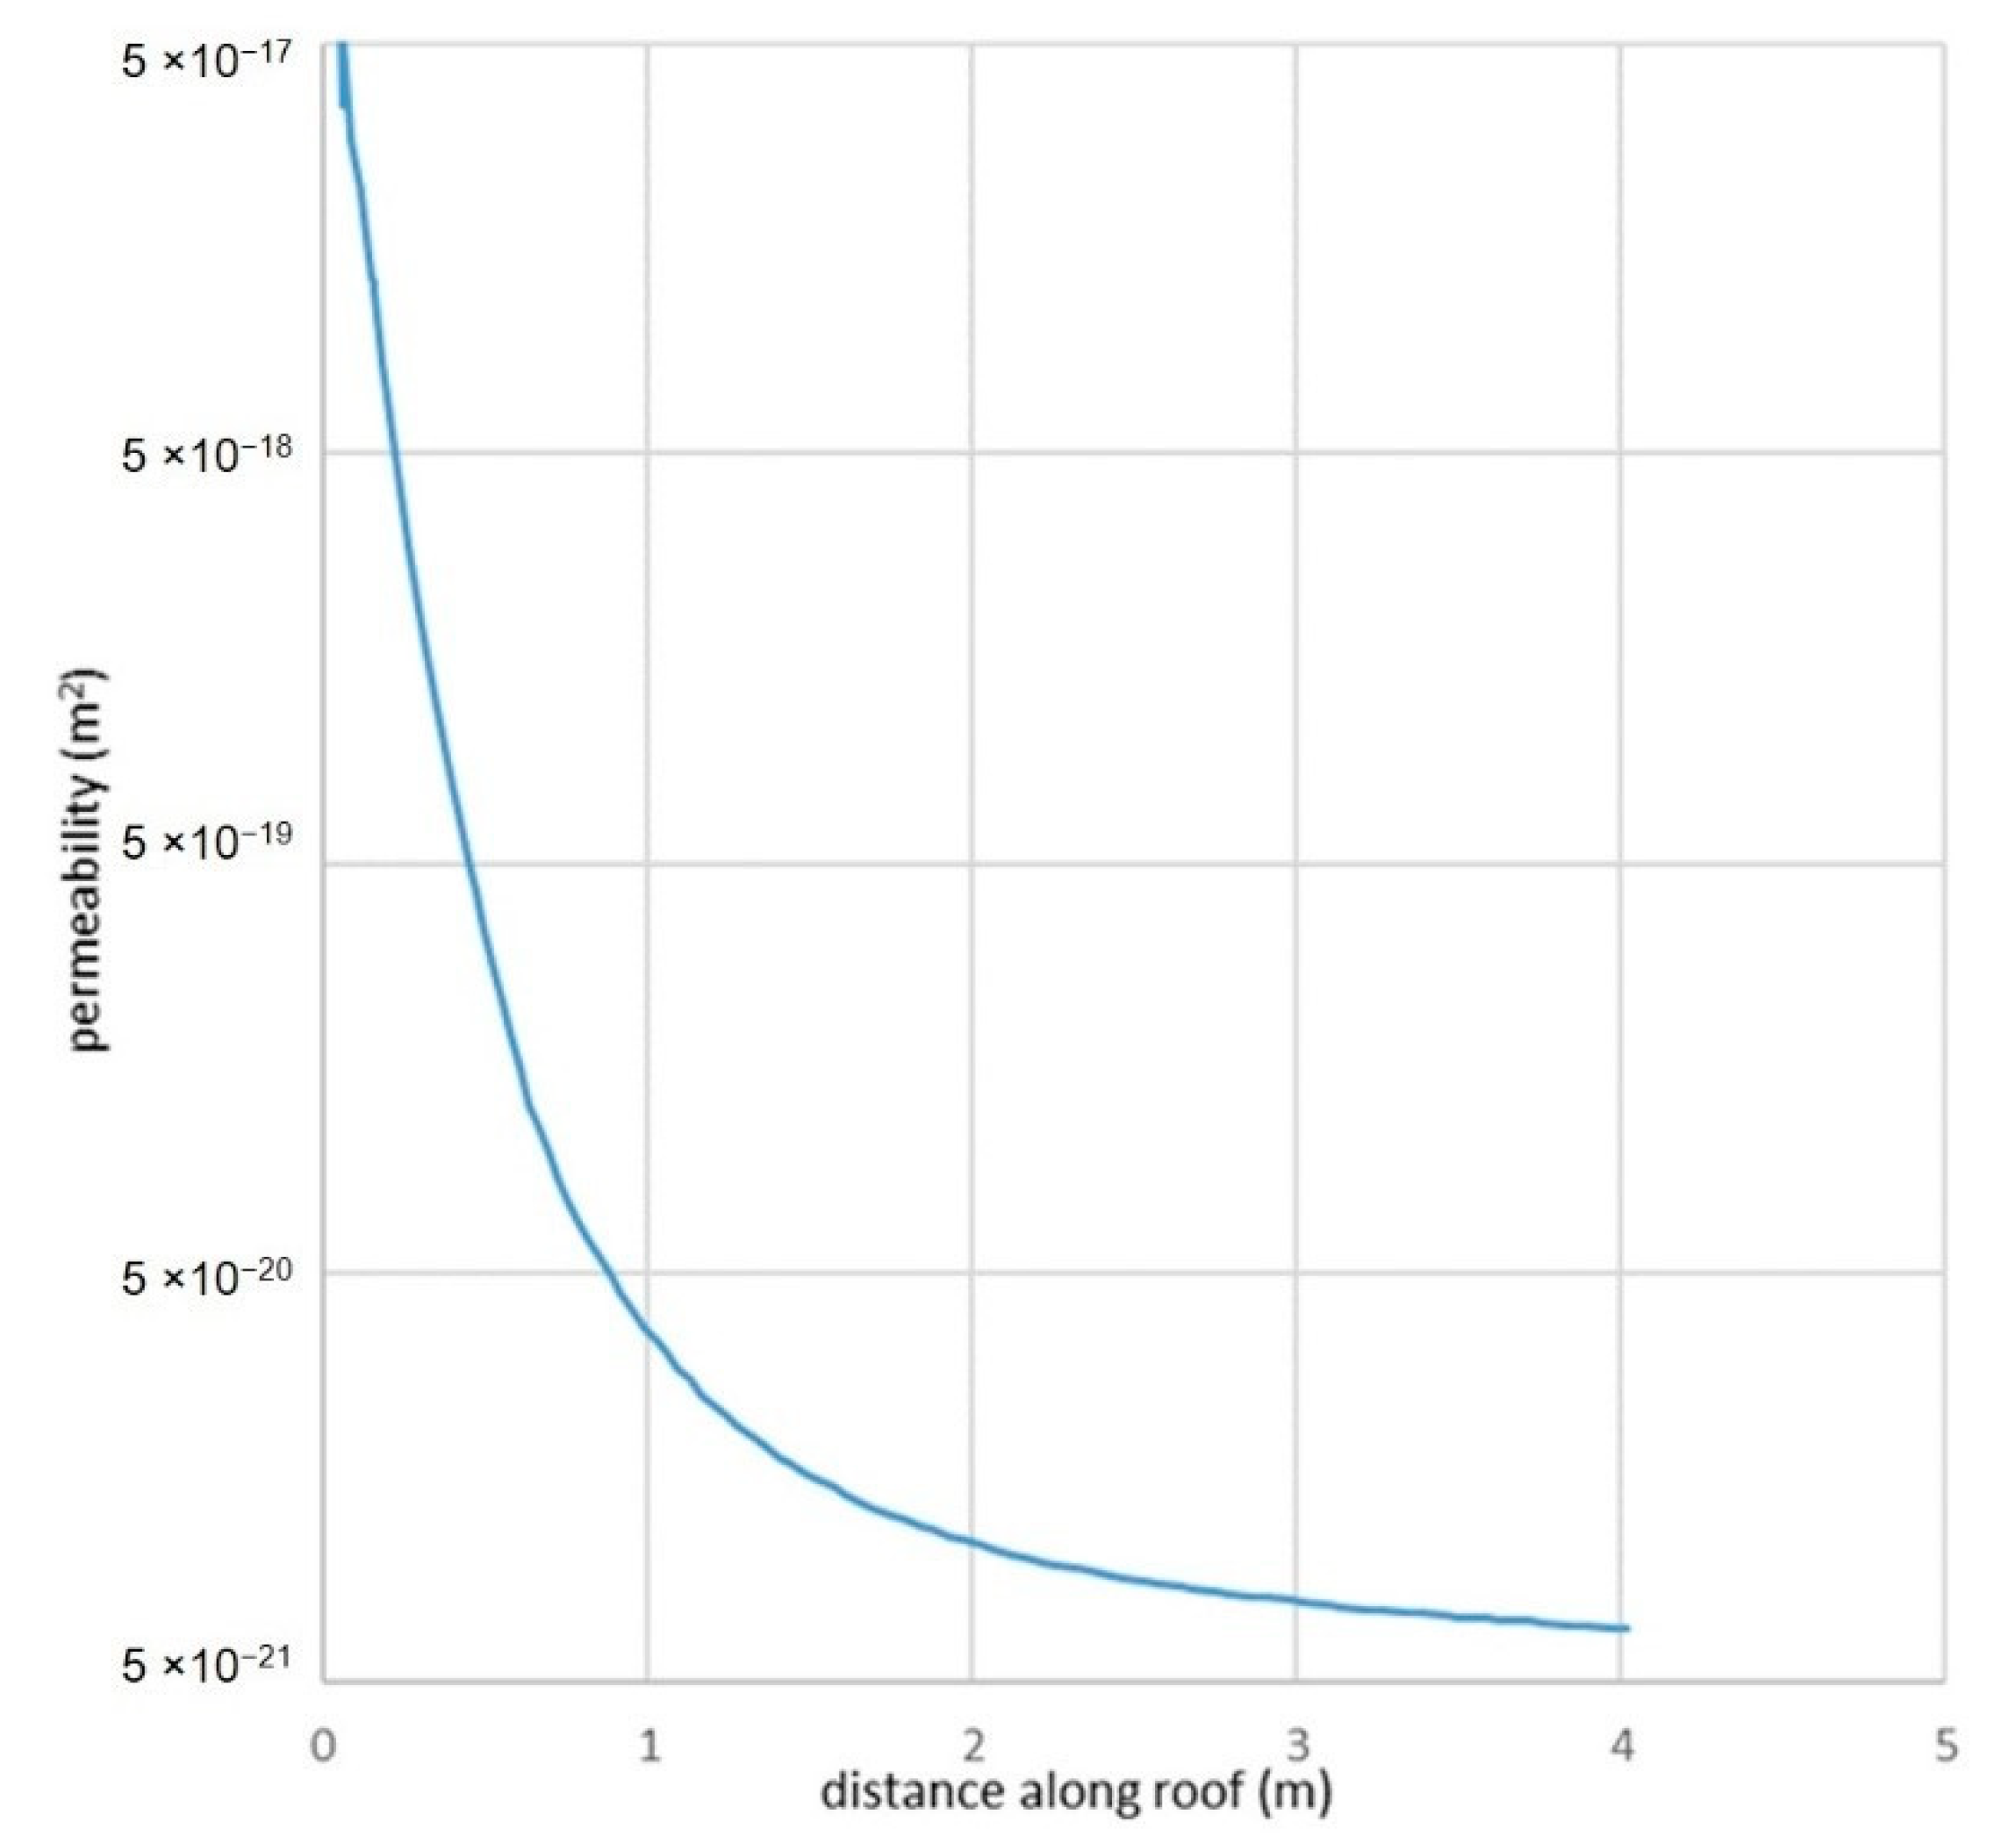
The permeability along the roof of the TSX tunnel changed due to the excavation. The simulated permeability profile is shown in Figure 15 and is similar in magnitude and trend to the measured transmissivity profile shown in Figure 11. It could be seen that the model correctly predicts an increase of the permeability by two orders of magnitude in the inner damage zone, within an approximate thickness of 0.3 m. The transition zone from 0.3 to 3 m would correspond to the outer damage zone. These results are comparable to the transmissivity values measured by the SEPPI method shown in Figure 11. It should be noted that the transmissivity values shown in Figure 11 are in unit of m2/s; the conversion factor to permeability in m2 is approximately 10−7 [42].
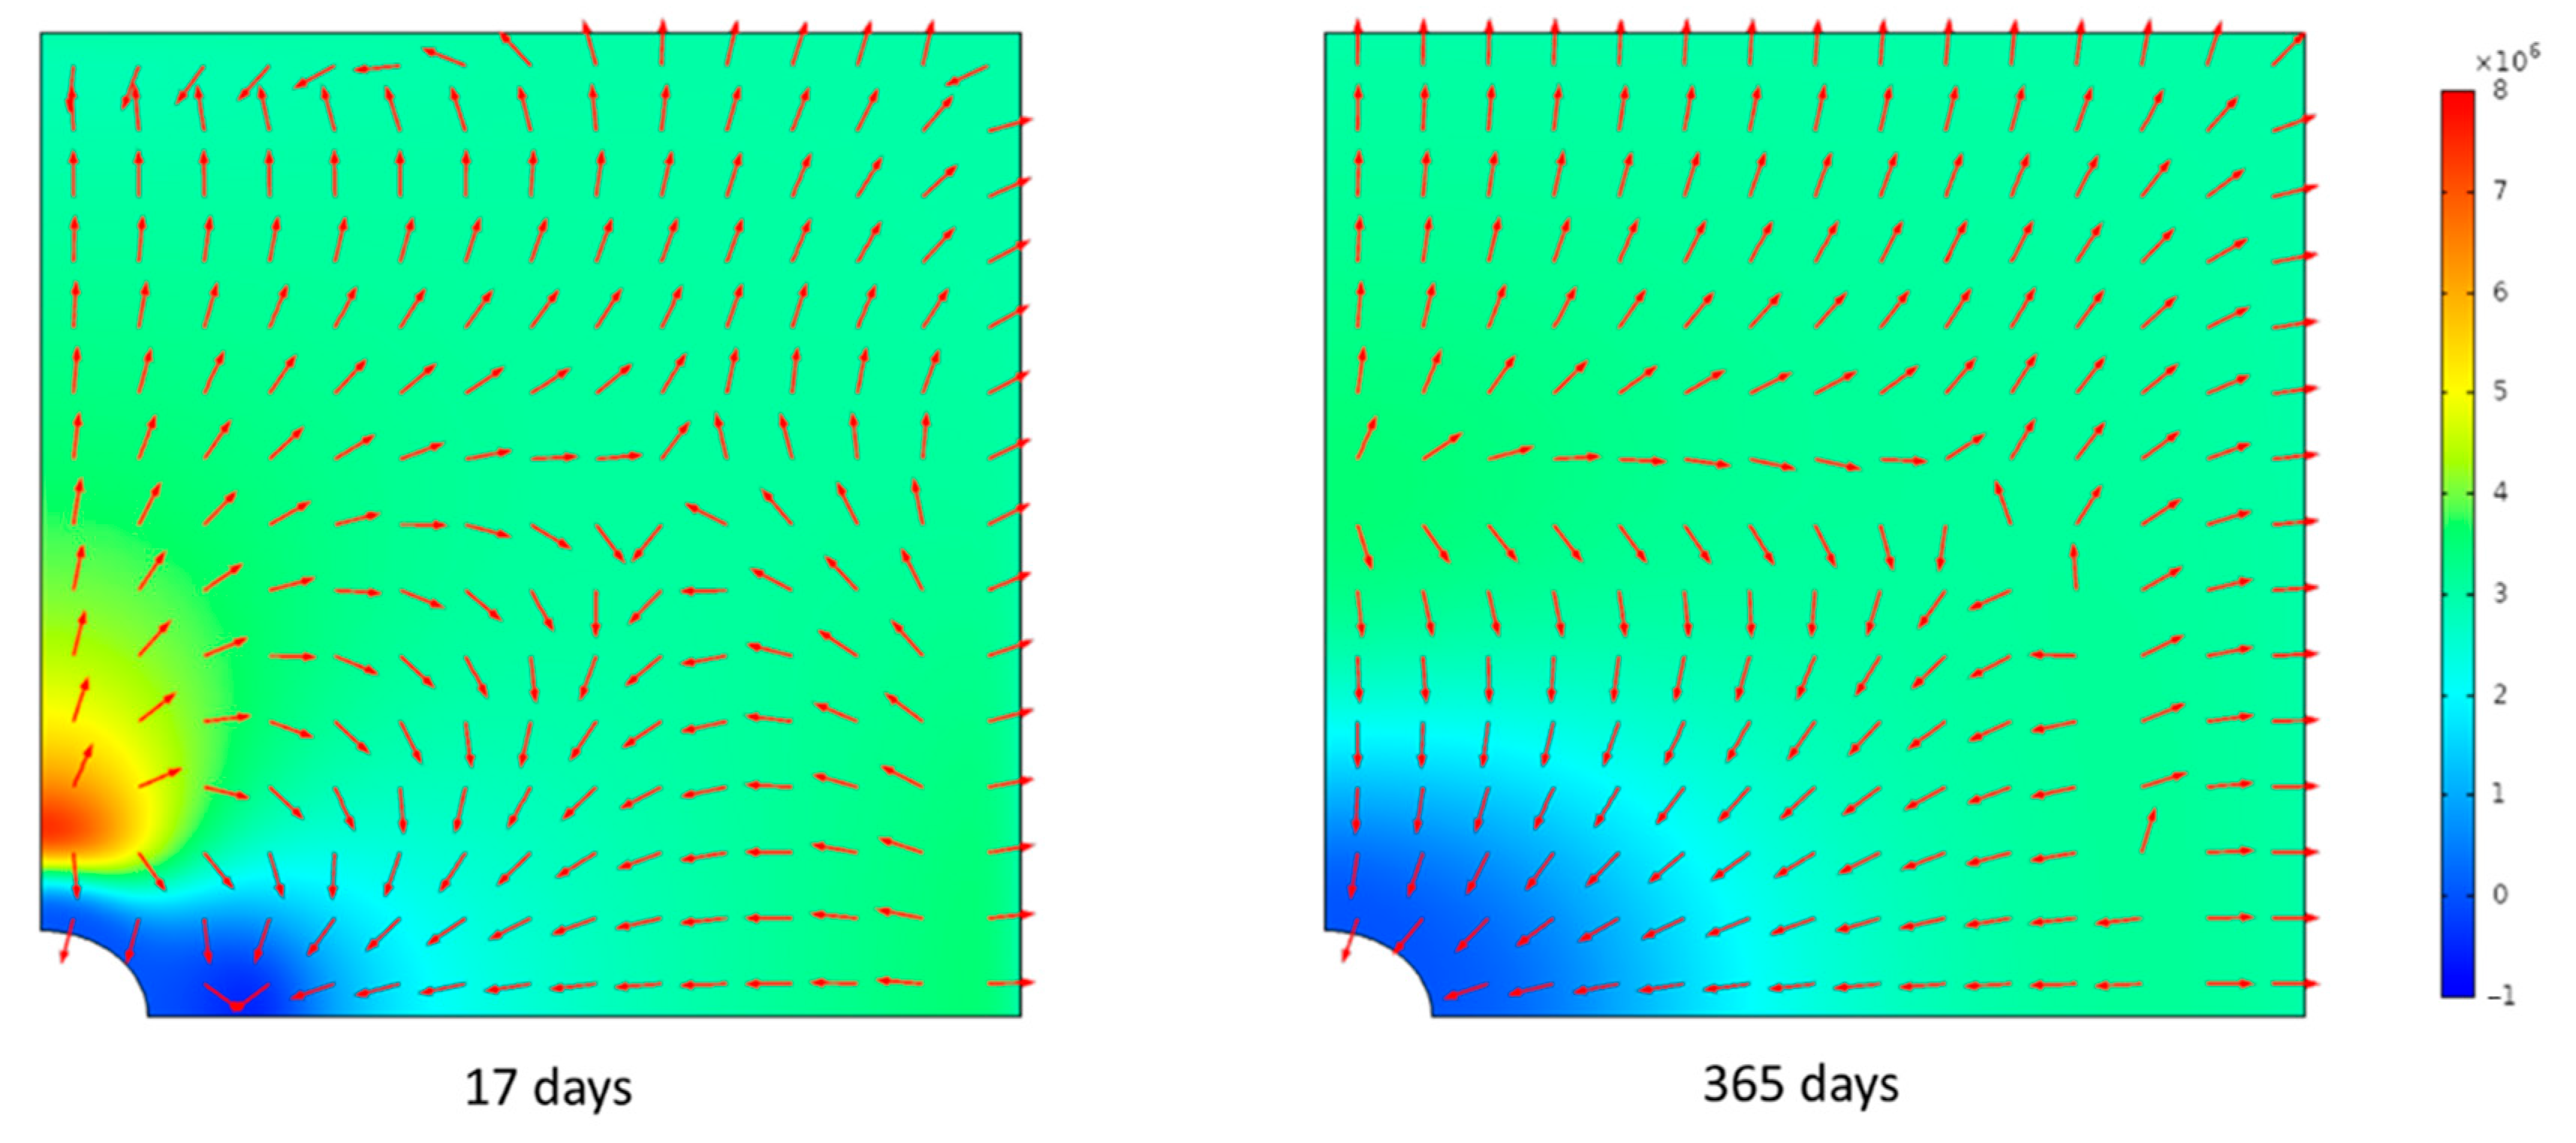
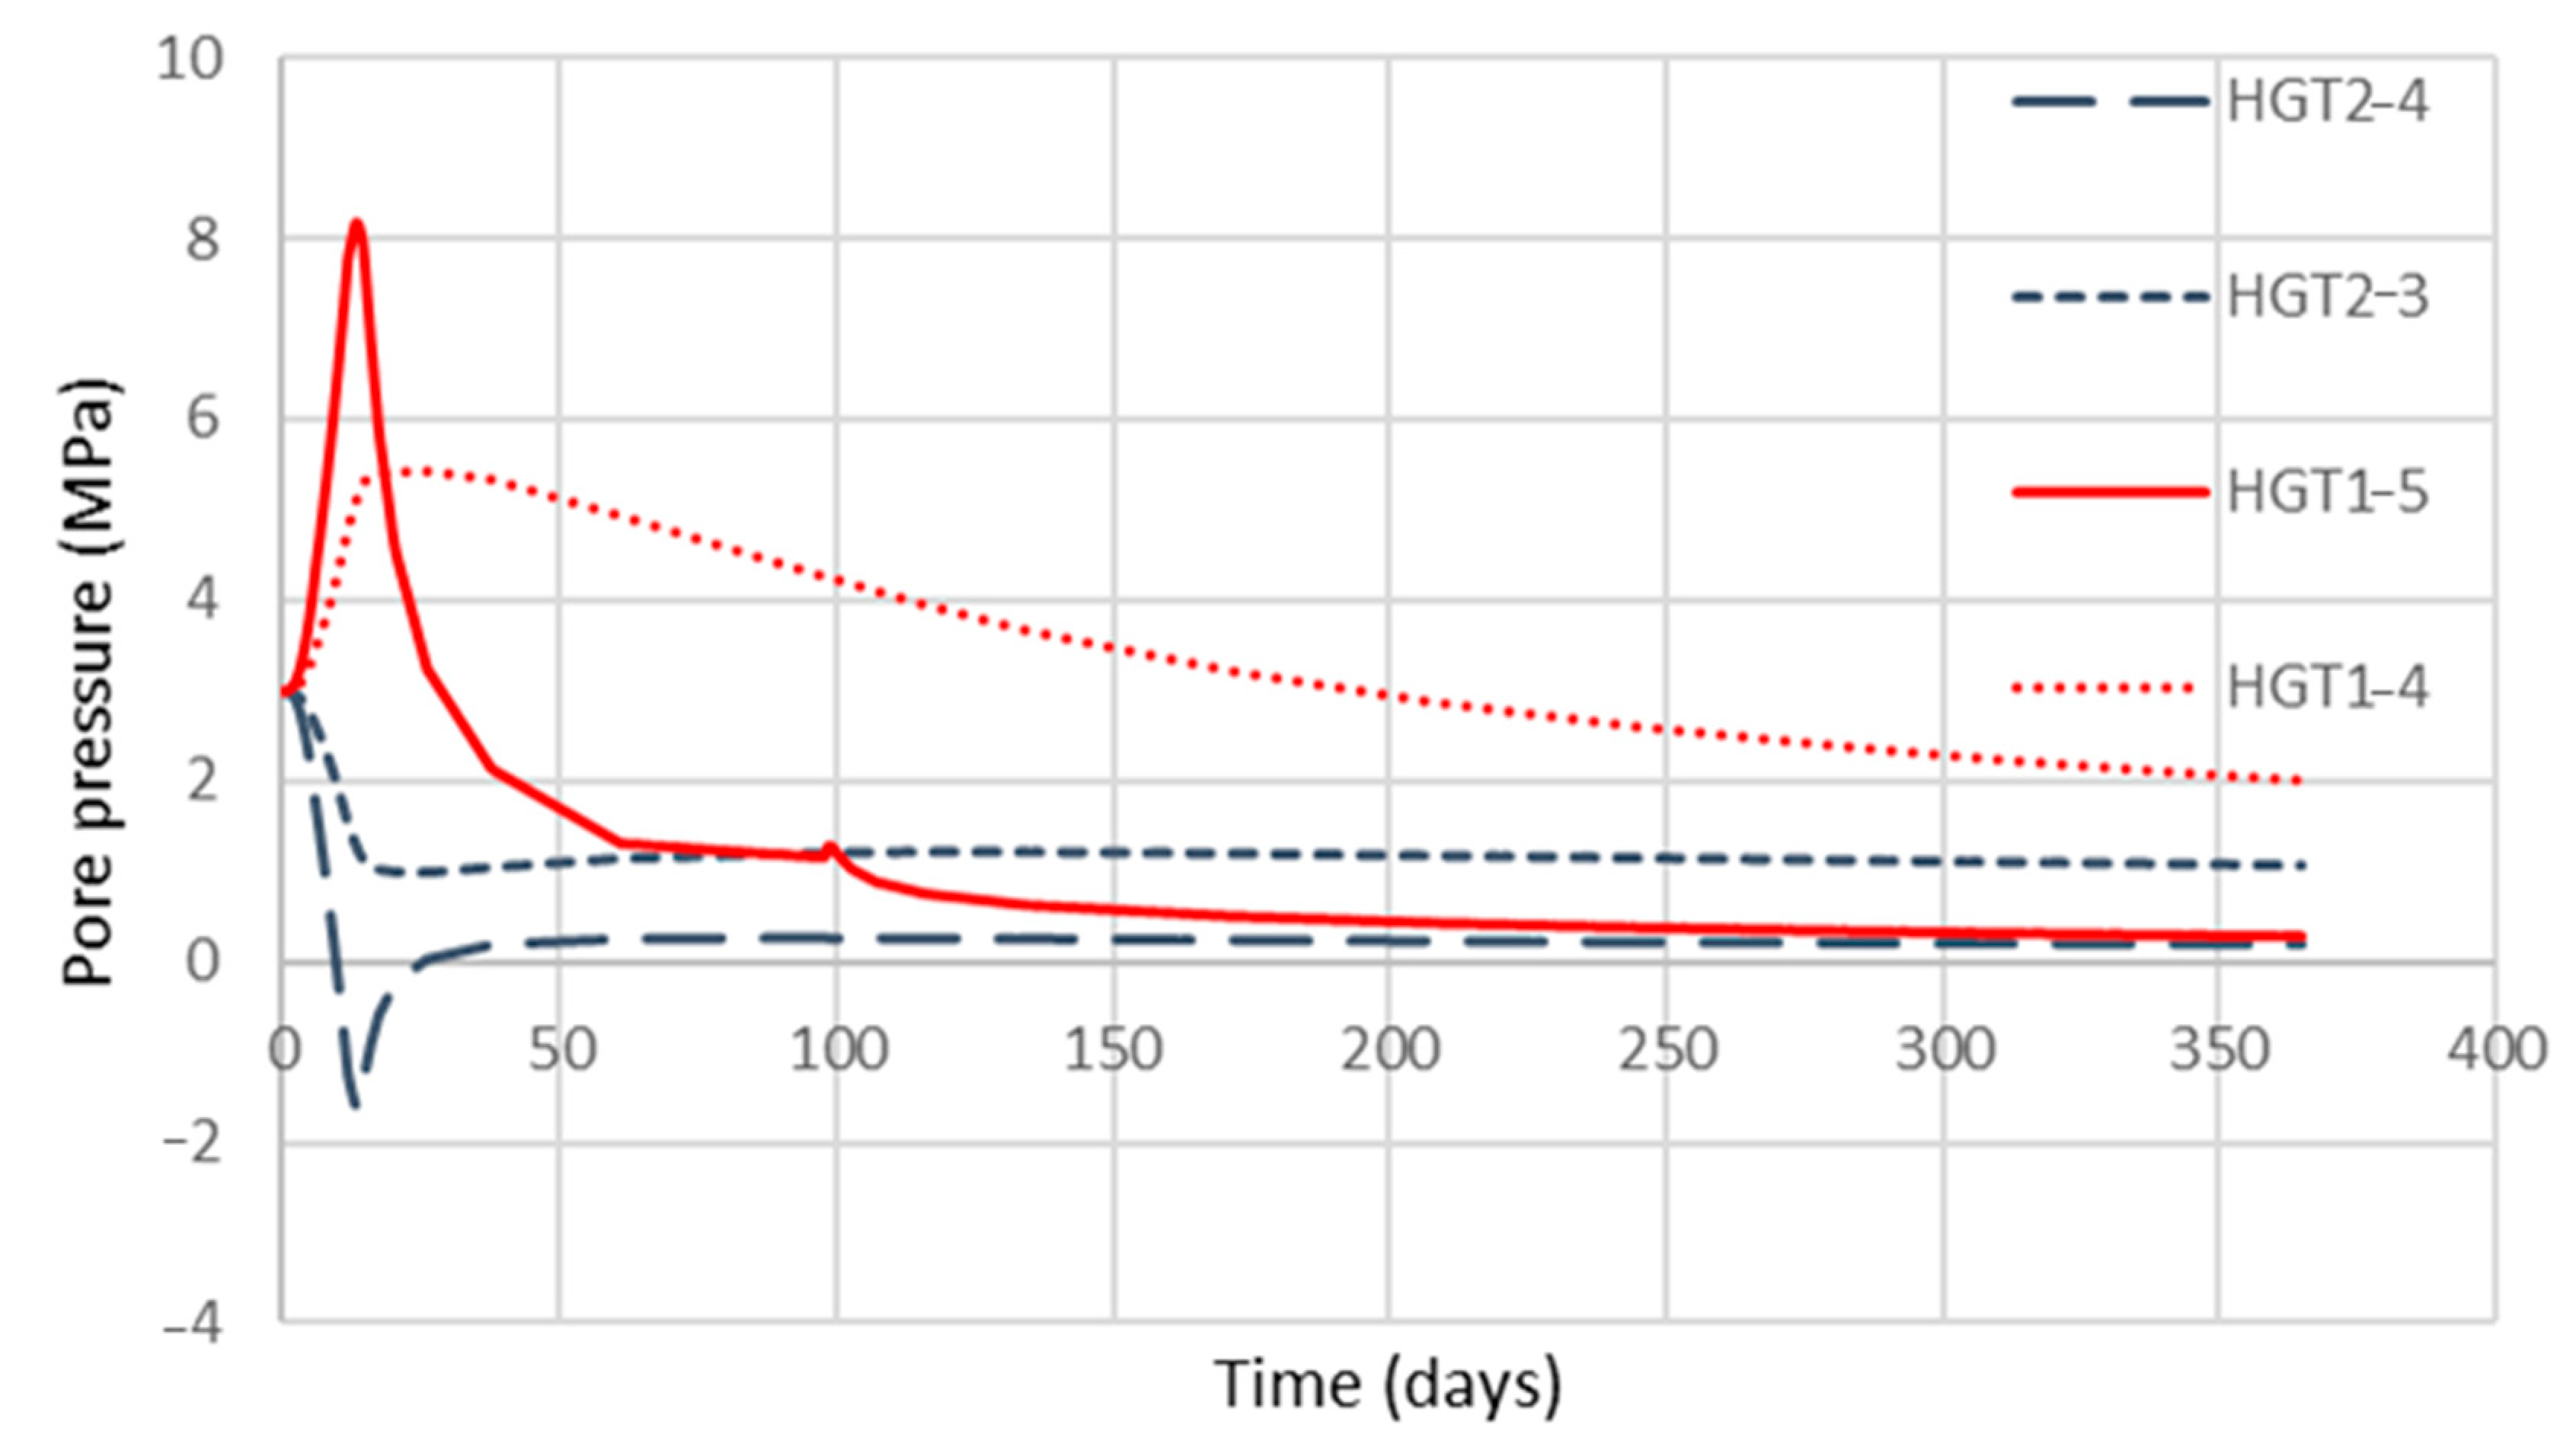
The simulated pore pressure distribution and groundwater flow field are shown in Figure 16, at 17 days and 365 days. Excavation of the tunnel creates a hydraulic sink that draws water towards it. In addition to the sink effects, poromechanical factors also influence the hydraulic regime. The model correctly simulates the coupled mechanical hydraulic response of the rock mass to excavation. Because the horizontal stress is larger than the vertical stress, the sides of the tunnel would undergo tension, and the roof and floor would be in compression. These states of stress result in a pressure increase along the roof and a pressure decrease along the sides; this early time pressure increase and decrease would slowly dissipate to reach a steady state condition in the long term. The simulated pore pressure evolution at monitoring points HGT1-4, HGT1-5, HGT2-3 and HGT2-4 (cf. Figure 12a) is shown in Figure 17. The agreement between the simulated results and the measured values (cf. Figure 12b) are good, both in values and trends.
6. Conclusions
In this study, past research on the mechanical behaviour of intact crystalline rock was reviewed, with particular emphasis on a Canadian granite, the LdB granite. This rock has been extensively studied by AECL while operating an URL until the year 2002. These studies come to a general consensus that the progressive damage and ultimate failure of intact LdB granite originate from the formation, propagation and coalescence of microcracks and flaws in the microstructure of the rock. These studies also point to three stress levels: the crack initiation at which microcracks form; the crack damage level, where the cracks propagate in an unstable manner and start to coalesce; and the peak stress level, where failure of the rock occurs in an abrupt manner. There is also a consensus that the peak stress as attained in laboratory compression tests, is an artifact of loading rate, apparatus stiffness and sample scale and is not indicative of the true strength of the rock. It was hypothesized that the true strength of the rock is at the damage level. However, field excavation tests at the Canadian URL indicate that failure of the rock occurs at stress level even below the crack damage level. From a critical review of past laboratory compression tests and in-situ excavation tests at the URL, a constitutive model of the mechanical behaviour of LdB granite has been developed within the framework of elastoplasticity. The model considers the crack damage level as the ultimate strength of the material and uses the concept of asynchronous degradation of cohesion and mobilization of friction. In addition, time-degradation of the strength to a level between the crack initiation and crack damage level is included in the constitutive model. The model was used to simulate laboratory compression tests and creep tests with good agreement between the modelling results and the experimental data. The constitutive model was implemented in a coupled hydro-mechanical model to simulate the response of LdB to excavation of a test tunnel at a depth of 420 m at the URL. The model successfully reproduced the extent and characteristics of the EDZ around this tunnel, as well as the hydraulic response of the rock.
A DGR for the disposal of radioactive waste located in crystalline rock formation, in addition to the engineered components, relies on the rock to contain and isolate the waste for very long periods of time. The hydro-mechanical behaviour of the rock needs to be understood in order to ensure that the rock would fulfill the above safety functions. Rock mass at the depth of a typical DGR would in general comprise intact rock, discrete fractures, and fault zones. This paper focuses on the effects of excavation on the hydro-mechanical behaviour of intact rock. Proponents of geological disposal would also have to assess the effects on the safety functions of the rock due to expected perturbations such as heat generated from the waste and future geological events (e.g., glaciation, earthquakes, when applicable). This assessment should be conducted not only for intact rock but also for individual fractures, for rock mass with ubiquitous fractures and for fault zones that might exist in the vicinity of the DGR. Steps in that research direction have been taken in the past for a generic DGR in crystalline rocks. Proponents of geological disposal in crystalline rocks should conduct studies on the above aspects for the site-specific conditions of a proposed DGR and integrate the results of the studies in the safety assessment and design of the proposed facility.
Funding
This research received no external funding.
Data Availability Statement
The data presented in this study are available on request from the Canadian Nuclear Safety Commission.
Conflicts of Interest
The author declares no conflict of interest.
References
- POSIVA. Safety Case for the Disposal of Spent Nuclear Fuel at Olkiluoto—Synthesis 2012. POSIVA 2012-12 Report. 2012. Available online: http://www.posiva.fi/files/2987/Posiva_2012-12web.pdf (accessed on 1 October 2020).
- SKB. Long Term Safety for the Final Repository for Spent Nuclear Fuel at Forsmark—Main Report of the SR-Site Project Volume I. SKB TR-11-01 Report. 2011. Available online: https://www.skb.com/future-projects/the-spent-fuel-repository/our-applications/ (accessed on 1 October 2020).
- Nuclear Waste Management Organization (NWMO). Implementing Adaptive Phased Management 2020 to 2024. NWMO Report. 2020. Available online: https://www.nwmo.ca/en/Reports (accessed on 1 October 2020).
- International Atomic Energy Agency (IAEA). Geological Disposal Facility for Radioactive Waste. Specific Safety Guide SSG-14. 2011. Available online: https://www-pub.iaea.org/MTCD/Publications/PDF/Pub1483_web.pdf (accessed on 1 October 2020).
- NWMO. Deep Geological Repository Conceptual Design Report Crystalline/Sedimentary Rock Environment. NWMO Report APM-REP-00440-0015 R001. 2016. Available online: https://www.nwmo.ca/en/Reports (accessed on 1 October 2020).
- Nguyen, T.S.; Li, Z.; Su, G.; Nasseri, H.B.; Young, R.P. Hydro-mechanical behavior of an argillaceous limestone considered as a potential host formation for radioactive waste disposal. J. Rock Mech. Geotech. Eng. 2018, 10, 1063–1081. [Google Scholar] [CrossRef]
- Selvadurai, A.P.S.; Giowacki, A. Estimate for the local permeability of the Cobourg limestone. J. Rock Mech. Geotech. Eng. 2018, 10, 1009–1019. [Google Scholar] [CrossRef]
- Chandler, N.A. Twenty years of underground research at Canada’s URL. In Proceedings of the WM’03 Conference, Tucson, AZ, USA, 23–27 February 2003. [Google Scholar]
- Chandler, N.; Guo, R.; Read, R. (Eds.) Rock Mechanics Results from the Underground Research Laboratory, Canada. Int. J. Rock Mech. Min. Sci. 2004, 41, 1221–1458. [Google Scholar]
- Selvadurai, A.P.S.; Blain-Coallier, A.; Selvadurai, P.A. Estimates for the Effective permeability of intact granite obtained from the Eastern and western flanks of the Canadian Shield. Minerals 2020, 10, 667. [Google Scholar] [CrossRef]
- Lau, J.S.O.; Gorski, B. The Post Failure Behaviour of Lac du Bonnet Granite; CANMET divisional report MRL 91-079 (TR); Department of Energy, Mines and Resources: Ottawa, ON, Canada, 1991. [Google Scholar]
- Lau, J.S.O.; Chandler, N.A. Innovative laboratory testing. Int. J. Rock Mech. Min. Sci. 2004, 41, 1251–1275. [Google Scholar] [CrossRef]
- Martino, J.B.; Chandler, N.A. Excavation-induced damage studies at the Underground Research Laboratory. Int. J. Rock Mech. Min. Sci. 2004, 41, 1427–1445. [Google Scholar] [CrossRef]
- Read, R.S. 20 years of excavation response studies at AECL’s Underground Research Laboratory. Int. J. Rock Mech. Min. Sci. 2004, 41, 1413–1426. [Google Scholar] [CrossRef]
- Nguyen, T.S.; Selvadurai, A.P.S. Coupled thermal-mechanical-hydrological behaviour of sparsely fractured rock: Implications for nuclear fuel waste disposal. Int. J. Rock Mech. Min. Sci. Geomech. Abstr. 1995, 32, 465–480. [Google Scholar] [CrossRef]
- Nguyen, T.S.; Selvadurai, A.P.S. A model for coupled mechanical and hydraulic behaviour of a rock joint. Int. J. Numer. Anal. Methods Geomech. 1998, 22, 29–48. [Google Scholar] [CrossRef]
- Peltier, W.R. Long-Term Climate Change; Report NWMO DGR-TR-2011-14 R000; NWMO: Toronto, ON, Canada, 2011. [Google Scholar]
- Nasir, O.; Fall, M.; Nguyen, T.S.; Evgin, E. Modelling of the hydro-mechanical response of sedimentary rocks of southern Ontario to past glaciations. Eng. Geol. 2011, 123, 271–287. [Google Scholar] [CrossRef]
- Canadian Nuclear Safety Commission. CNSC Research on Geological Repositories. 2017. Available online: http://nuclearsafety.gc.ca/eng/waste/cnsc-research/geologic-repositories/#seca (accessed on 1 October 2020).
- Akesson, U. Characterisation of Micro Cracks Caused by Core Disking; SKB Report P-08-103; Swedish Nuclear Fueland Waste Management Co.: Stockholm, Sweden, 2008. [Google Scholar]
- Berry, J.P. Some kinetic considerations of the Griffith criterion for fracture I: Equations of motion at constant force. J. Mech. Phys Solids 1960, 8, 194–206. [Google Scholar] [CrossRef]
- Cook, N.G.W. The failure of rock. Int. J. Rock Mech. Min. Sci. Geomech. Abstr. 1965, 2, 389–403. [Google Scholar] [CrossRef]
- Brace, W.F. Brittle Fracture of rocks. In State of Stress in the Earth’s Crust; Judd, W.R., Ed.; American Elsevier Publishing Company: New York, NY, USA, 1964. [Google Scholar]
- Bieniawski, Z.T. Mechanisms of brittle fracture of rocks, parts I-theory of the fracture process. Int. J. Rock Mech. Min. Sci. Geomech. Abstr. 1967, 4, 395–404. [Google Scholar] [CrossRef]
- Bieniawski, Z.T. Mechanisms of brittle fracture of rocks, parts II-experimental studies. Int. J. Rock Mech. Min. Sci. Geomech. Abstr. 1967, 4, 407–408. [Google Scholar] [CrossRef]
- Bieniawski, Z.T. Mechanisms of brittle fracture of rocks, parts III-fracture in tension and under long-term loading. Int. J. Rock Mech. Min. Sci. Geomech. Abstr. 1967, 4, 425–426. [Google Scholar] [CrossRef]
- Martin, C.D. The Strength of Massive Lac du Bonnet Granite around Underground Openings. Ph.D. Thesis, Department of Civil Engineering, University of Manitoba, Winnipeg, MB, Canada, 1993. [Google Scholar]
- Martin, C.D.; Chandler, N.A. The progressive fracture of Lac du Bonnet granite. Int. J. Rock Mech. Min. Sci. Geomech. Abstr. 1994, 31, 643–659. [Google Scholar] [CrossRef]
- Eberhardt, E.; Stead, D.; Stimpson, B.; Read, E.S. Identifying crack initiation and propagation thresholds in brittle rock. Can. Geotech. J. 1998, 35, 222–233. [Google Scholar] [CrossRef]
- Lan, H.; Martin, C.D.; Hu, B. Effect of heterogeneity of brittle rock on micromechanical extensile behavior during compression loading. J. Geophys. Res. 2010, 115, 1–14. [Google Scholar] [CrossRef]
- Hoek, E.; Martin, C.D. Fracture initiation and propagation in intact rock—A review. J. Rock Mech. Geotech. Eng. 2014, 6, 287–300. [Google Scholar] [CrossRef] [Green Version]
- Griffith, A.A. The phenomena of rupture and flow in solids. Phil. Trans. Royal Soc. Lond. 1921, 221, 163–198. [Google Scholar]
- Martin, C.D.; Christiansson, R. Estimating the potential for spalling around a deep nuclear waste repository in crystalline rock. Int. J. Rock Mech. Min. Sci. Geomech. Abstr. 2009, 46, 219–228. [Google Scholar] [CrossRef]
- Schmidtke, R.H.; Lajtai, E.Z. The long-term strength of Lac du Bonnet granite. Int. J. Rock Mech. Min. Sci. Geomech. Abstr. 1985, 22, 461–465. [Google Scholar] [CrossRef]
- Damjanac, B.; Fairhurst, C. Evidence for a long term strength threshold in crystalline rock. Rock Mech. Rock Eng. 2010, 43, 513–531. [Google Scholar] [CrossRef]
- Hajiabdolmajid, V.; Kaiser, P.K.; Martin, C.D. Modelling brittle failure of rock. J. Rock Mech. Min. Sci. 2002, 39, 731–741. [Google Scholar] [CrossRef]
- Patel, S.; Martin, C.D. Effect of stress path on the failure envelope of intact crystalline rock at low confining stress. Minerals 2020, 10, 1119. [Google Scholar] [CrossRef]
- Duevel, B.; Haimson, B. Mechanical characterization of pink Lac du Bonnet granite: Evidence of nonlinearity and anisotropy. Int. J. Rock Mech. Min. Sci. 1997, 34, 117-e1–117.e18. [Google Scholar] [CrossRef]
- Ghazvinian, E. Fracture Initiation and Propagation in Low Porosity Crystalline Rocks: Implications for Excavation Damage Zone (EDZ) Mechanics. Ph.D. Thesis, Queen’s University, Kingston, ON, Canada, 2015. [Google Scholar]
- Ghazvinian, E.; Diederichs, M.S.; Labrie, D.; Martin, C.D. An investigation on the fabric type dependency of the crack damage thresholds in brittle rocks. Geotech. Geol. Eng. 2015, 33, 1409–1429. [Google Scholar] [CrossRef]
- Ghazvinian, E.; Perras, M.; Langford, C.; Diederichs, M.; Labrie, D. A comprehensive investigation of crack damage anisotropy in Cobourg limestone and its effect on the failure envelope. In Proceedings of the GeoMontreal 2013, 66th Canadian Geotechnical Society Conference, Montreal, QC, Canada, 29 September–3 October 2013. [Google Scholar]
- Chandler, N.; Cournut, A.; Dixon, D.; Fairhurst, C.; Hansen, F.; Gray, M.; Hara, K.; Ishijima, Y.; Kozak, E.; Martino, J.; et al. The Five-Year Report on the Tunnel Sealing Experiment: An International Project of AECL, JNC, ANDARA and WIPP; AECL Whiteshell Laboratories: Pinawa, MB, Canada, 2002; AECL-12127. [Google Scholar]
- Mahyari, A.T.; Selvadurai, A.P.S. Enhanced consolidation in brittle geomaterials susceptible to damage. Mech. Coh-Frict. Mat. 1998, 3, 291–303. [Google Scholar] [CrossRef]
- Souley, M.; Homand, F.; Pepa, S.; Hoxha, D. Damage-induced permeability changes in granite: A case example at the URL in Canada. Int. J. Rock Mech. Min. Sci. 2001, 38, 297–310. [Google Scholar] [CrossRef]
- Shirazi, A.; Selvadurai, A.P.S. Lateral loading of a rigid rock socket embedded in a damage susceptible poroelastic solid. Int. J. Geomech. 2005, 5, 276–285. [Google Scholar] [CrossRef]
Figure 1.
Stages in the progressive failure of intact rock specimens subjected to compressive loading (adapted from [27,28,31]). (a) stress-strain evolution: cracks start to initiate at the crack initiation level accompanied by permanent strain. The crack damage is the true strength of the sample. The acoustic emission counts substantially increase after the crack damage level. (b) microcrack evolution: the crack formation, coalescence and formation of macrofracture are illustrated at different loading stages.

Figure 2.
The crack initiation, crack damage and peak strength envelopes for Lac du Bonnet (LdB) granite (adapted from [31]).
Figure 2.
The crack initiation, crack damage and peak strength envelopes for Lac du Bonnet (LdB) granite (adapted from [31]).

Figure 3.
Evolution of peak strength, crack initiation, crack damage stresses and Young’s modulus from uniaxial compression test on LdB granite (adapted from [12]).
Figure 3.
Evolution of peak strength, crack initiation, crack damage stresses and Young’s modulus from uniaxial compression test on LdB granite (adapted from [12]).

Figure 4.
Evolution of cohesion and friction angle of LdB granite in uniaxial compression tests: (a) components of strength. Departure from elastic behaviour starts at the crack initiation level, with a cohesion loss accompanied by friction mobilization. The true strength is at the crack damage level. (b) Asynchronous cohesion loss and friction mobilization assumed in this study. Friction is also assumed to degrade with time.

Figure 5.
Finite element model for laboratory compression tests.

Figure 6.
Stress-strain-volume deformation of LdB granite in uniaxial compression test: (a) Axial stress vs. axial strain; (b) Volumetric strain vs. axial strain.
Figure 6.
Stress-strain-volume deformation of LdB granite in uniaxial compression test: (a) Axial stress vs. axial strain; (b) Volumetric strain vs. axial strain.

Figure 7.
Simulated evolution of cohesion and friction in uniaxial compression test: (a) Simulated evolution of cohesion; (b) Simulated evolution of friction.
Figure 7.
Simulated evolution of cohesion and friction in uniaxial compression test: (a) Simulated evolution of cohesion; (b) Simulated evolution of friction.

Figure 8.
Effects of confining pressure on stress-strain response in compression tests.

Figure 9.
Simulation of uniaxial creep test.

Figure 10.
Excavation Damage around the Tunnel Sealing Experiment (TSX) tunnel (adapted from Chandler et al. [42]).
Figure 10.
Excavation Damage around the Tunnel Sealing Experiment (TSX) tunnel (adapted from Chandler et al. [42]).

Figure 11.
S-Wave velocity and transmissivity around TSX tunnel (adapted from Chandler et al. [42]).
Figure 11.
S-Wave velocity and transmissivity around TSX tunnel (adapted from Chandler et al. [42]).

Figure 12.
Pore pressure response of the rock mass due to excavation of the TSX tunnel (adapted from Chandler et al. [42]). (a) TSX tunnel with pressure sensors. HGT1-5 and HGT2-4 are 1.5 m into the rock; HGT1-4 and HGT2-3 are at 4 m. (b) Measured pore pressure response. pore pressure increases in the roof area (HGT1-5 and HGT1-4) and decreases in the side area (HGT2-4 and HGT2-3).

Figure 13.
Finite element model, boundary and initial conditions for the TSX tunnel excavation.

Figure 14.
Simulated excavation damage zone around the TSX tunnel.

Figure 15.
Simulated permeability profile along TSX roof.

Figure 16.
Simulated pore pressure distribution and groundwater velocity field.

Figure 17.
Simulated pore pressure evolution.


Table 1.
Material properties for LdB granite used as input in mathematical simulation.
| Property | Input Value | Reference |
|---|---|---|
| Young’s modulus (GPa) | 48 | Figure 3 |
| Poisson’s ratio (adimensional) | 0.2 | Lau et al. [12] |
| Cohesion (MPa) | 20 (maximum), 5(residual) | Figure 4b |
| Friction (°) | 0 to 72—degrade to 67 in 365 days | Figure 4b |
| Dilation angle (°) | 40% of friction angle | Assumed |
| Tensile strength (Mpa) | 7.5 to 9 | Hoek and Martin [31] |
Publisher’s Note: MDPI stays neutral with regard to jurisdictional claims in published maps and institutional affiliations. |
© 2020 by the author. Licensee MDPI, Basel, Switzerland. This article is an open access article distributed under the terms and conditions of the Creative Commons Attribution (CC BY) license (http://creativecommons.org/licenses/by/4.0/).
Share and Cite
MDPI and ACS Style
Nguyen, T.S. Progressive Damage of a Canadian Granite in Laboratory Compression Tests and Underground Excavations. Minerals 2021, 11, 10. https://doi.org/10.3390/min11010010
AMA Style
Nguyen TS. Progressive Damage of a Canadian Granite in Laboratory Compression Tests and Underground Excavations. Minerals. 2021; 11(1):10. https://doi.org/10.3390/min11010010
Chicago/Turabian StyleNguyen, Thanh Son. 2021. "Progressive Damage of a Canadian Granite in Laboratory Compression Tests and Underground Excavations" Minerals 11, no. 1: 10. https://doi.org/10.3390/min11010010
Note that from the first issue of 2016, this journal uses article numbers instead of page numbers. See further details here.