The History of Transgressions during the Late Paleocene-Early Eocene in the Kuqa Depression, Tarim Basin: Constraints from C-O-S-Sr Isotopic Geochemistry


Abstract
:
1. Introduction
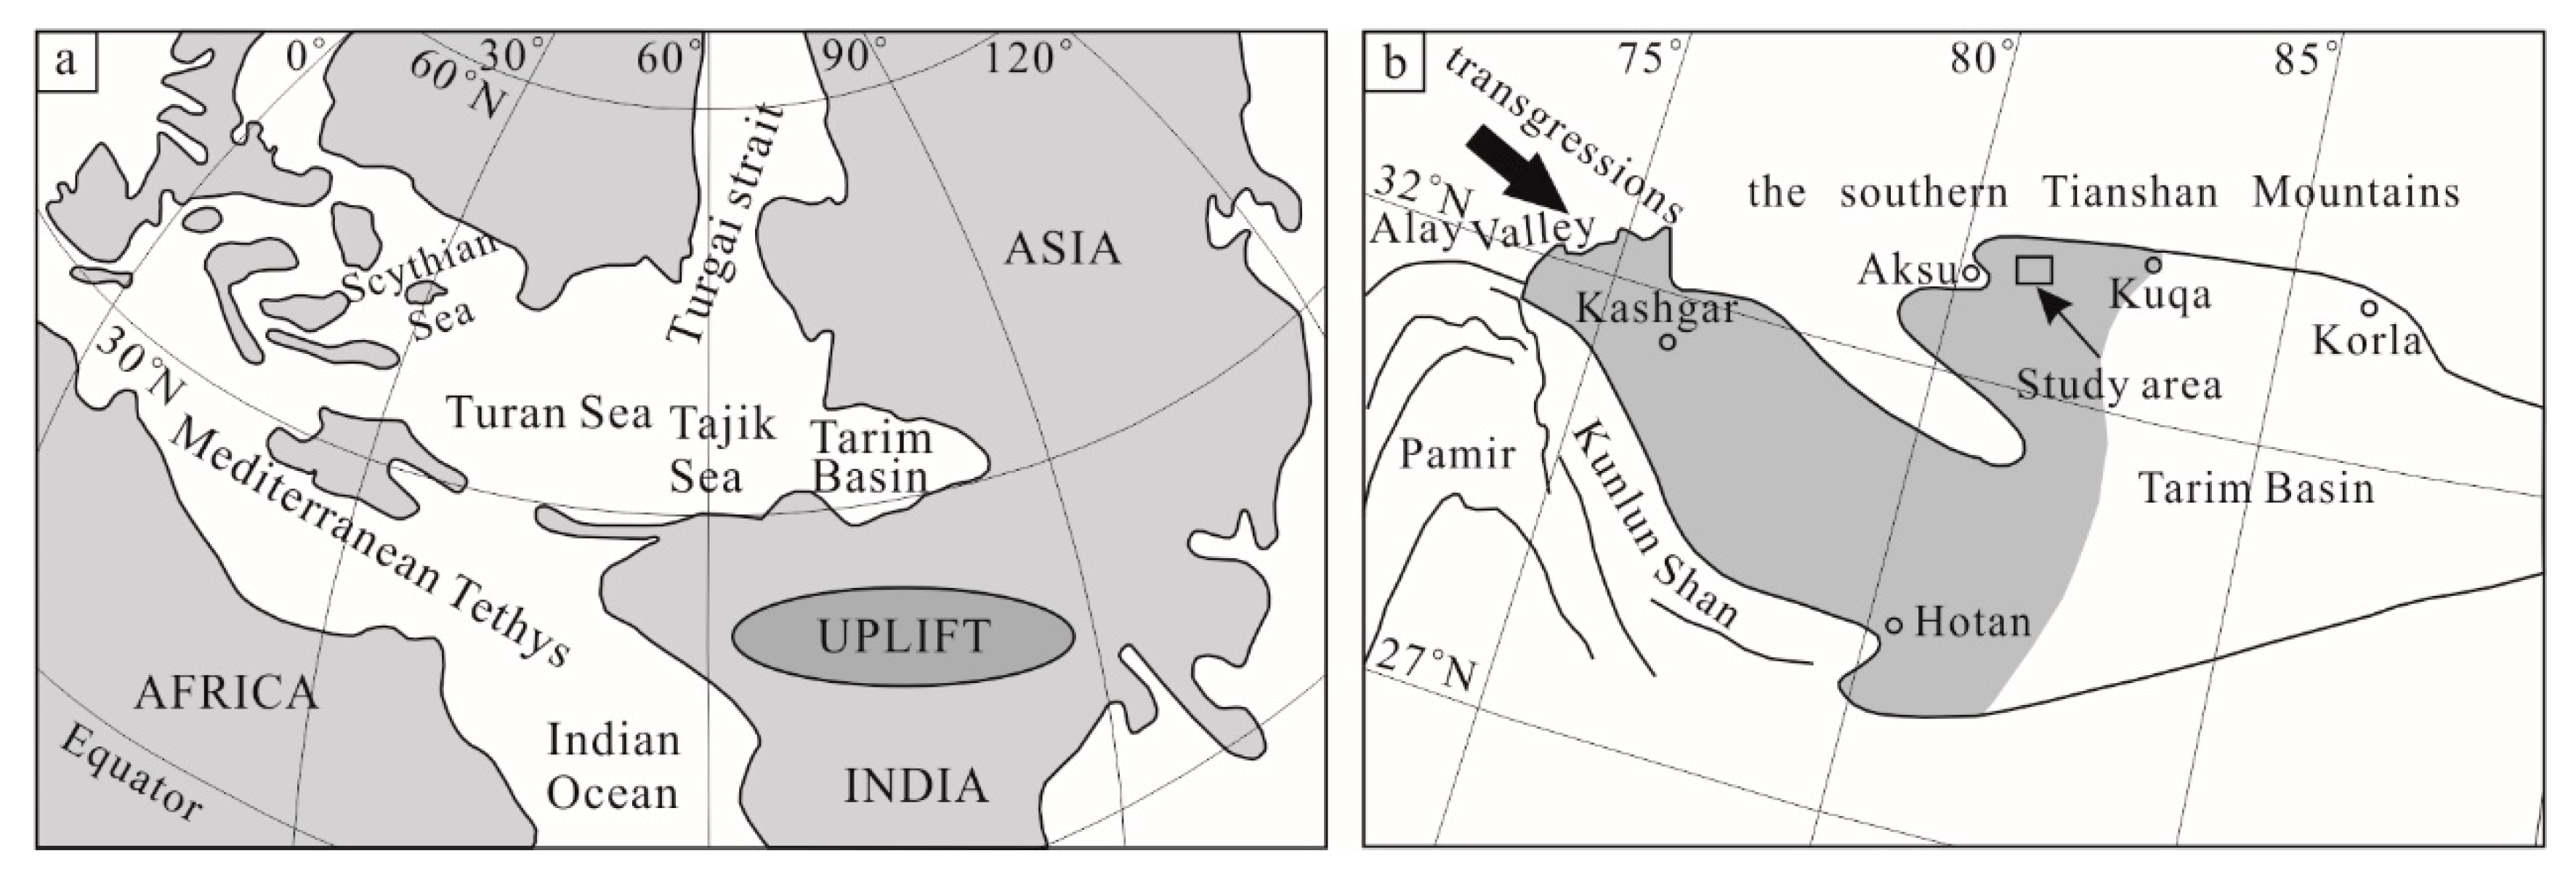
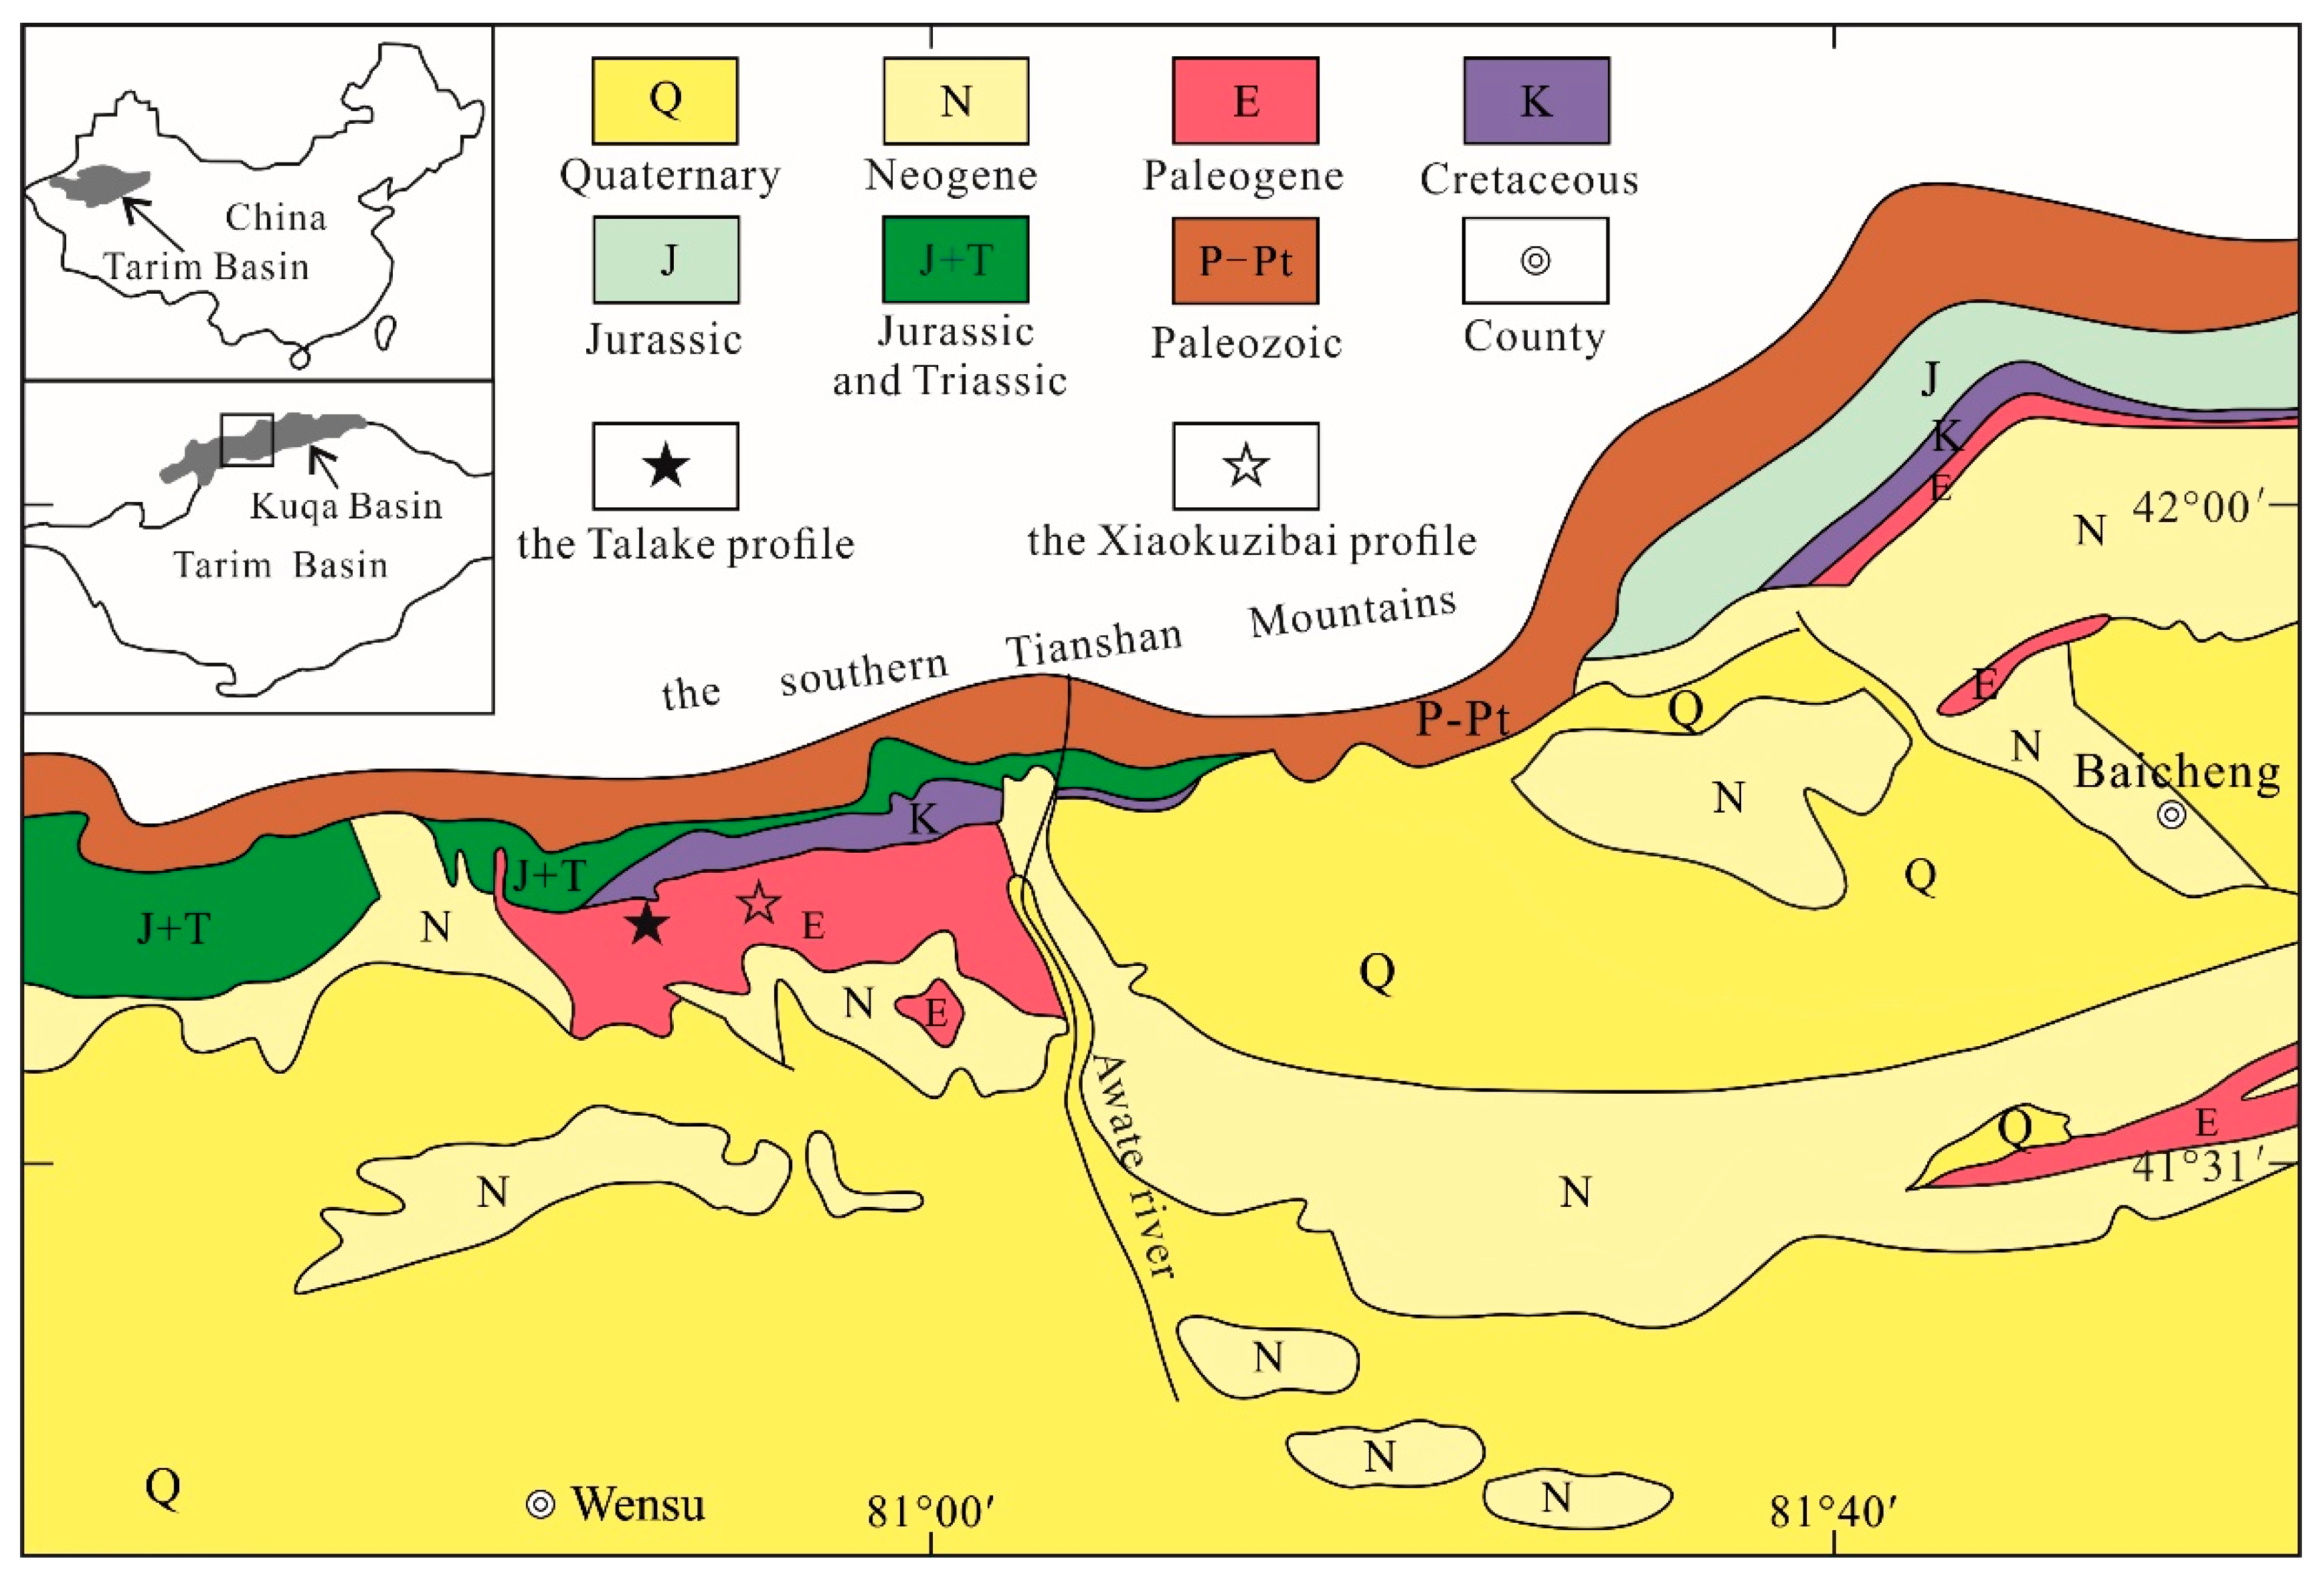
2. Geological Setting
3. Materials and Methods
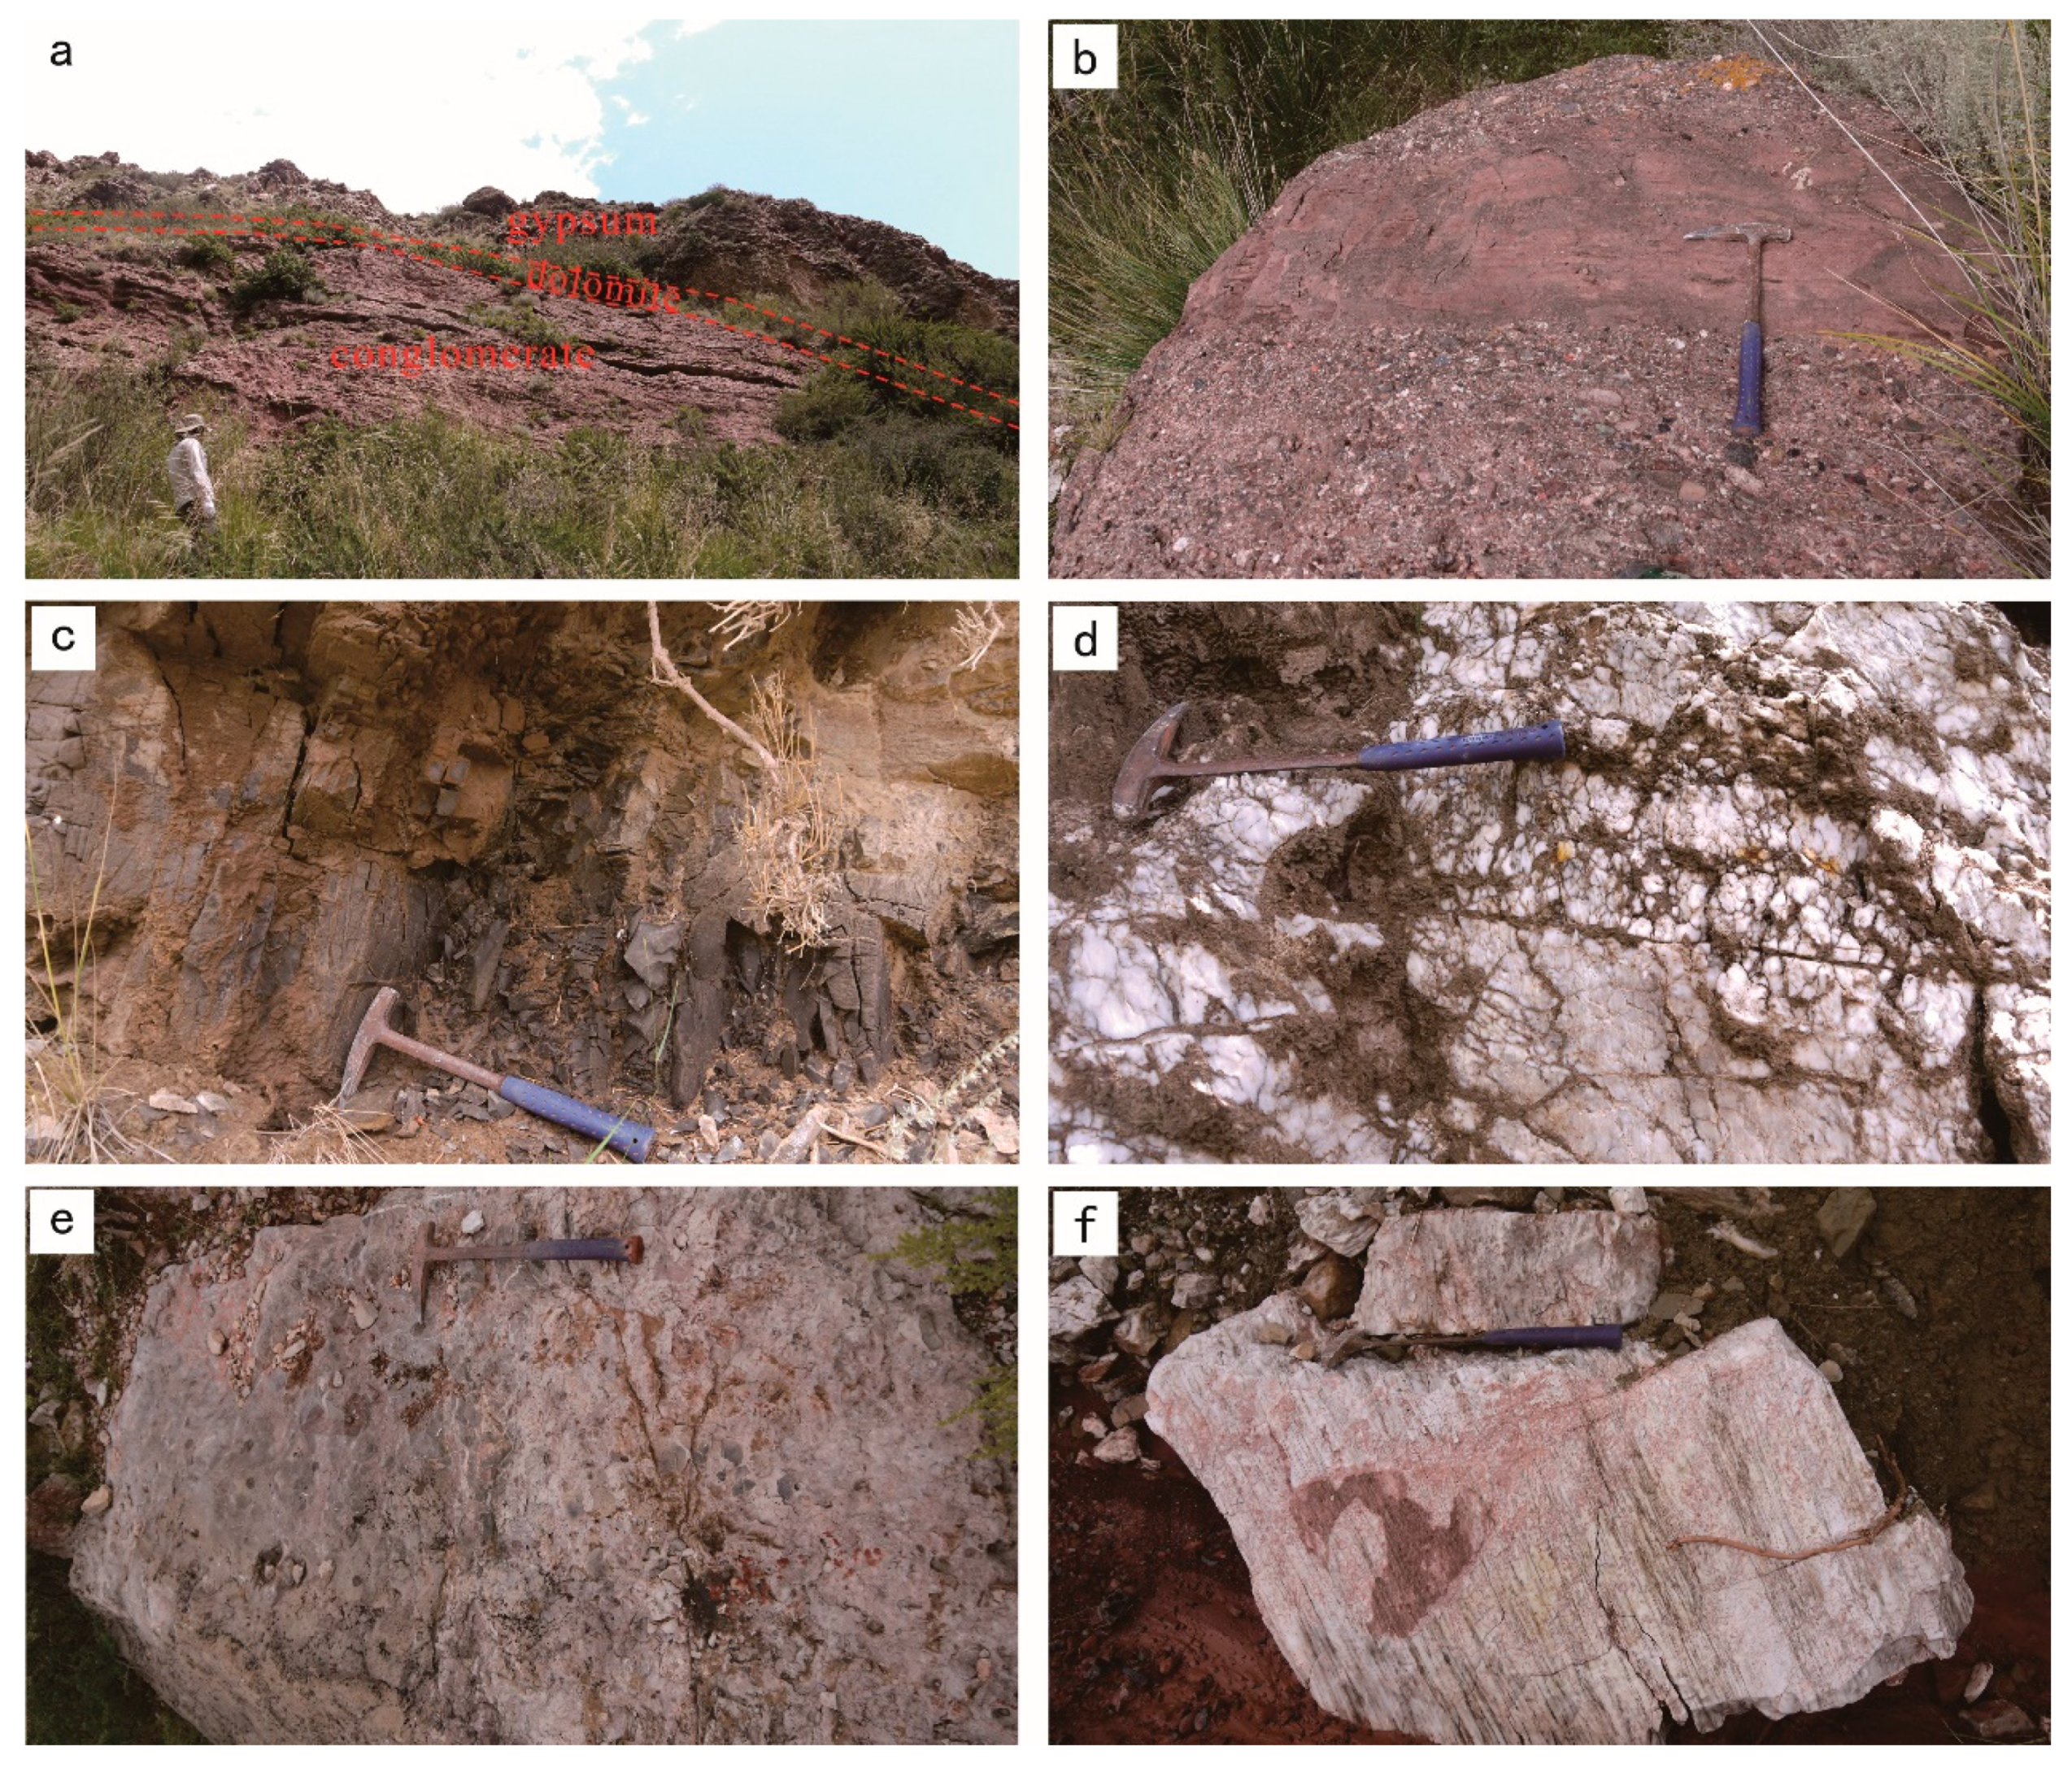
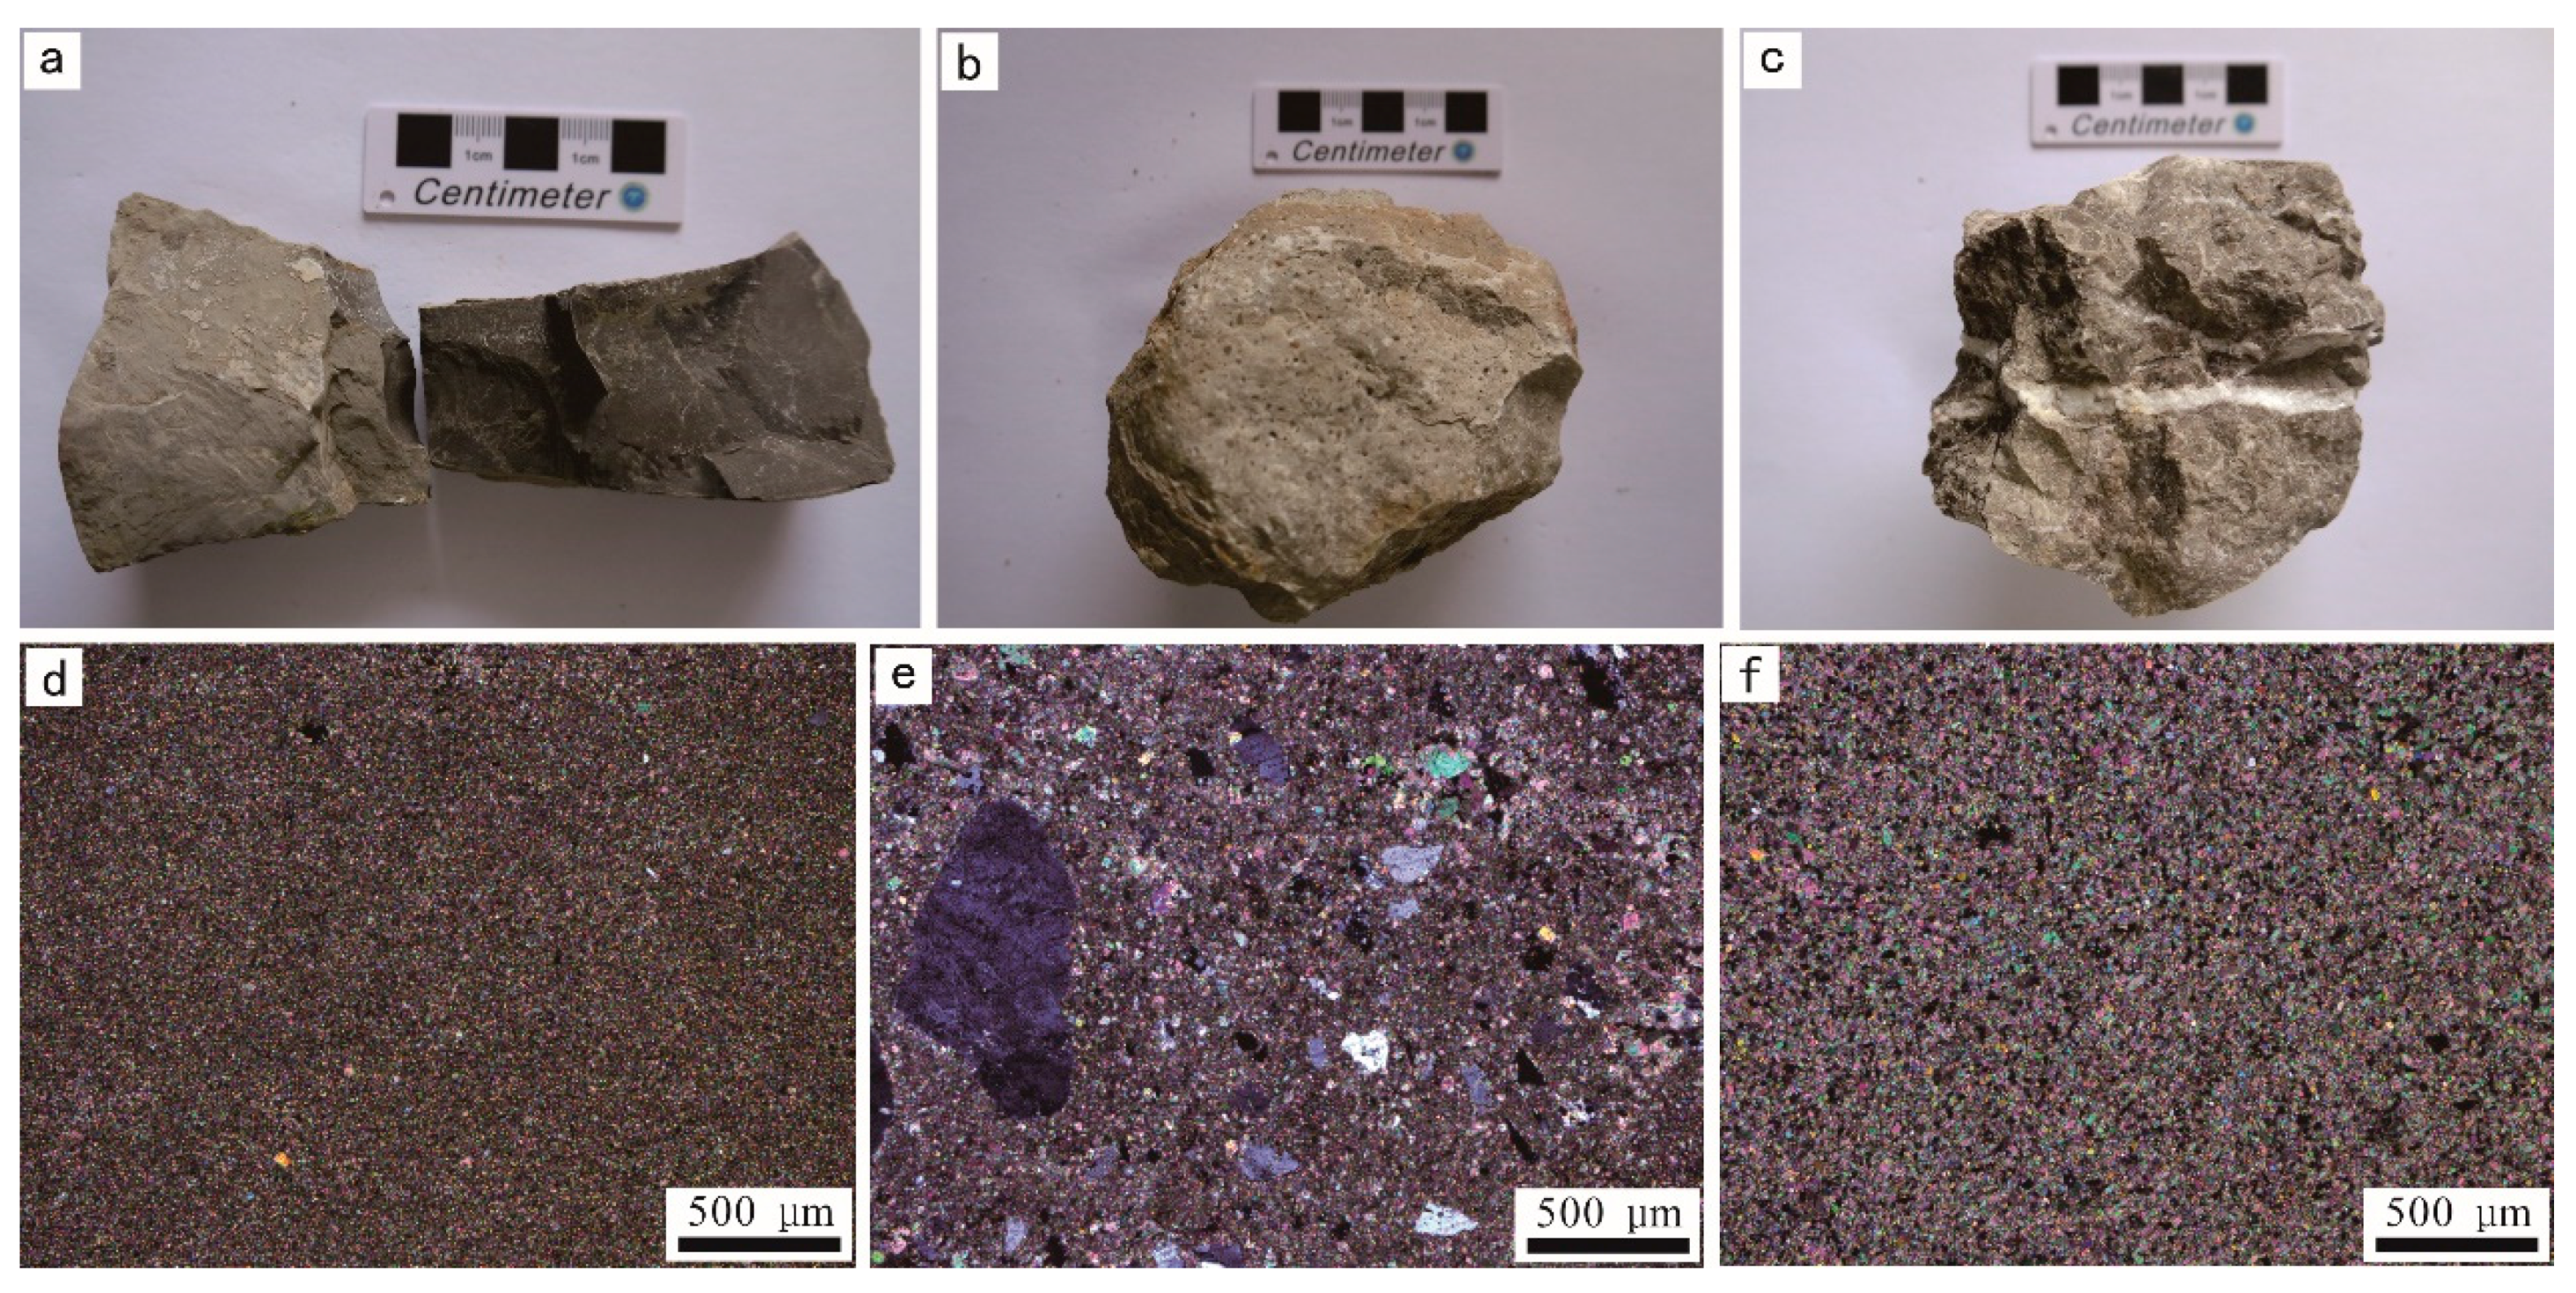
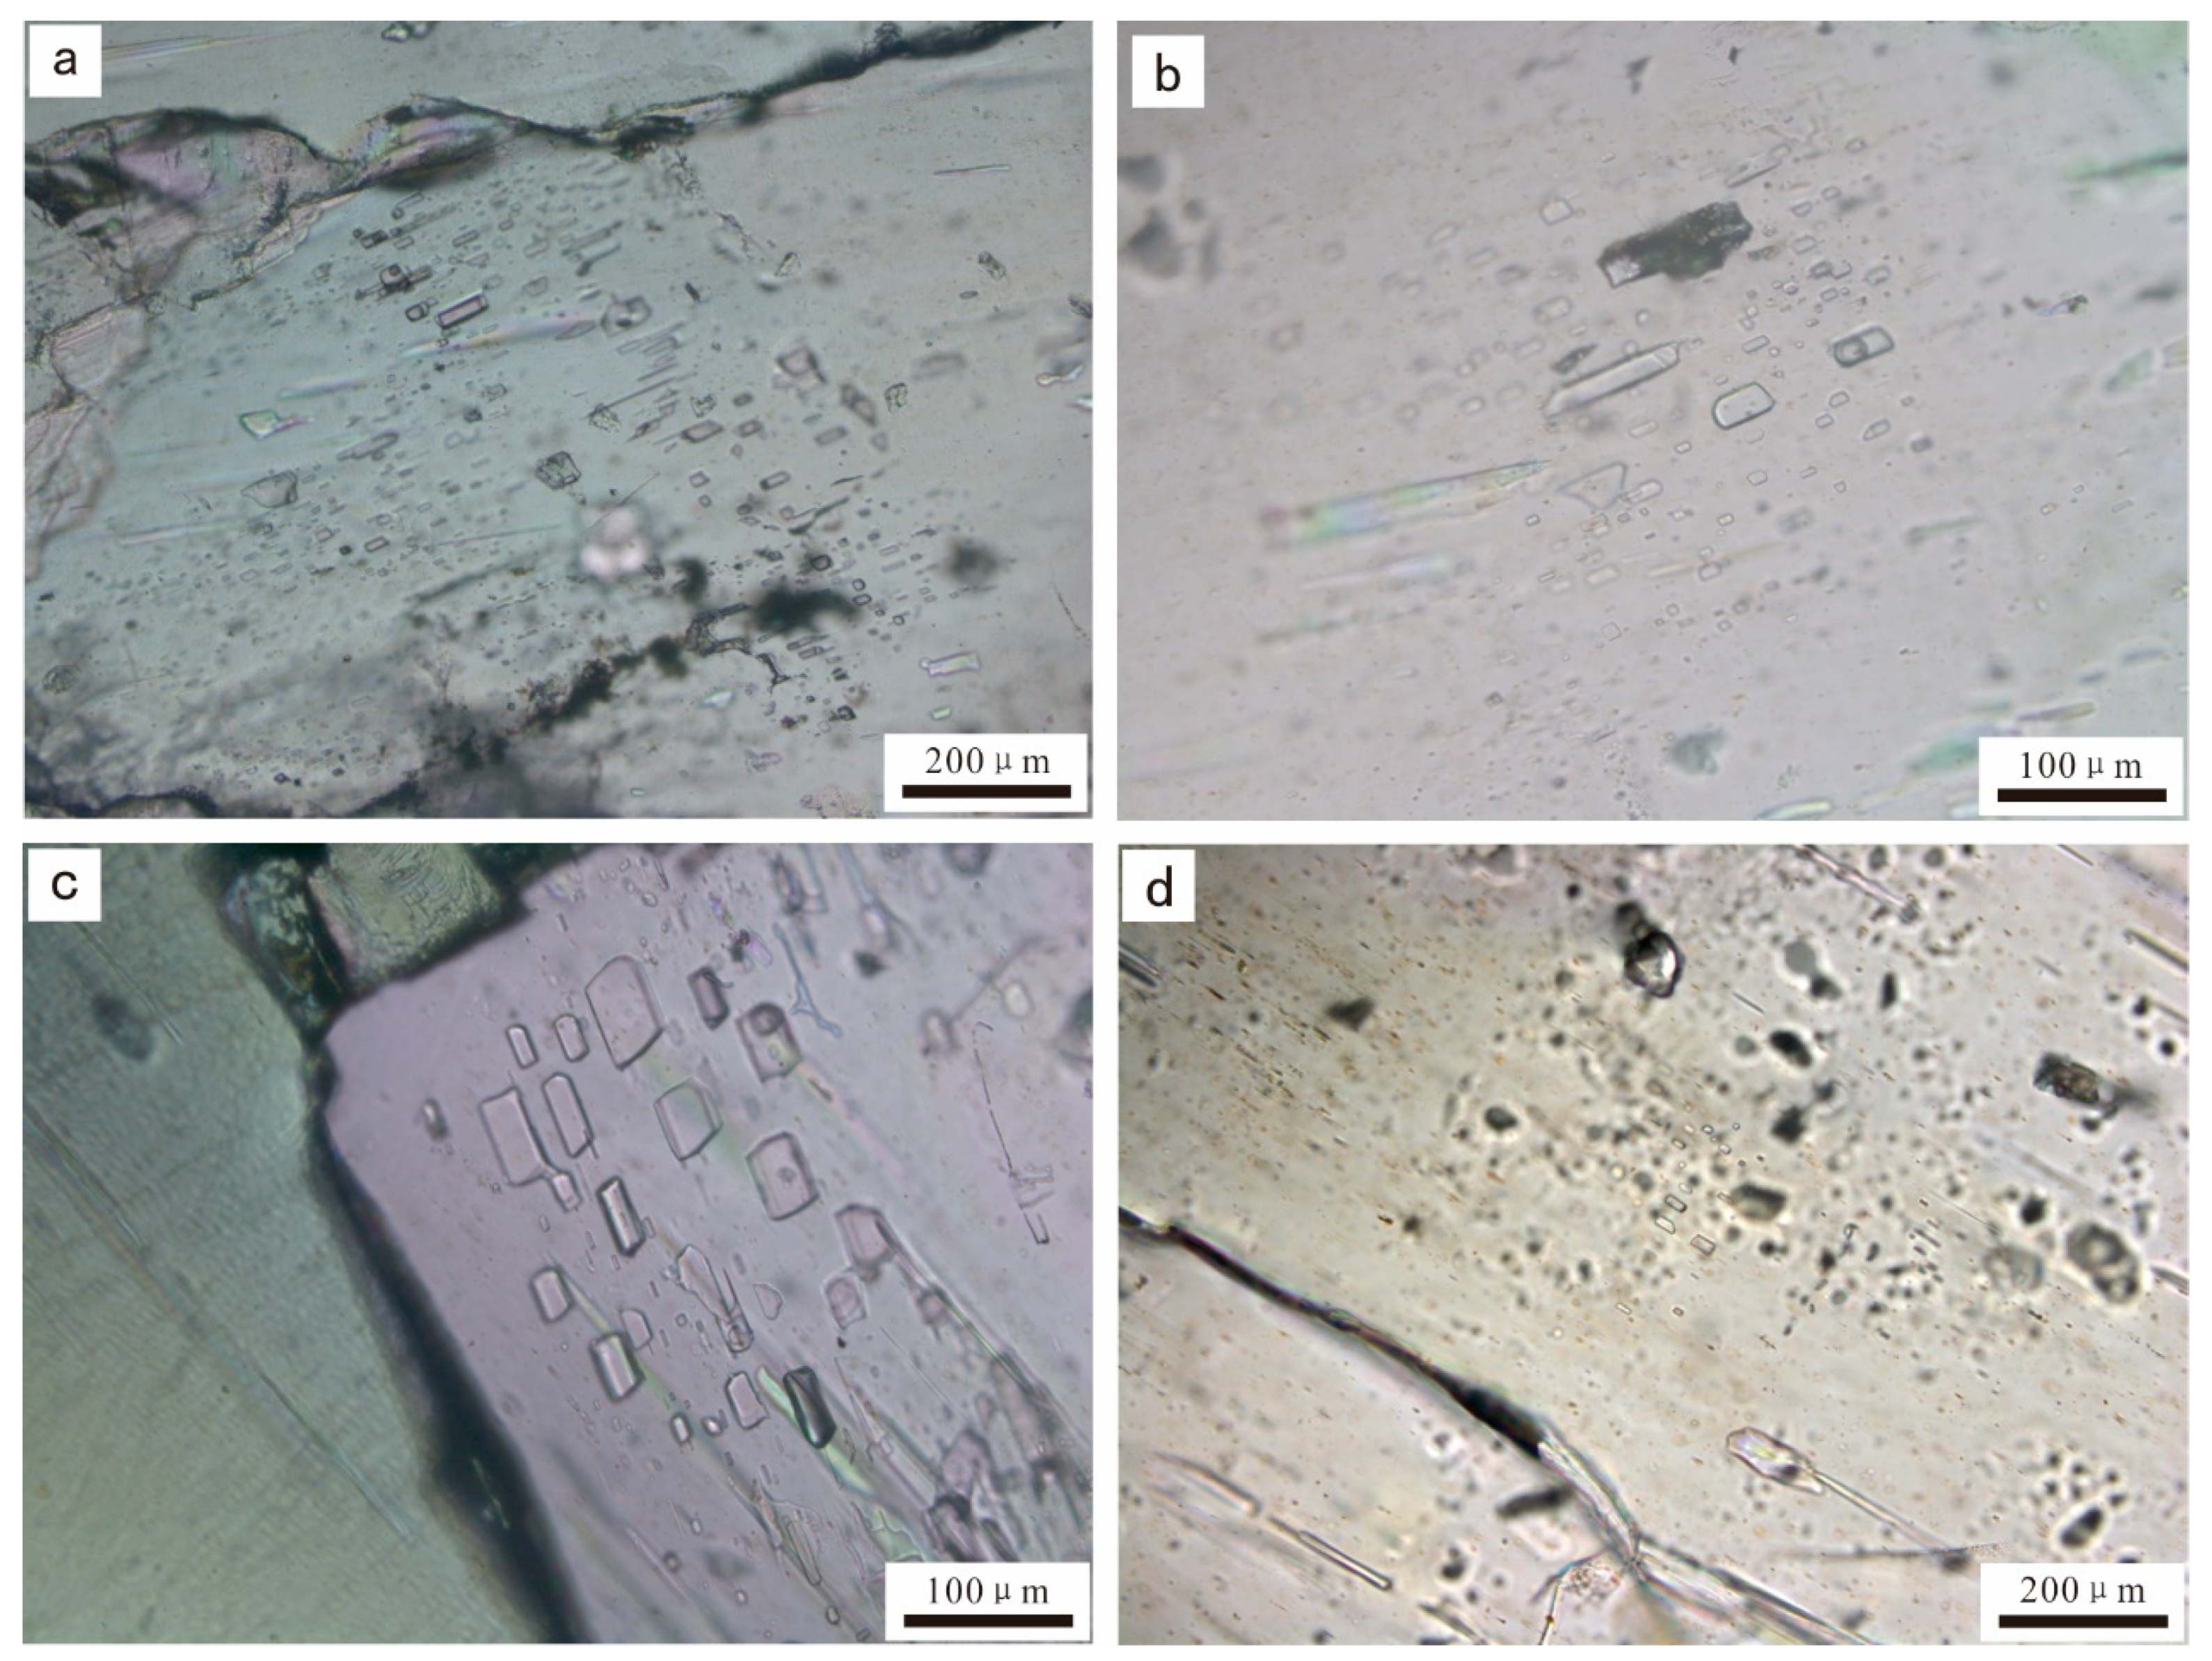
3.1. Materials
3.2. Experimental Methods
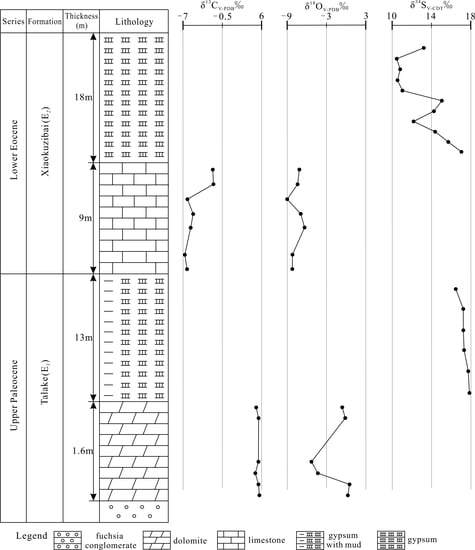
4. Results
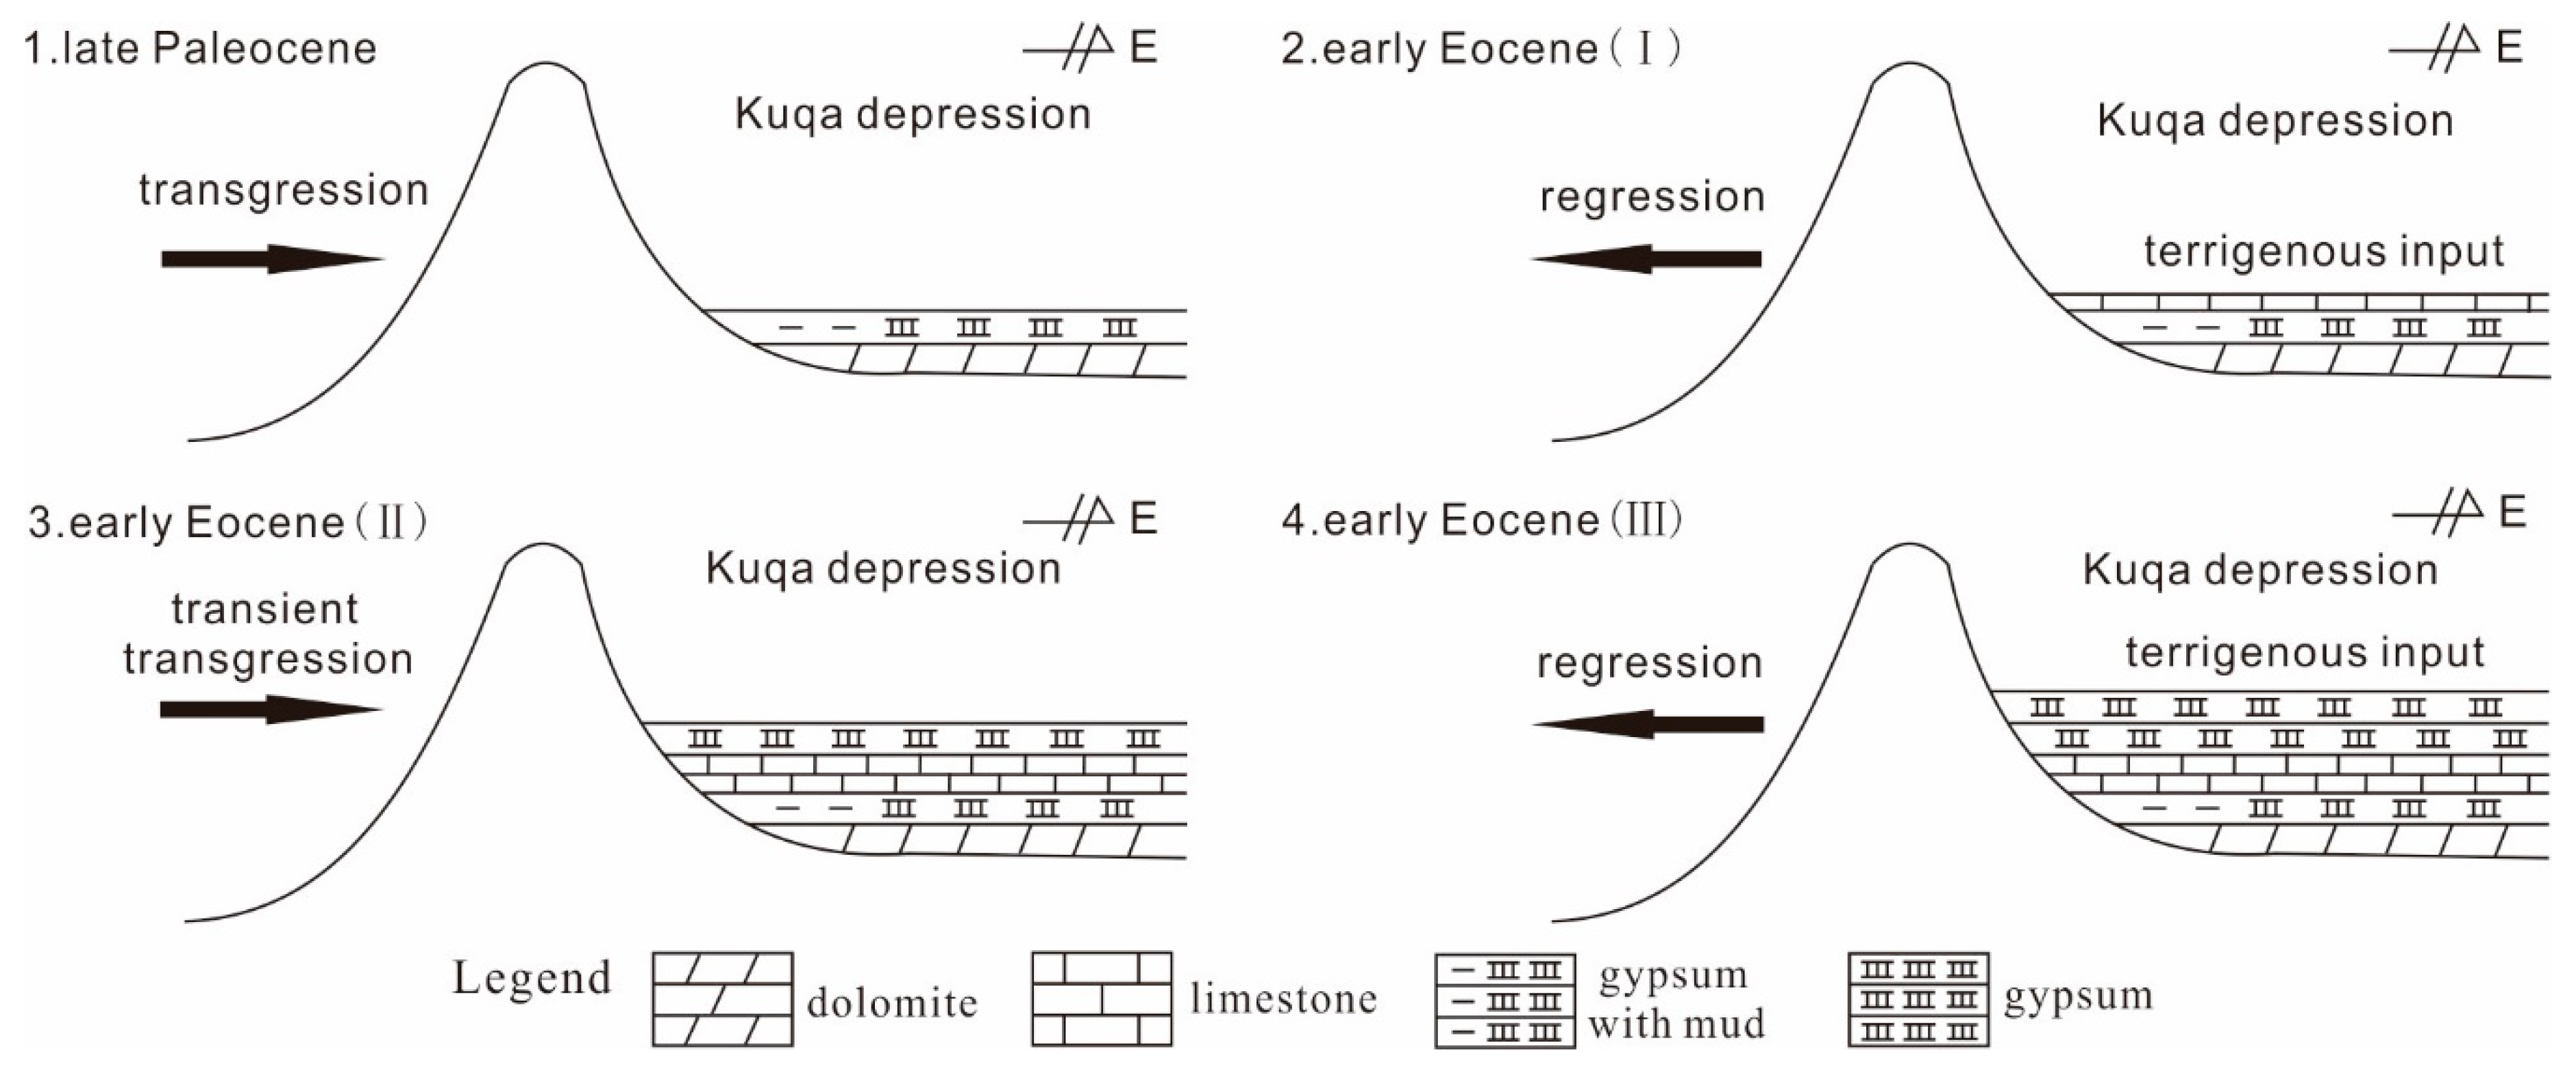
5. Discussion
5.1. Significance of the Carbon and Oxygen Isotopic Geochemistry
5.1.1. Validity of the Data
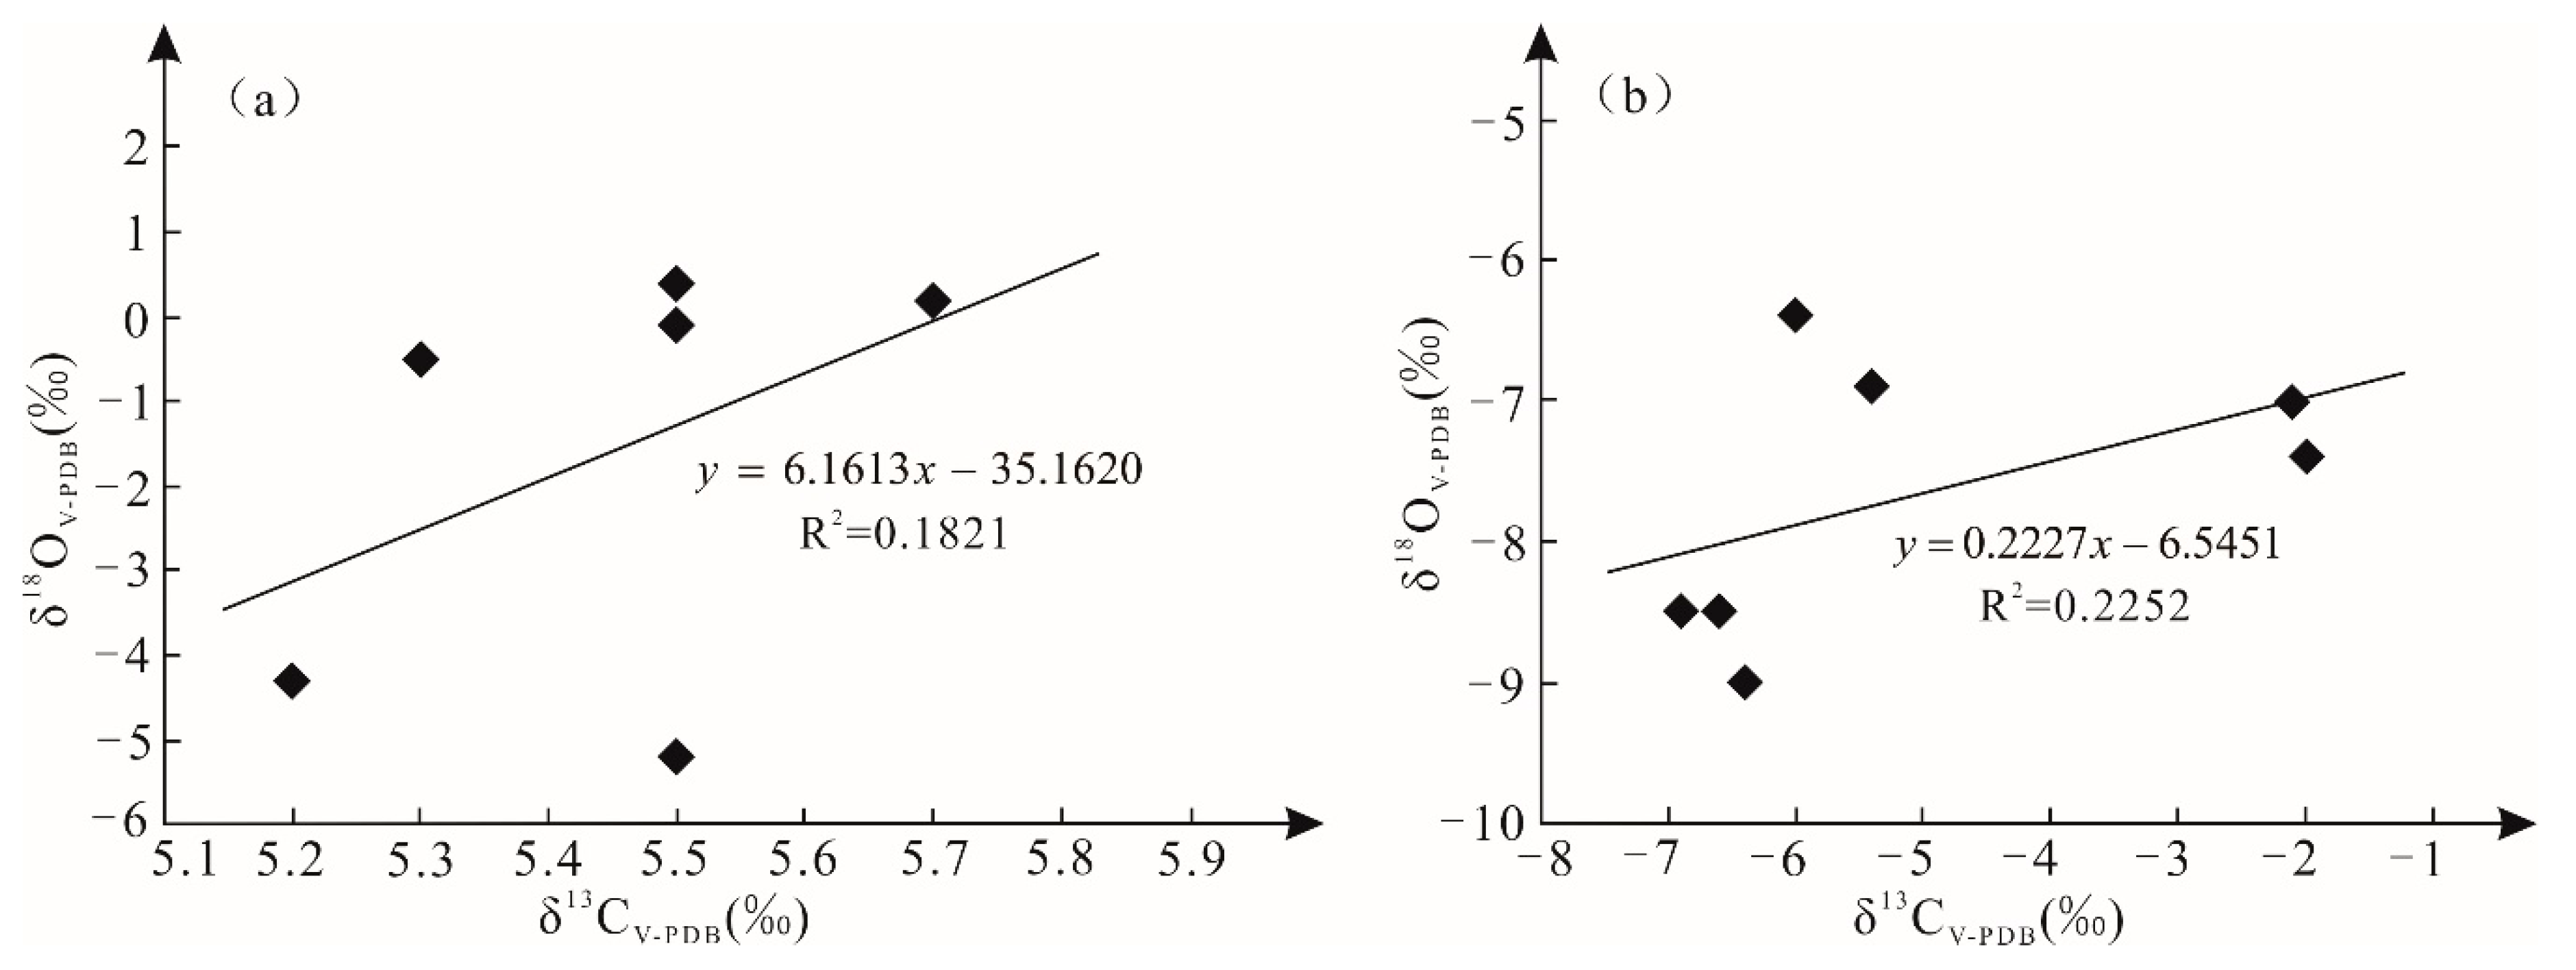
5.1.2. Upper Paleocene Carbonate Rocks
5.1.3. Lower Eocene Carbonate Rocks
5.2. Significance of the Sulfur Isotopic Geochemistry
5.3. Significance of the Strontium Isotopic Geochemistry
6. Conclusions
Author Contributions
Funding
Acknowledgments
Conflicts of Interest
References
- Abels, H.A.; Dupont-Nivet, G.; Xiao, G.; Bosboom, R.; Krijgsman, W. Step-wise change of Asian interior climate preceding the Eocene-Oligocene Transition (EOT). Palaeogeogr. Palaeoclim. Palaeoecol. 2011, 299, 399–412. [Google Scholar] [CrossRef]
- Wang, H.Z. Paleogeophic Atlas of China; China Cartographic Publishing House: Beijing, China, 1985. [Google Scholar]
- Su, X.; Guo, X.P.; Ding, X.Z. Late Cretaceous and Paleocene calcareous nannofossil assemblages from Kuche foreland Basin in the Northern Tarim Basin. Geoscience 2003, 17, 370–377. [Google Scholar]
- Zhu, Y.H.; Zhao, Y.Y.; Zhong, S.L. Paleogene calcareous nannofossil from the Xiaokuzibai section of the Kuqa depression, Tarim Basin. Acta Palaeontol. Sin. 2012, 51, 328–333. [Google Scholar]
- Fu, Q.L. Relationships between carbon and oxygen isotopic compositions and diagenetic environments of Lower Tertiary carbonate on the northwestern margin of Kuqa Basin, Xinjiang. J. Stratigr. 1996, 4, 280–284. [Google Scholar]
- Jia, J.H. Carbonate rocks and their genetic significance of the Mesozoic and Cenozoic in Kuqa depression of Xinjiang area. J. Paleogeography 2002, 4, 30–38. [Google Scholar]
- Liu, Q. Mesozoic and Cenozoic Terrigenous Clastic Rocks Chemical Sedimentary Rocks in China; Beijing Science and Technology Press: Beijing, China, 1987; pp. 15–17. [Google Scholar]
- Zhang, H.; Liu, C.L.; Cao, Y.T.; Sun, H.W.; Wang, L.C. A tentative discussion on the time and the way of marine regression from Tarim Bay during the Cenozoic. Acta Geosci. Sin. 2013, 34, 577–584. [Google Scholar]
- Cendon, D.I.; Peryt, T.M.; Ayora, C.; Pueyo, J.J.; Taberner, C. The importance of recycling processes in the Middle Miocene Badenian evaporite basin (Carpathian foredeep): Palaeoenvironmental implications. Palaeogeogr. Palaeoclim. Palaeoecol. 2004, 212, 141–158. [Google Scholar] [CrossRef]
- Playà, E.; Cendón, D.I.; Travé, A.; Chivas, A.R.; García, A. Non-marine evaporites with both inherited marine and continental signatures: The Gulf of Carpentaria, Australia, at ∼70 ka. Sediment. Geol. 2007, 201, 267–285. [Google Scholar] [CrossRef]
- Zhang, Q.Y.; Liang, B.; Qin, F.R.; Cao, J.W.; Dan, Y.; Li, J.R. Environmental and geochemical significance of carbon and oxygen isotopes of Ordovician carbonate paleokarst in Lunnan, Tarim Basin. Environ. Earth Sci. 2016, 75, 1074. [Google Scholar]
- Tabakh, M.E.; Utha-Aroon, C.; Schreiber, B.C. Sedimentology of the Cretaceous Maha Sarakham evaporites in the Khorat Plateau of northeastern Thailand. Sediment. Geol. 1999, 123, 31–62. [Google Scholar] [CrossRef]
- Playà, E.; Ortıí, F.; Rosell, L. Marine to non-marine sedimentation in the upper Miocene evaporites of the Eastern Betics, SE Spain: Sedimentological and geochemical evidence. Sediment. Geol. 2000, 133, 135–166. [Google Scholar] [CrossRef]
- Kelts, K. Lacaustrine Basin Analysis and Correlation by Strontium Isotope Stratigraphy. In Abstract of 13th International Sedimentary; Nottingham University: Nottingham, UK, 1987; pp. 9–13. [Google Scholar]
- Flecker, R.; Villiers, S.D.; Ellam, R.M. Modelling the effect of evaporation on the salinity 87Sr/86Sr relationship in modern and ancient marginal-marine systems: The Mediterranean Messinian Salinity Crisis. Earth Planet. Sci. Lett. 2002, 203, 221–233. [Google Scholar] [CrossRef]
- Palmer, M.R.; Cahit, H.; Fallick, A.E. Sulphur, sulphate oxygen and strontium isotope composition of Cenozoic Turkish evaporites. Chem. Geol. 2004, 209, 341–356. [Google Scholar] [CrossRef]
- Alonso-Azcárate, J.; Bottrell, S.H.; Mas, J.R. Synsedimentary versus metamorphic control of S, O and Sr isotopic compositions in gypsum evaporites from the Cameros Basin, Spain. Chem. Geol. 2006, 234, 45–57. [Google Scholar] [CrossRef]
- Peryt, T.M.; Anczkiewicz, R. Strontium isotope composition of Middle Miocene primary gypsum (Badenian of the Polish Carpathian Foredeep Basin): Evidence for continual non-marine inflow of radiogenic strontium into evaporite basin. Terra Nova 2015, 27, 54–61. [Google Scholar] [CrossRef]
- Lu, H.F.; Howell, D.G.; Jia, D.; Cai, D.S.; Wu, S.M.; Chen, C.M.; Valin, Z.C.; Shi, Y.S. Rejuvenation of the Kuqa Foreland Basin, northern flank of the Tarim Basin, Northwest China. Int. Geol. Rev. 1994, 36, 1151–1158. [Google Scholar]
- Zhang, C.J.; Tian, Z.Y. Tertiary salt structures and hydrocarbons in Kuqa depression of Tarim Basin. Acta Pet Sin. 1998, 19, 6–11. [Google Scholar]
- Xu, J.X.; Ma, H.Z.; Yang, L.S.; Tan, H.B.; Wang, J.G. Paleaogene and Neogene tectonic environment and sedimentation of evaporite in Kuqa Basin. Acta Geol. Sin. 2006, 80, 227–235. [Google Scholar]
- Cao, Y.T.; Yang, H.J.; Liu, C.L.; Gu, Q.Y.; Jiao, P.C.; Lu, Y.H. Response on sediment of evaporate in Kuqa Basin from Paleogene to Neogene period and Himalayan tectonic phase. Acta Sedimentol. Sin. 2010, 28, 1054–1065. [Google Scholar]
- Burtman, V.S. Cenozoic crustal shortening between the Pamir and Tien Shan and a reconstruction of the Pamir-Tien Shan transition zone for the Cretaceous and Palaeogene. Tectonophysics 2000, 319, 69–92. [Google Scholar] [CrossRef]
- Carrapa, B.; DeCelles, P.G.; Wang, X.; Clementz, M.K.; Mancin, N.; Stoica, M.; Kraatz, B.; Meng, J.; Abdulov, S.; Chen, F.H. Tectono-climatic implications of Eocene Paratethys regression in the Tajik basin of central Asia. Earth Planet. Sci. Lett. 2015, 424, 168–178. [Google Scholar] [CrossRef]
- Chen, X.W.; Chen, H.L.; Lin, X.B.; Cheng, X.G.; Yang, R.; Ding, W.W.; Gong, J.F.; Wu, L.; Zhang, F.Q.; Chen, S.Q.; et al. Arcuate Pamir in the Paleogene? Insights from a review of stratigraphy and sedimentology of the basin fills in the foreland of NE Chinese Pamir, western Tarim Basin. Earth Sci. Rev. 2018, 180, 1–16. [Google Scholar] [CrossRef]
- Zheng, H.B.; Tada, R.; Jia, J.T.; Lawrence, C.; Wang, K. Cenozoic Sediments in the Southern Tarim Basin: Implications for the Uplift of Northern Tibet and Evolution of the Taklimakan Desert; Geological Society, Special Publications: London, UK, 2010; Volume 342, pp. 67–78. [Google Scholar]
- Bosboom, R.; Dupontnivet, G.; Grothe, A.; Brinkhuis, H.; Villa, G.; Mandic, O.; Stoica, M.; Huang, W.; Yang, W.; Guo, Z.; et al. Linking Tarim Basin sea retreat (west China) and Asian aridification in the late Eocene. Basin Res. 2014, 26, 621–640. [Google Scholar] [CrossRef]
- Sun, J.M.; Windley, B.F.; Zhang, Z.L.; Fu, B.H.; Li, S.H. Diachronous seawater retreat from the southwestern margin of the Tarim Basin in the late Eocene. J. Asian Earth Sci. 2016, 116, 222–231. [Google Scholar] [CrossRef]
- Zheng, M.; Meng, Z.F. Magnetostratigraphy of tertiary system in Baicheng, Xinjiang. Acta Sedimentol. Sin. 2006, 24, 650–656. [Google Scholar]
- Teng, Z.H.; Yue, L.P.; He, D.F.; Deng, X.Q.; Bian, X.W. Magnetostratigraphic research of Cenozoic section of Kuche River area, South Xinjiang. J. Stratigr. 1997, 21, 55–62. [Google Scholar]
- Goldstein, R.H.; Reynolds, T.J. Systematics of Fluid Inclusions in Diagenetic Minerals. SEPM Short Course 1994, 31, 155–199. [Google Scholar]
- Drummond, C.N.; Patterson, W.P.; Walker, J.C.G. Climatic forcing of carbon-oxygen isotopic covariance in temperate-region marl lakes. Geology 1995, 23, 1031–1034. [Google Scholar] [CrossRef]
- Leng, M.J.; Marshall, J.D. Palaeoclimate interpretation of stable isotope data from lake sediment archives. Quat. Sci. Rev. 2004, 23, 811–831. [Google Scholar] [CrossRef] [Green Version]
- Veizer, J. Chemical diagenesis of carbonates: Theory and application of trace element technique. Stable Isot. Sediment. Geol. 1983, 10, 3–100. [Google Scholar]
- Kaufman, A.J.; Knoll, A.H. Neoproterozoic variations in the C-isotopic composition of seawater: Stratigraphic and biogeochemical implications. Precambrian Res. 1995, 73, 27–49. [Google Scholar] [CrossRef]
- Nan, J.Y.; Liu, Y.Y. Organic and inorganic carbon-isotope shift and paleoenvironment at the P-T boundary section in Meishan, Zhejiang Province. Geochimica 2004, 33, 9–19. [Google Scholar]
- Qing, H.R.; Veizer, J. Oxygen and carbon isotopic composition of Ordovician brachiopods: Implications for coeval seawater. Geochim. Cosmochim. Acta 1994, 58, 4429–4442. [Google Scholar] [CrossRef]
- Veizer, J.; Ala, D.; Azmy, K.; Bruckschen, P.; Buhl, D.; Bruhn, F.; Carden, G.A.; Diener, A.; Ebneth, S.; Godderis, Y.; et al. 87Sr/86Sr, δ13C and δ18O evolution of Phanerozoic seawater. Chem. Geol. 1999, 161, 1586. [Google Scholar] [CrossRef] [Green Version]
- Keitht, M.H.; Weber, J.N. Carbon and oxygen stable isotopic composition of selected limestones and fossils. Geochim. Cosmochim. Acta 1964, 28, 1787–1816. [Google Scholar] [CrossRef]
- Muttoni, G.; Mazza, M.; Mosher, D.; Katza, M.E.; Kent, D.V.; Balini, M. A Middle-Late Triasic (Ladinian-Rhaetian) carbon and oxygen isotope record from the Tethyan Ocean. Palaeogeogr. Palaeoclim. Palaeoecol. 2014, 399, 246–259. [Google Scholar] [CrossRef]
- Schopf, T.J.M. Paleoceanography; Harvard University Press: Cambridge, MA, USA, 1980. [Google Scholar]
- Cao, Y.T.; Liu, C.L.; Yan, H.; Jiao, P.C.; Zhang, H.; Lü, F.L.; Ding, T. Research on evaporite deposit and its controlling factors for saline lake chain of Tarim Basin and central Asia basin during Mesozoic-Cenozoic period. Miner. Depos. 2016, 35, 591–604. [Google Scholar]
- Bosboom, R.E.; Dupont-Nivet, G.; Houben, A.J.P.; Brinkhuis, H.; Villa, G.; Mandic, O.; Stoica, M.; Zachariasse, W.J.; Guo, Z.; Li, C. Late Eocene sea retreat from the Tarim Basin (west China) and concomitant Asian paleoenvironmental change. Palaeogeogr. Palaeoclim. Palaeoecol. 2011, 299, 385–398. [Google Scholar] [CrossRef]
- Guo, X.P. Study on marine Cretaceous-Tertiary boundary in the Western Tarim Basin. Earth Sci. 1990, 3, 325–335. [Google Scholar]
- Li, B.Y.; Zhou, Y.Q.; Wu, S.Z.; Li, Y.A. Characteristics of carbon and oxygen isotope of limestone from Yigeziya and Kalataer formations in southwestern Tarim Basin. Xinjiang Geol. 2002, 20, 88–90. [Google Scholar]
- Liu, C.L.; Cao, Y.T.; Yang, H.J.; Jiao, P.C.; Gu, Q.Y. Discussion on Paleogene-Neogene environment change of salt lakes in Kuqa Foreland Basin and its potash-forming effect. Acta Geosci. Sin. 2013, 34, 547–558. [Google Scholar]
- Strauss, H. Geological evolution from isotope proxy signals—Sulfur. Chem. Geol. 1999, 161, 89–101. [Google Scholar] [CrossRef]
- Lin, Y.T. Study on sulfur isotope of Trias marine deposit gypsum and brines in the Sichuan Basin. J. Saltlake Res. 2003, 11, 1–7. [Google Scholar]
- Shi, Z.S.; Chen, K.Y.; He, S. Strontium, sulfur and oxygen isotopic compositions and significance of paleoenvironment of Paleogene of Dongpu depression. Earth Sci. 2005, 30, 430–436. [Google Scholar]
- Holser, W.T.; Kaplan, I.R. Isotope geochemistry of sedimentary sulfates. Chem. Geol. 1966, 1, 93–135. [Google Scholar] [CrossRef]
- Toulkeridis, T.; Podwojewski, P.; Clauer, N. Tracing the source of gypsum in New Caledonian soils by REE contents and S-Sr isotopic compositions. Chem. Geol. 1998, 145, 61–71. [Google Scholar] [CrossRef]
- Sun, H.W. Sedimentary Characteristics of the Cretaceous-Paleogene Evaporates in Yarkand Basin, Xinjiang Northwestern China and Implication for Potash Information; China University of Geosciences (Beijing): Beijing, China, 2014; pp. 66–67. [Google Scholar]
- Leybourne, M.I.; Denison, R.E.; Cousens, B.L.; Bezys, R.K.; Gregoire, D.C.; Boyle, D.R.; Dobrzanski, E. Geochemistry, geology, and isotopic (Sr, S, and B) composition of evaporites in the Lake St. Martin impact structure: New constraints on the age of melt rock formation. Geochem. Geophys. Geosystems 2007, 8. [Google Scholar] [CrossRef]
- Wan, X.Q.; Wang, X.; Yu, T.; Li, G.B. The global Paleocene/Eocene Thermal Maximum event in the Gamba area, Tibet. Earth Sci. Front. 2006, 13, 218–226. [Google Scholar]
- Chaudhuri, S.; Clauer, N. History of Marine Evaporites: Constraints from Radiogenic Isotopes//Isotopic Signatures and Sedimentary Records; Springer: Berlin/Heidelberg, Germany, 1992; Volume 43, pp. 177–198. [Google Scholar]
- Shields, G.A. A normalised seawater strontium isotope curve: Possible implications for Neoproterozoic-Cambrian weathering rates and the further oxygenation of the Earth. Earth 2007, 2, 35–42. [Google Scholar] [CrossRef] [Green Version]
- Paytan, A.; Kastner, M.; Campbell, D.; Thiemens, M.H. Sulphur isotopic composition of Cenozoic seawater sulphate. Science 1998, 282, 1459–1462. [Google Scholar] [CrossRef] [Green Version]
- McArthur, J.M.; Howarth, R.J.; Bailey, T.R. Strontium isotope stratigraphy: LOWESS version 3: Best fit to the marine Sr-isotope curve for 0–509 Ma and accompanying look-up table for deriving numerical age. J. Geol. 2001, 109, 155–170. [Google Scholar] [CrossRef] [Green Version]
- Wang, X.Y.; Yin, H.W.; Deng, X.L.; Wei, Z. Strontium isotope characteristics and the origin of Cenozoic salt deposits in Kuqa depression. J. Nanjing Univ. (Nat. Sci.) 2015, 51, 1068–1074. [Google Scholar]


| Series | Lithology | Sample Number | δ13C (PDB, ‰) | δ18O (PDB, ‰) | Z Values | Mn/Sr | Remarks |
|---|---|---|---|---|---|---|---|
| Lower Eocene | micritic limestone | XKZB-01 | −6.6 | −8.5 | 109.55 | 0.93 | |
| XKZB-02 | −6.9 | −8.5 | 108.94 | 0.48 | |||
| XKZB-03 | −6.0 | −6.4 | 111.82 | 2.44 | |||
| XKZB-04 | −5.4 | −6.9 | 112.80 | 0.45 | |||
| XKZB-05 | −6.4 | −9.0 | 109.71 | 0.36 | |||
| XKZB-06 | −2.0 | −7.4 | 119.52 | 1.24 | |||
| XKZB-07 | −2.1 | −7.0 | 119.51 | 0.87 | |||
| Upper Paleocene | micritic dolomite | TLK-01 | 5.7 | 0.2 | 139.07 | 1.85 | |
| TLK-02 | 5.5 | 0.4 | 138.76 | 0.17 | |||
| TLK-03 | 5.2 | −4.3 | 135.81 | 0.36 | |||
| TLK-04 | 5.5 | −5.2 | 135.97 | 0.32 | |||
| TLK-05 | 5.4 | −3.9 | 136.42 | 13.36 | exclude | ||
| TLK-06 | 5.3 | −4.0 | 136.16 | 13.49 | exclude | ||
| TLK-07 | 4.2 | 2.4 | 137.10 | 6.28 | exclude | ||
| TLK-08 | 5.5 | −0.1 | 138.51 | 2.10 | |||
| TLK-09 | 5.3 | −0.5 | 137.91 | 1.37 |
| Series | Lithology | Sample Number | δ34S (‰) | 87Sr/86Sr |
|---|---|---|---|---|
| Lower Eocene | gypsum | XKZB-S01 | 17.0 | 0.708642 ± 11 |
| XKZB-S02 | 15.7 | 0.708929 ± 9 | ||
| XKZB-S03 | 14.4 | 0.709017 ± 6 | ||
| XKZB-S04 | 12.2 | 0.709062 ± 7 | ||
| XKZB-S05 | 14.1 | 0.709060 ± 7 | ||
| XKZB-S06 | 15.1 | 0.709193 ± 10 | ||
| XKZB-S07 | 11.1 | 0.709495 ± 12 | ||
| XKZB-S08 | 10.6 | 0.709494 ± 8 | ||
| XKZB-S09 | 10.8 | 0.709252 ± 6 | ||
| XKZB-S10 | 10.5 | 0.709883 ± 8 | ||
| XKZB-S11 | 13.3 | 0.709002 ± 7 | ||
| Upper Paleocene | gypsum | TLK-S01 | 17.9 | |
| TLK-S02 | 17.8 | |||
| TLK-S03 | 17.3 | |||
| TLK-S04 | 17.2 | |||
| TLK-S05 | 17.2 | |||
| TLK-S06 | 16.5 |
© 2020 by the authors. Licensee MDPI, Basel, Switzerland. This article is an open access article distributed under the terms and conditions of the Creative Commons Attribution (CC BY) license (http://creativecommons.org/licenses/by/4.0/).
Share and Cite
Xu, Y.; Cao, Y.; Liu, C.; Zhang, H.; Nie, X. The History of Transgressions during the Late Paleocene-Early Eocene in the Kuqa Depression, Tarim Basin: Constraints from C-O-S-Sr Isotopic Geochemistry. Minerals 2020, 10, 834. https://doi.org/10.3390/min10090834
Xu Y, Cao Y, Liu C, Zhang H, Nie X. The History of Transgressions during the Late Paleocene-Early Eocene in the Kuqa Depression, Tarim Basin: Constraints from C-O-S-Sr Isotopic Geochemistry. Minerals. 2020; 10(9):834. https://doi.org/10.3390/min10090834
Chicago/Turabian StyleXu, Yang, Yangtong Cao, Chenglin Liu, Hua Zhang, and Xiao Nie. 2020. "The History of Transgressions during the Late Paleocene-Early Eocene in the Kuqa Depression, Tarim Basin: Constraints from C-O-S-Sr Isotopic Geochemistry" Minerals 10, no. 9: 834. https://doi.org/10.3390/min10090834