Article

Epithermal Mineralization in the Busang Southeast Zone, Indonesia: New Insight into the Au Prospect at the Center of the Bre-X Fraud

1
Department of Earth Sciences, Dalhousie University, Halifax, NS B3H 4R2, Canada
2
Department of Geology, Saint Mary’s University, Halifax, NS B3H 3C3, Canada
3
North Vancouver, BC V7M 2H4, Canada
*
Author to whom correspondence should be addressed.
Minerals 2020, 10(8), 698; https://doi.org/10.3390/min10080698
Submission received: 9 July 2020 / Revised: 1 August 2020 / Accepted: 2 August 2020 / Published: 6 August 2020
(This article belongs to the Section Mineral Deposits)

Abstract

:
The Busang mineral prospect in Kalimantan, Indonesia, was reported to host a large Au resource until 1997 when it was revealed that drill core samples had been deliberately and systematically contaminated (“salted”) with extraneous Au to falsify resource estimates. One month before the fraud was uncovered, Dr. G. Milligan, then professor emeritus of geology, visited the site to collect a suite of core samples for academic study that was deemed representative of the host rocks, alteration, and mineralization of the Busang Southeast Zone. These samples were re-examined here by optical microscopy, electron microprobe (EMPA), whole-rock geochemistry, and fluid inclusion microthermometry to characterize the subsurface geology and hydrothermal mineralization, and to assess reasons why the system is of uneconomic character. The host rocks were variably altered calc-alkaline porphyritic subvolcanic diorites, typical of the lithological units along the mineralized trend in the Kalimantan Gold Belt. Early hydrothermal mineralization with quartz-sulfide (pyrite, chalcopyrite, Cu-sulfosalts) stockwork veinlets associated with pervasive phyllic and propylitic alteration was overprinted by crudely banded quartz-carbonate-sulfide/sulfosalt (pyrite, sphalerite, chalcopyrite, galena, tennantite-tetrahedrite, bournonite-seligmannite) veins. The stockwork veins were associated with up to 140 ppb bulk rock Au, some of which was hosted by Cu-sulfosalts. Microthermometry on quartz-hosted aqueous fluid inclusion assemblages (FIA; n = 13) and single inclusions (non-FIA; n = 20) in quartz-carbonate-sulfide/sulfosalt veins yielded an overall range in homogenization temperatures (Th) between 179 °C and 366 °C and bulk salinities between 1.1 wt.% to 8.6 wt.% NaCl equivalent, with much smaller data ranges for individual FIA (e.g., FIA 3; 239.1 °C to 240.5 °C and 0.5 wt.% to 1.4 wt.% NaCl equivalent). Primary FIA along growth zones in quartz were identified, providing constraints on fluid characteristics at the time of quartz growth. Carbonate-hosted FIA (n = 3) and single inclusions (non-FIA; n = 3) in the same veins yielded Th between 254 °C and 343 °C and bulk salinities of 1.1 wt.% to 11.6 wt.% NaCl equivalent. Likewise, data ranges for individual FIA were much smaller. Many of the geological characteristics of the Busang Southeast Zone were compatible with a telescoped, intermediate-sulfidation epithermal system, having formed from diluted magmatic fluids that precipitated weak base metal mineralization. However, the system was unproductive with respect to Au and Ag, at least within the studied area. Of note, vein textures and fluid inclusion characteristics indicative of boiling or efficient fluid mixing—processes both considered critical for the formation of economic lode gold deposits—were absent in the samples.

1. Introduction

Prior to being declared a fraud in May 1997, the Busang gold prospect in East Kalimantan, Indonesia (Figure 1), was touted by its operator Bre-X Minerals, Ltd., as hosting one of the largest gold deposits in the world at the time [1]. Although Bre-X was listed on the Toronto Stock Exchange, it was not required to publicly disclose reports by an independent qualified person on the geology and exploration results on the property. Consequently, with the exceptions of an unpublished study by Leach [2], an article in a local journal by Utoyo [3], and the damning report by Strathcona Mineral Services, Ltd. [4], little is known about the accurate geology, petrology, and mineralization at Busang.
George C. Milligan, then a professor emeritus of geology in Nova Scotia, Canada, at the invitation of Bre-X’s vice president of exploration John Felderhof, visited Busang in February 1997 (just one month prior to the debacle) and collected core splits for teaching and research purposes (Milligan, 1999, 2013, personal communications). In a 1999 letter, Milligan stated that microscopic and geochemical analysis of the samples indicated signs of mineralization-associated hydrothermal alteration typical of lode gold systems except with an absence of gold. Bre-X submitted whole core for assay, not keeping half, which is best practice. Therefore, these samples collected by Milligan provide a rare opportunity to study the subsurface geology of Busang, specifically the Busang Southeast Zone from where they were collected. In this article, we presented the results of a petrochemical and fluid inclusion study of “the Milligan samples”, relating our observations to descriptions of Busang in the texts mentioned above for context. These were then evaluated by comparison with epithermal gold systems in the region and globally.

2. Sampling and Analytical Methods

Bre-X drilled the Busang prospect from the Busang Central Zone (BCZ) to the Busang Southeast Zone (BSEZ) within the northeastern part of the tenement known as Block V. Milligan’s 12 samples were collected from four HQ-size diamond drill holes in the latter zone (Table 1), which Bre-X claimed to represent host rocks and high-grade gold zones.
Polished thin sections from all samples were studied optically and with a scanning electron microscope coupled with an energy-dispersive analyzer (SEM-EDS) at Dalhousie University, Halifax, NS. The determination of mineral-chemical compositions of opaque minerals, including gold concentrations, and elemental mapping of selected samples were completed using a JEOL JXA-8200 (Tokyo, Japan) electron microprobe analyzer (EMPA) at the Robert M. MacKay Electron Microprobe Laboratory, Dalhousie University, Halifax, with a 15-kV accelerating current, 200 nÅ beam current, and a 1-µm spot size. Arsenic, Se, Fe, Pb, Sb, Cu, Bi, S, Zn, Hg, Cd, and Te were analyzed for 20 s on the peak and 10 s on the background, whereas Au and Ag were analyzed for 50 s on the peak and 20 s on the background. The standards used were Au metal (Au), Ag metal (Ag), arsenopyrite (As), Bi2Se3 (Bi), synthetic pyrrhotite239 (S, Fe), galena (Pb), stibnite (Sb), chalcopyrite (Cu), sphalerite (Zn), Cd metal (Cd), FeTe2 (Te), and cinnabar (Hg). Five host rock samples and three quartz vein-bearing samples were analyzed for their whole-rock chemical compositions with various analytical methods by Act-Labs, Ancaster, Ontario (Supplementary Materials Table S1). Details of these methods can be found at https://www.actlabs.com or in Slater [5].
Microthermometric measurements of fluid inclusions in quartz and carbonate from five samples within two drill holes (BSSE-1 and BSSE-333) were carried out on a Linkam FTIR 600 heating-freezing stage equipped with an Olympus BX51 (Tokyo, Japan) microscope at Saint Mary’s University, Halifax. The stage was calibrated with synthetic inclusion standards containing pure H2O (final ice melting at 0 °C and critical behavior at 374.1 °C) and CO2 (final melting at −56.6 °C). Isochores and salinities were calculated with the “HOKIEFLINCS” Microsoft Excel spreadsheet [6] that used the equations of Bodnar [7], Bodnar [8], Bodnar and Vityk [9], and Atkinson [10]. Pressures of homogenization were determined using the program “SoWat” from Driesner and Heinrich [11].

3. Geology

3.1. The Geology of Borneo

Busang lies within the east-central Kalimantan volcanic belt (ECKVB; Figure 1) that is superimposed on the front ranges and foothills of the Paleozoic-Mesozoic Muller or Central Kalimantan Mountains (suture zone) and, to some extent, the Cretaceous Schwaner Mountains (Figure 1 and Figure 2). This suture separates the complex Borneo accretionary orogen to the NW from the low-lying basins to the SE. The pre-Paleogene rocks acted as the “craton” of Borneo throughout the Mesozoic [12,13]. Marine and continental sediments covered this basement complex during the Cretaceous to Eocene, and they were compressed and uplifted by south- to southeast-directed subduction beneath Borneo during the Eocene to Plio-Pleistocene. This collision along the Kalimantan Suture from the Eocene to early Oligocene produced siliceous calc-alkaline pyroclastic rocks [14]. From the late Oligocene to Pleistocene, subduction resumed along the Palawan Trench, at which time the magmas evolved from calc-alkaline to potassic alkaline. Magmatism ended in the Pliocene-Pleistocene [14], during which the NE-trending basalt-andesite volcanic centers of the ECKVB were emplaced.
Figure 1. Location and geology of Borneo (after Hamilton [12], Moss and Chamber [15]) showing major structural elements and the East-Central Kalimantan Volcanic Belt (ECKVB) with its epithermal deposits (after Abidin [16]). Only Kelian (~75 Mt at 1.8 g/t Au) and Mt. Muro (10.4 Mt 3.8 g/t Au and 101 g/t Ag) became mines [17,18].
Minerals 10 00698 g001
The regional lineaments in the vicinity of Busang are dominated by the NE-trending Kalimantan suture and a NW-striking structure (Figure 2). The latter is discernible as faults and fractures on the Shuttle Radar Topography Mission (SRTM) obtained for this study. The intersections of these faults along the ECKVB were considered by Corbett [19] (cited in Leach [2] and Utoyo [3]) to have controlled the emplacement of Paleogene intrusions and to appear spatially associated with the Mt. Muro, Kelian, and Busang mineralized centers.
Figure 2. District geology of the Busang prospect showing the eastern side of the Muller or Kalimantan Ranges, the NE-trending Paleogene-Neogene volcanic centers, and lineaments (solid) (after Atmawinata et al. [20]). Other structures (dash line) were interpreted from an Shuttle Radar Topography Mission (SRTM) from the USGS (this study). Utoyo [3] placed the Busang field camp on the south side of the andesite-basalt plug, locally known as the Busang Hill. A placer gold mining operation was located several kilometers northeast of the property (“Au” [3]). The topographic profile of the A-A’ cross section was extracted from the SRTM. Contacts and faults were drawn as vertical in the absence of structural data.
Minerals 10 00698 g002

3.2. The Geology of Busang

Busang and its vicinity are dominated by andesite-basalt flows, diorite subvolcanic stocks, tuffs, and breccias, which, in places, are covered by sedimentary rocks which are considered to have originated from within a maar [2] (Figure 3A). The rocks studied here were variably altered diorites, which exhibited porphyritic textures with relict plagioclase and pyroxene or amphibole phenocrysts set in a groundmass of quartz, chlorite, plagioclase, sulfide, and magnetite (Figure 4a–d). The mineralogy and texture were similar to those of the subsurface andesite porphyry investigated by Farquharson [4] (Figure 3B) and the porphyritic andesite outcrops described by Utoyo [3], which Bre-X identified as dacite [4]. Although Leach [2] and Utoyo [3] mentioned the presence of dacite, none of the samples in this study belonged to this rock type if classified by lithogeochemistry. Sample BSSE-333C, which had no whole-rock chemical data, visually appeared more felsic. However, this could have been the result of intense alteration (Figure 4e–f). Without establishing their field relationships, these rocks were tentatively interpreted as subvolcanic intrusive stocks. However, they could represent porphyritic flows. From cross-sections in Figure 3B, one can see that these basalt-andesite-dacite rocks extended to at least ~400 m below the current surface.
The whole-rock major- and trace-element compositions of five samples varied from 52.9 wt.% SiO2 to 63.7 wt.% SiO2 and from 1.88 wt.% Na2O + K2O to 4.06 wt.% Na2O + K2O (Supplementary Materials Table S2). The elevated silica and alkali contents were attributed to the presence of secondary quartz and sericite, and hence, the total alkali-silica (TAS) classification scheme for volcanic rocks [21] could not be applied to these rocks. However, assuming that Ti, Zr, Nb, and Y were immobile during hydrothermal alteration [22,23], the ratios of these elements allowed the classification of the studied subvolcanic rocks as basalt-andesite to andesite, which would be equivalent to diorite (Figure 5a). Chondrite-normalized REE patterns show enrichments in the light REE but only small enrichments in the heavy REE (Figure 5b). This fractionation pattern is consistent with the calc-alkaline magmas of the island arc affinity [24].
Breccias are a common feature at Busang (Figure 3B), and they vary from polymictic (this study) to monolithic [4]. The former type is clast-supported, consisting of fragments of felsic igneous and sedimentary rocks, and quartz with interstitial fine-grained quartz, clay minerals and pyrite. Farquharson [4] described fractures in porphyritic andesite as rubble (crackle) breccias, which consist of angular to rounded andesite wall-rock fragments cemented by fine-grained materials, clays, and pyrite. Porphyritic diorite intruded into the aforementioned andesite-dacite flows, with Utoyo [4] describing the contact as linear between the two rock types. No description of the sedimentary cover is available.
Figure 3. (A) Geology, hydrothermal alteration, “mineralized” zones (Busang Central Zone (BCZ) and Busang Southeast Zone (BSEZ)), and relevant drill collars of the Busang prospect (after [2,25], including drill holes BSSE-63, 82, 84 audited by Farquharson [4] and used in this study (BSSE-1, 2, 295, 333). (B) Northwest-looking cross-sections of drill holes showing the subsurface porphyritic andesite and alteration of the study area.
Minerals 10 00698 g003
Figure 4. Examples of host rocks and alteration in the “Milligan samples” in hand specimen (left) and thin section (right). ((a,b) sample BSSE-295B) Propylitic-altered diorite with relict phenocrysts of amphibole and plagioclase. The amphiboles have been altered to chlorite (chl), calcite (cc), and opaque minerals. ((c,d) sample BSSE-2B) Sericite-carbonate-altered diorite with phenocrysts of plagioclase (plag). The plagioclase has been altered to sericite (ser) and calcite. ((e,f) sample BSSE-333C). Silicic-altered vuggy diorite with sericite and quartz (qtz) alteration of the groundmass and drusy quartz filling vugs. The feldspar phenocrysts were poorly preserved, with only clusters of sericite remaining.
Minerals 10 00698 g004
Figure 5. (a) Plots of Zr/TiO2 vs. Nb/Y values of Busang subvolcanic rocks following the diagram of Winchester and Floyd [22]. Also shown is the geochemical trend of volcanic rocks that host the epithermal deposits along the ECKVB (Figure 1; data from Soeria-Atmadja et al. [14]), (b) Chondrite-normalized rare earth element (REE) patterns of the Busang samples. The normalizing values are from Sun and McDonough [26].
Minerals 10 00698 g005

3.2.1. Hydrothermal Alteration

From this study, three types of hypogene hydrothermal alteration were recognized: Chlorite + quartz + calcite ± epidote (“propylitic”), sericite + quartz + calcite + pyrite (“phyllic”), and quartz + sericite ± pyrite ± adularia ± calcite (“silicic”). A similar alteration was described in other reports [2]. Propylitic alteration, which occurred mostly at or near the surface, as well as along the periphery of the drilled area at depth (Figure 3B), was marked by pervasive chlorite ± calcite replacement of pyroxene and amphibole phenocrysts (Figure 4a,b). Anhedral rutile was disseminated sparsely and may have been part of the alteration assemblage. Sericite-carbonate alteration, identified as a “phyllic” alteration by Leach [2], appeared to be present in the center of the Busang drilled area and extendd to at least 330 m below sea level (Figure 3B, Figure 4c,d). This widespread alteration was dominated by sericite + quartz pseudomorphs after feldspar phenocrysts (e.g., Figure 4b) and by ubiquitous calcite and pyrite-dominated sulfides, particularly in the groundmass. Both propylitic- and phyllic-altered diorites here were cross-cut by sulfide stockwork veinlets and veins. The nature and mineralogy of these mineralized veins are described in the next section. Silicification formed massive quartz + pyrite ± calcite ± sericite mosaics after phenocrysts or xenocrysts between quartz vein stockworks or the contacts between quartz veins and host rocks (Figure 4e,f).

3.2.2. Mineralization and Paragenesis

The samples contained weakly-developed base metal mineralization associated with veining and alteration. Although some sulfide and sulfosalt species formed isolated grains or clots and were disseminated sparsely in the host rocks, they principally occurred in quartz + sulfide + calcite veins or replacement zones. Examples of sulfides and sulfosalt mineralization are shown in Figure 6. Five paragenetic stages denoted by “V1–5” were distinguished here based on cross-cutting relationships, and textures such as ove-growths and replacements (Figure 7). The geochemical associations and metal contents of this mineralization are described below.
Earlier mineralization, including that responsible for the highest bulk rock Au anomaly recorded here, occurred as stockwork veinlets and stringers (“V1”) and contained mainly pyrite and chalcopyrite. In the early veins, the first generation of pyrite (py1) was inclusion-free and fractured, whereas a second generation of pyrite (py2) occurred as dendritic inclusion-rich rims around the original pyrite (Figure 6a–d). Disseminated pyrite in the wallrock formed isolated grains, which were coeval with the silicification but may have pre-dated the formation of secondary phyllosilicates. In the stockwork veins, chalcopyrite contained inclusions of an unidentified Fe-As-Cu-S phase (possibly enargite), silicate minerals, and pyrite (Figure 6b).
Later mineralization included “V2-4” quartz-carbonate-sulfate veins, which were banded to massive and host pyrite ± sphalerite ± galena ± chalcopyrite ± sulfosalt assemblages (e.g., bournonite-seligmannite) (Figure 6e–k and Figure 7b). First, texturally massive quartz was deposited as crudely banded “V2” veins. Drusy cavities created by earlier leaching of the wall rocks were filled by euhedral quartz. Silicification of the wall rock occurred concurrently as alteration selvages around veins. “V3” sulfides, Cu-sulfosalts, and carbonates were deposited in earlier formed “V2” quartz veins. In this stage, pyrite formed first, followed by calcite, along with coeval tennantite-tetrahedrite, galena, sphalerite, and minor chalcopyrite (including “chalcopyrite disease” texture [27]). Chalcopyrite and bournonite-seligmannite formed later in the stage, with bournonite-seligmannite appearing to have replaced galena (Figure 6e,k). Later, euhedral “V4” calcite was deposited into vugs and fractures, this mineralization being sulfide-barren. Minor components of Fe, Mn, and Mg were present in these carbonates.
The last stage “V5” mineralization included pyrite replacement by marcasite. Also, minor amounts of gypsum/anhydrite were deposited (e.g., Figure 7b). Clays observable in hand specimen may be related to this stage.

3.2.3. Metal Associations

Bulk-rock assays of the altered and vein-bearing rocks show that gold contents vary from 8 ppb to 139 ppb, with the highest value occurring in the sericite-carbonate-altered andesite crisscrossed by stockwork-style sulfide veinlets (BSSE-295B in bulk-rock geochemical data, Supplementary Materials Table S2). Arsenic, an element typically associated with Au (e.g., John et al. [28] and references therein), also occurred mostly at background concentrations (16–185 ppm). Similarly, the contents of Cu, Pb, and Zn, which ranged widely from 13 ppm to 1140 ppm, 6 ppm to 1300 ppm, and 8 ppm to 215 ppm, respectively, were too low to be economically viable currently. Among the analyzed elements, as and Cu showed a positive correlation with gold. This association is consistent with the ore mineralogy observed for the highest-grade sample as described below.
Electron microprobe analysis of the vein minerals indicates that the unidentified Fe-As-Cu-S phase contained the highest Au concentration (850 ppm) of any mineral phase, followed by Sb-rich bournonite at 630 ppm, sphalerite at 580–590 ppm (plus 130–2490 ppm Ag), and tennantite-tetrahedrite at 160 ppm (plus 25,940 ppm Ag) (Supplementary Materials Table S3). The highest Au content occurring in the Fe-As-Cu-S phase is consistent with highest bulk rock Au assay occurring in a sample containing this phase, which suggests that Au was deposited mostly in the early stockwork event. Element maps show concentric zonation in bournonite-seligmannite with decreasing As content and increasing Sb content throughout its growth sequence, with the Sb rich outer layers being most Au-rich (Figure 6l).

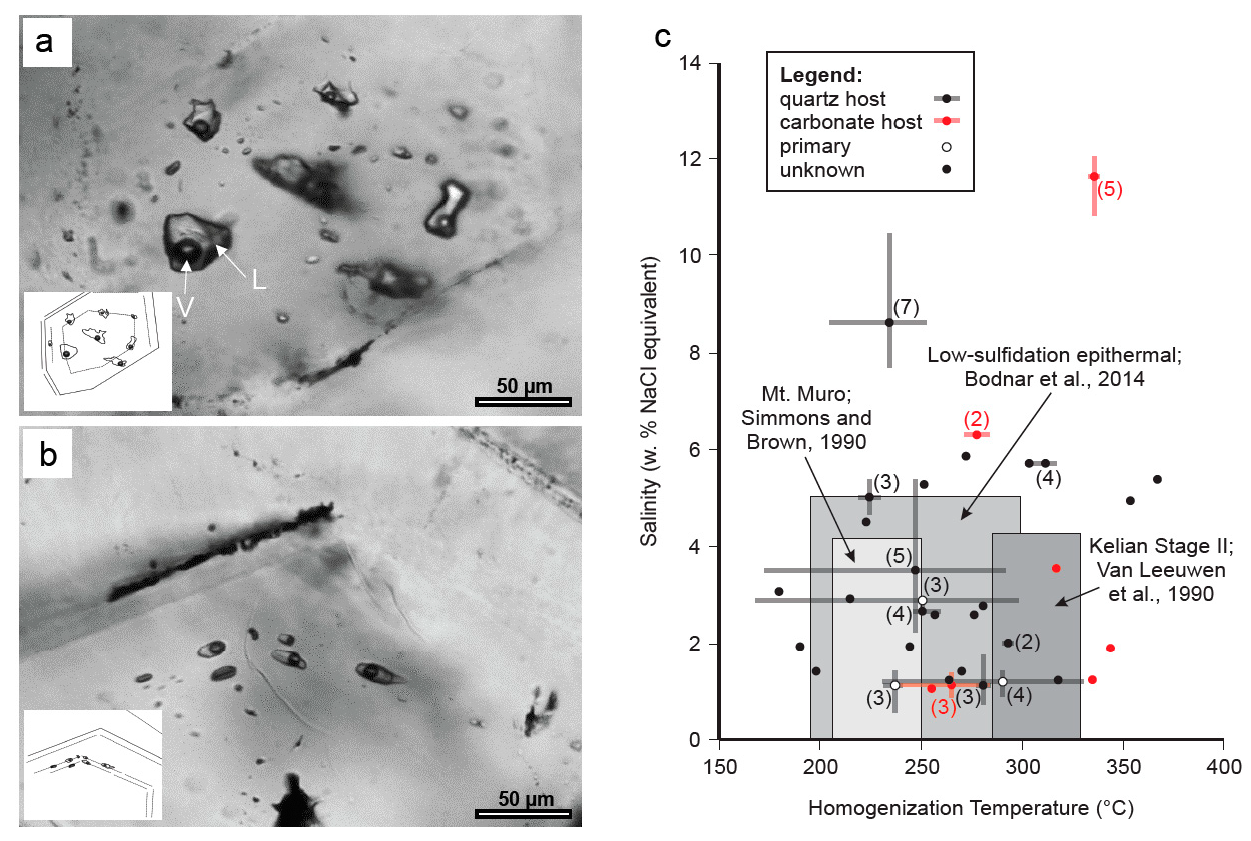
3.3. Fluid Inclusions

In four of the “Milligan samples” (BSSE-1A, B, BSSE-333B, and D), textural observations and microthermometric data were obtained for 68 quartz- and carbonate-hosted fluid inclusions. Forty-eight of these inclusions were hosted in 13 FIAs and the remaining 20 were single inclusions. Given that single inclusions represent the trapping of a fluid at a point in space and time, as do FIA, each was listed as its own FIA, knowing that their reliability is lower. The studied quartz and carbonate minerals were from the crudely banded epithermal veins of stages “V2–5.” The inclusions observed in this study were small (<25 µm and rarely >10 µm), rare, and irregular to prismatic, with some showing negative crystal shapes. All inclusions were two-phase (Laq + V) at room temperature with consistent liquid-to-vapor ratios. No evidence of heterogeneous entrapment was observed. Most FIAs were assigned with unclassified origins, owing to ambiguous crystal planes on which they were found, but a few FIAs showed clearly primary origin, as they outlined euhedral growth zones (Figure 8a,b). Microthermometric data are listed in Supplementary Materials Table S4 and visually presented in Figure 8c along with values from other studies shown as boxes.
Microthermometry on quartz-hosted aqueous fluid inclusion assemblages (n = 13) and lone inclusions (n = 20) in quartz-carbonate-sulfide/sulfosalt veins yielded homogenization temperatures (Th) between 179 °C and 366 °C and bulk salinities between 1.1 wt.% to 8.6 wt.% NaCl equivalent. The FIAs 2, 3, and 25, which were of primary origin, yielded mean Ths of 290.4 °C, 237.0 °C, and 250.1 °C, respectively, and mean salinities of 1.2 wt.%, 1.4 wt.%, and 2.9 wt.% NaCl equivalent, respectively. These primary FIAs had tight ranges in Th and salinity apart from several outliers which likely experienced post-entrapment modification (Figure 8c, see error bars on primary FIAs). Carbonate-hosted assemblages (n = 3) and lone inclusions (n = 3) in the same veins yielded Th between 254 °C and 343 °C and bulk salinities of 1.1 wt.% to 11.6 wt.% NaCl equivalent. The provenance of these carbonate-hosted FIAs and lone inclusions could not be classified except for one which was secondary.

4. Discussion

4.1. Geological Setting and Alteration

The geochemistry and textures of the host rocks at Busang are consistent with the Paleogene-Neogene magmatic rocks that host mineral occurrences along the trend in the KGB. The locally intense propylitic, phyllic, and silicic alteration indicate the presence of strongly reactive hydrothermal fluids and likely high fluid/rock ratios. These alteration zones are spatially associated with NE-SW-trending structures, which likely acted as fluid pathways and possibly localized the emplacement of the inferred causative intrusions (Figure 3). The diorite porphyry reported by Leach [2] below the Southeast Zone could be the causative intrusion or coeval with it, though geochronology of both the intrusive phases and mineralization (i.e., dating of adularia) would be required to confirm this link. At Masupa Ria, a gold prospect along trend from Busang containing the Ongkang vein system (308,000 t at 12.8 g/t Au [16]), Thompson et al. [31] describe altered andesitic porphyritic dykes and flows. The alteration types there include quartz-sericite and propylitic in the deeper levels of the Ongkang vein system (100–150 m below the current surface) and clay-rich alteration in the shallower levels. By comparison, the host rocks and alterations at Busang, which do not show strong clay alteration, appear to be a bare resemblance to those described in deeper levels of the Ongkang vein system at Masupa Ria.

4.2. Genetic Model

The suite of samples, collected as being representative of the Busang Southeast Zone, contained mineralization and alteration indicative of a telescoped porphyry-epithermal system (e.g., Simpson et al. [32]). Changes in the mineralization style throughout the paragenesis were interpreted to indicate a shift from a potentially deeper system (i.e., a porphyry-type stockwork, Figure 7a) to a potentially shallower epithermal vein system (Figure 7b). Whole-rock and microanalytical chemical data suggest that the former mineralization style was more productive with respect to gold in the studied samples. Overprinting of the alteration and early stockwork veins (“V1”) by multiphase re-activated veins (“V2–5”) is evidence for a telescoped system. Exhumation of the system through uplift and erosion during its formation is one mechanism which could have produced the telescoping interpreted here.
No FIs were observed in the earlier “V1” stockwork veins, and thus, the interpretation that they have a deeper porphyry-type association is only speculation. The mineralogy of these veins, being dominantly pyrite, chalcopyrite, and quartz, as well as their associated alteration assemblages, are compatible with a weakly mineralized, calc-alkaline porphyry system [33].
For the later “V2” quartz veins, given that most of the FIA were not classified, the Th and salinity ranges were also likely to contain data from secondary fluids, postdating their formation. However, primary fluid inclusion data for the “V2” quartz veins showed that this stage formed from low to moderate saline (1.1–2.9 wt.% NaCl equivalent) and moderate T (TFormation > Th:Th = 237.0–290.4 °C) hydrothermal fluids, and while an absolute T constraint was not obtained, these data are entirely consistently with the range in data published for global epithermal precious metal deposits [29]. The minimum P entrapment values (Ph = ~30–75 bar:) for the three primary quartz-hosted FIAs (based on average Th-salinity data), are generally compatible with a shallow depth of formation in the epizone (~100–300 m or ~300–800 m minimum depth assuming either lithostatic or hydrostatic gradients, respectively). An additional temperature constraint would be required to determine absolute entrapment P.
The calcite from vein stage “V3” formed from low to moderate saline fluids (from 1.1–11.6 wt.% NaCl) and possibly higher temperatures (TFormation > Th: 254–343 °C) than that of V2 quartz. These higher temperature fluids during the base metal-carbonate stage could have been trapped in secondary inclusions in “V2” quartz, explaining the large range in Th data for FIA in that stage. On the other hand, some of this spread in range was also likely due to post-entrapment modification, as the range of Th within some FIA can be large. If the fluids forming base metal-carbonate mineralization were in fact higher temperature, then this, combined with their higher salinity (up to 11.6 wt.% NaCl), is possible evidence for higher magmatic/meteoric fluid ratios during this stage related to an increase in magmatic fluid flux from the inferred causative intrusion(s).
The mineral assemblages in stage “V3” could indicate cooling toward the end of this stage. The alteration of galena to bournonite (Figure 6k) is a process consistent with a cooling-related increase in the sulfidation state [33]. The Ag contained within galena would have been redistributed to tennantite-tetrahedrite during such a process, accounting for the high concentration of Ag observed by EMPA for this mineral (Supplementary Materials Table S3), a process described by Sack & Goodell [34]. The progression from As- to Sb-rich bournonite-seligmannite (Figure 6l) is also suggestive of cooling [34]. Further speculating that the secondary FIA in “V3” carbonate, which came from some later stage, has the lowest Th for that mineral (FIA 30: Supplementary Materials Table S4), could corroborate the interpretation that the system began to cool toward the end of “V3” vein formation.
The waning of the hydrothermal system was recorded in the stage “V5” mineralization. Marcasite, generally considered to form at relatively low temperatures in hydrothermal systems (<200 °C [30]), replaced and overgrew pyrite. Minor amounts of gypsum/anhydrite were deposited as well, suggesting oxidation of the system, possibly reprecipitating S derived from previously formed sulfides. The decline of the temperature of the hydrothermal system in this stage could have reflected cooler meteoric water circulating through the system, a feature noted at the Kelian deposit in the last paragenetic stage (Kelian stage IV [17]).

4.3. Evaluation of the Epithermal System

Whereas the precious and base metals are present only in subeconomic quantities, the four documented stages of epithermal-style veining have mineralogies bearing strikingly resemblance to those described by Abidin [16] at Masupa Ria along the trend from Busang. Anomalous concentrations of Au have been identified in Cu-sulfosalts within stockwork veins (“V1”), and anomalous concentrations of Ag have been identified in tennantite-tetrahedrite within later-forming epithermal veins (“V3”). Fluid inclusion microthermometric data are consistent with the system, having been dominated by magmatic-hydrothermal fluids diluted by heated meteoric water in its final stages. The values of Th are in agreement with those of other Au deposits and prospects in the region, such as Kelian (290–330 °C [17]), Muyup (200–260 °C [16]), Masupa Ria (100–350 °C [16]), and Mt. Muro (210–250 °C [18]). Salinity versus Th plots demonstrate that the fluid inclusion data collected from this study are comparable to those for epithermal and deposits in the KGB and globally (Figure 8c and Bodnar et al. [29] and Wang et al. [35]).
Based on the criteria set out by White and Hedenquist [36], the crudely banded vein textures are indicative of an intermediate-sulfidation epithermal system. In a recent synthesis of intermediate-sulfidation epithermal deposits, Wang et al. [35] described a typical intermediate sulfidation mineral assemblage consisting of pyrite, sphalerite (light-colored), chalcopyrite, galena, and tetrahedrite-tennantite, which closely matches that of the Busang Southeast Zone, reflecting formation by relatively oxidized fluids above the pyrite-pyrrhotite buffer. The long-lived and dynamic nature of the hydrothermal system, a trait important for ore formation, is evident from the five distinct paragenetic stages that include veining and brecciation. The quantities and species of sulfides and sulfosalts in disseminations and veins are indications that reduced S was abundant, consistent with intermediate-sulfidation.
The absence of both substantial bulk rock Au or Ag anomalies, FIA containing “flashed” fluids (i.e., rapidly boiled), and textures indicative of rapid boiling or fluid mixing, such as colloform and banded veins [36,37], demonstrates that the system was not conducive to the transport and/or efficient concentration of precious metals, at least within the studied area. For example, the Au-bearing veins at Masupa Ria, with similar mineralogy, contain well-formed colloform-cockscomb banded textures indicative of rapid boiling or fluid mixing [37], a feature absent in the samples studied here. It is also possible that the studied samples represent subeconomic, base-metal enriched feeder zones below a boiling horizon which is now eroded and absent. Minor Au mineralization described by Leach [2] in the Central Zone could have been the more distal expression of the base metal-carbonate veins seen here in the Southeast Zone.

5. Conclusions

The study of the “Milligan samples” corroborates the findings of Leach [2], Utoyo [3], and Farquharson [4], demonstrating that the Busang Southeast Zone has many characteristics common to mineralized epithermal deposits in the Kalimantan Gold Belt along which the Busang property lies. The mineral assemblage, consisting of pyrite, sphalerite, chalcopyrite, galena, and Cu-sulfosalts, and the mineralizing fluids had a possible magmatic component derived from an inferred causative intrusion, indicating an intermediate-sulfidation epithermal system. What differentiates the Busang Southeast Zone from other more productive epithermal systems is the absence of vein textures and fluid inclusions, which are diagnostic of efficient boiling or fluid mixing. This confirms that key ore-forming processes were entirely absent within the studied area, or that the samples reflected deeper, poorly developed zones of base metal mineralization that can occur below a (now eroded, and absent) precious metals horizon.

Supplementary Materials

The following are available online at https://www.mdpi.com/2075-163X/10/8/698/s1, Table S1: Analytical methods employed to determine the concentrations of major- and trace-elements, Table S2: Whole-rock geochemical data for select samples from this study, Table S3: EMPA data for spot analyses on sulfides and sulfosalts, Table S4: Table summarizing fluid inclusion data. Inclusions are allocated to FIAs and their origin indicated. Where the origin is not evident the classification of “unclassified” is used.

Author Contributions

This article was distilled from an undergraduate honors thesis by the lead author E.S. completed under the co-supervision of M.Z. and J.H. T.M. through interpretation of technical documents, topographic data, and previous knowledge of Borneo geology added technical data to the geology maps and cross-sections in the Geology section and contributed to the written text. C.T. collected additional fluid inclusion data to supplement those from the thesis increasing the data set, particularly for carbonate minerals. All authors have read and agreed to the published version of the manuscript.

Funding

This research was funded by a Society of Economic Geology Canada Foundation undergraduate research grant, the Shell Experimental Learning Fund (SELF) (c/o Department of Earth Sciences, Dalhousie University), and contributions from MZ Geoscience.

Acknowledgments

This article is dedicated to the legacy of George Clinton Milligan (1919–2018), former professor of geology at Dalhousie University in Halifax, Canada. To the authors of this article, George gave a captivating recount of his visit to the remote site in the jungles of Borneo in February of 1997 which was a short time before the scandal was unearthed. Additional geologic literature of Busang was provided by Daniel Phillip Hellman of HS Consultants of Australia, and Mohamad N. Heriawan of Bandung Institute of Technology (ITB), Indonesia. The EMPA was operated with the assistance of Daniel Macdonald and thin sections were produced by technician Gordon Brown.

Conflicts of Interest

The authors declare no conflict of interest.

References

  1. Heinzl, M. Bre-X Confirms Worst Fears: Busang Has Virtually No Gold. Wall Str. J. 1997. Available online: https://www.wsj.com/articles/SB86279977155130500 (accessed on 6 January 2020).
  2. Leach, T. Alteration and mineralisation in the Busang Gold Prospect, East Kalimantan, Indonesia: 150 Years of Mining. In Proceedings of the AusIMM Annual Conference, Auckland, New Zealand, 1–4 September 2002; pp. 233–238. [Google Scholar]
  3. Utoyo, H. Mineralization of the busang prospect, east kalimantan. Indones. Min. J. 2014, 17. [Google Scholar]
  4. Farquharson, G. Technical Audit for Bre-X Minerals Ltd.: Interim Report; Strathcona Minerals: Toronto, ON, Canada, 1997; p. 54. [Google Scholar]
  5. Slater, E. Geochemical and Fluid Inclusion Study of Hydrothermal Mineralization in the Busang Southeast Zone, Kalimantan, Indonesia: Unique Insight into the Bre-X Scandal. Bachelor’s Thesis, Department of Earth Sciences Dalhousie University, Halifax, NS, Canada, 2013; p. 186, Unpublished.
  6. Steele-MacInnis, M.; Lecumberri-Sanchez, P.; Bodnar, R.J. Hokieflincs_H2O-NaCl: A microsoft excel spreadsheet for interpreting microthermometric data from fluid inclusions based on the PVTX properties of H2O-NaCl. Comput. Sci. 2012, 49, 334–337. [Google Scholar] [CrossRef]
  7. Bodnar, R.J. A method of calculating fluid inclusions volumes based on vapor bubble diameters and P-V-T-X properties of inclusion fluids. Econ. Geol. 1983, 78, 535–542. [Google Scholar] [CrossRef]
  8. Bodnar, R.J. Revised equation and table for determining the freezing point depression of H2O-NaCl solutions. Geochim. Cosmochim. Acta 1993, 57, 683–684. [Google Scholar] [CrossRef]
  9. Bodnar, R.J.; Vityk, M.O. Interpretation of microthermometric data for H2O-Nacl fluid inclusions. In Fluid Inclusions in Minerals, Methods and Applications; de Vivo, B., Frezzotti, M.L., Eds.; Virginia Tech: Blacksburg, VA, USA, 1994; pp. 117–130. [Google Scholar]
  10. Atkinson, A.B., Jr. A model for the PTX properties of H2O-NaCl. Master’s Thesis, Department of Geosciences, Virginia Tech, Blacksburg, VA, USA, 2002; p. 133, Unpublished. [Google Scholar]
  11. Driesner, T.; Heinrich, C.A. The system H2O-NaCl. I. correlation formulae for phase relations in temperature-pressure-composition space from 0 to 1000 °C, 0 to 5000 bar, and 0 to 1 XNaCl. Geochim. Cosmochim. Acta 2007, 71, 4880–4901. [Google Scholar] [CrossRef]
  12. Hamilton, W. Tectonics of the Indonesian Region. Geol. Soc. Malays. 1973, 6, 3–10. [Google Scholar] [CrossRef]
  13. Moss, S.J.; Finch, E.M. Geological implications of new biostratigraphic data from East and West Kalimantan, Indonesia. J. Asian Earth Sci. 1997, 15, 489–506. [Google Scholar] [CrossRef]
  14. Soeria-Atmadja, R.; Noeradi, D.; Priadi, B. Cenozoic magmatism in Kalimantan and its related geodynamic evolution. J. Asian Earth Sci. 1999, 17, 25–45. [Google Scholar] [CrossRef]
  15. Moss, S.J.; Chambers, J.L.C. Tertiary facies architecture in the Kutai Basin, Kalimantan, Indonesia. J. Asian Earth Sci. 1999, 17, 157–181. [Google Scholar] [CrossRef]
  16. Abidin, H.Z. The Tectonic and Mineral Deposits of the East-Central Kalimantan VolcaniC Belt, Indonesia: A Comparative Study of the Kelian, Muyup and Masupa Ria Gold Deposits. Ph.D. Thesis, The University of Adelaide, Adelaide, Australia, 1998; p. 256, Unpublished. [Google Scholar]
  17. van Leeuwen, T.M.; Leach, T.; Hawke, A.A.; Hawke, M.M. The Kelian disseminated gold deposit, East Kalimantan, Indonesia. J. Geochem. Explor. 1990, 35, 1–61. [Google Scholar] [CrossRef]
  18. Wurst, A.T. Geology and genesis of the Permata—Batu Badinding—Hulubai and Kerikil Au-Ag low Sulfidation Epithermal Deposits, Mt Muro, Kalimantan, Indonesia. Ph.D. Thesis, University of Tasmania, Hobart, Australia, 2004; p. 368, Unpublished.
  19. Corbett, G.J. Comments on the structural controls to gold mineralization in central Kalimantan from an inspection on remote sensing imagery. Internal Rep. Rio Tinto Explor. 1995. Unpublished technical report. [Google Scholar]
  20. Atmawinata, S.; Ratman, N.; Baharuddin; Badan Geologi. Peta geologi lembar Muara Ancalong, Kalimantan. In Geological Map of the Muara Ancalong Quadrangle; Pusat Penelitian dan Pengembangan Geologi: Bandung, Indonesia, 1995. [Google Scholar]
  21. le Maitre, R.W. Igneous Rocks. A Classification and Glossary of Terms, 2nd ed.; Cambridge University Press: Cambridge, UK, 2005; p. 256. [Google Scholar]
  22. Winchester, J.A.; Floyd, P.A. Geochemical discrimination of different magma series and their differentiation products using immobile elements. Chem. Geol. 1977, 20, 325–343. [Google Scholar] [CrossRef] [Green Version]
  23. Pearce, J.A.; Norry, M.J. Petrogenetic implications of Ti, Zr, Y, and Nb variations in intrusive rocks. Contrib. Mineral. Petrol. 1979, 69, 33–47. [Google Scholar] [CrossRef]
  24. Leybourne, M.I.; van Wagoner, N.A.; Ayres, L.D. Chemical stratigraphy and petrogenesis of the early proterozoic amisk lake volcanic sequence, flin flon-snow lake greenstone belt, Canada. J. Petrol. 1997, 38, 1541–1564. [Google Scholar] [CrossRef]
  25. PT. Kilborn Pakar Rekayasa. Westralian atan Minerals Busang Gold Project East Kalimantan: Intermediate Feasibility Study Volume 1 Technical and Financial; 1996; Unpublished technical report. [Google Scholar]
  26. Sun, W.; McDonough, W.F. Chemical and isotope systematics of oceanic basalts: Implications for mantle composition and processes. Geol. Soc. Spec. Publ. 1989, 42, 313–345. [Google Scholar] [CrossRef]
  27. Bortnikov, N.S.; Genkin, A.D.; Dobrovol’skaya, M.G.; Muravitskaya, G.N.; Filimonova, A.A. The nature of chalcopyrite inclusions in sphalerite: Exsolution, coprecipitation, or “disease”? Econ. Geol. 1991, 86, 1070–1082. [Google Scholar] [CrossRef]
  28. John, D.A.; Vikre, P.G.; du Bray, E.A.; Blakely, R.J.; Fey, D.L.; Rockwell, B.W.; Mauk, J.L.; Anderson, E.D.; Graybeal, F.T. Descriptive Models for Epithermal Gold-Silver Deposits: U.S. Geological Survey Scientific Investigations Report 2010–5070–Q; U.S. Geological Survey: Reston, VA, USA, 2018; p. 247.
  29. Bodnar, R.J.; Lecumberri-Sanchez, P.; Moncada, D.; Steele-MacInnis, M. Fluid Inclusions in Hydrothermal Ore deposits. In Treatise on Geochemistry, 2nd ed.; Holland, H.D., Turekian, K.K., Eds.; Elsevier: Oxford, UK, 2014; Volume 13, pp. 119–142. [Google Scholar]
  30. Simmons, S.F.; Browne, P.R. Mineralogic, alteration and fluid-inclusion studies of epithermal gold-bearing veins at the Mt. Muro prospect, Central Kalimantan (Borneo), Indonesia. J. Geochem. Explor. 1990, 35, 63–103. [Google Scholar] [CrossRef]
  31. Thompson, J.F.H.; Abidin, H.Z.; Both, R.A.; Martosuroyo, S.; Rafferty, W.J.; Thompson, A.J.B. Alteration and epithermal mineralization in the Masupa Ria volcanic center, Central Kalimantan Indonesia. J. Geochem. Explor. 1994, 50, 429–456. [Google Scholar] [CrossRef]
  32. Simpson, M.P.; Mauk, J.L.; Kendrick, R.G. Telescoped porphyry-style and epithermal veins and alteration at the central Maratoto valley prospect, Hauraki Goldfield, New Zealand. N. Z. J. Geol. Geophys. 2004, 47, 39–56. [Google Scholar] [CrossRef]
  33. Sillitoe, R. Porphyry copper deposits. Econ. Geol. 2010, 105, 3–41. [Google Scholar] [CrossRef] [Green Version]
  34. Sack, R.O.; Goodell, P.C. Retrograde reactions involving galena and Ag-sulfosalts in a zoned ore deposit, Julcani, Peru. Mineral. Mag. 2002, 66, 1043–1062. [Google Scholar] [CrossRef]
  35. Wang, L.; Quin, K.; Song, G.; Li, G. A review of intermediate sulfidation epithermal deposits and subclassification. Ore Geol. Rev. 2019, 107, 434–456. [Google Scholar] [CrossRef]
  36. White, N.C.; Hedenquist, J.W. Epithermal gold deposits: Styles, characteristics and exploration. Soc. Econ. Geol. News Lett. 1995, 23. [Google Scholar]
  37. Moncada, D.; Mutchler, S.; Nieto, A.; Reynolds, T.J.; Rimstidt, J.D.; Bodnar, R.J. Mineral textures and fluid inclusion petrography of the epithermal Ag–Au deposits at Guanajuato, Mexico: Application to exploration. J. Geochem. Explor. 2012, 114, 20–35. [Google Scholar] [CrossRef]
Figure 6. Mineralization in Busang samples. (a) Fractured early pyrite (py1) with minor chalcopyrite (cpy) in stockwork veinlets with a second generation of pyrite (py2) occurring as a skeletal overgrown on py1. (b) Magnified view of image “a” showing a chalcopyrite clot with poly-phase inclusions including pyrite, and an unclassified Fe-As-Cu-S sulfosalt (SS). (c) Magnified view of image “a” with fractured py1 with a skeletal overgrowth of py2. (d) Py1 veinlet with an overgrowth of py2 with a euhedral morphology and abundant silicate inclusions. (e) Polymetallic sulfide seam with sphalerite (sph) galena (gn), seligmannite-bournonite (bn-sgm), tennantite-tetrahedrite (ten-tet), and chalcopyrite in a quartz-carbonate vein; (f) Galena grain partially replaced by seligmannite-bournonite in quartz veins; (g) Clot of seligmannite-bournonite, galena, and pyrite in a quartz vein. (h) Rounded pyrite clot with galena-filled fractures. (i) Sulfide-seam in quartz-carbonate vein. Euhedral py (py2?) overgrown by chalcopyrite, sphalerite, and galena. Sphalerite here has abundant chalcopyrite disease. (j) Sulfide seam with early fractured pyrite, sphalerite, and galena in a quartz-carbonate vein. (k) Seligmannite-bournonite which has partially replaced galena. (l) EMPA element maps of the seligmannite-bournonite shown in “k” for arsenic (As) and antimony (Sb). Warm colors indicate higher abundances.
Minerals 10 00698 g006
Figure 7. Paragenetic sequence of the Busang Southeast Zone from this study with examples. Dashed lines indicate that mineralization was minor or less common. The paragenesis was divided into porphyry and epithermal environments and further subdivided into substages, with an interpretation discussed below. Gold and silver were not directly observed but implied from their association with V1 and V3 stage minerals. (a) Stockwork style mineralization from sample BSSE-333B, and (b) banded quartz-carbonate-base metal-sulfate vein from sample BSSE-1A.
Minerals 10 00698 g007
Figure 8. Fluid inclusion images in quartz. (a,b) Micrographs of primary FIAs in quartz. Note that the FIAs follow primary growth zones as illustrated in the inset images. (c) Plot of mean salinity vs. mean homogenization temperature by FIA. Field for low-sulfidation epithermal deposits modified from Bodnar et al. [29] is shown. Also, fields from the Mt. Muro and Kelian deposits in the KGB are shown from studies by Simmons & Brown [30] and Van Leeuwen et al. [17], respectively.
Minerals 10 00698 g008
Table 1. List of the 12 drill core drill samples examined in this study.
Drill Hole (Sample)Interval, mRock Type
BSSE-1(A)192.50–193.50Porphyritic diorite
BSSE-1(B)309.50–310.50Porphyritic diorite
BSSE-2(A)42.00–43.00Polymictic breccia
BSSE-2(B)301.00–302.00Porphyritic diorite
BSSE-2(C)329.00–330.00Porphyritic diorite
BSSE-295(A)235.75–235.85Porphyritic diorite/volcaniclastic rock
BSSE-295(B)368.00–369.00Porphyritic gabbro-diorite
BSSE-333(A)154.00–155.00Porphyritic diorite
BSSE-333(B)272.00–273.00Porphyritic diorite + quartz stockwork
BSSE-333(C)286.00–287.00Vuggy diorite
BSSE-333(D)308.00–309.00Porphyritic diorite + quartz veins
BSSE-333(E)396.00–397.00Porphyritic diorite + quartz-sulfide veins

