The Graphite Occurrences of Northern Norway, a Review of Geology, Geophysics, and Resources

 ,
, 
Abstract
:
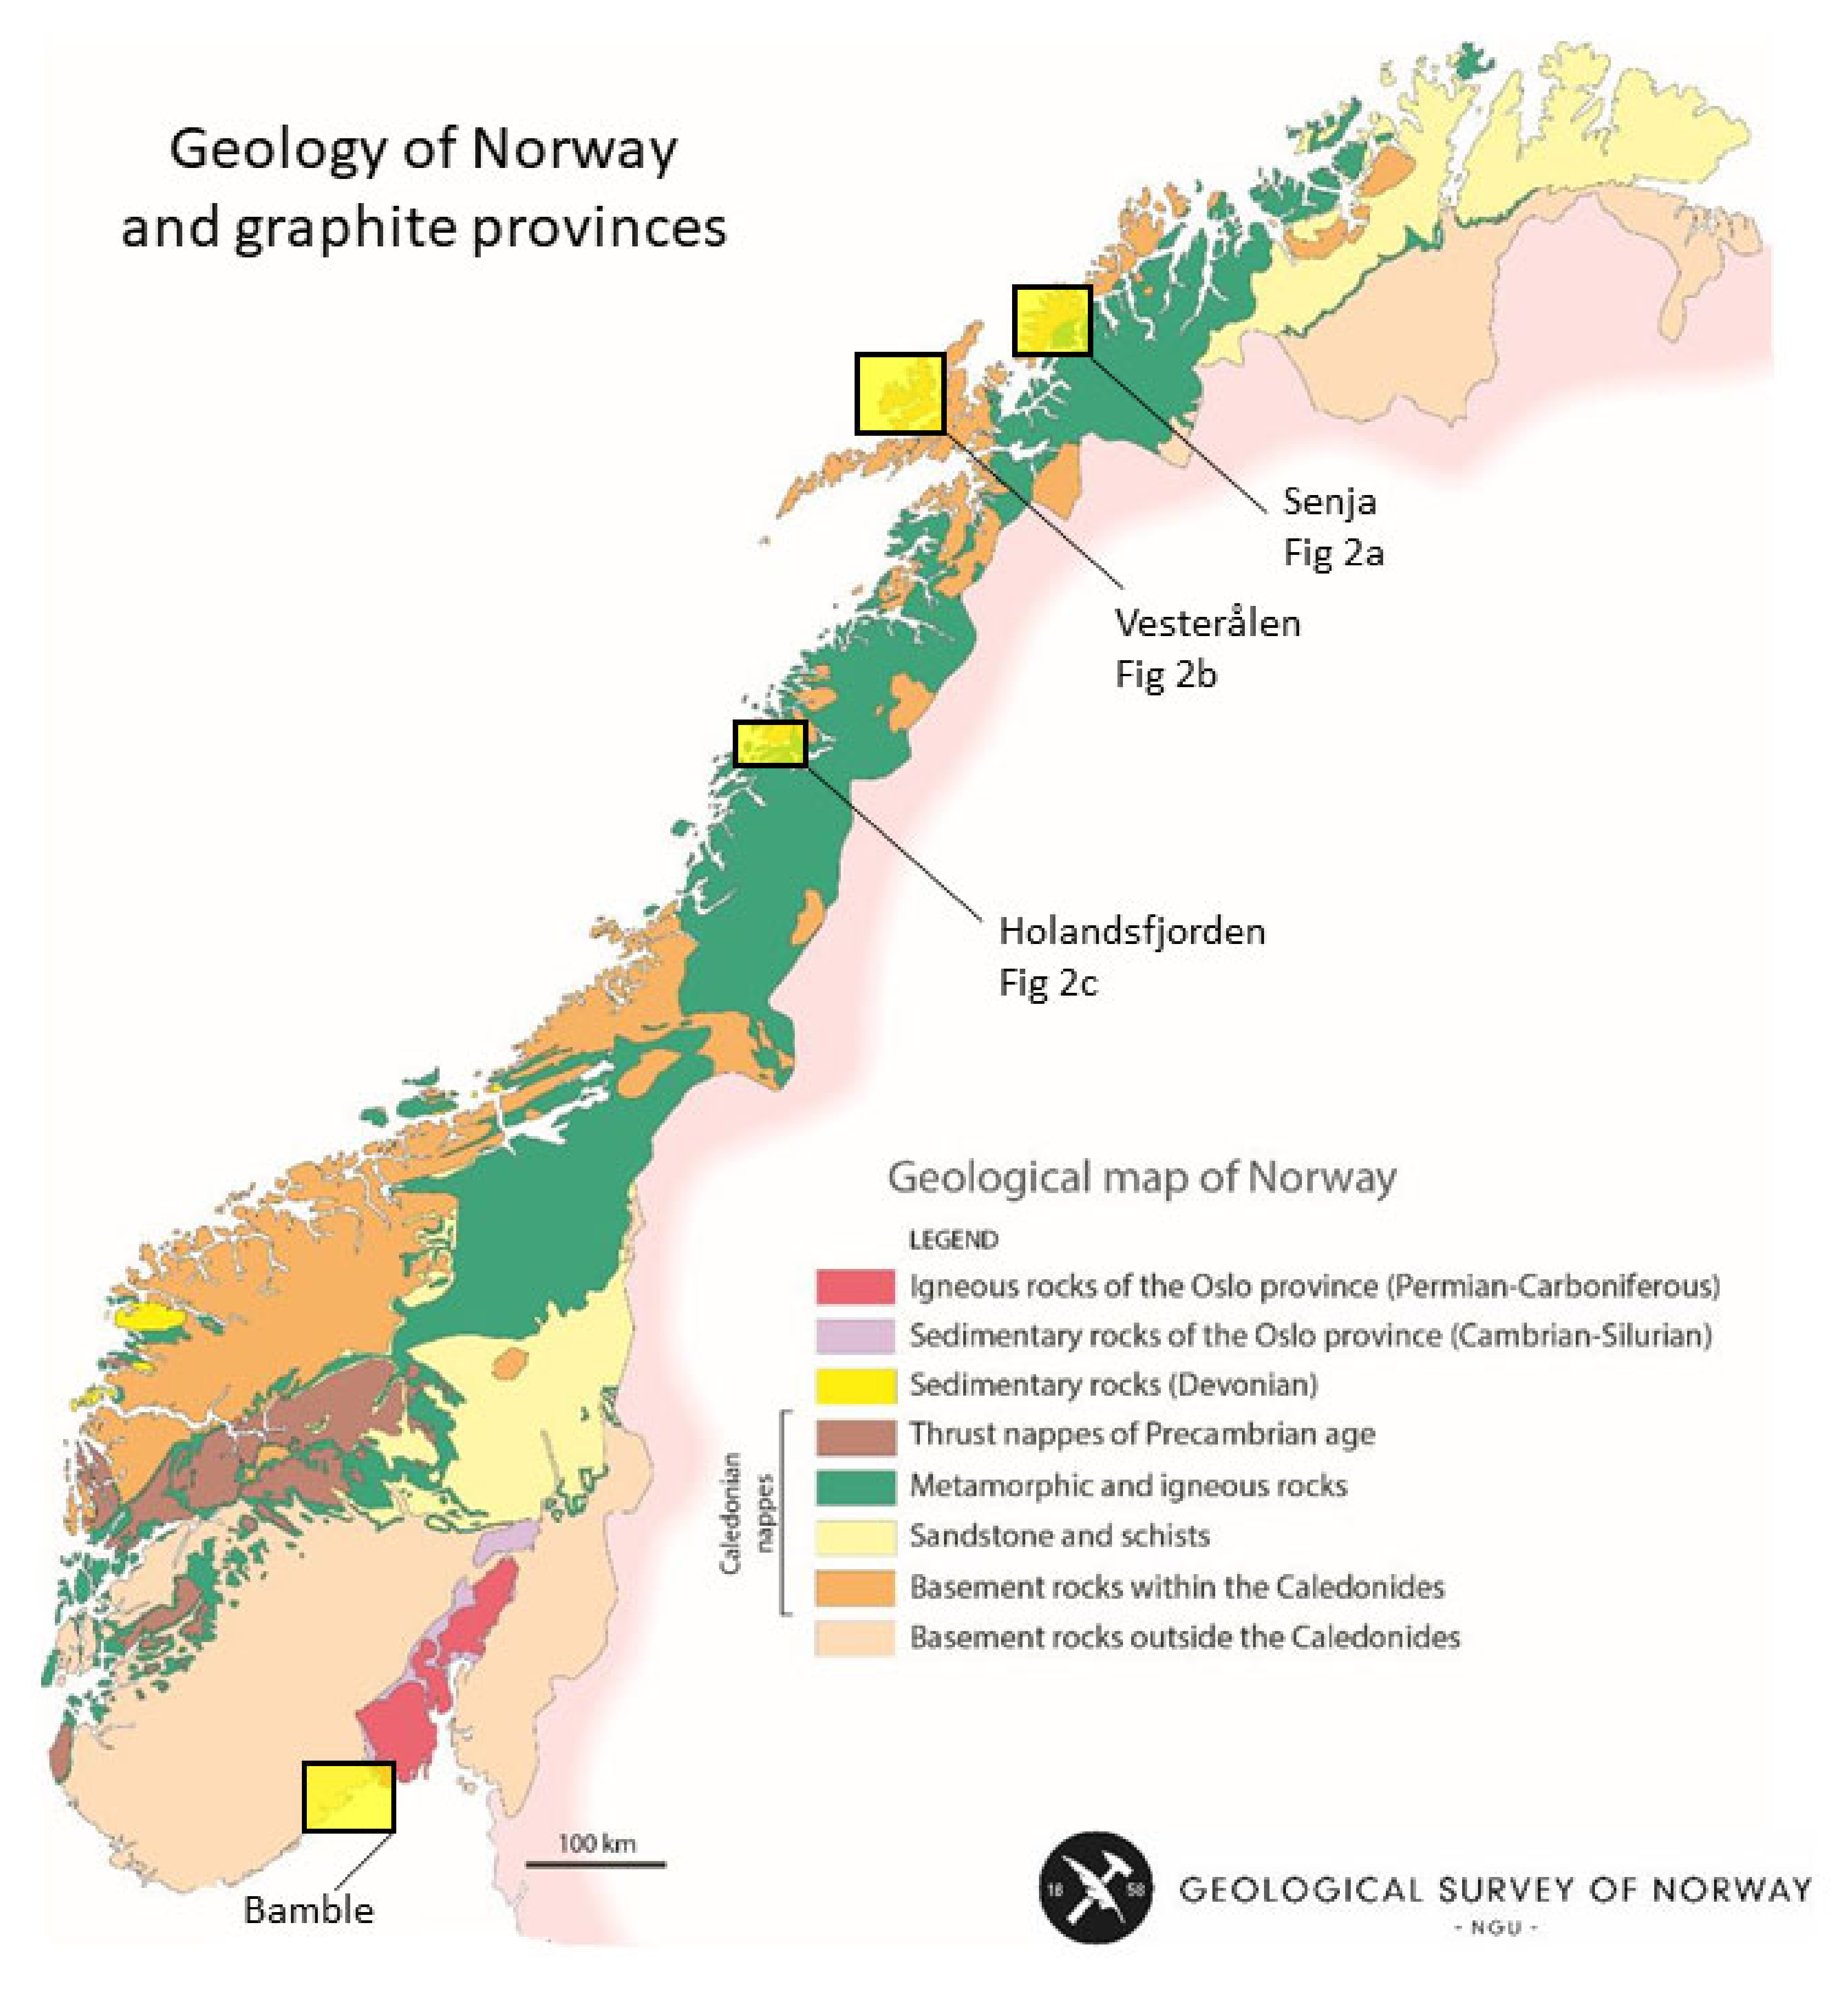
1. Introduction
2. Geological Setting
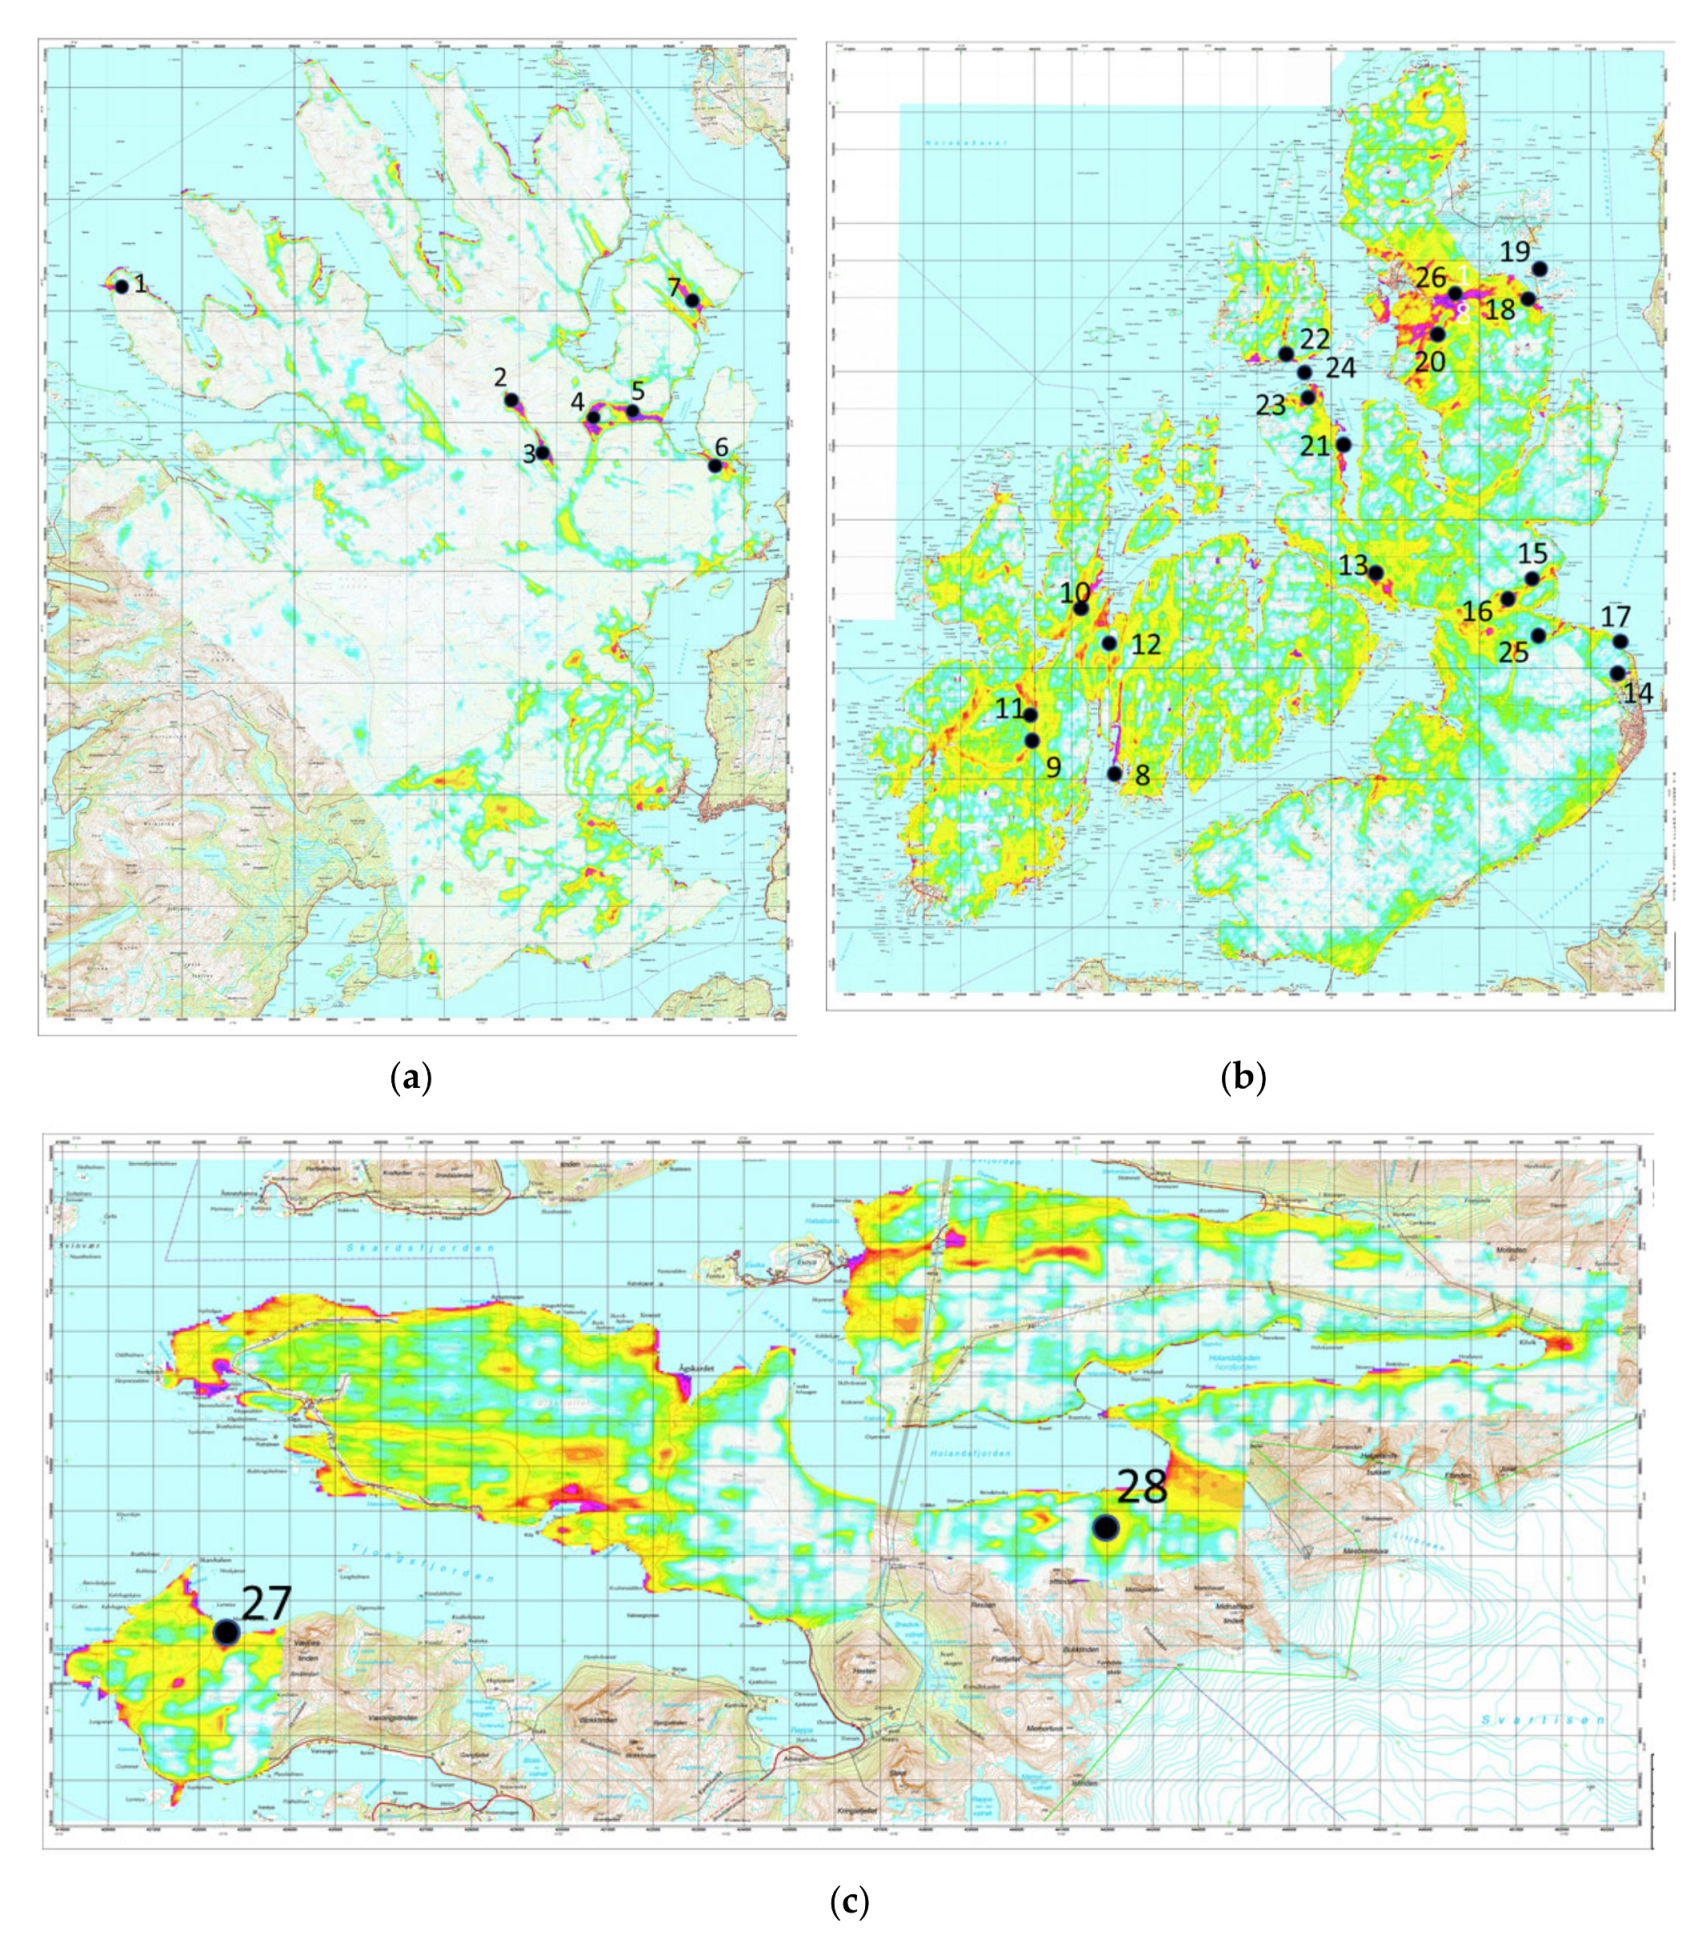
2.1. Senja
2.2. Vesterålen Area
2.3. Holandsfjord Area
3. Previous and Recent Work
4. Materials and Methods
4.1. Geophysical Methods
- Ground EM measurements with the use of EM31 [112].
- Charged- and self-potential (CP/SP), using in-house-developed equipment.
4.2. Petrophysical Measurements
4.3. Geological Methods
4.4. Geochemical Methods
4.5. Bench Scale Beneficiation
5. Results
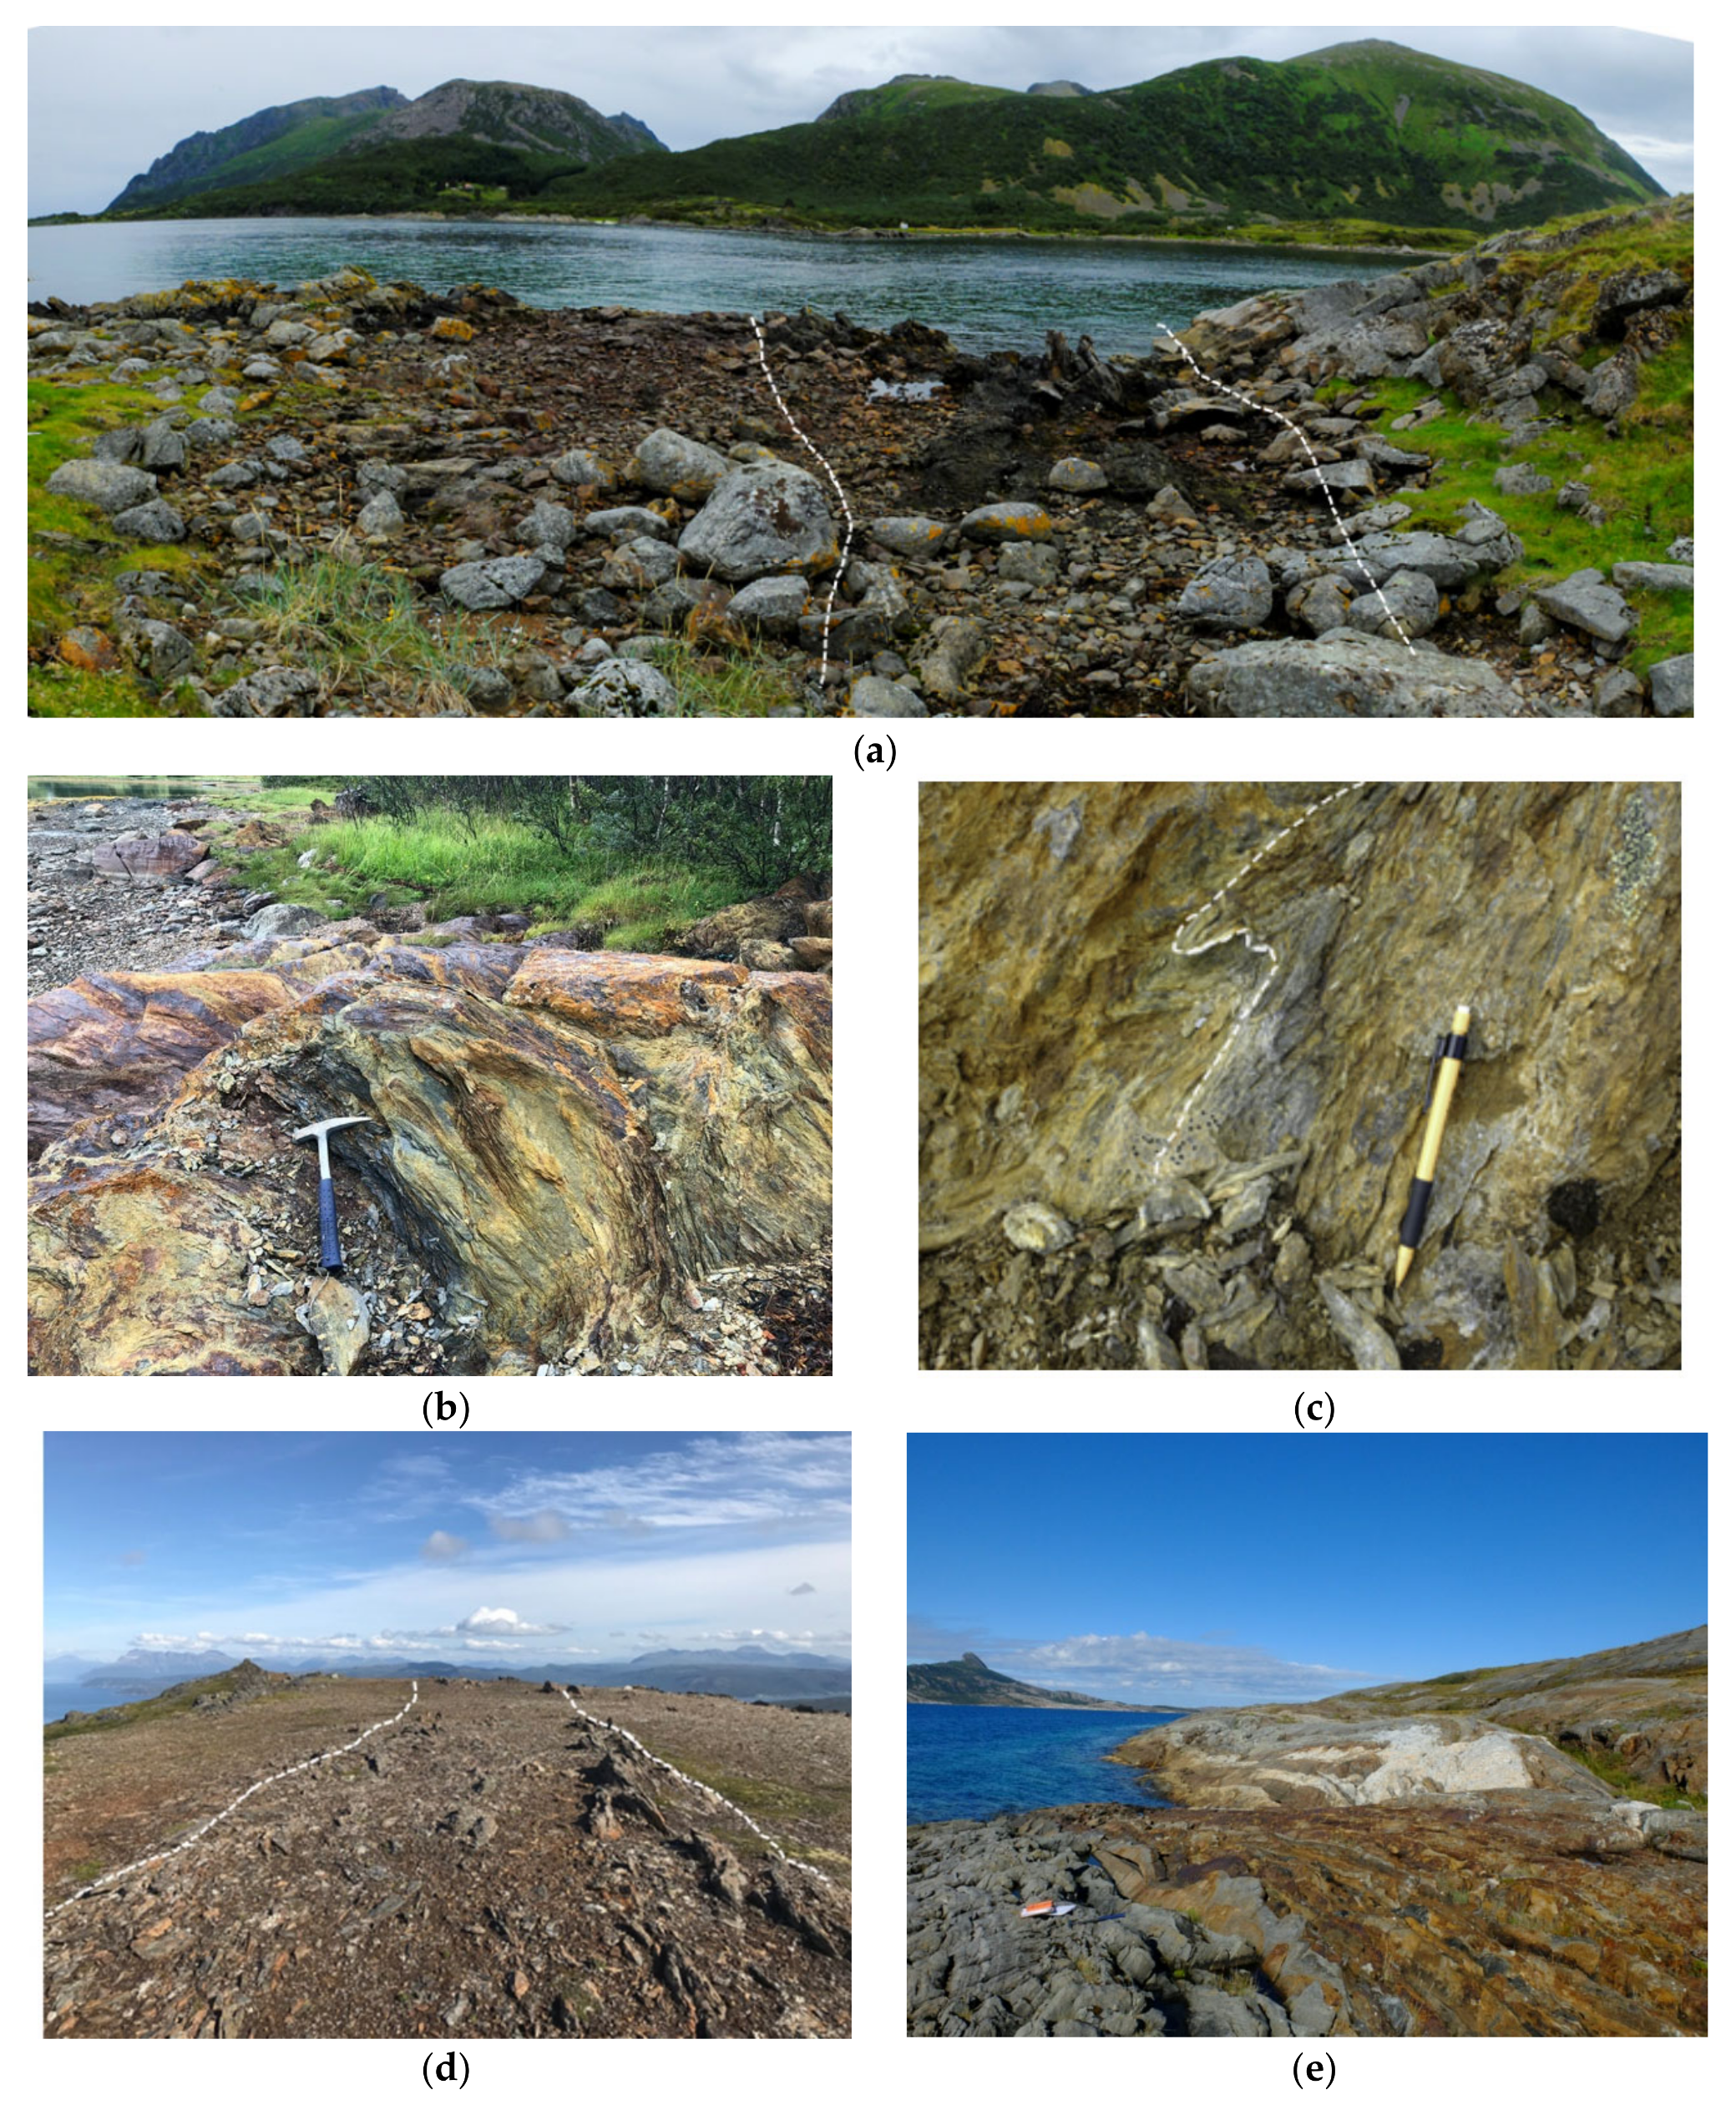
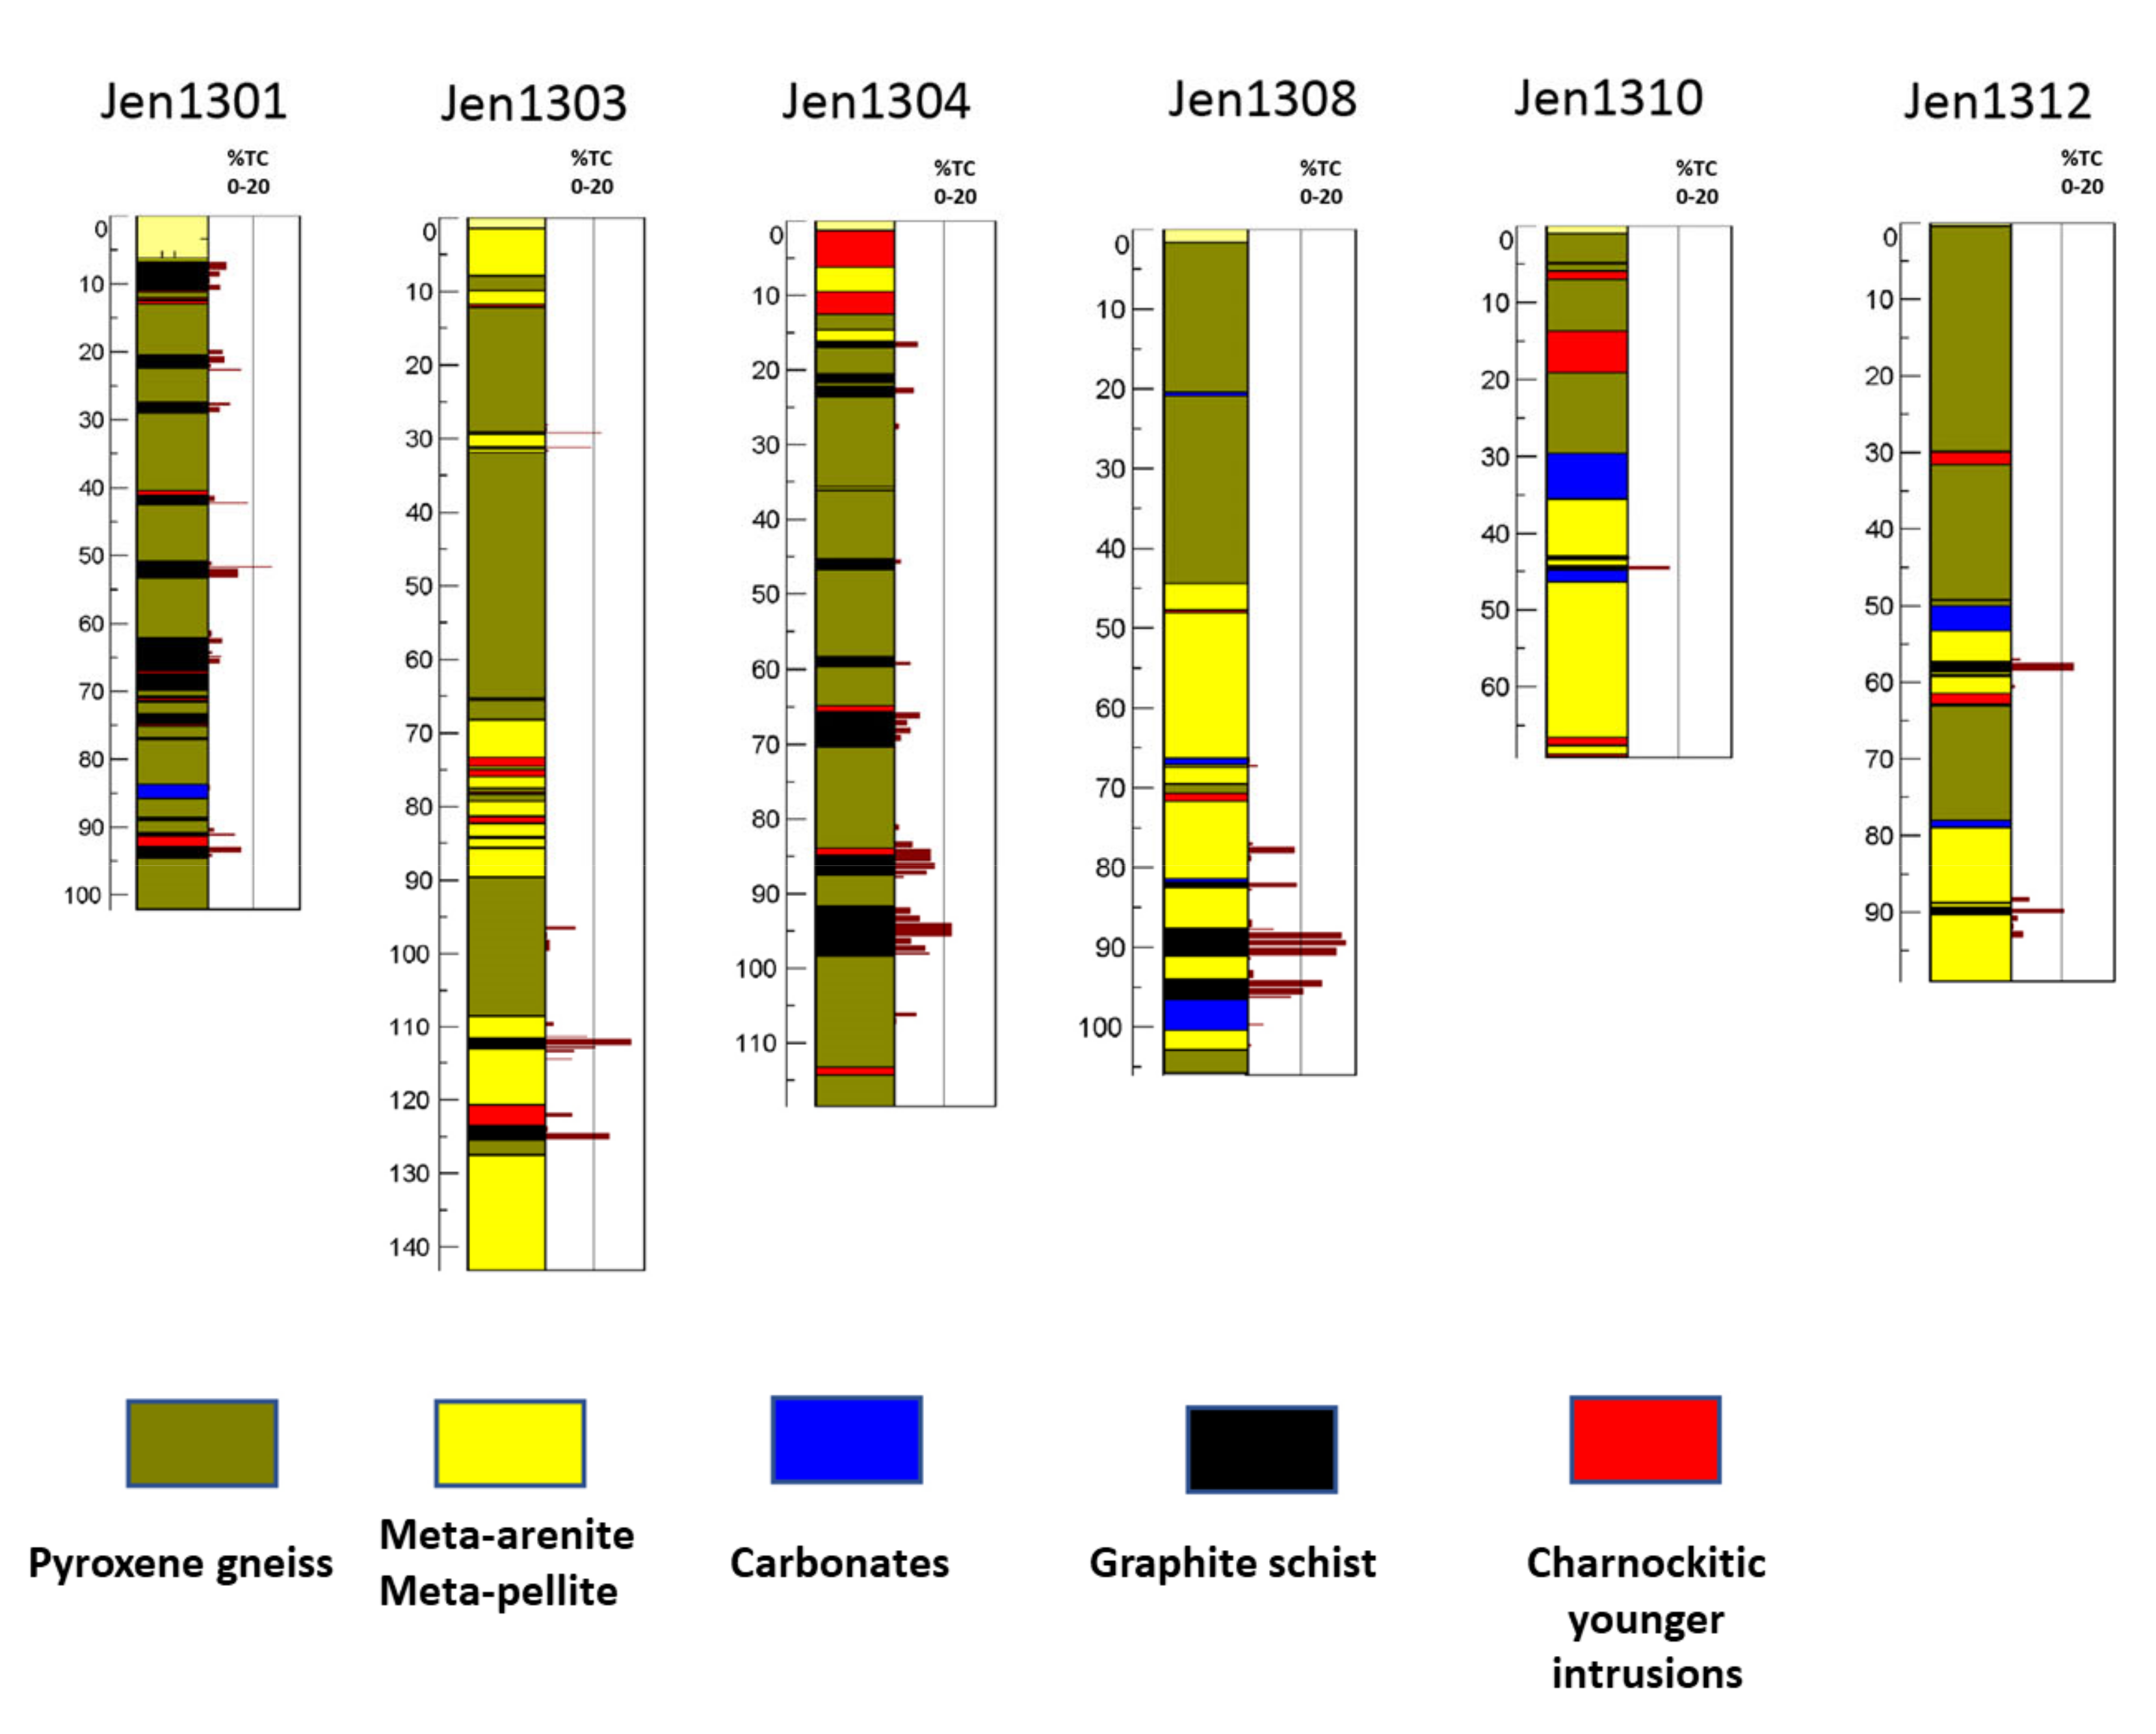
5.1. Geology of the Graphite-Bearing Units
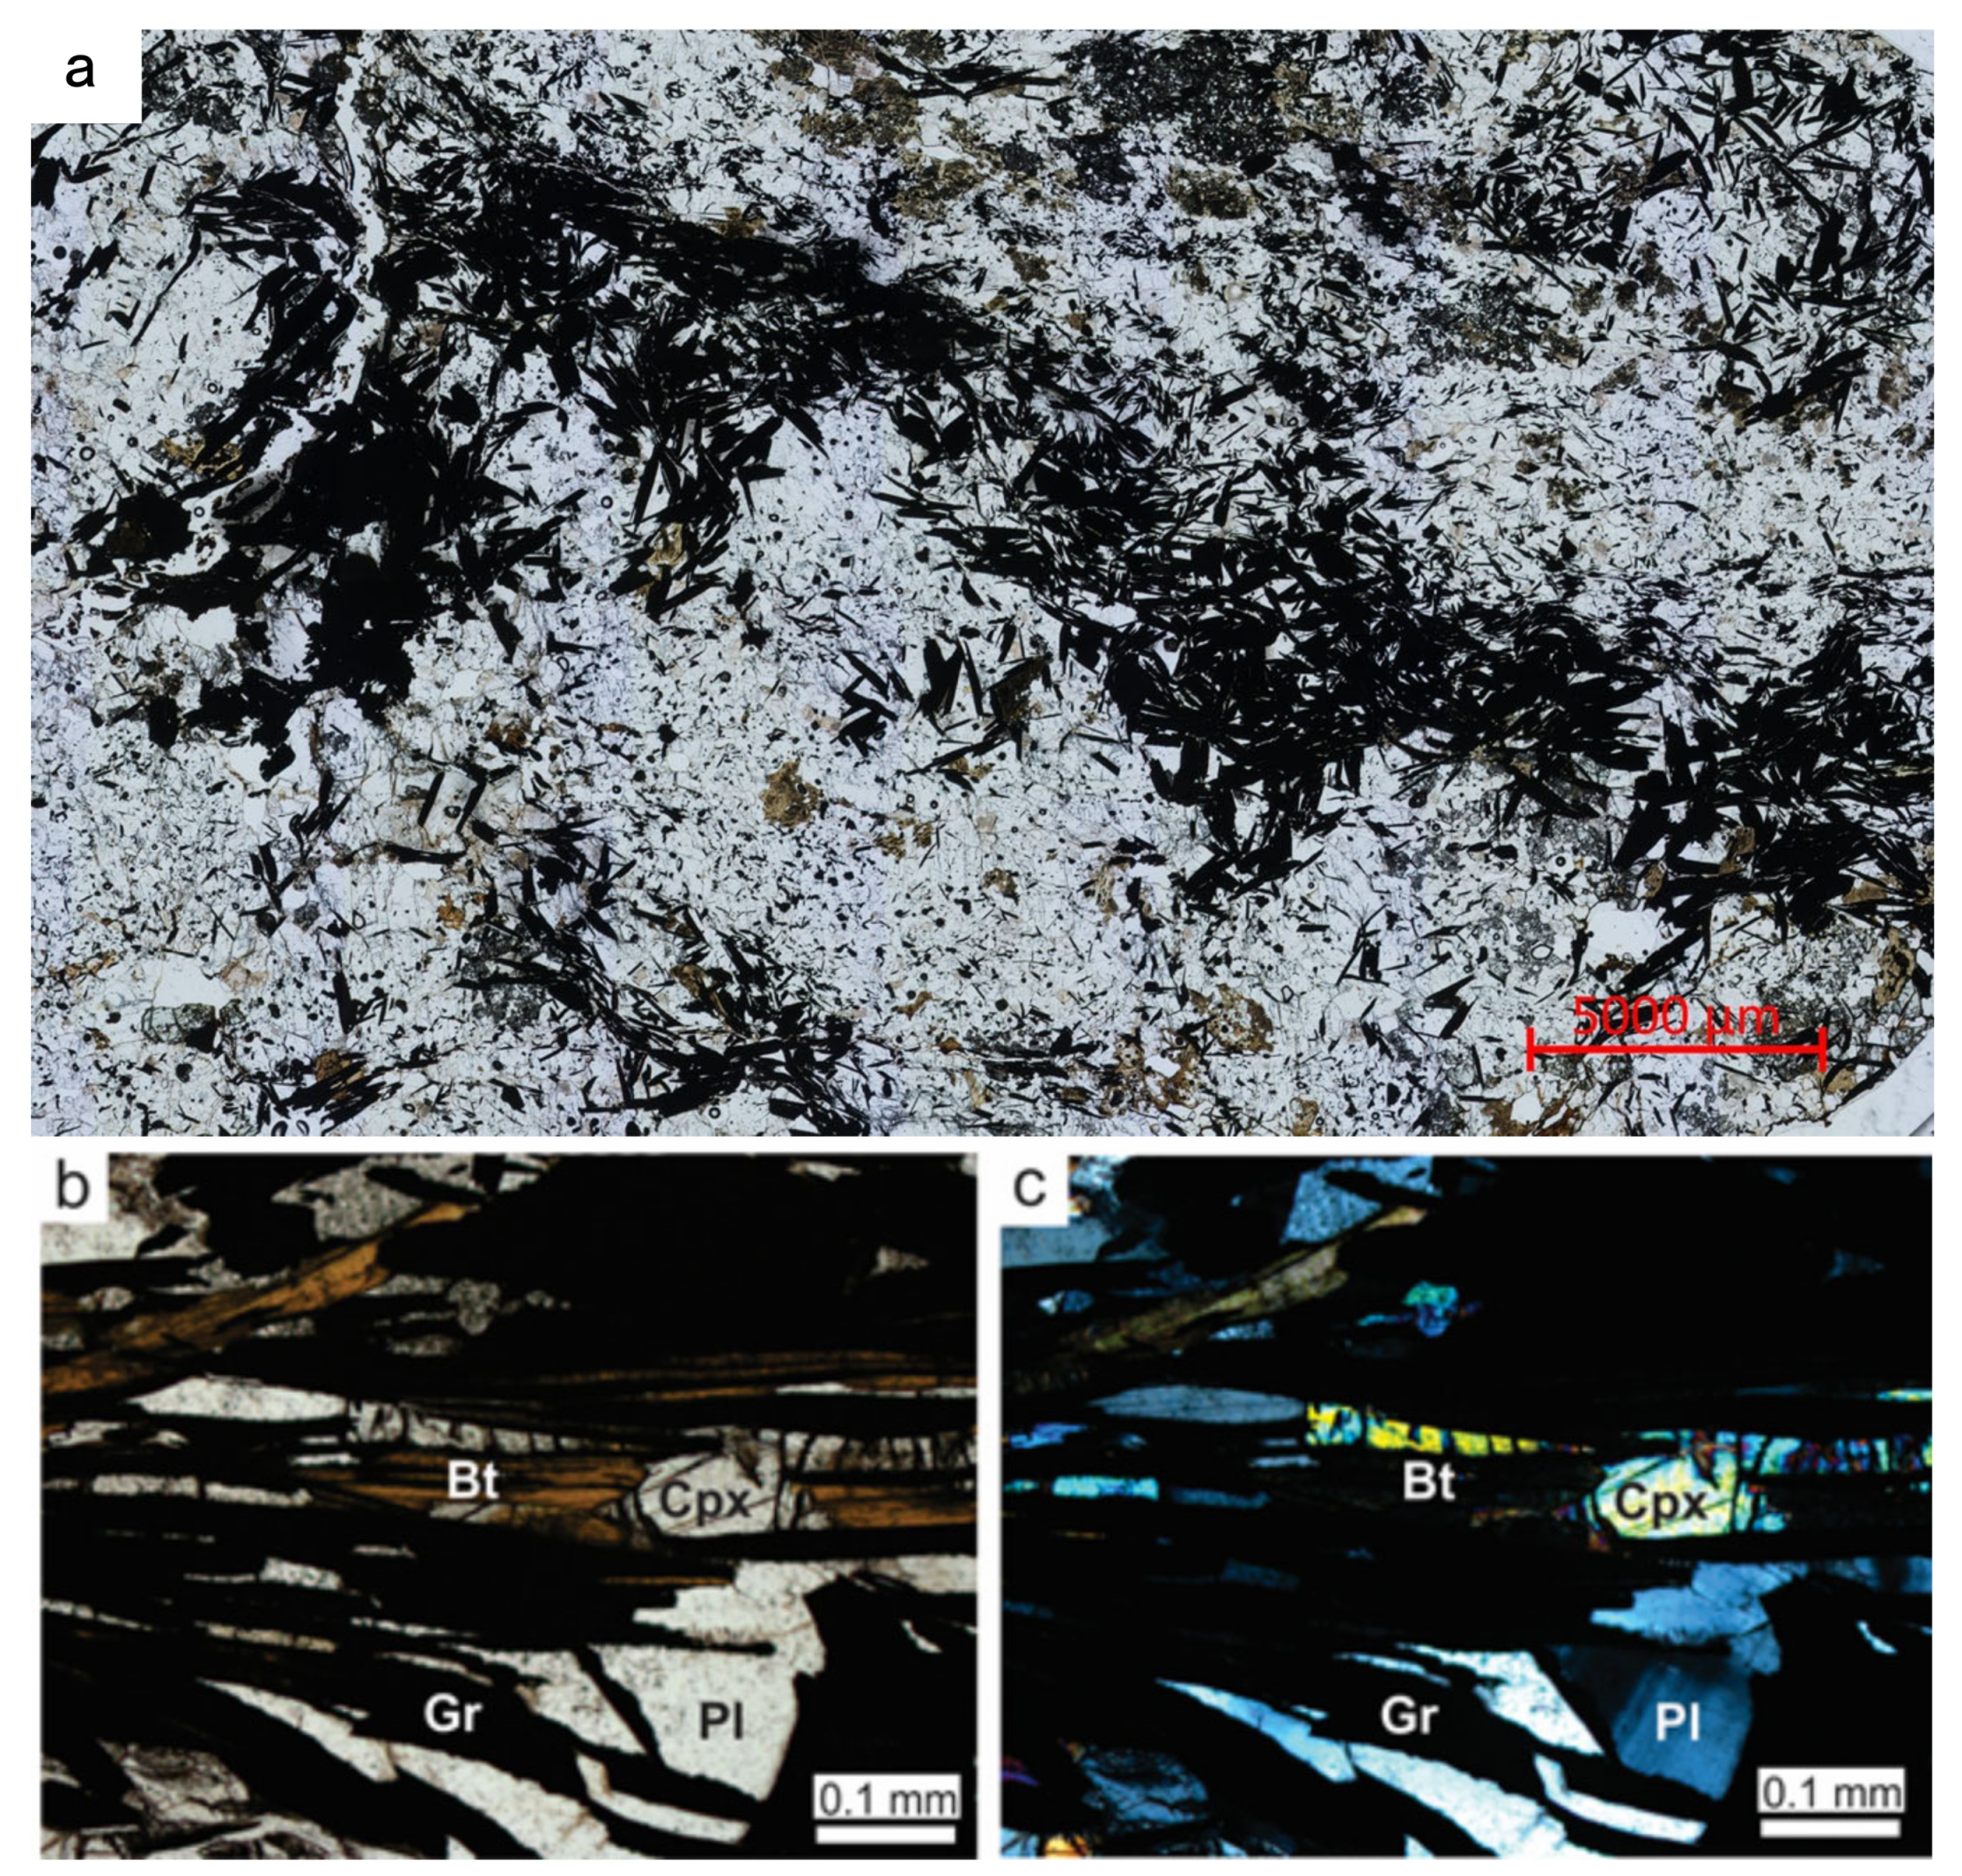
5.2. Petrography of Graphite Schist
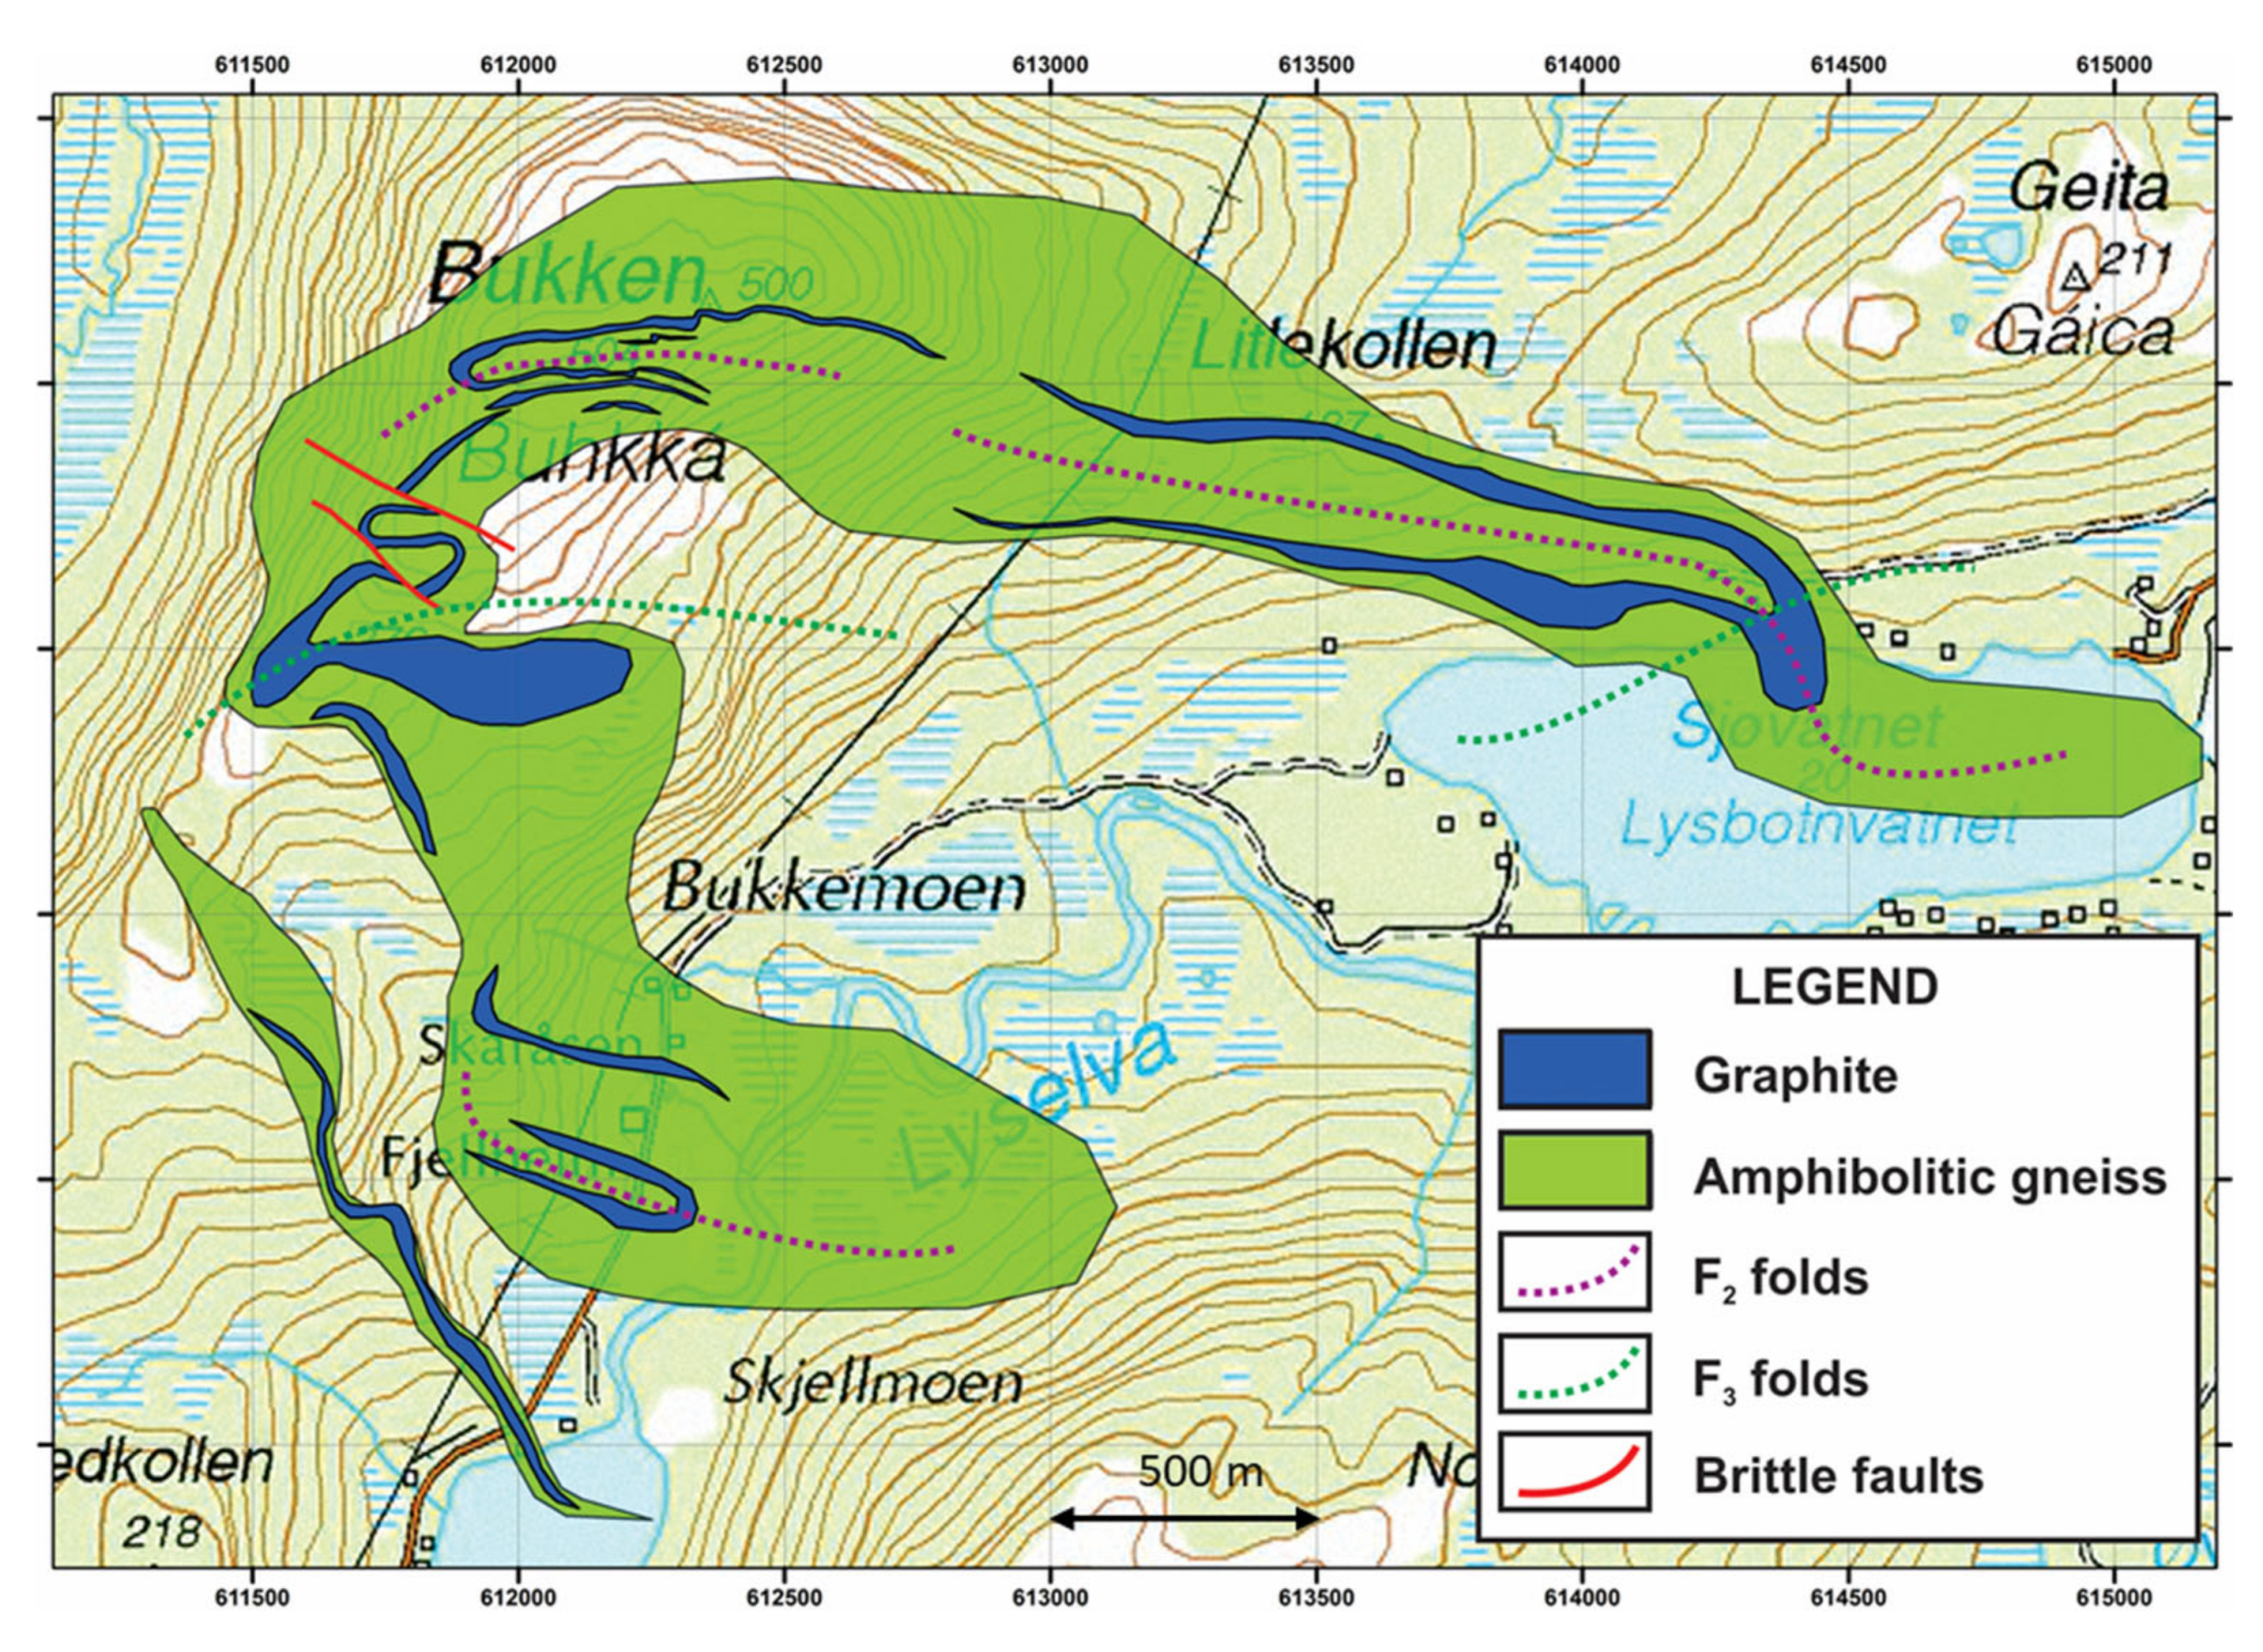
5.3. Structural Geology of the Graphite-Bearing Units
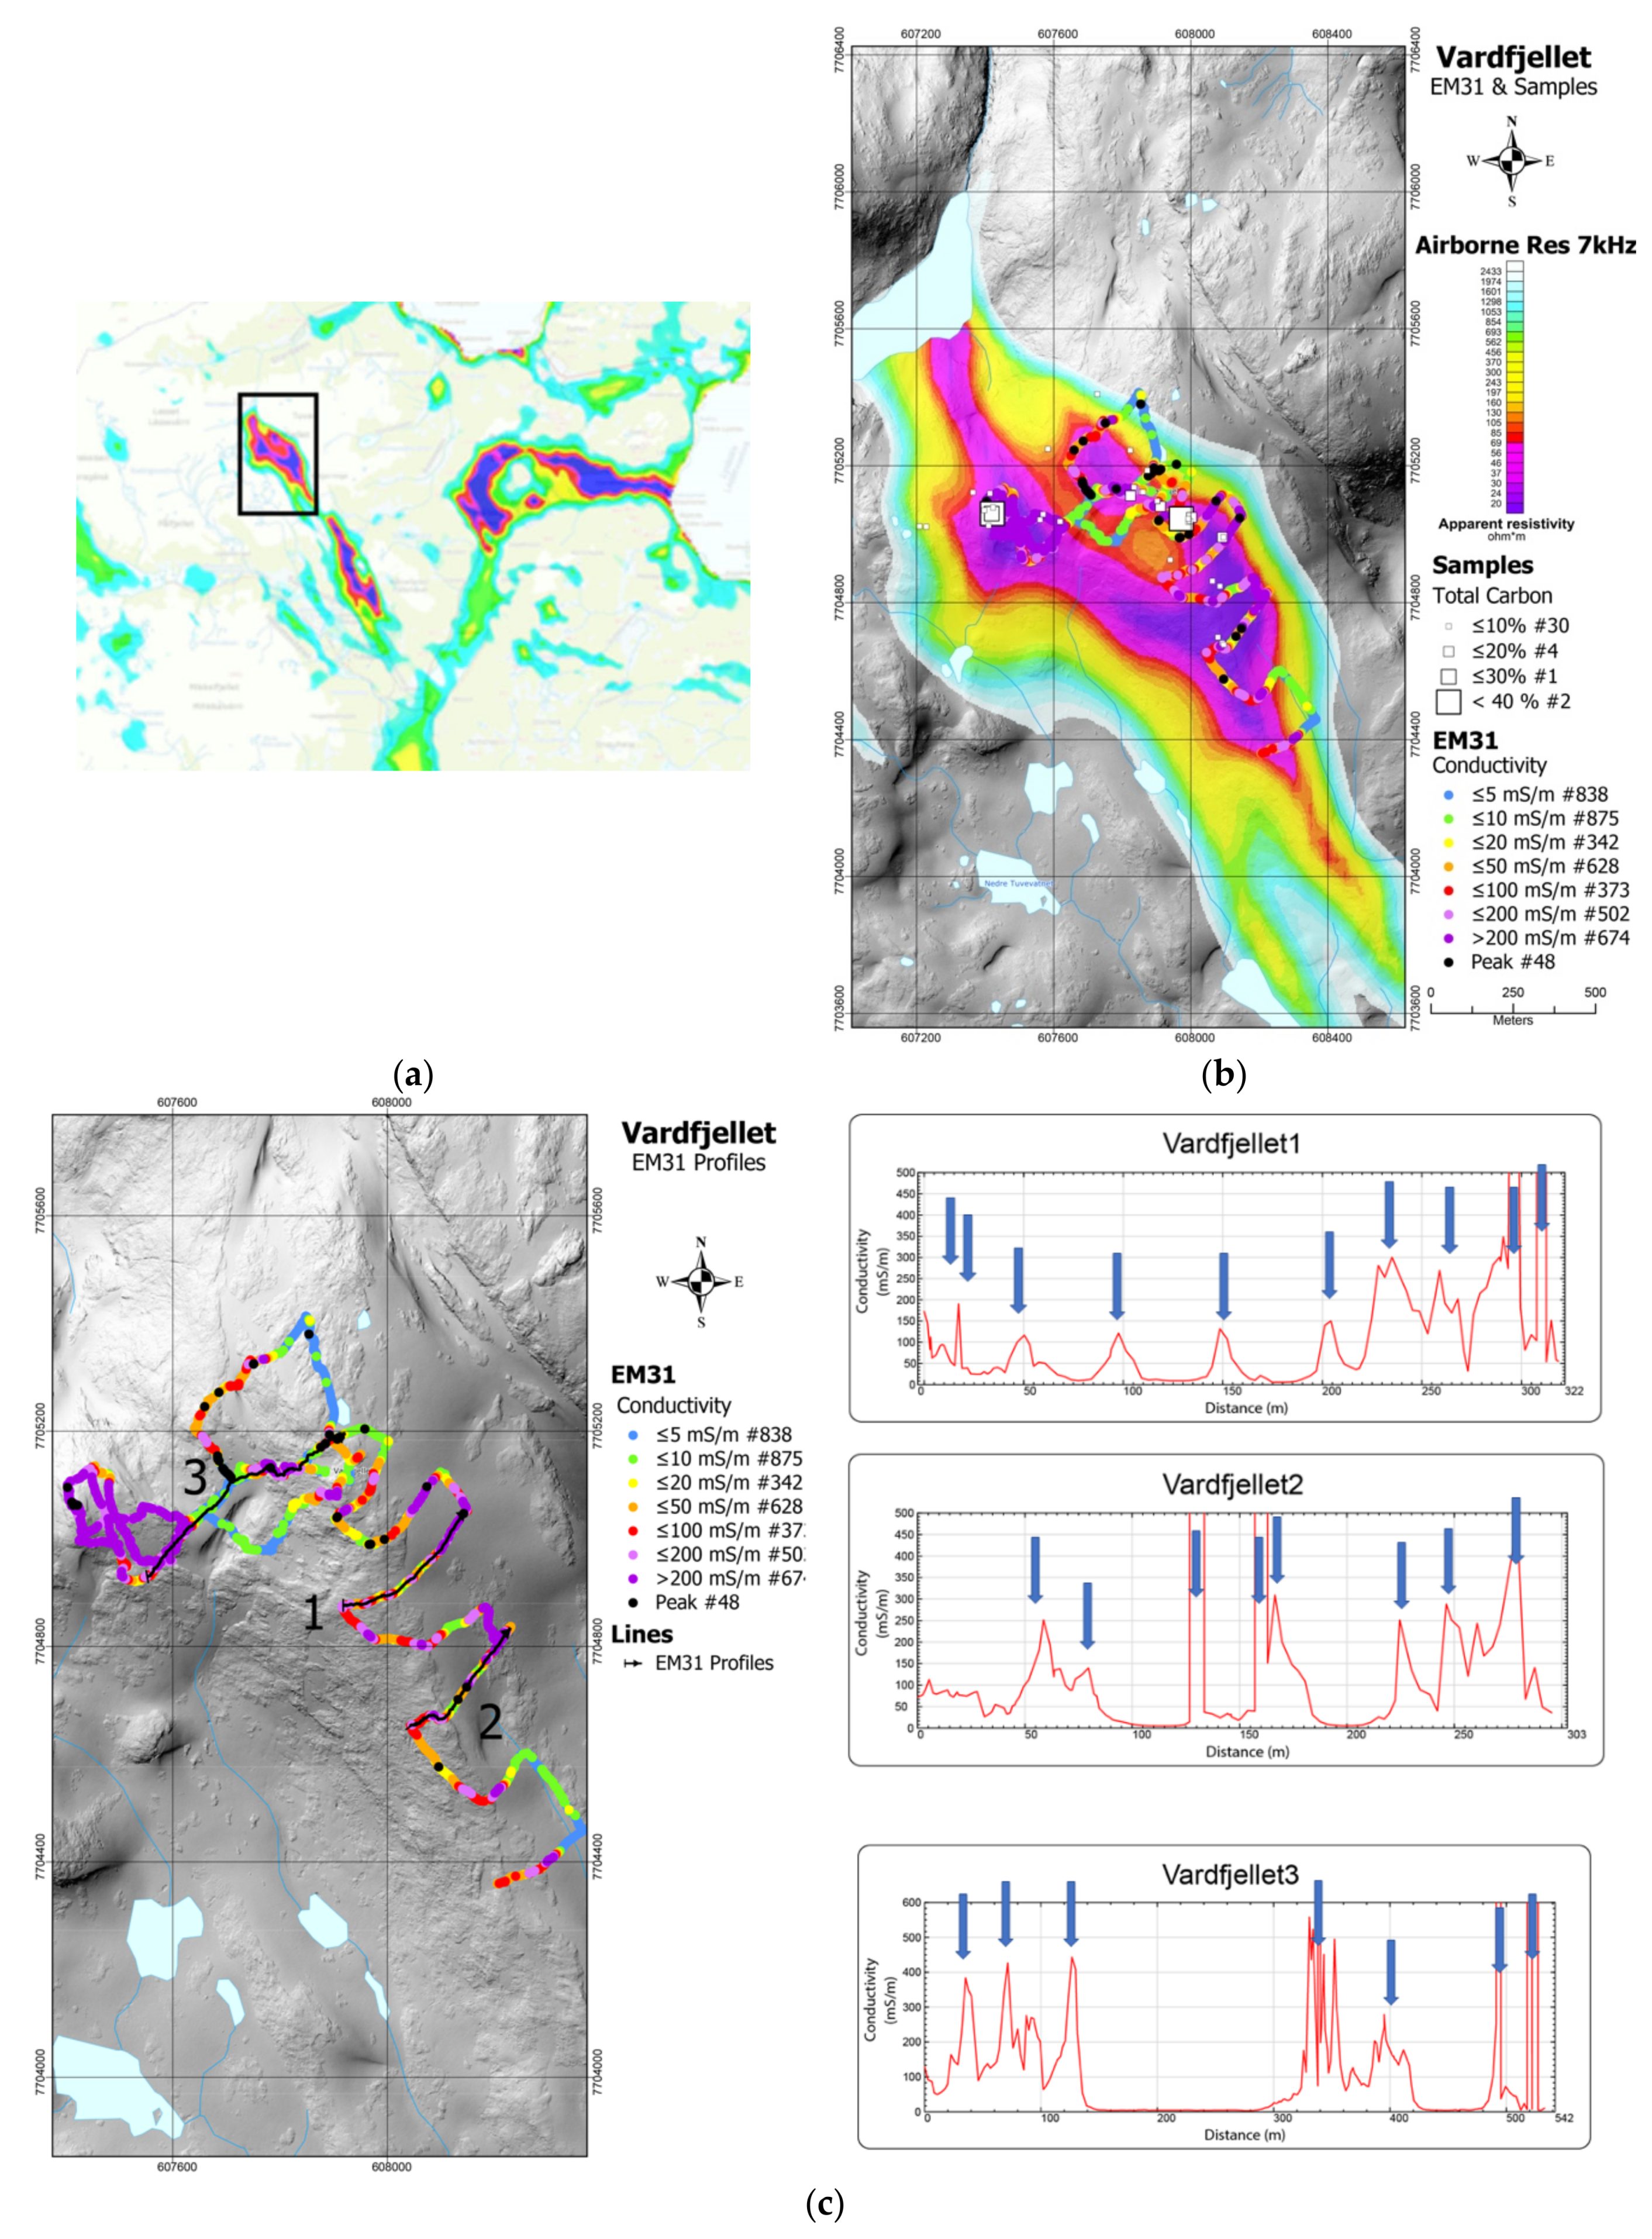
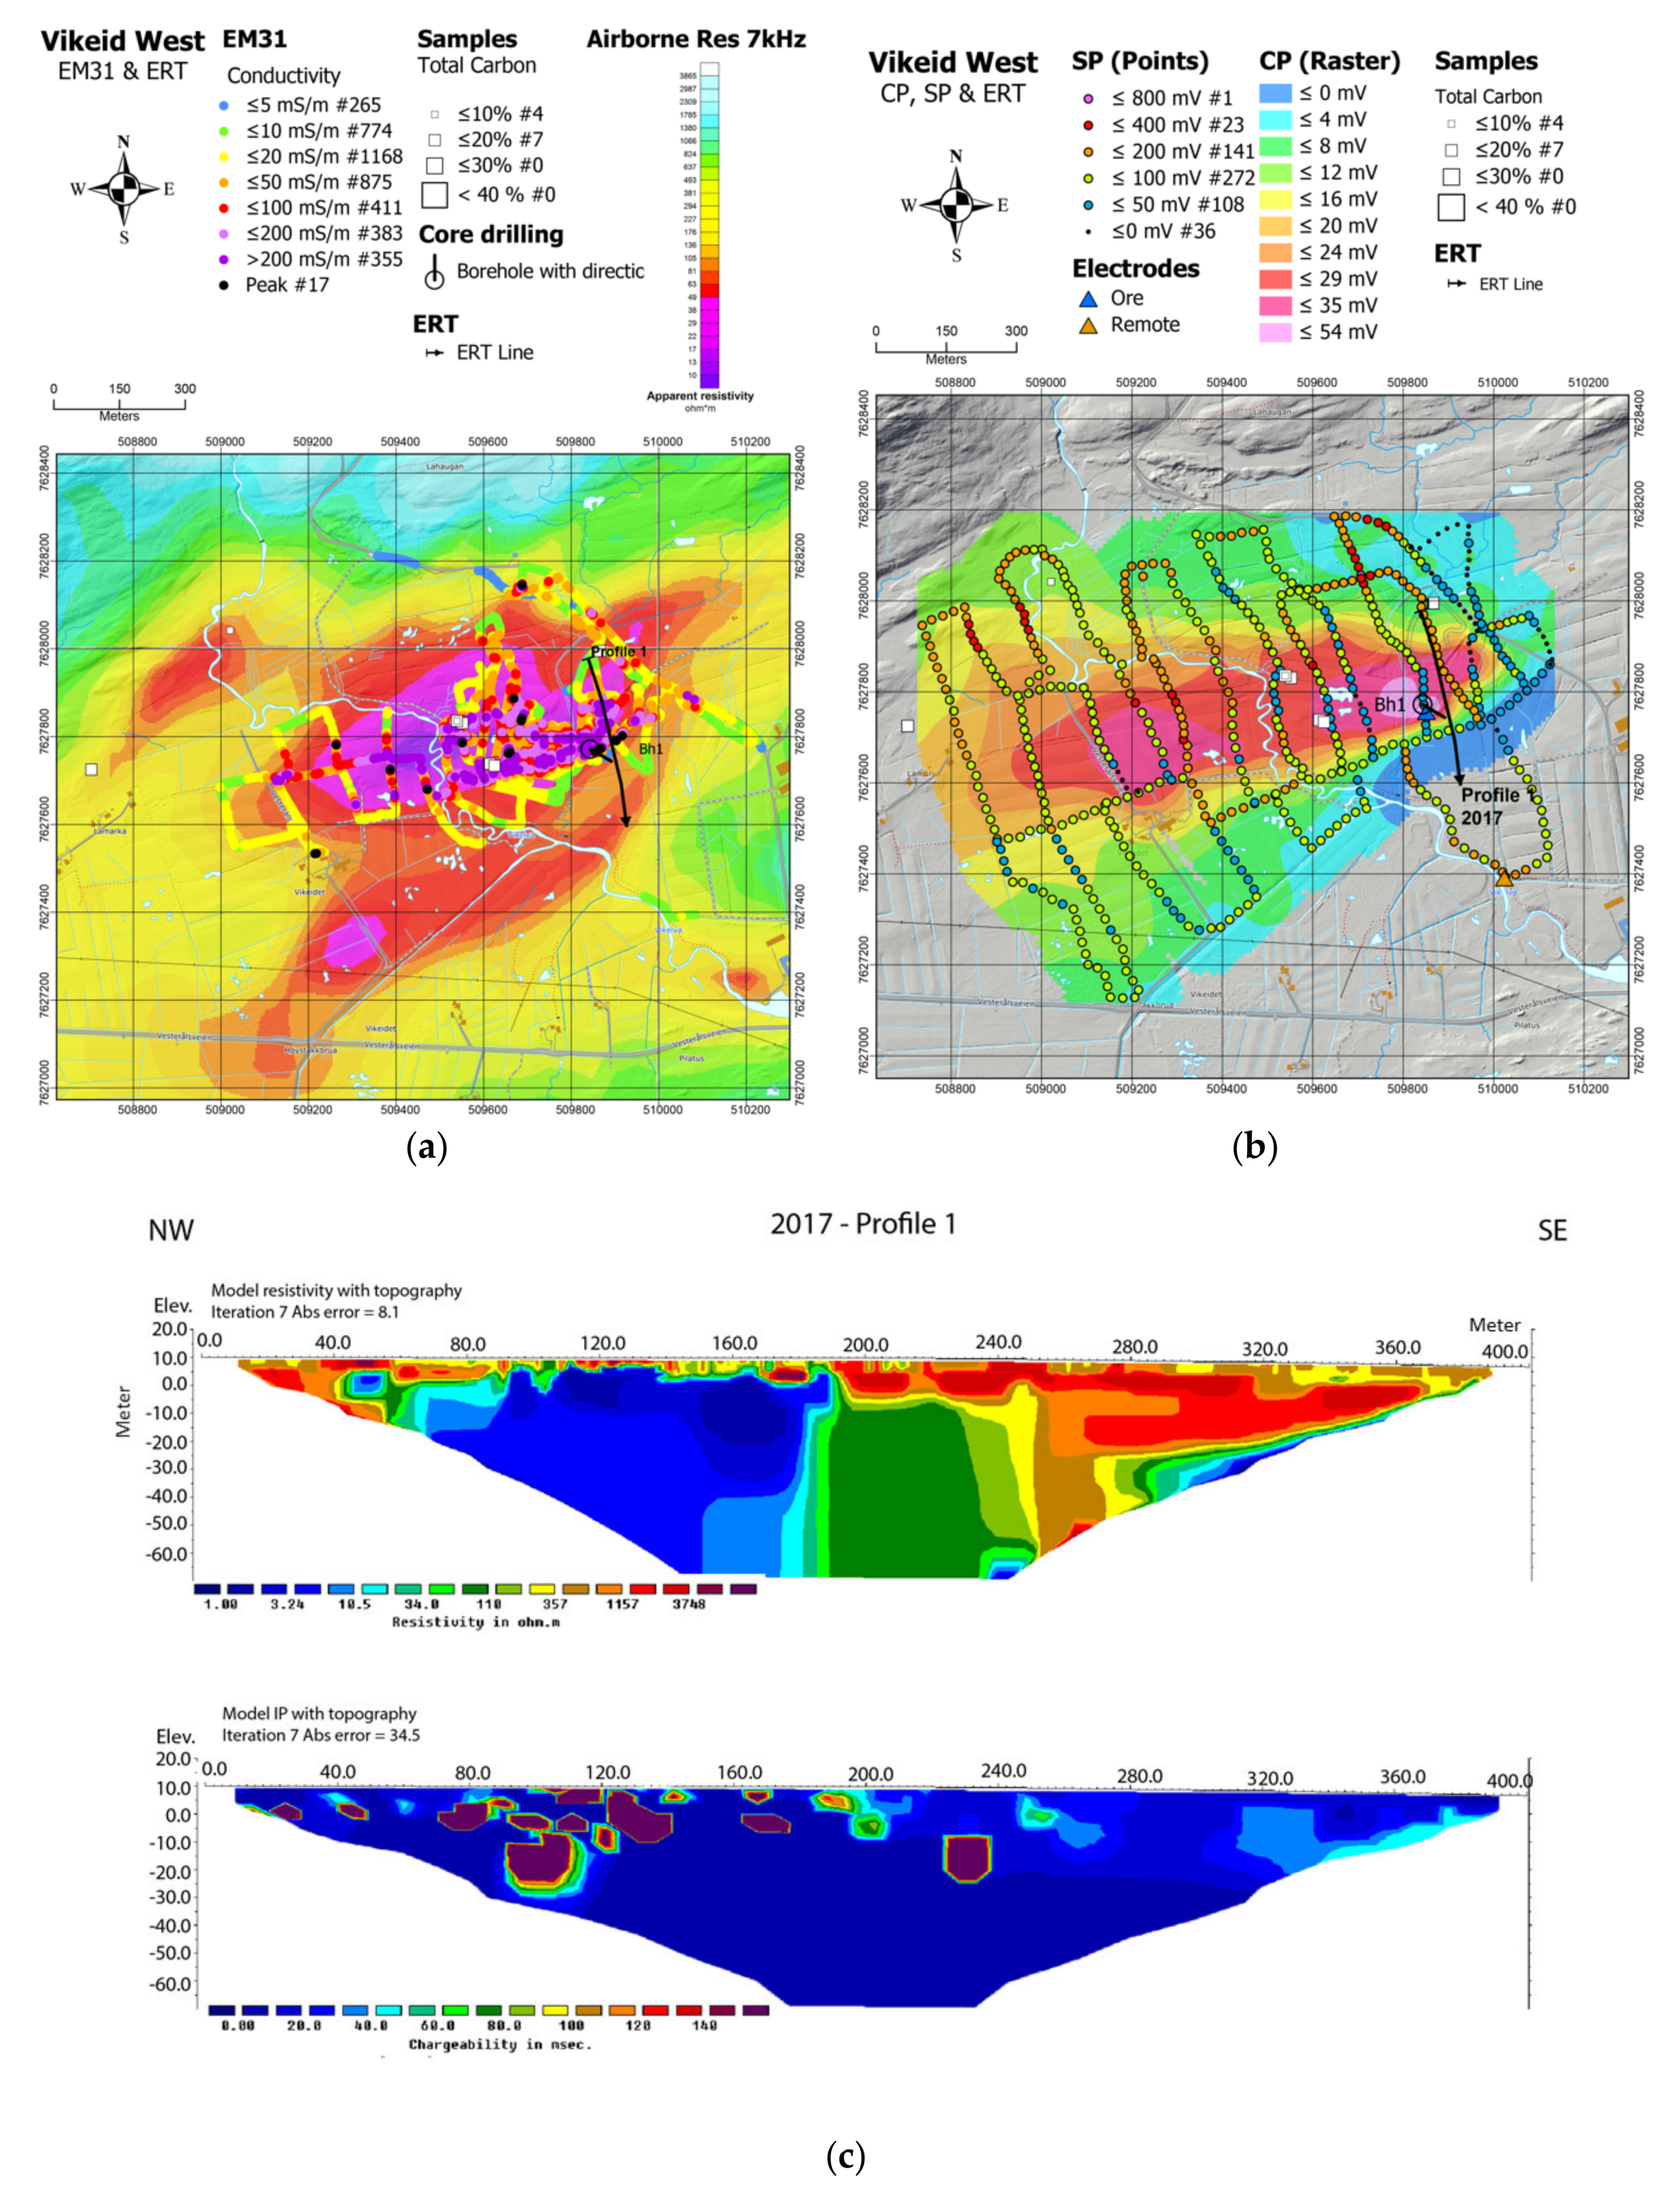
5.4. Ground Geophysical Measurements
5.5. Resource Estimates
5.6. Beneficiation Results
6. Discussion
6.1. Geology
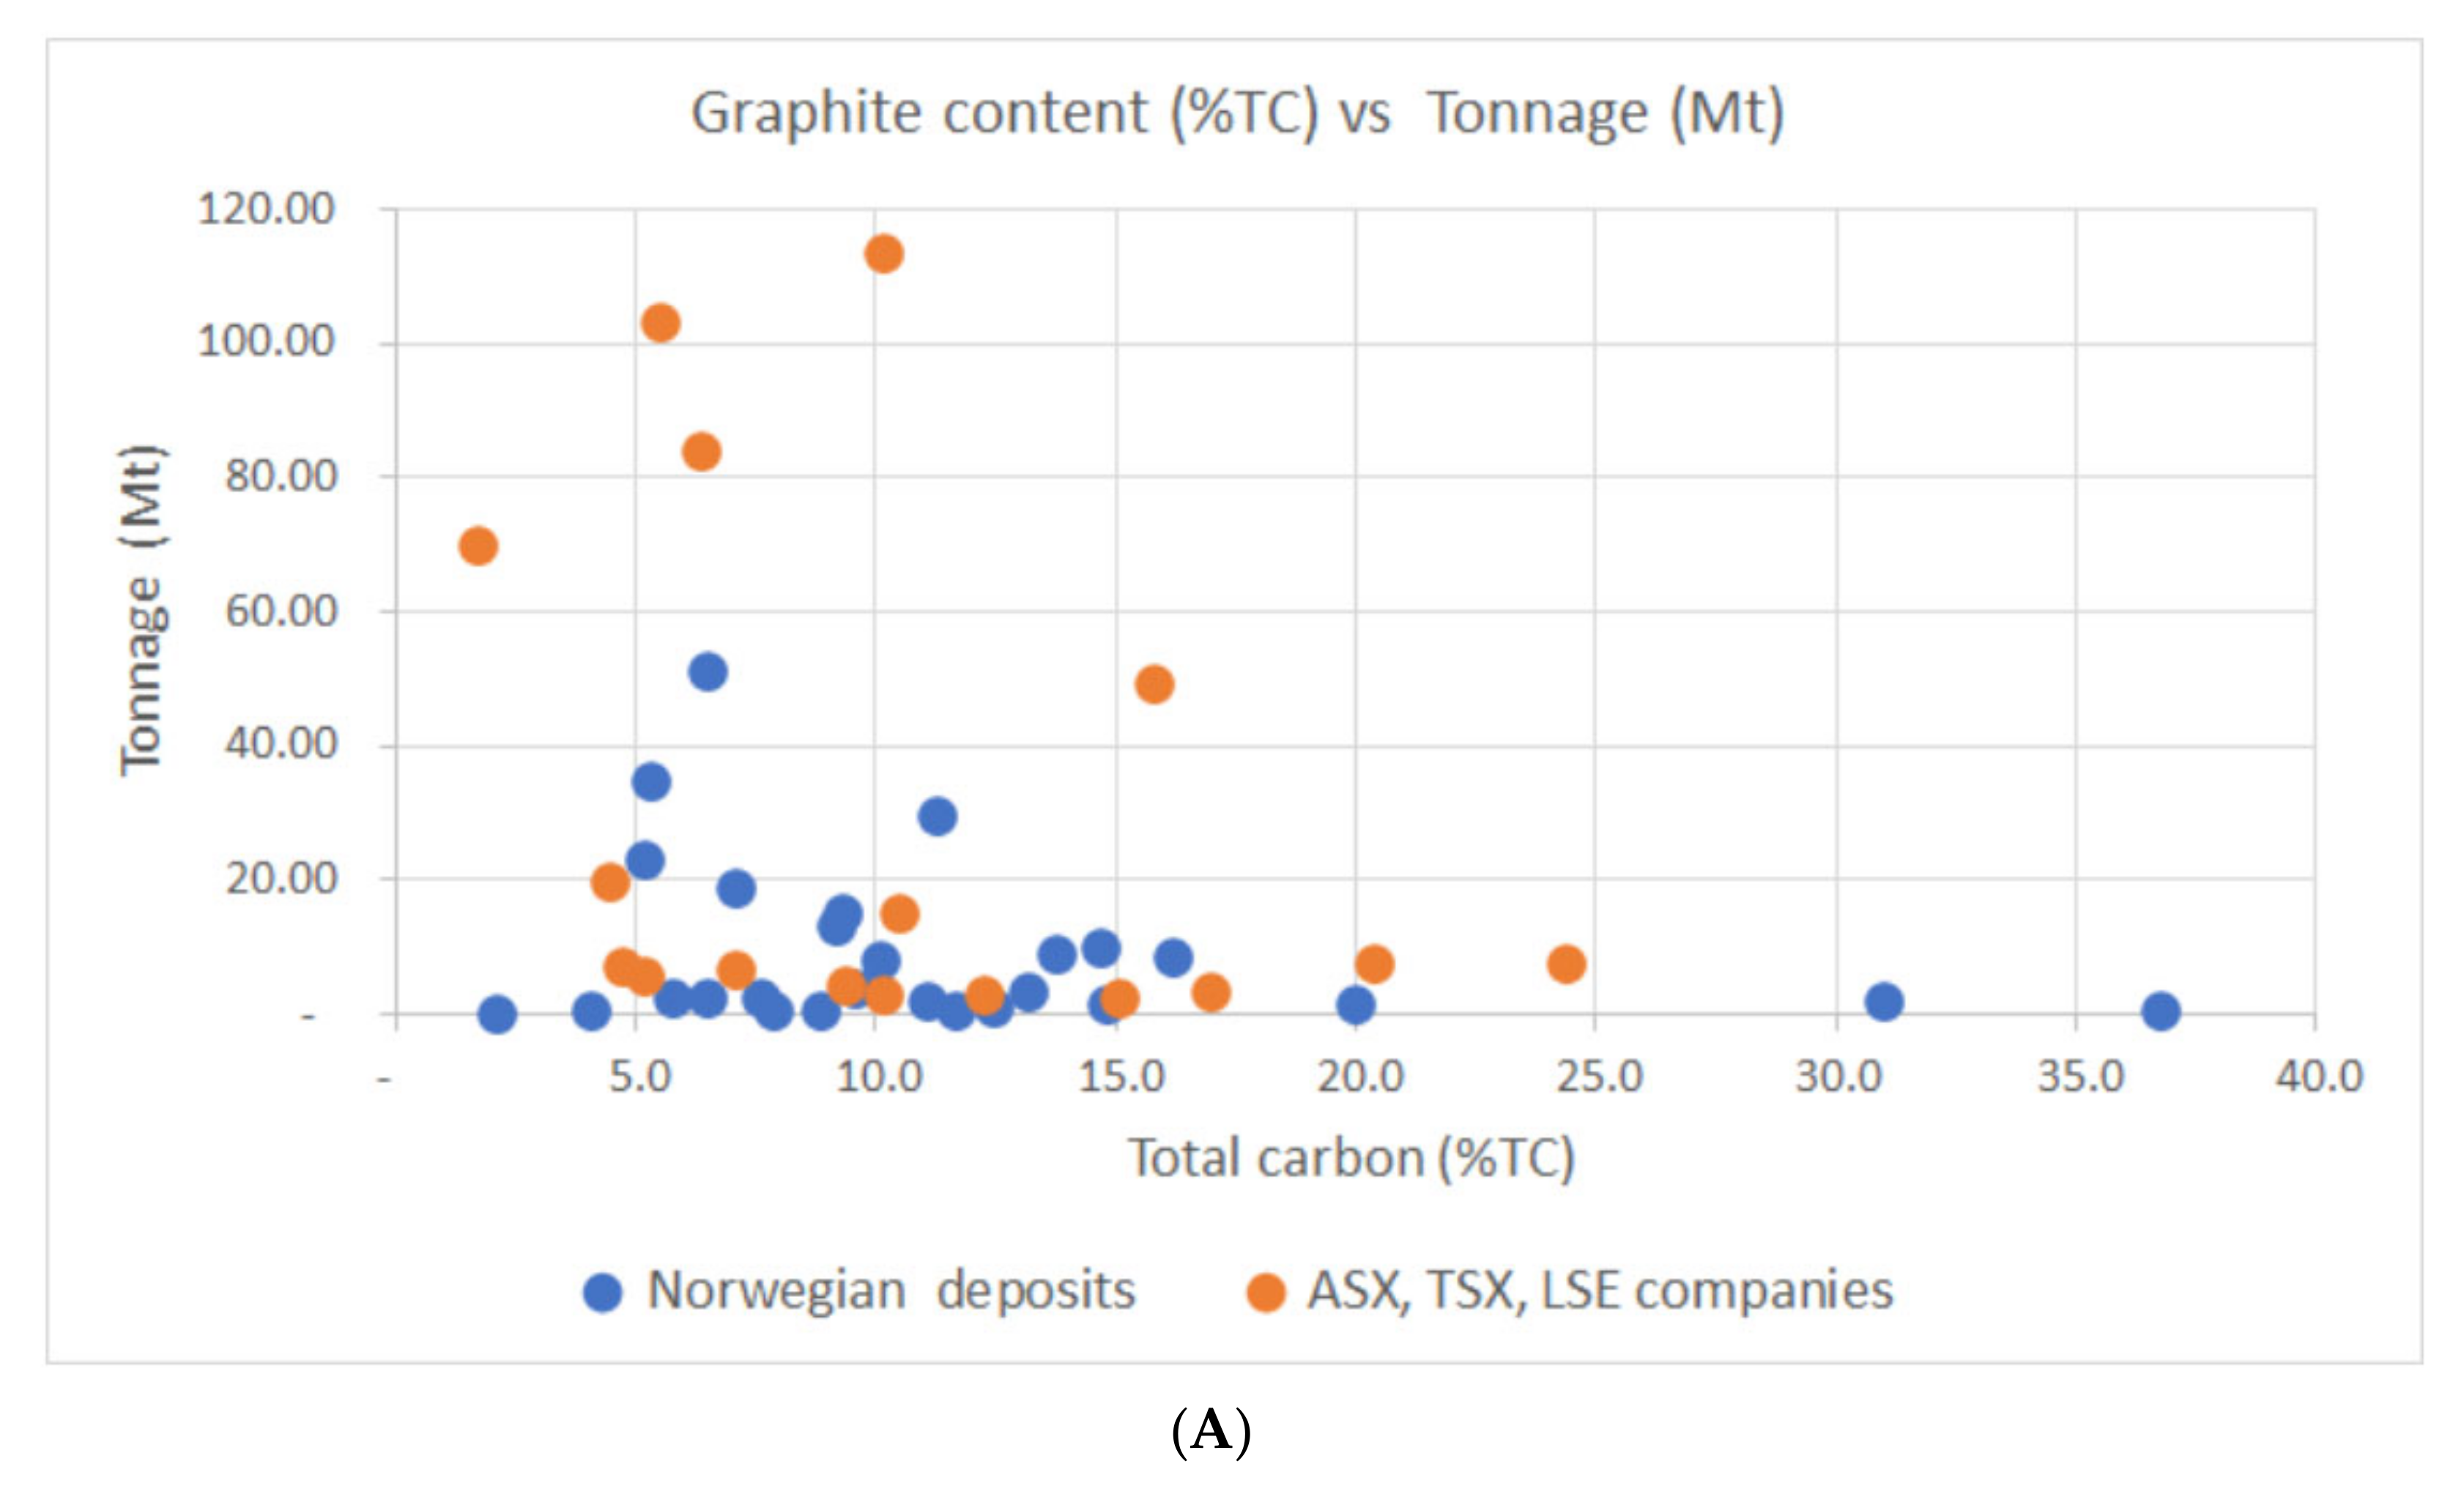
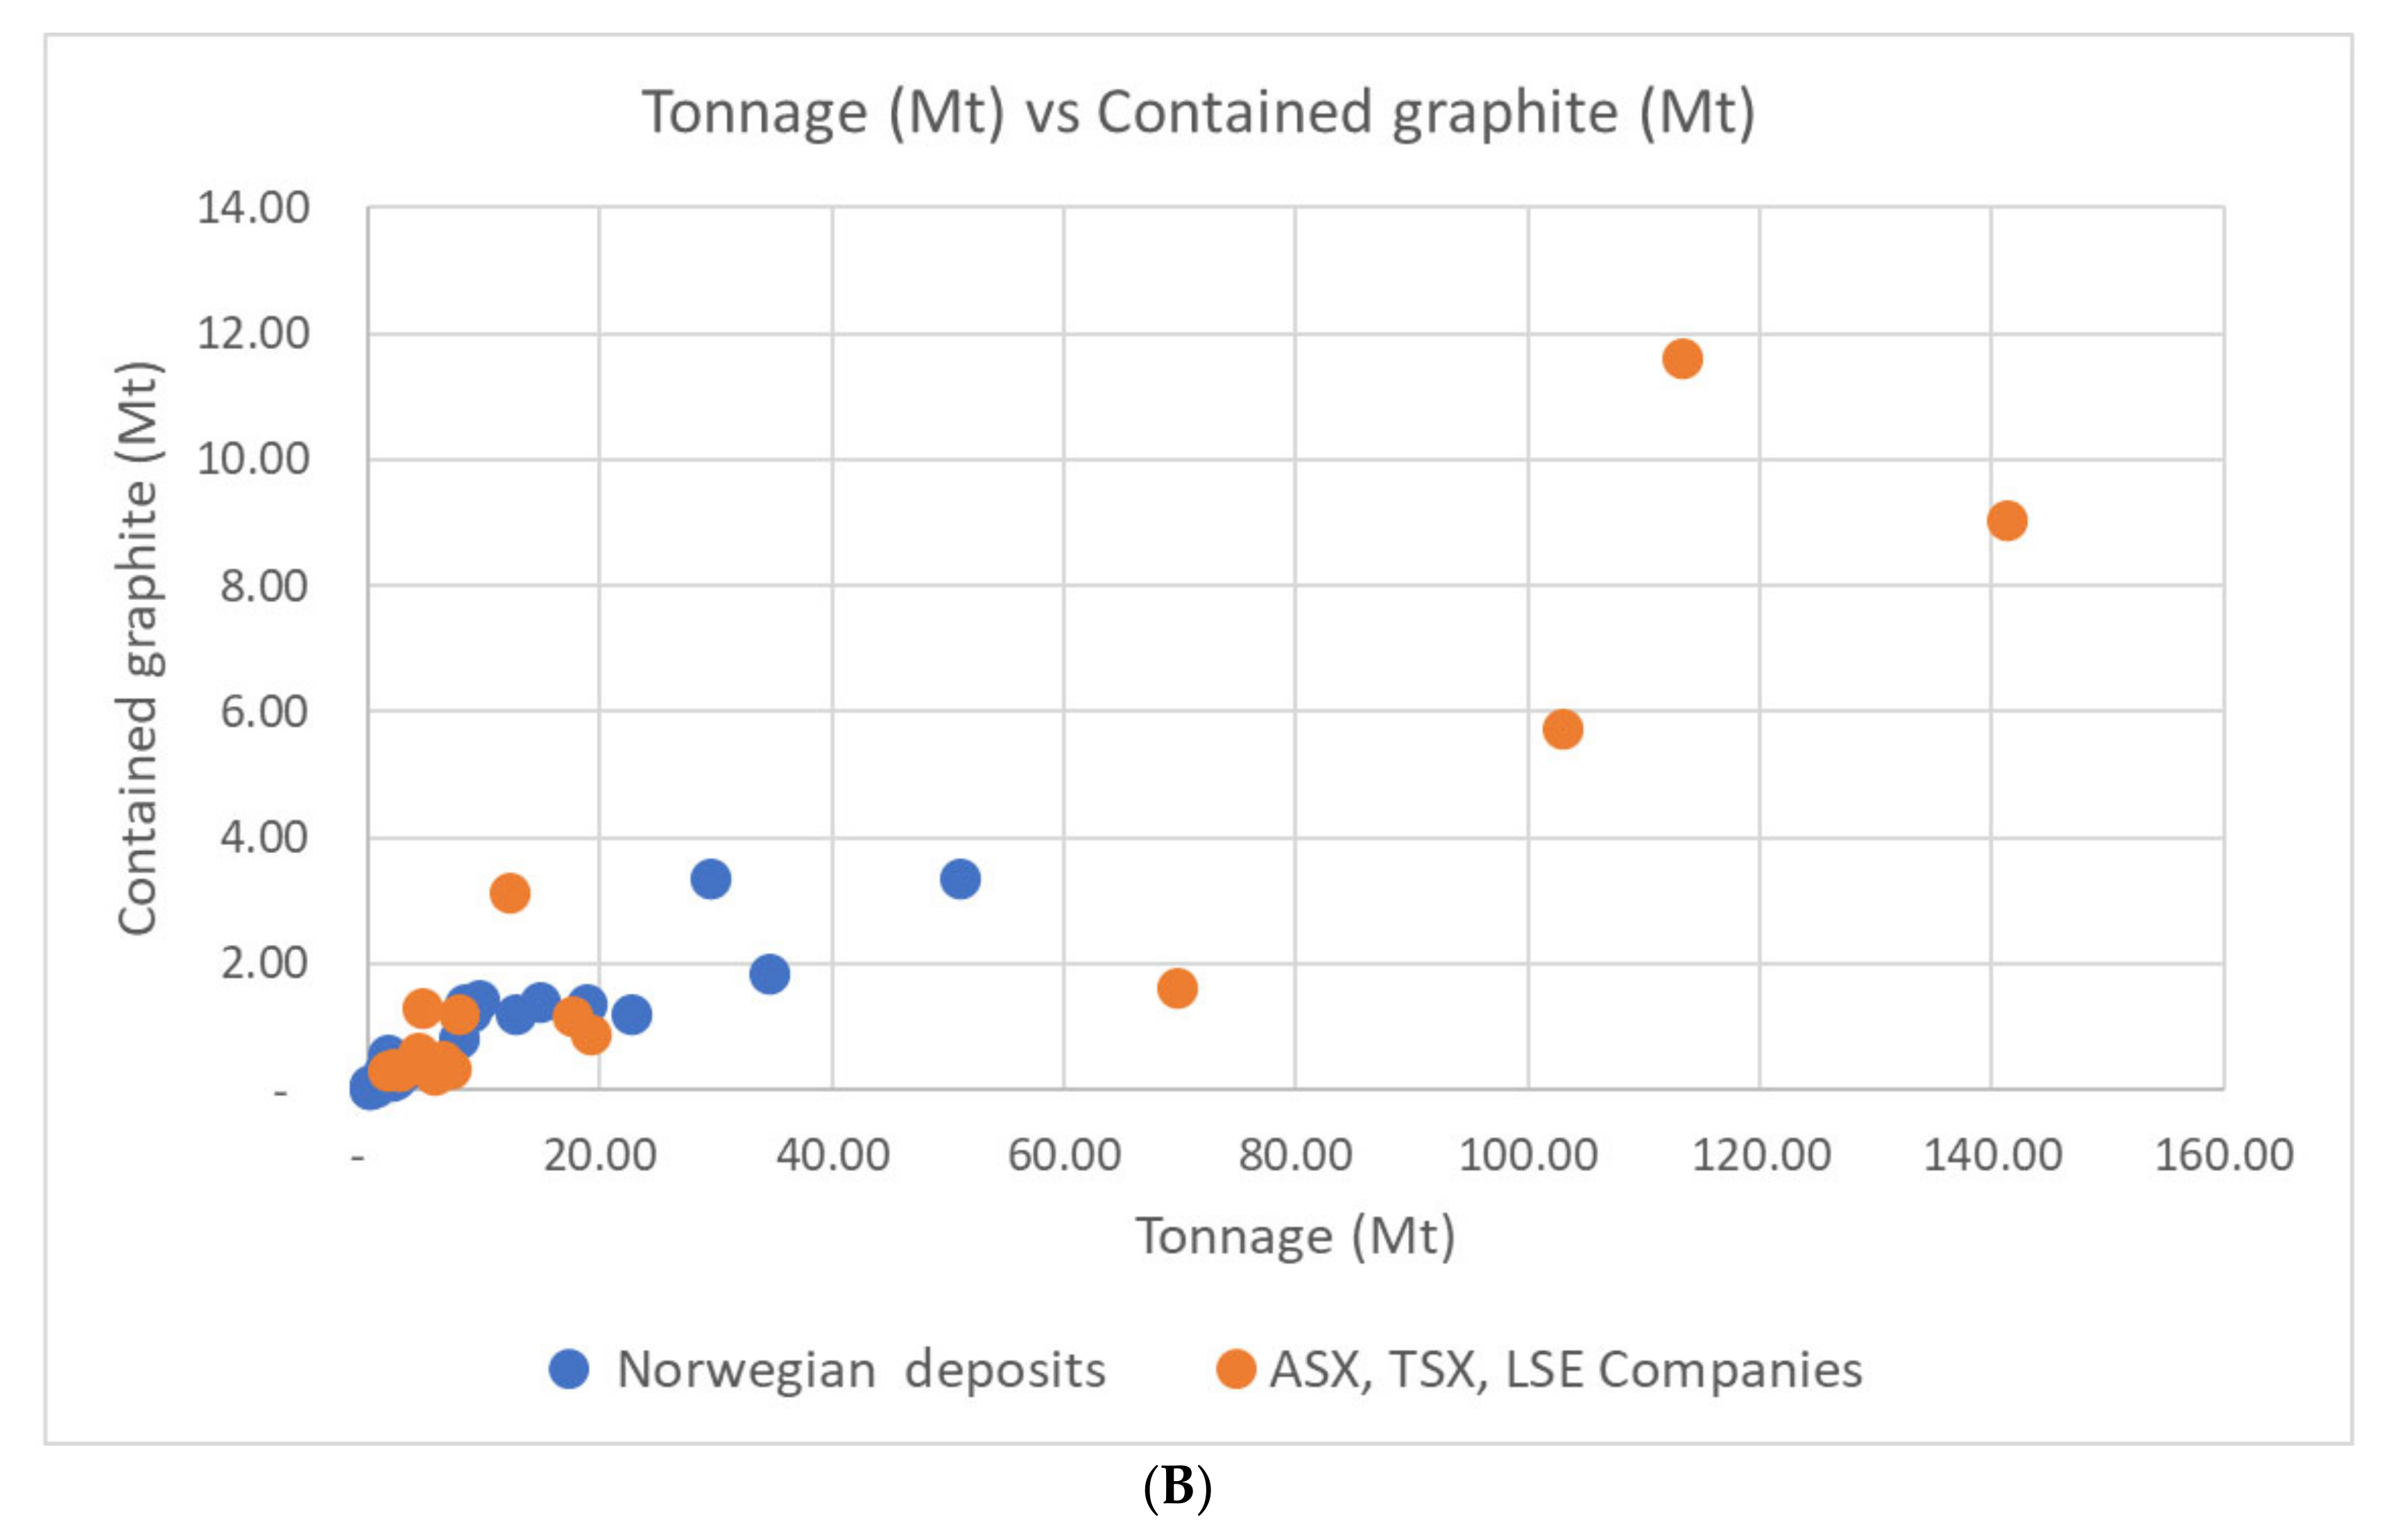
6.2. Comparison of Resource Estimates
- (1)
- % TC (grade), deposit size, and contained graphite, were % TC rank before deposit size.
- (2)
- Location (country risk).
- (3)
- Flake size distribution.
- (4)
- Product purity.
- (5)
- Off-take agreements.
- (6)
- Time frame of production.
7. Summary and Conclusions
Supplementary Materials
Author Contributions
Funding
Acknowledgments
Conflicts of Interest
References
- Schulz, K.J.; DeYoung, J.H., Jr.; Seal, R.R.; Bradley, D.C. Critical Mineral Resources of the United States—Economic and Environmental Geology and Prospects for Future Supply; U.S. Geological Survey: Reston, VA, USA, 2017; pp. 1–779. [CrossRef]
- European Commission. Study on the Review of the List of Critical Raw Materials; Final report; Publications Office of the EU: Brussels, Belgium, 2017; pp. 1–94. [Google Scholar] [CrossRef]
- World Economic Forum. A Vision for a Sustainable Battery Value Chain in 2030; World Economic Forum: Cologny, Switzerland, 2019; pp. 1–52. [Google Scholar]
- Beyssac, O.; Rumble, D. Graphitic carbon: A ubiquitous, diverse, and useful geomaterial. Elements 2014, 10, 415–420. [Google Scholar] [CrossRef]
- Bonijoly, M.; Oberlin, M.; Oberlin, A. A possible mechanism for natural graphite formation. Int. J. Coal Geol. 1982, 1, 283–312. [Google Scholar] [CrossRef]
- Buseck, P.R.; Beyssac, O. From Organic Matter to Graphite: Graphitization. Elements 2014, 10, 421–426. [Google Scholar] [CrossRef]
- Buseck, P.R.; Huang, B.-J. Conversion of carbonaceous material to graphite during metamorphism. Geochim. Cosmochim. Acta 1985, 49, 2003–2016. [Google Scholar] [CrossRef]
- Bustin, R.M.; Ross, J.V.; Rouzaud, J.N. Mechanisms of graphite formation from kerogen: Experimental evidence. Int. J. Coal Geol. 1995, 28, 1–36. [Google Scholar] [CrossRef]
- Frost, B.R.; Frost, C.D. CO2, melts and granulite metamorphism. Nature 1987, 327, 503–506. [Google Scholar] [CrossRef]
- Huizenga, J.M.; Touret, J.L. Granulites, CO2 and graphite. Gondwana Res. 2012, 22, 799–809. [Google Scholar] [CrossRef]
- Kříbek, B.; Sýkorová, I.; Machovič, V.; Laufek, F. Graphitization of organic matter and fluid-deposited graphite in Palaeoproterozoic (Birimian) black shales of the Kaya-Goren greenstone belt (Burkina Faso, West Africa). J. Metamorph. Geol. 2008, 26, 937–958. [Google Scholar] [CrossRef]
- Luque, F.; Huizenga, J.; Crespo-Feo, E.; Wada, H.; Ortega, L.; Barrenechea, J. Vein graphite deposits: Geological settings, origin, and economic significance. Miner. Depos. 2014, 49, 261–277. [Google Scholar] [CrossRef] [Green Version]
- Luque, F.; Ortega, L.; Barrenechea, J.F.; Millward, D.; Beyssac, O.; Huizenga, J.M. Deposition of highly crystalline graphite from moderate-temperature fluids. Geology 2009, 37, 275–278. [Google Scholar] [CrossRef] [Green Version]
- Papineau, D.; De Gregorio, B.T.; Stroud, R.M.; Steele, A.; Pecoits, E.; Konhauser, K.; Wang, J.; Fogel, M.L. Ancient graphite in the Eoarchean quartz-pyroxene rocks from Akilia in southern West Greenland II: Isotopic and chemical compositions and comparison with Paleoproterozoic banded iron formations. Geochim. Cosmochim. Acta 2010, 74, 5884–5905. [Google Scholar] [CrossRef]
- Pascal, M.; Ansdell, K.; Annesley, I.R.; Kotzer, T.; Jiricka, D. Graphite-bearing Pelitic Schists and Their Altered Equivalents in the Dufferin Lake Zone, South-central Athabasca Basin, Saskatchewan: Constraints On Graphite Formation and Destruction, and Implications for Uranium Mineralization. Can. Mineral. 2016, 54, 1459–1491. [Google Scholar] [CrossRef]
- Pasteris, J.D. Causes of the uniformly high crystallinity of graphite in large epigenetic deposits. J. Metamorph. Geol. 1999, 17, 779–787. [Google Scholar] [CrossRef]
- Rumble, D. Hydrothermal graphitic carbon. Elements 2014, 10, 427–433. [Google Scholar] [CrossRef]
- Rumble, D., III; Duke, E.F.; Hoering, T.L. Hydrothermal graphite in New Hampshire: Evidence of carbon mobility during regional metamorphism. Geology 1986, 14, 452–455. [Google Scholar] [CrossRef]
- Rumble, D., III; Hoering, T.C. Carbon isotope geochemistry of graphite vein deposits from New Hampshire, USA. Geochim. Cosmochim. Acta 1986, 50, 1239–1247. [Google Scholar] [CrossRef]
- Schidlowski, M. Organic matter in sedimentary rocks: The dust we tread upon was once alive. Terra Cogn. 1983, 4, 45–49. [Google Scholar]
- Touret, J.L.R.; Huizenga, J.M.; Kehelpannala, K.V.W.; Piccoli, F. Vein-type graphite deposits in Sri Lanka: The ultimate fate of granulite fluids. Chem. Geol. 2019, 508, 167–181. [Google Scholar] [CrossRef]
- Large, D.; Christy, A.; Fallick, A. Poorly crystalline carbonaceous matter in high grade metasediments: Implications for graphitisation and metamorphic fluid compositions. Contrib. Mineral. Petrol. 1994, 116, 108–116. [Google Scholar] [CrossRef]
- Landis, C. Graphitization of dispersed carbonaceous material in metamorphic rocks. Contrib. Mineral. Petrol. 1971, 30, 34–45. [Google Scholar] [CrossRef]
- Luque, F.J.; Crespo-Feo, E.; Barrenechea, J.F.; Ortega, L. Carbon isotopes of graphite: Implications on fluid history. Geosci. Front. 2012, 3, 197–207. [Google Scholar] [CrossRef] [Green Version]
- Rantitsch, G.; Lämmerer, W.; Fisslthaler, E.; Mitsche, S.; Kaltenböck, H. On the discrimination of semi-graphite and graphite by Raman spectroscopy. Int. J. Coal Geol. 2016, 159, 48–56. [Google Scholar] [CrossRef]
- Barzoi, S.C. Shear stress in the graphitization of carbonaceous matter during the low-grade metamorphism from the northern Parang Mountains (South Carpathians)—Implications to graphite geothermometry. Int. J. Coal Geol. 2015, 146, 179–187. [Google Scholar] [CrossRef]
- Beyssac, O.; Brunet, F.; Petitet, J.-P.; Goffé, B.; Rouzaud, J.-N. Experimental study of the microtextural and structural transformations of carbonaceous materials under pressure and temperature. Eur. J. Mineral. 2003, 15, 937–951. [Google Scholar] [CrossRef]
- Kirilova, M.; Toy, V.G.; Timms, N.; Halfpenny, A.; Menzies, C.; Craw, D.; Beyssac, O.; Sutherland, R.; Townend, J.; Boulton, C. Textural changes of graphitic carbon by tectonic and hydrothermal processes in an active plate boundary fault zone, Alpine Fault, New Zealand. Geol. Soc. Lond. Spec. Publ. 2018, 453, 205–223. [Google Scholar] [CrossRef] [Green Version]
- Moore, D.E.; Lockner, D.A. Crystallographic controls on the frictional behavior of dry and water-saturated sheet structure minerals. J. Geophys. Res. Solid Earth 2004, 109. [Google Scholar] [CrossRef]
- Newton, R.; Smith, J.; Windley, B. Carbonic metamorphism, granulites and crustal growth. Nature 1980, 288, 45–50. [Google Scholar] [CrossRef]
- Oohashi, K.; Hirose, T.; Kobayashi, K.; Shimamoto, T. The occurrence of graphite-bearing fault rocks in the Atotsugawa fault system, Japan: Origins and implications for fault creep. J. Struct. Geol. 2012, 38, 39–50. [Google Scholar] [CrossRef]
- Oohashi, K.; Hirose, T.; Shimamoto, T. Shear-induced graphitization of carbonaceous materials during seismic fault motion: Experiments and possible implications for fault mechanics. J. Struct. Geol. 2011, 33, 1122–1134. [Google Scholar] [CrossRef] [Green Version]
- Rutter, E.H.; Hackston, A.J.; Yeatman, E.; Brodie, K.H.; Mecklenburgh, J.; May, S.E. Reduction of friction on geological faults by weak-phase smearing. J. Struct. Geol. 2013, 51, 52–60. [Google Scholar] [CrossRef]
- Santosh, M.; Omori, S. CO2 flushing: A plate tectonic perspective. Gondwana Res. 2008, 13, 86–102. [Google Scholar] [CrossRef]
- Marques, M.; Suárez-Ruiz, I.; Flores, D.; Guedes, A.; Rodrigues, S. Correlation between optical, chemical and micro-structural parameters of high-rank coals and graphite. Int. J. Coal Geol. 2009, 77, 377–382. [Google Scholar] [CrossRef]
- Kwiecińska, B.; Petersen, H.I. Graphite, semi-graphite, natural coke, and natural char classification—ICCP system. Int. J. Coal Geol. 2004, 57, 99–116. [Google Scholar] [CrossRef]
- Rantitsch, G.; Grogger, W.; Teichert, C.; Ebner, F.; Hofer, C.; Maurer, E.-M.; Schaffer, B.; Toth, M. Conversion of carbonaceous material to graphite within the Greywacke Zone of the Eastern Alps. Int. J. Earth Sci. 2004, 93, 959–973. [Google Scholar] [CrossRef]
- Luque, F.; Barrenechea, J.; Rodas, M. Graphite geothermometry in low and high temperature regimes: Two case studies. Geol. Mag. 1993, 130, 501–511. [Google Scholar] [CrossRef]
- Luque, F.J.; Rodas, M. Constraints on graphite crystallinity in some Spanish fluid-deposited occurrences from different geologic settings. Miner. Depos. 1999, 34, 215–219. [Google Scholar] [CrossRef]
- Franklin, R.E. Crystallite growth in graphitizing and non-graphitizing carbons. Proc. R. Soc. Lond. Ser. A Math. Phys. Sci. 1951, 209, 196–218. [Google Scholar]
- Beyssac, O.; Goffé, B.; Chopin, C.; Rouzaud, J. Raman spectra of carbonaceous material in metasediments: A new geothermometer. J. Metamorph. Geol. 2002, 20, 859–871. [Google Scholar] [CrossRef]
- Ferrari, A.C. Raman spectroscopy of graphene and graphite: Disorder, electron–phonon coupling, doping and nonadiabatic effects. Solid State Commun. 2007, 143, 47–57. [Google Scholar] [CrossRef]
- Ferrari, A.C.; Meyer, J.C.; Scardaci, V.; Casiraghi, C.; Lazzeri, M.; Mauri, F.; Piscanec, S.; Jiang, D.; Novoselov, K.S.; Roth, S.; et al. Raman Spectrum of Graphene and Graphene Layers. Phys. Rev. Lett. 2006, 97, 187401. [Google Scholar] [CrossRef] [Green Version]
- Rahl, J.M.; Anderson, K.M.; Brandon, M.T.; Fassoulas, C. Raman spectroscopic carbonaceous material thermometry of low-grade metamorphic rocks: Calibration and application to tectonic exhumation in Crete, Greece. Earth Planet. Sci. Lett. 2005, 240, 339–354. [Google Scholar] [CrossRef]
- Kirilova, M.; Toy, V.; Rooney, J.S.; Giorgetti, C.; Gordon, K.C.; Collettini, C.; Takeshita, T. Structural disorder of graphite and implications for graphite thermometry. Solid Earth 2018, 9. [Google Scholar] [CrossRef] [Green Version]
- Dissanayake, C.B.; Chandrajith, R.; Boudou, J.P. Biogenic Graphite as a Potential Geomarker—Application to Continental Reconstructions of Pan-African Gondwana Terrains. Gondwana Res. 2000, 3, 405–413. [Google Scholar] [CrossRef]
- Ray, J.S. Carbon isotopic variations in fluid-deposited graphite: Evidence for multicomponent Rayleigh isotopic fractionation. Int. Geol. Rev. 2009, 51, 45–57. [Google Scholar] [CrossRef]
- Rosing-Schow, N.; Bagas, L.; Kolb, J.; Balić-Žunić, T.; Korte, C.; Fiorentini, M.L. Hydrothermal flake graphite mineralisation in Paleoproterozoic rocks of south-east Greenland. Miner. Depos. 2017, 52, 769–789. [Google Scholar] [CrossRef]
- Taner, M.F.; Drever, C.; Yakymchuk, C.; Longstaffe, F.J. Origin of graphite in the southwestern Grenville Province. Can. Mineral. 2017, 55, 1041–1055. [Google Scholar] [CrossRef] [Green Version]
- Hyuck, H.L.O. When is a metalliferous black shale not a black shale? In Metalliferous Black Shales and Related Ore Deposits Proceedings, 1989 United States Working Group Meeting, International Geological Correlation Program Project 254; Grauch, R.I., Huyck, H.L.O., Eds.; U.S. Geological Survey: Reston, VA, USA, 1990; pp. 42–52. [Google Scholar]
- Rønning, J.S.; Gautneb, H.; Larsen, B.E.; Henderson, I.; Knežević, J.; Gellein, J.; Davidsen, B.; Ofstad, F.; Viken, G. Geophysical and Geological Investigations for Graphite on Senja and in Kvæfjord, Troms County Northern Norway; NGU Report 2019.023; Geological Survey of Norway: Trondheim, Norway, 2019; pp. 1–159. [Google Scholar] [CrossRef]
- Gautneb, H.; Knežević, J.; Johannesen, N.E.; Wanvik, J.E.; Engvik, A.; Davidsen, B.; Rønning, J.S. Geological and Ore Dressing Investigations of Graphite Occurrences in Bø, Sortland, Hadsel and Øksnes Municipalities, Vesterålen, Nordland County, Northern Norway 2015–2016; NGU Report 2017.015; Geological Survey of Norway: Trondheim, Norway, 2017; pp. 1–70. [Google Scholar]
- Gautneb, H.; Wanvik, J.E. The Graphite Schists in the Gjerstad-Kragerø Area and Their Graphite Potential, Southern Norway; NGU Report 2016.010; Geological Survey of Norway: Trondheim, Norway, 2016; pp. 1–15. [Google Scholar]
- Touret, J. The precambrian metamorphic rocks around the lake Vegår (Aust-Agder, southern Norway). Nor. Geol. Undersøkelse Bull. 1968, 257, 1–45. [Google Scholar]
- Gautneb, H.; Lynch, E.; Athola, T.; Eklund, O. Presentation at Nordic Mining Day PDAC 2016. Available online: https://www.ngu.no/sites/default/files/05_Gautneb_Graphite.pdf (accessed on 12 April 2020).
- Palosaari, J.; Latonen, R.-M.; Smått, J.-H.; Blomqvist, R.; Eklund, O. High-quality flake graphite occurrences in a high-grade metamorphic region in Sortland, Vesterålen, northern Norway. Nor. J. Geol. 2016, 96, 19–26. [Google Scholar] [CrossRef]
- Palosaari, J.; Latonen, R.M.; Smått, J.H.; Raunio, S.; Eklund, O. The flake graphite prospect of Piippumäki—An example of a high-quality graphite occurrence in a retrograde metamorphic terrain in Finland. Miner. Depos. 2020. [Google Scholar] [CrossRef]
- Gautneb, H.; Tveten, E. The geology, exploration and characterisation of graphite deposits in the Jennestad area, Vesterålen, northern Norway. Nor. Geol. Undersøkelse Bull. 2000, 436, 67–74. [Google Scholar]
- Rønning, J.S.; Gautneb, H.; Dalsegg, E.; Larsen Eskil, B.; Rodionov, A. Oppfølgende Grafittundersøkelser I Meløy og Rødøy Kommuner, Nordland; NGU Report 2014.046; Geological Survey of Norway: Trondheim, Norway, 2014; pp. 1–63. [Google Scholar]
- Rønning, J.S.; Gautneb, H.; Larsen, B.E.; Baranval, V.C.; Bavidsen, B.; Engvik, A.; Gellein, J.; Knežević, J.; Ren, X. Viken, G. Geophysical and Geological Investigations of Graphite Occurrences in Vesterålen, Northern Norway in 2018 and 2019; NGU Report 2019.031; Geological Survey of Norway: Trondheim, Norway, 2019; pp. 1–159. [Google Scholar]
- Rønning, J.S.; Gautneb, H.; Henderson, I.H.C.; Larsen, B.E.; Knežević, J.; Gellein, J.; Ofstad, F. Geophysical and Geological Investigations of Hesten, Vardfjellet and Grunnvåg Graphite Occurrences, Senja, Northern Norway; NGU Report 2017.021; Geological Survey of Norway: Trondheim, Norway, 2017; pp. 1–72. [Google Scholar]
- Lauritsen, T. CP-, SP- og VLF-målinger Bukkemoen, Senja; NGU Report 88.185; Geological Survey of Norway: Trondheim, Norway, 1988; pp. 1–11. [Google Scholar]
- Rønning, J.S.; Larsen, B.E.; Elvebakk, H.; Gautneb, H.; Ofstad, F.; Knežević, J. Geophysical investigations of graphite occurrences in Bø and Øksnes municipalities, Vesterålen, Nordland County, Northern Norway 2015–2016; NGU Report 2017.014; Geological Survey of Norway: Trondheim, Norway, 2017; pp. 1–50. [Google Scholar]
- Sletten, A.M. Jennestad Graphite Project, Resource Estimation; unpublished report; Norwegian Graphite: Sortland, Norway, 2013; pp. 1–23. [Google Scholar]
- Skjeseth, S. Foreløpig Rapport for Geologisk Undersøkelse av Rendalsvik Grafittfelt ved Holandsfjord, Nordland, Sommeren 1952; NGU Report BA6557; Geological Survey of Norway: Trondheim, Norway, 1952; pp. 1–15. [Google Scholar]
- Skofteland, H.; Vestreng, V. Diamantboring i Rendalsvik 1984. Unpublished work, 1984.
- Lynch, E.P.; Hellström, F.A.; Huhma, H. The Nunasvaara graphite deposit, northern Sweden: New geochemical and U-Pb zircon age results for the host greenstones. In Proceedings of the Conference abstract, Nordic Geological Winter Meeting, Helsinki, Finland, 13–15 January 2016. [Google Scholar]
- Bergh, S.G.; Kullerud, K.; Armitage, P.E.; Bouke Zwaan, K.; Corfu, F.; Ravna, E.J.; Inge Myhre, P. Neoarchaean to Svecofennian tectono-magmatic evolution of the West Troms Basement Complex, North Norway. Nor. J. Geol. 2010, 90, 21–48. [Google Scholar]
- Bergh, S.G.; Corfu, F.; Myhre, P.I.; Kullerud, K.; Armitage, P.E.; Zwaan, K.B.; Ravna, E.K.; Holdsworth, R.E.; Chattopadhya, A. Was the Precambrian basement of Western Troms and Lofoten-Vesterålen in northern Norway linked to the Lewisian of Scotland? A comparison of crustal components, tectonic evolution and amalgamation history. Tecton.–Recent Adv. InTech Rij. 2012, 283–330. [Google Scholar] [CrossRef] [Green Version]
- Bergh, S.G.; Kullerud, K.; Corfu, F.; Armitage, P.E.B.; Davidsen, B.; Johansen, H.W.; Pettersen, T.; Knudsen, S. Low-grade sedimentary rocks on Vanna, North Norway: A new occurrence of a Palaeoproterozoic (2.4–2.2 Ga) cover succession in northern Fennoscandia. Nor. J. Geol. 2007, 87, 301–308. [Google Scholar]
- Corfu, F. U-Pb Age, Setting and Tectonic Significance of the Anorthosite–Mangerite–Charnockite–Granite Suite, Lofoten–Vesterålen, Norway. J. Petrol. 2004, 45, 1799–1819. [Google Scholar] [CrossRef]
- Corfu, F. Multistage metamorphic evolution and nature of the amphibolite–granulite facies transition in Lofoten–Vesterålen, Norway, revealed by U-Pb in accessory minerals. Chem. Geol. 2007, 241, 108–128. [Google Scholar] [CrossRef]
- Griffin, W.L.; Taylor, P.N.; Hakkinen, J.W.; Heier, K.S.; Iden, I.K.; Krogh, E.J.; Malm, O.; Olsen, K.I.; Ormaasen, D.E.; Tveten, E. Archaean and Proterozoic crustal evolution in Lofoten–Vesterålen, N Norway. J. Geol. Soc. 1978, 135, 629–647. [Google Scholar] [CrossRef]
- Engvik, A.K.; Gautneb, H.; Kneževic, S.J.; Rønning, J.S.; Austrheim, H. High-grade formation of graphite in Vesterålen, northern Norway, and its consequences for petrophysical properties of the lower continental crust. In Proceedings of the Nordic Geological Winter Meeting, Oslo, Norway, 8–10 January 2020. [Google Scholar]
- Markl, G.; Frost, B.R.; Bucher, K. The Origin of Anorthosites and Related Rocks from the Lofoten Islands, Northern Norway: I. Field Relations and Estimation of Intrinsic Variables. J. Petrol. 1998, 39, 1425–1452. [Google Scholar] [CrossRef]
- Gjelle, S.; Gustavson, M.; Qvale, H.; Skauli, H. Melfjorden. Berggrunnskart; Melfjorden; 19283 1:50 000; Geological Survey of Norway: Trondheim, Norway, 1985. [Google Scholar]
- Skår, Ø.; Mansfeldt, J. U-Pb dating of zircon using laser ablation ICP-MS at NGU. The method performed on Precambrian rocks in Northern Norway. Geol. Föreningens Forh. 2004, 126, 36. [Google Scholar]
- Brattland, S. Fra Industristed til Ødemark, Glimt fra Rendalsviks Historie; Meløy Historielag: Meløy, Norway, 1994; pp. 1–134. [Google Scholar]
- Myrvang, A. Rendalsvik i Meløy: Gruvesamfunnet som ble Borte; Helgeland Historielag: Herøy, Norway, 1997; pp. 87–91. [Google Scholar]
- Skjeseth, S.; Sørensen, H. An example of granitization in the central zone of the Caledonides of Northern Norway. Geol. Surv. Nor. Bull. 1953, 184, 154–183. [Google Scholar]
- Keilhau, B.M. Beretning om en geonostisk reise i Norlandene i 1855. Nyt Mag. Nat. 1855, 11, 1–34. [Google Scholar]
- Helland, A. Lofoten og Vesterålen. Nor. Geol. Undersøkelse Bull. 1887, 23, 1–246. [Google Scholar]
- Johannessen, G.A. Skaland Grafitverk 1917–1990. Utvikling og geologi. In Kulturvern ved bergverk 2004; Norsk Bergverksmuseum: Kongsberg, Norway, 2004; Volume 29, pp. 101–112. [Google Scholar]
- Johannessen, G.A. Grafitt industrien i Norge fra midten av 1700-tallet til i dag. Volund 1992, 40, 37–65. [Google Scholar]
- Neumann, H. Dagbok fra Nord-Norge 26.5-19.8 1952; NGU Report Ba 7709; Geological Survey of Norway: Trondheim, Norway, 1952; pp. 1–16. [Google Scholar]
- Flood, B. Skaland grafittverk A/S. In Bygger i berge; Carstens, H., Ed.; Tapir AS: Bergen, Norway, 2000; pp. 184–186. [Google Scholar]
- Opheim, A. Skalandfeltets Geologi; Geologisk og Petrografisk Beskrivelse av Skaland Grafitforekomst. Master’s Thesis, Norges Tekniske Høgskole, Trondheim, Norway, 1962; pp. 1–73. [Google Scholar]
- Dalsegg, E. Geofysiske Bakkemålinger Krokelvdalen og Geitskaret, Senja, Troms; NGU Report 85.188; Geological Survey of Norway: Trondheim, Norway, 1985; pp. 1–16. [Google Scholar]
- Dalsegg, E. Geofysiske Bakkemålinger Skalands Grubeområde og Trælen, Senja, Troms; NGU Report 85.187; Geological Survey of Norway: Trondheim, Norway, 1985; pp. 1–18. [Google Scholar]
- Rønning, J.S.; Rodionov, A.; Ofstad, F.; Lynum, R. Elektromagnetiske, Magnetiske, og Radiometriske Målinger fra Helikopter i Området Skaland-Trælen på Senja; NGU Report 2012.061; Geological Survey of Norway: Trondheim, Norway, 2012; pp. 1–30. [Google Scholar]
- Henderson, I.; Kendrick, M. Structural Controls on Graphite Mineralisation, Senja, Troms; NGU Report 2003.011; Geological Survey of Norway: Trondheim, Norway, 2003; pp. 1–95. [Google Scholar]
- Rodionov, A.; Ofstad, F.; Stampolidis, A.; Tassis, G. Helicopter-Borne Magnetic, Electromagnetic and Radiometric Survey at Northern Senja in 2012, 2013 and 2014, Troms County; NGU Report 2014.039; Geological Survey of Norway: Trondheim, Norway, 2014; pp. 1–26. [Google Scholar]
- Vokes, F.M. Befaring på Jennestad Grafittverk A/S; NGU Report BA5340; Geological Survey of Norway: Trondheim, Norway, 1954; 15p. [Google Scholar]
- Skjeseth, S. Foreløpig Rapport fra Geologiske Undersøkelser (kartlegging) av Jennestad Grafittfelt, Vesterålen; NGU Report BA5232; Geological Survey of Norway: Trondheim, Norway, 1952; pp. 1–13. [Google Scholar]
- Poulsen, A.O. Grafitfeltet ved Jennestad; NGU Report BA 5018; Geological Survey of Norway: Trondheim, Norway, 1947; pp. 1–9. [Google Scholar]
- Logn, Ø. Geofysisk Undersøkelse Jennestad Grafittfelt; Geological Survey of Norway: Trondheim, Norway, 1948; pp. 1–60. [Google Scholar]
- Heier, K.S. Petrology and geochemistry of high-grade metamorphic and igneous rocks on Langøy, northern Norway. Nor. Geol. Undersøkelse Bull. 1960, 207, 1–246. [Google Scholar]
- Mogaard, J.O.; Olesen, O.; Rønning, J.S.; Blokkum, O. Geofysiske Målinger fra Helikopter over Langøya, Vesterålen; NGU Report 88.151; Geological Survey of Norway: Trondheim, Norway, 1988; pp. 1–88. [Google Scholar]
- Rodionov, A.; Ofstad, F.; Tassis, G. Helicopter-Borne Magnetic, Electromagnetic and Radiometric Geophysical Survey in the Western Part of Austvågøya, Lofoten Archipelago, Nordland; NGU Report 2013.045; Geological Survey of Norway: Trondheim, Norway, 2013; pp. 1–26. [Google Scholar]
- Rodionov, A.; Ofstad, F.; Stampolidis, A.; Tassis, G. Helicopter-Borne Magnetic, Electromagnetic and Radiometric Geophysical survey at Langøya in Vesterålen, Nordland; NGU Report 2013.044; Geological Survey of Norway: Trondheim, Norway, 2013; pp. 1–26. [Google Scholar]
- Dalsegg, E. CP-, SP- og Ledningsevnemålinger ved Grafittundersøkelser ved Hornvannet, Sortland, Nordland.; NGU Report 94.003; Geological Survey of Norway: Trondheim, Norway, 1994; pp. 1–25. [Google Scholar]
- Gautneb, H. Grafittundersøkelser i Hornvannområdet, Sortland kommune, Nordland; NGU Report 92.293; Geological Survey of Norway: Trondheim, Norway, 1992; pp. 1–14. [Google Scholar]
- Gautneb, H. Grafittundersøkelser i Bø og Øksnes kommuner, Nordland 1992; NGU Report 93.010; Geological Survey of Norway: Trondheim, Norway, 1993; pp. 1–10. [Google Scholar]
- Gautneb, H. Grafittundersøkelser Hornvannet 1993, Sortland Kommune, Nordland; NGU Report 93.134; Geological Survey of Norway: Trondheim, Norway, 1993; pp. 1–12. [Google Scholar]
- Gautneb, H. Grafittundersøkelser Hornvann 1994; NGU Report 95.076; Geological Survey of Norway: Trondheim, Norway, 1995; pp. 1–54. [Google Scholar]
- Rønning, J.S. CP Målinger ved Grafittundersøkelser på Vikeid, Sortland Kommune Nordland; NGU Report 1991.262; Geological Survey of Norway: Trondheim, Norway, 1991; pp. 1–18. [Google Scholar]
- Rønning, J.S. CP- og SP-Målinger ved Grafittundersøkelser på Vikeid, Sortland Kommune, Nordland; NGU Report 93.018; Geological Survey of Norway: Trondheim, Norway, 1993; pp. 1–22. [Google Scholar]
- Gautneb, H.; Tveten, E. Grafittundersøkelser og Geologisk Kartlegging på Langøya, Sortland Kommune, Nordland; NGU Report 1992.155; Geological Survey of Norway: Trondheim, Norway, 1992; pp. 1–78. [Google Scholar]
- Sakshaug, G.F.; Brækken, H. Geofysiske Undersøkelser Rendalsvik Grafittfelt, Holandsfjord; Geological Survey of Norway: Trondheim, Norway, 1954; pp. 1–16. [Google Scholar]
- Gust, J.; Thoresen, H. Radiometriske Målinger og Prøvetaking i Rendalsvik Grafittfelt. Meløy, Nordland; NGU Report 1650/59A; Geological Survey of Norway: Trondheim, Norway, 1979; pp. 1–30. [Google Scholar]
- Rodionov, A.; Ofstad, F.; Tassis, G. Helicopter-Borne Magnetic, Electromagnetic and Radiometric Geophysical Survey in Holandsfjorden Area, Meløy, Nordland; NGU Report 2013.043; Geological survey of Norway: Trondheim, Norway, 2013; pp. 1–26. [Google Scholar]
- Geonics. Operating Manual EM31 D Non-contracting Terrain Conductivity Meter; Geonics Ltd.: Mississauga, ON, Canada, 1984. [Google Scholar]
- Dahlin, T. On the Automation of 2D Resistivity Surveying for Engineering and Environmental Applications; Lund University: Lund, Sweden, 1993. [Google Scholar]
- ABEM. Terrameter LS. Instruction Manual, release 1.11; ABEM Instrument AB: Sundbyberg, Sweden, 2012. [Google Scholar]
- Loke, M.H. Geoelectrical Imaging 2D & 3D. Instruction Manual. Res2DInv version 4.0. 2018. Available online: http://www.geotomosoft.com/ (accessed on 10 March 2020).
- Øzmerih, L. Graphite Benefication from Jennestad Ore; STF36 F910598; SINTEF: Trondheim, Norway, 1991; pp. 1–19. [Google Scholar]
- Myhre, P.I.; Corfu, F.; Bergh, S.G.; Kullerud, K. U-Pb geochronology along an Archaean geotransect in the West Troms Basement Complex, North Norway. Nor. J. Geol./Nor. Geol. Foren. 2013, 93, 1–24. [Google Scholar]
- Heldal, T.; Lund, E. Berggrunnsgeologisk kartlegging i Berg Kommune, Senja. Geologisk Kart (1:5000). Unpublished work, 1987.
- Weinstein, L.; Adam, J.A. Guesstimation: Solving the World’s Problems on the Back of a Cocktail Napkin; Princeton University Press: Princeton, NJ, USA, 2008. [Google Scholar]
- Melezhik, V.A.; Fallick, A.E.; Filippov, M.M.; Larsen, O. Karelian shungite—an indication of 2.0-Ga-old metamorphosed oil-shale and generation of petroleum: Geology, lithology and geochemistry. Earth Sci. Rev. 1999, 47, 1–40. [Google Scholar] [CrossRef]
- Strauss, H.; Melezhik, V.A.; Lepland, A.; Fallick, A.E.; Hanski, E.J.; Filippov, M.M.; Deines, Y.E.; Illing, C.J.; Črne, A.E.; Brasier, A.T. Enhanced Accumulation of Organic Matter: The Shunga Event. In Reading the Archive of Earth’s Oxygenation; Melezhik, V.A., Fallick, A.E., Eds.; Springer: Berlin, Germany, 2013; pp. 1195–1273. [Google Scholar]
- Scogings, A.; Chesters, J. Rank and file: Assessing graphite projects on credentials. Ind. Miner. 2015, 2015, 50–55. [Google Scholar]
- Kaufmann, D.; Kraay, A.; Mastruzzi, M. The Worldwide Governance Indicators: Methodology and Analytical Issues; Policy Research Working Paper No 5430; World Bank: Washington, DC, USA, 2010; pp. 1–31. [Google Scholar]


| Occurrence No. | Occurrence Name | % TC (Mean) | Tonnage (Mt) | Contained Graphite (Mt) | References |
|---|---|---|---|---|---|
| 1 | Trælen | 31.0 | 1.80 | 0.56 | * |
| 2 | Vardfjellet | 9.2 | 12.84 | 1.18 | [51,61] |
| 3 | Hesten | 5.8 | 2.07 | 0.12 | [51,61] |
| 4 | Bukken | 6.5 | 51.03 | 3.34 | [51,61,62] |
| 5 | Litljkollen | 5.3 | 34.54 | 1.83 | [51,61] |
| 6 | Grunnvåg | 5.2 | 22.77 | 1.19 | [51,61] |
| 7 | Skardsvåg | 2.1 | n. a. | n. a. | [51] |
| 8 | Haugsnes | 16.2 | 8.40 | 1.36 | [52,60,63] |
| 9 | Kjerkhaugen | 6.5 | 2.42 | 0.16 | [60] |
| 10 | Møkland | 13.2 | 3.40 | 0.45 | [52,60,63] |
| 11 | Rise | 7.9 | 0.19 | 0.01 | [60] |
| 12 | Sommarland | 12.5 | 0.85 | 0.11 | [52,60,63] |
| 13 | Brenna | 10.1 | 7.94 | 0.80 | [60] |
| 14 | Evassåsen | 7.6 | 2.12 | 0.16 | [60] |
| 15 | Vikeid Central | 13.8 | 8.89 | 1.23 | [60] |
| 16 | Vikeid West | 11.3 | 29.63 | 3.35 | [60] |
| 17 | Ånstad | 36.8 | 0.21 | 0.08 | [60] |
| 18 | Alsvåg | 8.9 | 0.25 | 0.02 | [60] |
| 19 | Instøya | 9.3 | 14.82 | 1.42 | [60] |
| 20 | Rødhamran | 14.8 | 1.38 | 0.20 | [52,60,63] |
| 21 | Romset | 14.7 | 9.63 | 1.42 | [60] |
| 22 | Skogsøya | 20.0 | 1.42 | 0.30 | [52,60,63] |
| 23 | Smines | 7.1 | 18.89 | 1.34 | [52,60,63] |
| 24 | Svinøya | 11.7 | 0.02 | 0.02 | [52,60,63] |
| 25 | Jennestad | 9.6 | 3.66 | 0.35 | [56,58,64] |
| 26 | Myre | na | na | na | [52,60,63] |
| 27 | Nord-Værnes | 4.1 | 0.60 | 0.02 | [59] |
| 28 | Rendalsvik | 11.1 | 1.90 | 0.21 | [65,66] |
| Average | 11.6 | 9.3 | 0.81 | ||
| Sum | 241.6 | 21.51 |
| μm | Wt. % | Wt. % Cumulative | % TC | % TC Recovery | % TC Cumulative Recovery |
|---|---|---|---|---|---|
| 300 | 7.1 | 7.1 | 98.2 | 7.7 | 7.7 |
| 150 | 31.7 | 38.8 | 98.1 | 34.5 | 42.2 |
| 75 | 29.8 | 68.6 | 90.4 | 29.9 | 72.1 |
| 63 | 7.4 | 76.0 | 80.7 | 6.6 | 78.7 |
| 45 | 8.4 | 84.4 | 78.0 | 7.3 | 86.0 |
| <45 | 15.6 | 100.0 | 80.7 | 14.0 | 100.0 |
| Cleaner concentrate | 100.0 | 90.1 | 98.1 |
© 2020 by the authors. Licensee MDPI, Basel, Switzerland. This article is an open access article distributed under the terms and conditions of the Creative Commons Attribution (CC BY) license (http://creativecommons.org/licenses/by/4.0/).
Share and Cite
Gautneb, H.; Rønning, J.S.; Engvik, A.K.; Henderson, I.H.C.; Larsen, B.E.; Solberg, J.K.; Ofstad, F.; Gellein, J.; Elvebakk, H.; Davidsen, B. The Graphite Occurrences of Northern Norway, a Review of Geology, Geophysics, and Resources. Minerals 2020, 10, 626. https://doi.org/10.3390/min10070626
Gautneb H, Rønning JS, Engvik AK, Henderson IHC, Larsen BE, Solberg JK, Ofstad F, Gellein J, Elvebakk H, Davidsen B. The Graphite Occurrences of Northern Norway, a Review of Geology, Geophysics, and Resources. Minerals. 2020; 10(7):626. https://doi.org/10.3390/min10070626
Chicago/Turabian StyleGautneb, Håvard, Jan Steinar Rønning, Ane K. Engvik, Iain H.C. Henderson, Bjørn Eskil Larsen, Janja Knežević Solberg, Frode Ofstad, Jomar Gellein, Harald Elvebakk, and Børre Davidsen. 2020. "The Graphite Occurrences of Northern Norway, a Review of Geology, Geophysics, and Resources" Minerals 10, no. 7: 626. https://doi.org/10.3390/min10070626