Article

The Effect of Pulsed Laser Heating on the Stability of Ferropericlase at High Pressures

1
Materials Physics and Technology at Extreme Conditions, Laboratory of Crystallography, Universität Bayreuth, D-95440 Bayreuth, Germany
2
Deutsches Elektronen-Synchrotron (DESY), D-22607 Hamburg, Germany
3
Bayerisches Geoinstitut, Universität Bayreuth, D-95440 Bayreuth, Germany
4
ESRF–The European Synchrotron, CS 40220, CEDEX 9, 38043 Grenoble, France
5
Department of Physics, Chemistry and Biology (IFM), Linköping University, SE-581 83 Linköping, Sweden
*
Author to whom correspondence should be addressed.
Minerals 2020, 10(6), 542; https://doi.org/10.3390/min10060542
Submission received: 29 April 2020 / Revised: 2 June 2020 / Accepted: 11 June 2020 / Published: 16 June 2020
(This article belongs to the Special Issue Minerals under Extreme Conditions)

Abstract

:
It is widely accepted that the lower mantle consists of mainly three major minerals—ferropericlase, bridgmanite and calcium silicate perovskite. Ferropericlase ((Mg,Fe)O) is the second most abundant of the three, comprising approximately 16–20 wt% of the lower mantle. The stability of ferropericlase at conditions of the lowermost mantle has been highly investigated, with controversial results. Amongst other reasons, the experimental conditions during laser heating (such as duration and achieved temperature) have been suggested as a possible explanation for the discrepancy. In this study, we investigate the effect of pulsed laser heating on the stability of ferropericlase, with a geochemically relevant composition of Mg0.76Fe0.24O (Fp24) at pressure conditions corresponding to the upper part of the lower mantle and at a wide temperature range. We report on the decomposition of Fp24 with the formation of a high-pressure (Mg,Fe)3O4 phase with CaTi2O4-type structure, as well as the dissociation of Fp24 into Fe-rich and Mg-rich phases induced by pulsed laser heating. Our results provide further arguments that the chemical composition of the lower mantle is more complex than initially thought, and that the compositional inhomogeneity is not only a characteristic of the lowermost part, but includes depths as shallow as below the transition zone.

1. Introduction

The Earth’s lower mantle constitutes more than half of the volume of the planet, from the transition zone at the depth of 660 km to the core-mantle boundary (CMB) at 2900 km [1]. Currently, it is widely accepted that the lower mantle consists of mainly three major minerals—ferropericlase, bridgmanite and calcium silicate perovskite [2,3,4]. Ferropericlase is believed to be the second most abundant of the three, comprising approximately 16–20 wt% of the lower mantle [1,5,6].
The expected percentage of iron (expressed as Fe/(Mg + Fe)) in (Mg,Fe)O in the lower mantle is 10–25%, as follows, particularly, from studies of Mg-Fe partitioning between bridgmanite and ferropericlase [7,8]. Ferropericlase with such a composition is so far considered to be stable in a NaCl-type (B1) structure ( F m 3 ¯ m ) throughout the lower mantle [9] (in contrast to bridgmanite that is replaced by post-perovskite near the CMB [10]); above ~50 GPa, iron in ferropericlase undergoes a spin crossover from a high-spin to a low-spin state [11].
There are, however, reports that (Mg,Fe)O, with a relatively large amount of Fe, may decompose at pressure-temperature conditions of the lowermost mantle into an Fe-richer and a Mg-richer phases [12,13]. In contrast to the earlier reports on decomposition, subsequent studies in laser-heated diamond anvil cells (LHDACs) did not observe any segregation between iron and magnesium [9,14,15,16] (although extra diffraction lines were observed, see Ref. [9], for example). Ferropericlase inclusions in super-deep diamonds show very large variations of Mg/Fe ratio [17], suggesting that there are natural processes which lead to compositional differentiation in the formation of (Mg,Fe)O. The behavior of ferropericlase, as well as the partitioning of iron between minerals that co-exist in lower mantle, play a crucial role in understanding the dynamics, geophysics, and geochemistry of the Earth [11,18].
Pulsed laser heating has been used for the initiation and study of chemical reactions in different systems at ambient pressures over the course of several decades [19]. In experiments with diamond anvil cells (DACs), pulsed laser heating (PLH) was considered as an option to prevent or minimize (in comparison with continuous wave, CW) reactions between diamond anvils (carbon) and heated matter [20,21]. However, a recent study on the reactivity of iron with the diamond anvils inside a DAC shows no obvious advantage due to heating in pulse mode [22]. Still, PLH in DACs is more stable (spatially and in term of overall duration) and often easier to control in comparison with CW.
In this study, we investigate the effect of pulsed laser heating on the stability of ferropericlase, with a geochemically relevant composition of Mg0.76Fe0.24O (Fp24) at pressure conditions corresponding to the depth from 800 km up to 1200 km within the upper part of the lower mantle [23,24], and at a temperature range of 1550 K to 3400 K. We report on the decomposition of Fp24 with the formation of a high-pressure (Mg,Fe)3O4 phase with CaTi2O4-type structure, as well as the dissociation of Fp24 into Fe-rich and Mg-rich phases induced by pulsed laser heating.

2. Materials and Methods

2.1. Sample Preparation

Ferropericlase starting material was synthesized by Longo et al. [25] Magnesium and iron metal were mixed in stoichiometric proportion 3:1 to obtain crystalline powder of Mg0.75Fe0.25O. Metals were dissolved in HNO3 and aqueous NH3 has been added in order to obtain hydroxide precipitate. The excess water (10 mL), NH4NO3 and NH3 were removed by drying the gel in a Pt crucible at 1200–1500 °C on a Bunsen and then in the furnace at 800 °C. The powders were finally equilibrated in the gas-mixing furnace under different CO/CO2 ratios well mixed at 1300 °C, in order to guarantee a wide range of Fe3+/ΣFe. LogfO2 has been estimated on activity-composition relation and oxygen activity at 1300 °C: it has been varied between log(−7) and log(−11) on the Fe-FeO buffer. The mixtures were enriched in 57Fe of approximately 10% of the total Fe, to facilitate Mössbauer spectroscopy measurements.
The powder ferropericlase, with a composition of Mg0.75Fe0.25O, was filled into Re-foil capsules for single crystal growth. Then, 10wt% ReO2 powder was added as a redox sensor. The starting material was pressurized to 15 GPa and heated to 1800 °C, for a maximum heating time of 1 h, using a Sumitomo press, one of the 6–8 Kawai-types of presses at Bayerisches Geoinstitut (BGI) and a LaCrO3 heater. The elevated temperature was monitored by a W97%Re3%–W75%Re25% thermocouple directly in contact with the Re capsule. The experimental run followed the standard procedure of cold pressurizing, with subsequent heating to target temperature with a 100 °C/min rate. Isobaric quenching of the experiments was achieved by turning off the power to the furnace, after which the sample was slowly decompressed. The cooling rate was approximately 200–250 °C/s. The homogeneity of the recovered sample was checked using scanning electron microscopy (SEM) and energy dispersive X-ray spectroscopy (EDX). No variations in chemical composition within the accuracy of the method (about 1 at%) were detected by EDX. Single crystal X-ray diffraction was performed on several particles, with linear dimensions of 15 to 25 μm, that were selected from the recovered sample. The lattice parameter of the material was found to be 4.218(1) Å with a refined chemical composition Mg0.76(2)Fe0.24(2)O.
Mössbauer absorption spectra were collected from a part of the recovered sample using a conventional WissEL spectrometer in constant-acceleration mode, with a nominal 10 mCi57Co(Rh) point source at 19 °C. The folded spectra consist of 256 channels. All spectra were fit using the MossA software package [26], using the full transmission integral with pseudo-Voigt source line-shapes (Figure 1). Despite the sample being too thick for an accurate fit, the spectra could be fit using two doublets with center shifts (CS) that correspond to iron Fe2+—as expected for ferropericlase—and a singlet with CS that corresponds to Fe3+. The amount of Fe3+ in the starting material is within the errors of uncertainty and can be considered negligible.
For the high-pressure experiments, a total of five crystals of ferropericlase were loaded into two BX90-type [27] DACs with Boehler-Almax [28] diamonds. Three crystals were placed in a DAC with anvil culets of 350 μm in diameter and two crystals in a DAC with anvil culets of 250 μm in diameter, and were pressurized, as described in the following sections. Rhenium gaskets were pre-indented from an initial thickness of 200 μm down to 25–35 μm and laser-drilled to create circular pressure chambers of 100–120 μm in diameter. Both DACs were loaded with neon as a pressure-transmitting medium using the in-house gas loading system at BGI [29].

2.2. Experiment 1

For the first experiment, three Mg0.76Fe0.24O crystals with dimensions of approximately 20 × 20 × 7 µm3 were placed inside the sample chamber of a DAC, and pressurized to 26(1) GPa (as determined from Raman shift of diamond anvil [30]). After laser heating (see Table 2), the pressure increased to 30.0(5) GPa (determined using X-ray diffraction data and the equation of state of Ne [31]). The samples were heated at beamline ID18 of the European synchrotron radiation facility (ESRF, Grenoble, France) using the portable laser-heating system [32]. Each crystal was heated using a different heating method—continuous wave (CW), pulsed at 25 kHz repetition rate with pulses of 3 μs, and pulsed at 1 kHz with pulses of 500 μs. Table 2 presents the details of each heating sequence. All crystals were heated using one-sided heating (upstream side), but the temperature was recorded from both observation sides. The thermal gradient was usually 100–200 K between the heated and the non-heated side, thus providing a constraint for the heating temperature of the whole volume of the crystal. Temperatures were measured using spectroradiometry and, particularly for the pulsed laser heating, the temperature reported is the one at the highest at the peak of the pulse, collected as described by Aprilis et al. [33].
Mössbauer spectra were collected using the Synchrotron Mössbauer Source (SMS) [34] of the Nuclear Resonance beamline [35] ID18 at the ESRF, where a 57FeBO3 single-crystal monochromator was used to obtain pure nuclear reflection, i.e., approximately 10 neV full-width at half maximum (FWHM), at the Mössbauer energy of 14.4 keV, from a wide spectrum of synchrotron radiation. Kirkpatrick-Baez mirrors were used to focus the beam to a cross-section size of 14 × 18 [horizontal × vertical] μm2. The velocity scales of all Mössbauer spectra were calibrated relative to a 25 μm thick α-Fe foil. Each SMS spectrum took approximately 30 min to collect and single line spectra were collected before and after each ferropericlase spectrum, to monitor source linewidth. All spectra were fit using the MossA software package [26], using the full transmission, integral with a normalized Lorentzian-squared source line-shape.
In situ high-pressure single-crystal diffraction experiments (SCXRD) were performed at beamline ID15b at the ESRF. Monochromatic X-ray diffraction experiments were performed using X-rays with wavelengths of 0.41107 Å. The X-ray beam was focused to approximately 10 × 10 μm2 FWHM by a spherical mirror and a bent Si(111) Laue monochromator [36]. Diffraction patterns were collected using a large area MAR555 flat panel detector. Before the experiment, the detector-sample distance was calibrated with a Si standard, using the procedure implemented in the program Dioptas [37].
Both a wide-scan and a stepped ω-scan were collected for each quenched crystal at 30 GPa. Wide-scans consisted of 2 s exposures during rotations of ±20° of the DAC. Stepped scans consisted of individual exposures of 1 s taken over 0.5° intervals in the range of ±35° rotation, to constrain the ω angle of maximum intensity of each peak. Collected diffraction images were analyzed using the CrysAlis PRO© software [38]. A single crystal of an orthoenstatite (Mg1.93,Fe0.06)(Si1.93,Al0.06)O6 (Pbca, a = 8.8117(2), b = 5.18320(10), c = 18.2391(3) Å) was used to calibrate the instrument model of CrysAlis PRO© (sample-to-detector distance, the detector’s origin, offsets of the goniometer angles, and rotation of the x-ray beam and the detector around the instrument axis). All structure solutions and refinements were performed with the JANA2006 crystallographic computing system [39].

2.3. Experiment 2

For the second experiment, two Mg0.76Fe0.24O crystals with dimensions of approximately 20 × 20 × 7 µm3 were placed inside the sample chamber of a DAC and then pressurized to 48(1) GPa (as determined from the Raman shift of diamond anvil [30]). Both crystals were laser heated from both sides using the double-sided pulsed laser heating system of BGI [33]. One crystal (C04) was heated with laser pulses of 250 μs duration at 2 kHz frequency, reaching temperatures of 2800 K and 3100 K respectively, on each side, at the peak of the pulses. The second crystal (C05) was heated with laser pulses of 11 μs duration, at a frequency of 25 kHz. The temperatures achieved at the peak of the pulses on each heating side were, in this case, 3100 K and 3400 K, respectively (Table 3). The heating run for both crystals lasted approximately 30 s.
The quenched materials were investigated at the Extreme Conditions Beamline (ECB) P02.2 of PETRA III (DESY, Hamburg, Germany) [40]. Data were collected with a Perkin Elmer XRD1621 flat panel detector using X-rays with a wavelength of 0.2907 Å and a size of 2.5 × 2.5 μm2 (FWHM) at the focal position. After heating, the pressure increased to 53.5(5) GPa, as determined from X-ray diffraction data and the equation of state of Ne [31]. A grid with 1 μm step, in both vertical and horizontal directions of wide scans of 20 s exposure during a ω rotation of ±20°, was collected from each crystal. Each grid covered a total area of 23 × 23 μm2, i.e., the whole crystal surface. The X-ray diffraction maps of the crystals were analyzed using the XDI software [41].

3. Results

Pulsed laser heating induced different chemical changes to the crystals observed at both 30 and 53.5 GPa: the decomposition of Fp24 with the formation of a new phase or/and dissociation of Fe-rich and Mg-rich ferropericlase. The evidence for two scenarios for both experiments is described below separately in the following sections.

3.1. Formation of CaTi2O4-Structured hp-(Mg,Fe)3O4 Phase

The performed X-ray diffraction experiments on the DAC heated at 30 GPa (Experiment 1) have revealed a different response of Mg0.76Fe0.24O crystals #1–3 to the high-temperature treatment. While crystal C03 have persisted upon the CW laser heating experiment, diffraction patterns of crystals C01 and C02 featured the appearance of new Bragg peaks, coexisting with the peaks of starting material (Figure 2). The quality of the diffraction data collected on crystal C02 is better than on the crystal C01, therefore, these data are used for further discussion. Based on single-crystal diffraction data, peaks belonging to the new phase were indexed in the orthorhombic unit cell with a = 2.7419(1) Å, b = 9.170(4) Å, c = 9.313(3) Å, V = 234.2(2) Å3. The crystal structure was solved in the space group Cmcm (N.63) and was found to be of CaTi2O4-type (Table 4), isostructural to the high-pressure form of Fe3O4 [42]. The unit cell volume of the observed phase is smaller than that reported for pure hp-Fe3O4 at 41 GPa (238.68 Å3) and calculated from published equations of state (Ref. [42], 242.4 Å3 at 30 GPa). This may indicate that Fe2+ was substituted by Mg2+. According to the results of single-crystal diffraction data analysis, the structure of the phase possesses two crystallographically independent sites occupied by Fe and Mg (FeMg1 and FeMg2, with Wyckoff positions 4c and 8f, respectively) and three oxygen sites. The FeMg1 and FeMg2 sites are coordinated by six oxygen atoms with a formation of trigonal prisms and octahedra, respectively (Figure 3a,b). Trigonal prisms share common triangular faces along the a axis, while the octahedra share common edges (Figure 3c). The average FeMg-O bond distances are 2.06(1) and 1.932(6) Å for FeMg1 and FeMg2, respectively (Table 5). Refinement of the cation sites occupancies yielded Fe0.46(7)Mg0.54(7) for FeMg1 and Fe0.68(7)Mg0.32(7) for FeMg2, resulting in the formula (Fe1.82(21),Mg1.18(21))O4, or (Fe0.61(7), Mg0.39(7))3O4.
Synchrotron Mössbauer spectra collected from each crystal at 30 GPa (Experiment 1) show minor changes before and after heating (Figure 4). The fitting of the spectra reveals the existence of an Fe3+ component (example of crystal C03 is shown in Figure 5), although the high overlap between the paramagnetic doublets increases the uncertainty of the fit. The Mössbauer absorption of all crystals can be explained solely by the components of pure ferropericlase. More specifically, the spectra could be fit using two doublets with center shifts (CS), that correspond to iron Fe2+ and a doublet with CS that corresponds to Fe3+. This may be due to the too small amount of the hp-(Mg,Fe)3O4 phase and/or the too small domains distributed in the ferropericlase matrix.
The same hp-(Mg,Fe)3O4 phase was also observed at 53.5 GPa, alongside ferropericlase on both crystals that where pulsed laser heated. While the diffraction data quality was not sufficient for structural refinement, the lattice parameters of hp-(Mg,Fe)3O4 were unambiguously determined from powder Le Bail refinement with orthorhombic unit cell: a = 2.660(2) Å, b = 8.892(4) Å, c = 9.094(3) Å, V = 215.14(16) Å3. The unit cell volume is smaller than that of pure hp-Fe3O4 at the same pressure [42], as expected for a material that contains both iron and magnesium. The detailed X-ray diffraction mapping revealed the formation of hp-(Mg,Fe)3O4 in small amounts at the heated area of both crystals (Figure 6), confirming the decomposition of ferropericlase at both pressure points.

3.2. Dissociation of (Mg,Fe)O

After laser heating, the broadening (at low 2θ angles) and splitting (at high 2θ) of Bragg peaks of ferropericlase were observed on quenched samples. The diffraction domains of ferropericlase have the same orientations but are characterized by slightly different d-spacings of the corresponding reflections, thus, suggesting the existence of two coherently grown phases with different lattice parameters.
In the case of Experiment 1 at 30 GPa, the effect was mainly observed on the crystal heated with short pulses of 3 μs (C02), where the splitting of ferropericlase Bragg peaks is also clearly visible at the diffraction profile pattern (Figure 2). The separation of diffraction peaks was less prominent on the crystal that was heated with long pulses of 500 μs duration (C01), and even less on the crystal heated with a CW laser. In the latter case, the peaks were only broadened and there was no distinct splitting, even for the high 2θ angles.
The splitting of ferropericlase diffraction peaks is similarly detected on both pulse laser heated ferropericlase crystals of Experiment 2 (at 53.5 GPa). Furthermore, an analysis of the diffraction patterns using X-ray diffraction mapping revealed that the separation into two phases was more intense at the center and less pronounced at the edges of the heated area where the heating temperatures were lower (Figure 7).

4. Discussion

4.1. Formation of hp-(Mg,Fe)3O4 by Laser Heating of Ferropericlase

Upon laser heating at pressures of about 30 GPa and 50 GPa, ferropericlase Mg0.76Fe0.24O underwent a chemical reaction, resulting in the formation of a CaTi2O4-type structured post-spinel oxide (Fe0.61, Mg0.39)3O4. The formation of the hp-(Mg,Fe)3O4 phase could possibly be the result of an oxidation-reduction of the solid solution of MgO-FeO into an oxide with a ferric component, as follows:
Mg 0.76 Fe 0.24 O x 12 MgFe 2 O 4 + x 12 Fe + ( 1 x 3 ) Mg 0.76 x 12 1 x 3 Fe 0.24 x 4 1 x 3 O
The iron end-member of Fe3O4 is known to transform into the same CaTi2O4-type of structure (hp-Fe3O4) upon compression and, reportedly, the formation of hp-Fe3O4 is facilitated by heating [42,43]. Recent studies based on quenched samples produced in multi-anvil presses reported that the magnesium end-member MgFe2O4 (magnesioferrite) decomposes into MgFe2O5 and hematite upon compression, without transforming into a high-pressure phase [44], but the solid solution with (Mg0.5,Fe0.5)Fe2O4 composition quenched from pressures of about 20 GPa and high temperatures transforms into an orthorhombic post-spinel phase with a yet unknown structure [45].
The structure of high-pressure magnesioferrite solid solution was unambiguously determined to be of the CaTi2O4-type using single-crystal X-ray diffraction, revealing a structure with composition (Fe0.73,Mg0.27)(Fe0.64,Mg0.36)2O4 and Fe occupying both crystallographic positions [46]. The high-pressure polymorph is reportedly stable at pressures above 27 GPa and was synthesized by compression at room temperature, supporting that the pressure conditions of this study lie within the stability field of the high-pressure polymorph of the oxide.
Magnesioferrite-magnetite solid solutions with iron-rich compositions (Mg0.5Fe2.5O4 [47] and non-stoichiometric Mg1.30Fe1.80O4 [48]) were found in magnesiowüstite inclusions of natural diamonds, formed around crystal defects of (Mg,Fe)O. The hypothesis that the magnesioferrite-magnetite solid solution is directly exsolved from (Mg,Fe)O is further supported by our results, thus, reinforcing the allegations of a deep, lower mantle origin of the diamond inclusions [47,49].
The decomposition of ferropericlase into a high-iron composition post-spinel hp-(Mg,Fe)3O4 phase and the ability of complex oxides such as Fe4O5 and Fe7O9 to form solid solutions with their Mg-end-members [45,50,51] have implications for the possible existence of complex Mg-Fe oxides in oxidized slabs and/or mantle and, thus, indicate that the phase composition of the lower mantle may not be limited to only the three major minerals of ferropericlase, bridgmanite and CaSi-perovskite.

4.2. Dissociation of (Mg,Fe)O into Fe-Rich and Fe-Poor Components

The heating of ferropericlase single crystals at both pressure points presented in this study induce the broadening or splitting of the diffraction peaks, due to the decomposition of Fp24 into two different phases, with the same NaCl-type structure and two different compositions, an Fe-rich and an Mg-rich, respectively. The difference in the compositions results in slightly different lattice parameters and, thus, the separation of the diffraction peaks, the effect being more obvious at higher diffraction angles.
The splitting of the Bragg reflections in ferropericlase has been attributed to the rhombohedral distortion of the cubic lattice under non-hydrostatic conditions [52]. However, this cause is excluded, since the transition to the rhombohedral R 3 ¯ m phase does not affect the (200) and (400) reflections of the cubic F m 3 ¯ m phase. In the results presented here, both reflections appear either broadened or split (Figure 2).
The iron partitioning in ferropericlase upon heating has been experimentally reported at pressure conditions of the lowermost mantle [12]. All the studies have so far been on powder samples and the results have been attributed to the effect of the Fe2+ spin transition [53], the Soret effect [54] or the non-ideal melting of the FeO-MgO system [18,55]. Some studies support the stability of different ferropericlase compositions upon heating and no inhomogeneity is reported for hot or quenched samples [9,16,56]. The lack of inhomogeneity after heating has been attributed to short heating duration [14], suggesting the influence of chemical kinetics as a possible reason for the discrepancy. Another LHDAC study on (Mg,Fe)O resulted in a homogeneous quenched sample after 60 min of heating, but at a range of temperatures of 1600–1800 K, relatively lower than the other studies in comparison [54]. Another reason for this discrepancy could be the overlap of the diffraction peaks of the B2 phase of NaCl used as a pressure medium, with the strong peaks of ferropericlase that could cover a possible change in the latter, the lack of resolution of the diffraction patterns in the small diffraction angles that were taken into consideration, or, in some cases, the low heating temperature of the annealing process.
None of the causes proposed for powder data can be applied here, since the formation of two phases on a single crystal sample takes place even at a pressure well below the spin crossover in Fe [16], and after heating at temperatures below melting (for the samples heated at 30 GPa) [18,55]. The two different phases of ferropericlase have a small difference in the lattice parameters, but the same orientation, as seen in the diffraction images of the quenched samples (an example presented in Figure 7). The coherent intergrowth of phases with different compositions is commonly observed in minerals forming lamellae due to exsolution [57] and is known to be induced by heating in single crystal studies [58]. The results of this study at 30 GPa (Experiment 1) provide strong evidence that there is a range of temperatures above 1800 K, where the miscibility gap of Mg0.76,Fe0.24O exists, as has also been suggested for higher pressures [59]. For the samples heated at 53.5 GPa (Experiment 2) close to solidus temperatures, it is hard to draw an unambiguous conclusion if melting was responsible or not for the decomposition.
Lately, the model of a homogeneous lower mantle with pyrolytic composition has been under discussion [48,60]. Our results provide further arguments that the chemical composition of the lower mantle is more complex than initially thought and that the compositional inhomogeneity is not only a characteristic of the lowermost part, but includes depths as shallow as below the transition zone.

4.3. Effect of Pulsed Laser Heating

Ferropericlase is a majorly investigated oxide due to its importance in the Earth interior mineralogy. However, its decomposition into a high-pressure magnesioferrite solid solution has not been reported so far, and the decomposition into of Fe- and Mg-rich components has also been disputed.
The formation of hp-(Mg,Fe)3O4 is obviously limited in amount in comparison to the bulk of (Mg,Fe)O, and for the samples laser heated at 53.5 GPa (Experiment 2), the detection of the new phase was possible by the very detailed high-intensity X-ray beam mapping of the entire sample. Therefore, the regular analysis of only powder X-ray diffraction data might not be enough for the identification of the phase.
Our observations indicate that the type of laser heating may also affect the results. As seen in Figure 2 and Table 2 (Experiment 1), for similar temperature ranges and heating duration applied to the crystals at the same pressure, the crystals that were pulsed (and especially the one heated with short laser pulses) had a significantly higher amount of hp-(Mg,Fe)3O4, and demonstrated much clearer signs of dissociation of Fp24 on iron- and magnesium-rich phases. In Experiment 2, both the formation of hp-(Mg,Fe)3O4 and the dissociation of (Fe,Mg)O were observed in both crystals, after only 30 s of pulsed laser heating. This is in contrast to the reports of Ref. [54], where no inhomogeneity was observed after 60 min of continuously heating ferropericlase samples at a similar pressure range. However, in this case, the heating technique might not be the only factor affecting the results, but also the different composition of the samples (Fe0.11Mg0.89O), as well as the significantly lower heating temperatures (1600–1800 K).
As a conclusion from both experiments conducted, our current results qualitatively agree with a previous report [22], suggesting that pulsed laser-heating not only does not prevent chemical reactions, but probably accelerates them.

Supplementary Materials

The following are available online at https://www.mdpi.com/2075-163X/10/6/542/s1, Figure S1: Representative powder diffraction patterns for the mapping of ferropericlase (Fp) crystal C04 at 53.5(5) GPa, Figure S2: Representative powder diffraction patterns for the mapping of ferropericlase (Fp) crystal C05 at 53.5(5) GPa, Figure S3: Powder diffraction patterns of ferropericlase (Fp) crystal C05 at 53.5(5) GPa at two selected positions, at the edge (“A”) and close to the center (“B”) of the heated area, Crystallographic Information File (CIF): Structure refinement of hp-(Mg,Fe)3O4 at 30 GPa.

Author Contributions

Methodology, L.D. and G.A.; investigation, G.A., A.P., S.C., S.K., C.M. (Caterina Melai), E.B., M.B., T.F., E.K., C.M. (Catherine McCammon), A.I.C., M.H. and L.D.; data curation, G.A., A.P., L.D., E.B. and C.M. (Catherine McCammon); writing—Original draft preparation, G.A., A.P., N.D. and L.D.; writing—Review and editing, G.A. with contributions from all co-authors; supervision, L.D. and N.D.; funding acquisition, N.D. and L.D. All authors have read and agreed to the published version of the manuscript.

Funding

This research was funded by the Federal Ministry of Education and Research, Germany (BMBF) grants No. 5K16WC1 and No. 05K19WC1, the Deutsche Forschungsgemeinschaft (DFG) projects DU 954-11/1, DU 393-9/2, and DU 393-13/1, and the Swedish Government Strategic Research Area in Materials Science on Functional Materials at Linköping University faculty grant SFO-Mat-LiU No. 2009 00971.

Acknowledgments

We acknowledge the use of synchrotron radiation facilities at the beamlines ID18 and ID15B of the European Synchrotron Radiation Facility (ESRF) and at the beamline P02.2 of PETRA III at DESY, a member of the Helmholtz Association (HGF). N.D. and L.D. thank the Federal Ministry of Education and Research, Germany (BMBF, grants No. 5K16WC1 and No. 05K19WC1) and the Deutsche Forschungsgemeinschaft (DFG projects DU 954-11/1, DU 393-9/2, and DU 393-13/1) for financial support. N.D. thanks the Swedish Government Strategic Research Area in Materials Science on Functional Materials at Linköping University (Faculty Grant SFO-Mat-LiU No. 2009 00971).

Conflicts of Interest

The authors declare no conflict of interest.

References

  1. Kaminsky, F.V. The Earth’s Lower Mantle; Springer Geology; Springer International Publishing: Cham, Switzerland, 2017; ISBN 978-3-319-55683-3. [Google Scholar]
  2. Lee, K.K.M.; O’Neill, B.; Panero, W.R.; Shim, S.-H.; Benedetti, L.R.; Jeanloz, R. Equations of state of the high-pressure phases of a natural peridotite and implications for the Earth’s lower mantle. Earth Planet. Sci. Lett. 2004, 223, 381–393. [Google Scholar] [CrossRef]
  3. Tschauner, O.; Ma, C.; Beckett, J.R.; Prescher, C.; Prakapenka, V.B.; Rossman, G.R. Discovery of bridgmanite, the most abundant mineral in Earth, in a shocked meteorite. Science 2014, 346, 1100–1102. [Google Scholar] [CrossRef] [PubMed] [Green Version]
  4. Xu, W.; Lithgow-Bertelloni, C.; Stixrude, L.; Ritsema, J. The effect of bulk composition and temperature on mantle seismic structure. Earth Planet. Sci. Lett. 2008, 275, 70–79. [Google Scholar] [CrossRef]
  5. Irifune, T. Absence of an aluminous phase in the upper part of the Earth’s lower mantle. Nature 1994, 370, 131–133. [Google Scholar] [CrossRef]
  6. Wood, B.J. Phase transformations and partitioning relations in peridotite under lower mantle conditions. Earth Planet. Sci. Lett. 2000, 174, 341–354. [Google Scholar] [CrossRef]
  7. Mao, H.; Guoyin, S.; Hemley, R.J. Multivariable Dependence of Fe-Mg Partitioning in the Lower Mantle. Science 1997, 278, 2098–2100. [Google Scholar] [CrossRef]
  8. Katsura, T.; Ito, E. Determination of Fe-Mg partitioning between perovskite and magnesiowüstite. Geophys. Res. Lett. 1996, 23, 2005–2008. [Google Scholar] [CrossRef]
  9. Lin, J.-F.; Heinz, D.L.; Mao, H.-K.; Hemley, R.J.; Devine, J.M.; Li, J.; Shen, G. Stability of magnesiowüstite in Earth’s lower mantle. Proc. Natl. Acad. Sci. USA 2003, 100, 4405–4408. [Google Scholar] [CrossRef] [Green Version]
  10. Murakami, M.; Hirose, K.; Kawamura, K.; Sata, N.; Ohishi, Y. Post-Perovskite Phase Transition in MgSiO3. Science 2004, 304, 855–858. [Google Scholar] [CrossRef] [Green Version]
  11. Badro, J.; Fiquet, G.; Guyot, F.; Rueff, J.-P.; Struzhkin, V.V.; Vankó, G.; Monaco, G. Iron Partitioning in Earth’s Mantle: Toward a Deep Lower Mantle Discontinuity. Science 2003, 300, 789–791. [Google Scholar] [CrossRef]
  12. Dubrovinsky, L.S. Stability of Ferropericlase in the Lower Mantle. Science 2000, 289, 430–432. [Google Scholar] [CrossRef] [PubMed]
  13. Dubrovinsky, L.; Dubrovinskaia, N.; Annersten, H.; Hålenius, E.; Harryson, H. Stability of (Mg0.5Fe0.5)O and (Mg0.8Fe0.2)O magnesiowustites in the lower mantle. Eur. J. Mineral. 2001, 13, 857–861. [Google Scholar] [CrossRef]
  14. Kondo, T.; Ohtani, E.; Hirao, N.; Yagi, T.; Kikegawa, T. Phase transitions of (Mg,Fe)O at megabar pressures. Phys. Earth Planet. Inter. 2004, 143–144, 201–213. [Google Scholar] [CrossRef]
  15. Lin, J.-F.; Weir, S.T.; Jackson, D.D.; Evans, W.J.; Vohra, Y.K.; Qiu, W.; Yoo, C.-S. Electrical conductivity of the lower-mantle ferropericlase across the electronic spin transition. Geophys. Res. Lett. 2007, 34, 2–5. [Google Scholar] [CrossRef] [Green Version]
  16. Fei, Y.; Zhang, L.; Corgne, A.; Watson, H.; Ricolleau, A.; Meng, Y.; Prakapenka, V. Spin transition and equations of state of (Mg, Fe)O solid solutions. Geophys. Res. Lett. 2007, 34, L17307. [Google Scholar] [CrossRef]
  17. Kaminsky, F. Mineralogy of the lower mantle: A review of ‘super-deep’ mineral inclusions in diamond. Earth Sci. Rev. 2012, 110, 127–147. [Google Scholar] [CrossRef]
  18. Deng, J.; Lee, K.K.M. Viscosity jump in the lower mantle inferred from melting curves of ferropericlase. Nat. Commun. 2017, 8, 1997. [Google Scholar] [CrossRef]
  19. Karlov, N.V.; Kirichenko, N.A.; Luk’yanchuk, B.S. Laser Thermochemistry: Fundamentals and Applications; Cambridge International Science Pub.: Cambridge, UK, 2000; ISBN 9781898326090. [Google Scholar]
  20. Goncharov, A.F.; Montoya, J.A.; Subramanian, N.; Struzhkin, V.V.; Kolesnikov, A.; Somayazulu, M.; Hemley, R.J. Laser heating in diamond anvil cells: Developments in pulsed and continuous techniques. J. Synchrotron Radiat. 2009, 16, 769–772. [Google Scholar] [CrossRef]
  21. Goncharov, A.F.; Prakapenka, V.B.; Struzhkin, V.V.; Kantor, I.; Rivers, M.L.; Dalton, D.A. X-ray diffraction in the pulsed laser heated diamond anvil cell. Rev. Sci. Instrum. 2010, 81, 113902. [Google Scholar] [CrossRef]
  22. Aprilis, G.; Kantor, I.; Kupenko, I.; Cerantola, V.; Pakhomova, A.; Collings, I.E.; Torchio, R.; Fedotenko, T.; Chariton, S.; Bykov, M.; et al. Comparative study of the influence of pulsed and continuous wave laser heating on the mobilization of carbon and its chemical reaction with iron in a diamond anvil cell. J. Appl. Phys. 2019, 125, 095901. [Google Scholar] [CrossRef] [Green Version]
  23. Katsura, T.; Yoneda, A.; Yamazaki, D.; Yoshino, T.; Ito, E. Adiabatic temperature profile in the mantle. Phys. Earth Planet. Inter. 2010, 183, 212–218. [Google Scholar] [CrossRef]
  24. Trubitsyn, V.P.; Trubitsyna, A.P. Effects of compressibility in the mantle convection Equations. Izv. Phys. Solid Earth 2015, 51, 801–813. [Google Scholar] [CrossRef]
  25. Longo, M.; McCammon, C.A.; Jacobsen, S.D. Microanalysis of the iron oxidation state in (Mg,Fe)O and application to the study of microscale processes. Contrib. Mineral. Petrol. 2011, 162, 1249–1257. [Google Scholar] [CrossRef]
  26. Prescher, C.; McCammon, C.; Dubrovinsky, L. MossA: A program for analyzing energy-domain Mössbauer spectra from conventional and synchrotron sources. J. Appl. Crystallogr. 2012, 45, 329–331. [Google Scholar] [CrossRef]
  27. Kantor, I.; Prakapenka, V.; Kantor, A.; Dera, P.; Kurnosov, A.; Sinogeikin, S.; Dubrovinskaia, N.; Dubrovinsky, L. BX90: A new diamond anvil cell design for X-ray diffraction and optical measurements. Rev. Sci. Instrum. 2012, 83, 125102. [Google Scholar] [CrossRef]
  28. Boehler, R.; De Hantsetters, K. New anvil designs in diamond-cells. High Press. Res. 2004, 24, 391–396. [Google Scholar] [CrossRef]
  29. Kurnosov, A.; Kantor, I.; Boffa-Ballaran, T.; Lindhardt, S.; Dubrovinsky, L.; Kuznetsov, A.; Zehnder, B.H. A novel gas-loading system for mechanically closing of various types of diamond anvil cells. Rev. Sci. Instrum. 2008, 79, 045110. [Google Scholar] [CrossRef]
  30. Akahama, Y.; Kawamura, H. Pressure calibration of diamond anvil Raman gauge to 310GPa. J. Appl. Phys. 2006, 100, 043516. [Google Scholar] [CrossRef]
  31. Dewaele, A.; Datchi, F.; Loubeyre, P.; Mezouar, M. High pressure–high temperature equations of state of neon and diamond. Phys. Rev. B 2008, 77, 094106. [Google Scholar] [CrossRef]
  32. Kupenko, I.; Dubrovinsky, L.; Dubrovinskaia, N.; McCammon, C.; Glazyrin, K.; Bykova, E.; Ballaran, T.B.; Sinmyo, R.; Chumakov, A.I.; Potapkin, V.; et al. Portable double-sided laser-heating system for Mössbauer spectroscopy and X-ray diffraction experiments at synchrotron facilities with diamond anvil cells. Rev. Sci. Instrum. 2012, 83, 124501. [Google Scholar] [CrossRef]
  33. Aprilis, G.; Strohm, C.; Kupenko, I.; Linhardt, S.; Laskin, A.; Vasiukov, D.M.; Cerantola, V.; Koemets, E.G.; McCammon, C.; Kurnosov, A.; et al. Portable double-sided pulsed laser heating system for time-resolved geoscience and materials science applications. Rev. Sci. Instrum. 2017, 88, 084501. [Google Scholar] [CrossRef] [PubMed] [Green Version]
  34. Potapkin, V.; Chumakov, A.I.; Smirnov, G.V.; Celse, J.-P.; Rüffer, R.; McCammon, C.; Dubrovinsky, L. The 57Fe Synchrotron Mössbauer Source at the ESRF. J. Synchrotron Radiat. 2012, 19, 559–569. [Google Scholar] [CrossRef] [PubMed]
  35. Rüffer, R.; Chumakov, A.I. Nuclear Resonance Beamline at ESRF. Hyperfine Interact. 1996, 97–98, 589–604. [Google Scholar]
  36. Merlini, M.; Hanfland, M. Single-crystal diffraction at megabar conditions by synchrotron radiation. High Press. Res. 2013, 33, 511–522. [Google Scholar] [CrossRef]
  37. Prescher, C.; Prakapenka, V.B. DIOPTAS: A program for reduction of two-dimensional X-ray diffraction data and data exploration. High Press. Res. 2015, 35, 223–230. [Google Scholar] [CrossRef]
  38. CrysAlisPro Software System. Version 1.171.38.43; Rigaku Oxford Diffraction; Rigaku: Tokyo, Japan, 2015.
  39. Petříček, V.; Dušek, M.; Palatinus, L. Crystallographic Computing System JANA2006: General features. Z. Krist. Cryst. Mater. 2014, 229, 345–352. [Google Scholar] [CrossRef]
  40. Liermann, H.P.; Konôpková, Z.; Morgenroth, W.; Glazyrin, K.; Bednarčik, J.; McBride, E.E.; Petitgirard, S.; Delitz, J.T.; Wendt, M.; Bican, Y.; et al. The Extreme Conditions Beamline P02.2 and the Extreme Conditions Science Infrastructure at PETRA III. J. Synchrotron Radiat. 2015, 22, 908–924. [Google Scholar] [CrossRef] [PubMed] [Green Version]
  41. Hrubiak, R.; Smith, J.S.; Shen, G. Multimode scanning X-ray diffraction microscopy for diamond anvil cell experiments. Rev. Sci. Instrum. 2019, 90, 025109. [Google Scholar] [CrossRef] [PubMed]
  42. Dubrovinsky, L.S.; Dubrovinskaia, N.A.; McCammon, C.; Rozenberg, G.K.; Ahuja, R.; Osorio-Guillen, J.M.; Dmitriev, V.; Weber, H.-P.; Bihan, T.L.; Johansson, B. The structure of the metallic high-pressure Fe3O4 polymorph: Experimental and theoretical study. J. Phys. Condens. Matter 2003, 15, 7697–7706. [Google Scholar] [CrossRef]
  43. Haavik, C.; Stølen, S.; Fjellvåg, H.; Hanfland, M.; Häusermann, D. Equation of state of magnetite and its high-pressure modification: Thermodynamics of the Fe-O system at high pressure. Am. Mineral. 2000, 85, 514–523. [Google Scholar] [CrossRef]
  44. Uenver-Thiele, L.; Woodland, A.B.; Ballaran, T.B.; Miyajima, N.; Frost, D.J. Phase relations of MgFe2O4 at conditions of the deep upper mantle and transition zone. Am. Mineral. 2017, 102, 632–642. [Google Scholar] [CrossRef]
  45. Uenver-Thiele, L.; Woodland, A.B.; Ballaran, T.B.; Miyajima, N.; Frost, D.J. Phase relations of Fe-Mg spinels including new high-pressure post-spinel phases and implications for natural samples. Am. Mineral. 2017, 102, 2054–2064. [Google Scholar] [CrossRef]
  46. Greenberg, E.; Xu, W.M.; Nikolaevsky, M.; Bykova, E.; Garbarino, G.; Glazyrin, K.; Merkel, D.G.; Dubrovinsky, L.; Pasternak, M.P.; Rozenberg, G.K. High-pressure magnetic, electronic, and structural properties of MFe2O4 (M = Mg,Zn,Fe) ferric spinels. Phys. Rev. B 2017, 95, 195150. [Google Scholar] [CrossRef] [Green Version]
  47. Wirth, R.; Dobrzhinetskaya, L.; Harte, B.; Schreiber, A.; Green, H.W. High-Fe (Mg, Fe)O inclusion in diamond apparently from the lowermost mantle. Earth Planet. Sci. Lett. 2014, 404, 365–375. [Google Scholar] [CrossRef]
  48. Kaminsky, F.V.; Lin, J.-F. Iron partitioning in natural lower-mantle minerals: Toward a chemically heterogeneous lower mantle. Am. Mineral. 2017, 102, 824–832. [Google Scholar] [CrossRef]
  49. Anzolini, C.; Nestola, F.; Mazzucchelli, M.L.; Alvaro, M.; Nimis, P.; Gianese, A.; Morganti, S.; Marone, F.; Campione, M.; Hutchison, M.T.; et al. Depth of diamond formation obtained from single periclase inclusions. Geology 2019, 47, 219–222. [Google Scholar] [CrossRef]
  50. Boffa Ballaran, T.; Uenver-Thiele, L.; Woodland, A.B. Complete substitution of Fe2+ by Mg in Fe4O5: The crystal structure of the Mg2Fe2O5 end-member. Am. Mineral. 2015, 100, 628–632. [Google Scholar] [CrossRef]
  51. Ishii, T.; Uenver-Thiele, L.; Woodland, A.B.; Alig, E.; Ballaran, T.B. Synthesis and crystal structure of Mg-bearing Fe9O11: New insight in the complexity of Fe-Mg oxides at conditions of the deep upper mantle. Am. Mineral. 2018, 103, 1873–1876. [Google Scholar]
  52. Kantor, I.; Dubrovinsky, L.; McCammon, C.; Kantor, A.; Pascarelli, S.; Aquilanti, G.; Crichton, W.; Mattesini, M.; Ahuja, R.; Almeida, J.; et al. Pressure-induced phase transition in Mg0.8Fe0.2O ferropericlase. Phys. Chem. Miner. 2006, 33, 35–44. [Google Scholar] [CrossRef]
  53. Dubrovinsky, L.; Dubrovinskaia, N.; Kantor, I.; McCammon, C.; Crichton, W.; Urusov, V. Decomposition of ferropericlase (Mg0.80Fe0.20)O at high pressures and temperatures. J. Alloys Compd. 2005, 390, 41–45. [Google Scholar] [CrossRef]
  54. Sinmyo, R.; Hirose, K. The Soret diffusion in laser-heated diamond-anvil cell. Phys. Earth Planet. Inter. 2010, 180, 172–178. [Google Scholar] [CrossRef]
  55. Fu, S.; Yang, J.; Zhang, Y.; Liu, J.; Greenberg, E.; Prakapenka, V.B.; Okuchi, T.; Lin, J.-F. Melting behavior of the lower-mantle ferropericlase across the spin crossover: Implication for the ultra-low velocity zones at the lowermost mantle. Earth Planet. Sci. Lett. 2018, 503, 1–9. [Google Scholar] [CrossRef]
  56. Lin, J.-F.; Vanko, G.; Jacobsen, S.D.; Iota, V.; Struzhkin, V.V.; Prakapenka, V.B.; Kuznetsov, A.; Yoo, C.-S. Spin Transition Zone in Earth’s Lower Mantle. Science 2007, 317, 1740–1743. [Google Scholar] [CrossRef] [PubMed] [Green Version]
  57. Zhang, R.Y.; Liou, J.G. Exsolution Lamellae in Minerals from Ultrahigh-Pressure Rocks. Int. Geol. Rev. 1999, 41, 981–993. [Google Scholar] [CrossRef]
  58. Pakhomova, A.S.; Danisi, R.M.; Armbruster, T.; Lazic, B.; Gfeller, F.; Krivovichev, S.V.; Yakovenchuk, V.N. High-temperature induced dehydration, phase transition and exsolution in amicite: A single-crystal X-ray study. Microporous Mesoporous Mater. 2013, 182, 207–219. [Google Scholar] [CrossRef]
  59. Martirosyan, N.S.; Litasov, K.D.; Lobanov, S.S.; Goncharov, A.F.; Shatskiy, A.; Ohfuji, H.; Prakapenka, V. The Mg-carbonate–Fe interaction: Implication for the fate of subducted carbonates and formation of diamond in the lower mantle. Geosci. Front. 2019, 10, 1449–1458. [Google Scholar] [CrossRef]
  60. Kaminsky, F.V.; Wirth, R.; Schreiber, A. A microinclusion of lower-mantle rock and other minerals and nitrogen lower-mantle inclusions in a diamond. Can. Mineral. 2015, 53, 83–104. [Google Scholar] [CrossRef]
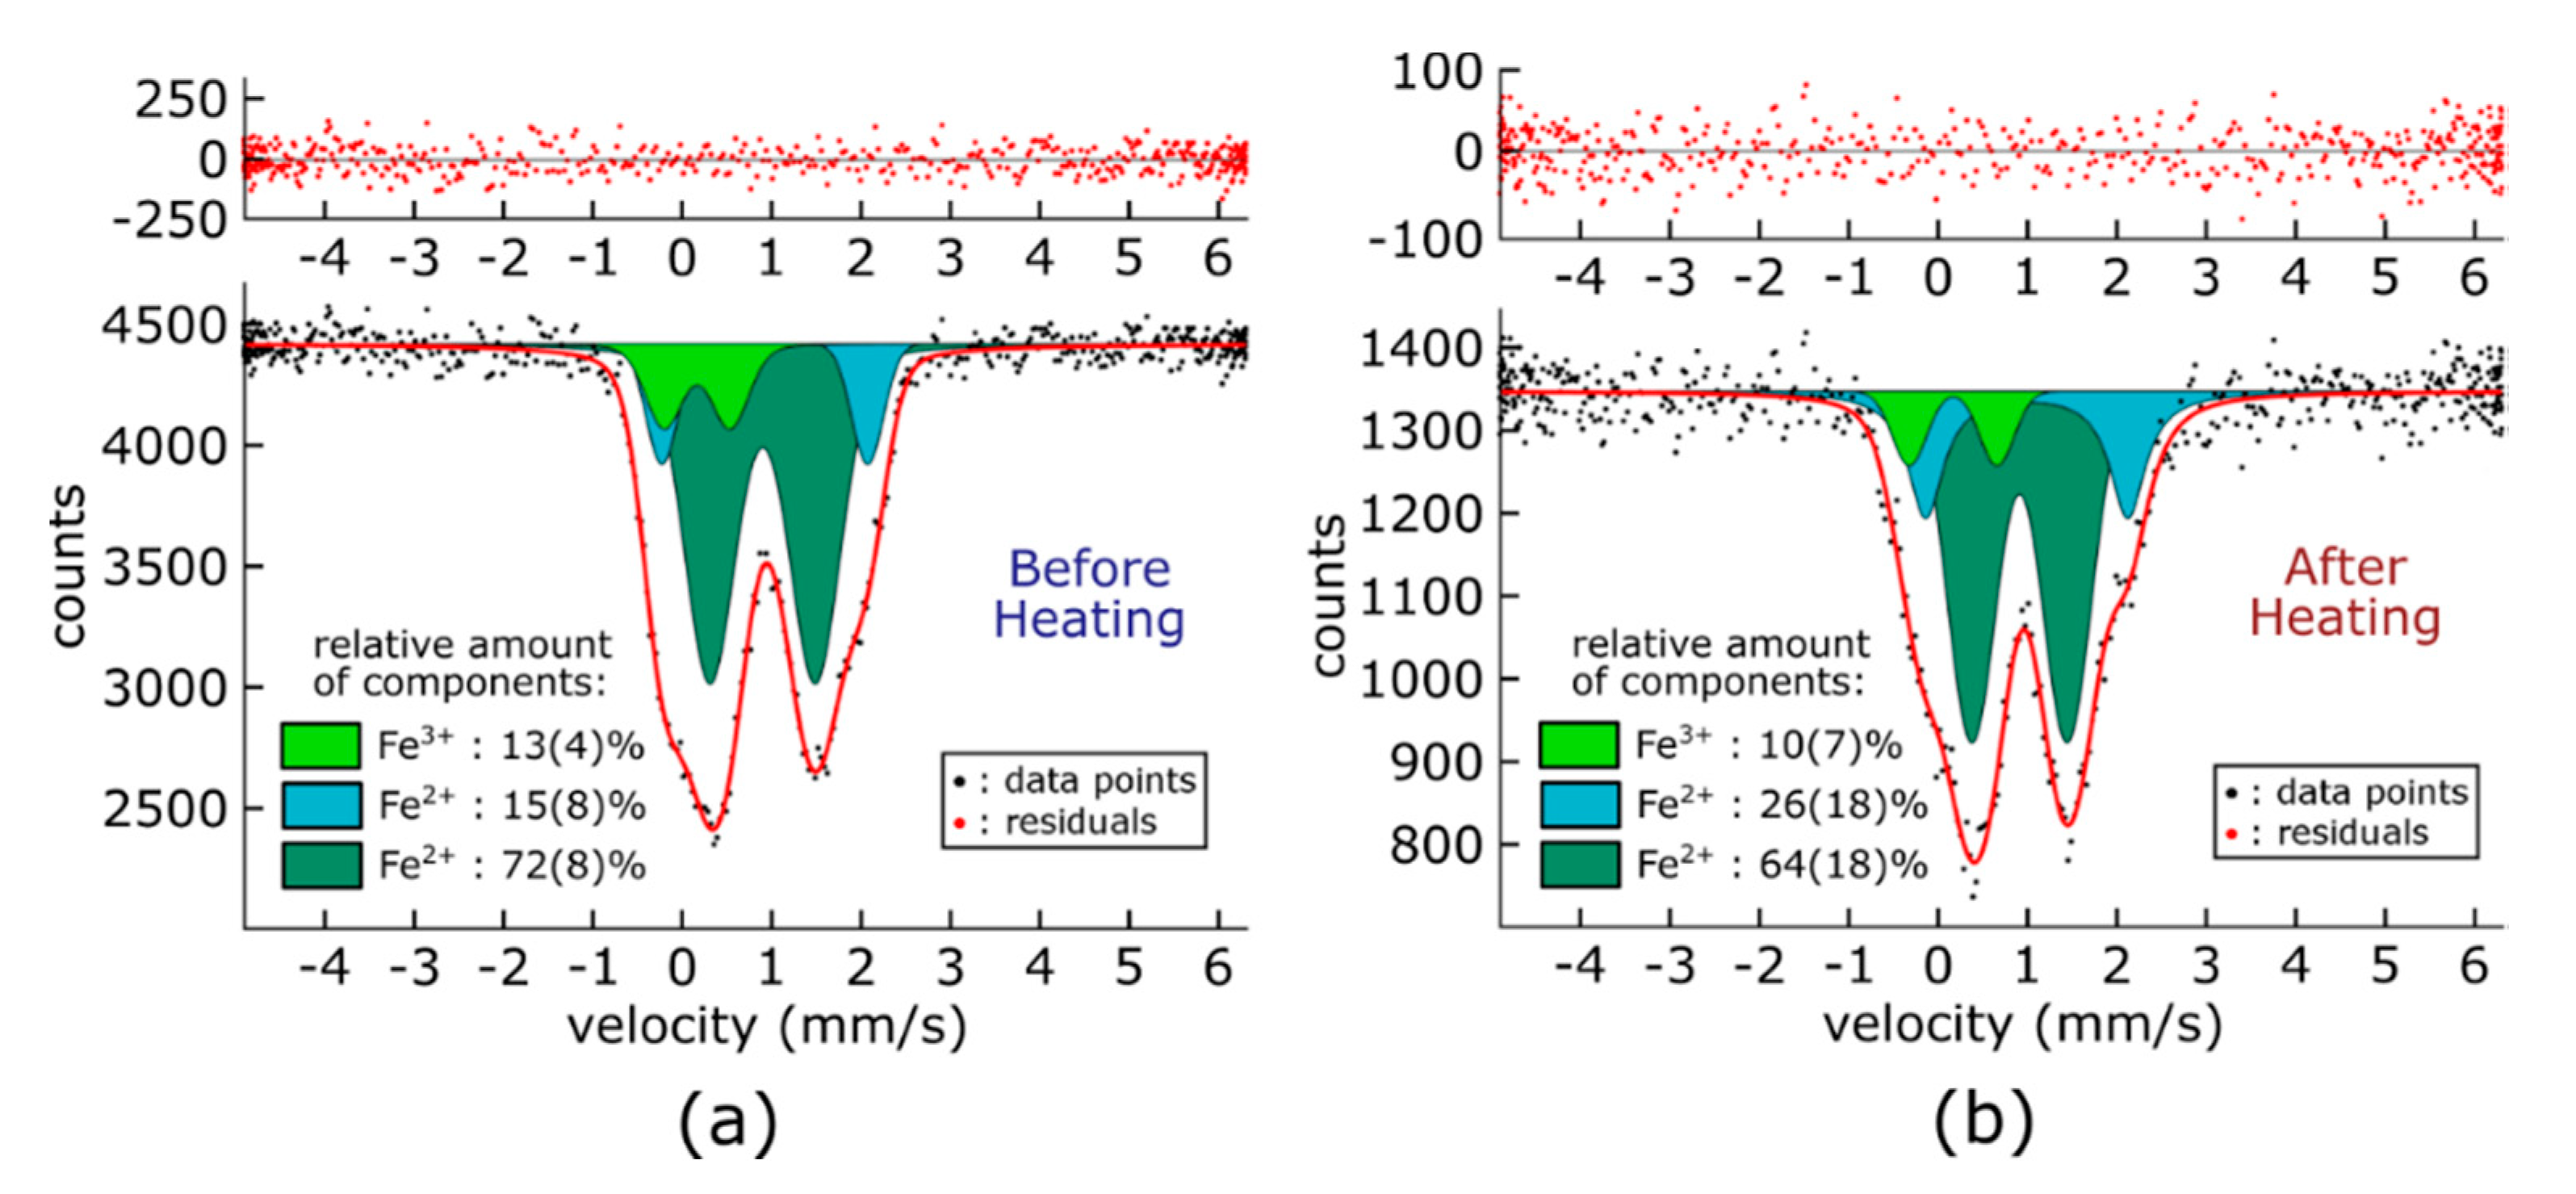
Figure 1. Fitted Synchrotron Mössbauer Source (SMS) spectra of ferropericlase at ambient pressure, after synthesis. The red solid lines show the theoretical fit of the data points (black dots) and the residuals are indicated above the spectra (red dots). Dark green and cyan doublets correspond to Fe2+ components and the light green singlet corresponds to the Fe3+ component. The fitting parameters are presented in detail in Table 1.
Minerals 10 00542 g001
Figure 2. Representative powder diffraction patterns of crystals C01, C02 and C03 of Experiment 1 at 30 GPa, after being laser-heated correspondingly by CW, short (3 µs), and long (500 µs) pulses. Diamond reflections have been masked. Reflections (331), (400), (331) and (420) of ferropericlase (highlighted) are visibly broadened or split; asterisks mark the most prominent reflections of hp-(Mg,Fe)3O4 phase formed after laser heating.
Minerals 10 00542 g002
Figure 3. Coordination polyhedra of FeMg1 (a) and FeMg2 (b) crystallographic sites in the crystal structure of (Fe1.82,Mg1.18)O4. The bond distances are given in angstroms. The crystal structure of (Fe1.82,Mg1.18)O4 (c) is built of trigonal prisms and octahedra (Fe,Mg)O6. Trigonal prisms share trigonal faces, while the octahedra connect through common edges. Oxygen atoms are shown as red spheres.
Minerals 10 00542 g003
Figure 4. Normalized SMS spectra collected from each ferropericlase crystal, before and after heating at 30 GPa (Experiment 1). Blue circles correspond to absorption spectra collected before heating and red triangles correspond to absorption spectra collected from the quenched samples. Solid lines are guides for the eye. The spectra are normalized from 0 to 1 that correspond to the lowest count point (i.e., maximum absorption) and the average of the baseline, respectively.
Minerals 10 00542 g004
Figure 5. Fitted SMS spectra of ferropericlase crystal (C03 of Experiment 1), (a) before heating and (b) after being heated continuously at 30 GPa. The red solid lines show the theoretical fit of the data points (black dots) and the residuals are indicated above the spectra (red dots). Dark green and cyan doublets correspond to Fe2+ components and light green doublet corresponds to the Fe3+ component. The fitting parameters are presented in detail in Table 1.
Minerals 10 00542 g005
Figure 6. Optical microscope images of two crystals of (Mg,Fe)O (named C04, C05) at 53.5(5) GPa, before (a) and after (b) pulsed laser heating and X-ray diffraction maps of the quenched products at the locations of C04 (c) and C05 (d) crystals. The approximate heated areas are depicted as red dashed circles in (a). The areas of diffraction mapping are shown as green rectangles in (b), for crystals C04 and C05, respectively. The color intensity is proportional to the intensity of the corresponding reflections used for mapping. Diffraction lines and color coding are as follows: for crystal C04 (c)—the (211) reflection of Re for the gray region, the (111) reflection of Ne for the light green region, the (220) reflection of ferropericlase (Fp) for the blue region, the sum of (006) and (023) reflections of the hp-(Mg,Fe)3O4 (Cmcm) for the orange region; for crystal C05 (d)—the sum of the (111) and (200) reflections of Ne for the pink region, the sum of (200) and (220) reflections of ferropericlase (Fp) for the blue region, the (023) reflection of the hp-(Mg,Fe)3O4 (Cmcm) for the dark green region. Representative powder diffraction patterns of each region are presented in Figures S1 and S2.
Minerals 10 00542 g006
Figure 7. Splitting of Bragg reflections of ferropericlase after pulse laser heating of C04 crystal in Experiment 2 (53.5 GPa). (a) X-ray diffraction map of the crystal showing the relative intensity of the (220) reflection of ferropericlase at the selected positions at the edge (“A”) and close to the center (“B”) of the heated area; (b) and (c) show 2D diffraction patterns for positions A and B respectively, with selected reflections magnified (yellow rectangles). Diamond reflections and inactive areas of the detector (including edges) are masked (red areas). The rest are ferropericlase peaks marked by blue rectangles. Continuous diffraction rings are due to Ne. (d) and (e) Integrated diffraction profiles of Bragg (600) reflection (marked by blue asterisk on (b)) of ferropericlase at positions A and B of the crystal respectively. Representative powder diffraction patterns of positions A and B are presented in Figure S3.
Minerals 10 00542 g007
Table 1. Fitted parameters of center shift (CS) and quadrupole splitting (QS) of ferropericlase crystal C03 of Experiment 1 at 30 GPa, before heating and after being heated continuously.
Fe2+
(Dark Green)
Fe2+
(Cyan)
Fe3+
(Light Green)
CS (mm/s)QS (mm/s)CS (mm/s)QS (mm/s)CS (mm/s)QS (mm/s)
Starting material0.94(1)1.27(49)0.94(1)2.48(12)0.01(29)-
After CW heating0.92(2)1.06(9)1.00(6)2.26(14)0.17(15)0.98(18)
Table 2. Details of laser heating on three different (Fe0.24Mg0.76)O crystals at 30.0(5) GPa.
CrystalHeating MethodHeating TimeTemperature (Upstream)Temperature (Downstream)
C01Pulsed, 1 kHz/500 μs25 min1800–2100 K1550–1650 K
C02Pulsed, 25 kHz/3 μs12 min1800–2100 K1650–1950 K
C03Continuous wave11 min1900–2300 K1700–1800 K
Table 3. Details of laser heating on two different (Fe0.24Mg0.76)O crystals at 53.5(5) GPa.
CrystalHeating MethodHeating TimeMaximum
Temperature (Side A)
Maximum
Temperature (Side B)
C04Pulsed, 2 kHz/250 μs30 s2800 K3100 K
C05Pulsed, 25 kHz/11 μs30 s3100 K3400 K
Table 4. Crystallographic data and refinement parameters for crystal C02 at 30.0(5) GPa.
Crystal Data
CompositionMg4.71Fe7.29O16
Space GroupCmcm
a, Å2.742(1)
b, Å9.170(4)
c, Å9.313(3)
Volume, Å3234.2(2)
Z1
Data Collection
Wavelength, Å 0.41107
Max. θ°20.68
Index Ranges−3 ≤ h ≤ 3
−12 ≤ k ≤ 9
−12 ≤ l ≤ 12
No. Meas. Refl.247
No. Unique Refl.135
No. Obs. Refl.
(I > 3σ(I))
107
No. of Variables14
Rint0.0575
Rσ0.0709
R1, I > 3σ(I)0.0766
R1, all data0.0915
wR2, I > 3σ(I)0.2018
wR2, all data0.2279
GooF1.134
Table 5. Bond distances and polyhedral parameters for hp-(Mg,Fe)3O4 at 30.0(5) GPa.
FeMg1O6 Trigonal PrismFeMg2O6 Octahedra
FeMg1-O12.004(11) Å x2FeMg2-O11.849(7) ÅFeMg1-FeMg12.7419(10) Å
FeMg1-O22.091(9) Å x4FeMg2-O21.933(7) Å x2FeMg1-FeMg22.822(5) Å
FeMg2-O31.9496(17) Å x2FeMg2-FeMg22.7419(10) Å
FeMg2-O21.981(12) ÅFeMg2-FeMg22.772(5) Å
FeMg2-FeMg22.901(4) Å
<FeMg1-O>2.06(1) Å<FeMg2-O>1.932(6) Å
Volume8.2718 Å3Volume9.5666 Å3

