Mineralogy and Geochemistry of the Kinnikinic Quartzite at the Arco Hills Silica and Gold Project in Butte County, Idaho: Results of an Ore Quality Spot Check and Implications for Potential Plasma Furnace Processing


Abstract
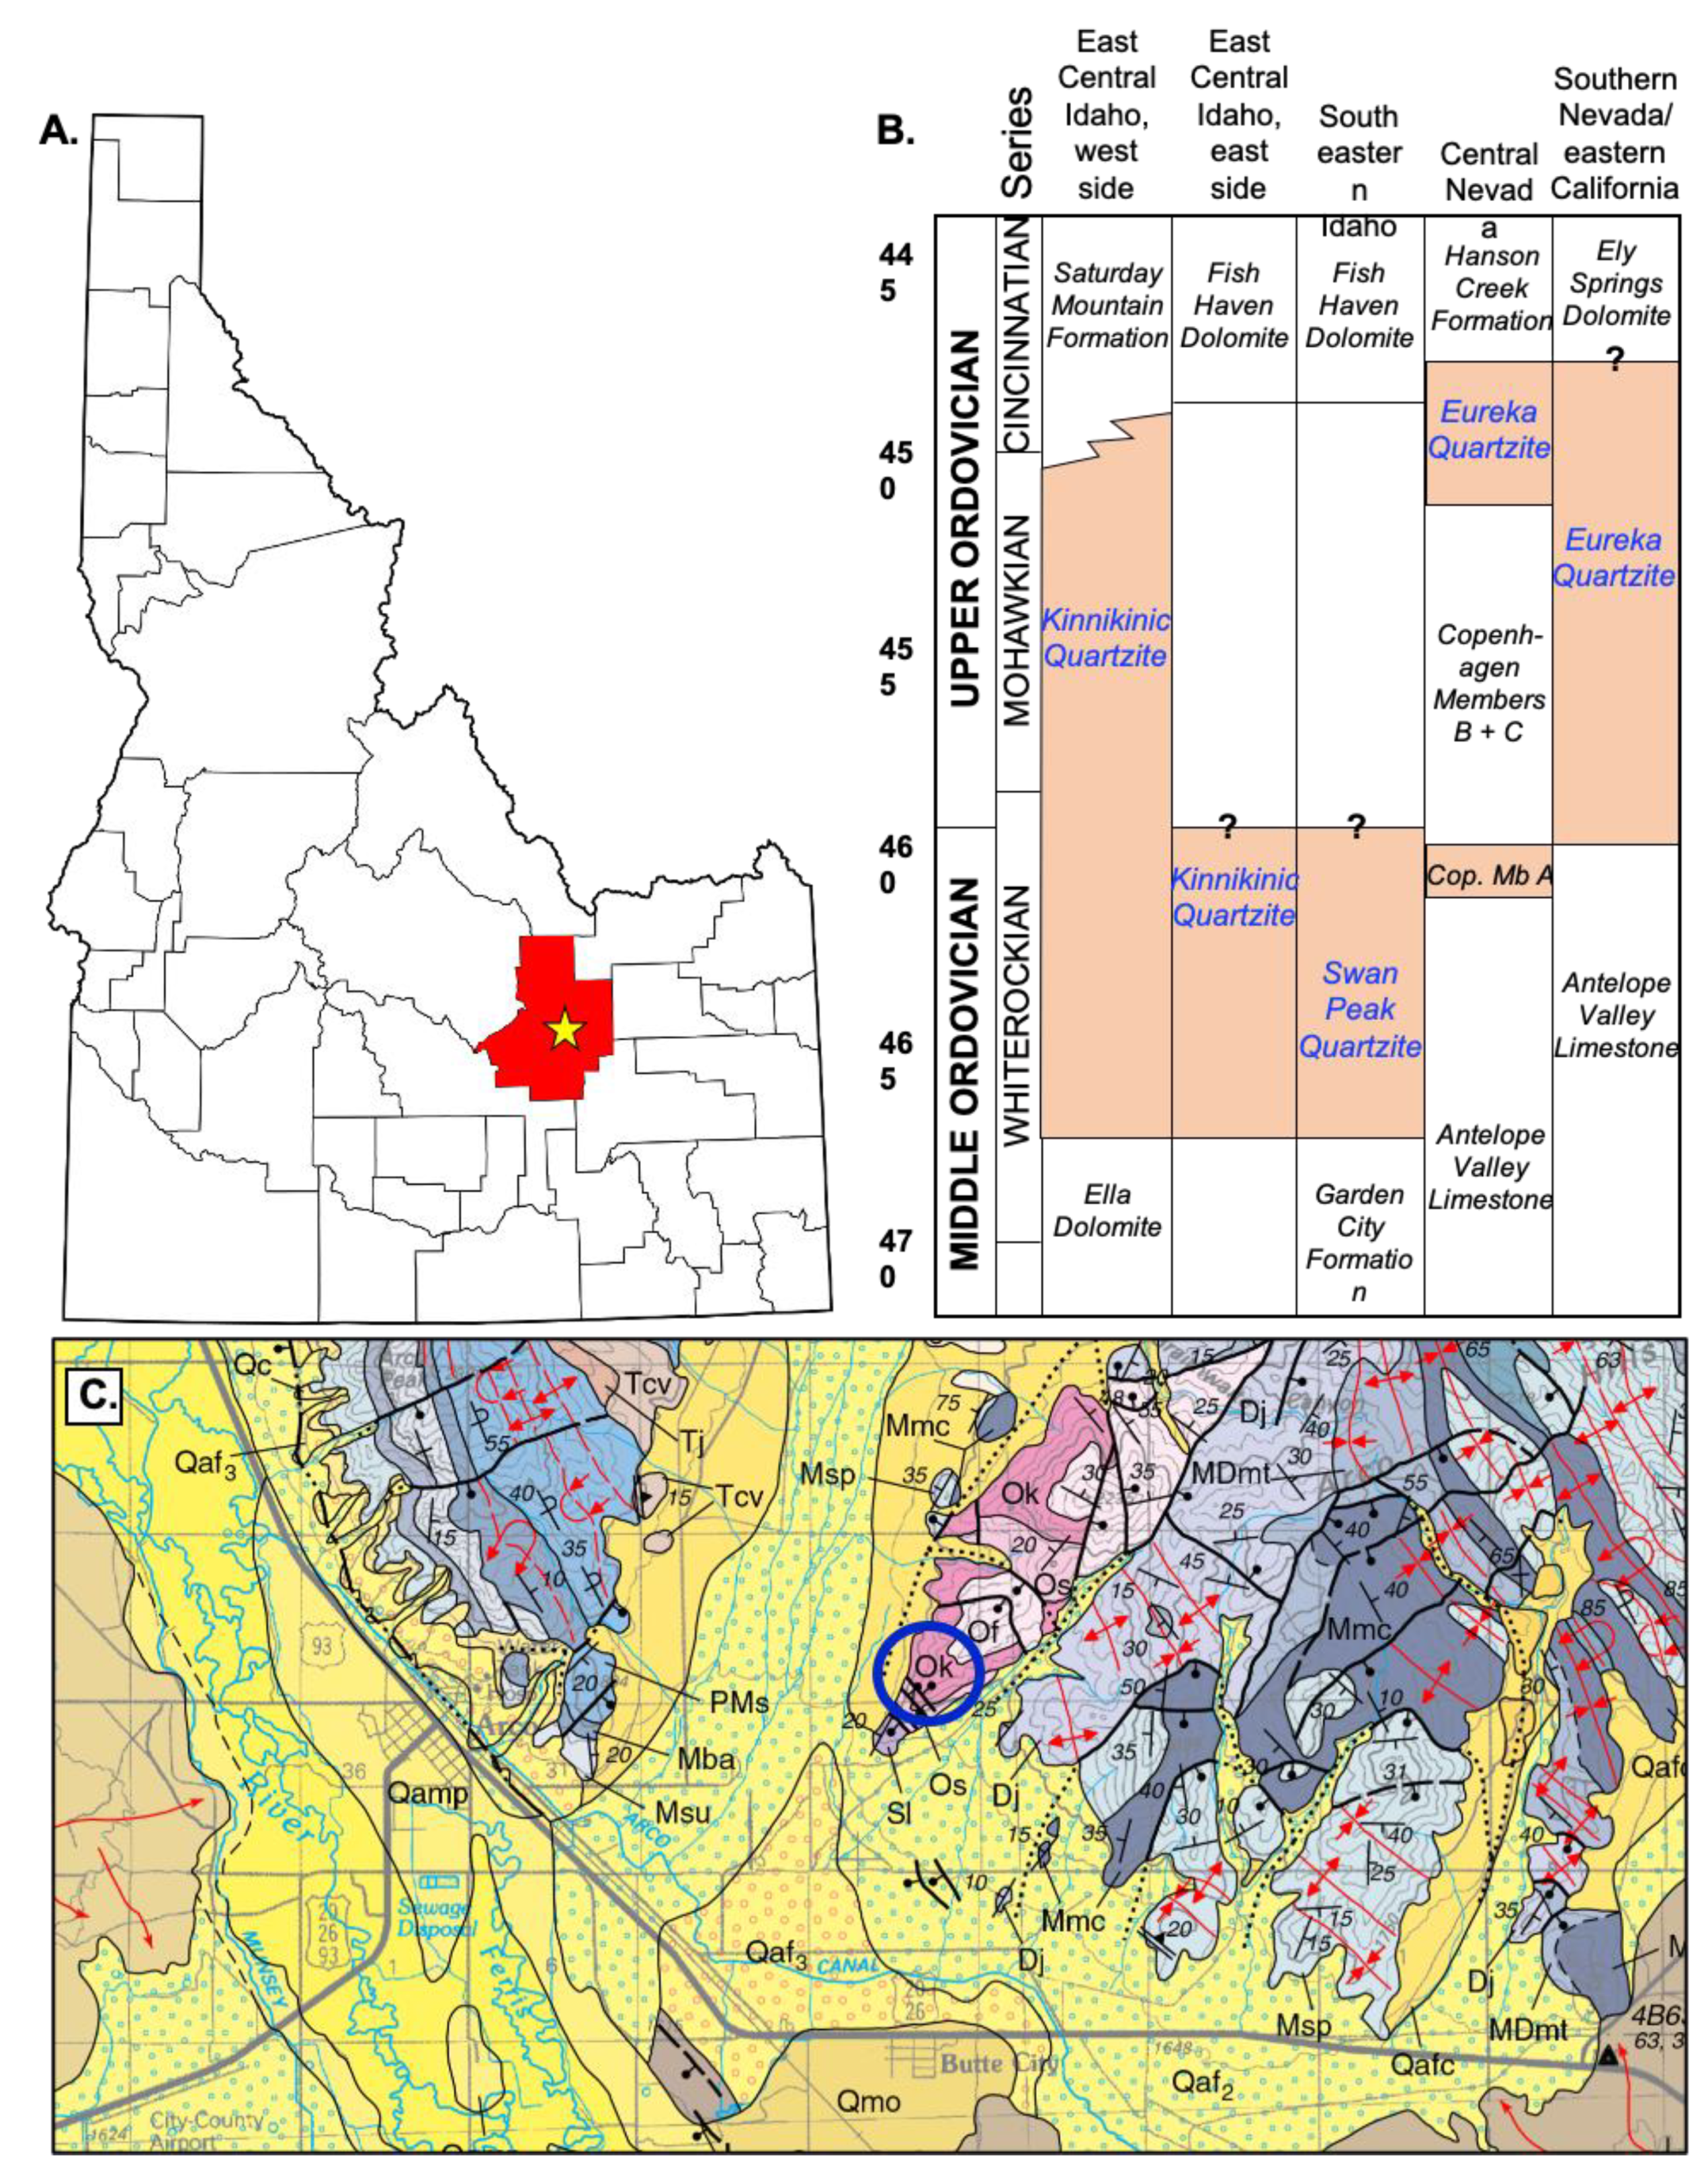
:1. Introduction
2. Methods
2.1. Samples and Preparation
2.2. Analytical Methods
3. Results
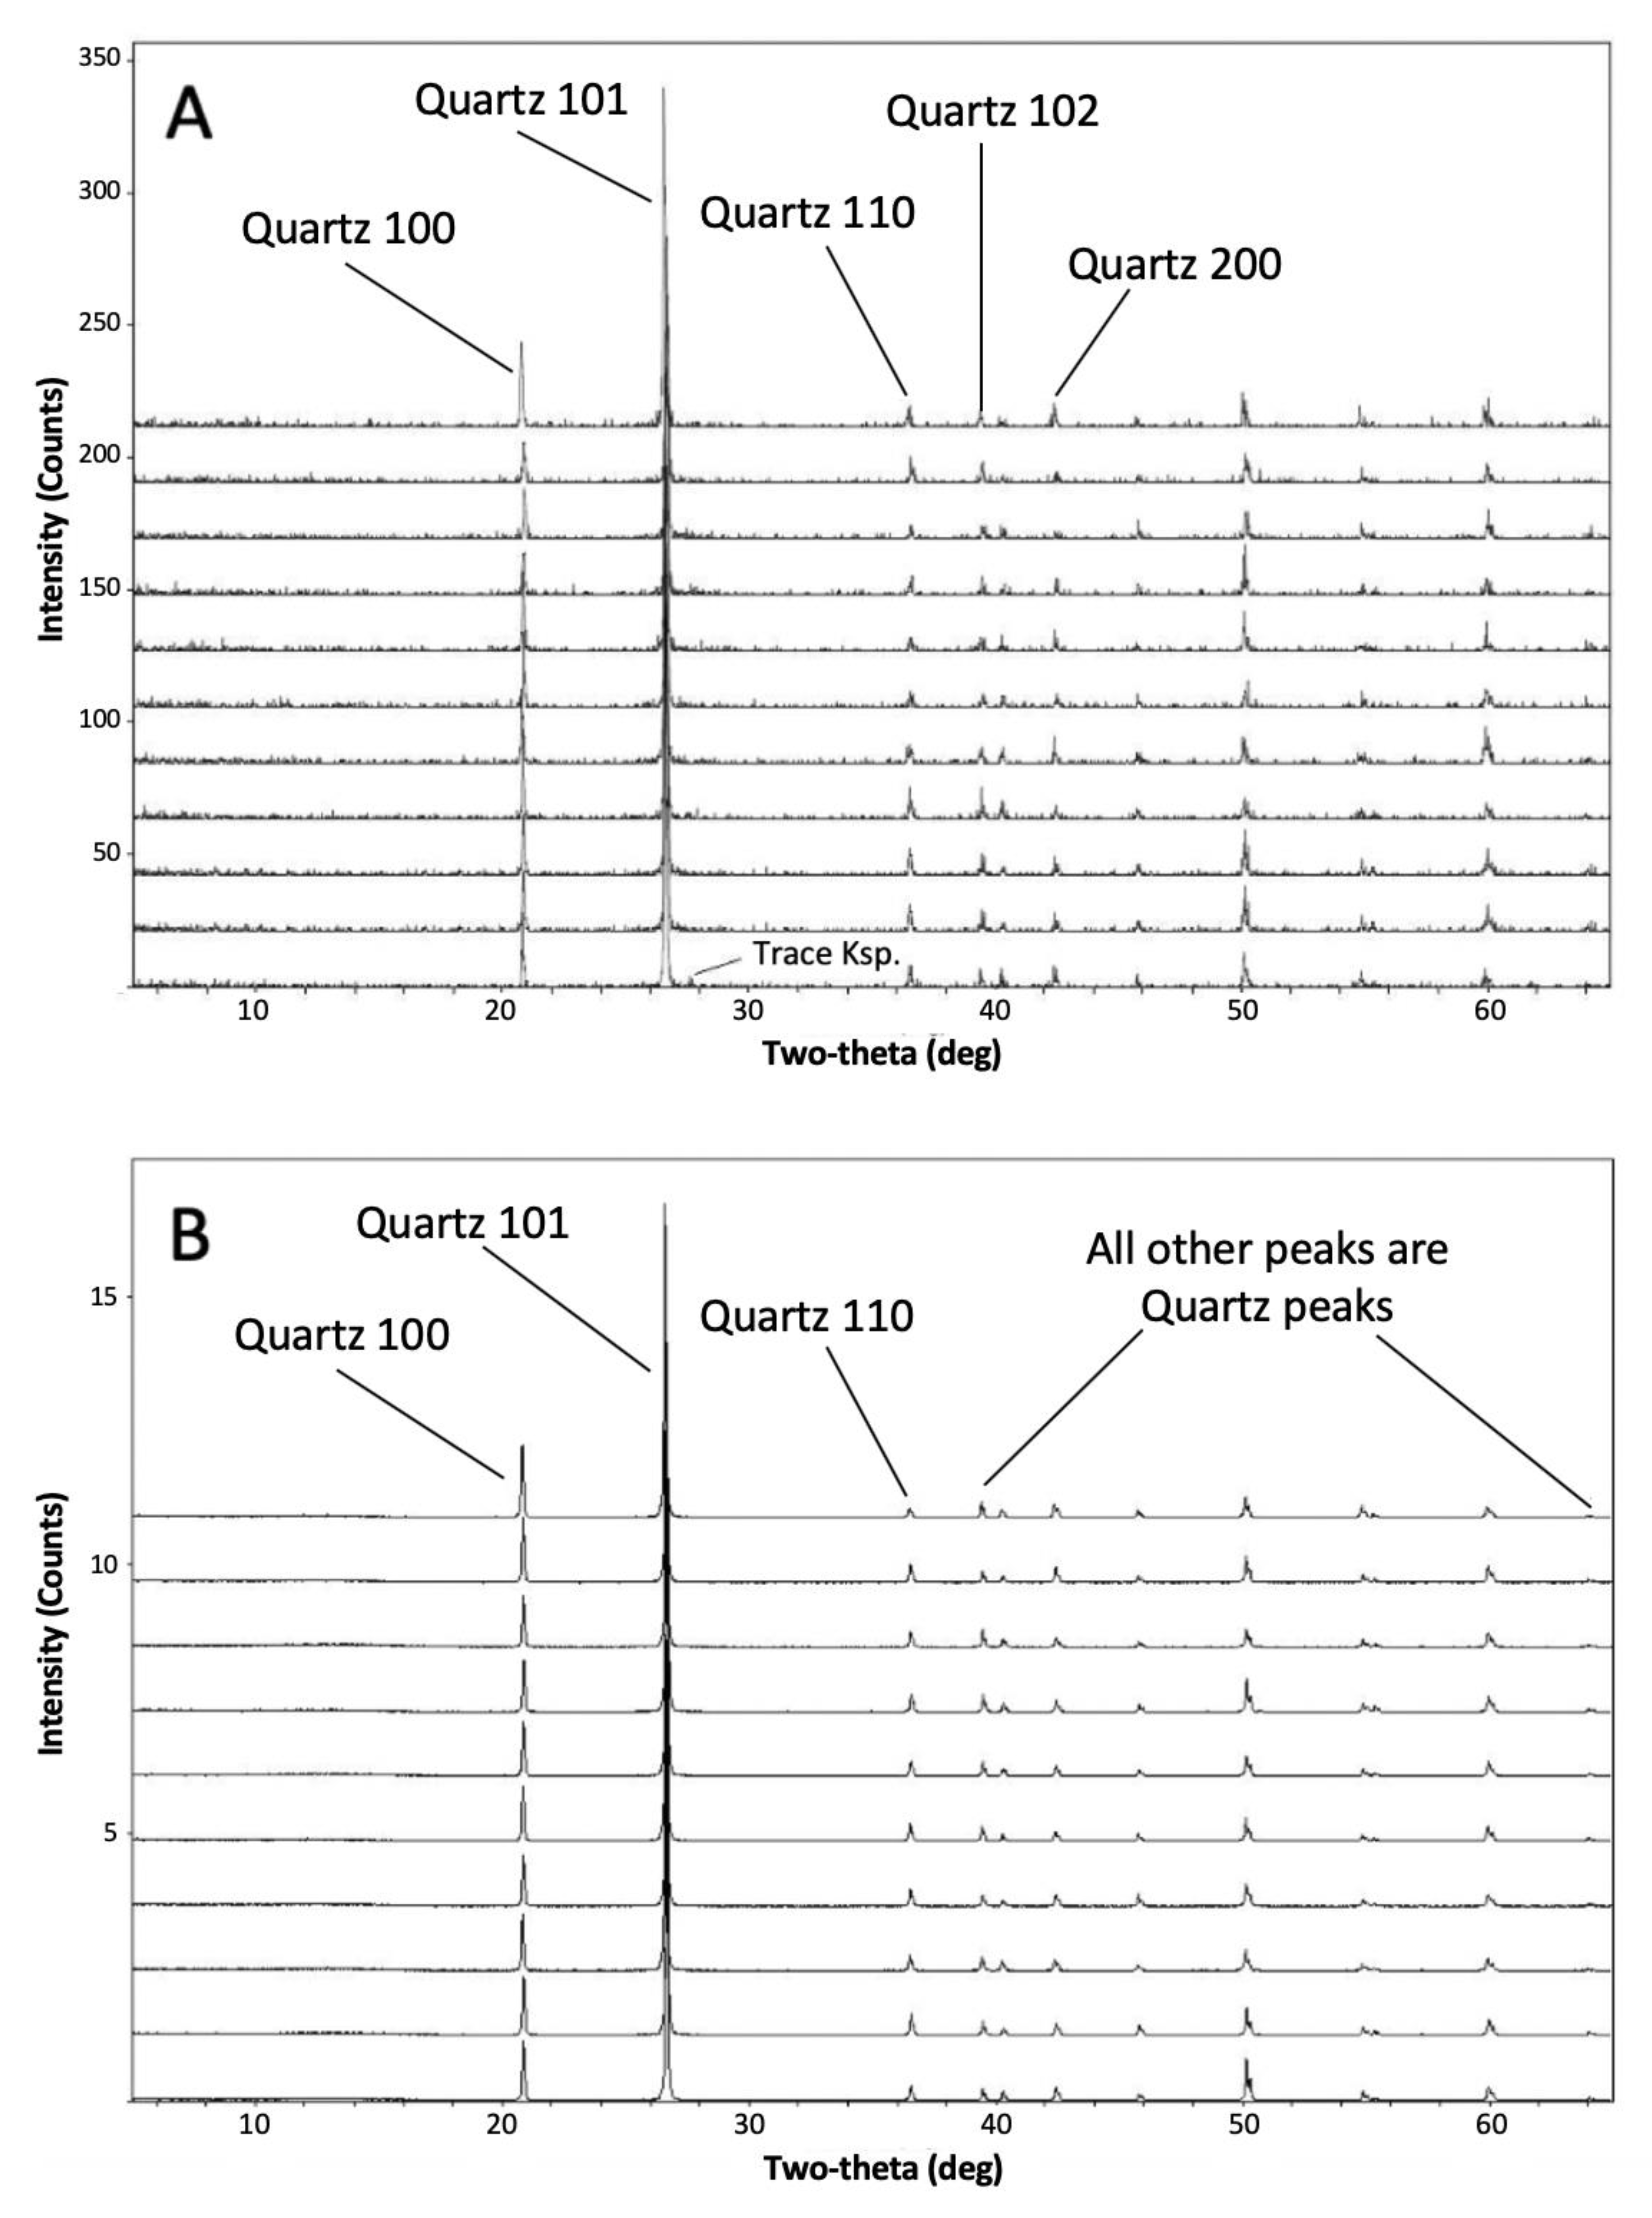
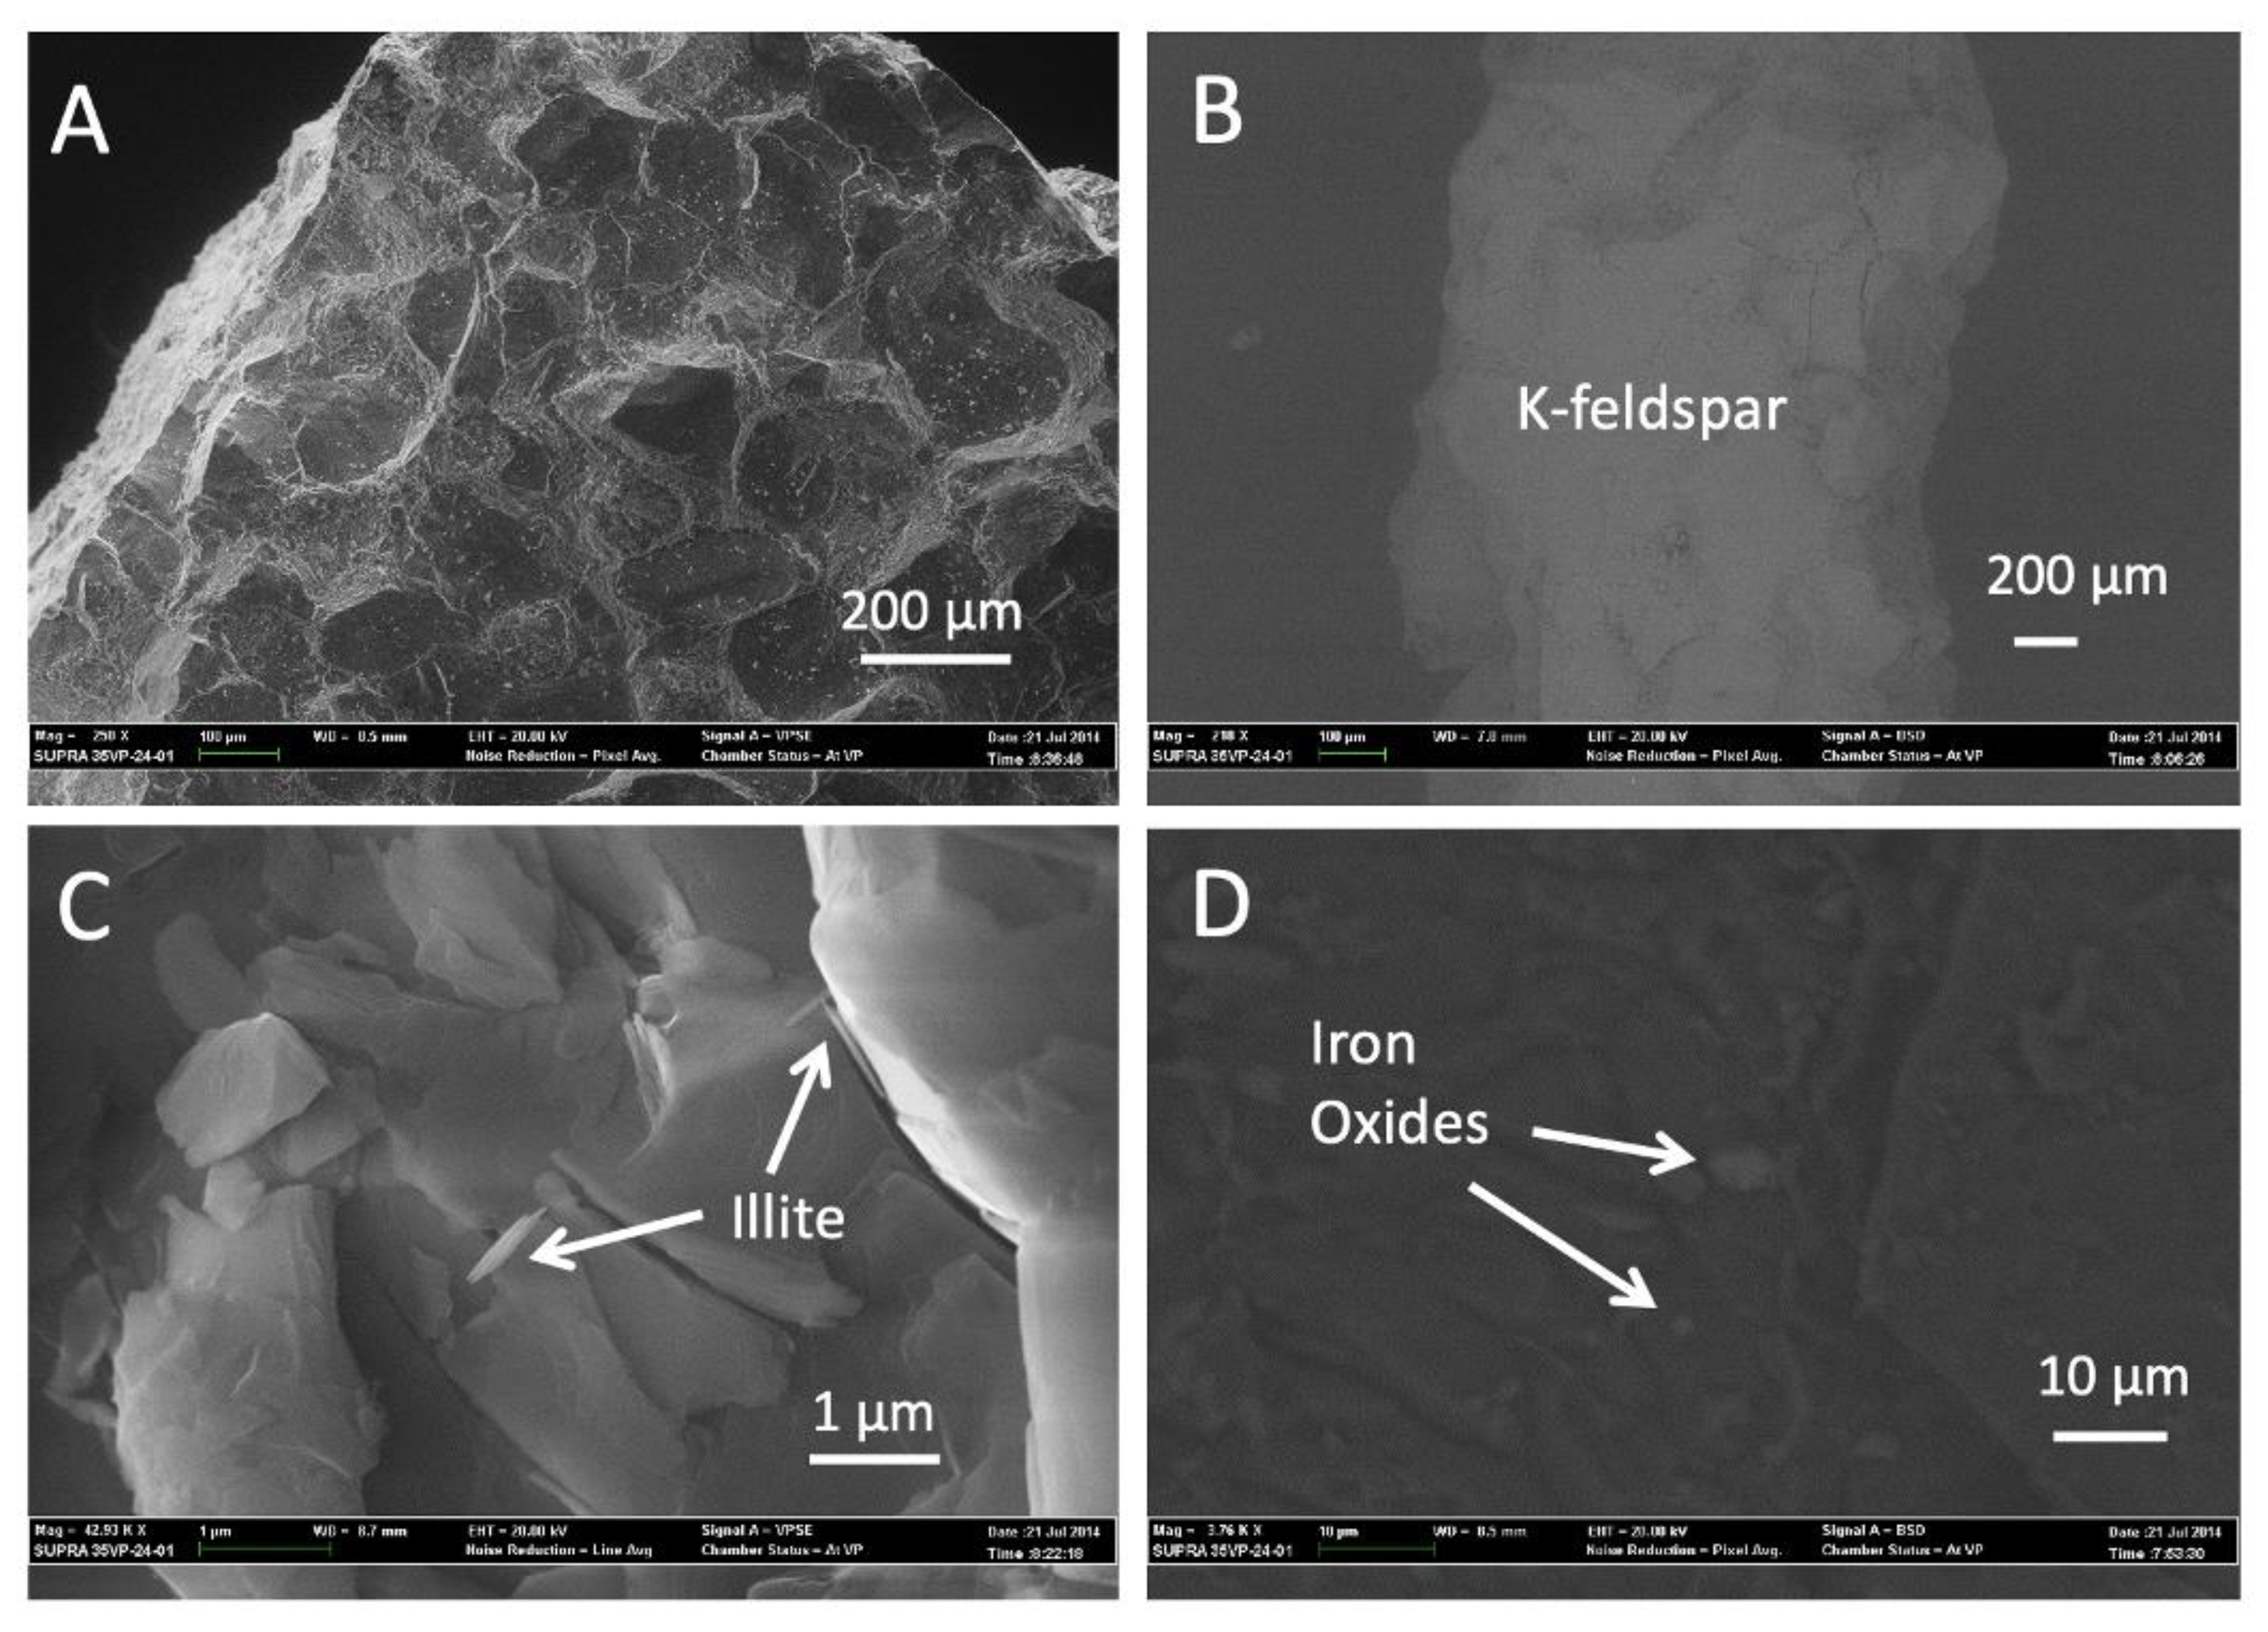
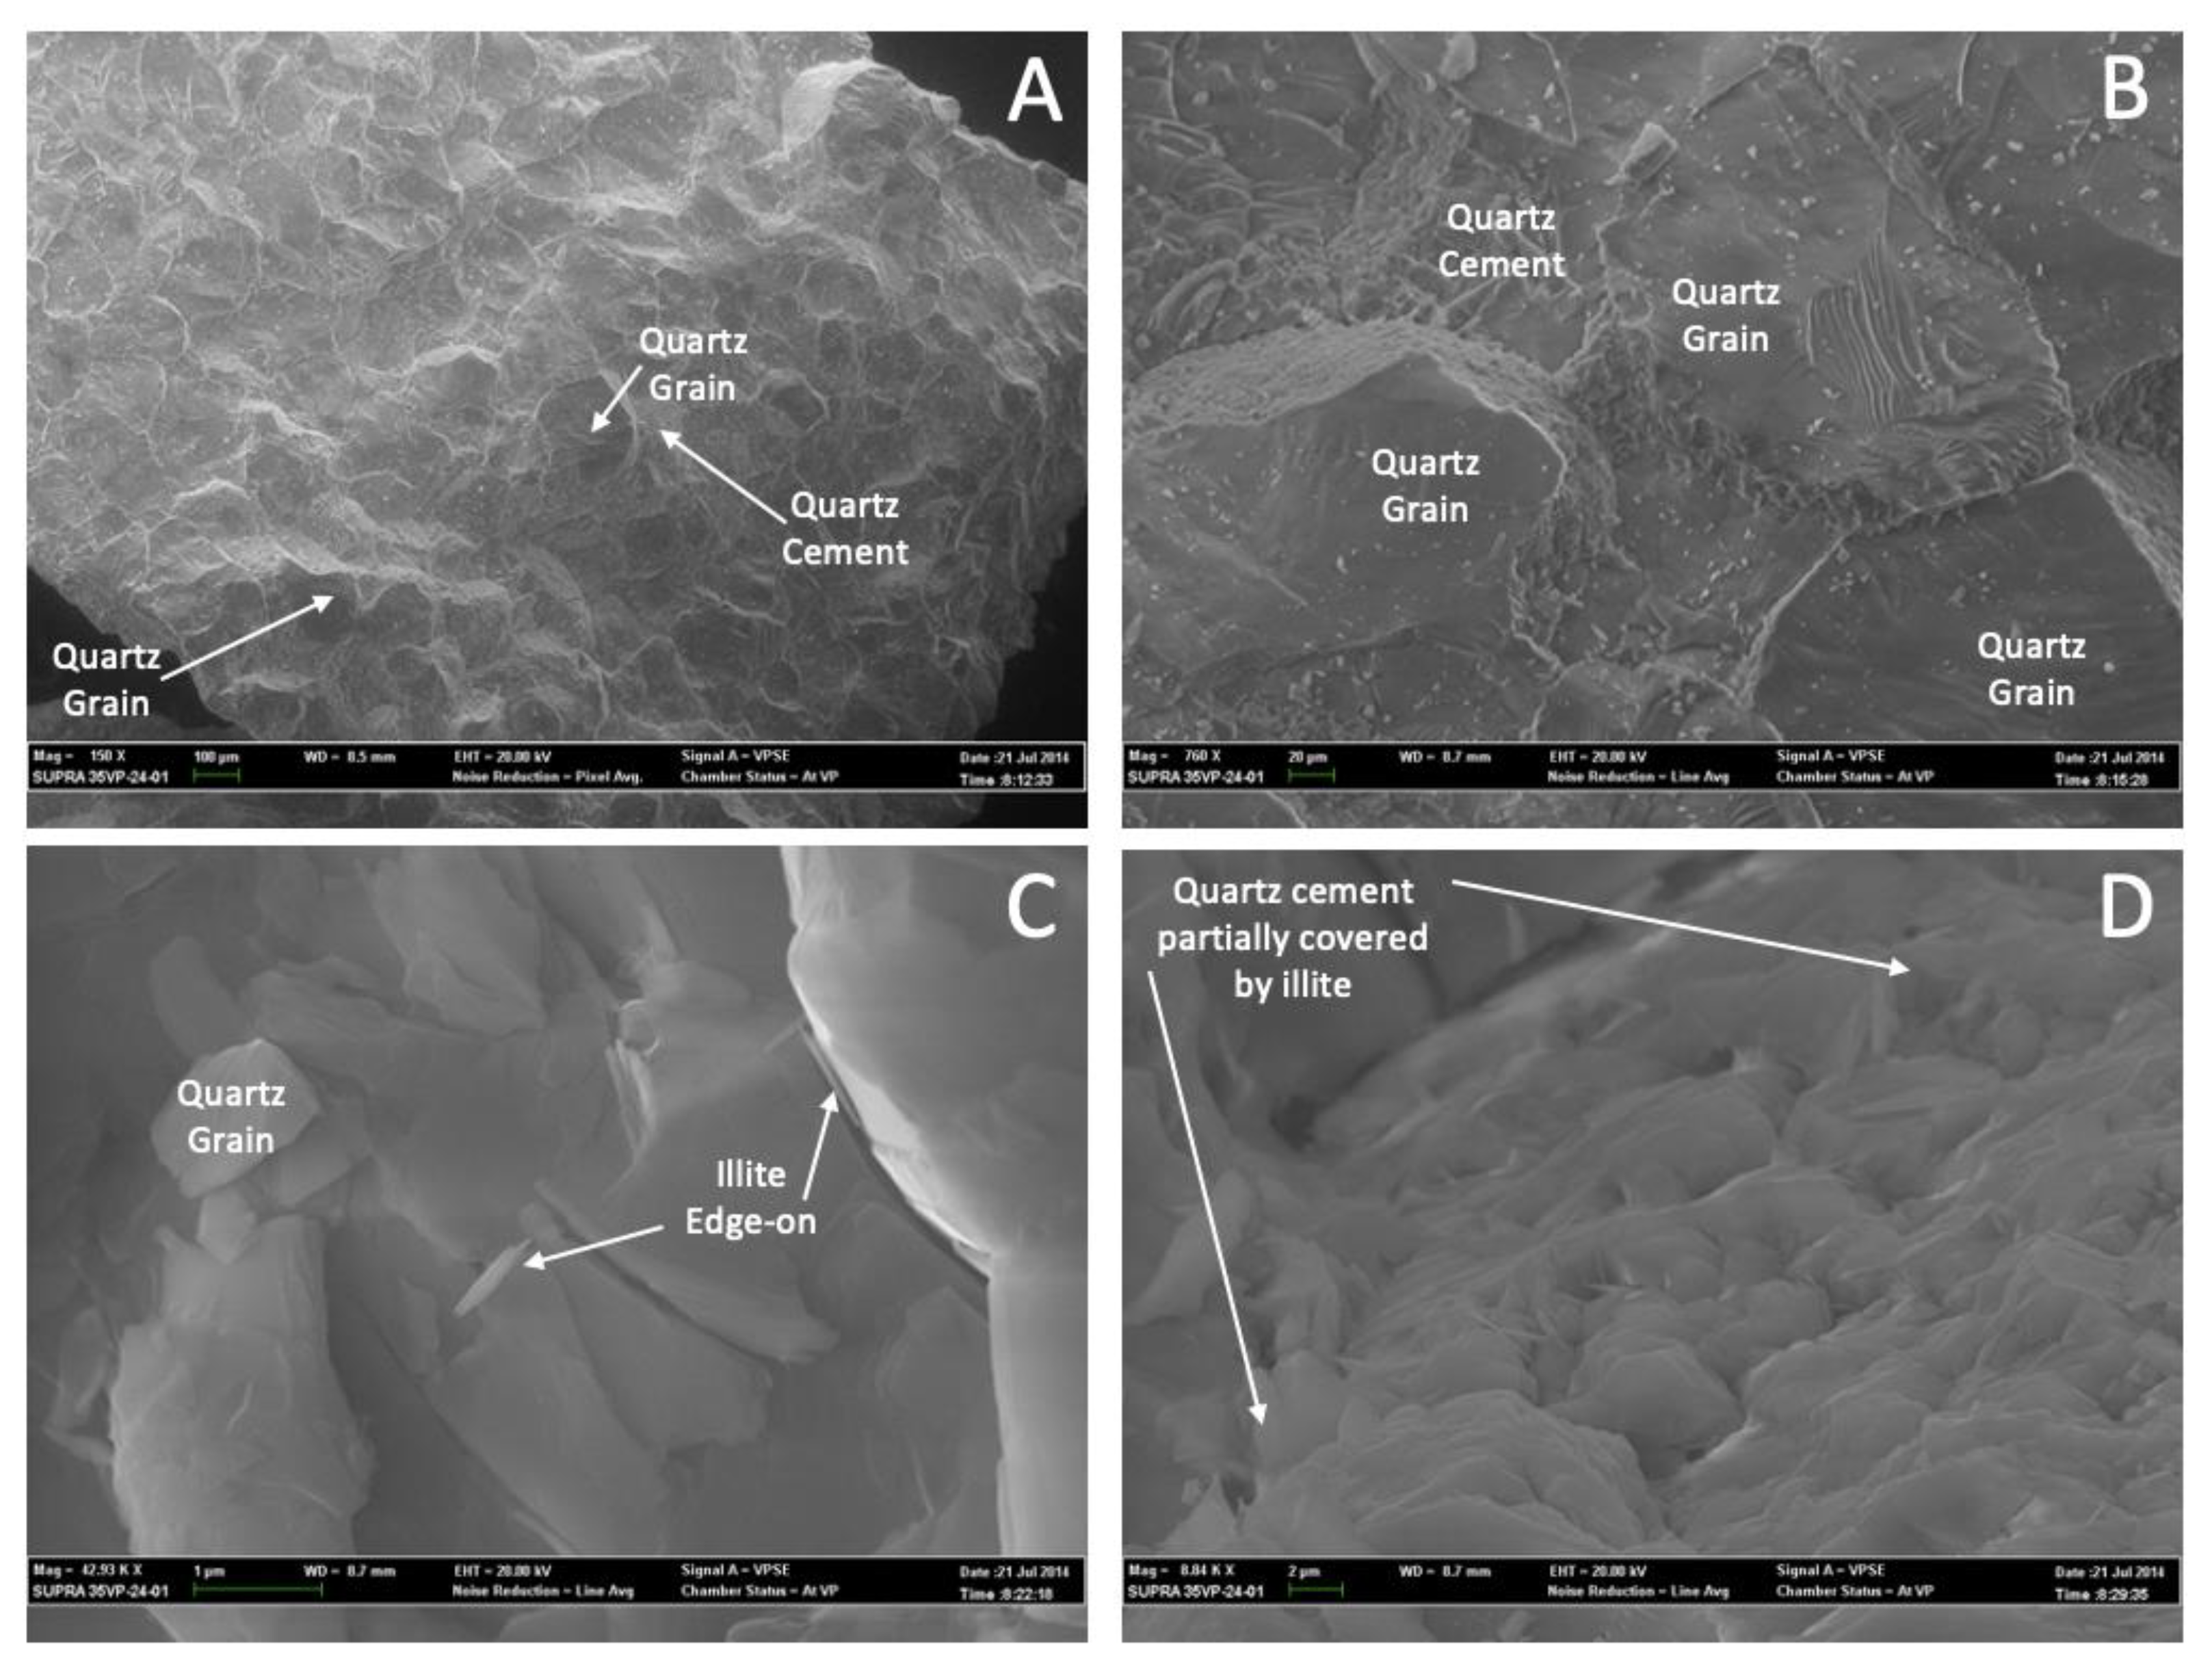
3.1. Mineralogical Results
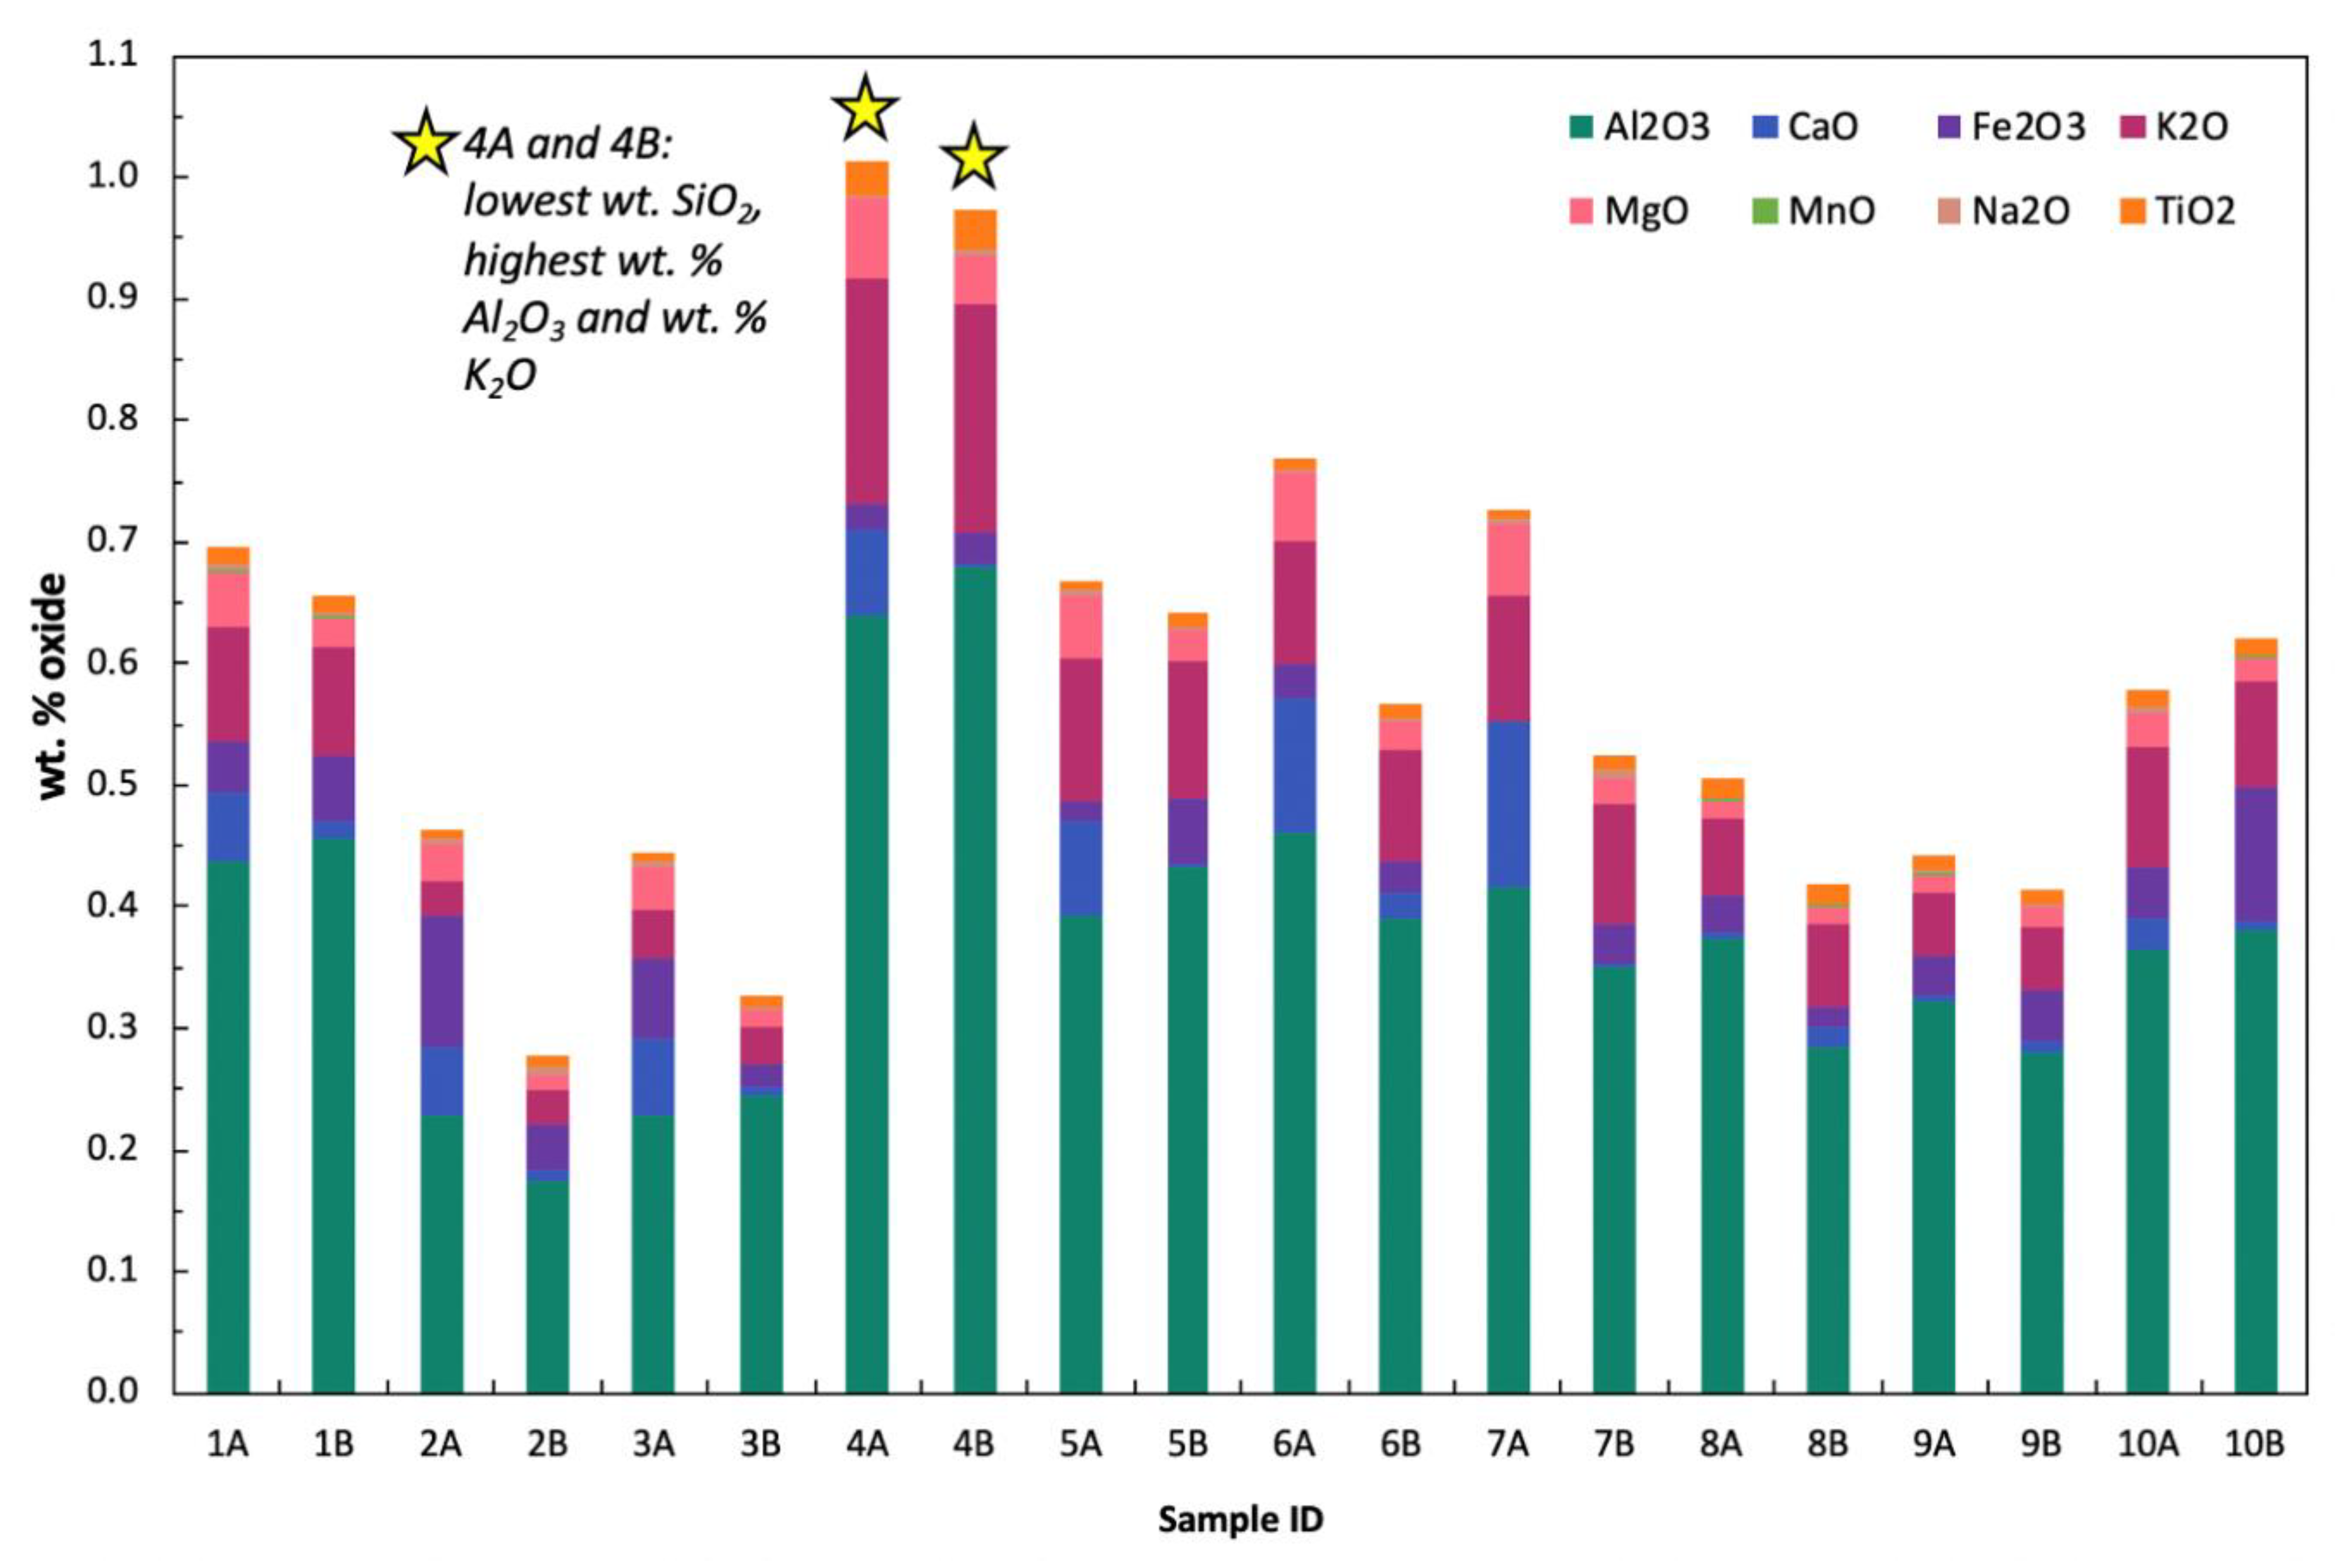
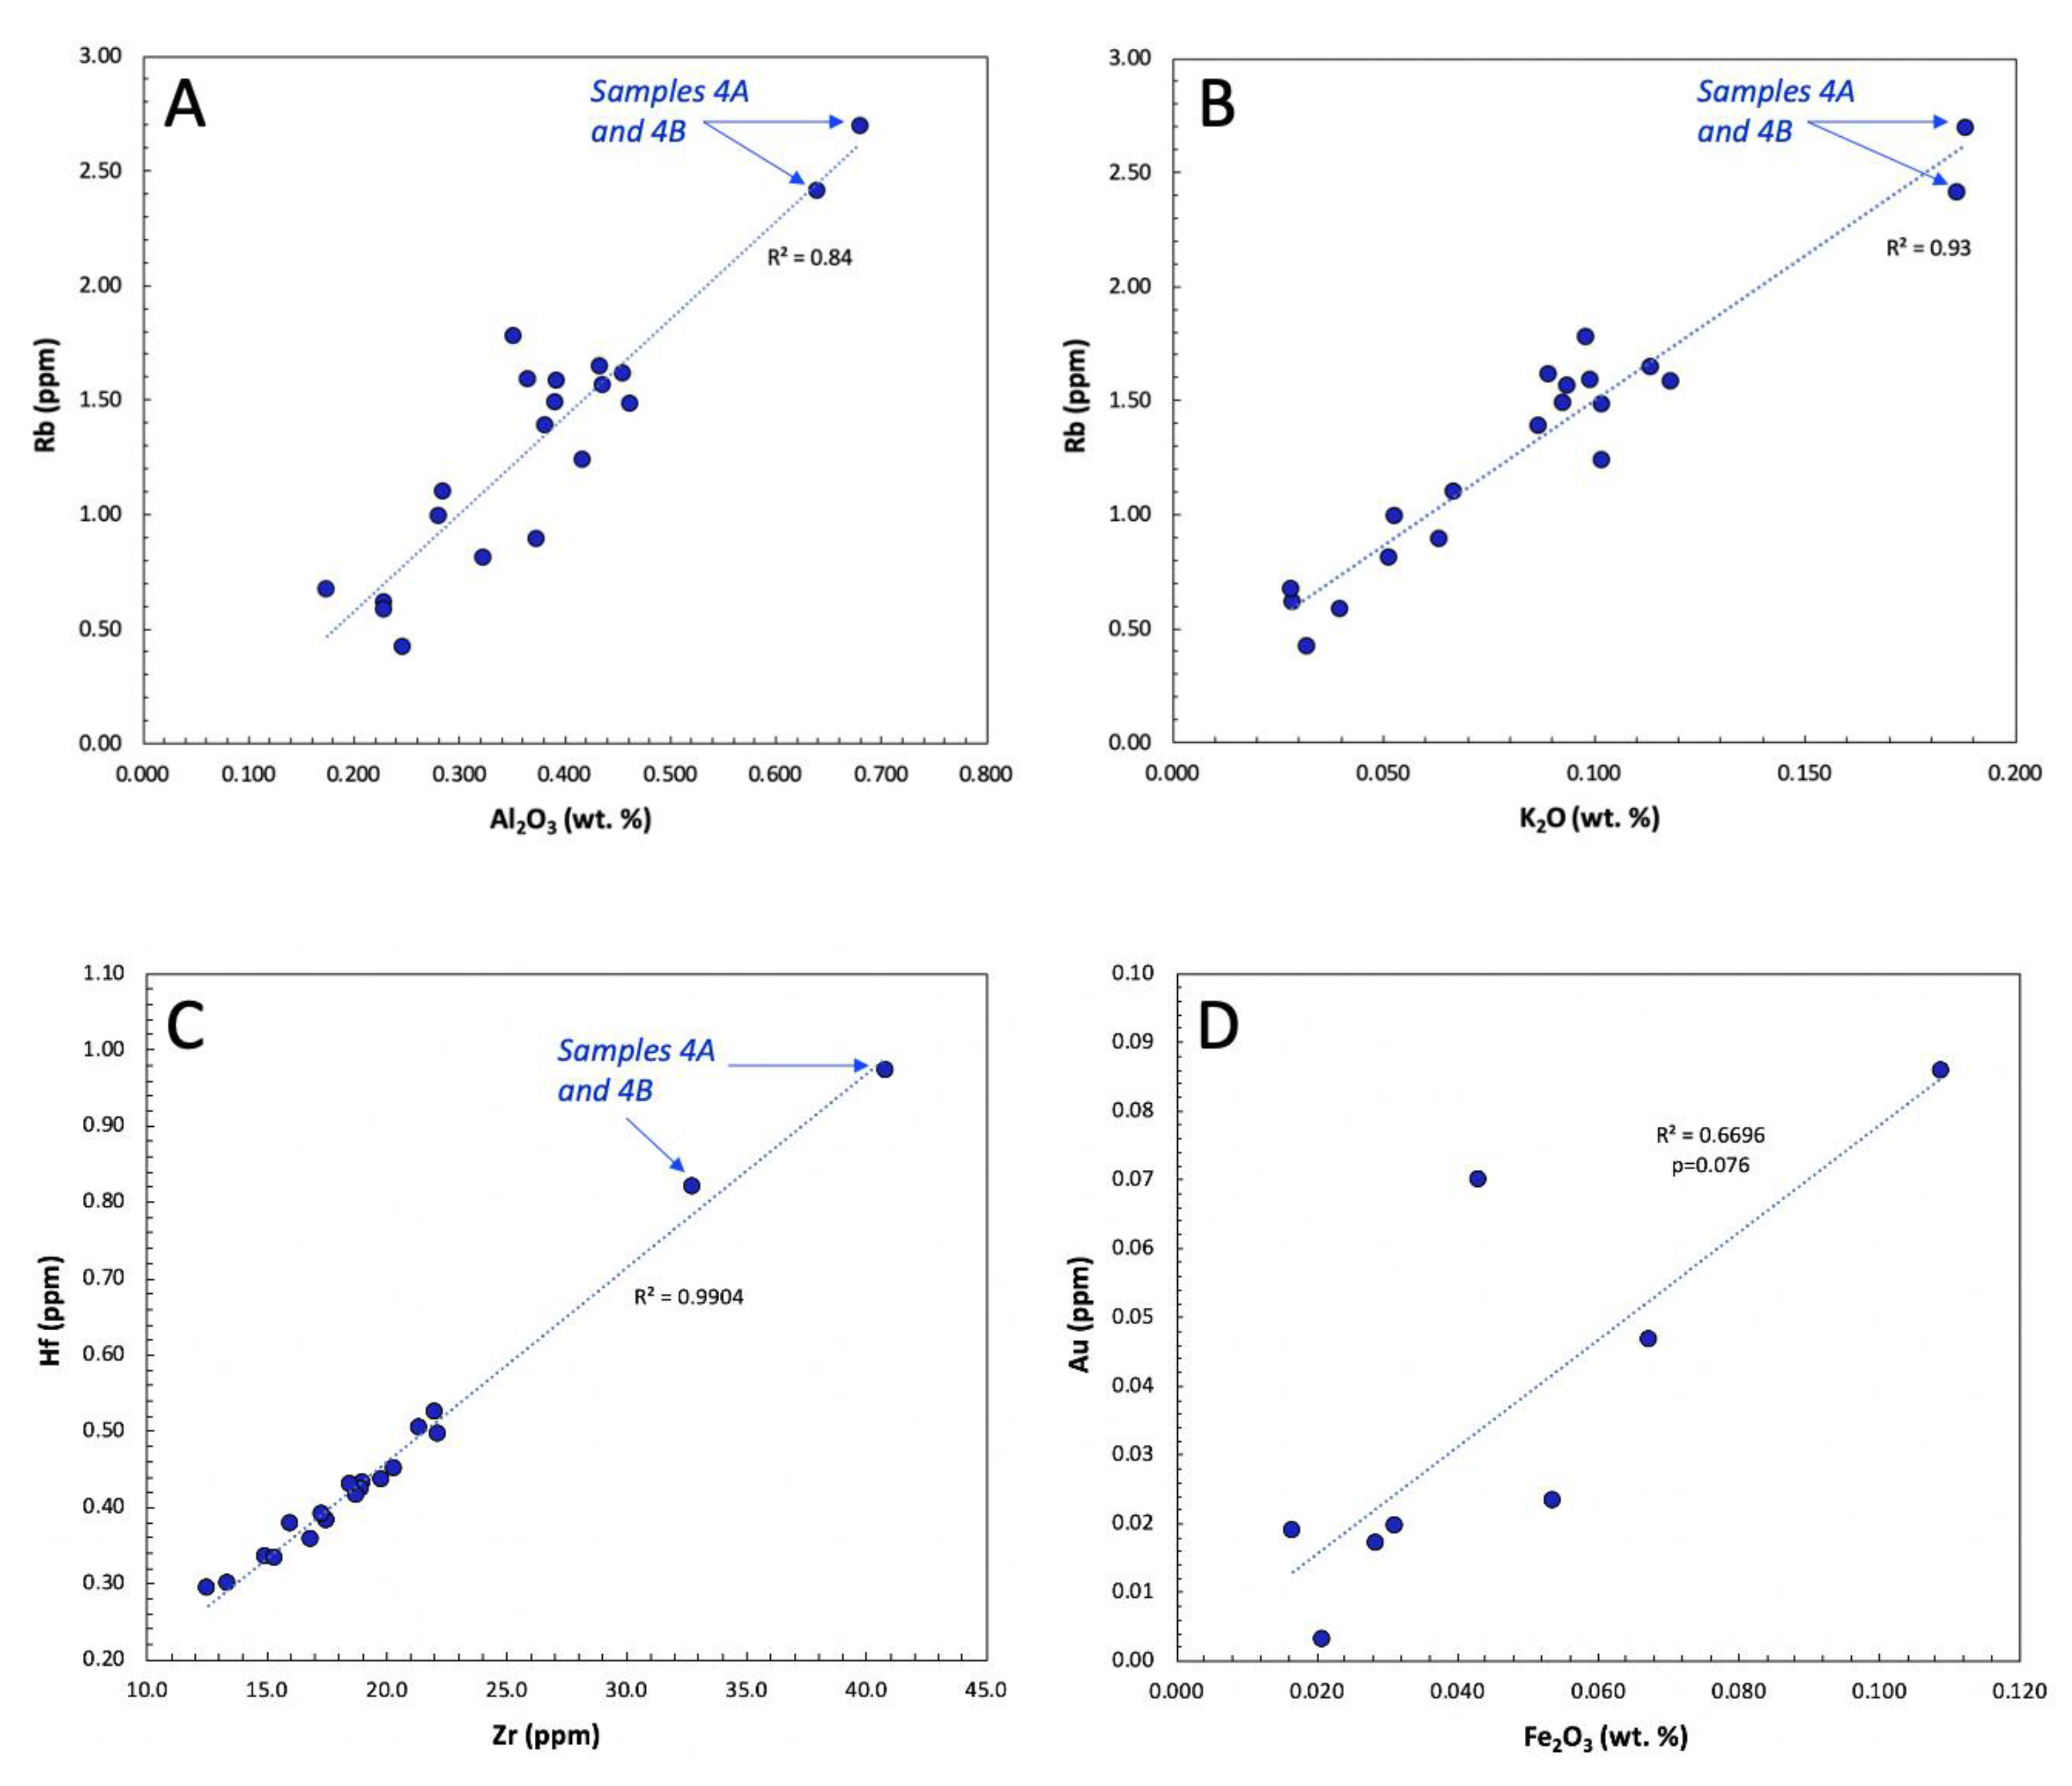
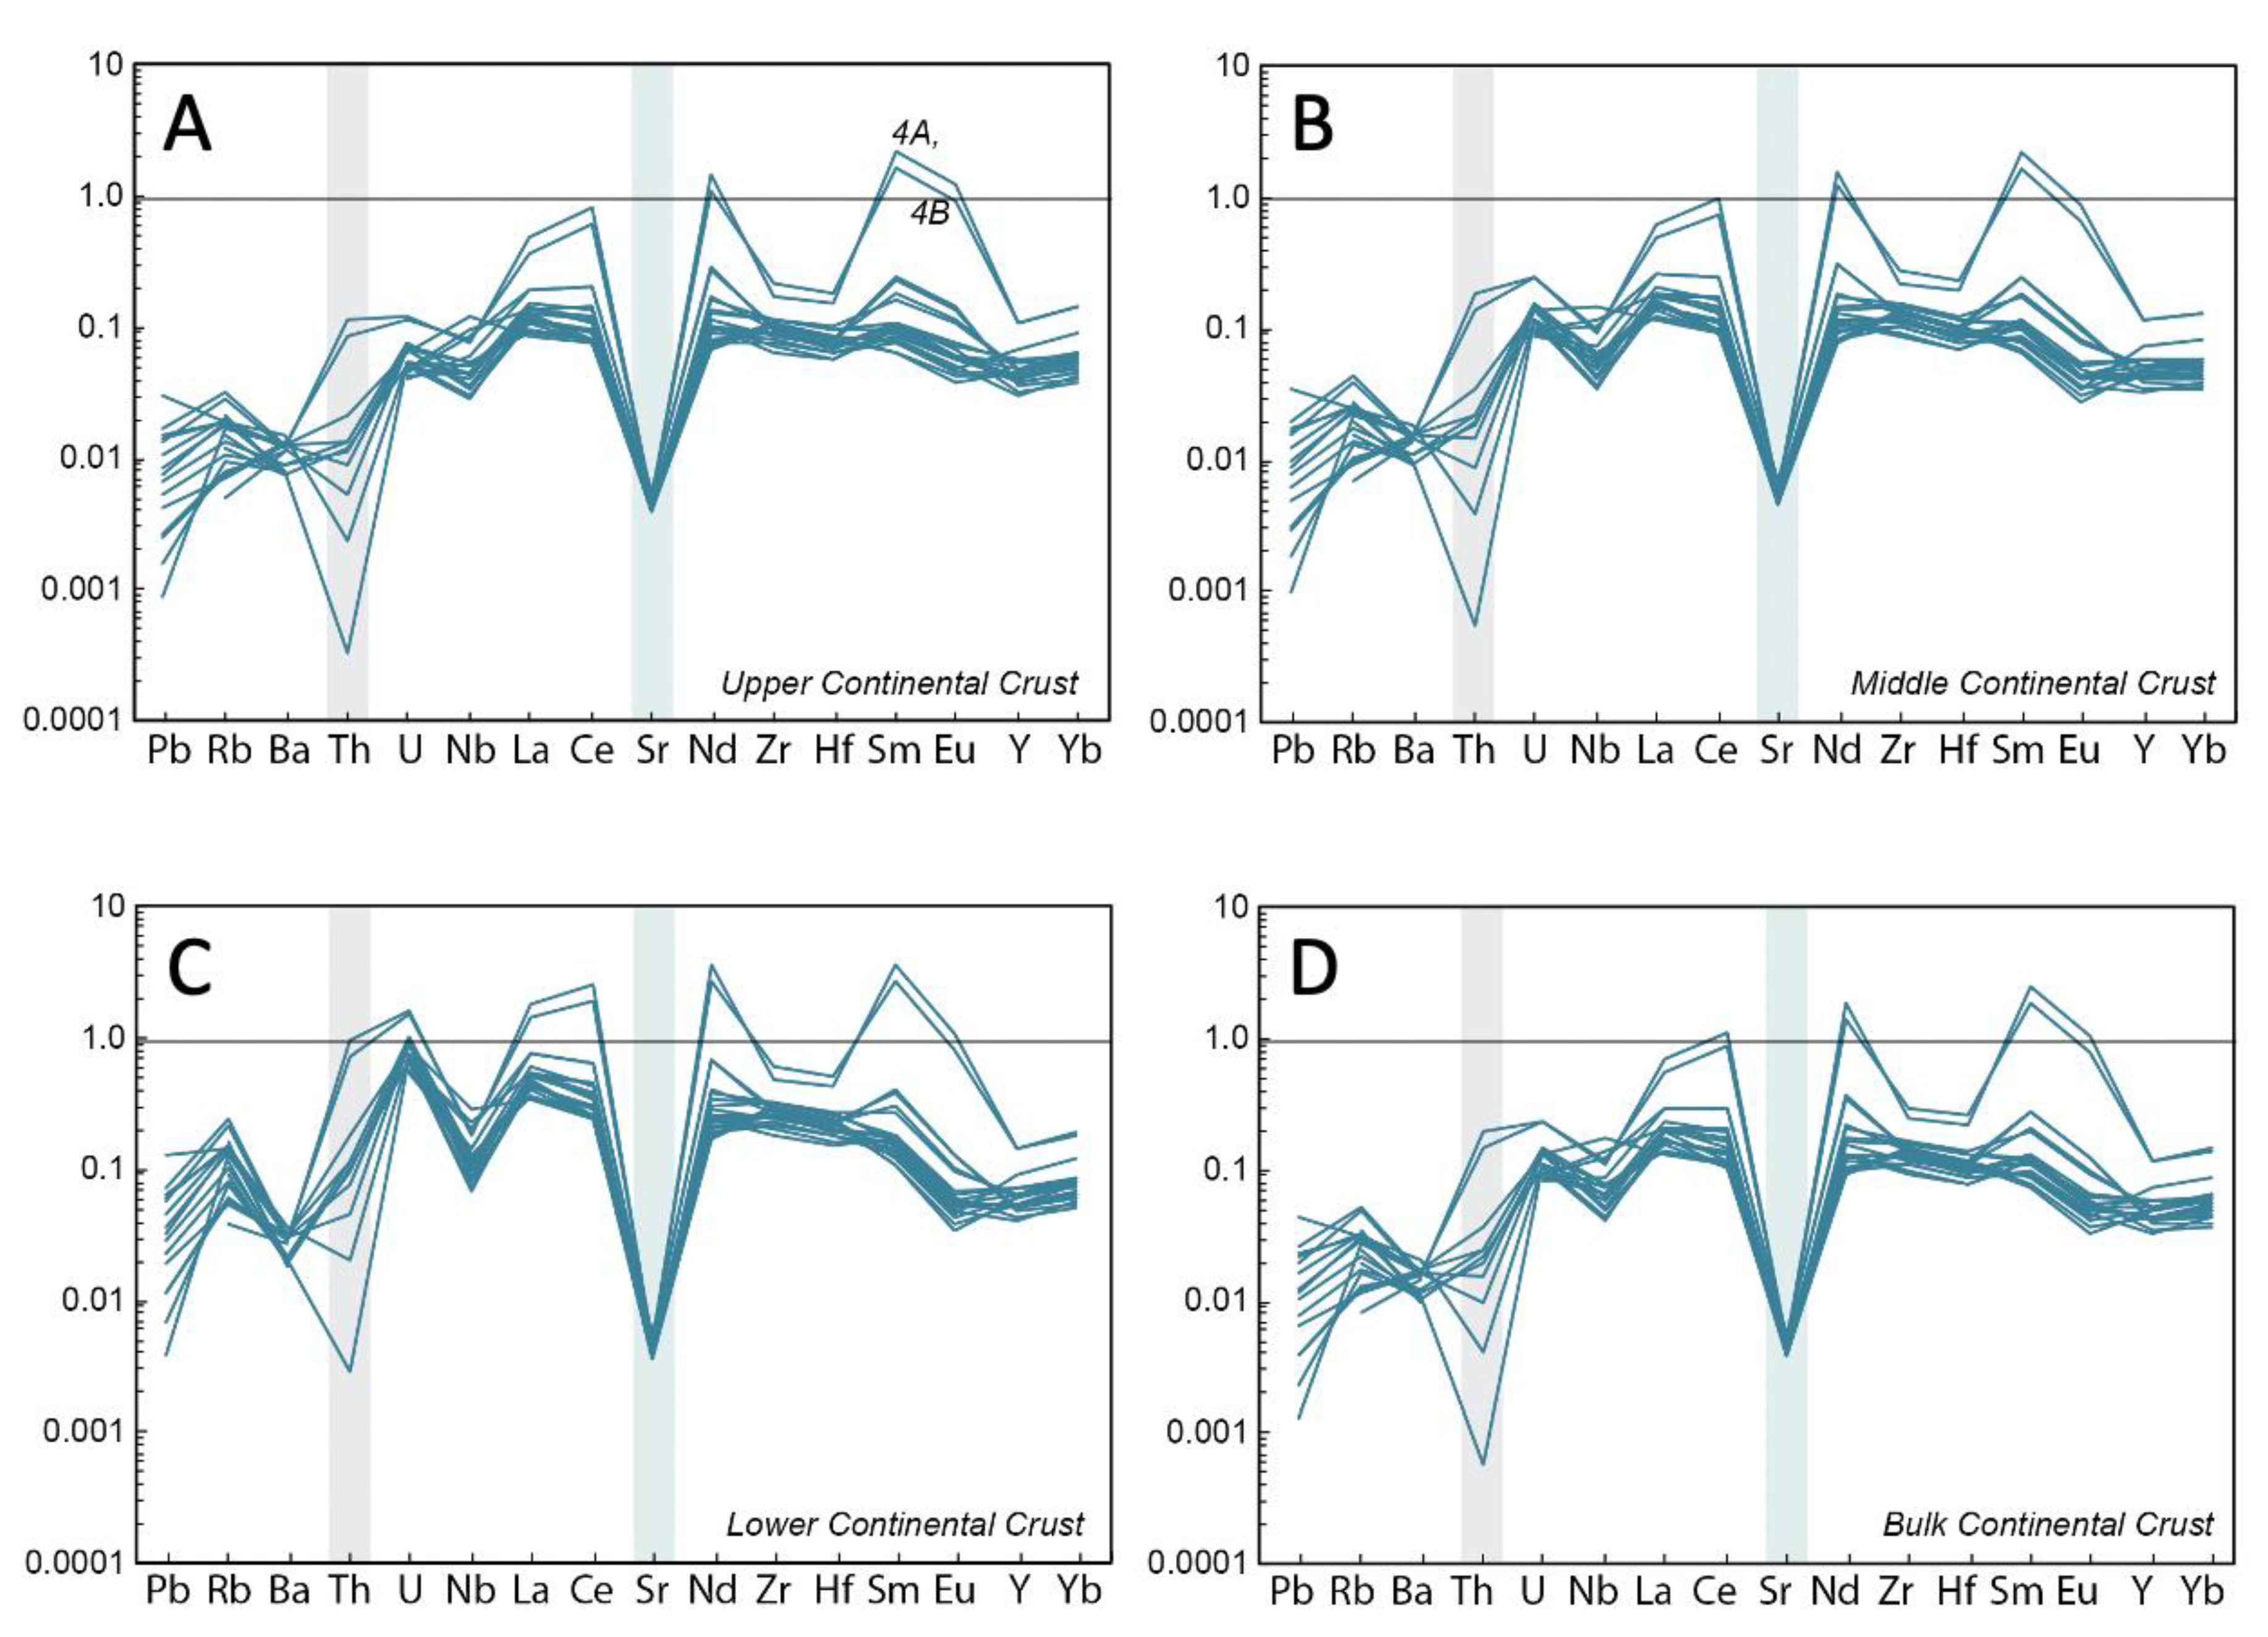
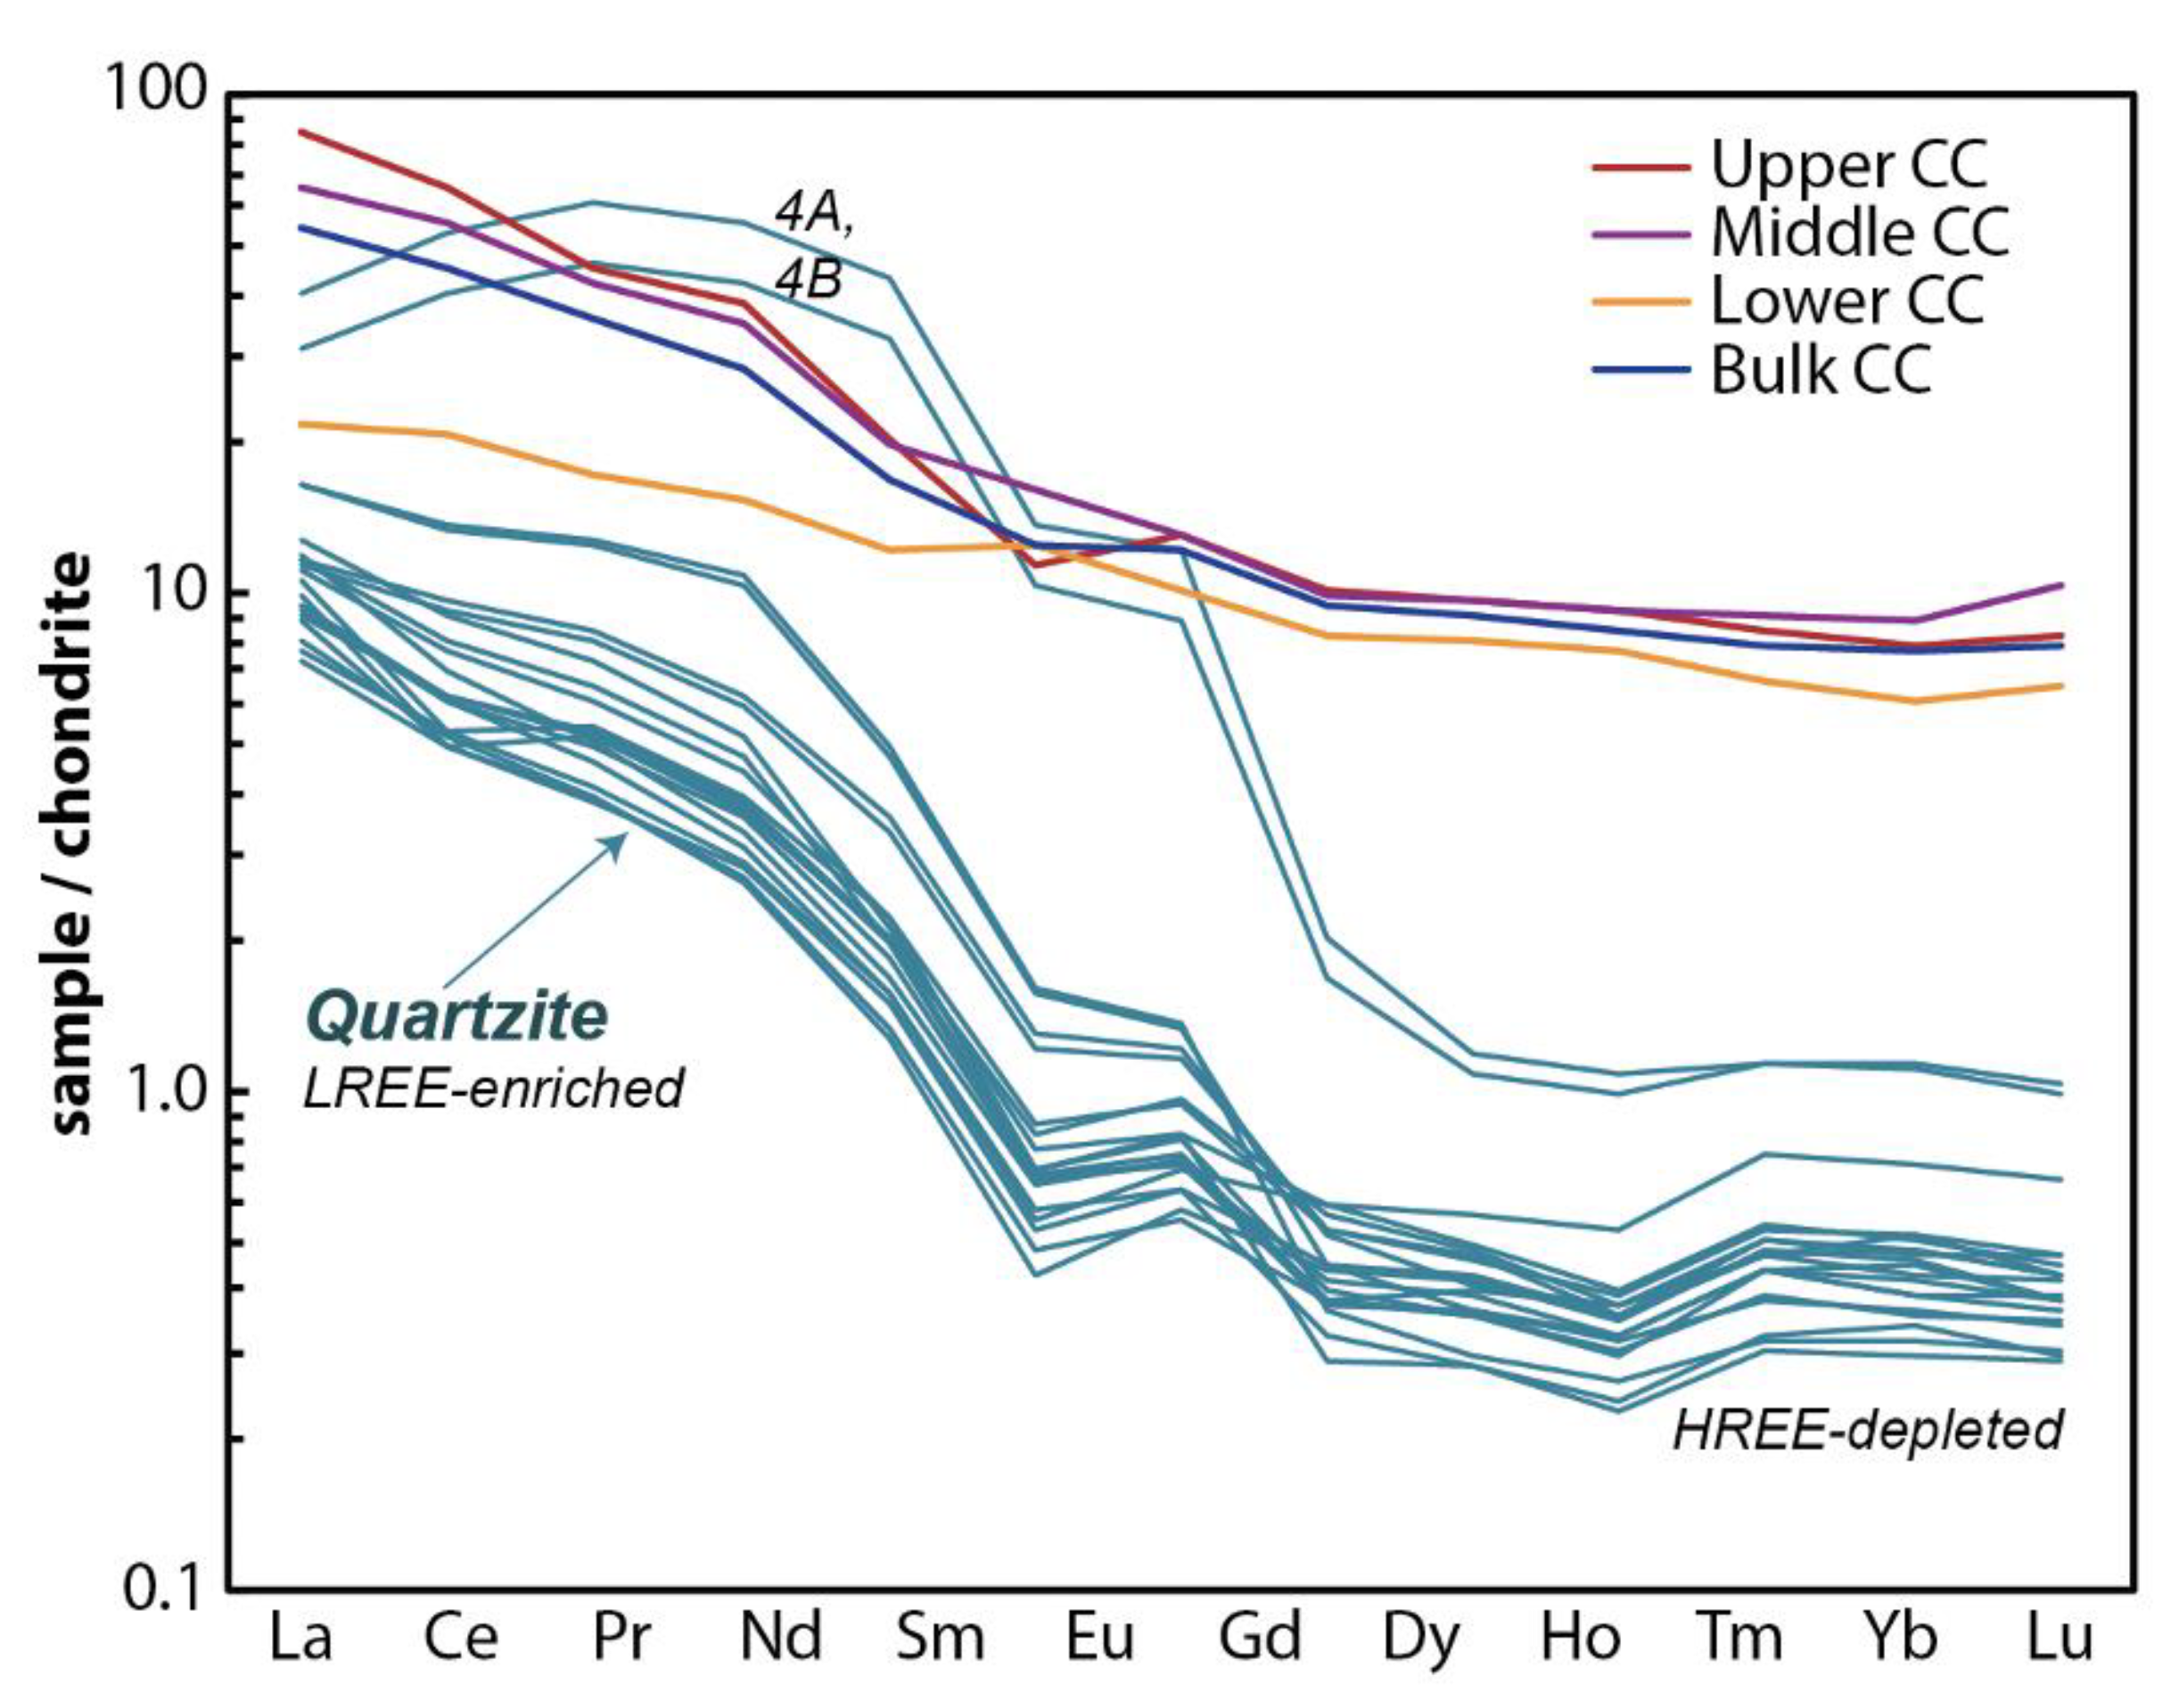
3.2. Bulk Geochemical Results
4. Discussion
4.1. Mineralogy and Geochemistry Implications for Potential Future Mineral Resource Development
4.2. Implications for Plasma Furnace Utilization
5. Conclusions
Supplementary Materials
Author Contributions
Funding
Acknowledgments
Conflicts of Interest
References
- Wellmer, F.W.; Becker-Platen, J.D. Global Nonfuel Mineral Resources and Sustainability. U.S.G.S. Circ. 2016, 1294. Available online: https://pubs.usgs.gov/circ/2007/1294/paper1.html (accessed on 21 May 2020).
- McNish, S. 2018 Conversations that Matter: Precious Metals in the Green Economy. Vancouver Sun. Available online: https://vancouversun.com/news/local-news/conversations-that-matter-precious-metals-in-the-green-economy/ (accessed on 21 May 2020).
- Straterra. The Minerals Industry is among Sectors of the NZ Society Where Great Strides Have Been Made of the Last 20 Years or so. 2018. Available online: https://www.straterra.co.nz/mining-in-nz/sustainability/green-minerals-and-the-green-economy/ (accessed on 20 May 2020).
- Frost, H.S. Africa Can Lead Platinum-Fueled Hydrogen Economy. Mining Weekly 2019. Available online: https://m.miningweekly.com/article/s-africa-can-lead-platinum-fuelled-hydrogen-economy-2019-09-20-1/rep_id:3861 (accessed on 21 May 2020).
- UN Environment Programme 2020. How Minerals and Metals Companies Can Help Achieve 2030 Agenda for Sustainable Development. Available online: https://www.unenvironment.org/news-and-stories/story/how-minerals-and-metals-companies-can-help-achieve-2030-agenda-sustainable (accessed on 21 May 2020).
- Chu, S. U.S. Department of Energy Critical Materials Strategy. 2011. Available online: https://energy.gov/sites/prod/files/DOE_CMS2011_FINAL_Full.pdf (accessed on 2 May 2020).
- Golev, A.; Scott, M.; Erskine, P.D.; Ali, S.H.; Ballantyne, G.R. Rare earth supply chains: Current status, constraints and opportunities. Resour. Policy 2014, 41, 52–59. [Google Scholar] [CrossRef]
- Armentrout, C.; Burke, M.; Silverstein, J.; Krekeler, M.P.S.; Nesbit, L.; Kidd, M.; Straub, K.; Newby, N.; Sellers, A. An unusual occurrence of silver in stream sediment from northern Breathitt County, Kentucky. Southeast. Geol. 2015, 51, 109–119. [Google Scholar]
- McLeod, C.; Krekeler, M.P.S. Sources of extraterrestrial rare earth elements: To the Moon and beyond. Resources 2017, 6, 40. [Google Scholar] [CrossRef] [Green Version]
- El-Kammer, A.; El-Wakil, M.; abd El-Rahman, Y.; Fathy, M.; Abdel-Azeem, M. Stream sediment geochemical survey of rare element in an arid region of the Hamadat area, central Eastern Desert, Egypt. Ore Geol. Rev. 2020, 117, 103287. [Google Scholar] [CrossRef]
- Lemos, F.A.; Sobral, L.G.S.; Dutra, A.J.B. Copper electrowinning from gold plant waste streams. Miner. Eng. 2006, 19, 388–398. [Google Scholar] [CrossRef]
- Geise, G.; LeGalley, E.; Krekeler, M.P.S. Mineralogical and geochemical investigations of silicate-rich mine waste from a Kyanite mine in Central Virginia: Implications for mine waste recycling. Environ. Earth Sci. 2011, 62, 185–196. [Google Scholar] [CrossRef]
- Schellenbach, W.L.; Krekeler, M.P.S. Mineralogical and geochemical investigations of pyrite-rich mine waste from a Kyanite mine in Central Virginia with comments on recycling. Environ. Earth Sci. 2012, 66, 1295–1307. [Google Scholar] [CrossRef]
- Schippers, A.; Hedrich, S.; Vasters, J.; Drobe, M.; Sand, W.; Willscher, S. Biomining: Metal recovery from ores with microorganisms. In Geobiotechnology I. Advances in Biochemical Engineering/Biotechnology; Schippers, A., Glombitza, F., Sand, W., Eds.; Springer: Berlin/Heidelberg, Germany, 2013; Volume 141, pp. 1–47. [Google Scholar]
- Park, I.; Tabelin, C.B.; Jeon, S.; Li, X.L.; Seno, K.; Ito, M.; Hiroyoshi, N. A review of recent strategies for acid mine drainage prevention and mine tailings recycling. Chemosphere 2019, 219, 588–606. [Google Scholar] [CrossRef]
- Fickling, D. Rare-Earth Prices Decline in China. Wall Str. J. 2011. Available online: https://www.wsj.com/articles/SB10001424052702304760604576426501004377160 (accessed on 14 May 2020).
- Taplin, N. Why Rare Earths Are a Low-Grade Weapon in Trade Fight. Wall Str. J. 2019. Available online: https://www.wsj.com/articles/why-rare-earths-are-a-low-grade-weapon-in-trade-fight-11559821874 (accessed on 2 May 2020).
- Yang, S. China Trade Fight Raises Specter of Rare-Earth Shortage. Wall Str. J. 2019. Available online: https://www.wsj.com/articles/china-trade-fight-raises-specter-of-rare-earth-shortage-11559304000 (accessed on 4 May 2020).
- Why the Gold Price Is Falling. Economist 2015. Available online: https://www.economist.com/the-economist-explains/2015/07/20/why-the-gold-price-is-falling (accessed on 2 May 2020).
- Pierdzioch, C.; Risse, M.; Rohloff, S. A boosting approach to forecasting the volatility of gold-price fluctuations under flexible loss. Resour. Policy. 2016, 47, 95–107. [Google Scholar] [CrossRef]
- The Mysterious Quiescence of the Gold Market. Economist 2017. Available online: https://www.economist.com/finance-and-economics/2017/04/12/the-mysterious-quiescence-of-the-gold-market (accessed on 4 May 2020).
- Hobbs, S.W.; Hays, W.H.; Ross, R.J., Jr. The Kinnikinic quartzite of central Idaho—Redefinition and subdivision. US Geol. Surv. Bull. 1254–J. 1968. [Google Scholar] [CrossRef]
- James, W.C.; Oaks, R.Q. Petrology of the Kinnikinic quartzite (Middle Ordovician), East-central Idaho. J. Sediment. Res. 1977, 47, 1491–1511. [Google Scholar]
- Baar, E.E. Determining the Regional-Scale Detrital Zircon Provenance of the Middle-Late Ordovician Kinnikinic (Eureka) Quartzite, East-Central Idaho, U.S. Master’s Thesis, Washington State University, Pullman, WA, USA, 2009; p. 144. Available online: http://citeseerx.ist.psu.edu/viewdoc/download?doi=10.1.1.427.3930&rep=rep1&type=pdf (accessed on 5 May 2020).
- Map of Idaho Highlighting Butte County Available through the Public Domain. Available online: https://en.wikipedia.org/wiki/Butte_County,_Idaho#/media/File:Map_of_Idaho_highlighting_Butte_County.svg (accessed on 14 May 2020).
- Skipp, B.; Snider, L.G.; Janecke, S.U.; Kuntz, M.A. Geologic Map of the Arco 30 × 60 Minute Quadrangle, South-Central Idaho. Idaho Geological Survey. 2009. Available online: https://www.idahogeology.org/product/gm-47 (accessed on 29 May 2020).
- Gehrels, G.E.; Dickinson, W.R.; Ross, G.M.; Stewart, J.H.; Howell, D.G. Detrital zircon reference for Cambrian to Triassic miogeoclinal strata of western North America. Geology 1995, 23, 831–834. [Google Scholar] [CrossRef]
- Malone, D.H.; Craddock, J.P.; McLaughlin, P.I.; Konstantinou, A.; McGillivray, K. Detrital zircon geochronology of the Bighorn Dolomite, Wyoming, USA: Evidence for Trans-Hudson dust deposition on the Western Laurentian carbonate platform. J. Geol. 2017, 125, 261–269. [Google Scholar] [CrossRef]
- McGuire, J.D.; Malone, D.H.; Craddock, J.P.; Malone, S.J. Detrital zircon U-Pb geochronology of the Ordovician lander sandstone, Bighorn mountains, Wyoming. Mt. Geol. 2019, 56, 231–246. [Google Scholar] [CrossRef]
- Gehrels, G.E.; and Dickinson, W.R. Detrital zircon provenance of Cambrian to Triassic Miogeoclinal and Eugeoclinal Strata in Nevada. Am. J. Sci. 1995, 295, 18–48. [Google Scholar] [CrossRef]
- Gehrels, G.E. Introduction to detrital zircon studies of Paleozoic and Triassic strata in western Nevada and northern California. Geol. Soc. Am. Spec. Pap. 2000, 347, 1–17. [Google Scholar] [CrossRef]
- Beranek, L.P.; Link, P.K.; Fanning, C.M. Detrital zircon record of mid-Paleozoic convergent margin activity in the northern U.S. Rocky Mountains: Implications for the Antler orogeny and early evolution of the North American Cordillera. Lithosphere 2016, 8, 533–550. [Google Scholar] [CrossRef] [Green Version]
- Gehrels, G.; Pecha, M. Detrital zircon U-Pb geochronology and Hf isotope geochemistry of Paleozoic and Triassic passive margin strata of western North America. Geosphere 2014, 10, 49–65. [Google Scholar] [CrossRef]
- Burke, M.; Rakovan, J.; Krekeler, M.P.S. A study by electron microscopy of gold and associated minerals from Round Mountain, Nevada. Ore Geol. Rev. 2017, 91, 708–717. [Google Scholar] [CrossRef]
- Chen, P-Y. Table of Key Lines in X-ray Powder Diffraction Patterns of Minerals in Clays and Associated Rocks. Indiana Dep. Nat. Resour. Geol. Surv. Occas. Pap. 1977. Available online: http://clay.uga.edu/courses/8550/Chen_OP21.pdf (accessed on 21 May 2020).
- Geochemical Earth Reference Model. Available online: https://earthref.org/KDD/ (accessed on 16 May 2020).
- Rudnick, R.L.; Gao, S. Composition of the continental crust. Treatise Geochem. 2003, 3, 1–64. [Google Scholar]
- Kirk, J.; Ruiz, J.; Chesley, J.; Titley, S.; Walshe, J. A detrital model for the origin of gold and sulfides in the Witwatersrand basin based on Re-Os isotopes. Geochim. Cosmochim. Acta 2001, 65, 2149–2159. [Google Scholar] [CrossRef]
- Tucker, R.F.; Viljoen, R.P.; Viljoen, M.J. A review of the Witswatersrand Basin—The World’s greatest goldfield. Episodes 2016, 39, 105–133. [Google Scholar] [CrossRef]
- Minter, W.E.L.; Renger, F.E.; Siegers, A. Early Proterozoic gold placers of the Moeda Formation within the Gandarela Syncline, Minas Gerais, Brazil. Econ. Geol. Bull. Soc. Econ. Geol. 1990, 85, 943–951. [Google Scholar] [CrossRef]
- Cavallo, A.; Dino, G.A. The Bargiolina, a striking historical stone from Monte Bracco (Piedmont, NW Italy) and a Possible Source of Industrial Minerals. Sustainability 2019, 11, 4293. [Google Scholar] [CrossRef] [Green Version]
- Stein, K-J. Deposits of dimension stone in Benin and their classification after UNFCR. Z. Dtsch. Gessllschaft Geowiss. 2007, 158, 429–446. [Google Scholar] [CrossRef]
- Cabello, M.L.; Peres, A.E.C.; Martins, A.H.; Pereira, C.A. Use of quartzite quarries wastes in civil construction. Glob. Stone Congr. 2013, 548, 135. [Google Scholar] [CrossRef]
- Aliasgharzadeh-Polesangi, A.; Abdollah-Pour, H.; Farzin, Y.A. Nanostructured silicon production from quartzite ore by low-energy wet blending of the reagents, reduction in controlled atmosphere, and hydro metallurgy. J. Mater. Res. Technol. 2019, 8, 1014–1023. [Google Scholar] [CrossRef]
- The Mineral Industry in Newfoundland and Labrador: Its Development and Economic Contributions. Government of Newfoundland and Labrador, Department of Natural Resources. Geol. Surv. 2020. Available online: https://www.gov.nl.ca/nr/files/mines-geoscience-publications-openfiles-of-nfld2889.pdf (accessed on 21 May 2020).
- Ridley, J. Ore Deposit Geology; Cambridge University Press: Cambridge, UK, 2013; p. 398. [Google Scholar]
- Marsden, J.O.; House, C.I. The Chemistry of Gold Extraction; Society for Mining, Metallurgy and Exploration Inc.: Littleton, CO, USA, 2006; p. 682. [Google Scholar]
- Goonan, T.G. Rare Earth Elements—End Use and Recyclability; Scientific Investigations Report. 2011–5094. U. S. Geol. Surv. 2011. Available online: https://pubs.usgs.gov/sir/2011/5094/pdf/sir2011-5094.pdf (accessed on 2 May 2020).
- Al-Thyabat, S.; Zhang, P. REE extraction from phosphoric acid, phosphoric acid sludge, and phosphogypsum. Trans. Inst. Min. Metall. Sect. C-Miner. Process. Extr. Metall. 2015, 124, 143–150. [Google Scholar] [CrossRef]
- Huang, X.W.; Dong, J.S.; Wang, L.S.; Feng, Z.Y.; Xue, Q.N.; Meng, X.L. Selective recovery of rare earth elements form ion-adsorption rare earth element ores by stepwise extraction with HEH(EHP) and HDEHP. Green Chem. 2017, 19, 1345–1352. [Google Scholar] [CrossRef]
- Maes, S.; Zhuang, W.Q.; Rabaey, K.; Alvarez-Cohen, L.; Hennebel, T. Concomittant leaching and electrochemcial extraction of rare earth elements from monazite. Env. Sci. Tech. 2017, 51, 1654–1661. [Google Scholar] [CrossRef] [Green Version]
- NIOSH, N.D. Tips for Preventing Silicosis. Available online: https://arlweb.msha.gov/S&HINFO/SILICO/SILITIPS.pdf (accessed on 6 May 2020).
- Miles, R.W.; Hynes, K.M.; Forbes, I. Photovoltaic solar cells: An overview of state-of-the-art cell development and environmental issues. Prog. Cryst. Growth Charact. Mater. 2005, 51, 1–42. [Google Scholar] [CrossRef]
- Sörvik, A.I. Method for the Manufacture of Pure Silicon Metal and Amorphous Silica by Reduction OF Quartz (SiO2). World Intellectual Property Organization. Patent No. WO2007102745A1, 2007. Available online: https://patents.google.com/patent/WO2007102745A1/en (accessed on 21 May 2020).
- Volokitin, O.; Vlasov, V.; Volokitin, G.; Skripnikova, N.; Shekhovtsov, V. Mathematical modeling of quartz particle melting process in plasma-chemical reactor. AIP Conf. Proc. 2016, 1698, 040013. [Google Scholar] [CrossRef] [Green Version]
- Zhou, H.; Sun, X.; Cook, N.J.; Lin, H.; Fu, Y.; Zhong, R.; Brugger, J. Nano- to micron-scale particulate gold hosted by magnetite a product of gold scavenging by bismuth melts. Econ. Geol. 2017, 112, 993–1010. [Google Scholar] [CrossRef]
- Reeve, J.S.; Cross, K.C.; Smith, R.N.; Oreskes, N. Olympic dam copper-uranium-gold-silver deposit. In Geology and Mineral Deposits or Australia and Papau New Guinea; Hughes, F.E., Ed.; Melbourne Australasian Institute of Mining and Metallurgy: Carlton, Australia, 1990; Volume 14, pp. 1009–1035. [Google Scholar]
- Reynolds, L.J. Geology of the Olympic Dam Cu-U-Au-Ag-REE deposit. MESA J. 2001, 23, 4–11. Available online: http://www.geokniga.org/books/4804 (accessed on 21 May 2020).
- Porto, C.G.; Hale, M. Mineralogy, morphology and chemistry of gold in the stone line lateritic profile of the Posse deposit, Central Brazil. J. Geochem. Explor. 1996, 57, 115–125. [Google Scholar] [CrossRef]
- Al-Merey, R.; Hariri, Z.; Abu Hilal, I. Selective separation of gold from iron ore samples using ion exchange resin. Microchem. J. 2003, 75, 169–177. [Google Scholar] [CrossRef]
- Bas, A.D.; Safizadeh Ghali, E.; Choi, Y. Leaching and electrochemical dissolution of gold in the presence of iron oxide minerals associated with roasted gold ore. Hydrometallurgy 2016, 166, 143–153. [Google Scholar] [CrossRef]
- Dickinson, S. Rare Earth and Polysilicon. Does China Control Our Green Future? China Bus. 2010. Available online: https://www.chinalawblog.com/2010/11/rare_earths_and_polysilicon_does_china_hold_our_green_future_in_its_hands.html (accessed on 6 May 2020).
- Johnson, C.M.; Winter, B.L. Provenance analysis of lower Paleozoic cratonic quartz arenites of the North American midcontinent region U-Pb and Sm-Nd isotope geochemistry. Geol. Soc. Am. Bull. 1999, 111, 1723–1738. [Google Scholar] [CrossRef]
- Konstantinou, A.; Wirth, K.; Craddock, J.P.; Malone, D.H.; Vervoort, J.D.; Davidson, C. Provenance of early Paleozoic quartz arenites, Midcontinent, USA. J. Geol. 2014, 22, 201–216. [Google Scholar] [CrossRef]
- Davis, J.G. St. Peter Sandstone Mineral Resource Evaluation. Proceeding of the 48th Annual Forum on the Geology of Industrial Minerals, Missouri, USA, 30 April–4 May 2012; Conway, F.M., Ed.; Phoenix, Arizona, Arizona Geological Survey Special Paper: Scottsdale, AZ, USA, 2014; pp. 1–7. Available online: http://repository.azgs.az.gov/sites/default/files/dlio/files/nid1576/fgim-chap6-stpeterss_davis.pdf (accessed on 6 May 2020).
- Naicker, K.; Cukrowska, E.; McCarthy, T.S. Acid mine drainage arising from gold mining activity in Johannesburg, South Africa and environs. Environ. Pollut. 2003, 122, 29–40. [Google Scholar] [CrossRef]
- Winde, F.; Wade, P.; van der Walt, I.J. Gold Tailings as a Source of Waterborne Uranium Contamination of Streams—The Koekemoersruit. Klerksdopr Goldfield, South Africa as a Case Study—Part I of III: Uranium Migration Along the Aqueous Pathway. Water SA 2004, 30, 219–225. Available online: https://pdfs.semanticscholar.org/f41c/f7f6b9026fff84708b30e31a40f1ca7bf5f4.pdf (accessed on 6 May 2020).
- Tutu, H.; McCarthy, T.S.; Cukrowska, E. The chemical characteristics of acid mine drainage with particulate reference to sources, distribution and remediation: The Witwatersrand Basin, South Africa as a case study. Appl. Geochem. 2008, 23, 3666–3684. [Google Scholar] [CrossRef]
- Ojelede, M.E.; Annegarn, H.; Kneen, M.A. Evaluation of aeolian emissions from gold mine tailings on the Witswatersrand. Aeolian Res. 2012, 3, 477–486. [Google Scholar] [CrossRef]
- Hansen, R.N. Inter-comparison geochemical modelling approaches and implications for environmental risk assessments: A Witswatersrand gold tailings source term characterization study. Appl. Geochem. 2018, 95, 71–84. [Google Scholar] [CrossRef]
- Malatse, M.; Ndlovu, S. The Viability of Using the Witwatersrand Gold Mine Tailings for Brick Making. J. South. Afr. Inst. Min. Metall. 2015, 115, 321–326. Available online: http://www.scielo.org.za/scielo.php?script=sci_abstract&pid=S2225-62532015000400014 (accessed on 6 May 2020). [CrossRef]


| Sample | SiO2 | CaO | Fe2O3 | K2O | MgO | MnO | Na2O | P2O5 | Al2O3 | TiO2 | Total |
|---|---|---|---|---|---|---|---|---|---|---|---|
| 1A | 96.47 | 0.058 | 0.043 | 0.09 | 0.05 | 0.001 | 0.006 | 0.012 | 0.44 | 0.013 | 97.18 |
| 2A | 99.43 | 0.055 | 0.109 | 0.03 | 0.03 | <0.001 | 0.003 | 0.014 | 0.23 | 0.008 | 99.91 |
| 3A | 99.44 | 0.063 | 0.067 | 0.04 | 0.04 | b.d. | 0.003 | 0.015 | 0.23 | 0.008 | 99.90 |
| 4A | 98.68 | 0.072 | 0.021 | 0.19 | 0.07 | b.d. | 0.004 | 0.023 | 0.64 | 0.027 | 99.72 |
| 5A | 99.16 | 0.077 | 0.017 | 0.12 | 0.05 | b.d. | 0.004 | 0.013 | 0.39 | 0.009 | 99.84 |
| 6A | 99.18 | 0.110 | 0.028 | 0.10 | 0.05 | b.d. | 0.003 | 0.015 | 0.46 | 0.009 | 99.96 |
| 7A | 99.14 | 0.135 | 0.001 | 0.10 | 0.06 | b.d. | 0.005 | 0.015 | 0.42 | 0.007 | 99.88 |
| 8A | 99.35 | 0.006 | 0.031 | 0.06 | 0.01 | <0.001 | 0.002 | 0.002 | 0.37 | 0.015 | 99.86 |
| 9A | 99.40 | 0.005 | 0.032 | 0.05 | 0.02 | <0.001 | 0.003 | 0.002 | 0.32 | 0.011 | 99.85 |
| 10A | 99.02 | 0.025 | 0.043 | 0.10 | 0.03 | <0.001 | 0.006 | 0.000 | 0.36 | 0.013 | 99.60 |
| 1B | 98.95 | 0.015 | 0.054 | 0.09 | 0.03 | 0.002 | 0.003 | 0.001 | 0.46 | 0.014 | 99.61 |
| 2B | 99.64 | 0.009 | 0.038 | 0.03 | 0.01 | 0.001 | 0.006 | 0.002 | 0.17 | 0.009 | 99.92 |
| 3B | 99.66 | 0.007 | 0.017 | 0.03 | 0.01 | 0.001 | 0.002 | 0.001 | 0.25 | 0.009 | 99.99 |
| 4B | 98.84 | 0.003 | 0.025 | 0.19 | 0.04 | <0.001 | 0.003 | 0.005 | 0.68 | 0.033 | 99.82 |
| 5B | 99.15 | 0.002 | 0.053 | 0.11 | 0.03 | <0.001 | 0.002 | b.d. | 0.43 | 0.012 | 99.80 |
| 6B | 99.26 | 0.020 | 0.026 | 0.09 | 0.02 | <0.001 | 0.003 | b.d. | 0.39 | 0.012 | 99.83 |
| 7B | 99.38 | 0.003 | 0.032 | 0.10 | 0.02 | <0.001 | 0.008 | b.d. | 0.35 | 0.010 | 99.91 |
| 8B | 99.57 | 0.017 | 0.016 | 0.07 | 0.02 | <0.001 | 0.002 | 0.002 | 0.28 | 0.015 | 99.99 |
| 9B | 99.44 | 0.010 | 0.042 | 0.05 | 0.01 | <0.001 | 0.003 | b.d. | 0.28 | 0.011 | 99.86 |
| 10B | 99.00 | 0.007 | 0.110 | 0.09 | 0.02 | <0.001 | 0.002 | b.d. | 0.38 | 0.012 | 99.62 |
| Max | 99.66 | 0.135 | 0.110 | 0.19 | 0.07 | 0.002 | 0.008 | 0.023 | 0.68 | 0.033 | 99.99 |
| Min. | 96.47 | 0.002 | 0.001 | 0.03 | 0.01 | b.d. | 0.002 | b.d | 0.17 | 0.007 | 97.18 |
| Avg. | 99.11 | 0.035 | 0.040 | 0.09 | 0.03 | 0.001 | 0.004 | 0.008 | 0.38 | 0.013 | 99.70 |
| St. Dv. | 0.67 | 0.039 | 0.028 | 0.04 | 0.02 | 0.000 | 0.002 | 0.007 | 0.13 | 0.006 | 0.60 |
| Sample | Sc | V | Cr | Ni | Cu | Zn | Rb | Sr | Y | Zr | Nb | Mo | Sb | Ba | La | Ce |
| 1A | 0.83 | 2.11 | 8.13 | 2.79 | 0.53 | b.d. | 1.56 | 1.53 | 0.94 | 20.32 | 1.44 | 0.08 | b.d. | 8.06 | 2.69 | 4.74 |
| 2A | 0.50 | 3.00 | 10.01 | 3.51 | 0.22 | b.d. | 0.62 | 1.48 | 1.02 | 21.36 | 1.11 | 0.04 | 0.04 | 8.21 | 4.26 | 7.78 |
| 3A | 1.02 | 2.66 | 8.62 | 4.04 | 0.59 | b.d. | 0.59 | 1.85 | 0.80 | 19.05 | 1.00 | 0.08 | 0.02 | 7.76 | 6.02 | 12.94 |
| 4A | 1.24 | 1.36 | 19.42 | 2.70 | 0.62 | b.d. | 2.41 | 1.57 | 2.28 | 32.76 | 0.91 | 0.16 | b.d. | 7.39 | 14.54 | 50.21 |
| 5A | 0.86 | 1.71 | 8.87 | 2.94 | 0.52 | 10.90 | 1.58 | 1.36 | 1.17 | 17.48 | 0.59 | 0.03 | 0.01 | 5.06 | 3.62 | 4.67 |
| 6A | 0.87 | 1.95 | 9.90 | 4.15 | 1.45 | 22.31 | 1.48 | 1.27 | 0.94 | 18.97 | 0.63 | 0.04 | 0.07 | 8.06 | 2.94 | 4.98 |
| 7A | 0.82 | 1.78 | 9.95 | 3.74 | 0.25 | 16.12 | 1.24 | 1.25 | 0.64 | 17.51 | 0.59 | 0.03 | b.d. | 4.79 | 3.47 | 5.85 |
| 8A | 0.91 | 1.72 | 11.07 | 5.03 | 0.51 | b.d. | 0.89 | 1.31 | 1.00 | 22.03 | 0.51 | 0.05 | 0.02 | 5.60 | 4.18 | 8.89 |
| 9A | 0.53 | 1.79 | 10.31 | 5.08 | 1.16 | 55.93 | 0.81 | 1.27 | 0.88 | 13.42 | 0.37 | 0.18 | b.d. | 5.14 | 3.34 | 5.96 |
| 10A | 0.75 | 1.90 | 12.47 | 6.63 | 4.80 | 58.23 | 1.59 | 1.69 | 1.13 | 12.56 | 0.62 | 0.06 | b.d. | 9.50 | 3.47 | 6.02 |
| 1B | 1.07 | 2.48 | 14.07 | 5.97 | 0.37 | 2.10 | 1.62 | 1.43 | 1.44 | 14.95 | 0.64 | 0.07 | b.d. | 7.70 | 2.82 | 5.02 |
| 2B | 0.72 | 1.71 | 10.35 | 5.42 | 0.23 | 29.58 | 0.67 | 1.58 | 0.68 | 22.13 | 0.55 | b.d. | b.d. | 7.27 | 4.75 | 8.63 |
| 3B | 1.17 | 1.86 | 11.04 | 6.26 | 0.25 | 36.25 | 0.42 | 1.77 | 0.75 | 18.79 | 0.73 | b.d. | b.d. | 6.94 | 6.05 | 13.07 |
| 4B | 1.33 | 1.91 | 22.74 | 4.31 | 0.49 | 27.28 | 2.69 | 1.62 | 2.25 | 40.81 | 0.94 | b.d. | b.d. | 7.78 | 11.36 | 38.08 |
| 5B | 0.94 | 1.97 | 13.90 | 5.81 | 0.32 | 17.84 | 1.65 | 1.35 | 1.13 | 16.88 | 0.54 | 0.03 | b.d. | 5.09 | 3.93 | 5.04 |
| 6B | 1.18 | 4.11 | 11.28 | 5.85 | 1.87 | 136.49 | 1.49 | 1.33 | 0.87 | 19.81 | 0.53 | 0.21 | 0.01 | 7.90 | 3.27 | 4.71 |
| 7B | 1.18 | 3.68 | 12.77 | 6.04 | 0.51 | 12.83 | 1.78 | 1.30 | 0.85 | 15.33 | 0.49 | 0.44 | b.d. | 4.65 | 4.34 | 6.62 |
| 8B | 0.56 | 1.45 | 15.69 | 7.32 | 1.28 | 7.80 | 1.10 | 1.42 | 0.99 | 18.52 | 0.42 | 0.02 | b.d. | 5.57 | 4.28 | 9.22 |
| 9B | 0.66 | 1.86 | 11.86 | 10.06 | 0.77 | 95.80 | 0.99 | 1.26 | 0.82 | 16.03 | 0.34 | 0.20 | b.d. | 4.82 | 4.05 | 7.30 |
| 10B | 0.80 | 3.21 | 15.96 | 7.74 | 0.89 | 139.52 | 1.39 | 1.29 | 0.86 | 17.30 | 0.40 | 0.25 | b.d. | 7.88 | 3.42 | 5.79 |
| Max | 1.33 | 4.11 | 22.74 | 10.06 | 4.80 | 139.52 | 2.69 | 1.85 | 2.28 | 40.81 | 1.44 | 0.44 | 0.07 | 9.50 | 14.54 | 50.21 |
| Min. | 0.50 | 1.36 | 8.13 | 2.70 | 0.22 | b.d. | 0.42 | 1.25 | 0.64 | 12.56 | 0.34 | b.d. | b.d. | 4.65 | 2.69 | 4.67 |
| Avg. | 0.90 | 2.21 | 12.42 | 5.27 | 0.88 | 44.60 | 1.33 | 1.45 | 1.07 | 19.80 | 0.67 | 0.11 | 0.03 | 6.76 | 4.84 | 10.78 |
| St. Dv. | 0.24 | 0.75 | 3.71 | 1.85 | 1.03 | 44.97 | 0.59 | 0.18 | 0.45 | 6.50 | 0.28 | 0.11 | 0.02 | 1.49 | 2.96 | 11.84 |
| Sample | Sc | V | Cr | Ni | Cu | Zn | Rb | Sr | Y | Zr | Nb | Mo | Sb | Ba | La | Ce |
| 1A | 0.52 | 1.99 | 0.35 | 0.05 | 0.19 | 0.17 | 0.04 | 0.09 | 0.02 | 0.12 | 0.02 | 0.45 | 0.07 | 0.26 | 0.22 | 0.18 |
| 2A | 0.90 | 3.36 | 0.46 | 0.06 | 0.23 | 0.15 | 0.03 | 0.09 | 0.02 | 0.13 | 0.02 | 0.51 | 0.09 | 0.04 | b.d. | 0.13 |
| 3A | 1.73 | 7.36 | 1.09 | 0.14 | 0.41 | 0.17 | 0.03 | 0.08 | 0.01 | 0.09 | 0.01 | 0.43 | 0.05 | 0.07 | b.d. | 0.13 |
| 4A | 8.34 | 39.17 | 9.87 | 1.19 | 3.72 | 0.77 | 0.10 | 0.27 | 0.04 | 0.27 | 0.04 | 0.82 | 0.00 | 0.23 | 1.16 | 0.32 |
| 5A | 0.71 | 2.61 | 0.47 | 0.07 | 0.30 | 0.22 | 0.04 | 0.09 | 0.02 | 0.12 | 0.02 | 0.38 | 0.02 | 0.13 | 0.00 | 0.14 |
| 6A | 0.54 | 1.87 | 0.30 | 0.04 | 0.18 | 0.17 | 0.04 | 0.09 | 0.02 | 0.11 | 0.01 | 0.42 | 0.02 | 0.14 | 0.14 | 0.20 |
| 7A | 0.63 | 2.19 | 0.37 | 0.05 | 0.20 | 0.12 | 0.02 | 0.06 | 0.01 | 0.08 | 0.01 | 0.38 | b.d. | b.d. | b.d. | 0.15 |
| 8A | 1.10 | 4.21 | 0.77 | 0.11 | 0.36 | 0.20 | 0.04 | 0.10 | 0.02 | 0.13 | 0.02 | 0.53 | 0.02 | 0.09 | 0.14 | 0.20 |
| 9A | 0.71 | 2.65 | 0.46 | 0.06 | 0.22 | 0.14 | 0.03 | 0.08 | 0.02 | 0.10 | 0.01 | 0.30 | b.d. | 0.03 | b.d. | 0.14 |
| 10A | 0.72 | 2.68 | 0.47 | 0.06 | 0.25 | 0.23 | 0.04 | 0.10 | 0.02 | 0.12 | 0.02 | 0.29 | b.d. | 0.50 | 0.02 | 0.15 |
| 1B | 0.56 | 2.04 | 0.37 | 0.05 | 0.21 | 0.22 | 0.05 | 0.13 | 0.03 | 0.18 | 0.03 | 0.34 | 0.02 | 0.25 | 0.05 | 0.18 |
| 2B | 1.00 | 3.67 | 0.50 | 0.07 | 0.25 | 0.11 | 0.02 | 0.06 | 0.01 | 0.07 | 0.01 | 0.50 | b.d. | 0.04 | b.d. | 0.12 |
| 3B | 1.75 | 7.69 | 1.13 | 0.14 | 0.42 | 0.14 | 0.03 | 0.07 | 0.01 | 0.08 | 0.01 | 0.42 | b.d. | b.d. | b.d. | 0.11 |
| 4B | 6.29 | 29.61 | 7.53 | 0.90 | 2.72 | 0.64 | 0.09 | 0.25 | 0.04 | 0.28 | 0.04 | 0.97 | b.d. | 0.29 | 0.87 | 0.31 |
| 5B | 0.74 | 2.76 | 0.52 | 0.07 | 0.29 | 0.20 | 0.04 | 0.09 | 0.02 | 0.11 | 0.02 | 0.36 | b.d. | 0.18 | b.d. | 0.13 |
| 6B | 0.53 | 1.91 | 0.31 | 0.04 | 0.17 | 0.15 | 0.03 | 0.08 | 0.02 | 0.10 | 0.01 | 0.44 | b.d. | b.d. | b.d. | 0.14 |
| 7B | 0.69 | 2.37 | 0.39 | 0.06 | 0.23 | 0.14 | 0.03 | 0.07 | 0.02 | 0.10 | 0.01 | 0.33 | b.d. | b.d. | b.d. | 0.14 |
| 8B | 1.15 | 4.47 | 0.83 | 0.11 | 0.38 | 0.20 | 0.04 | 0.09 | 0.02 | 0.12 | 0.02 | 0.43 | b.d. | 0.11 | 0.12 | 0.18 |
| 9B | 0.84 | 3.14 | 0.52 | 0.06 | 0.25 | 0.15 | 0.03 | 0.08 | 0.01 | 0.09 | 0.01 | 0.38 | b.d. | b.d. | 0.12 | 0.14 |
| 10B | 0.67 | 2.55 | 0.43 | 0.06 | 0.22 | 0.16 | 0.03 | 0.08 | 0.02 | 0.11 | 0.01 | 0.39 | b.d. | 0.01 | 0.09 | 0.18 |
| Max. | 8.34 | 39.17 | 9.87 | 1.19 | 3.72 | 0.77 | 0.10 | 0.27 | 0.04 | 0.28 | 0.04 | 0.97 | 0.09 | 0.50 | 1.16 | 0.32 |
| Min. | 0.52 | 1.87 | 0.30 | 0.04 | 0.17 | 0.11 | 0.02 | 0.06 | 0.01 | 0.07 | 0.01 | 0.29 | b.d. | b.d. | b.d. | 0.11 |
| Ave. | 1.51 | 6.42 | 1.36 | 0.17 | 0.56 | 0.22 | 0.04 | 0.10 | 0.02 | 0.13 | 0.02 | 0.45 | 0.04 | 0.16 | 0.27 | 0.17 |
| St. Dv. | 2.04 | 9.83 | 2.55 | 0.30 | 0.93 | 0.17 | 0.02 | 0.06 | 0.01 | 0.06 | 0.01 | 0.17 | 0.03 | 0.13 | 0.38 | 0.06 |
© 2020 by the authors. Licensee MDPI, Basel, Switzerland. This article is an open access article distributed under the terms and conditions of the Creative Commons Attribution (CC BY) license (http://creativecommons.org/licenses/by/4.0/).
Share and Cite
Lindeman, C.; Oglesbee, T.; McLeod, C.; Krekeler, M.P.S. Mineralogy and Geochemistry of the Kinnikinic Quartzite at the Arco Hills Silica and Gold Project in Butte County, Idaho: Results of an Ore Quality Spot Check and Implications for Potential Plasma Furnace Processing. Minerals 2020, 10, 523. https://doi.org/10.3390/min10060523
Lindeman C, Oglesbee T, McLeod C, Krekeler MPS. Mineralogy and Geochemistry of the Kinnikinic Quartzite at the Arco Hills Silica and Gold Project in Butte County, Idaho: Results of an Ore Quality Spot Check and Implications for Potential Plasma Furnace Processing. Minerals. 2020; 10(6):523. https://doi.org/10.3390/min10060523
Chicago/Turabian StyleLindeman, Carter, Traister Oglesbee, Claire McLeod, and Mark P.S. Krekeler. 2020. "Mineralogy and Geochemistry of the Kinnikinic Quartzite at the Arco Hills Silica and Gold Project in Butte County, Idaho: Results of an Ore Quality Spot Check and Implications for Potential Plasma Furnace Processing" Minerals 10, no. 6: 523. https://doi.org/10.3390/min10060523