Article

Coexisting Rubies and Blue Sapphires from Major World Deposits: A Brief Review of Their Mineralogical Properties

Gemological Institute of America, 5355 Armada Drive, Carlsbad, CA 92008, USA
Minerals 2020, 10(5), 472; https://doi.org/10.3390/min10050472
Submission received: 3 March 2020 / Revised: 14 May 2020 / Accepted: 19 May 2020 / Published: 22 May 2020
(This article belongs to the Special Issue Mineralogy and Geochemistry of Ruby)

Abstract

:
Gem corundum deposits are typically divided into blue sapphire and ruby deposits. However, this classification often overlooks the fact that the precious stones produced are the same mineral with only an overall slight difference in their trace element profiles. It can take only a couple thousand ppm chromium to create the rich, red color expected of a ruby. This contribution deals specifically with economically important gem corundum mining regions that produce both blue sapphires and rubies either in comparable quantities (Mogok, Myanmar, and the basalt-related gem fields on the border between Thailand and Cambodia at Chanthaburi, Thailand, and Pailin, Cambodia) or predominantly blue sapphires with rare rubies (secondary Montana sapphire deposits and Yogo Gulch in Montana as well as the gem fields of Sri Lanka). Comparison of the trace element profiles and inclusions in the blue sapphire/ruby assemblages in these deposits shows that there are both monogenetic and polygenetic assemblages in which the blue sapphires and rubies have the same geological origin (monogenetic) or distinct geological origins (polygenetic). In the monogenetic assemblages, the rubies and blue sapphires have essentially indistinguishable inclusions and trace element chemistry profiles (with the exception of Cr contents). On the other hand, polygenetic assemblages are composed of rubies and blue sapphires with distinct inclusions and trace element chemistry profiles. Notably, in the monogenetic assemblages, chromium seems to vary independently from other trace elements. In these assemblages, Cr can vary by nearly four orders of magnitude with essentially no consistent relationship to other trace elements. The observations described herein are an attempt to address the question of what the geochemical and geological constraints are that turn gem corundum into a spectacular ruby.

1. Introduction

In the gemological world we often speak of the “big three”, the three high-value gems that dominate the colored stone market: ruby, sapphire, and emerald (at least in the western world, in much of Asia, jade is the most important gem). Two of the big three, ruby and sapphire, are the same mineral species, corundum, and this special issue is wholly devoted to ruby, the red variety of the mineral corundum. Although they are the same mineralogical species with essentially the same chemical makeup (generally >98 wt% Al2O3), rubies with a vivid, deep red saturated color can be far more desirable than almost any vividly colored blue sapphire.
In our silica-rich Earth, corundum (α-Al2O3) is not the easiest mineral to form as any excess alumina tends to react with silica and other components such as alkalis to form other alumina-rich minerals such as feldspars and micas. Corundum therefore forms in a limited range of P-T-x environments (including silica undersaturation), and the number of possible ways in which gem-quality corundum can form is even narrower [1,2]. The geological conditions of formation have imparted some gem corundum with a sufficient quantity of the red-coloring agent chromium to pass as a ruby, while some gem corundum is colored by iron and titanium, which impart the blue color seen in sapphires. In fact, considering the geology of the major ruby and sapphire deposits in the world, at first glance it seems to make sense. In metamorphic terranes, rubies often form in marbles derived from platform carbonates. While the exact mechanisms of formation may not be entirely understood, it has been suggested that molten evaporate salts enabled mobilization of chromium and aluminum that enabled crystallization of Cr-rich corundum [3,4]. In contrast, metamorphic blue sapphires typically form in settings where a deficiency in chromium is expected, such as from the interaction between syenitic pegmatites and high-grade metamorphic rocks (Mogok, Myanmar) or from amphibolite or granulite facies gneisses (Sri Lanka and Madagascar) [1,5].
This contribution will focus on specific gemstone deposits from major gem producing regions around the world which are known for producing both blue sapphires and rubies. This contribution focuses on gem deposits from major gem producing regions. The deposits included are Mogok, Myanmar; Chanthaburi, Thailand; Pailin, Cambodia; Montana, USA; and various gem deposits in Sri Lanka. The gemological properties of the blue sapphires and rubies from these deposits will be described, especially their inclusions and trace element chemistry, with the intent of determining the relationships (if any) between these two varieties of gem corundum and to help understand the possible controls on the geochemical behavior of chromium in the specific formation situation of gem corundum.

2. Materials and Methods

The samples dominantly were derived from the Gemological Institute of America’s (GIA) Colored Stone Reference Collection, which was built up over more than 10 years through the GIA Field Gemology program [6]. This was supplemented, especially for the Montana sapphires, by samples provided by several trusted contacts who have worked extensively in the sapphire mining areas of Montana including Richard B. Berg from the Montana Bureau of Mines and Geology, John Emmett, a consultant with GIA, Jeff Hapeman, a gem dealer with Earth’s Treasury, and Will Heierman, a gem dealer who has worked with many of the sapphire miners in Montana. The sample set is comprised of 17 Thai/Cambodian rubies, 28 Thai/Cambodian blue sapphires, 18 Sri Lankan rubies, 17 Sri Lankan pink sapphires, 61 Sri Lankan blue sapphires, 43 rubies from Mogok, Myanmar, 143 blue sapphires from Mogok, Myanmar, 16 secondary Montana rubies, 6 secondary Montana pink sapphires, 52 secondary Montana blue sapphires, 8 Yogo, Montana rubies, 9 Yogo, Montana violet sapphires, and 18 Yogo, Montana blue sapphires. Essentially all the samples in this reference collection were collected from secondary alluvial or elluvial deposits which were weathered from primary, hard rock deposits. The main exception is the Yogo sapphires and rubies, which are derived from a primary deposit.
Laser ablation inductively coupled plasma mass spectrometry (LA-ICP-MS) analyses were conducted using a Thermo Scientific iCap-Q ICP-MS (Thermo Fisher Scientific, Waltham, MA, USA) with plasma RF power of 1400 W coupled with a New Wave Research UP-213 laser ablation (New Wave Research, Inc, Bozeman, MT, USA) unit with a frequency-quintupled Nd:YAG laser (213 nm wavelength with 4 ns pulse width). Laser conditions consisted of a 55 µm diameter spot size, a fluence of 10 ± 1 J/cm2, and a 15 Hz repetition rate using NIST 610 and 612 glasses as external standards and 27Al as an internal standard with a defined value of 529,250 ppm Al. Accuracy of the measurements on the standard reference materials is generally within 5% to 20%. On longer runs lasting more than 2 h, one of the standards was run again as an unknown as a quality control measure to ensure instrument drift was kept at an acceptable level by ensuring that a standard reference material could be measured within 15% of its known values for the relevant elements. The analyses reported here were carried out over the course of several years in the lab at the GIA, and so the detection limits varied over the course of data collection. However, general ranges for detection limits are 0.1–0.3 ppm Mg, 1.2–4.7 ppm Ti, 0.1–0.5 ppm V, 1.3–5.1 ppm Cr, 13.7–54.8 ppm Fe, and 0.1–0.2 ppm Ga. Detection limits were calculated according to the method of Longerich et al. [7]. Each stone was typically analyzed in three spots, but sometimes, up to 12 spots were obtained if there was significant color zoning or regions with clouds of microscopic inclusions that were targeted to get a statistically significant representation of chemical heterogeneity in these stones.
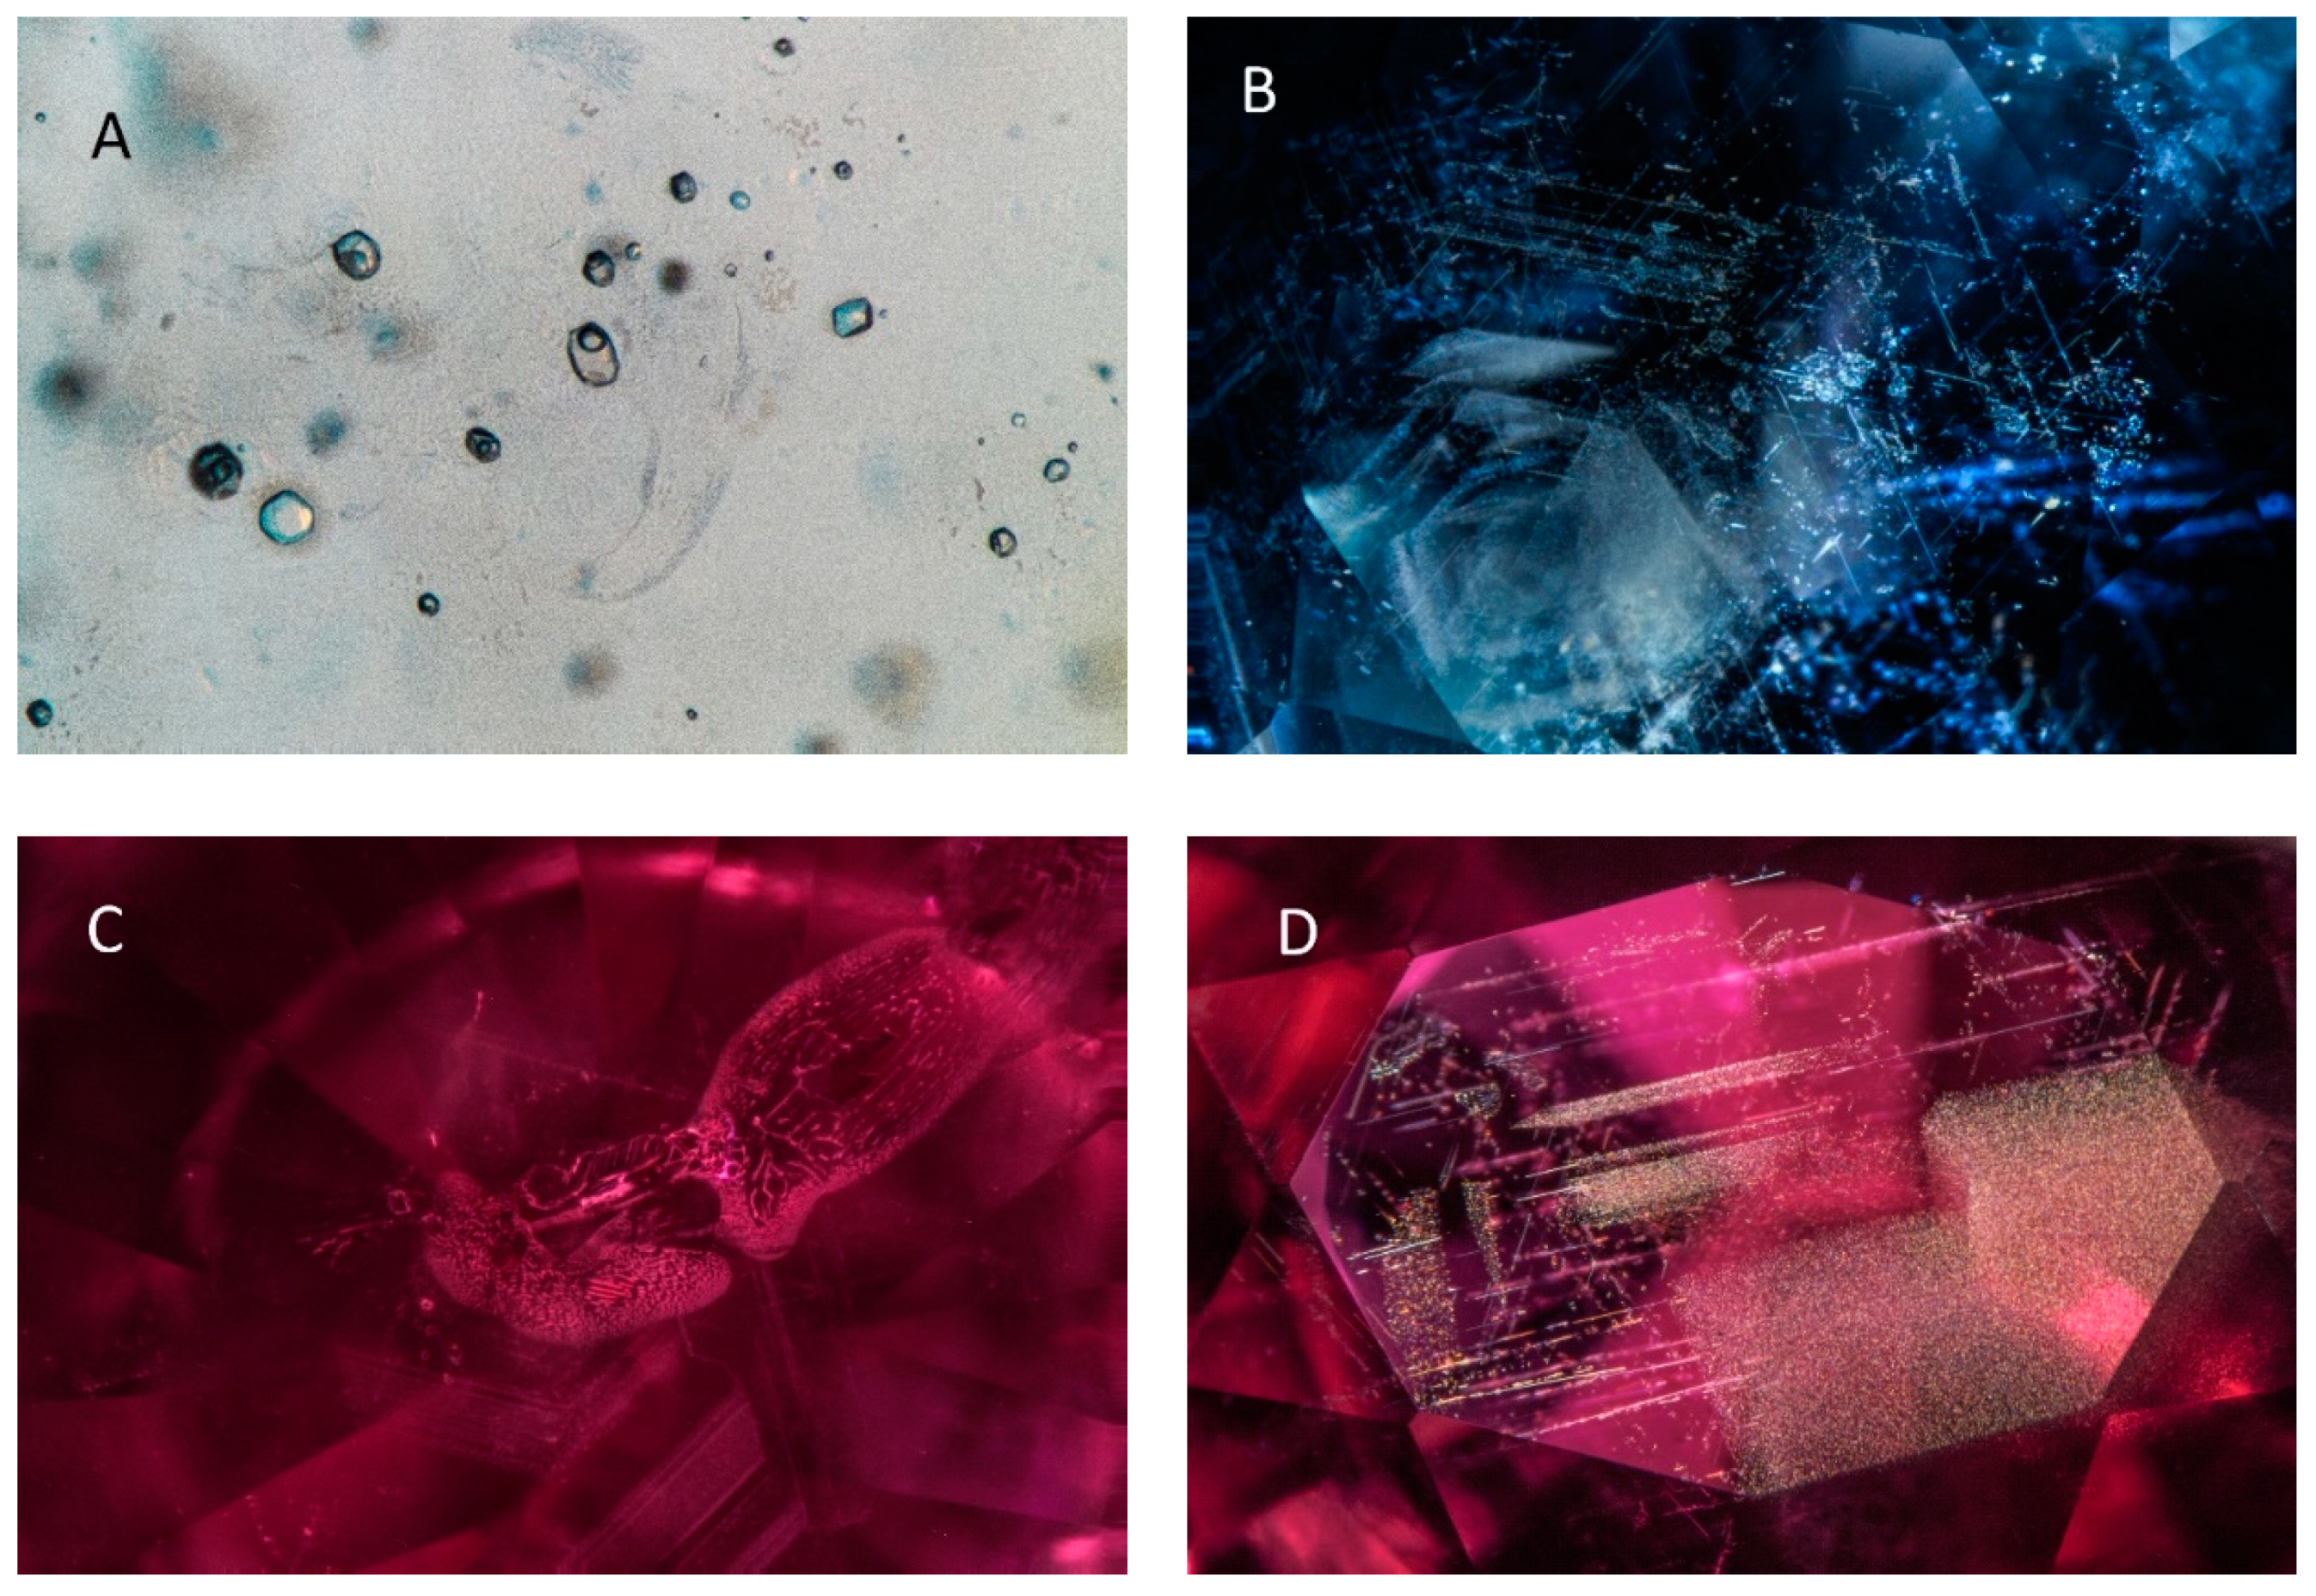
When possible, mineral inclusions were identified using Raman spectroscopy with a Renishaw inVia Raman microscope system. The Raman spectra of the inclusions were excited using a Stellar-REN Modu Ar-ion laser producing highly polarized light at 514 nm and collected at a nominal resolution of 3 cm−1 in the 2000–200 cm−1 range. Each spectrum was comprised of three accumulations at 20× or 50× magnification. In many cases, the confocal capabilities of the Raman system allowed inclusions beneath the surface to be analyzed. Several other stones were polished to expose the inclusion to the surface.

3. Results

3.1. Thai/Cambodian Rubies and Sapphires

Rubies and sapphires have been recovered from river gravels and secondary alluvial and elluvial deposits near the present-day Thai/Cambodian border near Chanthaburi, Thailand, and Pailin, Cambodia, for at least 200 years. During the mid to late 20th century, as ruby supplies from Mogok, Myanmar, started to dwindle due to political problems, Thai rubies and sapphires came to dominate the market and supplied much of the gem corundum bought and sold in the world at that time [8]. Currently, much of the deposit is exhausted, although some small operations are still producing gem corundum. While found in secondary gravels, the rubies and sapphires were derived from alkali basalt flows in the area in which the gem corundum was brought up as xenocrysts within the lavas [9,10,11,12]. Unfortunately, the specific geologic origin of the Thai/Cambodian rubies and sapphires is not yet precisely understood. Note, while there are several gem corundum deposits distributed throughout Thailand and Cambodia including Kanchanaburi, Thailand, and Ratanakiri, Cambodia, in this contribution we focus only on the gem fields of Chanthaburi, Thailand, and Pailin, Cambodia, which was the most important producer of gem corundum. Further, the gem fields where gem corundum is found straddle the border between these two countries and can effectively be considered one single deposit. This is corroborated by the similarities in the gemological properties of the stones found on both sides of the Thai/Cambodian border [8,9,10,11,12,13,14,15].
The Thai/Cambodian rubies are presumed to have been derived from some (ultra)mafic or basic host rocks, which is supported by the mineral inclusions in the rubies such as clinopyroxenes, Mg-Fe-Ca-rich garnets, and rare sapphirine inclusions [9,12,13]. Often these results have been interpreted to support a model of ruby formation through high-temperature, high-pressure metamorphism of (ultra)mafic rocks and subsequent transport to the surface when the alkali basalts passed through these ruby-bearing formations. On the other hand, [14] studied melt inclusions in the Thai/Cambodian rubies and compared them to melt inclusions found in Yogo sapphires from Montana, USA. From their results they suggested the formation of the Thai/Cambodian rubies through a peritectic melting reaction when the alkali basaltic magma passed through mafic or basic igneous rocks and partially melted them, forming the corundum and simultaneously transporting it to the surface.
Blue sapphires from Chanthaburi, Thailand, and Pailin, Cambodia, share many properties with other blue-green-yellow (BGY) sapphires from alkali basalts as in Australia, China, Nigeria, and Ethiopia among others [8,15]. Their inclusions indicate a different geological source from the Thai/Cambodia rubies and include Na/K-rich feldspars, pyrochlores, ferrocolumbite, zircon, and uraninite [15,16]. Together with the dominantly Na/K-rich, moderately silica-rich melt inclusions found in these sapphires, this suggests their derivation from syenitic-type rocks possibly with some contribution from a carbonatite or CO2-rich component [15,16]. It should be noted that there are some general differences in some blue sapphires from Chanthaburi, Thailand, and Pailin, Cambodia, with hexagonal milky banding occurring more frequently in Pailin, Cambodia, stones. On the other hand, Chanthaburi, Thailand, sapphires do not generally exhibit this milky banding but tend to have denser, more coarse rutile silk. However, there are enough overall similarities in their trace element chemistry and solid inclusions to consider them as one general group here.
The difference in the geologic source of the Thai/Cambodian rubies and sapphires is obvious when examining the range of their trace element profiles (Figure 1 and Table 1). While both the rubies and sapphires are characterized by relatively high iron contents (average of 4030.5 and 2505.5 ppm, respectively) and similar ranges of titanium (94.2 and 127.9 ppm, respectively) and vanadium (18.5 and 19.9 ppm, respectively), all the other trace elements are significantly different. Mg and Cr are enriched in the rubies while Ga is significantly enriched in the sapphires. The differences are still more obvious when observing plots of the trace element patterns for the Thai/Cambodian rubies and sapphires (Figure 2).
The relationships between the trace elements in Thai/Cambodian sapphires and rubies can be further elucidated by investigating the correlation matrices for the trace elements in these stones (Table 2 and Table 3). The rubies and sapphires are considered separately in these correlation matrices given the obvious wide disparity in their trace element profiles. There is only weak positive correlation between any of the trace elements for the sapphires (Table 2). At most there is a slight positive correlation between some of the trivalent cations (V3+, Cr3+ and Ga3+). However, these three elements show negative correlation with Fe which is especially pronounced for V3+. The Thai/Cambodian rubies show strong positive correlation between Mg, Ti, and V (Table 3). Cr shows weak positive correlation with Mg and negative correlation with Ga but no other significant correlations.
Additionally, Thai/Cambodian rubies and sapphires can easily be distinguished through microscopic observation of their inclusions (Figure 2A–D). While mineral inclusions of feldspars and pyrochlores may give an indication of the sapphires’ geologic origin, they are actually quite uncommon in these gems. Generally, the most common inclusion in the blue sapphires is coarse rutile silk usually concentrated in hexagonal, angular bands but often with elongate rutile needles that can extend beyond individual growth zones (Figure 2A,B). In Cambodian sapphires, milky clouds are often seen, which are arranged in hexagonal growth zones. These milky clouds are composed of minute inclusions that cannot be individually identified microscopically but are presumed to be nano-sized inclusions of rutile or other oxides. In contrast, Thai/Cambodian rubies never have inclusions of rutile silk or milky clouds. These rubies often have few inclusions, however, the most common inclusions are melt inclusions or other crystalline inclusions with angular decrepitation haloes (Figure 2C,D). Sometimes, twinning planes with boehmite filling in the tubular intersections between adjacent twinned sectors also occur. While melt inclusions have been identified in both the rubies and sapphires, Electron Probe Microanalysis (EPMA) analyses of these inclusions (when polished to the surface) indicate the melts related to the formation of the rubies and sapphires are chemically distinct, with those occurring in the rubies being more Ca-rich and generally K-deficient, while those in the sapphires are generally Ca-poor and Na- and/or K-rich [14,17].

3.2. Rubies and Sapphires from Myanmar, Mogok

Mogok, or the fabled “Ruby Land”, in Myanmar (formerly Burma) has been the world’s preeminent source of fine rubies for at least 800 years. Mogok also produces significant quantities of fine blue sapphires as well. While production of fine rubies and sapphires has decreased in modern times, these gems still hold the allure and romance associated with the legendary gems from Myanmar. The gem deposits lie in the Mogok Metamorphic Belt, which was produced during the collision of the Indian plate with Eurasia. Mogok rubies are found in high-grade, relatively pure marbles and are interpreted to have formed from molten evaporite salt lenses that mobilized and crystallized alumina and chromium needed to form rubies [3,4]. The genesis of the sapphires is less well understood. However, the blue sapphires are known to be associated with intrusions of syenitic pegmatites into gneisses and other metamorphic rocks and are presumed to have formed through interaction between the alkaline igneous bodies and the metamorphic rocks into which they intruded.
Just as with the Thai/Cambodian stones, the difference in the geologic source formations for Mogok rubies and sapphires is well illustrated by studying their trace element patterns (Figure 3 and Table 4). However, the differences are not as dramatic as for the Thai/Cambodian stones. Generally, Mg and Ti have similar concentrations in the sapphires (average of 49.3 ppm and 125.5 ppm, respectively) and rubies (average of 46.4 ppm and 100.8 ppm, respectively), although the sapphires have wider extremes in their maximum and minimum values. However, the sapphires have much higher Fe concentrations (average of 2133.8 ppm) and slightly higher average Ga contents (average of 82.1 ppm) than the rubies (averages of 69.9 and 57.4 ppm for Fe and Ga, respectively). On the other hand, V and Cr are both much higher in the rubies (averages of 433.6 ppm and 2962.5 ppm, respectively) than the sapphires (averages of 15.1 ppm and 30.7 ppm, respectively). These different ranges in trace element chemistry are more easily seen graphically, where a Fe vs. Cr plot can clearly separate the rubies and sapphires, while plots involving Cr, Fe, and/or Ga show their distinct ranges despite the small overlap in some cases (Figure 3). On the other hand, plots involving Mg or Ti generally show the two materials to be overlapping (Figure 3).
Some additional insights into the relationship between the various trace elements can be found by looking at correlation matrices for the trace elements in the Mogok blue sapphires and rubies (Table 5 and Table 6). For Mogok blue sapphires, the strongest positive correlations are between Ti-Mg and Cr-V, and correlations between any other elements are weak. For Mogok rubies, Ti and Mg have very strong positive correlations, and there are weaker positive correlations between Fe and both Ti and Mg as well as with V and both Ti and Mg. For both the Mogok rubies and blue sapphires, Cr only shows significant positive correlation with V and weak correlation with all other elements.
Similarly to the case of Thai/Cambodian stones, the differences in geological origin between the Mogok rubies and sapphires can be discerned from their inclusions (Figure 4A–D). Rounded grains of carbonate minerals, apatite, and sulfide minerals are somewhat common in Mogok rubies, while feldspars and zircons and sometimes calcite are occasionally found in the blue sapphires. Mogok rubies are often distinguished by their short, reflective platelet rutile inclusions that can produce vivid interference colors when illuminated with an intense fiber optic light (Figure 4C). However, similar types of inclusions can be seen in the Mogok sapphires (Figure 4A). Longer, non-reflective rutile silk can be found in both types of stones, although it tends to occur in more of a “nested” intergrown arrangement in the rubies (Figure 4D) and is generally more dispersed or arranged in linear or angular bands in some cases in the sapphires. However, the sapphires are frequently characterized by the presence of polysynthetic twinning (Figure 4B).

3.3. Secondary Montana Blue Sapphires and Rubies

Sapphires have been mined in Montana since the late 19th century when early prospectors found the dense gem-quality stones amongst the gravels they were working for gold. The two major deposits are at Rock Creek and a stretch of gravel bars along the Missouri River near the capital city of Helena. Note, the sapphires produced at the primary deposit in Yogo Gulch, Montana, are not considered along with the secondary Montana sapphires but will be discussed in the next section. Sapphires at both Rock Creek and the Missouri River are gemologically very similar in terms of their general color range, inclusions, and trace element chemistry. Geologically, the sapphires in both localities are understood to have been transported to the surface through volcanic eruptions that transported the sapphires from deep within the Earth’s crust [18]. At Rock Creek, the volcanics are mostly rhyolitic in nature, while in the Missouri River deposit, sapphire-bearing basaltic trachyandesites have been identified as a potential source for the sapphires [18]. Chemically, the sapphires are classified as metamorphic based on their low Ga and Mg/Ga contents [19,20]. In contrast, [21] studied melt inclusions in these sapphires and suggested their origin through peritectic melting reactions during partial melting of lower crustal anorthosites or other basic/mafic rocks, possibly during intrusion of the volcanic formations that eventually transported the sapphires to the surface.
Secondary Montana sapphires are predominantly pastel blue and green with accompanying pink, lavender, yellow, and orange stones. Even rare red rubies have been produced from these deposits, although it is possible that many of these exceptional stones were tragically lost to the tailings piles, as they may have been mistaken for ordinary garnets [22,23]. While the production is dominated by blue and green sapphires, there does seem to be a fairly continuous variation in color from blue and green to pink to lavender to true red. The similarity of the blue and pink sapphires and red rubies is corroborated by their trace element profiles. Except for Cr and V, the ranges and averages of Mg, Ti, Fe and Ga concentrations are essentially the same across the entire color range from blue/green to pink to red (Table 7). Perhaps the most surprising aspect of this is that the trace elements Mg, Ti, Fe and Ga generally vary by one order of magnitude but always less than two orders of magnitude between the blue/green to pink sapphires to red rubies, while Cr varies by more than three orders of magnitude across the full color range. Examination of the trace element plots further explains these trends by showing that Cr concentrations vary continuously from the blue/green to pink sapphires to rubies with little to no variation in other trace elements (Figure 5), whereas trace element plots not involving Cr tend to show complete overlap among the entire range of colored gem corundum from these deposits (Figure 5).
Additional observations can be made about relationships between the various trace elements in the secondary Montana sapphires by investigating correlation matrices (Table 8 and Table 9). Table 8 shows the correlation matrix for the full dataset including blue and pink sapphires and rubies. However, since the high-Cr sample set is composed of only a few samples, there is a possibility that these few samples could skew the Cr correlations, so another correlation matrix is presented in Table 9 for only the blue and pink sapphires. The strongest correlation in both cases is between Ti and Mg. Iron appears to be positively correlated with Ti and Mg in both cases and with V and Cr with the full dataset, but the Fe-V and Fe-Cr correlations weaken or disappear when only the blue and pink sapphires are compared. Further, Cr shows moderate positive correlation with V and Ga. Finally, Ga shows positive correlation with the trivalent cations V, Cr and Fe and perhaps moderate correlation with Ti.
Observations of the inclusions in these stones suggest that there are no significant differences amongst the entire range of colors for these gem corundum (Figure 6A–D). Generally, inclusions in the secondary Montana sapphires include bands of coarse rutile silk involving short to long needles and reflective platelet-like inclusions (Figure 6B), inclusions of feldspar, rutile, garnet, apatite, zircon, and clinozoisite, as well as melt inclusions (Figure 6A). The same types of inclusions are seen in the pink sapphires and rubies. Melt inclusions have been analyzed only in the blue/green Montana sapphires so far, but their compositions have been interpreted to suggest the formation of these sapphires through partial melting of anorthosites or other calcic-feldspar-rich rocks [21].

3.4. Yogo Blue Sapphires and Rubies

The sapphires produced from Yogo Gulch, Montana, have some geological similarities with those from the secondary deposits at Rock Creek and Missouri River, and yet, gemologically they are quite distinct. While all the Montana sapphires share a similar geological genesis story of being transported from deep within the Earth to the surface by volcanic activity in the Cenozoic, the Yogo sapphires were transported by a unique volcanic formation, a ouachitite, which is a member of the lamprophyre family [14]. Additionally, the Yogo sapphires are easily distinguishable from the secondary Montana sapphires by their trace elements and inclusions. Specifically, the dominant internal characteristic of Yogo sapphires is their distinct lack of any acicular rutile silk, which is a nearly ubiquitous feature in the secondary Montana sapphires. Additionally, Yogo sapphires and the secondary Montana sapphires have relatively high Fe and low Ga contents. Magnesium and titanium are generally more enriched in the Yogo sapphires, which allows them to be distinguished from nearly all of the secondary Montana sapphires.
In contrast, Yogo sapphires generally have a much more restricted color range than the secondary Montana sapphires. Yogo Gulch is known for producing predominantly cornflower blue sapphires, although there is a continuous gradation in color into purple and rare purplish-red rubies. The trace element patterns of the Yogo blue and violet sapphires and rubies are strikingly similar except for their Cr concentrations (Table 10). The ranges and averages of Mg, Ti, Fe, and Ga are very similar, and even V has relatively little variation across the entire color range (Table 10). Graphically, this is seen more clearly by plotting essentially any of the trace elements against Cr, which shows an unbroken continuity as Cr concentrations increase, with almost no variation in any of the other trace elements (Figure 7). However, plotting any of the other trace elements against each other shows the blue and violet sapphires and rubies are essentially completely overlapping (Figure 7).
Further information about the relationships between the various trace elements in Yogo sapphires and rubies can be obtained by studying their correlation matrices (Table 11 and Table 12). As with the secondary Montana sapphires, the very high Cr range for stones from Yogo is comprised of only a few samples. With this uneven distribution of samples across the Cr range, there is a chance that the correlations reported between Cr and other elements are skewed. For this reason, we report two correlation matrices for both the full range of samples including rubies (Table 11) and another reduced sample set including only blue and violet sapphires (Table 12). The strongest positive correlation is between Mg and Ti, but there also appears to be strong positive correlation between V and both Mg and Ti. Chromium shows positive correlation with V in both datasets. When rubies are included, Cr shows positive correlation also with Mg, Ti, Fe, and possibly Ga; however, this disappears for Fe and Ga when rubies are removed, and it weakens for Mg and Ti. Additionally, Fe has weak correlation with Mg, Ti and V.
Generally speaking, gem corundum from Yogo tends to have very few inclusions, which makes it difficult to make microscopic observations on the inclusions within a statistically meaningful sample set for the rare red rubies. However, the small set of Yogo rubies we have been able to study appear to have similar inclusions to the purples and blues, including silicate and carbonatite melt inclusions, feldspars, and large, euhedral rutile inclusions. Melt inclusions have been analyzed in the Yogo sapphires and rubies and were found to be similar regardless of the color range [14].

3.5. Sri Lankan Blue Sapphires and Rubies

Sri Lanka was the ancient world’s preeminent source of blue sapphires, and the culture of blue sapphire mining is still important to this gem island. While the mines are generally not as productive as they may have been in the past, there is still steady production of blue sapphires, especially in the Elahera, Ratnapura, and Kataragama areas. Today Sri Lankan sapphires also have to compete with the massive production of stones coming from the relatively new deposits in Madagascar, where the blue sapphires produced can be very similar in their gemological properties to Sri Lankan blue sapphires. In Sri Lanka (as well as in Madagascar), the sapphires are considered to belong to the metamorphic group and to have been formed during regional metamorphism during the collision of east and west Gondwana during the Mozambique Orogeny, which lasted from about 750 to 450 Ma [1,2]. The host rock for the sapphires has not really been determined in most cases, but it is considered most likely that they formed from amphibolite or granulite facies metamorphic rocks [1].
The gem wealth of Sri Lanka does not stop at blue sapphires, and the color of gem corundum from Sri Lanka extends beyond just the blues. While blue sapphires are the most economically important, many other colors are produced including yellow and pink sapphires, orangy-pink or pinkish-orange so-called padparadscha sapphires, as well as uncommon rubies. In general, the blue and pink sapphires and rubies have similar averages and ranges for Mg, Ti, and Ga, while Fe tends to be enriched in the blue sapphires relative to the pink sapphires and rubies, although there is overlap in the lower Fe concentration range (Table 13). As expected, Cr increases steadily from the blue sapphires (average of 4.2 ppm) to pink sapphires (average of 131 ppm) to rubies (average of 1217 ppm). Vanadium follows a similar trend increasing from blue sapphires (average of 19.8 ppm) to pink sapphires (average of 49.1 ppm) to rubies (average of 68.8 ppm) as well (Figure 8). One trend that is particularly notable is the continuous increase in Cr contents from blue to pink sapphires to rubies with little to no variation in the other trace elements. When these stones are displayed in plots not involving Cr, there tends to be nearly complete overlap in their trace element ranges (except for the extension of the blue sapphires to the high Fe range).
Additional insight into the relationships between trace elements across the blue to pink sapphire to ruby range can be gained by studying correlation matrices between trace elements (Table 14). The strongest positive correlation is between Mg and Ti, but there is also strong correlation between V and both Mg and Ti. Chromium has a weak positive correlation with Mg but no correlations with any other elements. Both Fe and Ga show moderate positive correlation with Mg, Ti and V, but there is no correlation to a slightly negative correlation between Fe and Ga.
This similarity seen in trace element chemistry across the entire color range is also seen for these stones’ inclusions. Typical inclusions within Sri Lankan blue sapphires are biotite, elongate, continuous rutile silk, CO2 inclusions, elongate negative crystals, and sometimes short, reflective platelet-like silk that can show iridescent colors using an intense fiber optic light (Figure 9C,D). The pink sapphires and rubies generally contain very similar inclusions with elongate silk, biotite, elongate negative crystals, and short, reflective platelet-like silk (Figure 9A,B).

4. Discussion and Conclusions

As this special issue can attest, the investigation of the geological genesis of important gemstone deposits has become a serious scientific pursuit. Unfortunately, in many cases traditional geological studies are inadequate to understand the formation of gem corundum deposits. This is because most gem corundum is found in secondary deposits formed through millions of years of weathering, and hence, much of the traditional geological context is lost. Therefore, in order to understand these precious stones’ geological story, researchers must turn to clues taken from the stones’ inclusions, trace elements, and isotopes. Inclusions have been especially helpful in many cases especially the study of melt and mineral inclusions [14,21,24,25,26]. It can be challenging to build a full geologic model from inclusions that may sparsely populate the gem corundum and which may or may not be fully representative of the initial mineral/fluid assemblage in which the stones formed. However, often inclusions are the only available piece of evidence that can directly link the sapphires and rubies to their geological origins. Inclusion analysis has been useful to study other gemstones as well such as the use of diamond inclusions, which has vastly improved our understanding of the deep Earth [27,28].
In contrast, the path from trace element chemistry to geological origin is less well understood. Many previous studies have shown that trace element chemistry of gem corundum is controlled by geological origin [19,29,30,31]. However, there have been some documented cases where the trace element chemistry classification of stones from certain deposits does not agree with information of their geological origin from either their inclusions or geological field observations [14,21,28,32,33]. As described by these authors, while the existing chemical discrimination diagrams can be quite useful, in some cases, they do not always accurately predict geological origin. Even without these specific cases where the existing classification schemes break down, [15] suggested that even for the classical metamorphic and basalt-related blue sapphires, there is some degree of overlap in their trace element chemistry in the range of Fe and Ga concentrations, where the Fe and Ga are at the high end for metamorphic blue sapphires and at the low end for basalt-related blue sapphires.
When discussing the geological origins of gem corundum, rubies and blue sapphires are often considered separately [1], with the implication that the geological conditions for sufficient Cr-enrichment to form rubies must be significantly different from the geological conditions that would form low-Cr blue sapphires. The Thai/Cambodian rubies are considered to have formed from rocks that could have been Cr-enriched, while their blue sapphire counterparts likely formed from alkaline igneous rocks such as syenites that should not have been significantly enriched in Cr [11,15]. Some of the established trace element geological classification schemes utilize Cr as an essential discriminant between metamorphic and magmatic sapphires with the implication that Cr is expected to partition into corundum differently based on geological origin [34,35]. However, how far can this argument go before it breaks down? From the results presented above for gem corundum deposits that produce both rubies and blue sapphires within the same deposit, it is clear there are two types of coexisting blue sapphire/ruby assemblages: monogenetic and polygenetic assemblages.
The polygenetic assemblages are those in which rubies and blue sapphires clearly have different geological origins, and yet, the two geochemically and geologically distinct assemblages happen to occur in the same deposit. In the present work, this includes blue sapphires and rubies from Thailand/Cambodia as well as Mogok, Myanmar. It should be noted that this is not necessarily to say that the origin of the rubies and blue sapphires are completely unrelated. The rubies and blue sapphires in Chanthaburi, Thailand, and Pailin, Cambodia, were clearly transported to the surface by similar alkali basalts; however, the results above and work from other researchers indicate that these two varieties of gem corundum were derived from mineralogically and geochemically distinct environments [14,16,17,
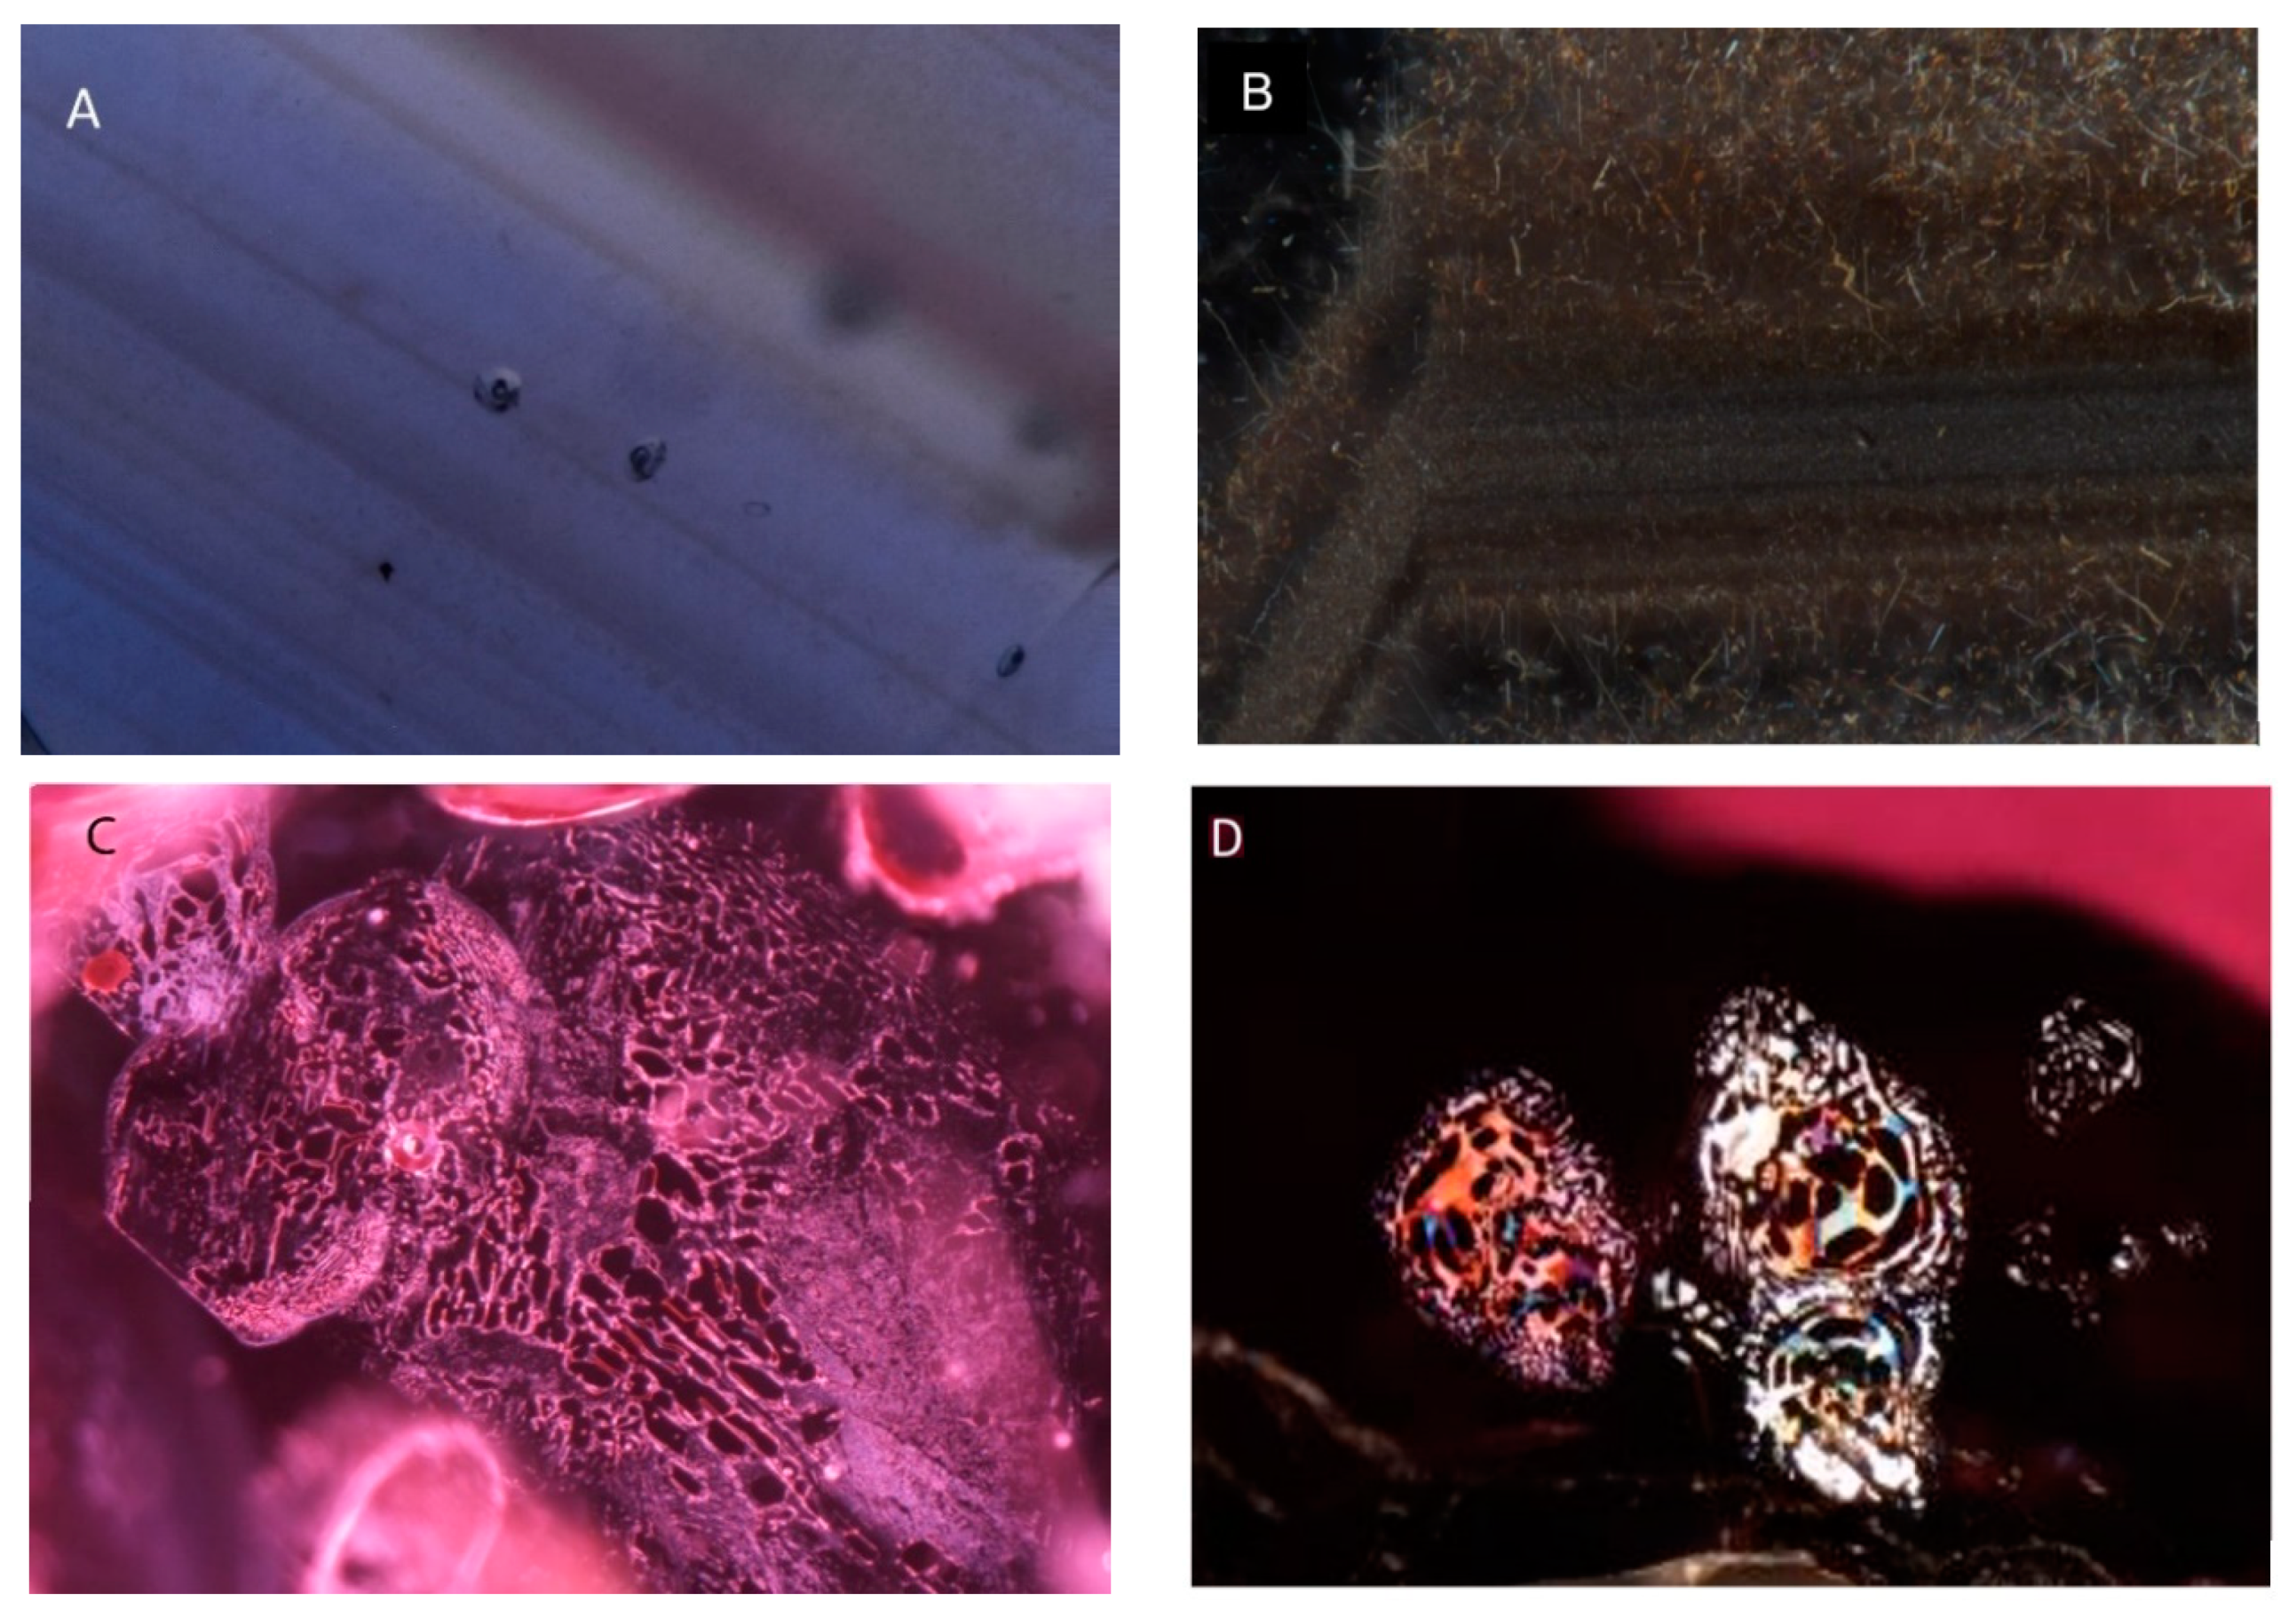
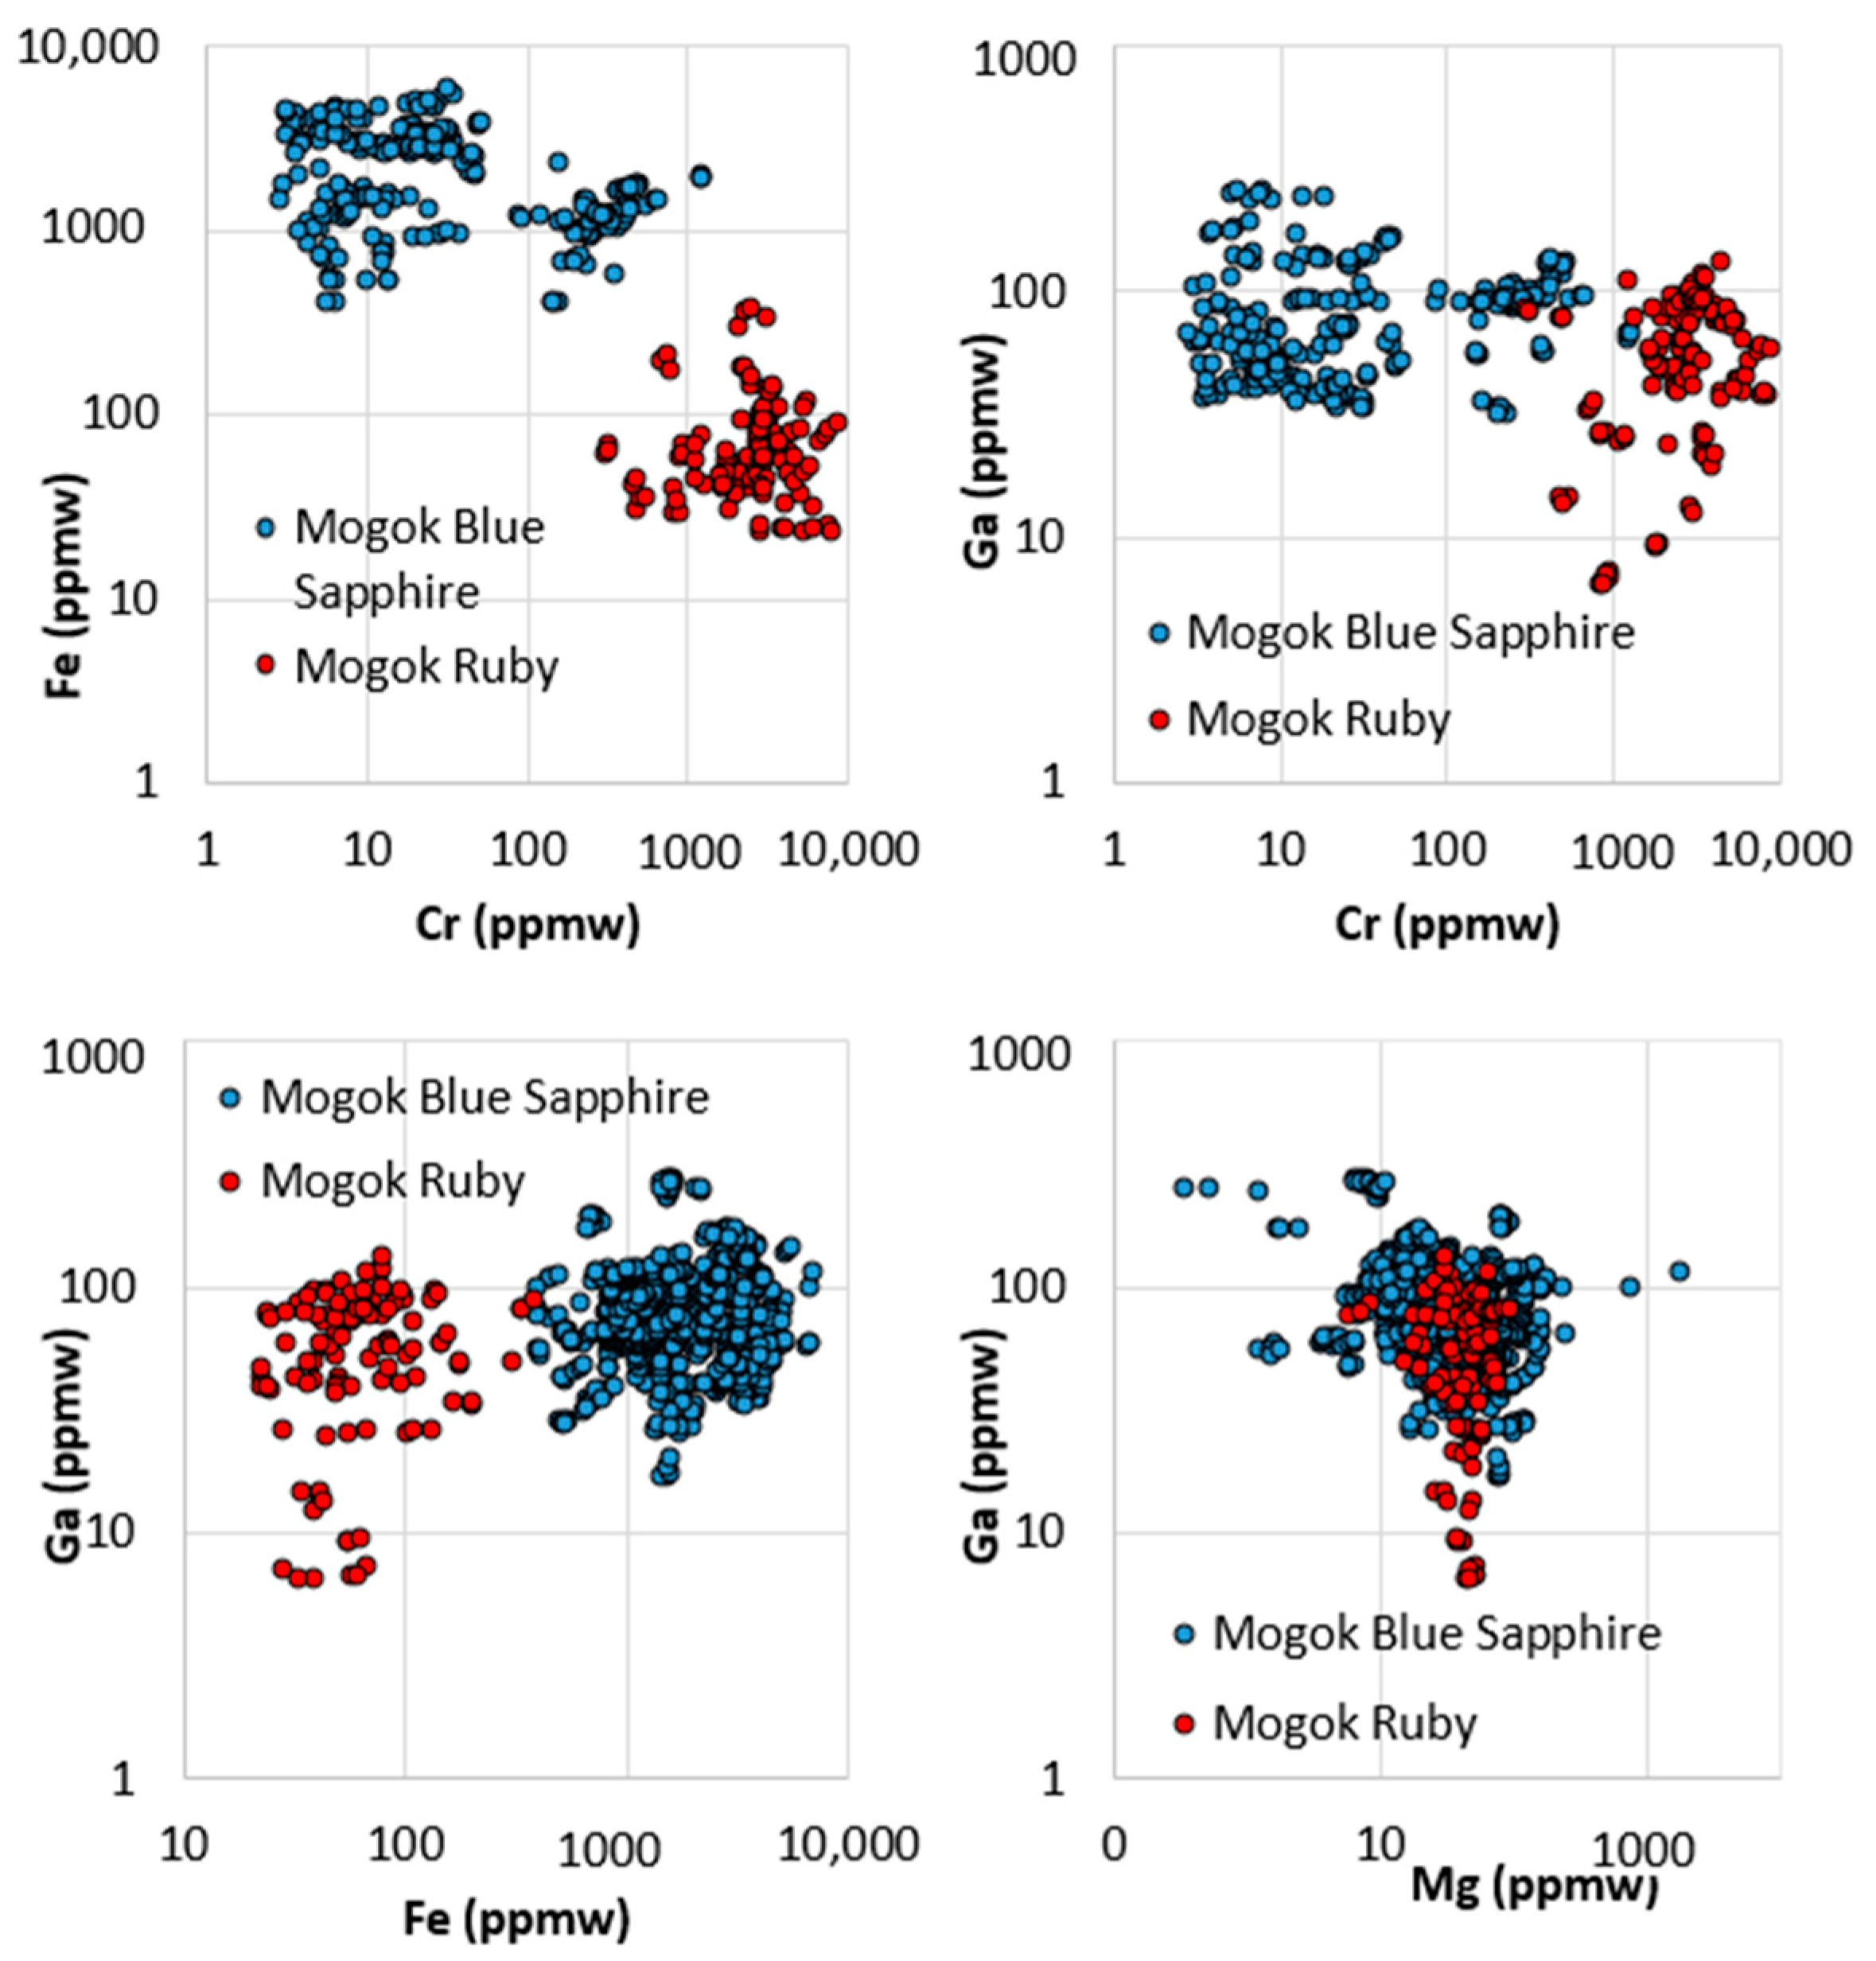
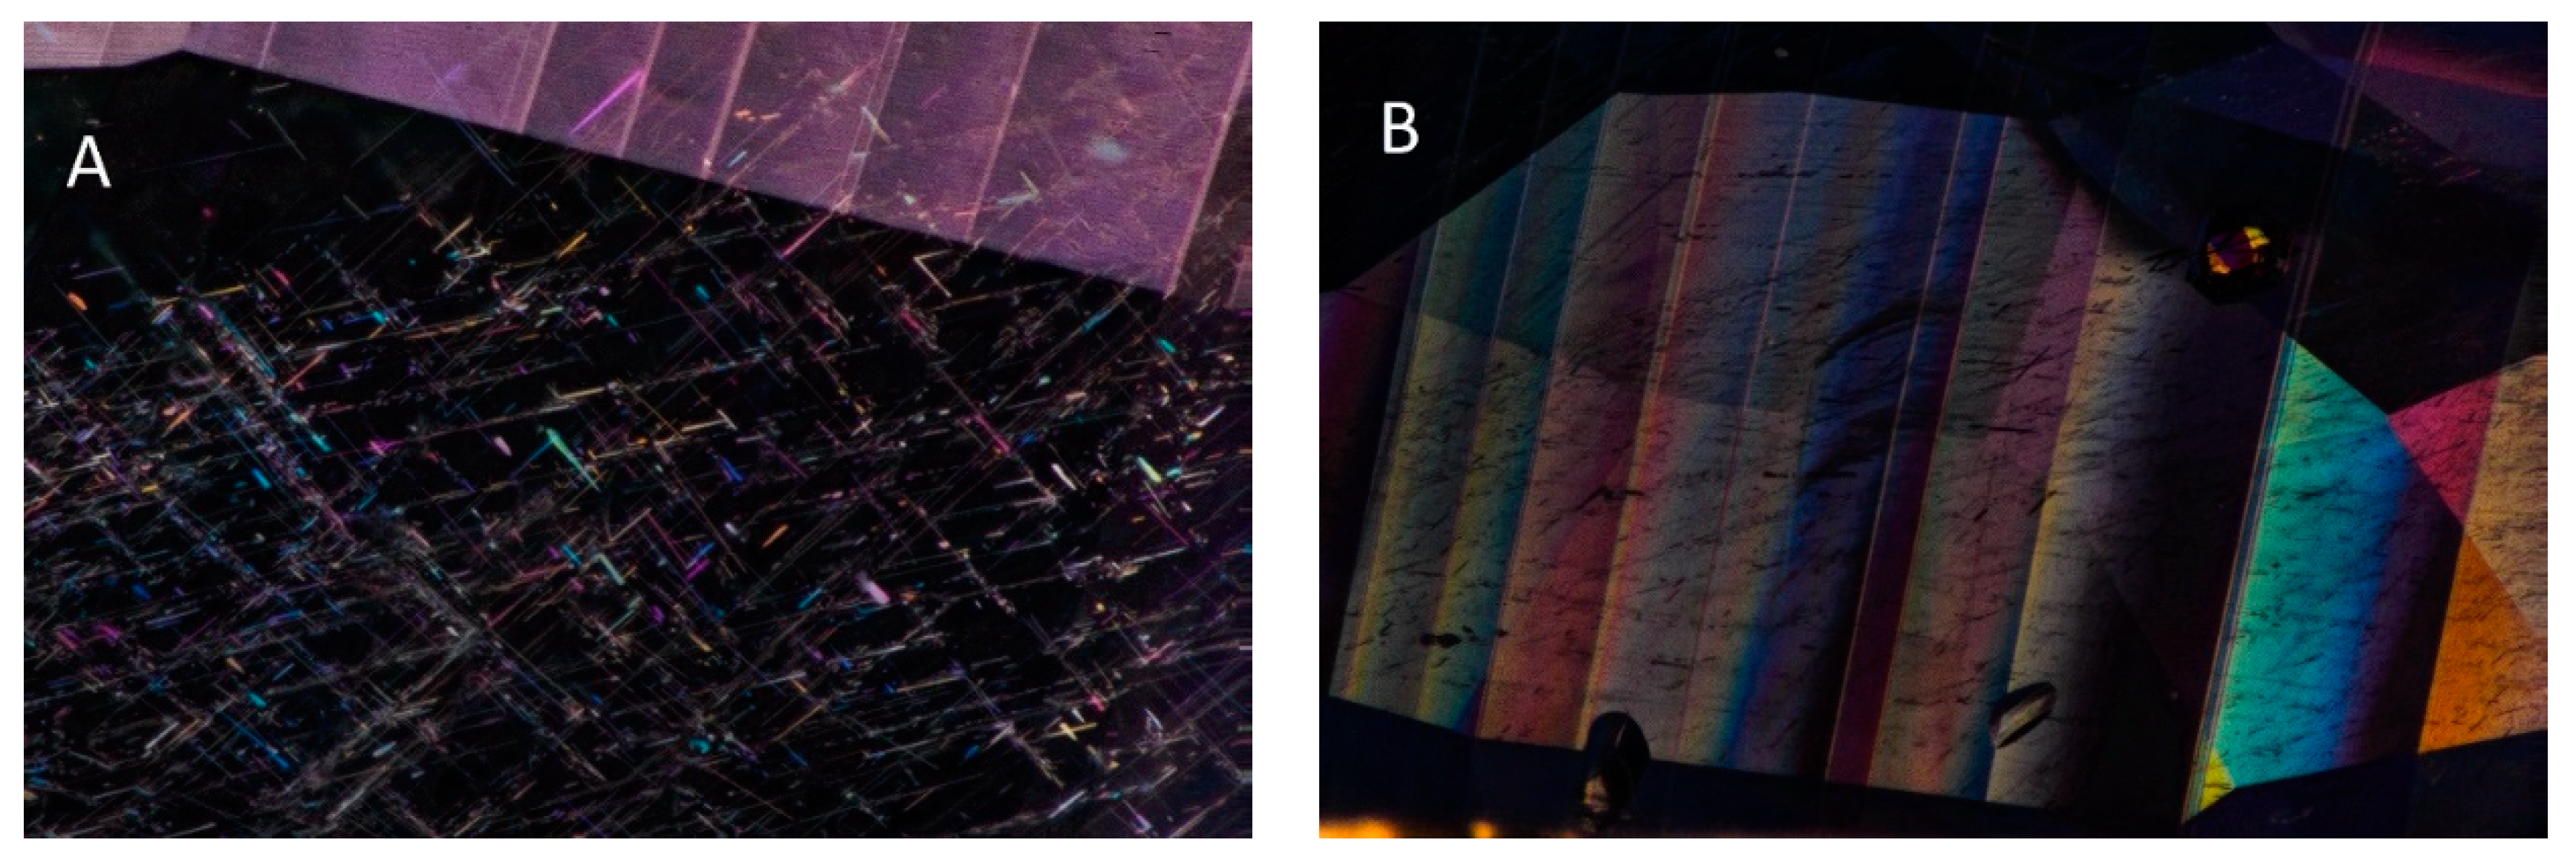
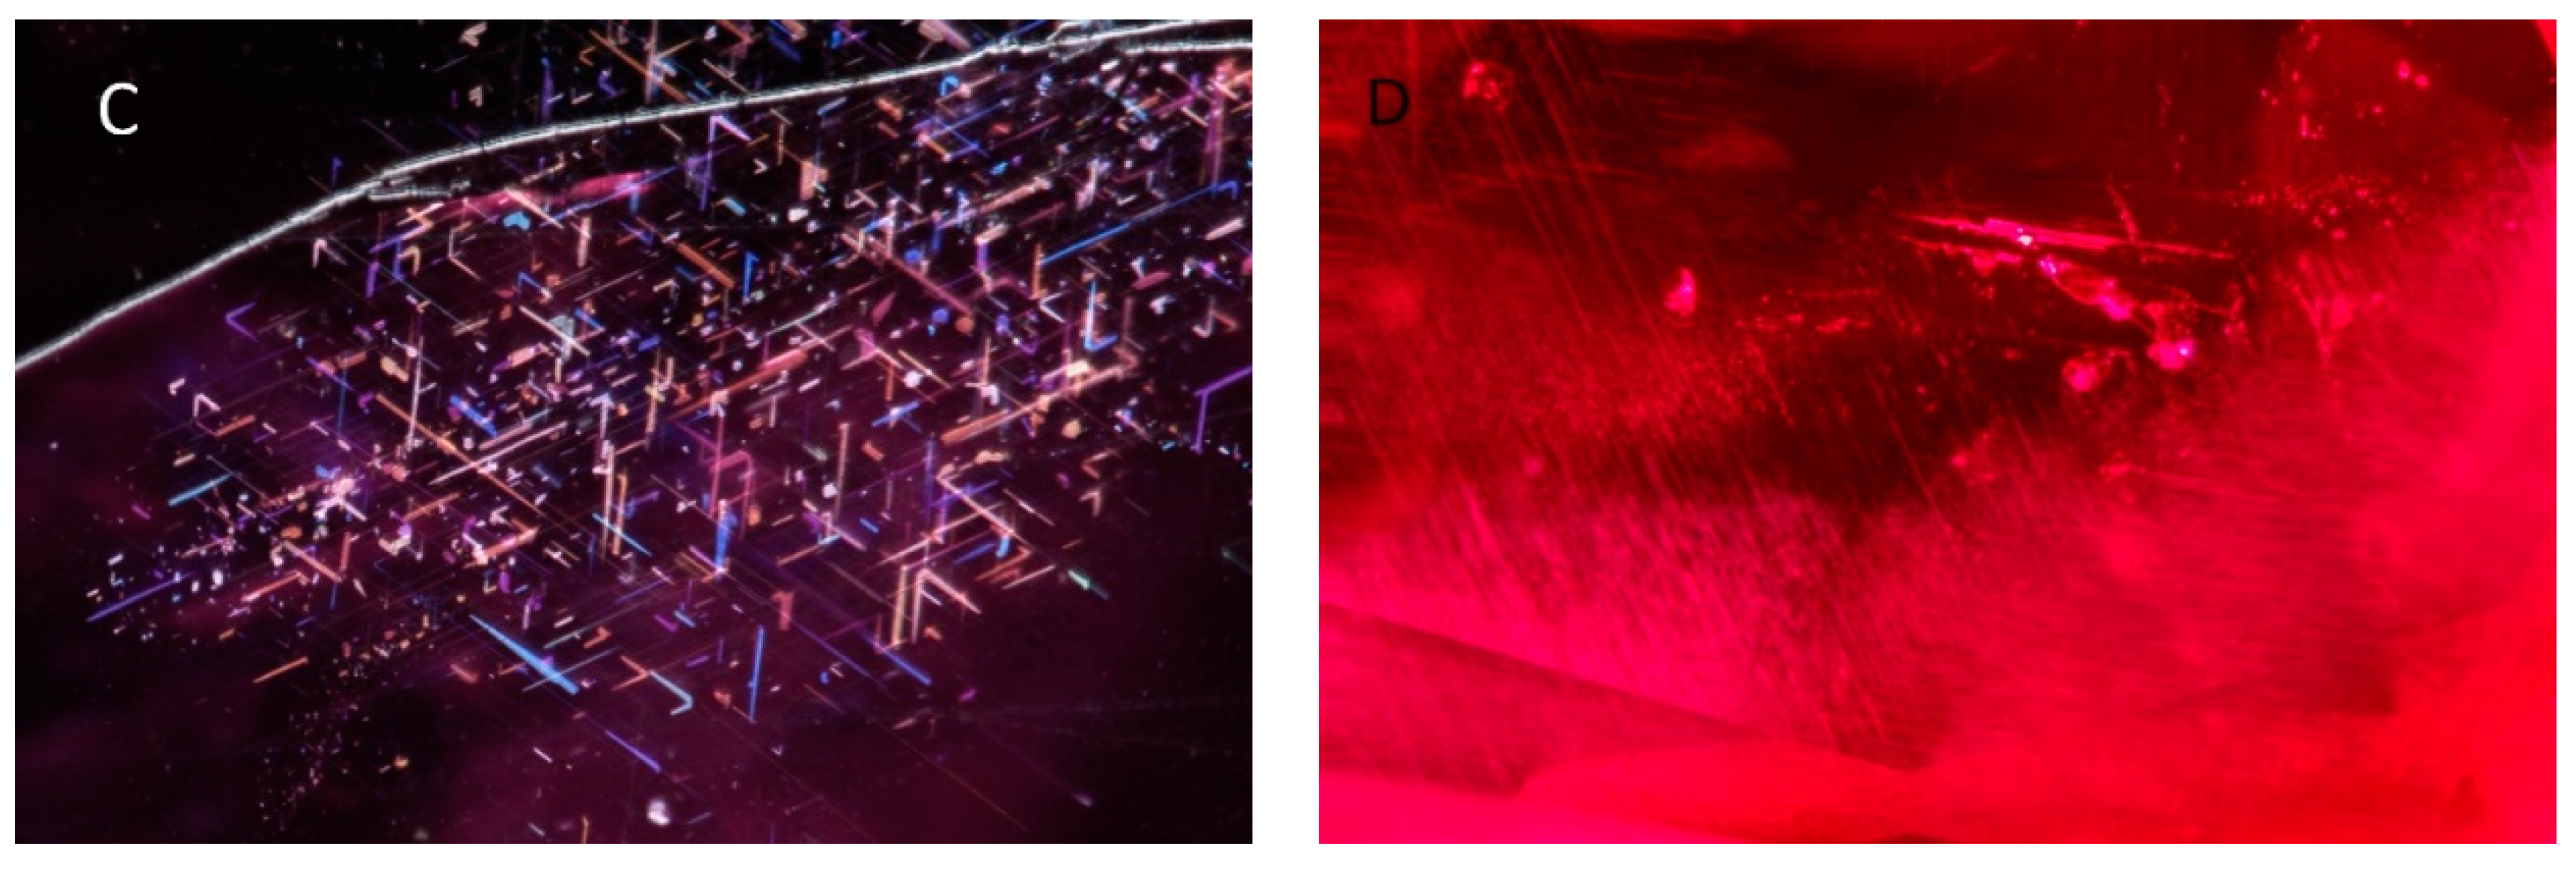
24]. Similarly, rubies and blue sapphires from Mogok, Myanmar, were both derived from regional metamorphism and/or igneous activity directly related to the Himalayan Orogeny, even if their specific modes of formation are distinct. Furthermore, while the rubies and sapphires from both the Thai/Cambodian and Mogok deposits are distinct in many of their properties, there are some similarities in their properties that tend to obscure the documented differences in their geological origins. For instance, although there are differences in their overall inclusions, the short reflective platelet-like silk, occasional long, slender rutile silk, and calcite mineral inclusions are common between the two types of stones. Additionally, for the sapphires and rubies from Mogok, Myanmar, while there are clear differences in their Fe contents, plots involving other elements such as Mg, Ti, and Ga tend to show nearly complete overlap in their compositions.
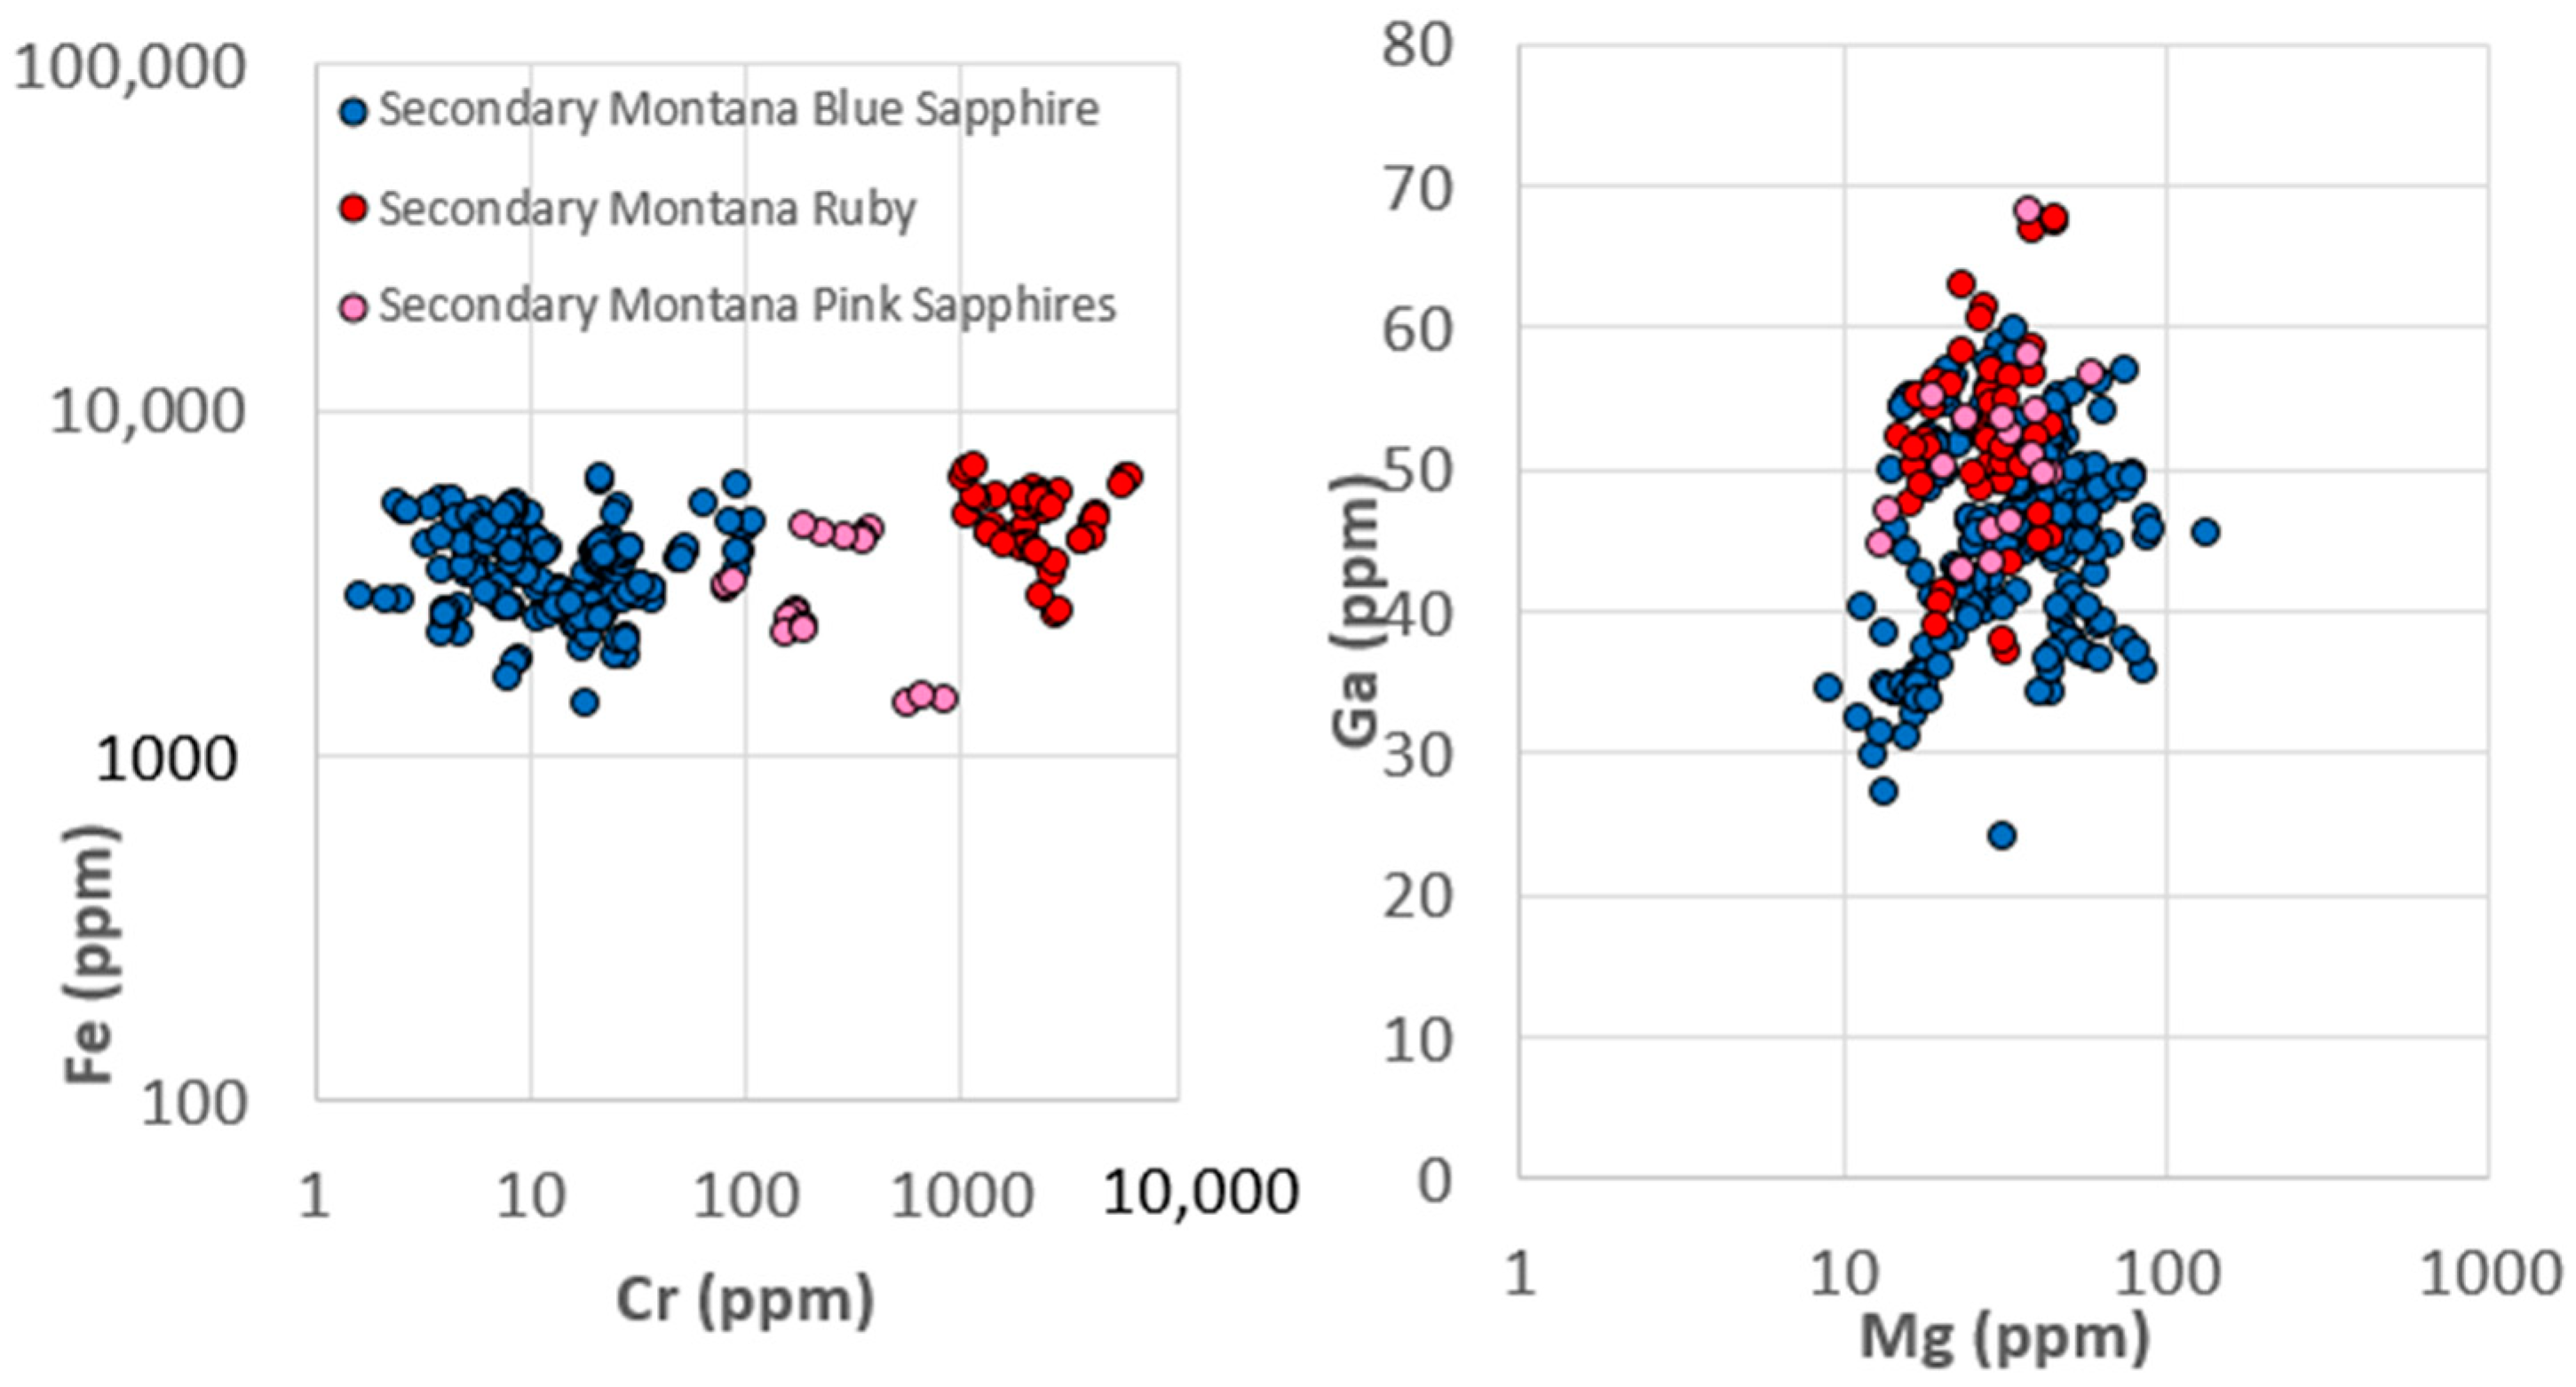
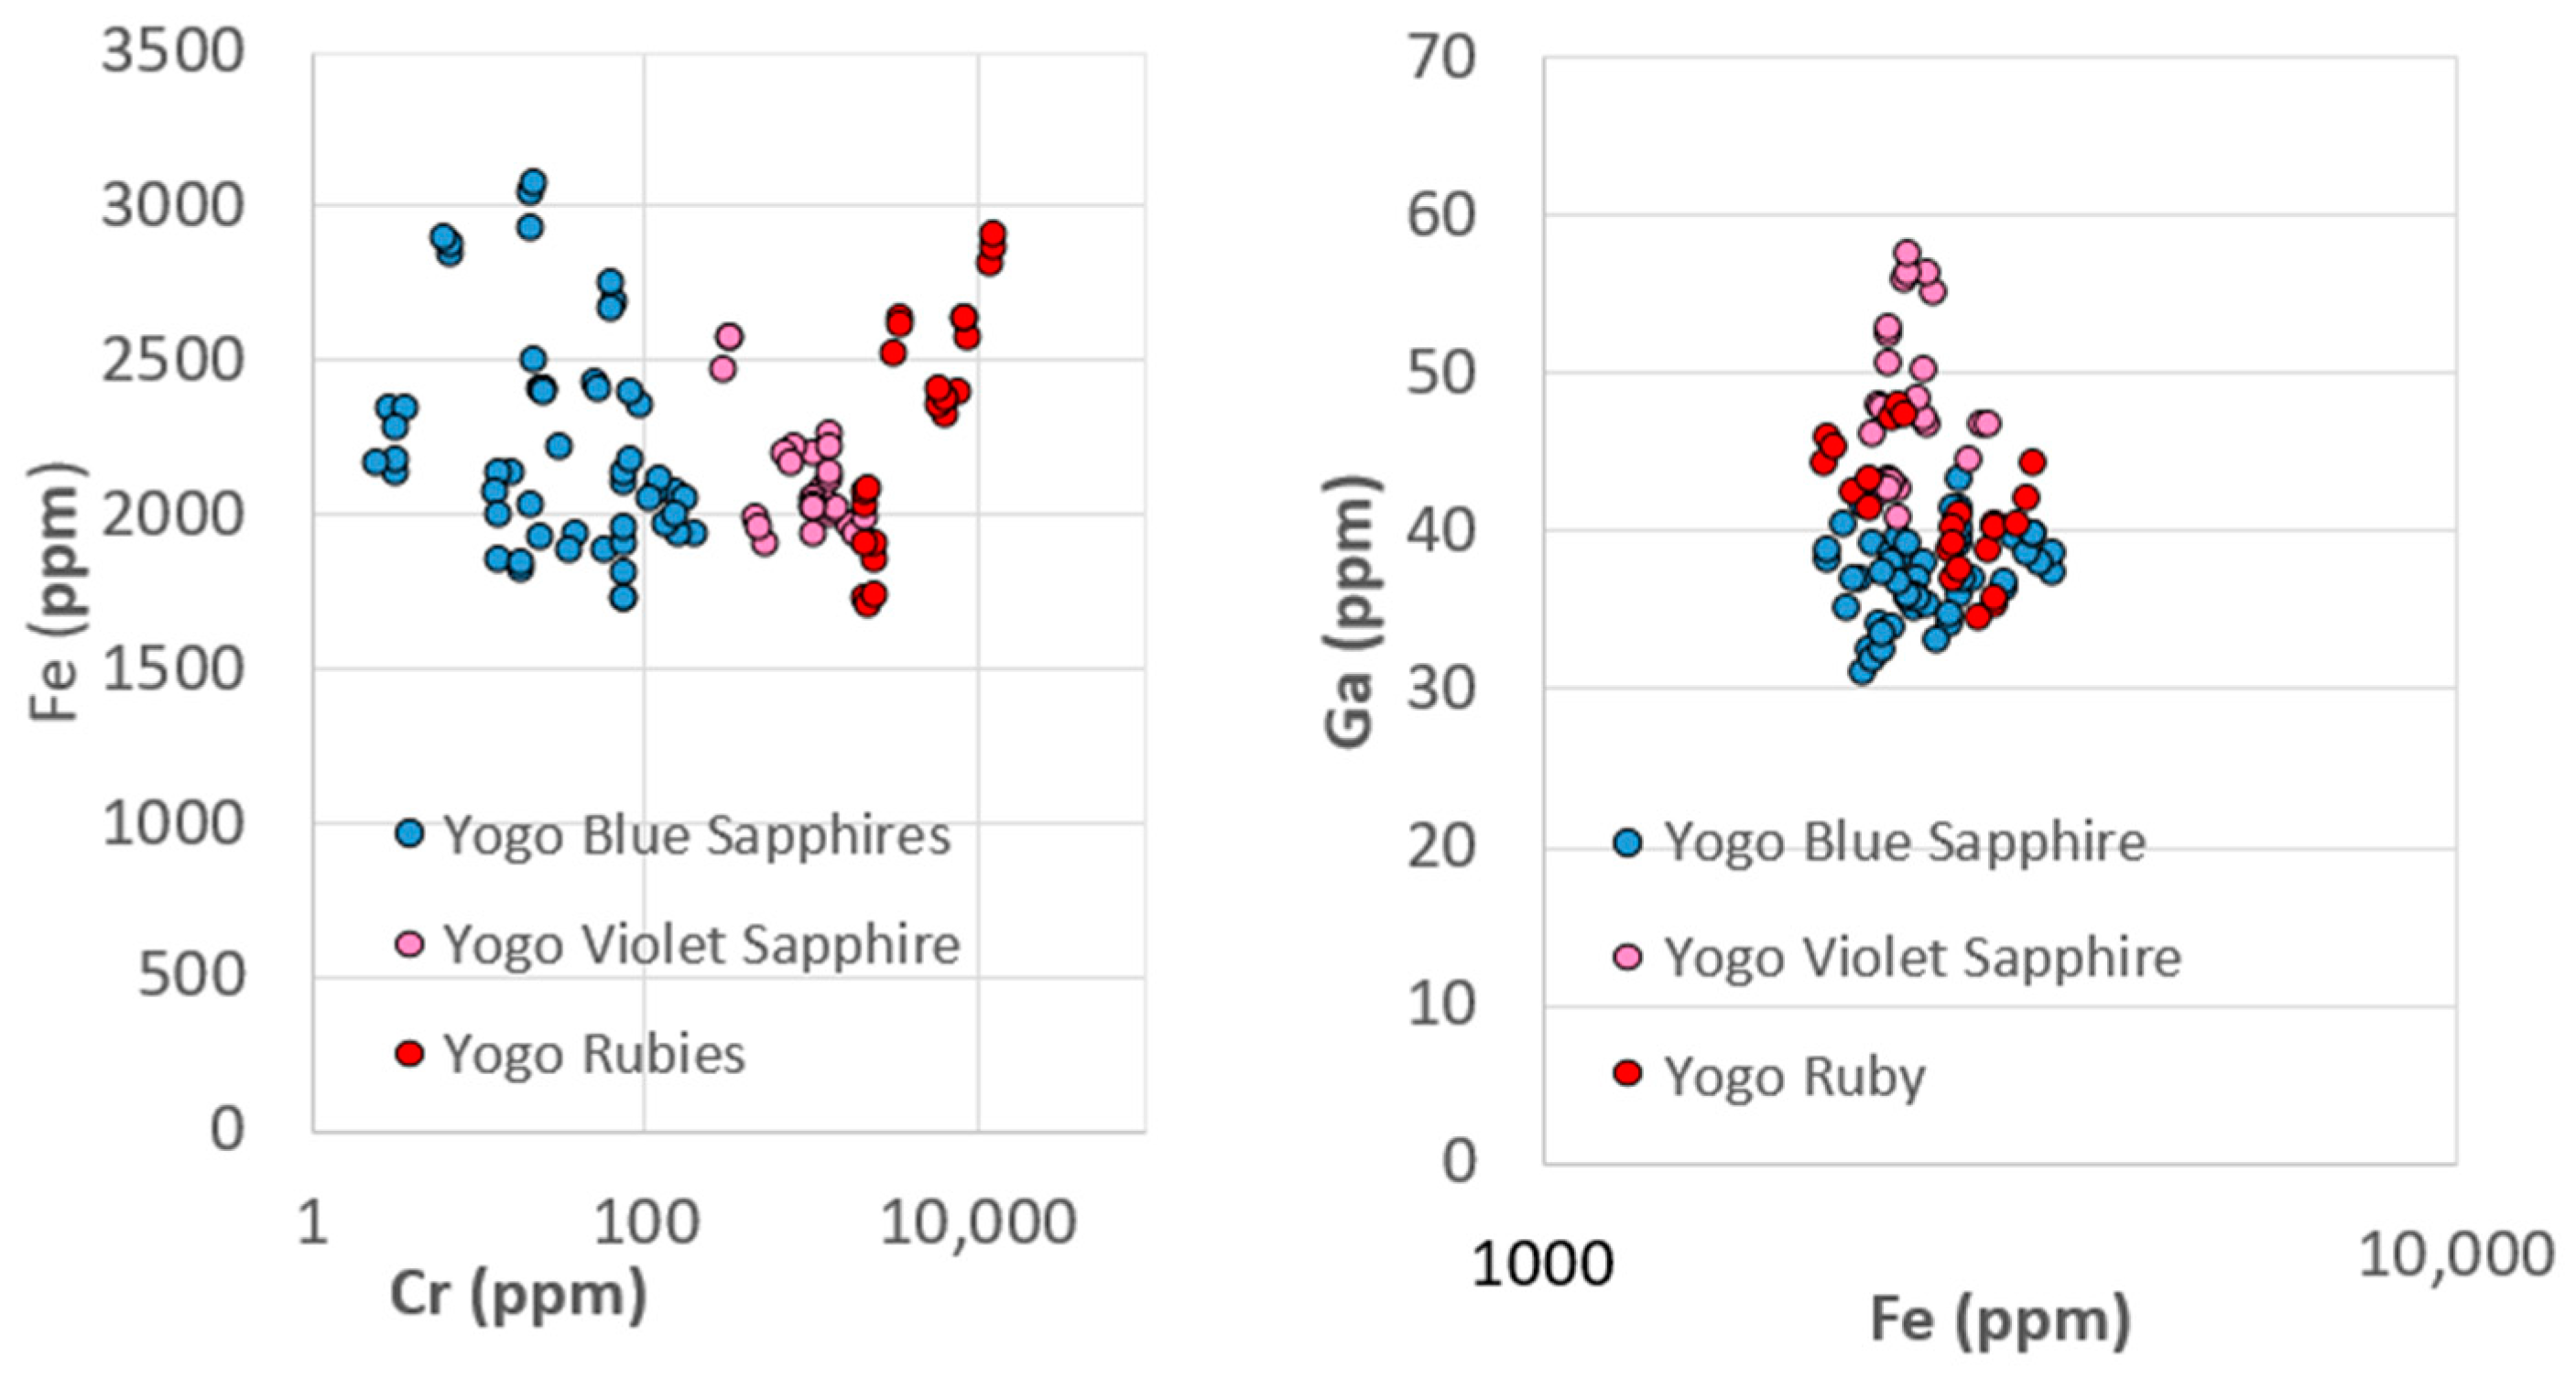
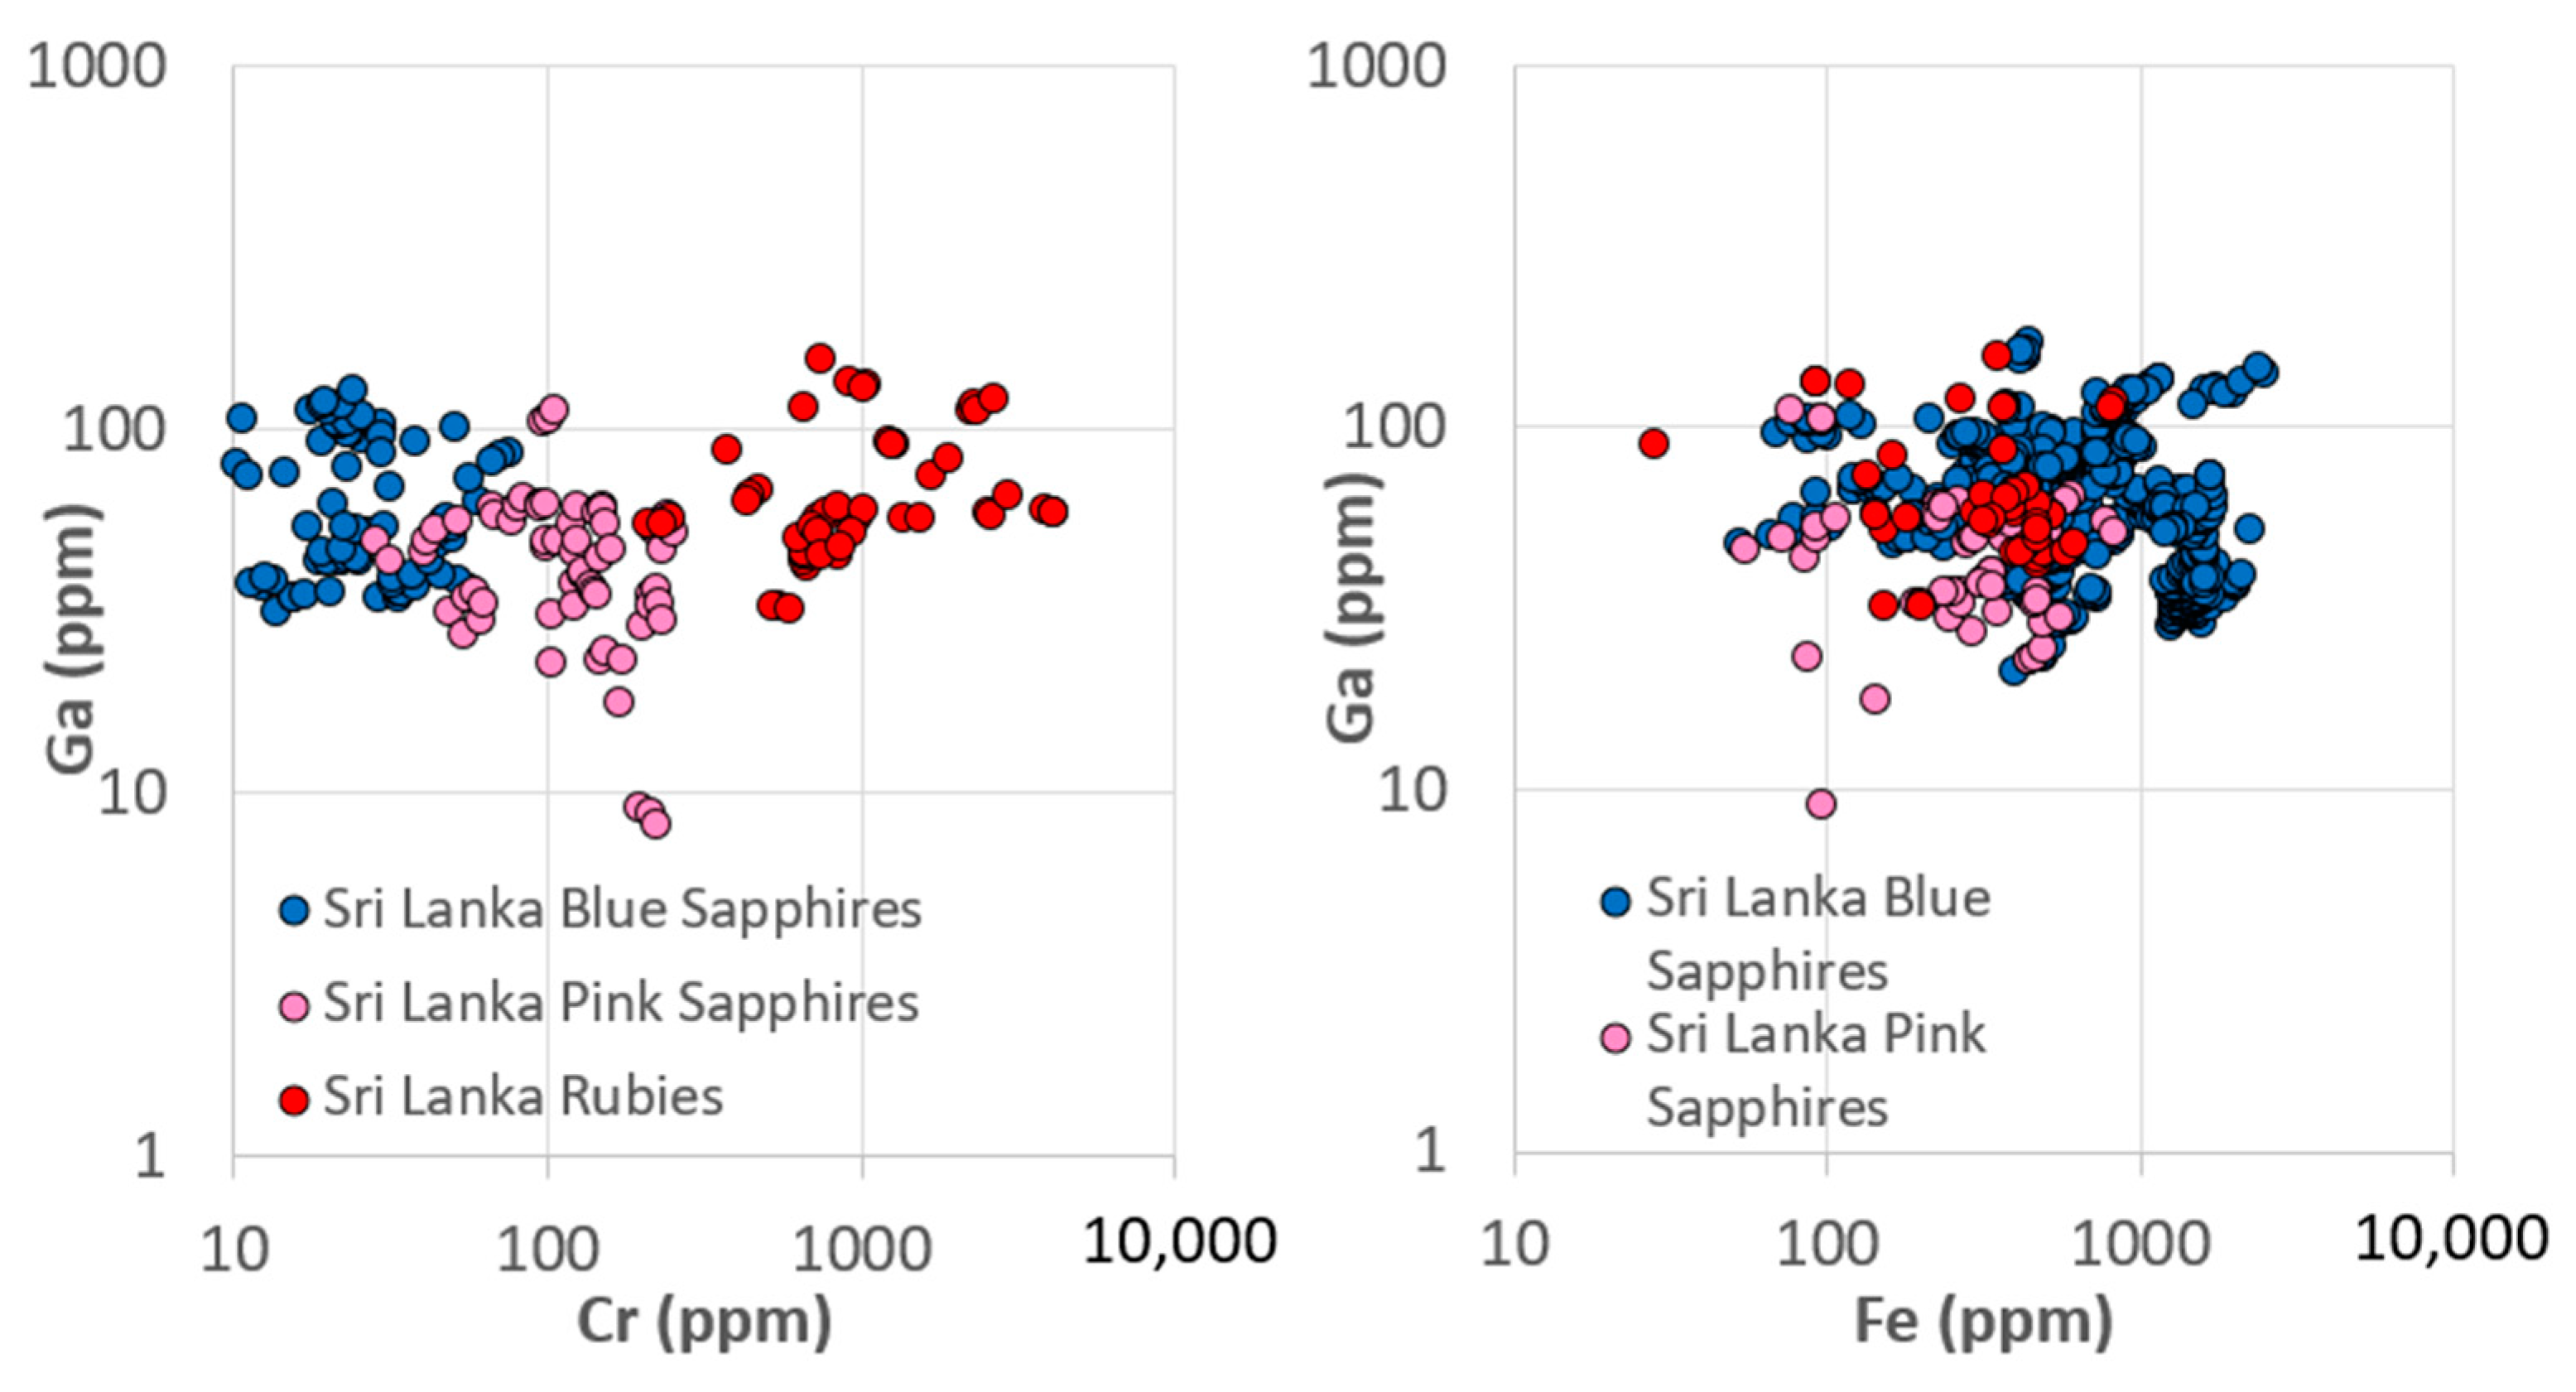
In contrast, the monogenetic ruby/sapphire assemblages described here are those in which the inclusions and trace element chemistry point toward a single geological origin for rubies and blue sapphires within a single deposit. In this study this includes rubies and blue sapphires from Yogo Gulch, Montana, as well as the secondary Montana sapphires and rubies in addition to the rubies and blue sapphires from Sri Lanka. One notable aspect of the monogenetic assemblages is the continuous transition in Cr concentrations across the blue sapphire-pink sapphire-ruby spectrum. However, the most surprising feature of the trace element relationships in the monogenetic suites is that Cr does not show a correlation with most other trace elements. The main exception seems to be V, which is positively correlated with Cr in most cases. Note, Zaw et al. also discussed the potential correlation between V and Cr in rubies and sapphires from Mogok, Myanmar [30]. Occasionally, the correlation matrices also show a weak positive correlation with trace elements like Ga and sometimes Mg or Ti. However, the other trace elements in the monogenetic assemblages tend to vary generally by less than two orders of magnitude, while Cr can vary by well over three to nearly four orders of magnitude. Even over this wide range in Cr concentrations, there is typically relatively little variation in the range of the other trace elements (except V as stated above). One surprising observation here is that Cr concentrations can vary between such extremes with little to no variations in the trace element chemistry and inclusions. This presumably indicates similar geological origins for the high- and low-Cr corundum. Apparently, in these environments, Cr behaves independently from the other trace elements commonly found in gem corundum, even when compared to trace elements that share the same valence state as Al3+ such as Fe3+ and Ga3+.
While this study focuses on a small number of deposits where reliably collected reference samples were available, there is ample room for expanding this work to other important deposits. Notably, the Australian sapphire fields, known as one of the most important producers of basalt-related sapphires, have also occasionally produced red rubies, although in significantly lower quantities [36,37,38,39]. In fact, Sutherland et al. [39] noted a very similar transition from purple and bluish sapphire to pink sapphire to rubies in the New England, New South Wales, gem fields which had higher Ga and Ga/Mg ratios than other basalt-related rubies such as those from Chanthaburi, Thailand, and Pailin, Cambodia. Additionally, while understudied, the gem corundum deposits of Colombia are known for producing small quantities of rubies in addition to blue and other fancy colored sapphire [40,41]. Rubies from many deposits in their natural, untreated state often have distinct blue color zoning either in the cores of the stones as in Mong Hsu stones from Myanmar [42,43], Vietnam [43,44,45,46], or Tajikistan [43,47,48]. While this blue/red zoned corundum may not fit the category of monogenetic ruby/blue sapphire assemblages, they are evidence of the complex geochemical controls on the trace element chemistry of gem corundum and the difficulty of neatly categorizing these stones based on their trace elements.
The reasons for the extreme diversity in Cr concentrations relative to other trace elements in the monogenetic ruby/blue sapphire assemblages are not obvious. One possible explanation is mineralogical heterogeneity in Cr-bearing minerals in the geological environment in which the gem corundum formed. Cr tends to be concentrated in a relatively small number of mineral phases compared to Fe and Ga, and this extreme variance in Cr concentrations could be related to the fortuitous spatial relationship between the growing corundum crystal and nearby Cr-bearing minerals. However, what would be the cause for such extreme heterogeneity in Cr-bearing minerals in the monogenetic assemblages relative to the polygenetic ruby/sapphire assemblages?
One conclusion from this study is that rubies and sapphires do not necessarily represent different tectonic environments or different geological conditions of formation. Whatever environments facilitate the formation of gem corundum in the Earth, they may not always discriminate between Cr-enriched rubies and Cr-poor blue sapphires. The observations and discussion presented here provide a basis for further investigations into the question posited above: what makes a ruby a ruby? With such huge differences in the value placed on these two varieties of gem corundum, we often still need to understand the geochemical constraints that can turn a sapphire into an extraordinary, richly colored red ruby.

Funding

This research received no external funding.

Acknowledgments

I would like to express gratitude to my colleagues at the Gemological Institute of America who have helped inspire this work through conversations about the wide world of gemology and gemstone science including Nathan Renfro, Wim Vertriest, Sudarat Saeseaw, Ziyin Sun, Shane McClure, Dino DeGhionno, Karen Smit, Evan Smith, and Christopher M. Breeding. Four anonymous reviewers also provided many useful suggestions and comments that significantly strengthened this manuscript. Thanks as well to special editors Lin Sutherland and Khin Zaw for their editorial input and constructive suggestions and the invitation to submit this manuscript in this Special Issue of Minerals concerning the geology of ruby deposits.

Conflicts of Interest

The author declares no conflict of interest.

References

  1. Giuliani, G.; Ohnenstetter, D.; Fallick, A.E.; Groat, L.A.; Fagan, A.J. The geology and genesis of gem corundum deposits. In Geology of Gem Deposits, 2nd ed.; Groat, L.A., Ed.; Short Course Series; Mineralogical Association of Canada: Quebec City, QC, Canada, 2014; Volume 44, pp. 29–112. [Google Scholar]
  2. Giuliani, G.; Groat, L.A. Geology of corundum and emerald gem deposits: A review. Gems Gemol. 2019, 55, 464–489. [Google Scholar] [CrossRef] [Green Version]
  3. Garnier, V.; Giuliani, G.; Ohnenstetter, D.; Fallick, A.E.; Dubessy, J.; Banks, D.; Vinh, H.Q.; Lhomme, T.; Maluski, H.; Pêcher, A.; et al. Marble-hosted ruby deposits from Central and Southeast Asia: Towards a new genetic model. Ore Geol. Rev. 2008, 34, 169–191. [Google Scholar] [CrossRef]
  4. Giuliani, G.; Dubessy, J.; Ohnenstetter, D.; Banks, D.; Branquet, Y.; Feneyrol, J.; Fallick, A.E.; Martelat, J.-E. The role of evaporites in the formation of gems during metamorphism of carbonate platforms: A review. Miner. Depos. 2018, 53, 1–20. [Google Scholar] [CrossRef]
  5. Simonet, C.; Fritsch, E.; Lasnier, B.A. classification of gem corundum deposits aimed towards gem exploration. Ore Geol. Rev. 2008, 34, 127–133. [Google Scholar] [CrossRef]
  6. Vertriest, W.; Palke, A.C.; Renfro, N.D. Field gemology: Building a research collection and understanding the development of gem deposits. Gems Gemol. 2019, 55, 490–511. [Google Scholar] [CrossRef]
  7. Longerich, H.P.; Jackson, S.E.; Günther, D. Inter-laboratory note. Laser ablation inductively coupled plasma mass spectrometric transient signal data acquisition and analyte concentration calculation. J. Anal. At. Spctrm. 1996, 11, 899–904. [Google Scholar] [CrossRef]
  8. Hughes, R.W.; Manorotkul, W.; Hughes, E.B. Ruby & Sapphire: A Gemologist’s Guide; RWH Publishing/Lotus Publishing: Bangkok, Thailand, 2017; p. 816. [Google Scholar]
  9. Sutthirat, C.; Saminpanya, S.; Droop, G.T.R.; Henderson, C.M.B.; Manning, D.A.C. Clinopyroxene-corundum assemblages from alkali basalt and alluvium, eastern Thailand: Constraints on the origin of Thai rubies. Mineral. Mag. 2001, 65, 277–295. [Google Scholar] [CrossRef]
  10. Khoi, N.N.; Sutthirat, C.; Tuan, D.A.; Van Nam, N.; Thuyet, N.T.M.; Nhung, N.T. Ruby and Sapphire from the Tan Huong-Truc Lau Area, Yen Bai Province, Northern Vietnam. Gems Gemol. 2011, 47, 182–195. [Google Scholar] [CrossRef]
  11. Saminpanya, S.; Sutherland, F.L. Different origins of Thai area sapphire and ruby, derived from mineral inclusions and co-existing minerals. Eur. J. Mineral. 2011, 23, 683–694. [Google Scholar] [CrossRef] [Green Version]
  12. Promwongnan, S.; Sutthirat, C. Mineral Inclusions in Ruby and Sapphire from the Bo Welu Gem Deposit in Chanthaburi, Thailand. Gems Gemol. 2019, 55, 354–369. [Google Scholar] [CrossRef]
  13. Koivula, J.I.; Fryer, C.W. Sapphirine (not sapphire) in a ruby from Bo Rai, Thailand. J. Gemmol. 1987, 20, 70. [Google Scholar] [CrossRef]
  14. Palke, A.C.; Wong, J.; Verdel, C.; Ávila, J.N. A common origin for Thai/Cambodian rubies and blue and violet sapphires from Yogo Gulch, Montana, USA? Am. Mineral. 2018, 103, 469–479. [Google Scholar] [CrossRef]
  15. Palke, A.C.; Saeseaw, S.; Renfro, N.D.; Sun, Z.; McClure, S.F. Geographic origin determination of blue sapphire. Gems Gemol. 2019, 55, 354–369. [Google Scholar] [CrossRef] [Green Version]
  16. Graham, I.; Sutherland, L.; Zaw, K.; Nechaev, V.; Khanchuk, A. Advances in our understanding of the gem corundum deposits of the West Pacific continental margins intraplate basaltic fields. Ore Geol. Rev. 2008, 34, 200–215. [Google Scholar] [CrossRef]
  17. Srithai, B.; Rankin, A. Geochemistry and genetic significance of melt inclusions in corundum from the Bo Ploi sapphire deposits, Thailand. In Proceedings of the Program with Abstracts of the First Meeting Asia Current Research on Fluid Inclusion, Nanjing, China, May 2006. [Google Scholar]
  18. Berg, R.B.; Palke, A.C. Sapphires from an Eocene sill near Helena, Montana. In Proceedings of the GSA Annual Meeting, Denver, CO, USA, 27 September 2016; p. 48. [Google Scholar]
  19. Peucat, J.J.; Ruffault, P.; Fritsch, E.; Bouhnik-Le Coz, M.; Simonet, C.; Lasnier, B. Ga/Mg ratio as a new geochemical tool to differentiate magmatic from metamorphic blue sapphires. Lithos 2007, 98, 261–274. [Google Scholar] [CrossRef]
  20. Zwaan, J.C.; Buter, E.; Mertz-Kraus, R.; Kane, R.E. Alluvial sapphires from Montana: Inclusions, geochemistry, and indications of a metasomatic origin. Gems Gemol. 2015, 51, 370–391. [Google Scholar] [CrossRef]
  21. Palke, A.C.; Renfro, N.D.; Berg, R.B. Melt inclusions in alluvial sapphires from Montana, USA: Formation of sapphires as a restitic component of lower crustal melting? Lithos 2017, 278, 43–53. [Google Scholar] [CrossRef]
  22. Malaquais, C. A rare ruby from Montana. Gems Gemol. 2018, 54, 434–435. [Google Scholar]
  23. Palke, A.C.; Hapeman, J.R. Rubies from Rock Creek, Montana. Gems Gemol. 2019, 55, 286–288. [Google Scholar]
  24. Limtrakun, P.; Zaw, K.; Ryan, C.G.; Mernagh, T.P. Formation of the Denchai gem sapphires, northern Thailand: Evidence from mineral chemistry and fluid/melt inclusion characteristics. Mineral. Mag. 2001, 65, 725–735. [Google Scholar] [CrossRef]
  25. Pakhomova, V.A.; Zalishchak, B.L.; Odarichenko, E.G.; Lapina, M.I.; Karmanov, N.S. Study of melt inclusions in the Nezametnoye corundum deposit, Primorsky region of the Russian Far East: Petrogenetic consequences. J. Geochem. Explor. 2006, 89, 302–305. [Google Scholar] [CrossRef]
  26. Palke, A.C.; Renfro, N.D.; Berg, R.B. Origin of sapphires from a lamprophyre dike at Yogo Gulch, Montana, USA: Clues from their melt inclusions. Lithos 2016, 260, 339–344. [Google Scholar] [CrossRef]
  27. Smith, E.M.; Shirey, S.B.; Nestola, F.; Bullock, E.S.; Wang, J.; Richardson, S.H.; Wang, W. Large gem diamonds from metallic liquid in Earth’s deep mantle. Science 2016, 354, 1403–1405. [Google Scholar] [CrossRef] [PubMed] [Green Version]
  28. Smit, K.V.; Shirey, S.B.; Hauri, E.H.; Stern, R.A. Sulfur isotopes in diamonds reveal differences in continent construction. Science 2019, 364, 383–385. [Google Scholar] [CrossRef] [PubMed]
  29. Sutherland, F.L.; Schwarz, D. Origin of gem corundums from basaltic fields. Aust. Gemmol. 2001, 21, 30–33. [Google Scholar]
  30. Zaw, K.; Sutherland, L.; Yui, T.F.; Meffre, S.; Thu, K. Vanadium-rich ruby and sapphire within Mogok Gemfield, Myanmar: Implications for gem color and genesis. Miner. Depos. 2015, 50, 25–39. [Google Scholar] [CrossRef]
  31. Sutherland, L.; Zaw, K.; Meffre, S.; Yui, T.-F.; Thu, K. Advances in trace element “Fingerprinting” of gem corundum, ruby and sapphire, Mogok Area, Myanmar. Minerals 2015, 5, 61–79. [Google Scholar] [CrossRef] [Green Version]
  32. Sorokina, E.S.; Rassomakhin, M.A.; Nikandrov, S.N.; Karampelas, S.; Kononkova, N.N.; Nikolaev, A.G.; Anosova, M.O.; Somsikova, A.V.; Kostitsyn, Y.A.; Kotlyarov, V.A. Origin of blue sapphire in newly discovered spinel–chlorite–muscovite rocks within meta-ultramafites of Ilmen Mountains, South Urals of Russia: Evidence from mineralogy, geochemistry, Rb-Sr and Sm-Nd isotopic data. Minerals 2019, 9, 36. [Google Scholar] [CrossRef] [Green Version]
  33. Darling, R.S.; Gordon, J.L.; Loew, E.R. Microscopic Blue Sapphire in Nelsonite from the Western Adirondack Mountains of New York State, USA. Minerals 2019, 9, 633. [Google Scholar] [CrossRef] [Green Version]
  34. Sutherland, F.L.; Schwarz, D.; Jobbins, E.A.; Coenraads, R.R.; Webb, G. Distinctive gem corundum suites from discrete basalt fields; a comparative study of Barrington, Australia, and West Pailin, Cambodia, gemfields. J. Gemmol. 1998, 26, 65–85. [Google Scholar] [CrossRef]
  35. Giuliani, G.; Pivin, M.; Fallick, A.E.; Ohnenstetter, D.; Song, Y. Demaiffe Geochemical and oxygen isotope signatures of mantle corundum megacrysts from Mbujui-Mayi kimberlite, Democratic Republic of Congo, and the Changle alkali basalt, China. Comptes Rend. Geosc. 2015, 347, 24–34. [Google Scholar] [CrossRef]
  36. Sutherland, F.L.; Coenraads, R.R. An unusual ruby-sapphire-sapphirine-spinel assemblage from the Tertiary Barrington volcanic province, New South Wales, Australia. Mineral. Mag. 1996, 60, 623–638. [Google Scholar] [CrossRef]
  37. Sutherland, F.L.; Graham, I.T.; Pogson, R.E.; Schwarz, D.; Webb, G.B.; Coenraads, R.R.; Fanning, C.M.; Hollis, J.D.; Allen, T.C. The Tumbarumba basaltic gem field, New South Wales: In relation to sapphire-ruby deposits of eastern Australia. Rec. -Aust. Mus. 2002, 54, 215–248. [Google Scholar]
  38. Sutherland, F.L.; Coenraads, R.R.; Schwarz, D.; Raynor, L.R.; Barron, B.J.; Webb, G.B. Al-rich diopside in alluvial ruby and corundum-bearing xenoliths, Australian and SE Asian basalt fields. Mineral. Mag. 2003, 67, 717–732. [Google Scholar] [CrossRef]
  39. Sutherland, F.L.; Graham, I.T.; Harris, S.J.; Coldham, T.; Powell, W.; Belousova, E.A.; Martin, L. Unusual ruby–sapphire transition in alluvial megacrysts, Cenozoic basaltic gem field, New England, New South Wales, Australia. Lithos 2017, 278, 347–360. [Google Scholar] [CrossRef]
  40. Keller, P.C.; Koivula, J.I.; Jara, G. Sapphire from the Mercaderes-Rio Mayo Area, Cauca, Colombia. Gems Gemol. 1985, 21, 20–25. [Google Scholar] [CrossRef]
  41. Sutherland, F.L.; Duroc-Danner, J.M.; Meffre, S. Age and origin of gem corundum and zircon megacrysts from the Mercaderes–Rio Mayo area, South-west Colombia, South America. Ore Geol. Rev. 2008, 34, 155–168. [Google Scholar] [CrossRef]
  42. Peretti, A.; Schmetzer, K.; Bernhardt, H.J.; Mouawad, F. Rubies from Mong Hsu. Gems Gemol. 1995, 31, 2–26. [Google Scholar] [CrossRef]
  43. Palke, A.C.; Saeseaw, S.; Renfro, N.D.; Sun, Z.; McClure, S.F. Geographic origin determination of ruby. Gems Gemol. 2019, 55. [Google Scholar] [CrossRef]
  44. Kane, R.E.; McClure, S.F.; Kammerling, R.C.; Khoa, N.D.; Mora, C.; Repetto, S.; Khai, N.D.; Koivula, J.I. Rubies and fancy sapphires from Vietnam. Gems Gemol. 1991, 27, 136–155. [Google Scholar] [CrossRef]
  45. Brown, G. Vietnamese ruby: A discriminatory problem for gemmologists. Aust. Gemmol. 1992, 18, 43–46. [Google Scholar]
  46. Long, P.V.; Vinh, H.Q.; Garnier, V.; Giuliani, G.; Ohnenstetter, D. Marble-hosted ruby from Vietnam. Can. Gemmol. 2004, 25, 83–95. [Google Scholar]
  47. Smith, C.P. Rubies and pink sapphires from the Pamir Range in Tajikistan, former USSR. J. Gemmol. 1998, 26, 103–109. [Google Scholar] [CrossRef]
  48. Sorokina, E.S.; Litvinenko, A.K.; Hofmeister, W.; Häger, T.; Jacob, D.E.; Nasriddinov, Z.Z. Rubies and sapphires from Snezhnoe, Tajikistan. Gems Gemol. 2015, 51, 160–175. [Google Scholar] [CrossRef]
Figure 1. Trace element plots of Thai/Cambodian rubies and sapphires including Mg vs. Ga (left) and Cr vs. Ga (right) plots.
Minerals 10 00472 g001
Figure 2. Photomicrographs of inclusions in Thai/Cambodian (A,B) blue sapphires representing (A) glassy melt inclusions and (B) oriented rutile inclusions in angular bands and (C,D) rubies representing (C) a glass melt inclusion which has burst out into the corundum host and (D) inclusions with geometric, partially healed decrepitation haloes. Thai/Cambodian rubies are characterized by melt-filled decrepitation haloes around melt inclusions, whereas the blue sapphires are characterized by melt inclusions and planar to hexagonally arranged bands of rutile silk. Photomicrographs by (A,B) Jonathan Muyal and (C,D) Aaron C. Palke. Fields of view: (A) 1.26 mm (B) 1.26 mm, (C) 1.26 mm, and (D) 1.58 mm.
Minerals 10 00472 g002
Figure 3. Trace element plots of rubies and blue sapphires from Mogok, Myanmar, showing their representative range of trace element profiles.
Minerals 10 00472 g003
Figure 4. Photomicrographs of characteristic inclusions in Mogok, Myanmar, (A,B) blue sapphires showing reflective oriented rutile silk and polysynthetic twinning and (C,D) rubies including (C) reflective, oriented rutile silk and (D) nested elongate rutile silk surrounding mineral inclusions. Photomicrographs by (A,B,D) Aaron C. Palke and (C) Charuwan Khowpong. Fields of view: (A) 3.57 mm, (B) 2.34 mm, (C) 1.58 mm, and (D) 4.48 mm.
Minerals 10 00472 g004aMinerals 10 00472 g004b
Figure 5. Trace element plots of secondary Montana blue and pink sapphires and rubies showing characteristic ranges of their trace elements.
Minerals 10 00472 g005
Figure 6. Photomicrographs of typical inclusions in secondary Montana (A,B) blue sapphires representing (A) melt inclusions and (B) hexangonally arranged rutile silk and (C,D) pink sapphires and rubies representing (C) melt inclusions and (D) hexagonally arranged bands of rutile silk. Photomicrographs by (AC) Aaron C. Palke and (D) Tyler Smith. Fields of view: (A) 1.64 mm, (B) 4.08 mm, (C) 2.23 mm, and (D) 3.57 mm.
Minerals 10 00472 g006
Figure 7. Plots of trace element chemistry of blue and pink sapphires and rubies from Yogo Gulch, Montana, showing their characteristic trace element ranges.
Minerals 10 00472 g007
Figure 8. Trace element plots of blue and pink sapphires and rubies from Sri Lanka showing their characteristic trace element ranges.
Minerals 10 00472 g008
Figure 9. Photomicrographs of typical inclusions in Sri Lankan (A,B) rubies representing (A) elongate negative crystals and reflective rutile silk and (B) a biotite inclusion and (C,D) blue sapphire representing (C) elongate and reflective rutile silk and (D) biotite inclusions. Photomicrographs by Aaron C. Palke. Fields of view: (A) 1.26 mm, (B) 1.76 mm, (C) 1.47 mm, (D) 1.49 mm.
Minerals 10 00472 g009
Table 1. Summary of trace elements for Thai/Cambodian sapphires and rubies in ppm.
Thai/Cambodian Blue Sapphires (28 Samples, 289 Analyses)
MgTiVCrFeGa
min2.020.13.2bdl1553.9108.0
max39.7372.958.688.16870.7195.0
average8.994.218.56.04030.5132.7
median8.178.013.03.94334.1131.0
Thai/Cambodian Rubies (17 Samples, 54 Analyses)
MgTiVCrFeGa
min150.084.98.92189.91738.717.0
max216.0208.934.74959.73317.734.8
average170.9127.919.93302.72505.526.0
median165.0120.518.23434.82721.425.6
bdl = below the detection limit, see “Materials and Methods” section for details.
Table 2. Correlation table for trace elements of Thai/Cambodian Sapphires.
MgTiVCrFeGa
Mg1
Ti0.0151
V0.1750.0511
Cr0.073−0.2870.3601
Fe−0.1760.096−0.901−0.2731
Ga0.1170.2390.4990.254−0.3851
Table 3. Correlation table for trace elements of Thai/Cambodian Rubies.
MgTiVCrFeGa
Mg1
Ti0.8171
V0.8140.9111
Cr0.282−0.0280.1351
Fe0.4330.4430.512−0.3691
Ga0.4570.7110.6320.127−0.1851
Table 4. Summary of trace elements for sapphires and rubies from Mogok, Myanmar, in ppm.
Blue Sapphires from Mogok, Myanmar (143 Samples, 878 Analyses)
MgTiVCrFeGa
min0.314.6bdlBdl395.616.9
max1799.62389.4182.01259.96996.6280.0
average49.3125.515.130.72133.882.1
median36.892.27.10.01755.570.5
Rubies from Mogok, Myanmar (43 Samples, 126 Analyses)
MgTiVCrFeGa
min6.115.5119.0303.0bdl6.6
max90.0188.01620.18869.4374.6132.0
average46.4100.8433.62962.569.957.4
median46.299.6373.52824.855.357.0
bdl = below the detection limit, see “Materials and Methods” section for details.
Table 5. Correlation table for trace elements of blue sapphires from Mogok, Myanmar.
MgTiVCrFeGa
Mg1
Ti0.5811
V0.0360.0651
Cr−0.032−0.0210.6851
Fe0.033−0.031−0.034−0.1411
Ga−0.058−0.061−0.0660.048−0.0621
Table 6. Correlation table for trace elements of rubies from Mogok, Myanmar.
MgTiVCrFeGa
Mg1
Ti0.9651
V0.1680.2031
Cr−0.0350.0100.2521
Fe0.2380.258−0.037−0.0831
Ga−0.0550.0090.0730.1510.1791
Table 7. Summary of trace elements for secondary Montana sapphires and rubies in ppm.
Secondary Montana Blue Sapphires (52 Samples, 246 Analyses)
MgTiVCrFeGa
min9.07.52.1bdl1402.824.0
max132.3255.022.7109.16326.259.8
average37.267.56.514.73681.045.7
median34.965.45.58.43703.746.5
Secondary Montana Pink Sapphires (6 Samples, 18 Analyses)
MgTiVCrFeGa
min13.222.26.081.51419.542.8
max58.976.613.6854.94569.268.3
average31.553.69.0287.83040.651.3
median32.060.18.5189.02855.850.6
Secondary Montana Rubies (8 Samples, 48 Analyses)
MgTiVCrFeGa
min15.138.33.11040.02545.237.2
max45.8189.068.16120.06804.067.8
average28.573.418.72495.04882.952.3
median28.164.111.82255.04947.652.3
bdl = below the detection limit, see “Materials and Methods” section for details.
Table 8. Correlation table for trace elements of secondary Montana blue/green and pink sapphires and rubies.
MgTiVCrFeGa
Mg1
Ti0.6641
V−0.153−0.0381
Cr−0.1070.0970.3771
Fe0.1170.2520.3030.3601
Ga0.0740.2170.3120.3610.4051
Table 9. Correlation table for trace elements of only blue/green and pink sapphires from the secondary Montana sapphire mines.
MgTiVCrFeGa
Mg1
Ti0.7071
V−0.058−0.0371
Cr−0.027−0.0300.2731
Fe0.2700.3090.150−0.1871
Ga0.1380.2060.4670.2690.3191
Table 10. Summary of trace elements for Yogo sapphires and rubies in ppm.
Yogo Blue Sapphires (18 Samples, 54 Analyses)
MgTiVCrFeGa
min89.4136.03.52.41722.031.0
max142.0239.024.3208.03066.043.4
average115.9192.513.152.12201.537.4
median116.0193.512.633.82129.437.1
Yogo Violet Sapphires (9 Samples, 27 Analyses)
MgTiVCrFeGa
min120.0209.028.2312.01898.440.7
max170.0266.061.02090.02570.457.4
average137.2238.744.61049.92109.347.8
median137.0242.045.21070.02049.646.9
Yogo Rubies (8 Samples, 24 Analyses)
MgTiVCrFeGa
min112.0176.022.12110.01713.634.5
max164.0306.068.51,2900.02906.447.9
average135.3233.543.65538.82308.341.2
median133.5239.043.44685.02377.240.7
bdl = below the detection limit, see “Materials and Methods” section for details.
Table 11. Correlation table for trace elements of Yogo blue and violet sapphires and rubies.
MgTiVCrFeGa
Mg1
Ti0.9561
V0.6650.7481
Cr0.5510.4960.5201
Fe−0.050−0.072−0.1310.3511
Ga0.4830.5670.7620.159−0.1271
Table 12. Correlation table for trace elements of only blue and violet sapphires from Yogo.
MgTiVCrFeGa
Mg1
Ti0.9701
V0.6970.7661
Cr0.2220.3340.7001
Fe−0.151−0.162−0.347−0.3401
Ga0.4070.4000.376−0.0180.2081
Table 13. Summary of trace elements for Sri Lanka sapphires and rubies in ppm.
Sri Lanka Blue Sapphires (61 Samples, 581 Analyses)
MgTiVCrFeGa
min20.320.9bdlbdl57.121
max464.93309.1122.074.42461.0173.0
average50.3311.619.84.2760.066.8
median39.3155.013.5bel601.465.9
Sri Lanka Pink Sapphires (18 Samples, 65 Analyses)
MgTiVCrFeGa
min25.032.19.928.453.78.2
max292.02500.0309.0248.0819.8113.3
average94.9252.149.1131.0311.946.2
median75.3156.030.8123.0302.447.0
Sri Lanka Rubies (17 Samples, 51 Analyses)
MgTiVCrFeGa
min11.536.015.1207.026.932.5
max142.01429.6210.04019.7825.7157.0
average66.6276.268.81217.0357.470.2
median66.7232.951.9834.9377.159.2
bdl = below the detection limit, see “Materials and Methods” section for details.
Table 14. Correlation table for trace elements of Sri Lankan blue and pink sapphires and rubies.
MgTiVCrFeGa
Mg1
Ti0.8171
V0.8140.9111
Cr0.282−0.0280.1351
Fe0.4330.4430.512−0.3691
Ga0.4570.7110.6320.127−0.1851

