Article

Layered Double Hydroxides with Intercalated Permanganate and Peroxydisulphate Anions for Oxidative Removal of Chlorinated Organic Solvents Contaminated Water

by
Karen Maria Dietmann
1,
Tobias Linke
2,
Miguel del Nogal Sánchez
3,
José Luis Pérez Pavón
3 and
Vicente Rives
1,*
1
Grupo de Investigación Reconocido—Química del Estado Sólido, Materiales y Catálisis Heterogénea (GIR-QUESCAT), Departamento de Química Inorgánica, Universidad de Salamanca, 37008 Salamanca, Spain
2
Institute of Earth Sciences, University of Iceland, Sturlugata 7, 101 Reykjavík, Iceland
3
Departamento de Química Analítica, Nutrición y Bromatología, Universidad de Salamanca, 37008 Salamanca, Spain
*
Author to whom correspondence should be addressed.
Minerals 2020, 10(5), 462; https://doi.org/10.3390/min10050462
Submission received: 9 April 2020 / Revised: 7 May 2020 / Accepted: 18 May 2020 / Published: 20 May 2020

Abstract

:
The contamination by chlorinated organic solvents is a worldwide problem as they can deeply penetrate aquifers, accumulating in the sub-surface as lenses of highly hazardous pollutants. In recent years, so called in situ oxidation processes have been developed to remediate chlorinated organic solvents from groundwater and soil by injecting solutions of oxidising agents such as permanganate or peroxydisulphate. We here present modified layered double hydroxides (LDHs) with intercalated oxidising agents that might serve as new reactants for these remediation strategies. LDHs might serve as support and stabiliser materials for selected oxidising agents during injection, as the uncontrolled reaction and consumption might be inhibited, and guarantee that the selected oxidants persist in the subsurface after injection. In this study, LDHs with hydrotalcite- and hydrocalumite-like structures intercalated with permanganate and peroxydisulphate anions were synthesised and their efficiency was tested in batch experiments using trichloroethene or 1,1,2-trichloroethane as the target contaminants. All samples were characterised using powder X-ray diffraction, thermal analysis coupled with mass spectrometry to directly analyse evolving gases, and Fourier-transform infrared spectroscopy. Additionally, particle size distribution measurements were carried out on the synthesised materials. Results of the batch experiments confirmed the hypothesis that oxidising agents keep their properties after intercalation. Permanganate intercalated LDHs proved to be most efficient at degrading trichloroethene while peroxydisulphate intercalated Ca,Al-LDHs were the most promising studied reactants degrading 1,1,2-trichloroethane. The detection of dichloroethene as well as the transformation of the studied reactants into new LDH phases confirmed the successful degradation of the target contaminant by oxidation processes generated from the intercalated oxidising agent.

1. Introduction

Decontamination of groundwater and soils from chlorinated organic solvents, formerly used as degreasing agents, cleaning solutions, paint thinners, or even pesticides, has become a major issue due to the increasing concern about the negative effect of these chemicals on health worldwide [1,2]. Chlorinated organic solvents belong to the group of dense non-aqueous phase liquids (DNAPLs), which deeply penetrate aquifers, accumulating in the sub-surface [2,3] and forming lenses of recalcitrant, highly hazardous pollutants [4]. Several attempts have been described in the literature to fix these chemicals to cancel their negative effects [5,6,7,8]. However, it needs to be considered that the reactants degrading contaminants are not fixed in the soil, but can be moved and transported by water flow [9,10,11]. On the other hand, the physical or chemical properties might be different in different soils, hence further reaction of the selected reactants under the new conditions also needs to be taken into account. In other words, the retention procedures could be insufficient if such a further reaction takes place as the retained contaminant could be released under the new conditions and so the final fact would simply (and unfortunately) be to transfer the problem from one point to another.
Recently, the application of in situ chemical oxidation (ISCO) strategies to remediate chlorinated organic solvents from groundwater and soil has become more prominent as contaminants are degraded and transformed into less hazardous or even non-hazardous substances [12,13]. These strategies typically include the injection of pure solutions of various oxidising agents such as permanganate, peroxydisulphate, ozone, or Fenton’s reagent into the subsurface [4,14,15]. These reactants show high reaction rates and have the potential to remove large amounts of pollution in a short time [3,13]. The limitations of these strategies arise from the short persistence of the injected oxidants due to fast reactions with the contaminants [4,12,13,15,16,17]. To address this problem, studies have been carried out in recent years on the so called controlled release materials. These are capable of slowly releasing active products over a long time, thus being potentially able to guarantee the long-term effectiveness of in situ treatments [4,5,8,16,17].
This study focussed on the question of whether layered double hydroxides (LDHs) could be modified to degrade chlorinated organic solvents such as trichloroethene and 1,1,2-trichloroethane by intercalating commonly used oxidising agents. Recent publications have shown that LDHs intercalated with long-chain organic molecules (to modify the hydrophobicity of the interlayer) are able to absorb and hence immobilize target contaminants such as trichloroethene, 1,1,2-trichloroethane, or trichloromethane, inhibiting further spreading in the contaminated zone [18,19] and might serve as new reactants for remediation strategies. Due to the selected remediation strategy and the current conditions in the contaminated zone, a simple retention by adsorption of contaminants onto the alkyl chain of intercalated organic molecules might be unfavoured or even useless due to the instability of LDHs at more acidic conditions, which would lead to the destruction of the selected reactant. Hence, the use of modified LDH particles that are able to degrade target contaminants by oxidation processes might be a good alternative. LDHs might serve as support and stabiliser materials for selected oxidising agents during injection as the uncontrolled reaction and consumption might be inhibited, and guarantee that the selected oxidants persist in the subsurface after injection.
Layered double hydroxides are solids characterized by a structure built up of net positive charged brucite-like layers balanced by intercalated anions coexisting with an interlayer of water molecules [20,21,22]. The general formula of LDHs can be written as [MeII1−x MeIIIx(OH)2]x+[Am−x/m•nH2O]x− [21]. The brucite-like layers are formed by edge-sharing metal hydroxyl octahedra characterized by a partial divalent/trivalent cation substitution resulting in the net positive charge, with Mg, Ca, Mn, Fe, Ni, Cu, and Zn being the most common divalent cations (MeII), while Al, Mn, Fe, Co, Ni, Cr, and Ga serve as common trivalent anions (MeIII) [20,21,22]. In natural systems, the most abundant interlayer anions (Am−) are CO32−, OH, Cl, and SO42− [20,21,22].
If cations in the hydrocalumite-like materials are substituted by ions with large ion radii such as Ca2+, then the distance between neighbouring atoms in the main layer is increased (see Figure 1, right panel). The strict octahedral order in the main layer becomes disintegrated as it opens towards the interlayer and the calcium cation becomes seven-fold coordinated by one additional oxygen of the interlayer [20].
This study focussed on LDHs related to the hydrotalcite sub-group, with Mg2+ and Al3+ in a 3:1 molar ratio; furthermore, mentioned as Mg,Al-LDHs, and others related to the hydrocalumite sub-groups, with Ca2+ and Al3+ in a 2:1 molar ratio, subsequently named as Ca,Al-LDHs. Permanganate- and peroxydisulphate-ions were selected as the interlayer anions. LDHs were synthesised by the direct co-precipitation method under supersaturated conditions. The selected synthesis is a facile, rather rapid, and inexpensive route to directly synthesise the desired materials without having to produce precursor materials.
The studied LDHs could therefore be used as cheap, easily prepared, and environmentally friendly carrier materials in the form of LDHs incorporating commonly used oxidising agents, resulting in improved remediation materials.

2. Materials and Methods

2.1. Preparation of Samples

Chemicals and reagents were purchased from different suppliers with a minimum purity of 95% and were used without any further purification. Full data are included in the Supplementary Materials in Table S1. All samples were synthesised by the co-precipitation method [24] under supersaturated conditions with sodium hydroxide (NaOH) as the precipitating agent.
To synthesise the samples, different volumes of 1 mol/L aqueous solutions of the metal cation nitrates were mixed in a specific ratio (a Mg2+/Al3+ molar ratio of 3 was used for Mg,Al-LDHs samples, while a Ca2+/Al3+ value of 2 for samples Ca,Al-LDHs) and dropwise added using a peristaltic pump (1 mL/min) to 100 mL of an aqueous solution containing the stoichiometric amount of the anion (permanganate or peroxydisulphate, written as MnO4 or S2O8, respectively, in the names of the samples, see below) to be intercalated. Syntheses were carried out at optimised values of pH 9 (Mg,Al-LDHs) or pH 11 (Ca,Al-LDHs), which was maintained at constant by adding the required amount of 1 M NaOH using a Crison pH-burette 24. After completing the addition, the samples were aged in the mother liquor for 24 h (Mg,Al-LDHs) or three days (Ca,Al-LDHs) at room temperature under constant agitation.
Different aging times were selected from the information given in the literature and the previous experience of the authors regarding the synthesis of the selected materials. Data from the literature regarding MgAl-LDHs confirm that the well-formed hydrotalcite-like structure can already be formed with aging times of one day or less [18,25,26]. The synthesis of hydrocalumite-like materials using co-precipitation is usually carried out at higher temperatures [27,28]. In this study, as the aging of the samples was carried out at room temperature to avoid the formation of undesired side products, a longer aging time was selected.
To avoid carbonation of the samples from atmospheric CO2, all solutions were prepared with decarbonated water, which was prepared by boiling and then bubbling nitrogen; a nitrogen atmosphere was maintained along all syntheses and aging steps. Synthesis of Ca,Al-LDHs samples was carried out in a glove box under a nitrogen atmosphere to minimize the influence of atmospheric CO2. Afterwards, all samples were centrifuged and washed with decarbonated, distilled water, and dried in an oven at 40 °C for 24 h.
Four samples with intercalated oxidizing agents were prepared and labelled with their desired composition of the main layer either as Mg,Al-X or Ca,Al-X, where X stands for the intercalated oxidizing agent (i.e., permanganate or peroxydisulphate).

2.2. Characterisation Methods

To analyse the elemental chemical composition of the synthesised samples, an inductively coupled plasma optical emission spectrometer (ICP-OES, Ciros Vision, Spectro, Kleve, Germany) equipped with a semiconductor detector (CCD) was used. The detailed procedure followed is described in File S1.
Solutions of the batch experiments were analysed using headspace-programmed temperature vaporiser-gas chromatography-mass spectrometry (HS-PTV-GC-MS). Pre-tests revealed that a dilution factor of 300 for all solutions was necessary to ensure the best possible results (please refer to File S2 for detailed instructions about the used procedure).
Crystalline phases were identified by powder x-ray diffraction (PXRD) using a D5000 x-ray diffractometer (Bruker, Billerica, MA, USA) with 2θ geometry equipped with a 1200 W Ni-filtered copper x-ray anode (λ = 1.5406 Å/0.154 nm). The measurements were performed in the 2–75°2θ range with a step size of 0.05°2θ at a counting time of 1.5 s per step.
Thermogravimetric analysis (TG) and differential thermal analysis (DTA) curves were recorded simultaneously on an SDT Q600 (TA Instruments, New Castle, DE, USA) using γ-Al2O3 previously calcined overnight at 1200 °C in open air, as a reference material for the DTA measurements. All samples were heated up to 900 °C at a heating rate of 5 °C/min under O2 flow (50 mL/min). The gases released during the heating process were analysed online using a coupled mass spectrometer (MS, ThermoStar GSD 301 T2, Pfeiffer Vacuum, Aßlar, Germany).
Fourier transform infrared spectroscopy (FTIR) analyses were carried out using a FTIR spectrometer (Spectrum Two, Perkin Elmer, Waltham, MA, USA) with Spectrum software. The KBr pellet method was used for the preparation of the samples. Measurements were carried out in the 4000–400 cm−1 range, averaging 20 scans to improve the signal-to-noise ratio at a nominal resolution of 4 cm−1.
The particle size distributions of the samples were determined by laser diffraction (Mastersizer 2000, Malvern, Malvern, UK) with software provided by the manufacturer. The samples were dispersed in water, stirred at 800 rpm, and pumped (2050 rpm) to the measuring unit. Deagglomeration of the particles was attained by in situ ultrasonic treatment for 5, 10, or 15 min.

2.3. Chlorinated Organic Solvent Oxidation

Batch experiments were carried out using 1–2 g of the selected dried LDH sample, which was dispersed in 200 mL of deionized water under gentle stirring. A final contaminant concentration of 0.4 mmol/L was set by adding the required volume of either trichloroethene (TCE, 3.6 μL) or 1,1,2-trichloroethane (1,1,2-TCA, 3.7 μL) using a Hamilton Microliter syringe. Control experiments containing contaminants but no LDH contaminants of the same concentration were prepared to follow the evaporation of the contaminants during the experiments. Bottle necks were wrapped with Teflon tape and bottles (120 mL amber glass bottles, Sigma-Aldrich) were securely closed using plastic caps with moulded-in Polytetrafluoroethylene (PTFE)/silicone septa (Sigma-Aldrich). To minimize the evaporation of the added chlorinated organic solvents, all bottles were stored upside down during the batch experiments. Constant agitation during the experiments was ensured by placing all bottles in an isothermal water bath (WNB 49, Memmert, Büchenbach, Germany) coupled with an agitator (SV 49, Memmert) set at 105 strokes per minute. Portions of the solutions containing 1,1,2-TCA were taken after 2, 4, 6, 24, and 48 h after the addition of the selected LDHs. Portions of the solutions containing TCE were sampled after 2, 24, 48, 72 and 144 h after the addition of LDHs.
Batch experiments were stopped after 48 h (TCE) or 144 h (1,1,2-TCA) by filtering the samples. The filtering cake was dried on filter paper in a desiccator for two days at room temperature and securely stored until used for PXRD measurements.

3. Results and Discussion

3.1. Characterization of the Synthesized Materials

3.1.1. ICP-OES

The chemical elemental analysis data for Ca, Mg, Al, Mn, and S for all synthesised samples are given in Table 1. The Ca/Al, Mg/Al, and anion/Al (X/Al) molar ratios, calculated from the chemical element analysis data, are also included.
The Mg/Al molar ratio was close to 3 for samples MA–X, a maximum deviation of 4% being calculated for sample MA–S2O8, while the Ca/Al molar ratio for the CA–X samples was close to the expected value of 2, the maximum deviation being only 3% for both samples. These values are in a range that is usually accepted to yield well-defined hydrotalcite- and hydrocalumite-like structures [20,21]
The MnO4/Al3+ molar ratios for the permanganate intercalated samples were acceptably close to the expected value of 1, and a maximum deviation of 8% was calculated for sample MA–MnO4. This ratio was somewhat lower than unity, which means that additional anions should exist in the interlayer. The presence of carbonate from atmospheric CO2 seems to be excluded due to the precautions taken during the preparation of the samples. FTIR and TG/DTA analyses (see the following related sections) showed that nitrate from metal ion precursors was present in the synthetic LDHs. For the peroxydisulphate intercalated samples, the expected value of 0.5 was not reached. The large deviation (up to 40% for sample CA-S2O8) might be due to the simultaneous intercalation of other anions existing in the reaction medium (e.g., nitrate from the metal cations solution or carbonate).

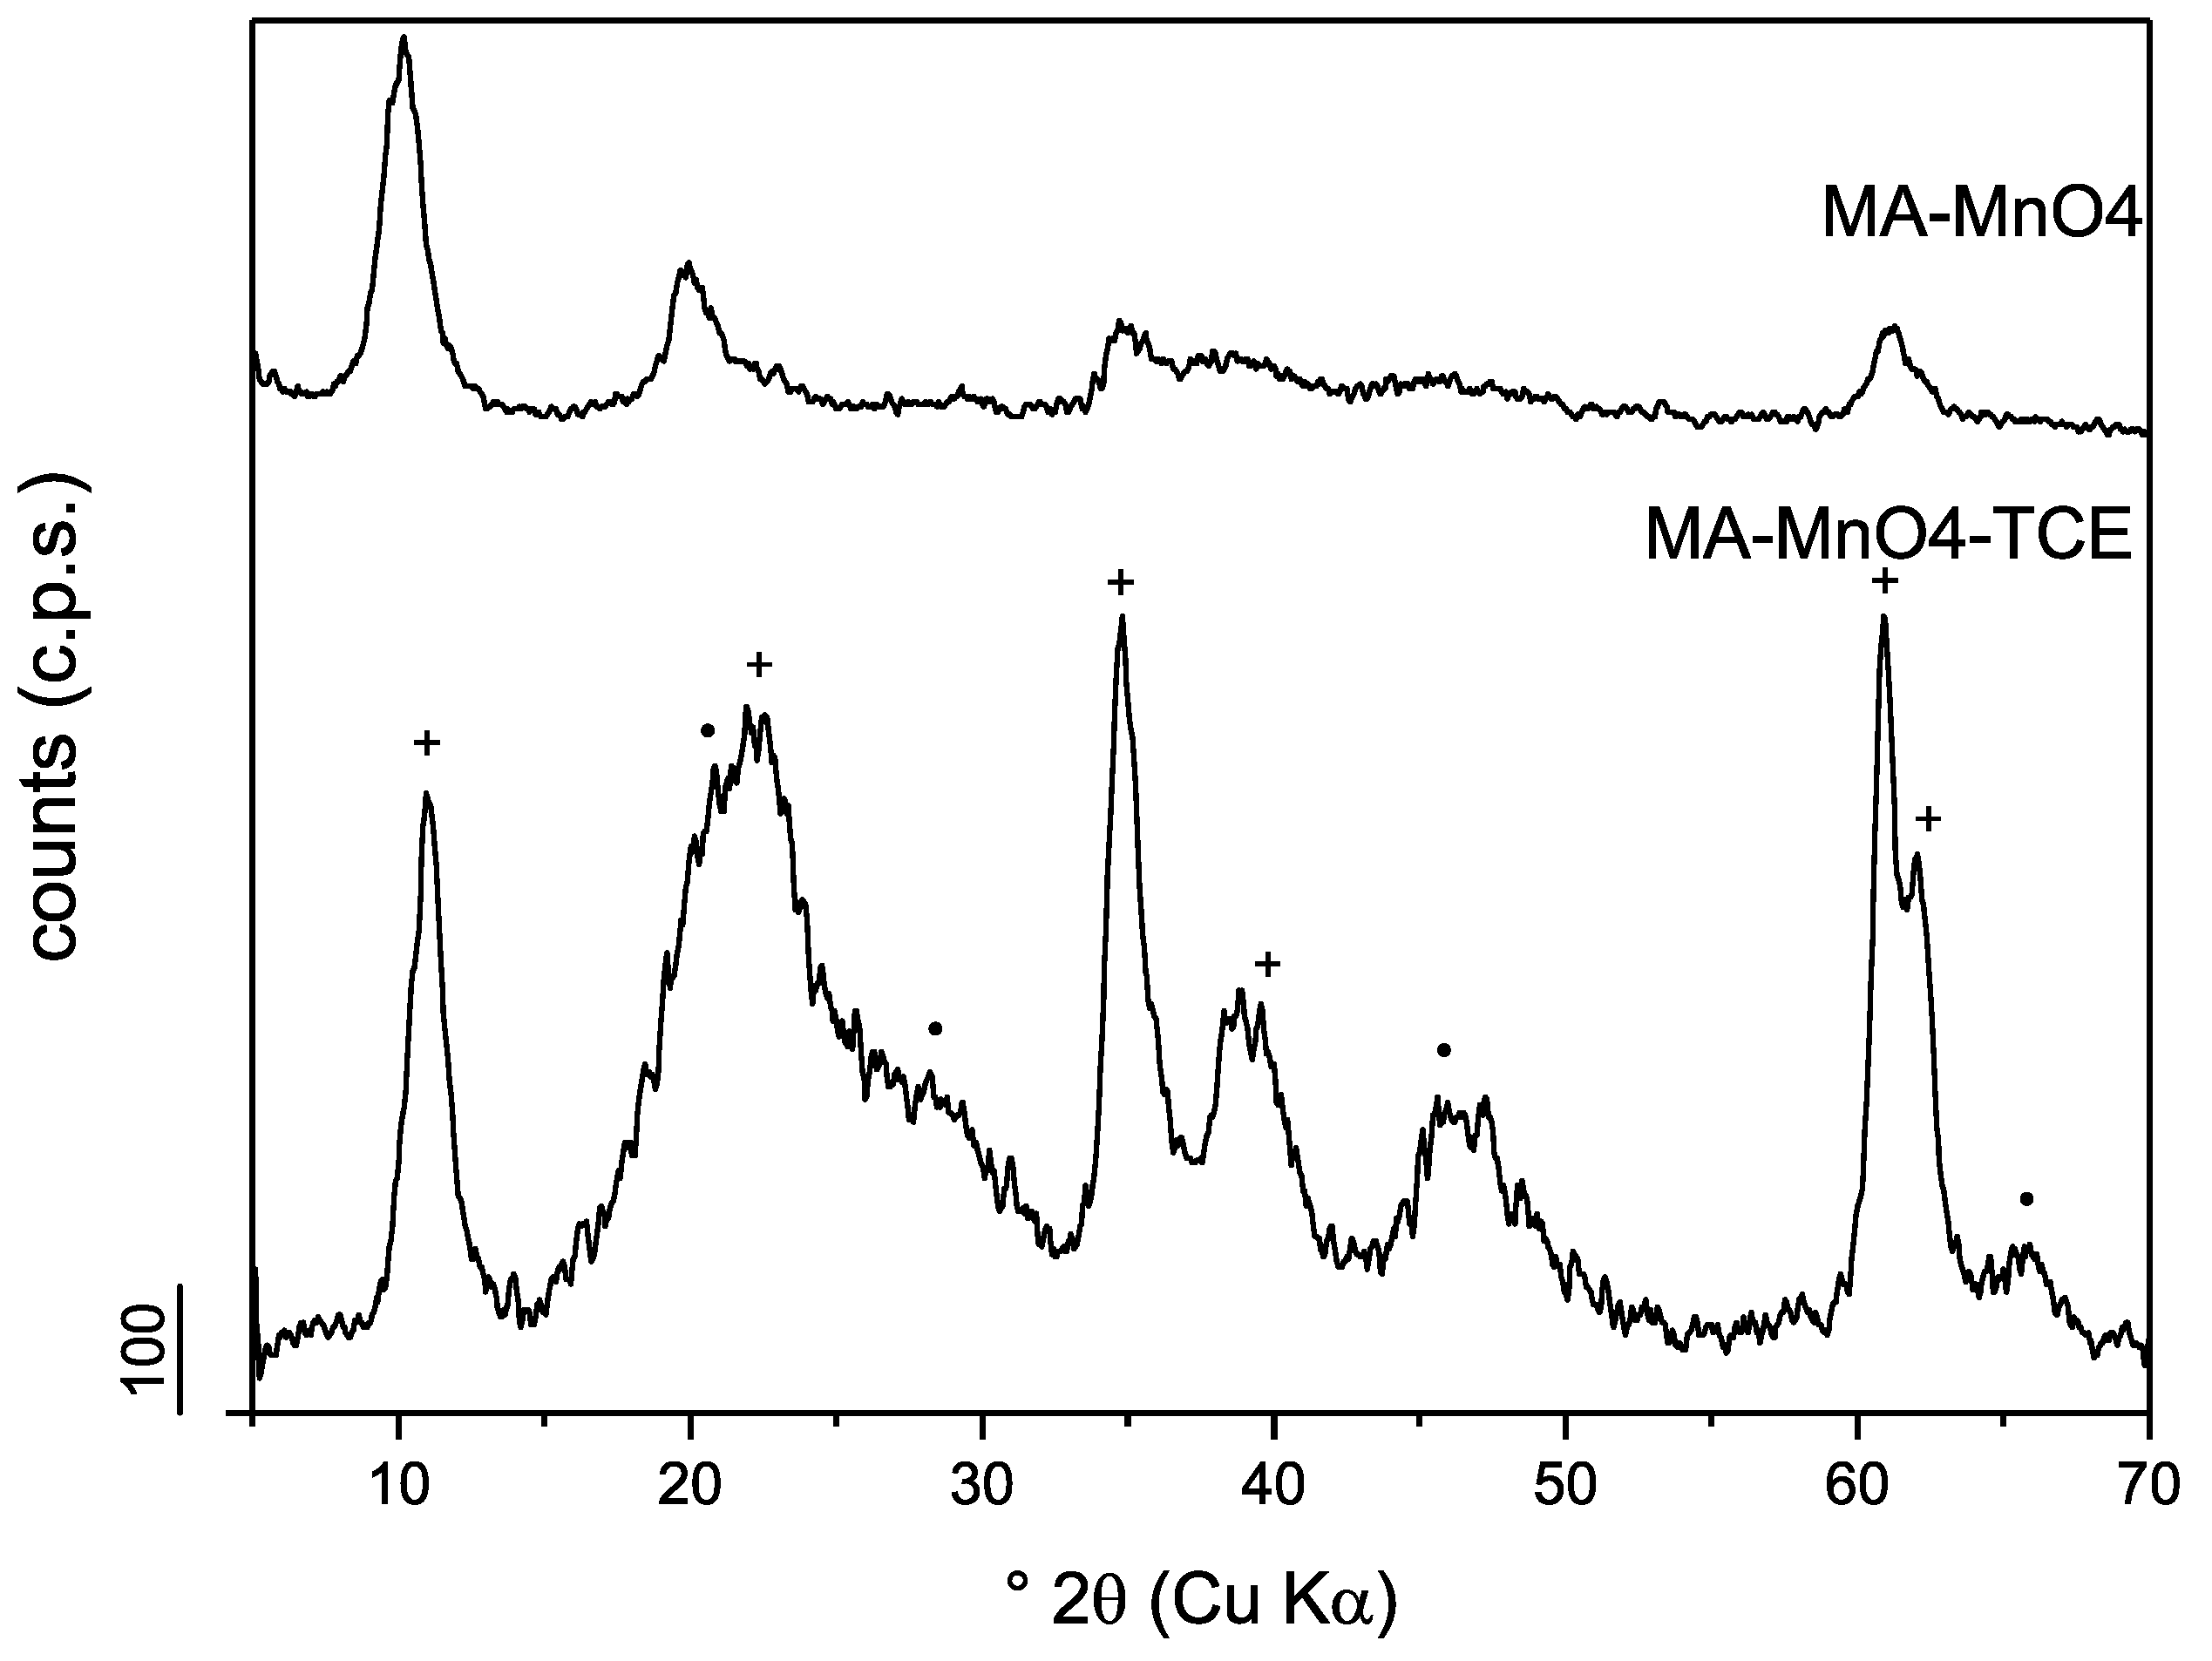
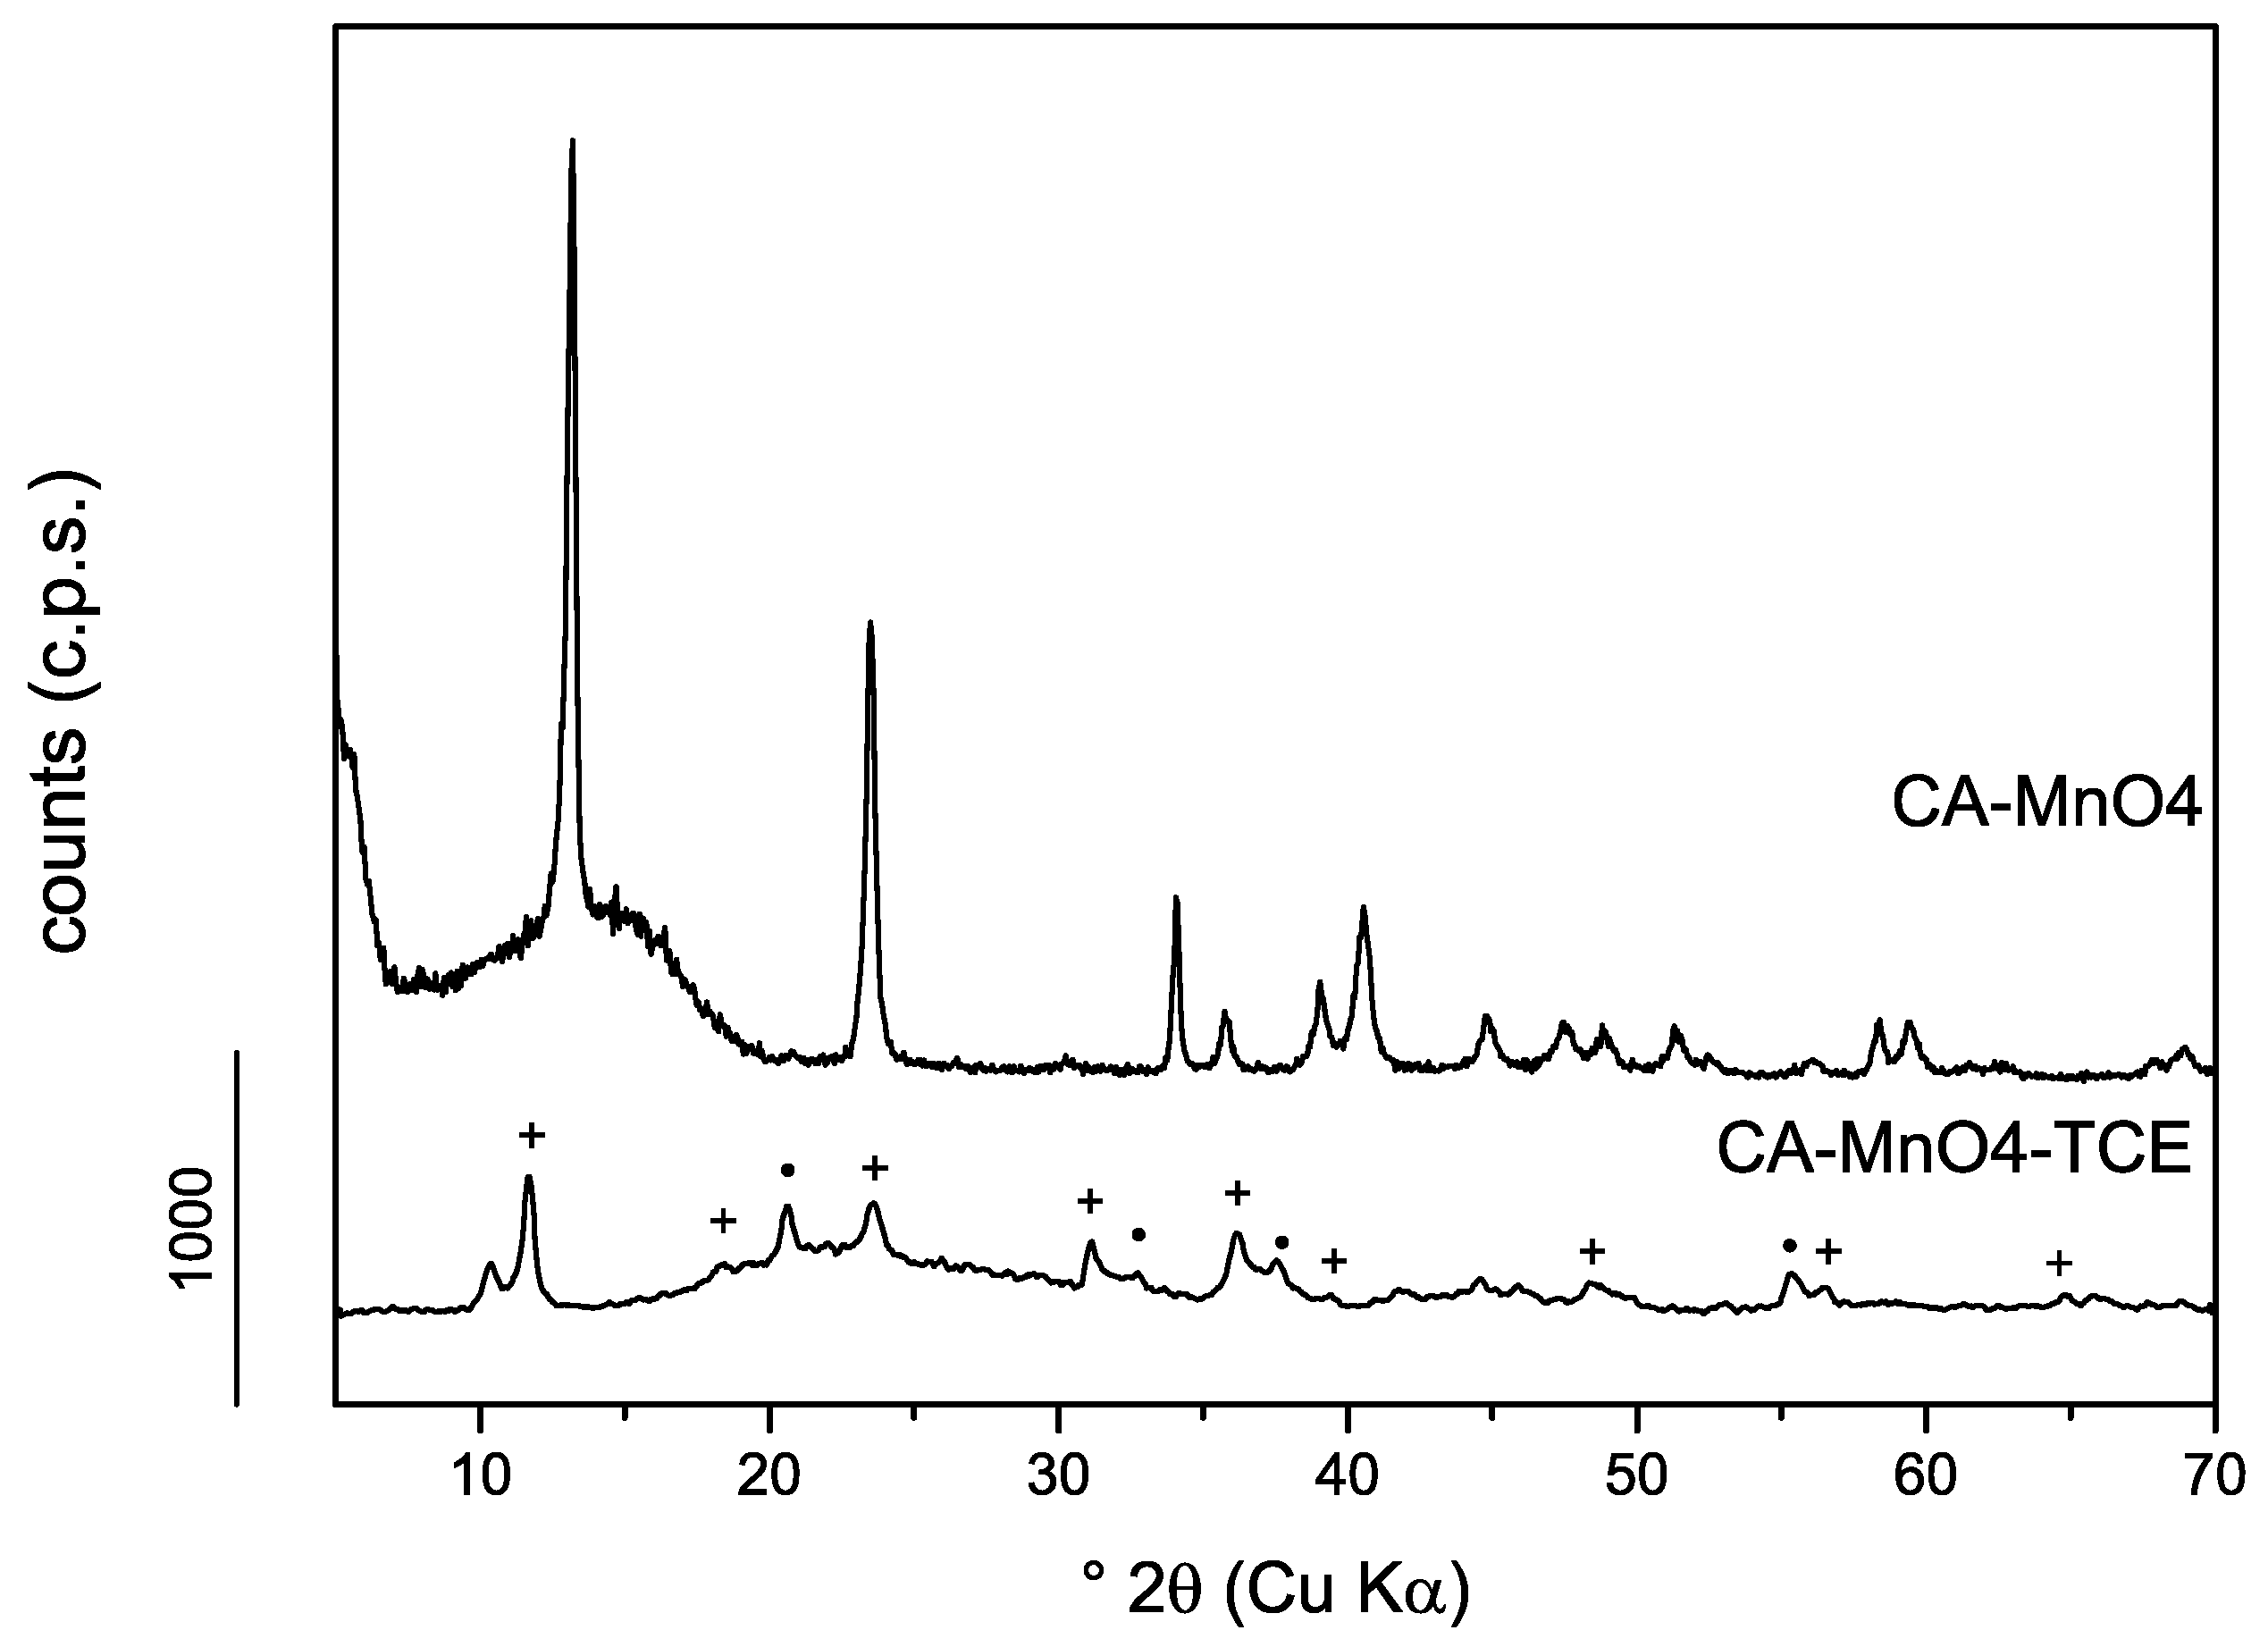
3.1.2. Powder X-Ray Diffraction

The PXRD patterns of the synthesised samples are included in the Figures S1–S4. All of the studied samples showed diffraction patterns typical for layered double hydroxides with hydrotalcite- and hydrocalumite-like structures for our MA–X and CA–X samples.
Mg,Al-LDHs showed a first peak at ca. 10°2θ (d-spacing = 8.7 Å for MA–MnO4, 8.8 Å for MA–S2O8), which was due to the reflection of the (003) planes in hydrotalcite-like structures with a rhombohedral 3R stacking of the main layers [21]. For these samples, the lattice parameter c corresponded to three times the spacing value of this peak (i.e., c = 26.1 Å for MA–MnO4 and c = 26.4 Å for MA–S2O8). Lattice parameter a gives the average distance between two adjacent cations in the main layers. It can be calculated as twice the d-spacing of the reflexion of the (110) planes, which is responsible for the first peak of a doublet at approximately 60°2θ; a = 3.03 Å for MA–MnO4 and a = 3.02 Å for MA–S2O8, which were in relatively good agreement with the reported data for similar LDHs [18,20,29]. The typical doublet at approx. 60°2θ could not be easily detected in the PXRD diagrams of these samples, and only a single peak was recorded. Hence, the here stated values must be considered with caution and might deviate due to the quality of the studied samples. Possible explanations are the low crystallinity of the Mg,Al-samples due to the selected aging time and stacking faults in the crystal lattice, most likely as a turbostratic disorder of the cations in the layers in in c-direction,, which generates the so called “shark’s fin” peak shape of the (h0l) reflections in the range from 35–50°2θ.
Ca,Al-LDHs likewise showed a first peak at approximately 10°2θ, which corresponded to the reflection of the (003) planes of CA–MnO4 (d-spacing = 8.6 Å) and (006) planes for the sample CA–S2O8 (d-spacing = 8.7 Å). The variation in the planes responsible for the diffractions originates because Ca,Al-LDHs can exhibit two different stacking sequences, namely, rhombohedral 3R polytype with X = MnO4 and rhombohedral 6R polytype with X = S2O82− [22,30]. Consequently, the lattice parameter c corresponds to three times the spacing of this first peak for the permanganate intercalated sample (c = 25.8 Å) and six times the spacing for the peroxydisulphate intercalated sample (c = 52.0 Å). In these samples, the lattice parameter a differs largely from those stated for the Mg,Al-LDHs as the presence of the larger calcium cations, if compared to the magnesium counterparts, in the main layer of the LDHs result in increased distances between neighbouring atoms in the brucite-like layers [20,22]. For the Ca,Al-LDHs samples, a values of 5.73 Å (CA-MnO4) and 5.75 Å (CA-S2O8) were observed, which were in very good agreement with the values reported in the literature [20,26,27,28,29,30,31,32].
The longer aging time of the Ca,Al-LDHs samples led to the development of intense, sharp peaks, which indicated a well crystallized material had formed for these samples. In contrast, Mg,Al-LDHs samples rather showed broader, weaker peaks, indicating a less crystalline material. The crystallite size was calculated for the first peak, corresponding to the spacing of the LDH in the c-direction, using the Scherrer equation [33]. The resulting crystallite sizes are given in Table 2. It should be noticed that despite the different nature of the intercalated anion, the crystallite size in the direction perpendicular to the layers was roughly the same for both Mg,Al-samples on one side, and for both Ca,Al-samples on the other. It should also be noted that the values for the Ca,Al-samples were significantly larger than for the Mg,Al-LDHs, probably as a result of the longer reaction time, allowing a slow increase in the crystallite size from the mother liquor during synthesis.

3.1.3. Thermal Analysis and Evolved Gas Analysis

The thermal decomposition of the synthesised materials was studied using TG-DTA coupled to a MS to determine the gases evolved upon increasing the temperature. The curves are included in the Figures S5–S8 and that for sample MA–MnO4 is included in Figure 2. All curves of the studied material revealed the expected mass losses that are typical for Mg,Al- and Ca,Al-LDHs [34,35], respectively (i.e., three mass loss steps for the Mg,Al-LDHs, while four for the calcium counterparts, respectively), a difference clearly related to the nature of the layers. Significant differences can be also observed on changing the nature of the intercalated anion. The thermal behaviour of these solids was also different from that reported for nitrates or carbonates containing LDHs, where the interlayer anions are removed as a gaseous species upon heating at or above ca. 500–600 °C. However, in the current study, the decomposition of permanganate or peroxydisulphate led to permanent anions, which were not expected to be removed upon heating in the experimental conditions and temperature range here applied.
The values of the mass losses recorded in each step are summarized in Table 3.
In all cases, the first mass loss can be ascribed to the removal of externally adsorbed water (if any) and that of the interlayer water, as confirmed by mass spectrometry of the evolved gases for sample CA–MnO4, which showed a signal at m/z = 18 (H2O+).
The amount of interlayer water (see Table 4) was calculated from the mass content of the layer metal cations and interlayer anions (Table 1) and this first mass loss. To perform this study, it was assumed that MnO4 (or S2O82−) were the only species existing in the interlayer, together with water molecules. The error was not too large, making this approach or considering the presence of nitrate and/or carbonate, to fully balance the positive charge of the layers, especially in the case of the S2O8 samples. The DTA curves of the studied samples showed medium intensity endothermic peaks for the Mg,Al-LDHs and high intensity endothermic peaks for the Ca,Al-LDHs in the same temperature range. In all cases, a small mass loss was recorded above ca. 550 °C, which might correspond to the release of occluded water molecules. However, the main mass loss, at intermediate temperatures, occurred in a single step for the Mg,Al-samples, but in two steps for the Ca,Al-LDHs.
The main loss took place between ca. 150 and 600 °C, but the behaviour observed for the permanganate and peroxydisulfate intercalated samples was quite different and are discussed separately.
For the Mg,Al-LDHs, a second mass loss was recorded up to 530 °C, which was due to the decomposition of the interlayer phases and evolution of water by condensation of the hydroxyl groups of the main layer. Only NO2, as co-intercalated nitrate to balance the excess of the net positive charge of the main layers and being present due to the use of Mg2+ and Al3+ nitrate salts during the synthesis of the reactants, was detected in this second mass loss step, together with water vapour, evolved for sample MA–MnO4. While for sample MA–S2O8, NO2, together with a minor amount of CO2, was evolved, together with SO3 coming from the decomposition of peroxydisulphate. In this last case, it seems that the interlayer anions were S2O82− and NO3, which came from the initially used magnesium and aluminium nitrates used for the synthesis of the samples as well as CO32−, most likely intercalated from atmospheric CO2. This amount was qualitatively rather low as the amount of evolved gases was not quantified. The presence of nitrate was confirmed by FTIR spectroscopy (see below).
The question remains about the thermal decomposition of interlayer permanganate anion. It is well known [36] that thermal decomposition of KMnO4 takes place in the same temperature range, leading to a mixture of KMnO4, K2MnO4, and O2. Formation of birnessite should be discarded, as an oxidising atmosphere was used in the current case. In our case, evolution of O2 was not monitored, as oxygen being the carrier gas, small changes in its partial pressure from the thermal decomposition of MnO4 would be negligible. However, it should be noted that this is the pattern for the decomposition of bulk KMnO4, not of MnO4 existing in the interlayer, which can undergo decomposition in a different fashion. The recorded mass loss was caused by the transformation of the intercalated permanganate to some sort of manganese oxide, most likely Mn3O4, haussmanite, or MnO2, pyrolusite, which is confirmed by the evolution of O2, together with the release of NO2, from co-intercalated nitrate, and water from main layer hydroxyl groups. This mass loss was accompanied in the DTA curve by a strong endothermic effect. The shape of the DTA curves for samples MA–MnO4 and MA–S2O8 were rather similar as well as the corresponding TG curves. However, the gases detected by MS in the second mass loss effect for sample MA–S2O8 corresponded to CO2, NO2, and SO3, together with H2O. This means that, in this case, in addition to S2O82−, the interlayer also contained small portions of nitrate and carbonate, the tentative origin of which has been described above. In addition, the partial decomposition of the S2O82− anion was also observed, with the evolution of SO3.
The Ca,Al-LDHs samples showed a different behaviour from that shown by the permanganate-containing sample. The first and last steps extended in similar temperature ranges for both sets of samples, but the main difference is that the intermediate mass loss splits into two well defined processes. From the MS of the evolved gases, it is concluded that the second mass loss (13.8% of the initial sample mass for the sample CA–MnO4, and 9.4% for sample CA–S2O8) corresponded to the removal of water mainly through the condensation of a layer of hydroxyl groups. For the third mass loss (15.4% and 23% for samples CA–MnO4and CA–S2O8, respectively), the MS showed the release of NO2 for sample CA–MnO4and of NO2 and SO3 for sample CA–S2O8. For the reasons given above, the evolution of MnO4was not monitored.
All synthesised samples showed similar patterns in their thermal decomposition. The Mg,Al-LDH samples showed a three step thermal decomposition of the solids. The first one corresponded to the removal of the interlayer and eventually externally adsorbed water molecules. The second one corresponds to the condensation of the layer of hydroxyl groups with the evolution of water, together with NO2 from the interlayer nitrate, the anions in the original reagents, which complete the electrical balance in the solid, and SO2 for sample MA–S2O8. The third step probably corresponds to the evolution of gases formed during the early stage of the decomposition, which resulted being occluded and are released only at high temperatures.
On the contrary, the CA-LDHs showed a decomposition in four steps. The first and the fourth step probably had the same origin as the first and the third one in the decomposition of the Mg,Al-LDH samples. The second one seems to correspond to the evolution of water vapour from the layer of hydroxyl groups, and the third one to the decomposition of the interlayer counter anions (i.e., peroxydisulphate and nitrate). Processes involving the interlayer species occur simultaneously with the condensation of layer hydroxyls for the MA–LDH samples, but not for the CA-LDH ones.
The calculated formulas of the studied compounds, which were based on the results of the TG-DTA-MS analyses, are given in Table 4. The content of magnesium, calcium, aluminium, and the interlayer anions MnO4 and S2O82− were calculated based on the results of the ICP-OES analyses (see the raw data in Table 1). The water content in the interlayer was calculated from the results of the thermal analyses of the solids. The nitrate content included was calculated based on the electrical balance between the layers and the interlayer, considering that NO2 evolution was observed in all cases.

3.1.4. FTIR Spectroscopy

All samples studied showed absorption bands typical for layered materials related to the hydrotalcite- and hydrocalumite-subgroups. These bands can be assigned to vibrations of the hydroxyl groups of the main layers, water molecules of the interlayer, the intercalated anions, and of the lattice of the main layers [37,38,39,40]. The precise positions of the bands in all recorded spectra are given in Tables S2 and S3.
Figure 3 shows the FTIR spectra of the studied samples. For the Mg,Al-LDHs samples, a broad absorption band was recorded between 3575–3345 cm−1, which corresponded to the stretching vibration of hydroxyl groups in the interlayer and the main layer of the LDH. For Ca,Al-LDHs, this broad absorption band was recorded as a double band with vibrations of the hydroxyl groups in the main layer corresponding to the first band and those of the two interlayers in the second band. The broadening of this absorption band is caused by hydrogen bonds. The absorption band at 1632 cm−1 corresponds to the bending vibration of the interlayer water molecules. All samples showed an intense absorption band at 1385 cm−1, which is most likely caused by the stretching vibrations of nitrate species [29,41] due to insufficient washing of the samples. From the chemical elemental analysis, it can be assumed that some of these nitrate anions are in the interlayer to completely balance the positive charge of the brucite-like layers. The absorption band at 785 cm−1 corresponded to bending vibrations of the metal hydroxide groups of the main layer [29,41]. These could only be found in the spectra of the Ca,Al-samples. Absorption bands recorded below 700 cm−1 were caused by the metal-hydroxyl translation modes in the lattice of the LDHs.
In addition to the absorption bands typical for every LDH, these spectra showed further bands caused by their respective interlayer anion. Hence, permanganate intercalated samples showed absorption bands caused by the stretching vibrations of the tetrahedral-coordinated permanganate-anion at 904 cm−1 (v3) and 826 cm−1 (v1) [29,41,42]. Sample CA–MnO4 additionally showed an absorption band at 786 cm−1, corresponding to the symmetric stretching vibration of the tetrahedrally-coordinated permanganate-ion in the interlayer of the LDH [42].
The peroxydisulphate intercalated samples showed additional adsorption bands caused by different vibrations in the peroxydisulphate-ion. Bands at 1312 cm−1, 1271 cm−1, and 1111 cm−1 corresponded to the stretching vibrations of the SO42− group [43]; sample CA–S2O8 only showed the last mentioned band. Bending vibrations of the sulphate groups led to bands at 685 and 667 cm−1 [41,43], which were only recorded for sample MA–S2O8. The stretching vibrations of the S–O–O–S bridge caused absorption bands at 1060 cm−1 (vas) and 836 cm−1 (vs) [41,43]. The absorption band at 423 cm−1 can also be assigned to bending vibrations of the S–O–O–S bridge in the peroxydisulphate-ion [41].
The evaluation of the FTIR spectra of the synthesised samples confirmed the successful intercalation of the desired interlayer anions permanganate and peroxydisulphate, together with the probable presence of nitrate anions.

3.1.5. Particle Size Distribution

The particle size distribution was measured for all synthesised samples on the dried sample material. All samples were treated under ultrasound for 5 up to 15 min to minimize the aggregation of the primary particles. All diagrams are included in the Figures S9–S12.
The Mg,Al-LDH samples revealed a maximum at around 300 µm with a sharp decrease in the curve for values above this maximum. Below the maximum, the recorded curve decreased more steadily, revealing shoulders at approximately 30 and 2 µm. Application of 15 min ultrasound resulted in the evolution of a second maximum at 30 µm for sample MA–S2O8, whereas no significant differences could be seen in the respective curve of sample MA–MnO4 after 15 min of ultrasound treatment. The evolution of the second maxima in sample MA–S2O8 might be due to a re-agglomeration of small particles, which were separated during the ultrasound treatment [44].
Ca,Al-LDHs samples showed a maximum at 100–100 µm in the curve of the untreated sample. Towards a larger or smaller particle size, the curve decreased slowly. The curve for sample CA–MnO4 showed one shoulder at ca. 5 µm, which was absent in the curve of sample CA–S2O8. However, this curve showed shoulders at 0.5 and 125 µm. Upon 15 min ultrasound treatment, the mentioned shoulders evolved into new maxima at 0.5 and 3.5 µm in both CA–LDHs. Small shoulders could be seen at 20 µm and 80 µm.
Sample MA–MnO4 was the only sample to show a monomodal particle size distribution at 110 µm, the other synthesised samples revealed bimodal particle size distributions.
The d(0.5) values defined as the median particle size in µm, which divides the population exactly into two equal halves for all samples, are given in Table 5.
As shown in Table 5, the Mg,Al-LDHs samples generally had larger particle sizes than the Ca,Al-LDHs ones. The peroxydisulphate intercalated samples showed smaller average particle sizes compared to the permanganate intercalated LDHs. Upon ultrasound treatment, the average particle size of all samples decreased significantly, the largest decrease being detected for sample CA–MnO4 (reduced by a factor of 34). Such a behaviour should be closely related to the specific nature of the layers and to a lesser extent, to the interlayer anion. It is probable that small differences in the surface properties could account for these findings. It seems that the development of particles and their size distribution is strongly dependent on the precise stirring conditions during synthesis and aging as well as on the precise drying conditions.

3.2. Reactivity Studies

All chromatograms of the HS-PTV-GC-MS measurements of the batch experiments using trichloroethene (TCE) or 1,1,2-trichloroethane (1,1,2-TCA) as the contaminants after the selected reaction times are given in the Figures S13–S20. Experimental solutions containing TCE were sampled after 2, 24, 48, 72 and 144 h after the addition of LDHs. Samples of the experimental solutions containing 1,1,2-TCA were taken after 2, 4, 6, 24 and 48 h after the addition of the selected peroxydisulphate intercalated LDHs. An exception was made for the peroxydisulphate intercalated samples as the literature reports a slower reaction of inactivated peroxydisulphate with contaminants [45]. Usually, it is activated to produce free sulphate radicals showing a higher reactivity (103–105 times faster) and oxidation potential towards different contaminants (2.6 V for the radicals compared to 2.1 V for the peroxydisulphate ion) [45]. Subsequently, experimental solutions using peroxydisulphate intercalated LDHs as the reactants were first sampled after 24 h.
Resulting peaks at different retention times in the GC curves were assigned to different compounds using coupled MS spectroscopy. It was found that in the experiments here carried out, the target contaminants TCE and 1,1,2-TCA had a retention time of 2.4 min and 2.9 min, respectively. Measurements on blank solutions, containing the two selected contaminants but in the absence of any LDH, were carried out to examine the evaporation rate of the contaminants during the batch experiments. Results of the blank measurements on TCE are given in Table S4 in the Supplementary Materials. The calculated concentrations, by integrating the area of the corresponding peak at a retention time of 2.4 min, revealed a total evaporation of 39.4% TCE compared to the initial concentration of 0.4 mmol/L; for 1,1,2-TCA, an evaporation of 20.3% was calculated (see Table S5).
Quantitative calculations were carried out for each experiment to estimate the amount of intercalated oxidising agent that reacted with the selected target contaminant. In addition to this, the initial oxidant:contaminant ratios were calculated for each experiment (see Table S4 for precise values of the experiments using TCE and Table S5 for experiments addressing 1,1,2-TCA).

3.2.1. TCE–Mg,Al-LDHs System

The curves for both samples (MA–MnO4 and MA–S2O8, Figures S13 and S14) showed a clear decrease over time at the height of the peak corresponding to TCE; the largest decrease was recorded for sample MA–MnO4 (Figure S13). Sample MA–MnO4 showed a first decrease after 24 h by approximately one fourth of the initial peak height and no further significant decrease was observed after 48 and 72 h. A final decrease was detected after 144 h by approximately one tenth compared to the initial peak height. Additionally, all curves showed a small peak at 2.95 min, the retention time of 1,1,2-TCA, which did not show any significant changes over time. This is most likely to be present due to the memory effect of the selected GC column.
For sample MA–S2O8 (Figure S14), the curves showed a rather different evolution of the peaks corresponding to TCE. The intensity of the TCE peak at a retention time of 2.4 min slightly increased after 24 h reaction, if compared to the height after 2 h reaction. When the reaction time was further extended to 48 and 72 h the intensity decreased, reaching a final height, after 72 h reaction, of one fifth of the initial height. Again, the additional peak at 2.95 min corresponded to 1,1,2-TCA and is caused by the memory effect of the selected column.
To identify the evolution of the contaminant concentration in solution over time, the area of the TCE peak at different reaction times was integrated and normalized to the values of the blank solution measurements. Calculated contaminant concentrations of the experiments using Mg,Al-LDHs are given in Table S4 as mmol/L and % of the initially added amount of the contaminant (0.4 mmol/L). Figure 4 shows the evolution of the contaminant concentration (%) over time (red squares) compared to the loss of contaminant due to evaporation, measured in blank solutions (black dots).
The permanganate intercalated Mg,Al-LDH turned out to be especially effective at degrading TCE in aqueous solutions. The initial oxidant:TCE ratio was calculated to be 116:1 for this experiment. After a reaction time of 144 h, only 0.007 mmol/L TCE could be detected, which corresponded to 1.7% of initial TCE concentration. This indicates a total TCE loss of 98.3%, 39.4% due to evaporation, and 59.0% was the result of the successful degradation of TCE by MA–MnO4. This maximum decrease in the TCE concentration in the solution was reached after a reaction time of only 24 h. No further change in the contaminant concentration could be seen upon increasing reaction time. Quantitative calculations revealed that only 1.5% of the intercalated permanganate was reduced to MnO2 (concluded from the PXRD measurements) upon reaction with TCE.
For the experiment using MA–S2O8, the initial peroxydisulphate:TCE ratio was calculated to be 50:1. Results revealed a final TCE concentration in solution of 0.062 mmol/L after 72 h, which was equivalent to 15.6% of the initial TCE concentration. This indicated a total TCE loss of 84.5% over the course of this experiment, and 45.1% by the degradation process. The curve progression of the evolution of the TCE concentration in solution, compared to that of the blank measurements, indicates that the degradation process did not finish, even after 144 h. Quantitative calculations revealed that less than 0.9% of the intercalated peroxydisulphate reacted with TCE within this time frame.
Based on the results of the HS-PTV-GC-MS measurements, the PXRD measurements were solely carried out on the reacted sample MA–MnO4, where the reaction was completed after 144 h, to examine the evolution of the crystalline phases formed upon reaction with TCE. Such a study was not carried out for sample MA–S2O8 as the reaction was not completed even after 144 h. Figure 5 compares the diffraction pattern of the used sample MA–MnO4-TCE (bottom) with that of the freshly synthesised, unreacted sample MA–MnO4. It should be noted that after the reaction, the solid showed a brown colour, thus suggesting the absence of permanganate (purple, oxidation state +7) or manganate (green, oxidation state +6), but the presence of manganese oxides, where its oxidation state should be lower than +6, upon reaction with TCE.
Compared to the pattern of the raw material, the main peaks of the reacted sample slightly shifted towards a higher °2θ, with the first maximum at 10.9°2θ, indicating a decrease in the interlayer spacing for the used sample from 8.71 Å to 8.05 Å after the reaction.
In other words, the interlayer permanganate species reacted with TCE, leading to the formation of new phases in the interlayer.
Most of the new peaks recorded could be assigned to a chloride-intercalated hydrotalcite-like material. Constatino and Pinnavaia [26] reported chloride intercalated Mg,Al-LDHs with an interlayer spacing of 7.8 Å, which was in good agreement with our findings. The remaining peaks could be assigned to manganese oxide (MnO2). This indicates that the initially intercalated permanganate-ions were exchanged by chloride ions, formed as a by-product of TCE oxidation by permanganate, which is in turn reduced to MnO2.

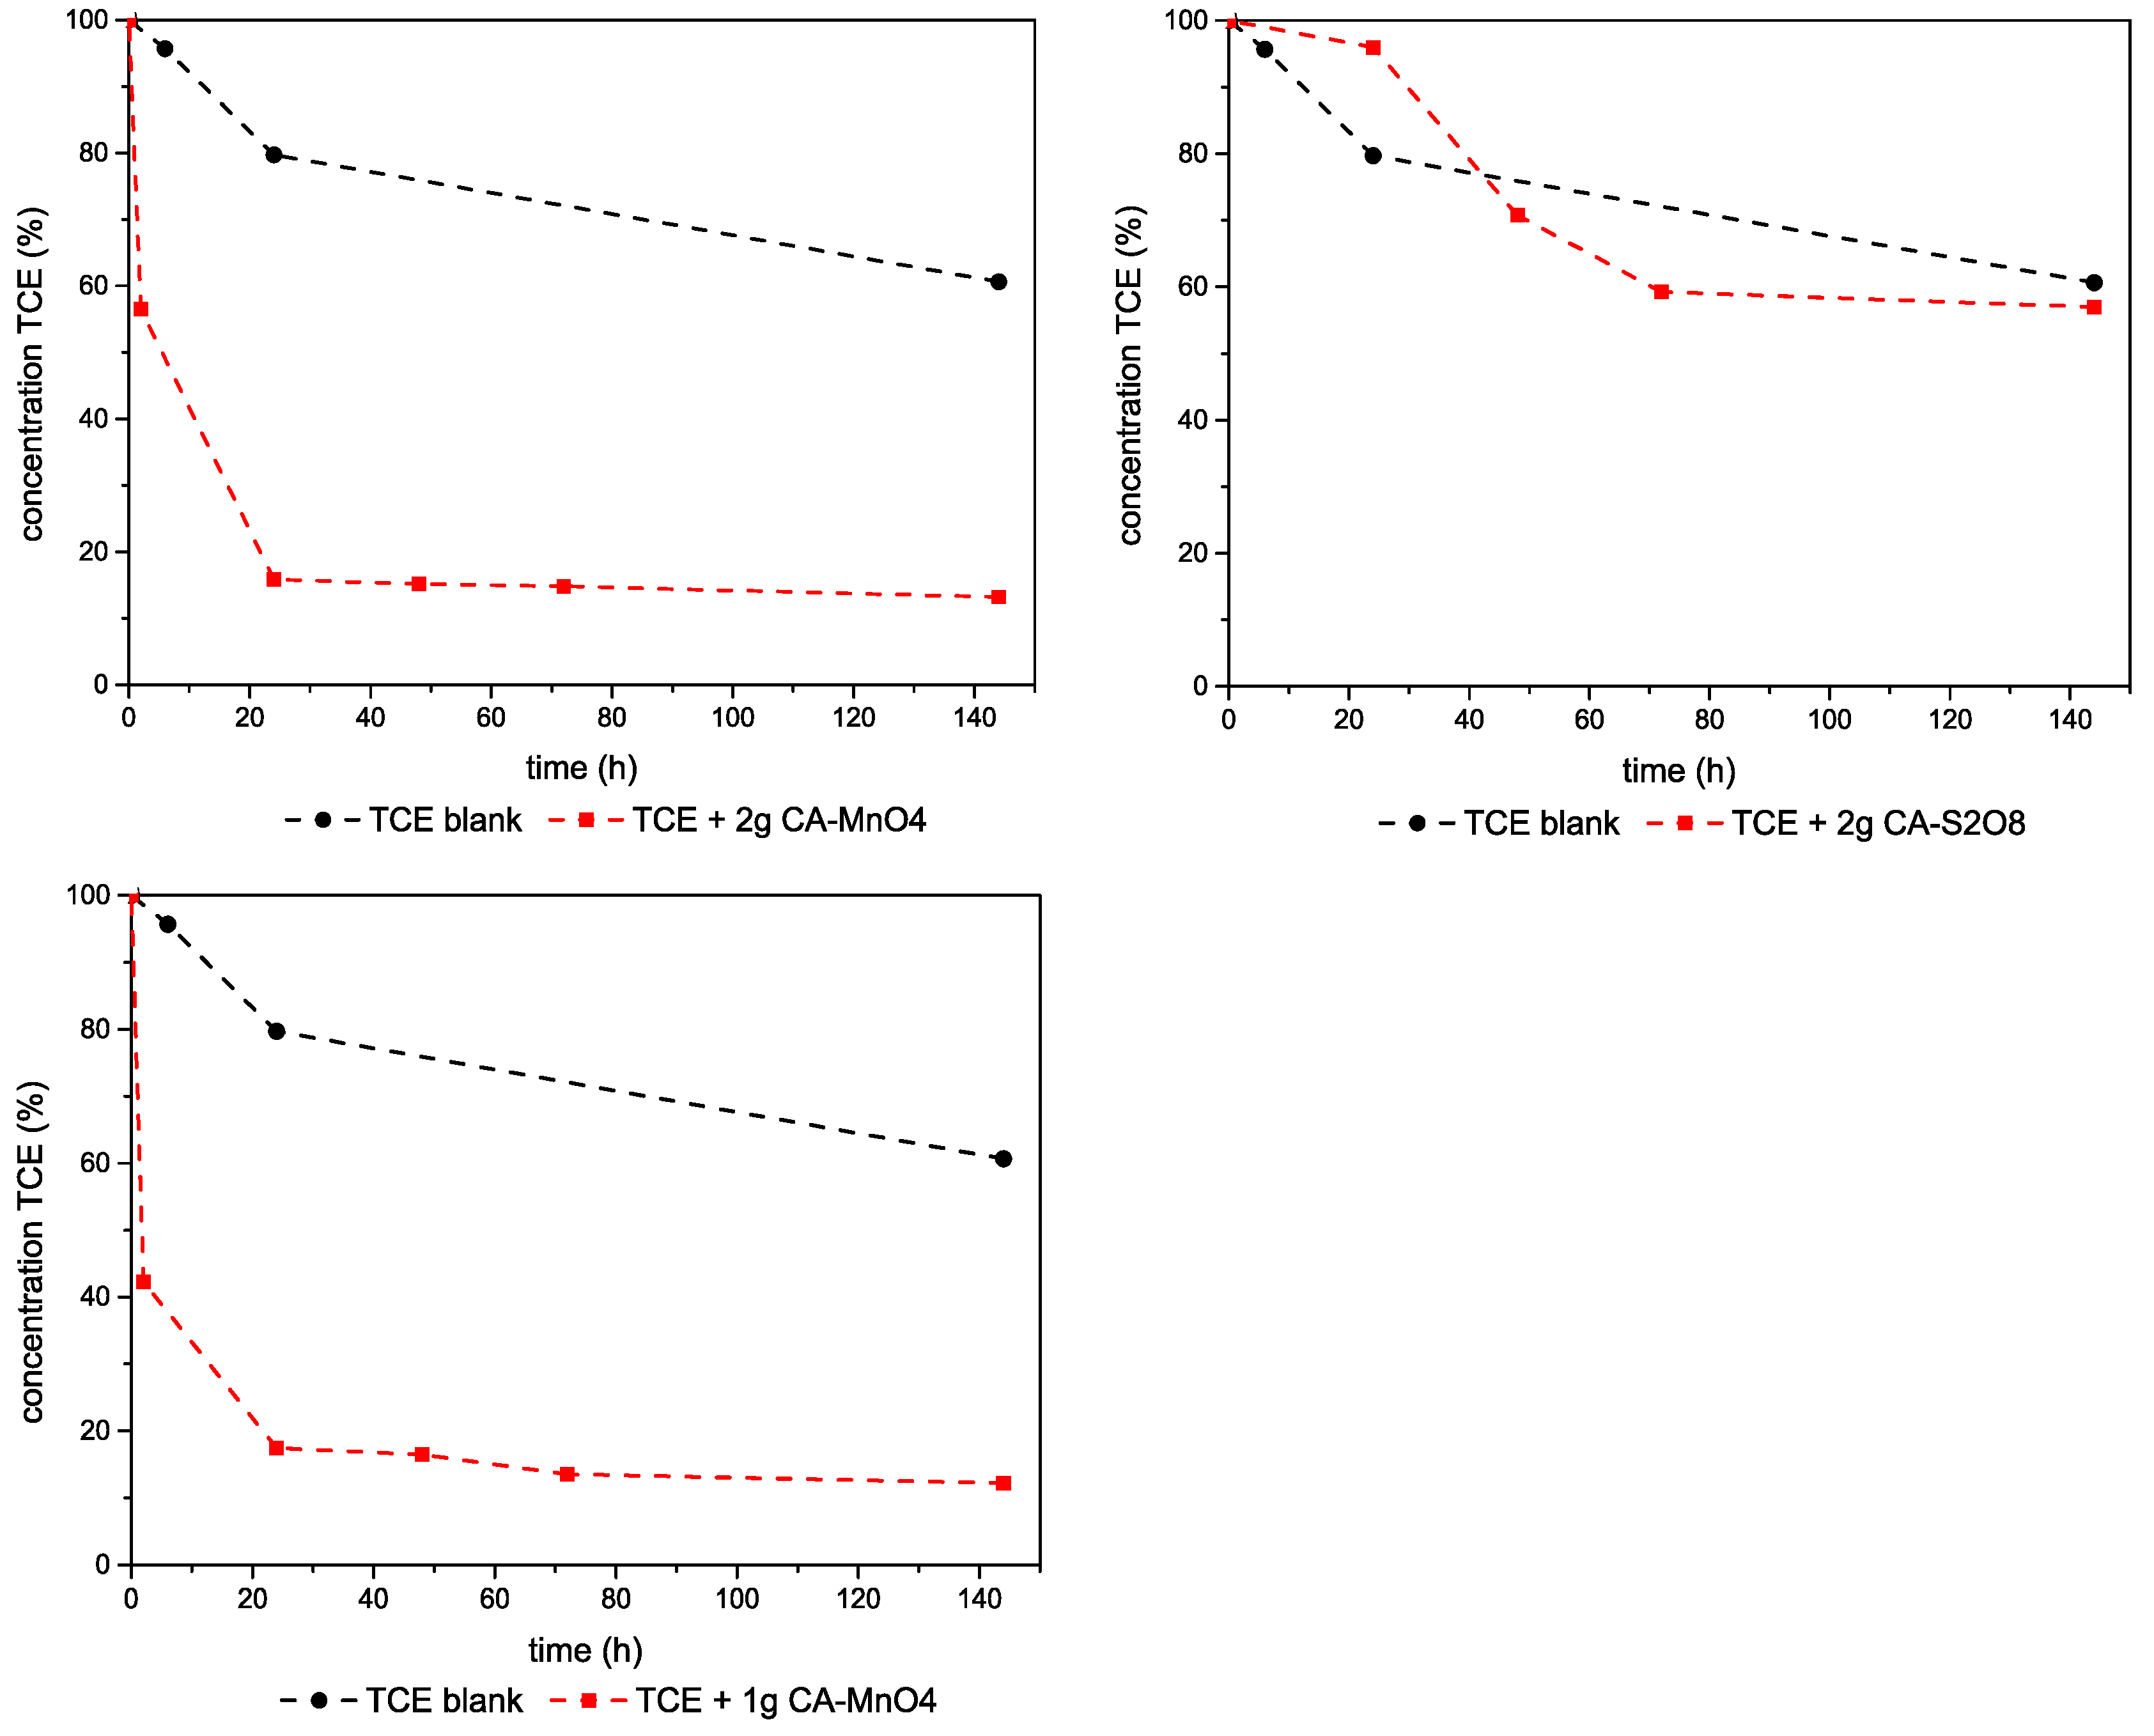
3.2.2. TCE–Ca,Al-LDHs System

All curves of the experiments carried out on TCE degradation using Ca,Al-LDHs are included in the Figures S15–S17. The curves revealed a linear evolution of the TCE peak over time, the largest decrease being observed for sample Ca,Al-MnO4 by approximately one third of the initial peak height. Curves related to experiments using 2 g CA-MnO4 showed no further significant peak evolution after 24 h of reaction time. The curves of the experiment using 1 g CA-MnO4 showed only a slightly slower evolution of the TCE peak, reaching the minimum peak height after 72 h.
The curves for the reactions carried out with sample CA–S2O8 showed a smaller decrease in the TCE peak height and no further decrease after 72 h of reaction. The peak height was decreased by one half compared to the initial peak height.
Calculated contaminant concentrations of the experiments using Ca,Al-LDHs are given in Table S4 in mmol/L and% of the initially added amount of the contaminant (0.4 mmol/L). Figure 6 shows the evolution of the contaminant concentration (%) over time (red squares) compared to the loss of contaminant due to evaporation, measured in blank solutions (black dots).
For the experiments using 2 g or 1 g CA-MnO4, the initial permanganate:TCE concentrations were calculated as 131:1 and 66:1, respectively. The final TCE concentration of 0.05 mmol/L (13.18% and 12.18%, respectively) was calculated for both experiments, indicating that the solid degraded 47.5% and 48.5% of TCE, respectively. No further change in the contaminant concentration could be seen upon increasing the reaction time after 24 h. It was estimated by quantitative calculations that only 1% and 1.9%, respectively, of the intercalated permanganate were reduced upon reaction with TCE.
The results of the experiment with CA–S2O8 gave a final TCE concentration in solution of 0.228 mmol/L (56.99% of the initial concentration; initial peroxydisulphate:TCE was 41:1). This sums up to a total TCE loss of only 43%, from which only 3% was the result of the degradation by the LDH, a poor degradation behaviour compared to the other synthesised reactants tested in this study. This might be due to a lack of intercalated oxidising agent, which was insufficient to degrade TCE, but as other experiments in this study have shown, was enough to degrade 1,1,2-TCA. Quantitative calculations revealed that presumably less than 0.1% of the intercalated peroxydisulphate was reduced upon reaction with TCE. Further investigation is needed to doubtlessly answer this question as the literature showed that the selected total reaction time should be enough to degrade TCE by inactivated peroxydisulphate [46]. Based on the here gathered results, we cannot propose any potential use of the peroxydisulphate intercalated Ca,Al-LDH regarding its potential use in remediation strategies addressing trichloroethene.
PXRD measurements were carried out on the used Ca,Al-MnO4 sample. Figure 7 shows the XPRD pattern of sample CA–MnO4 after the reaction with TCE (bottom) and compared to the pattern of the unreacted sample (top).
The main peak was recorded at values of 10.3°2θ (d-spacing 8.6 Å) for the original sample, and 11.7°2θ (7.5 Å) after the reaction. Evaluation of the pattern corresponding to the used sample revealed hydrocalumite (pattern 00–054–0851), a chloride intercalated Ca,Al-LDH with the formula [Ca4Al2(OH)12]Cl2•10H2O [31] as the main phase (main peak at 11.4°2θ, 7.7 Å). The remaining peaks could be assigned to manganese oxide (MnO2).
The occurrence of hydrocalumite and manganese oxide confirmed that the studied LDH successfully degraded the selected contaminant. As the contaminant is oxidised by the intercalated permanganate ion, the contaminant degrades, releasing chlorine ions into the solution while the permanganate ions are reduced, forming manganese oxides. To balance the net positive charge of the main layers of the Ca,Al-LDH, the now free chloride anions are intercalated, forming hydrocalumite. As for the experiments described above, throughout the experiments, the solid showed a colour change from purple to brown, indicating the transformation of the permanganate ions to manganese oxides and thus confirming the reaction of the LDH and the interlayer anion, respectively, with TCE.
Based on the results of the MS analyses and the calculated TCE concentrations in solution, it can be concluded that intercalation has no negative effect on the oxidative potential of permanganate. No significant variations were detected using LDHs with a different main layer composition.
The results presented here also indicate a large potential of sample MA–S2O8 as a possible reactant for the chemical oxidation of TCE, while CA–S2O8 showed no significant degradation of the contaminants.

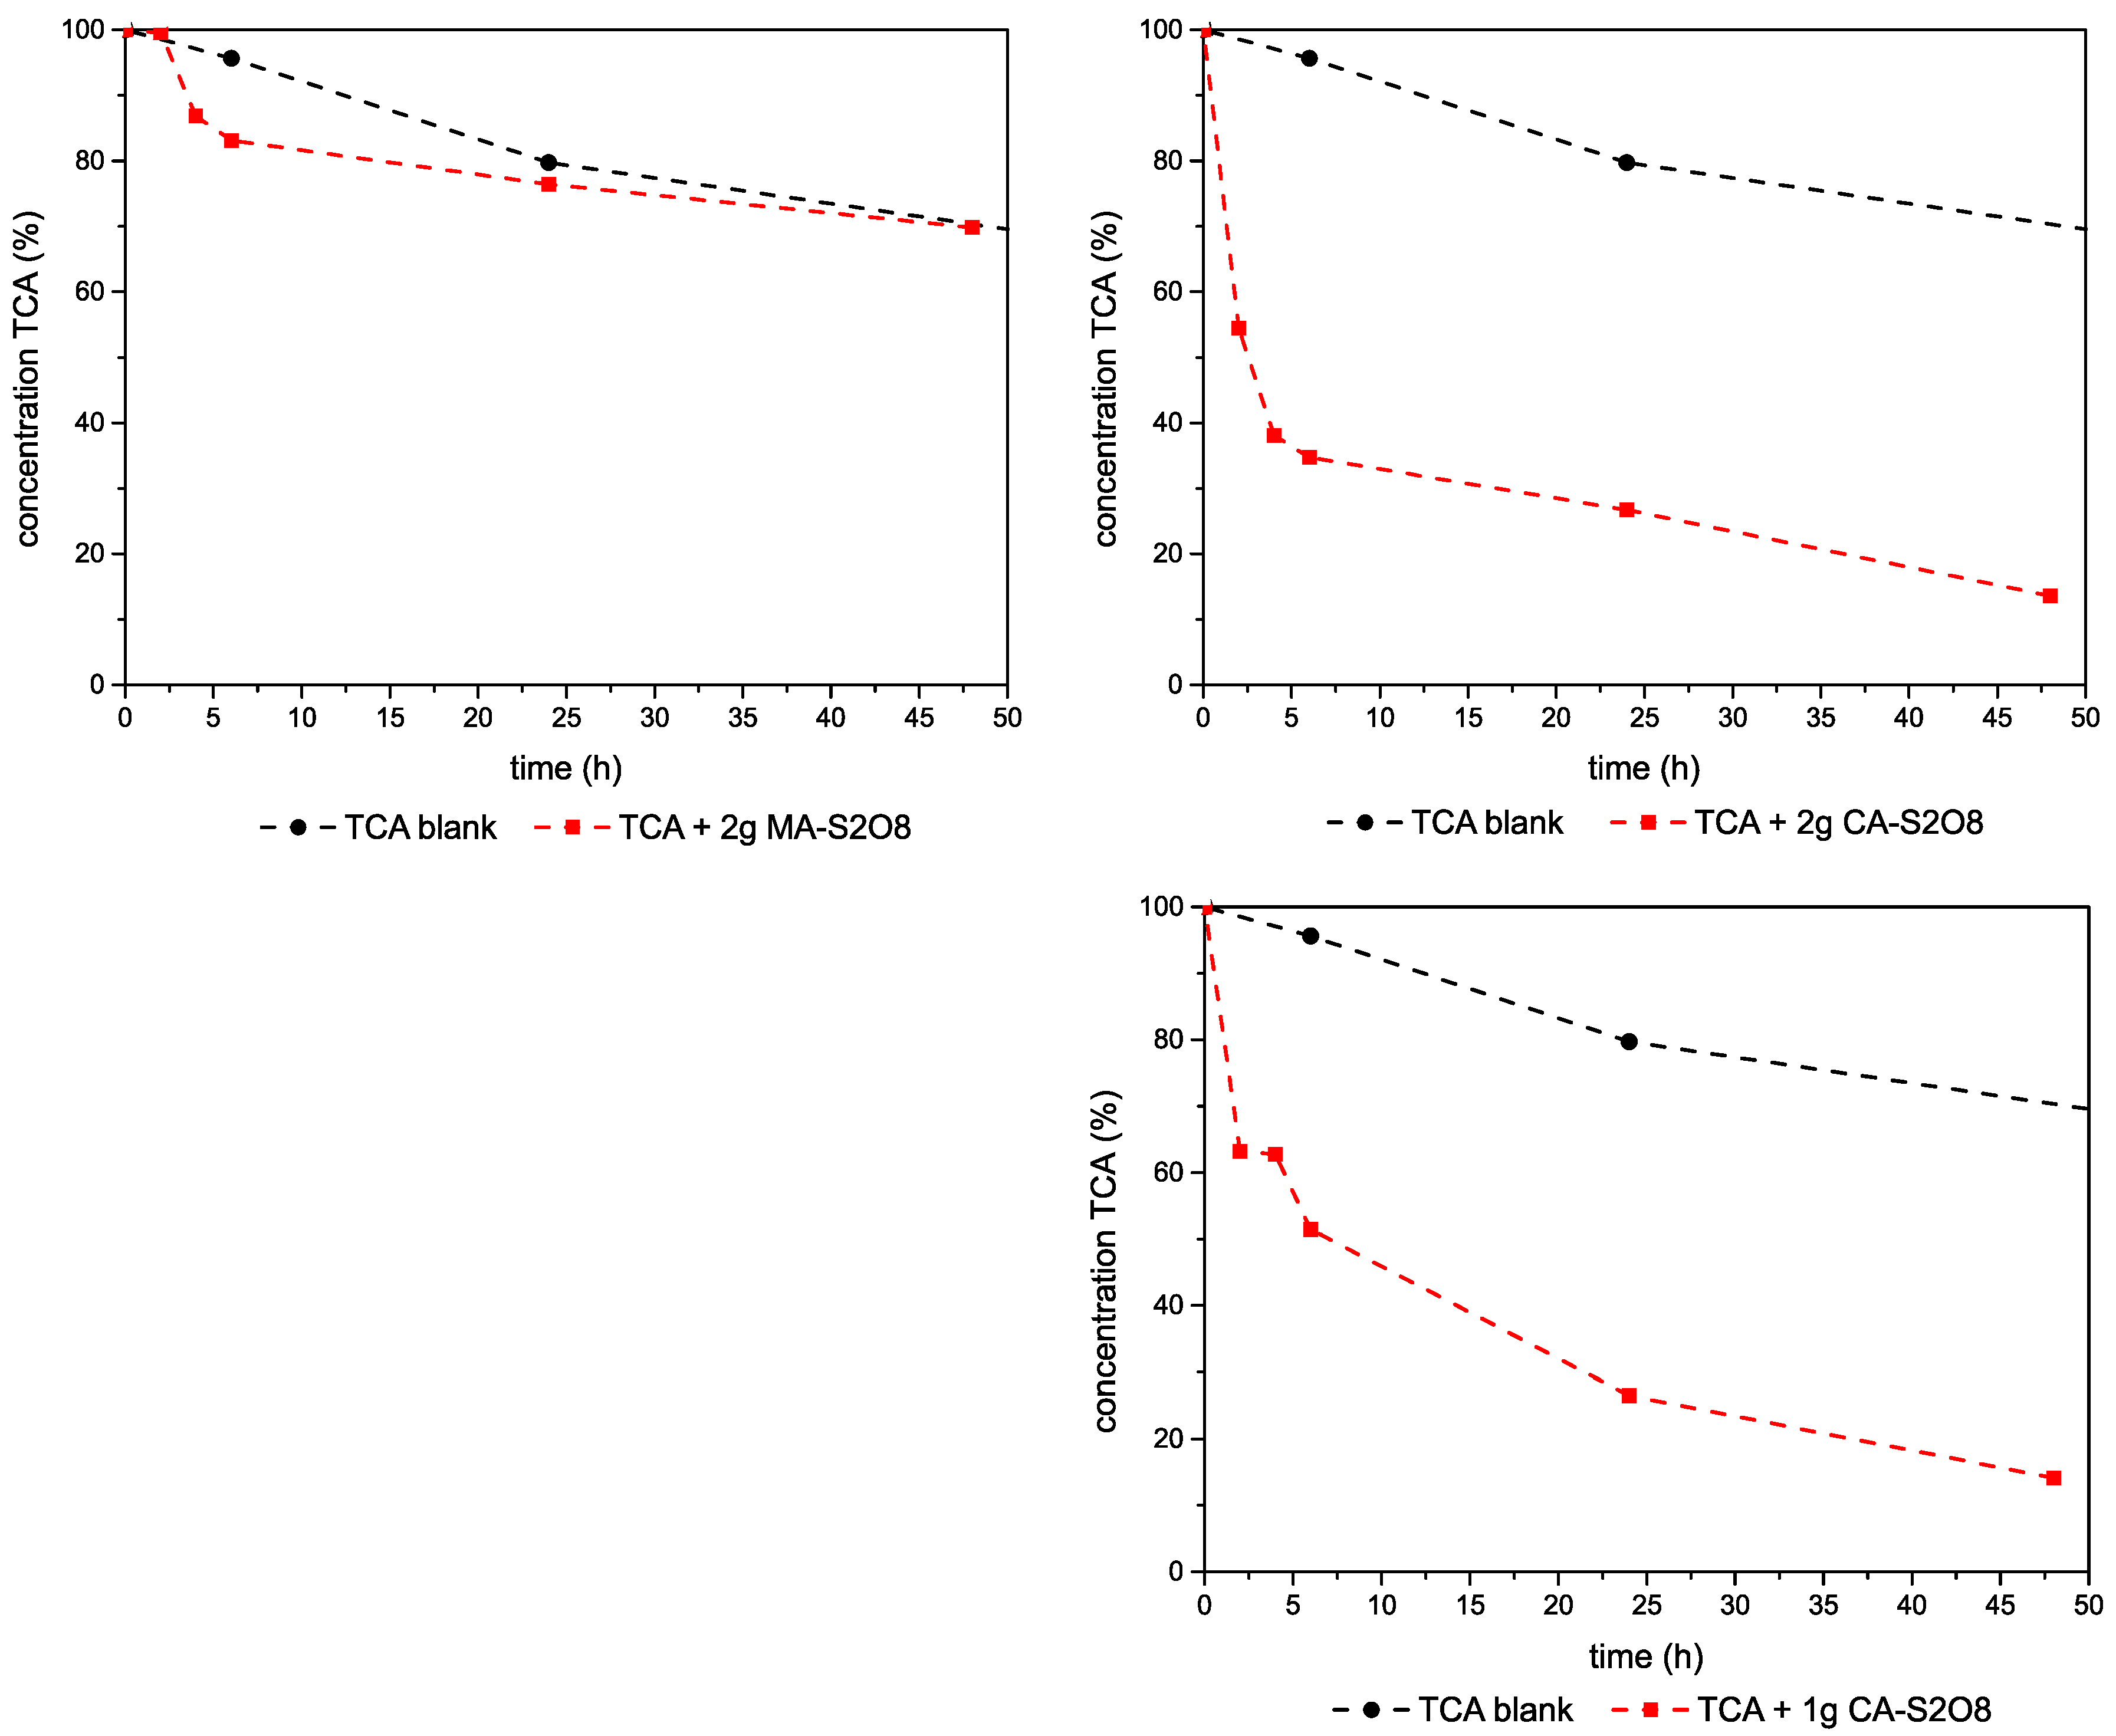
3.2.3. Experiments–1,1,2-TCA-Mg,Al- and Ca,Al-LDHs

As shown in the literature, permanganate is not an effective oxidising agent to degrade chlorinated alkanes [3], and peroxydisulphate intercalated LDHs were exclusively used to carry out batch experiments addressing 1,1,2-TCA. Initial peroxydisulphate:TCA ratios were calculated as 50:1 for the experiment using MA–S2O8, 41:1 using 2 g CA–S2O8, and 20:1 using 1 g CA–S2O8, respectively.
Curves of the HS-PTV-GC-MS measurements for these experiments are included in the Figures S18–S20.
A linear evolution of the peaks at 2.95 min (1,1,2-TCA) could be observed in the curves of all three studied samples. The peak height decreased upon increasing reaction time; curves for experiments using 1 or 2 g of MA–S2O8 showed the largest changes in the peak height, decreasing down to one third of the original intensity, when comparing the curves recorded after 2 h of reaction time. The peak at 2.47 min was most likely caused by contamination of the GC column caused by previous measurements and insufficient flushing. It should be noted that as the intensity of the 1,1,2-TCA peak at 2.95 min decreased, a new peak at 1.54 min developed, suggesting that the species responsible for this peak was the result of 1,1,2-TCA degradation by peroxydisulphate. Despite the known issues to identify compounds that show retention times within the range of the solvent front, this peak could be assigned to dichloroethene (DCE, M = 96.95 g/mol), one degradation product of 1,1,2-TCA in the dehydrochlorination pathway [47,48]. This finding clearly confirms the successful degradation of the target contaminant by the peroxydisulphate intercalated Ca,Al-LDH.
Figure 8 shows the calculated 1,1,2-TCA concentrations in solution. Calculated contaminant concentrations in the blank and experimental solutions are given in Table S5.
The decrease in the 1,1,2-TCA concentration in the experiment using MA–S2O8 showed no significant degradation of the target contaminant as the 1,1,2-TCA loss was mainly caused by evaporation. No degradation products were detected in the MS spectra. Contrary to the Ca,Al-LDHs, no significant degradation of 1,1,2-TCA was observed for the magnesium containing counterpart MA–S2O8. Quantitative calculations confirmed that less than 0.3% of the intercalated peroxydisulphate reacted with the TCA. Further investigation needs to be carried out to study the reaction of MA–S2O8 with 1,1,2-TCA.
Results of the experiments using CA–S2O8 (Table S5) indicate a final 1,1,2-TCA concentration in solution of 13.58% (0.054 mmol/L) using 2 g of the LDH and 14.11% (0.056 mmol/L) using 1 g of the solid, after a total reaction time of 48 h, resulting in a total contaminant loss of 86.4% and 85.9%, respectively. Considering a contaminant evaporation of 20.3%, calculated based on the blank solution measurement, nearly 66% of the 1,1,2-TCA was degraded in 48 h. Total reaction times, estimated by comparing the curve progression of the experimental solution with that of the blank solution, varied regarding the amount of LDH used in each experiment; the reaction seemed to be finished after 6 h using 2 g LDH and after 24 h using 1 g LDH. It was determined by quantitative calculations that only 1.5% and 1.4% of the intercalated peroxydisulphate were reduced upon reaction with TCA using 2 g and 1 g CA-S2O8, respectively. Considering the initial oxidant:TCA ratio, the reduction of peroxydisulphate in these experiments was relatively small.
Combining these results, it can be stated that the used contaminant was degraded by the peroxydisulphate intercalated Ca,Al-LDH, as confirmed by the presence and evolution of the degradation pathway metabolite cis−1,1,2-dichloroethene. Based on these results, peroxydisulphate intercalated Ca,Al-LDH may have a large potential to be used for in situ chemical oxidation processes addressing 1,1,2-TCA.
PXRD measurements were carried out on the reacted sample CA–S2O8 to examine the evolution of the mineral phases due to the reaction of the LDH with 1,1,2-TCA. Figure 9 compares the diffraction pattern of the reacted sample (bottom) with that of the freshly synthesised, unreacted sample (top).
Compared to the pattern of the raw material, the main peaks of the reacted sample slightly shifted towards a larger °2θ, with a maximum peak at 11.25°2θ, indicating a decrease in the interlayer spacing of the reacted sample (7.9 Å). Furthermore, the evolution of new peaks and the simultaneous vanishing of other peaks, which are present in the pattern of the raw material, imply the formation of new mineral phases during the reaction of sample CA–S2O8 with the target contaminant. The PXRD pattern of the reacted sample was evaluated using the International Centre for Diffraction Data (ICCD) mineral database. Most of the peaks including the maximum peak at 11.25°2θ (d-spacing of 7.9 Å) were assigned to hydrocalumite (ICDD reference pattern 00–054–0851), a chloride intercalated Ca,Al-LDH with the mineral formula [Ca4Al2(OH)12]Cl2•10H2O showing a main peak at 11.4°2θ with an interlayer spacing of 7.7 Å [31]. Corresponding peaks in the pattern are labelled using (+). The remaining peaks, starting at 10.2°2θ (8.7 Å) could be assigned to kuzelite, a sulphate intercalated Ca,Al-LDH with the mineral formula [Ca4Al2(OH)12]SO4•6H2O (ICCD pattern 00–050–1607), which shows a main peak at 9.85°2θ (9.0 Å) [32]. Peaks corresponding to kuzelite are labelled with (*).
The findings confirm the oxidation of 1,1,2-TCA by peroxydisulphate intercalated Ca,Al-LDH. The initial interlayer anions oxidise the contaminant by releasing chloride ions into the solution while the peroxydisulphate is simultaneously transformed into sulphate ions. This caused the transformation of the peroxydisulphate intercalated LDH into kuzelite, a sulphate intercalated LDH. The additional formation of hydrocalumite, a chloride intercalated LDH, was only possible due to the dehydrochlorination of 1,1,2-TCA by the peroxydisulphate intercalated LDH.

4. Conclusions

Successful intercalation of permanganate and peroxydisulphate, respectively, in the interlayer of Mg,Al- and Ca,Al-LDHs was attained. Co-intercalated nitrate species showed no negative influence on the conducted experiments. The resulting structural parameters as well as the calculated chemical formulas of the synthesised material are in good agreement with the values reported in the literature, but for the peroxydisulphate intercalated Ca,Al-LDH sample, a lack in the target interlayer anion was observed. Results of the particle size distribution measurements revealed an aggregation of the studied LDHs upon synthesis and aging.
The permanganate-intercalated LDHs proved to be the most effective reactants for experiments addressing trichloroethene and up to 60% of the initial contaminant concentration was removed (HS-PTV-GC-MS measurements), most likely via dehydrochlorination. For permanganate-intercalated Ca,Al-LDH, the results revealed no differences when using different initial amounts of oxidant, proving that 1 g of the reactant is enough to degrade the initial contaminant concentration. Permanganate intercalated LDHs showed a colour exchange from purple to red, indicating the reduction of the intercalated permanganate upon reaction with TCE. Experiments addressing 1,1,2-trichloroethane revealed that CA–S2O8 is by far the most effective sample. Up to 66% of the initially added contaminant (0.4 mmol/L) was degraded as confirmed by HS-PTV-GC-MS measurements and dichloroethene, one metabolite following the dehydrochlorination pathway, was formed and its abundance clearly increased upon increasing reaction times.
Intercalation of well-known and effective oxidising agents has no negative influence on their potential to degrade the here studied contaminants. It can be assumed that the intercalation of the oxidising agent enhances their stability and focusses their reaction onto the targeted contaminant. This might be of interest for a potential use of the here studied LDHs in in situ chemical oxidation processes addressing groundwater contamination by chlorinated organic solvents.
Changes in the mineral content upon reaction with contaminants leading to the formation of hydrocalumite and kuzelite, both rare in nature but well studied as synthetic minerals, would not cause any additional harm to the environment. The studied LDHs can degrade chlorinated organic solvents, here trichloroethene and trichloroethane, without the risk of releasing high amounts of chlorides or sulphates into the environment. In fact, once released into solution, ions are re-intercalated into the structure of the LDH, leading to the transformation of the reactant.

Supplementary Materials

The following are available online at https://www.mdpi.com/2075-163X/10/5/462/s1. File S1: ICP-OES; File S2: HS-PTV-GC-MS; Figure S1: Powder x-ray diffraction pattern of sample MA–MnO4; Figure S2: Powder x-ray diffraction pattern of sample MA–S2O8; Figure S3. Powder x-ray diffraction pattern of sample CA–MnO4; Figure S4. Powder x-ray diffraction pattern of sample CA–S2O8; Figure S5. Thermogravimetric analysis-differential thermal analysis of sample MA–MnO4; Figure S6. Thermogravimetric analysis-differential thermal analysis of sample MA–S2O8; Figure S7. Thermogravimetric analysis-differential thermal analysis of sample CA–MnO4; Figure S8. Thermogravimetric analysis-differential thermal analysis of sample CA–S2O8; Figure S9. Particle size distribution of sample MA–MnO4 after different times (min) of ultrasound treatment; Figure S10. Particle size distribution of sample MA–S2O8after different times (min) of ultrasound treatment; Figure S11. Particle size distribution of sample CA–MnO4 after different times (min) of ultrasound treatment; Figure S12. Particle size distribution of sample CA–S2O8 after different times (min) of ultrasound treatment; Figure S13. Results of the gas chromatography-mass spectrometry measurements of the batch experiment with 2 g MA–MnO4 and trichloroethene; Figure S14. Results of the gas chromatography-mass spectrometry measurements of the batch experiment with 2 g MA–S2O8 and trichloroethene; Figure S15. Results of the gas chromatography-mass spectrometry measurements of the batch experiment with 2 g CA–MnO4 and trichloroethene; Figure S16. Results of the gas chromatography-mass spectrometry measurements of the batch experiment with 1 g CA–MnO4 and trichloroethene; Figure S17. Results of the gas chromatography-mass spectrometry measurements of the batch experiment with 2 g CA–S2O8 and trichloroethene; Figure S18. Results of the gas chromatography-mass spectrometry measurements of the batch experiment with 2 g MA–S2O8 and 1,1,2-trichloroethane; Figure S19. Results of the gas chromatography-mass spectrometry measurements of the batch experiment with 2 g CA–S2O8 and 1,1,2-trichloroethane; Figure S20. Results of the gas chromatography-mass spectrometry measurements of the batch experiment with 1 g CA–S2O8 and 1,1,2-trichloroethane; Table S1. List of chemicals used within this study; Table S2. Band positions (cm−1) in the FTIR spectra of the permanganate intercalated samples with corresponding assignments; Table S3. Band positions (cm−1) in the FTIR spectra of the peroxydisulfate intercalated samples with corresponding assignments; Table S4. Results of the HS-PTV-GC-MS measurements of the batch experiments with TCE as the contaminant. Results of the blank solution are also given; Table S5. Results of the HS-PTV-GC-MS measurements of batch experiments with 1,1,2-TCA as the contaminant. Results of the blank solution are also given.

Author Contributions

Conceptualization, K.M.D. and V.R.; Methodology, K.M.D. and V.R.; Formal analysis, K.M.D., T.L. and M.d.N.S.; Investigation, K.M.D.; Resources, V.R.; Data curation, K.M.D. and V.R.; Writing—original draft preparation, K.M.D.; Writing—review and editing, T.L., M.d.N.S., J.L.P.P. and V.R.; Visualization, K.M.D.; Supervision, V.R.; Project administration, V.R.; Funding acquisition, V.R. All authors have read and agreed to the published version of the manuscript.

Funding

This study is part of the project Metal-Aid, which has received funding from the European Union’s Horizon 2020 Research and Innovation Programme under the Marie Skłodowska-Curie Grant Agreement No. 675219. For more information, see http://metal-aid.eu/.

Conflicts of Interest

The authors declare no conflicts of interest.

References

  1. Huling, S.G.; Weaver, W. Dense Nonaqueous Phase Liquids Ground Water Issue; EPA/540/4-91/002; U.S. Environmental Protection Agency: Washington, DC, USA, 1991.
  2. Sobsey, M.D.; Bartram, S. Water quality and health in the new millennium: The role of the World Health Organization Guidelines for Drinking-Water Quality. Forum Nutr. 2003, 56, 396–405. [Google Scholar] [PubMed]
  3. Technical and Regulatory Guidance for In Situ Chemical Oxidation of Contaminated Soil and Groundwater, 2nd ed.; Interstate Technology & Regulatory Council (ITRC) In Situ Chemical Oxidation: Malvern, UK, 2005.
  4. O’Connor, D.; Hou, D.; Ok, Y.S.; Song, Y.; Sarmah, A.K.; Li, X.; Tack, F.M. Sustainable in situ remediation of recalcitrant organic pollutants in groundwater with controlled release materials: A review. J. Control. Release 2018, 283, 200–213. [Google Scholar] [CrossRef] [PubMed]
  5. Semkiw, S.E.; Barcelona, M.J. Field Study of Enhanced TCE Reductive Dechlorination by a Full-Scale Whey PRB. Ground Water Monit. Remediat. 2011, 31, 68–78. [Google Scholar] [CrossRef]
  6. Kambhu, A.; Comfort, S.; Chokejaroenrat, C.; Sakulthaew, C. Developing slow-release persulfate candles to treat BTEX contaminated groundwater. Chemosphere 2012, 89, 656–664. [Google Scholar] [CrossRef] [PubMed] [Green Version]
  7. Sheu, Y.; Chen, S.; Chien, C.; Chen, C.; Kao, C. Application of a long-lasting colloidal substrate with pH and hydrogen sulfide control capabilities to remediate TCE-contaminated groundwater. J. Hazard. Mater. 2015, 284, 222–232. [Google Scholar] [CrossRef]
  8. Christenson, M.; Kambhu, A.; Reece, J.; Comfort, S.; Brunner, L. A five-year performance review of field-scale, slow-release permanganate candles with recommendations for second-generation improvements. Chemosphere 2016, 150, 239–247. [Google Scholar] [CrossRef] [Green Version]
  9. Christensen, T.H.; Bjerg, P.L.; Banwart, S.A.; Jakobsen, R.; Heron, G.; Albrechtsen, H.-J. Characterization of redox conditions in groundwater contaminant plumes. J. Contam. Hydrol. 2000, 45, 165–241. [Google Scholar] [CrossRef]
  10. In Situ Remediation of Chlorinated Solvent Plumes. In In Situ Chemical Oxidation for Groundwater Remediation; Springer Science and Business Media: Berlin, Germany, 2010; pp. 217–280.
  11. Engelmann, C.; Händel, F.; Binder, M.; Yadav, P.K.; Dietrich, P.; Liedl, R.; Walther, M. The fate of DNAPL contaminants in non-consolidated subsurface systems—Discussion on the relevance of effective source zone geometries for plume propagation. J. Hazard. Mater. 2019, 375, 233–240. [Google Scholar] [CrossRef]
  12. Bennedsen, L.R. In situ Chemical Oxidation—The Mechanisms and Applications of Chemical Oxidants for Remediation Purposes. In Chemistry of Advanced Environmental Purification Processes of Water—Fundamentals and Applications; Sorgaard, E., Ed.; Elsevier: Amsterdam, The Netherlands, 2014; pp. 26–87. [Google Scholar]
  13. Huling, S.G.; Pivetz, B.E. In-Situ Chemical Oxidation Engineering Issue; EPA/600/R-06/072; U.S. Environmental Protection Agency: Washington, DC, USA, 2007.
  14. Watts, R.J.; Teel, A.L. Treatment of Contaminated Soils and Groundwater Using ISCO. Pr. Period. Hazard. Toxic Radioact. Waste Manag. 2006, 10, 2–9. [Google Scholar] [CrossRef]
  15. Siegrist, R.L.; Urynowicz, M.A.; Crimi, M.; Lowe, K.S. Genesis and Effects of Particles Produced during In Situ Chemical Oxidation Using Permanganate. J. Environ. Eng. 2002, 128, 1068–1079. [Google Scholar] [CrossRef]
  16. Yuan, B.; Chen, Y.; Fu, M.-L. Degradation efficiencies and mechanisms of trichloroethylene (TCE) by controlled-release permanganate (CRP) oxidation. Chem. Eng. J. 2012, 192, 276–283. [Google Scholar] [CrossRef]
  17. Evans, P.J.; Dugan, P.J.; Nguyen, D.; Lamar, M.; Crimi, M. Slow-release permanganate versus unactivated persulfate for long-term in situ chemical oxidation of 1,4-dioxane and chlorinated solvents. Chemosphere 2019, 221, 802–811. [Google Scholar] [CrossRef] [PubMed]
  18. Dietmann, K.M.; Linke, T.; Trujillano, R.; Rives, V. Effect of Chain Length and Functional Group of Organic Anions on the Retention Ability of MgAl- Layered Double Hydroxides for Chlorinated Organic Solvents. ChemEngineering 2019, 3, 89. [Google Scholar] [CrossRef] [Green Version]
  19. Alonso-De-Linaje, V.; Mangayayam, M.C.; Tobler, D.J.; Dietmann, K.M.; Espinosa, R.; Rives, V.; Dalby, K.N. Sorption of chlorinated hydrocarbons from synthetic and natural groundwater by organo-hydrotalcites: Towards their applications as remediation nanoparticles. Chemosphere 2019, 236, 124369. [Google Scholar] [CrossRef]
  20. Mills, S.J.; Christy, A.; Génin, J.-M.R.; Kameda, T.; Colombo, F. Nomenclature of the hydrotalcite supergroup: Natural layered double hydroxides. Miner. Mag. 2012, 76, 1289–1336. [Google Scholar] [CrossRef] [Green Version]
  21. de Roy, A.; Forano, C.; Besse, J.P. Layered Double Hydroxides: Synthesis and Post-Synthesis Modification. In Layered Double Hydroxides: Present and Future; Rives, V., Ed.; Nova Science Publishers: New York, NY, USA, 2002; pp. 1–40. ISBN 978-1-61209-289-8. [Google Scholar]
  22. Bookin, A.S. Polytype Diversity of the Hydrotalcite-Like Minerals, I. Possible Polytypes and their Diffraction Features. Clays Clay Miner. 1993, 41, 551–557. [Google Scholar] [CrossRef]
  23. Allmann, R.; Jepsen, H.P. Die Struktur des Hydrotalkits. Neues Jahrb. Mineral. Mon. 1969, 1969, 544–551. [Google Scholar]
  24. Miyata, S. Synthesis of Hydrotalcite-Like Compounds and their Physico-Chemical Properties—The Systems Mg2+-Al3+-SO42− and Mg2+-Al3+-CrO42−. Clays Clay Miner. 1977, 25, 14–18. [Google Scholar] [CrossRef]
  25. Reichle, W. Synthesis of anionic clay minerals (mixed metal hydroxides, hydrotalcite). Solid State Ion. 1986, 22, 135–141. [Google Scholar] [CrossRef]
  26. Constantino, V.R.; Pinnavaia, T.J. Basic Properties of Mg2+1-xAl3+x Layered Double Hydroxides Intercalated by Carbonate, Hydroxide, Chloride, and Sulfate Anions. Inorg. Chem. 1995, 34, 883–892. [Google Scholar] [CrossRef]
  27. Rousselot, I.; Taviot-Gueho, C.; Leroux, F.; Leone, P.; Palvadeau, P.; Besse, J.-P. Insights on the Structural Chemistry of Hydrocalumite and Hydrotalcite-like Materials: Investigation of the Series Ca2M3+(OH)6Cl•2H2O (M3+: Al3+, Ga3+, Fe3+, and Sc3+) by X-Ray Powder Diffraction. J. Solid State Chem. 2002, 167, 137–144. [Google Scholar] [CrossRef]
  28. Chebout, R.; Tichit, D.; Layrac, G.; Barama, A.; Coq, B.; Cota, I.; Rangel, E.R.; Medina, F. New basic catalysts obtained from layered double hydroxides nanocomposites. Solid State Sci. 2010, 12, 1013–1017. [Google Scholar] [CrossRef]
  29. Villegas, J.C.; Giraldo, O.H.; Laubernds, K.; Suib, S.L. New Layered Double Hydroxides Containing Intercalated Manganese Oxide Species: Synthesis and Characterization. Inorg. Chem. 2003, 42, 5621–5631. [Google Scholar] [CrossRef] [PubMed]
  30. Risch, A.; Göske, J.; Ecker, M.; Pöllmann, H. ICDD Grant-in-Aid Program; ICDD: Newtown Square, PA, USA, 1994. [Google Scholar]
  31. Rapin, J.-P.; Renaudin, G.; Elkaïm, E.; François, M. Structural transition of Friedel’s salt 3CaO•Al2O3•CaCl2•10H2O studied by synchrotron powder diffraction. Cem. Concr. Res. 2002, 32, 513–519. [Google Scholar] [CrossRef] [Green Version]
  32. Pöllmann, H.; Witzke, T.; Kohler, H. Ca4Al2 (OH)12. Neues Jahrb. Mineral. Mon. 1997, 1997, 423–432. [Google Scholar] [CrossRef]
  33. Scherrer, P. Bestimmung der Größe und der inneren Struktur von Kolloidteilchen mittels Röntgenstrahlen Nachrichten von der Gesellschaft der Wissenschaften zu Göttingen. Math. Phys. Kl. 1918, 26, 98–100. [Google Scholar]
  34. Rives, V. Study of Layered Double Hydroxides by Thermal Methods. In Layered Double Hydroxides: Present and Future; Rives, V., Ed.; Nova Science Publishers: New York, NY, USA, 2002; pp. 127–152. ISBN 978-1-61209-289-8. [Google Scholar]
  35. Rives, V. Comment on “Direct Observation of a Metastable Solid Phase of Mg/Al/CO3-Layered Double Hydroxide by Means of High-Temperature in Situ Powder XRD and DTA/TG”1. Inorg. Chem. 1999, 38, 406–407. [Google Scholar] [CrossRef]
  36. Herbstein, F.H.; Ron, G.; Weissman, A. The thermal decomposition of potassium permanganate and related substances. Part, I. Chemical aspects. J. Chem. Soc. A 1971, 1821. [Google Scholar] [CrossRef]
  37. Hernandez-Moreno, M.J.; Ulibarri, M.A.; Rendon, J.L.; Serna, C.J. IR Characteristics of Hydrotalcite-like Compounds. Phys. Chem. Miner. 1985, 12, 34–38. [Google Scholar] [CrossRef]
  38. Labajos, F.M.; Rives, V.; Ulibarri, M.A. Effect of hydrothermal and thermal treatments on the physicochemical properties of Mg-Al hydrotalcite-like materials. J. Mater. Sci. 1992, 27, 1546–1552. [Google Scholar] [CrossRef]
  39. Kloprogge, T.; Hickey, L.; Frost, R.L. FT-Raman and FT-IR spectroscopic study of synthetic Mg/Zn/Al-hydrotalcites. J. Raman Spectrosc. 2004, 35, 967–974. [Google Scholar] [CrossRef] [Green Version]
  40. Richardson, M.C.; Braterman, P.S. Infrared Spectra of Oriented and Nonoriented Layered Double Hydroxides in the Range from 4000 to 250 cm−1, with Evidence for Regular Short-Range Order in a Synthetic Magnesium−Aluminum LDH with Mg:Al = 2:1 but Not with Mg:Al = 3:1. J. Phys. Chem. C 2007, 111, 4209–4215. [Google Scholar] [CrossRef]
  41. Nakamoto, K. Infrared and Raman Spectra of Inorganic and Coordination Compounds—Part A: Theory and Applications in Inorganic Chemistry, 6th ed.; Wiley: Hoboken, NJ, USA, 2009; ISBN 978-0-471-74339-2. [Google Scholar]
  42. Gonzalez-Vilchez, F.; Griffith, W.P. Transition-metal tetra-oxo-complexes and their vibrational spectra. J. Chem. Soc. Dalton Trans. 1972, 13, 1416–1421. [Google Scholar] [CrossRef]
  43. Simon, A.; Richter, H. RAMAN-und Ultrarotspektroskopische Untersuchungen an Salzen der Peroxodischwefelsäure. Z. Anorg. Allg. Chem. 1962, 315, 196–203. [Google Scholar] [CrossRef]
  44. Blott, S.; Croft, D.J.; Pye, K.; Saye, S.E.; Wilson, H.E. Particle size analysis by laser diffraction. Geol. Soc. Lond. Spéc. Publ. 2004, 232, 63–73. [Google Scholar] [CrossRef]
  45. Tsitonaki, A.; Petri, B.; Crimi, M.; Mosbæk, H.; Siegrist, R.L.; Bjerg, P.L. In Situ Chemical Oxidation of Contaminated Soil and Groundwater Using Persulfate: A Review. Crit. Rev. Environ. Sci. Technol. 2010, 40, 55–91. [Google Scholar] [CrossRef]
  46. Liang, C.; Lee, I.-L.; Hsu, I.-Y.; Liang, C.-P.; Lin, Y.-L. Persulfate oxidation of trichloroethylene with and without iron activation in porous media. Chemosphere 2008, 70, 426–435. [Google Scholar] [CrossRef]
  47. Vogel, T.M.; Criddle, C.S.; Mccarty, P.L. ES Critical Reviews: Transformations of halogenated aliphatic compounds. Environ. Sci. Technol. 1987, 21, 722–736. [Google Scholar] [CrossRef]
  48. Tobiszewski, M.; Namieśnik, J. Abiotic degradation of chlorinated ethanes and ethenes in water Environ. Sci. Pollut. Res. Int. 2012, 19, 1994–2006. [Google Scholar] [CrossRef] [Green Version]
Figure 1. Schematic illustration of the structure of a permanganate intercalated hydrotalcite (left) and hydrocalumite (right). Magnesium and calcium are shown as green, aluminium as grey, oxygen as red, and manganese as purple balls. For better clarity, the hydrogen atoms are not shown. Structural data based on Allman and Jepsen [23] and Mills et al. [20].
Minerals 10 00462 g001
Figure 2. Thermogravimetric analysis-differential thermal analysis (TG-DTA) of sample MA–MnO4.
Minerals 10 00462 g002
Figure 3. FTIR spectra of the synthesised samples. (Left panel) permanganate-ion; (right panel) peroxydisulphate-ion. (Top spectra) MA samples; (bottom spectra) CA samples.
Minerals 10 00462 g003
Figure 4. Results of the HS-PTV-GC-MS measurements with permanganate (left) and peroxydisulphate (right) intercalated MA–LDHs using trichloroethene as the contaminant. Contaminant concentration (%) in solution over time (h). Blank solution as black dots, experimental solution as red squares.
Minerals 10 00462 g004
Figure 5. PXRD pattern of the used sample MA–MnO4 after the experiments using TCE (bottom) compared to the pattern of the unreacted raw material (top). (+) chloride intercalated Mg,Al-LDH and (∙) MnO2.
Minerals 10 00462 g005
Figure 6. Results of the HS-PTV-GC-MS measurements with Ca,Al-LDHs using trichloroethene as the contaminant. Contaminant concentration (%) in solution over time (h). Blank solution as black dots, experimental solution as red squares.
Minerals 10 00462 g006
Figure 7. PXRD pattern of the reacted sample CA–MnO4 after experiments using TCE (bottom) compared to the pattern of the unreacted raw material (top). Peaks are labelled regarding their assigned mineral phases; (+) hydrocalumite and (∙) MnO2.
Minerals 10 00462 g007
Figure 8. Results of the HS-PTV-GC-MS measurements with peroxydisulphate intercalated LDHs using 1,1,2-trichloroethane as the contaminant. Contaminant concentration (%) in solution over time (h). Blank solution as black dots, experimental solution as red squares.
Minerals 10 00462 g008
Figure 9. PXRD pattern of the reacted sample CA–S2O8 after experiments using 1,1,2-TCA (bottom) compared to the pattern of the unreacted raw material (top). Peaks were labelled regarding their assigned mineral phases; (+) hydrocalumite and (*) kuzelite.
Minerals 10 00462 g009
Table 1. Chemical elemental analysis data (% w/w) of the synthesised samples and calculated molar ratios. All values rounded to two decimal places.
SampleMgCaAlMnSMg/AlCa/AlX/Al
MA-MnO421.20 8.0415.03 2.93 0.92
MA-S2O819.03 7.36 6.362.87 0.36
CA-MnO4 13.374.658.85 1.940.94
CA-S2O8 8.292.89 2.05 1.930.30
Table 2. Lattice parameters (Å) and average crystallite size (D, Å) of the synthesised samples.
Sampleac’cD
MA–MnO43.038.726.150
MA–S2O83.028.826.460
CA–MnO45.738.625.8350
CA–S2O85.758.752.0420
Table 3. Summary of the thermal decomposition data for all of the samples studied.
SampleEventMass Loss (%)Temperature Range (°C)Evolved Gases
MA–MnO4I11.625–160H2O
II36.4160–527NO2, H2O
III1.7527–900
Total49.725–900
MA–S2O8I11.625–218H2O
II29218–536SO3, CO2, NO2, H2O
III2.7536–900
Total43.325–900
CA–MnO4I10.825–130H2O
II13.8130–300H2O
III15.4300–560NO2
IV6560–900
Total4625–900
CA–S2O8I20.625–125H2O
II9.4125–330H2O
III23330–686SO3, NO2, H2O
IV1.5686–900
Total54.525–900
Table 4. Chemical formulae of the synthesized samples. All values rounded to two decimal places.
SampleChemical Formula
MA–MnO4[Mg0.75Al0.26(OH)2](MnO4)0.23(NO3)0.02•0.64H2O
MA–S2O8[Mg0.74Al0.26(OH)2](S2O8)0.09(NO3)0.07•0.56H2O
CA–MnO4[Ca0.66Al0.34(OH)2](MnO4)0.32(NO3)0.02•0.73H2O
CA–S2O8[Ca0.66Al0.34(OH)2](S2O8)0.10(NO3)0.147•1.40H2O
Table 5. The d(0.5) values in µm of the particle size distribution of the aggregated and de-aggregated samples.
SampleParticle Size (µm)
d(0.5)
Aggregated
d(0.5)
De-Aggregated
MA–MnO4220180
MA–S2O821080
CA–MnO41705
CA–S2O8705
d(0.5) = median particle size.

