Model Test and Numerical Study on Surrounding Rock Deformation and Overburden Strata Movement Law of Gob-Side Entry Retaining via Roof Cutting


Abstract
:1. Introduction
2. Gob-Side Entry Retaining by Roof Cutting
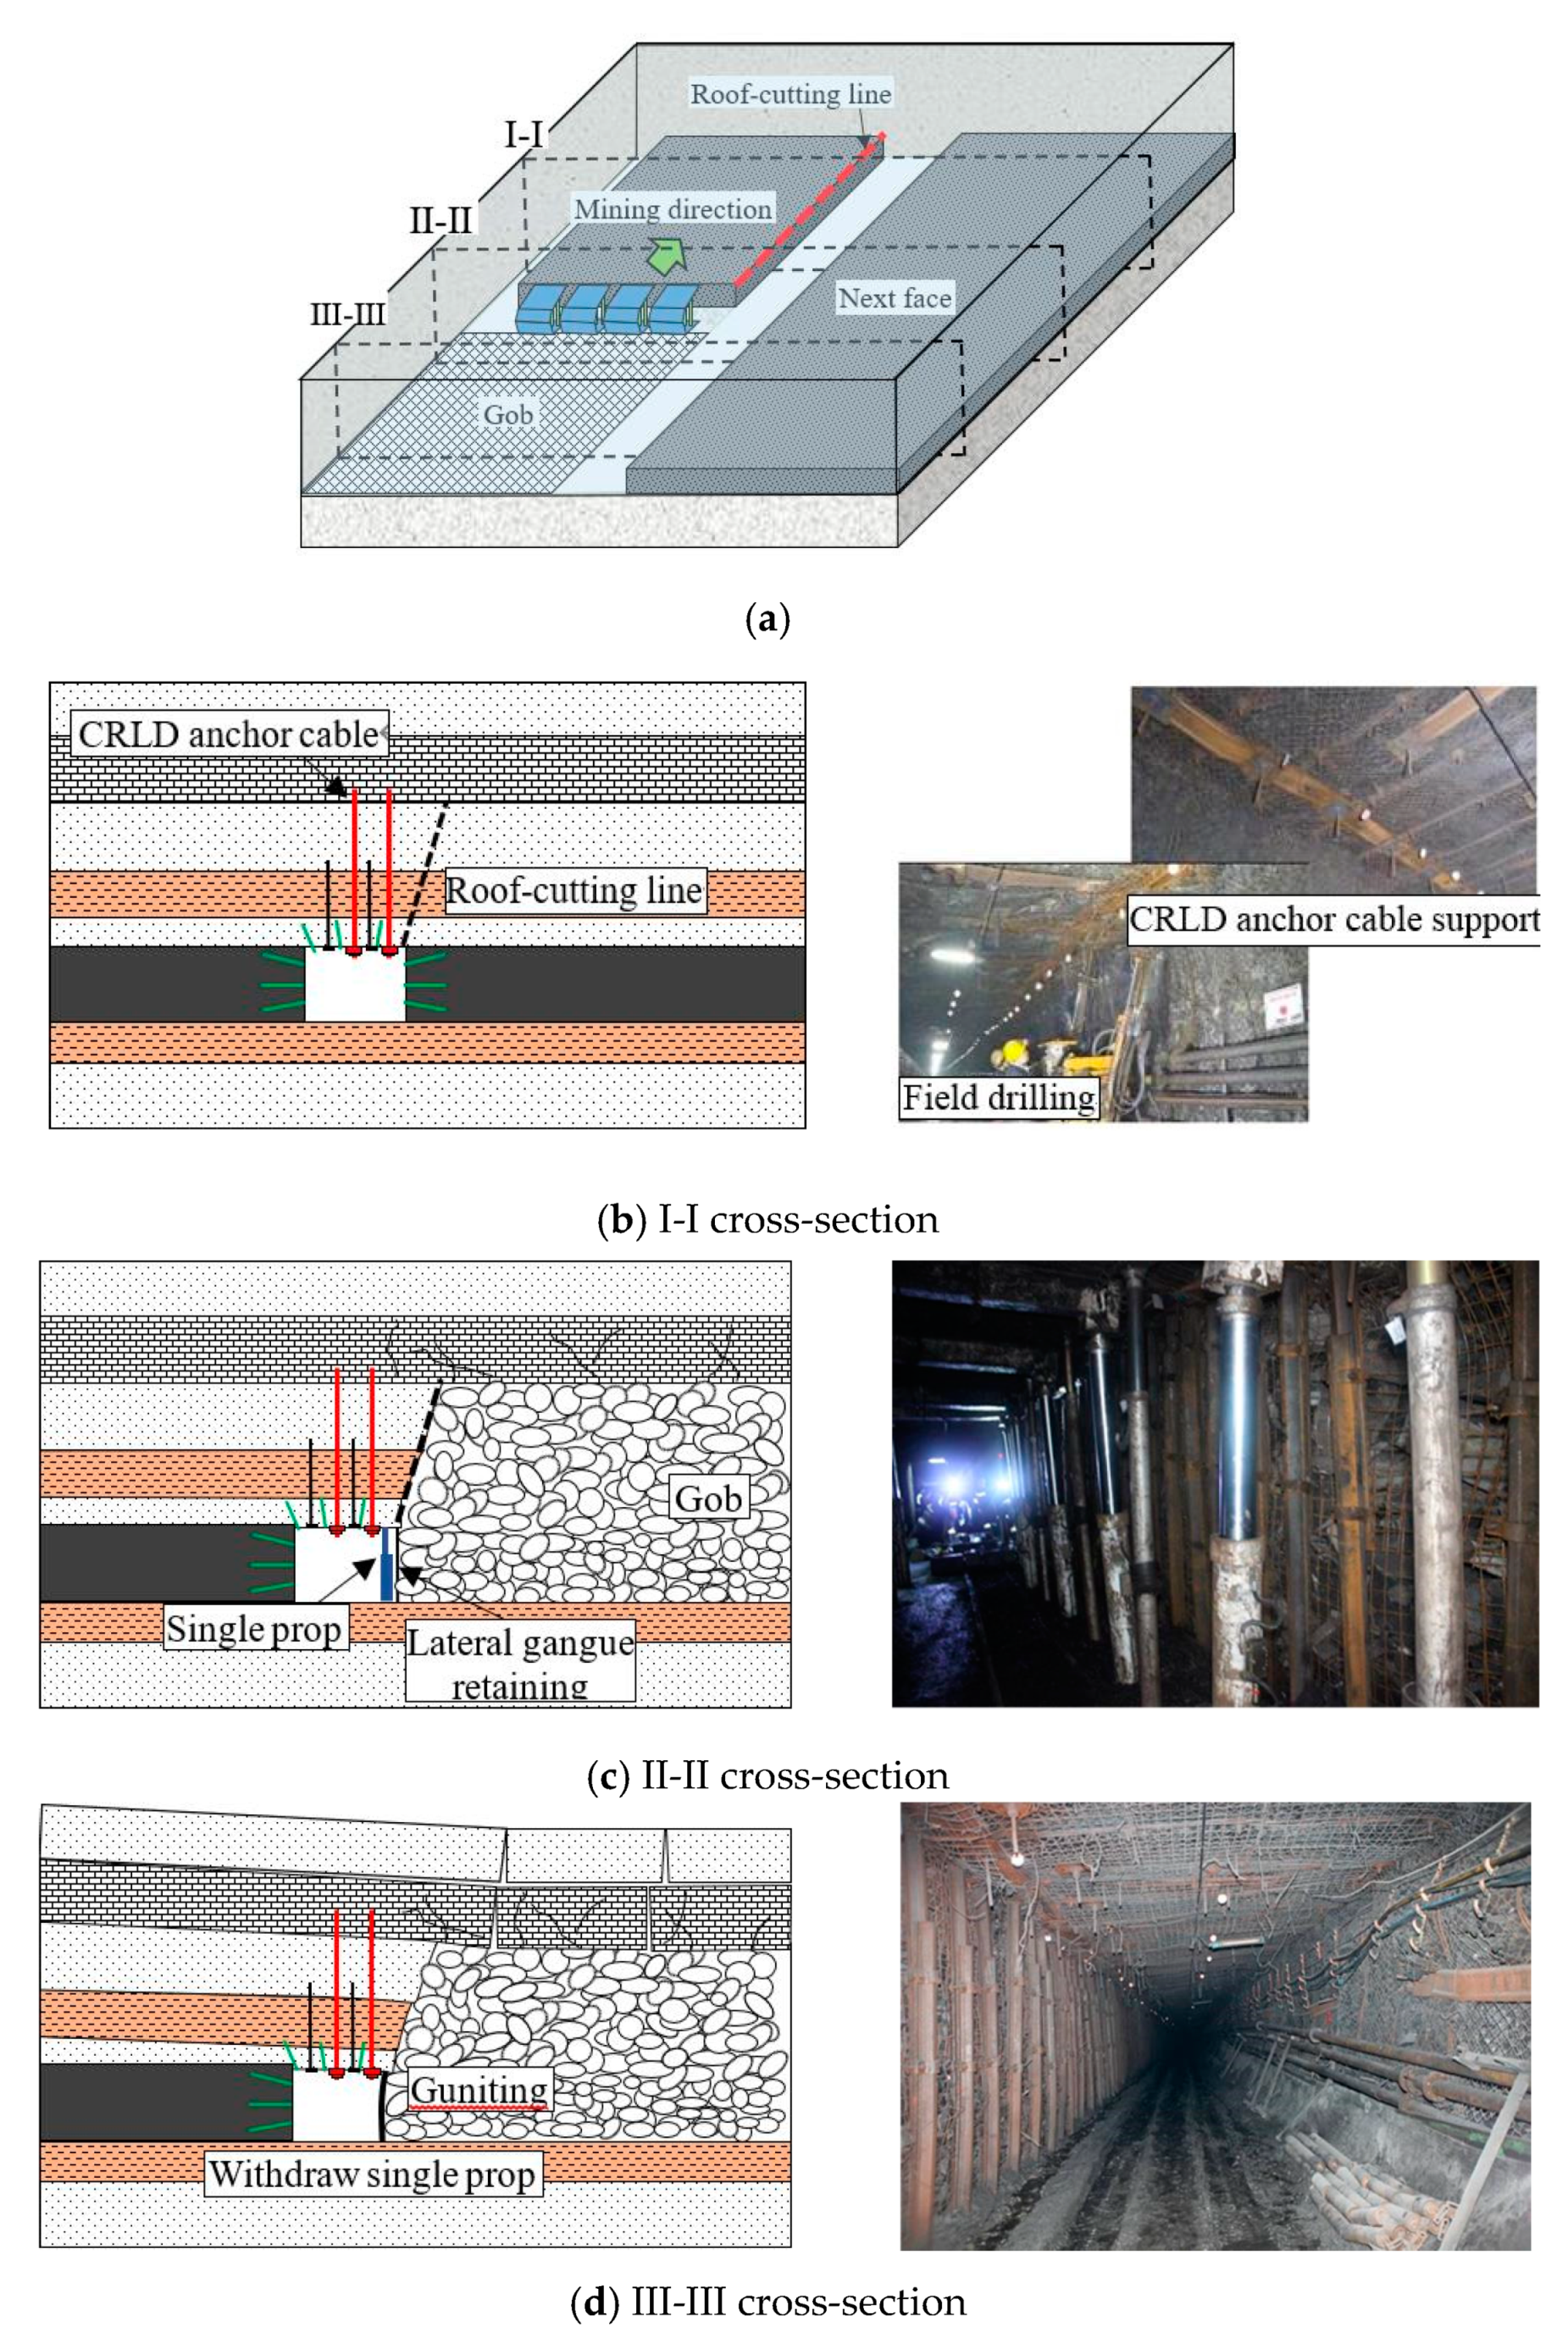
2.1. Technological Process
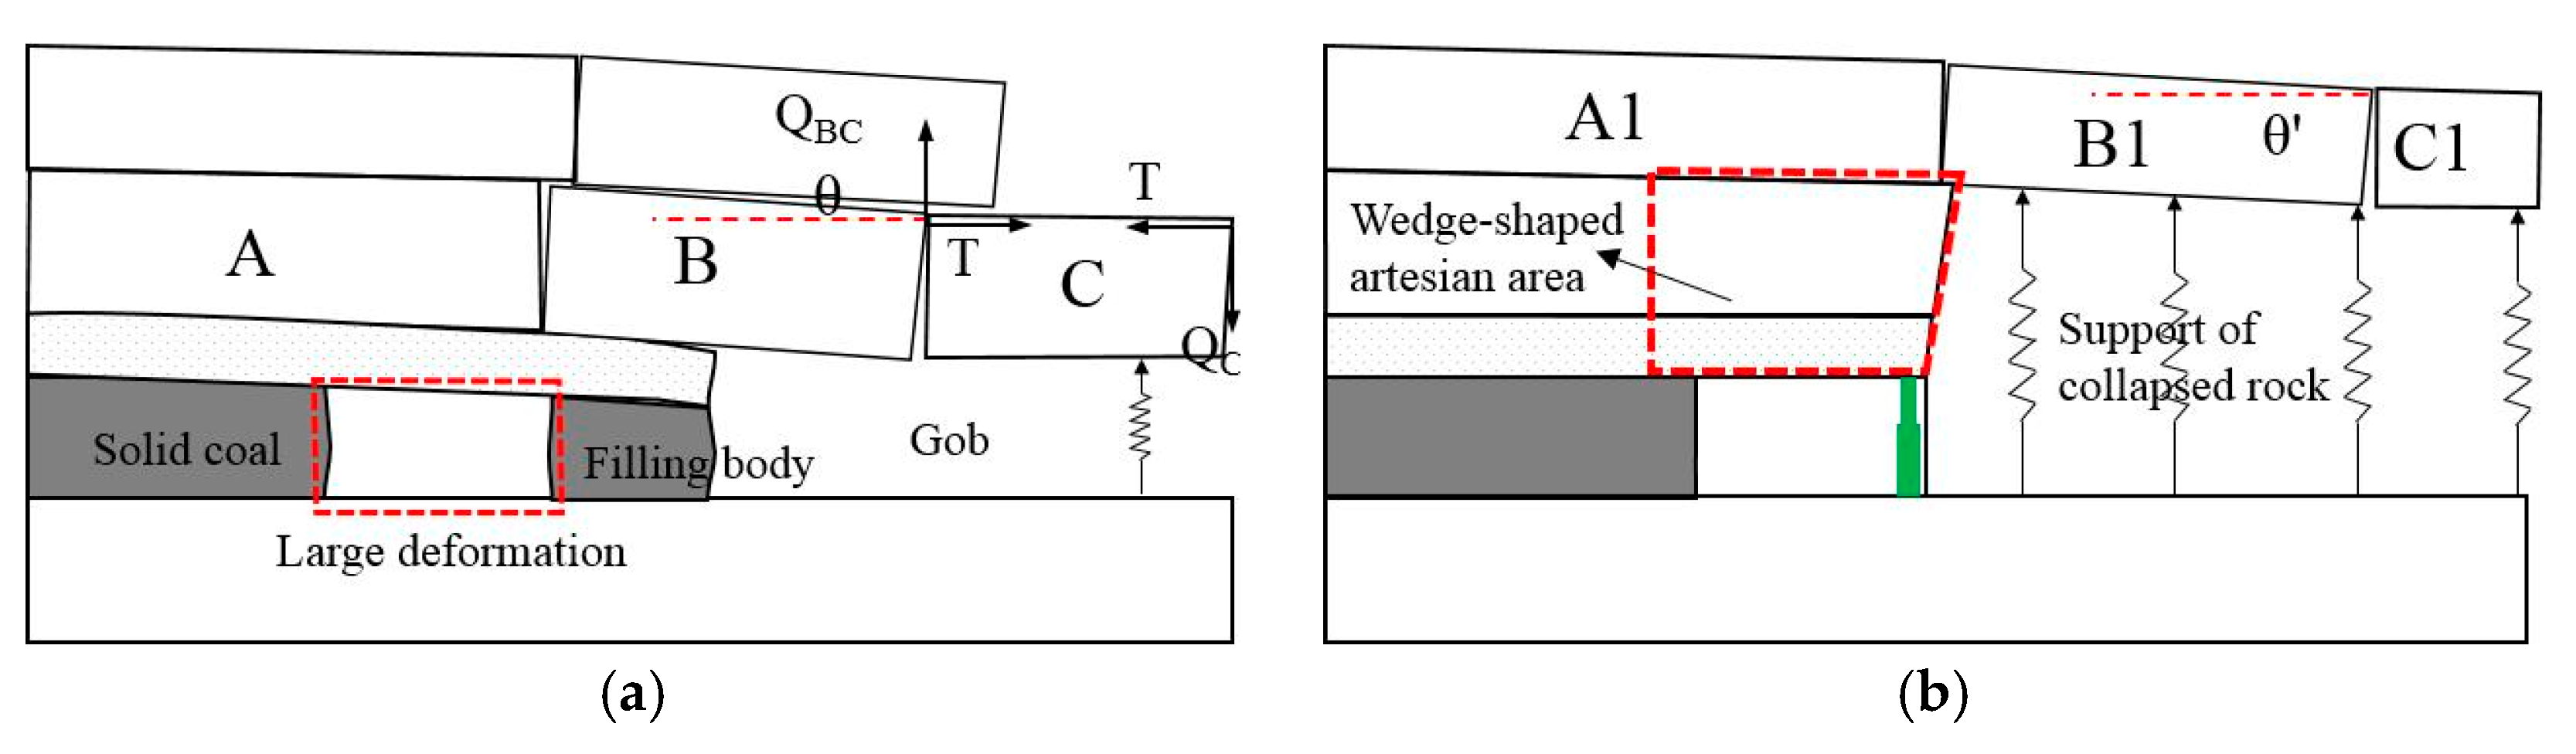
2.2. Principle
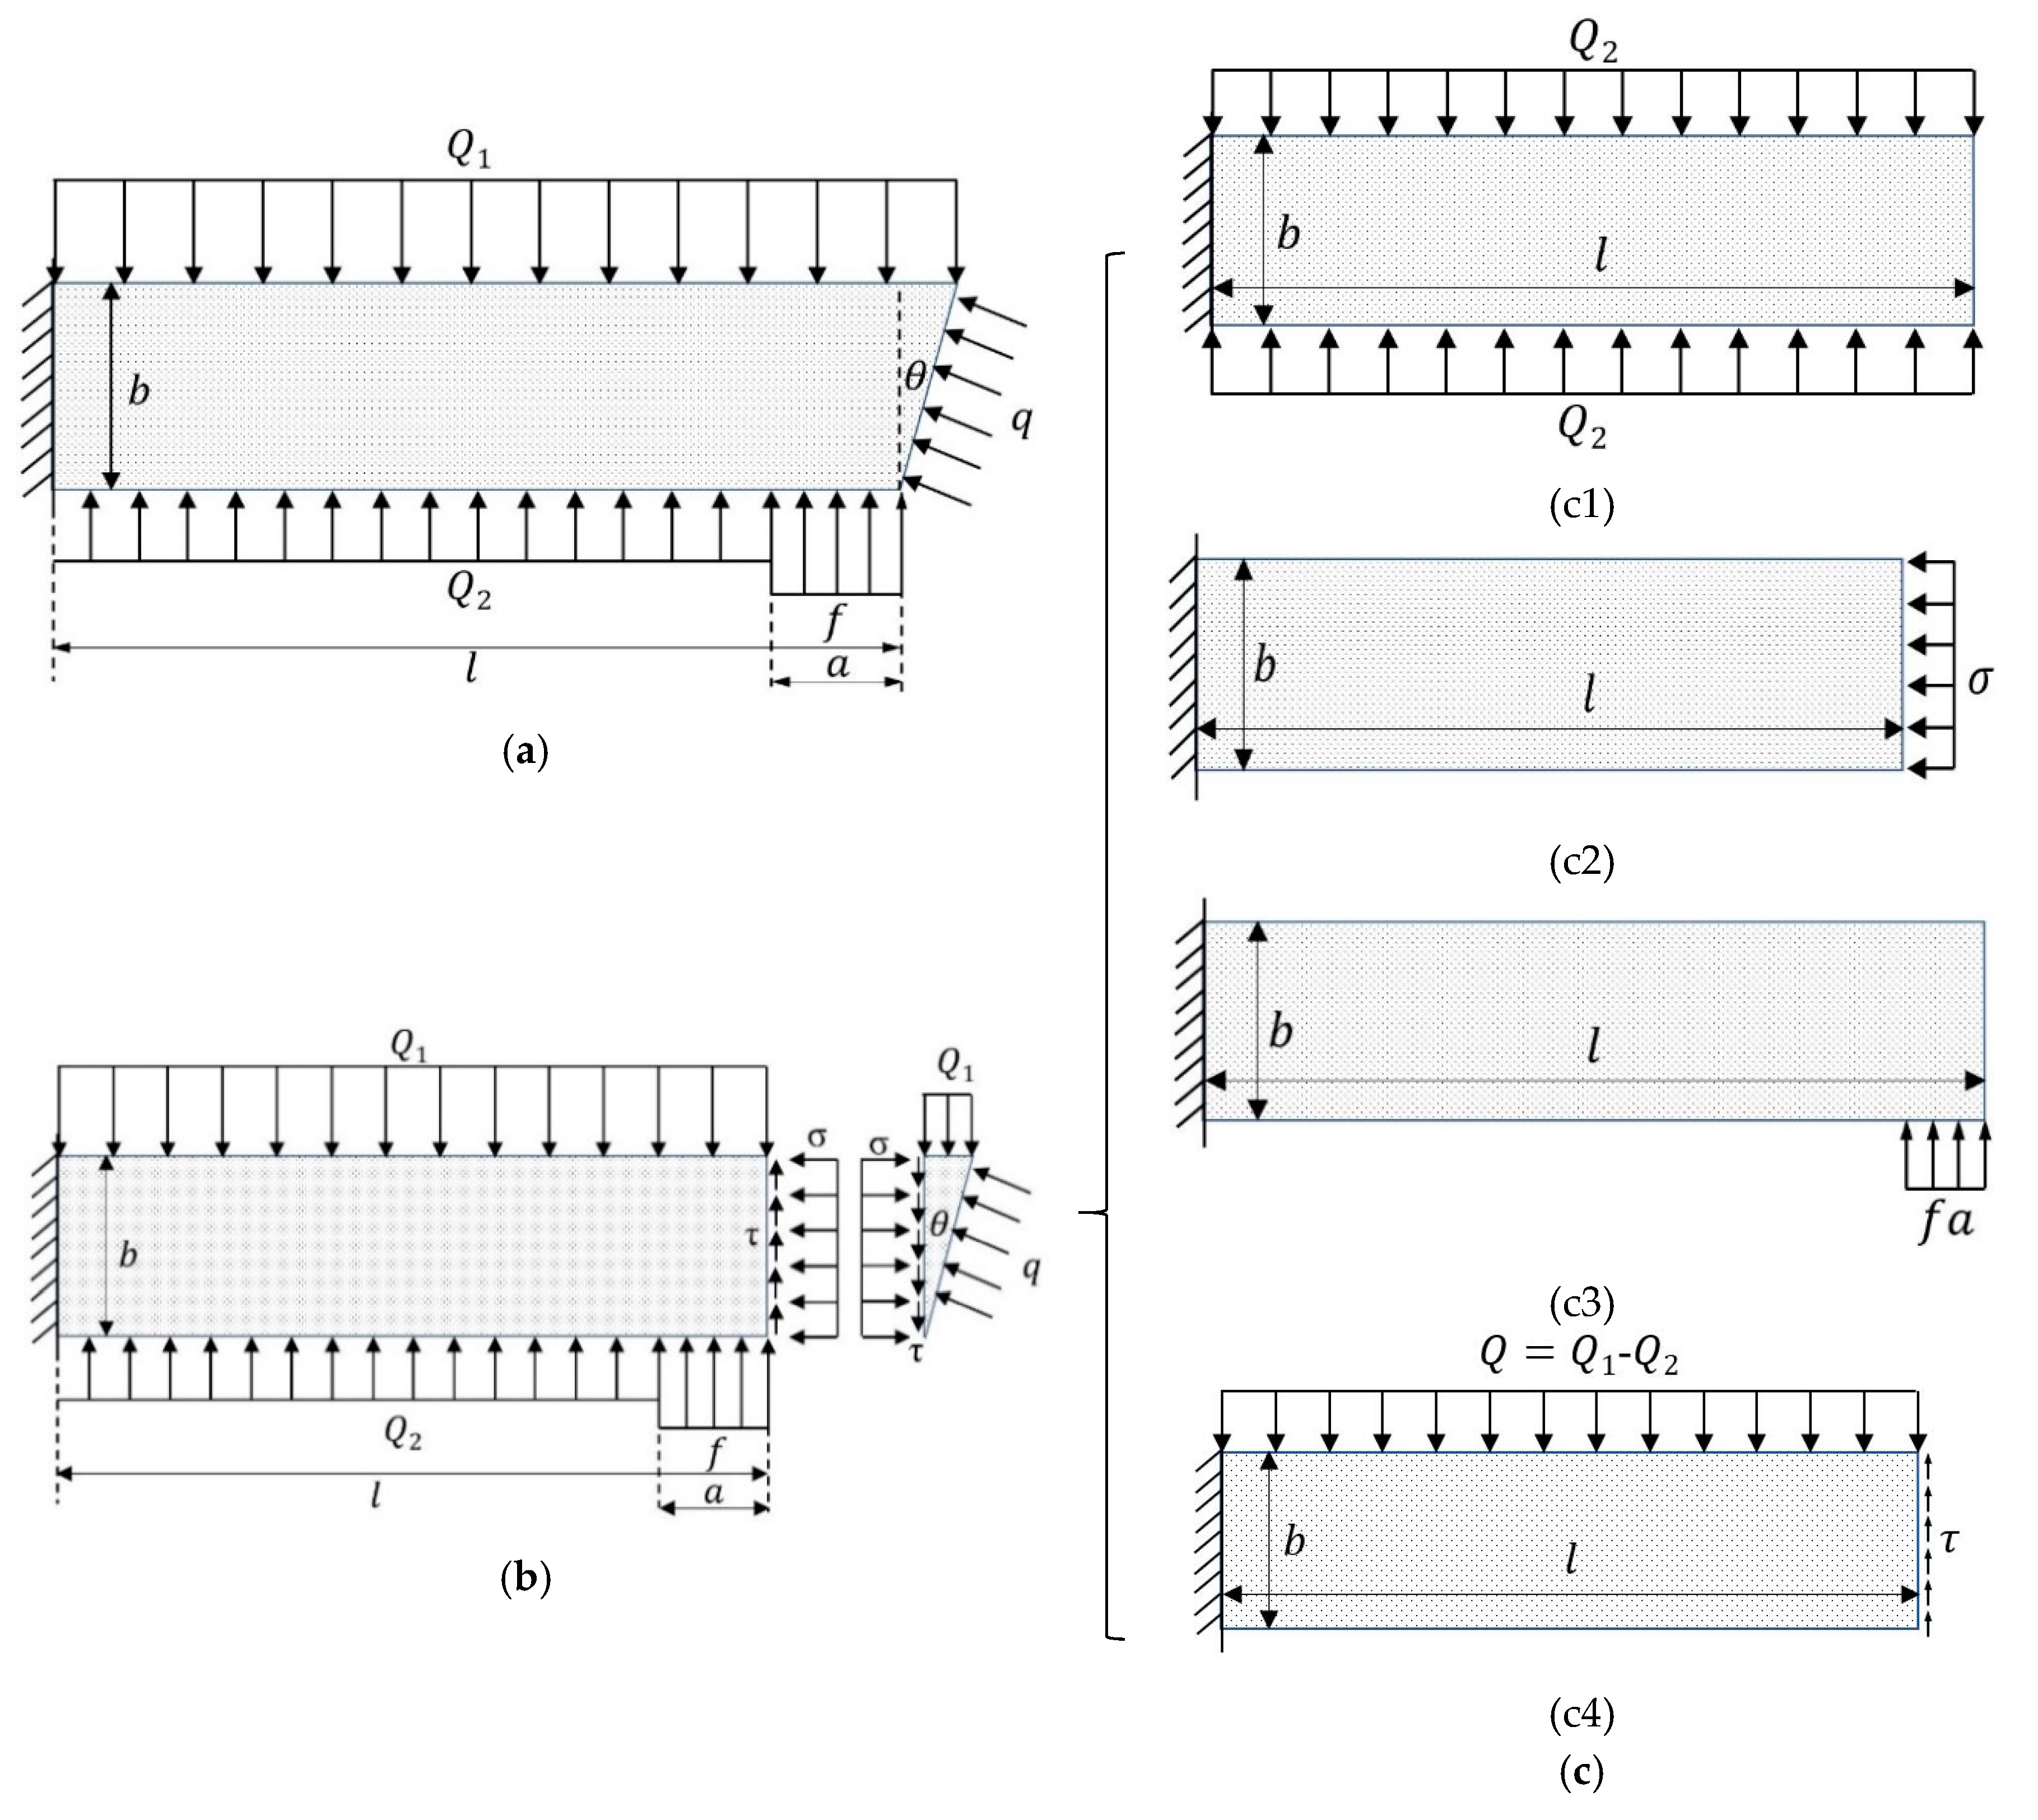
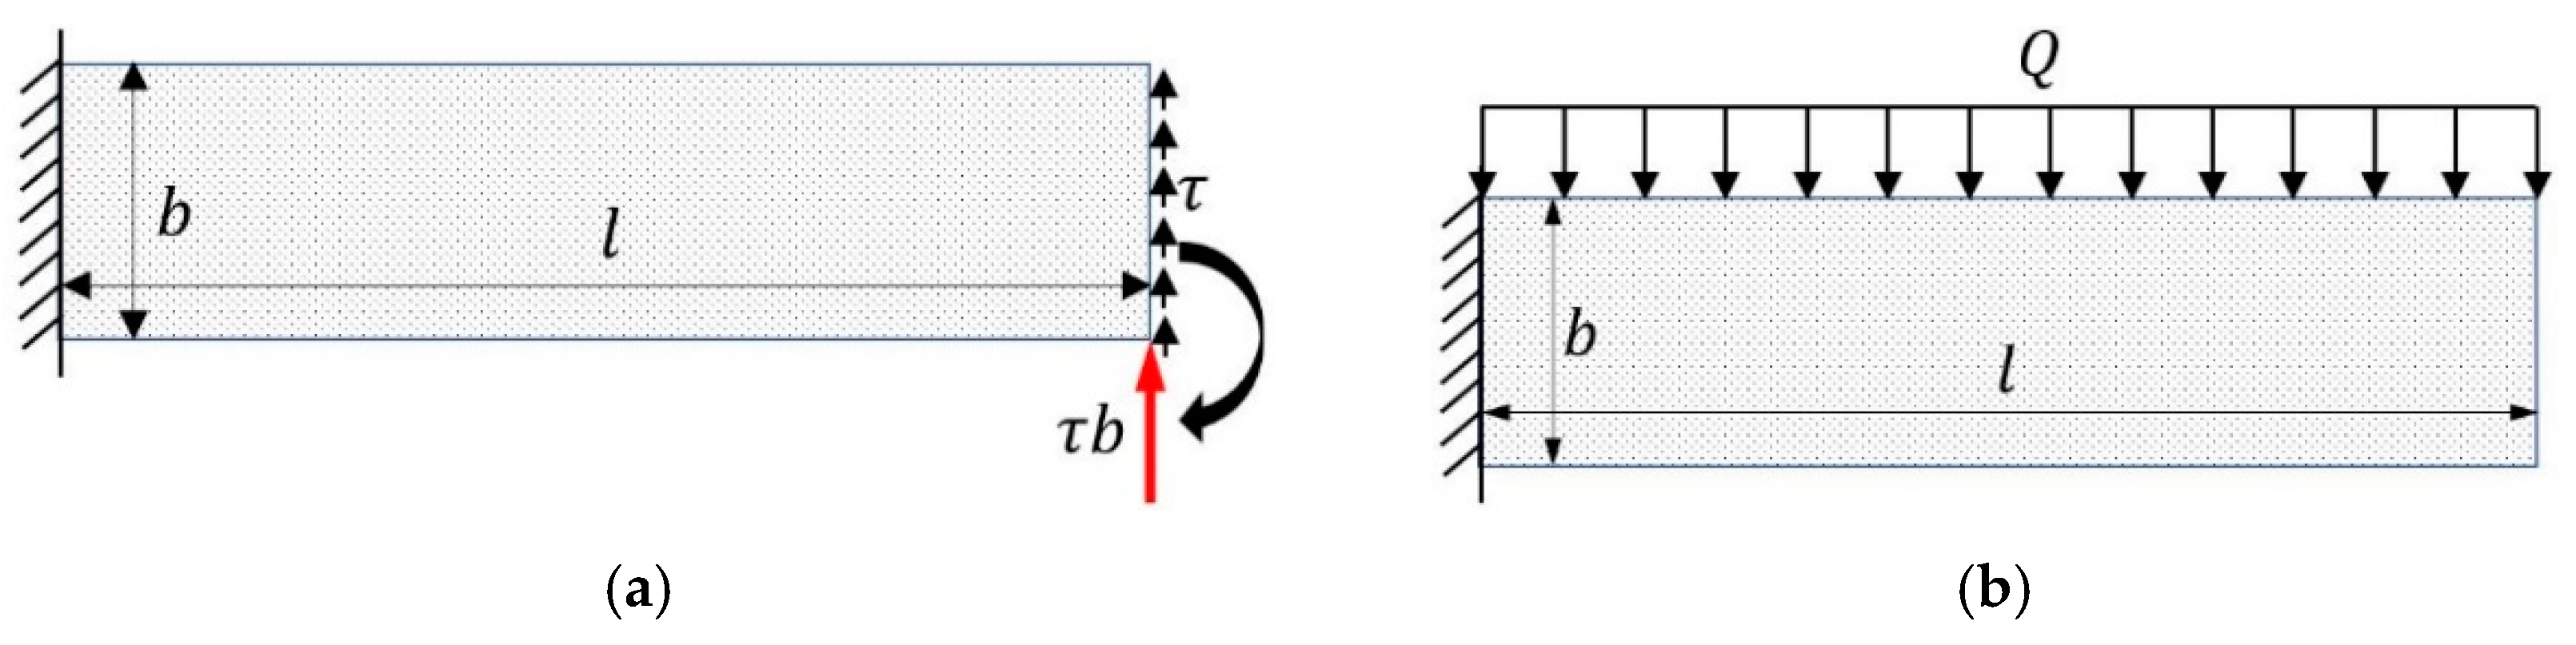
2.3. Mechanical Model
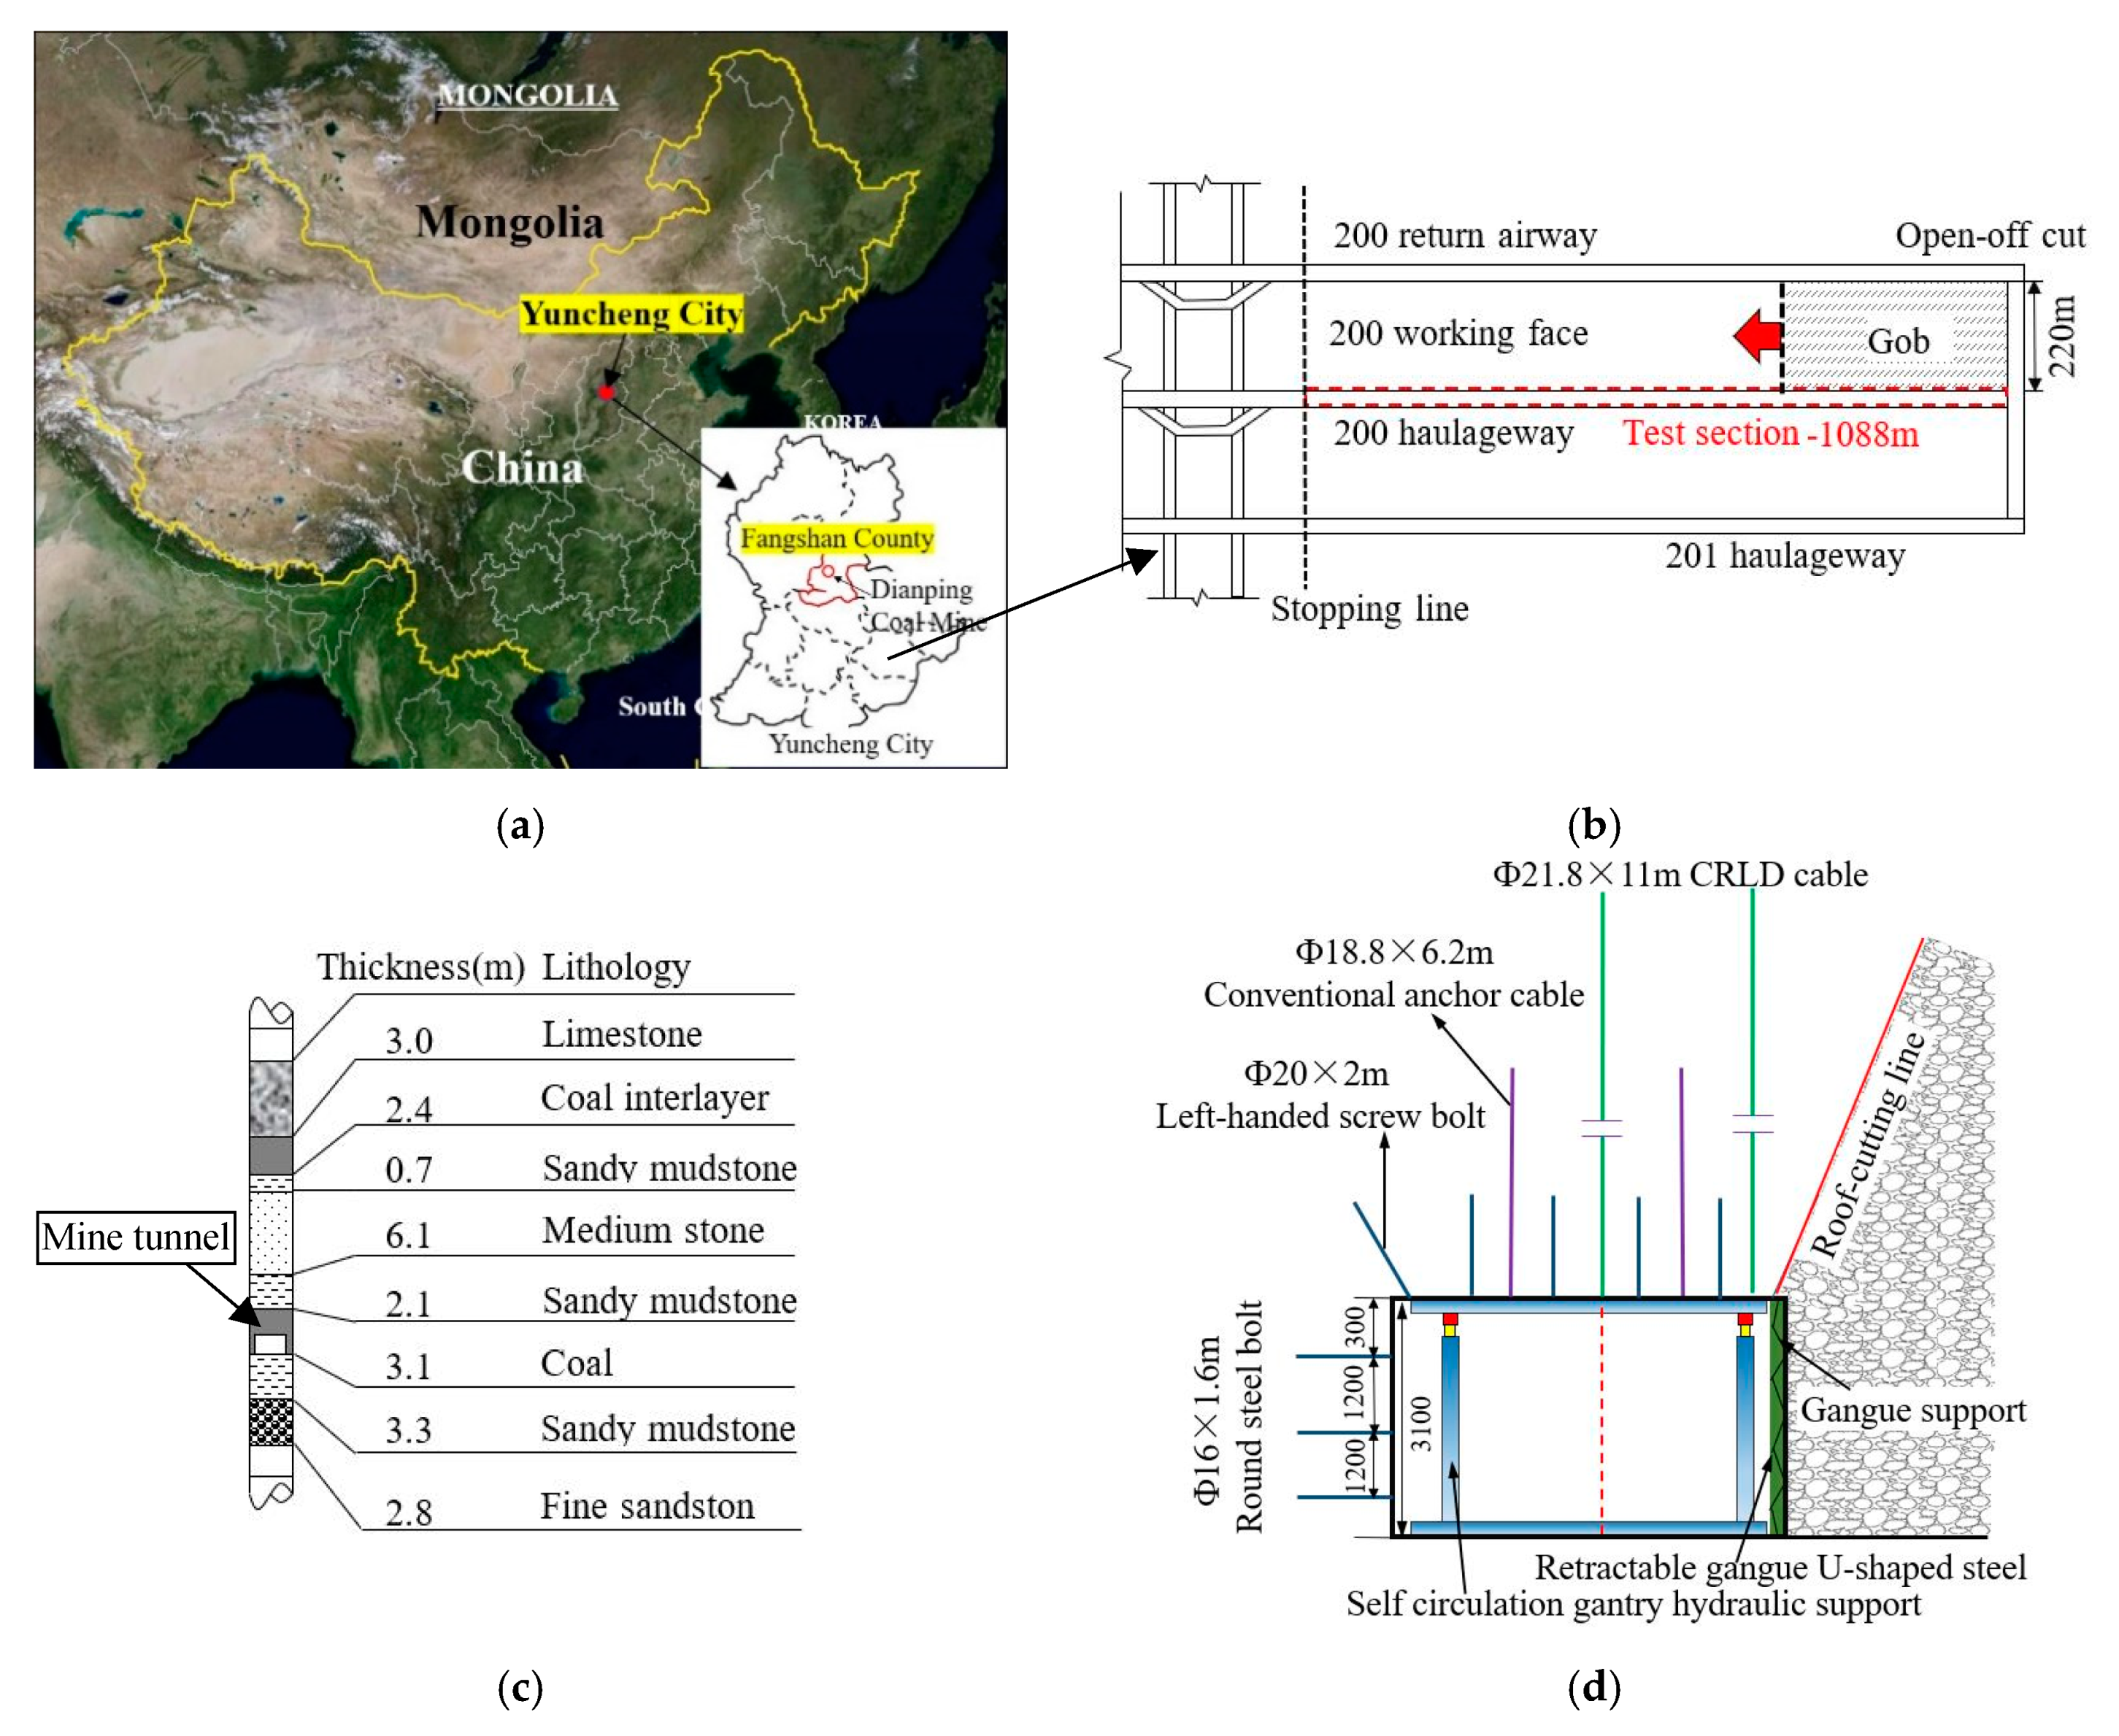
3. Project Overview
Geological Conditions
4. Model Experiment
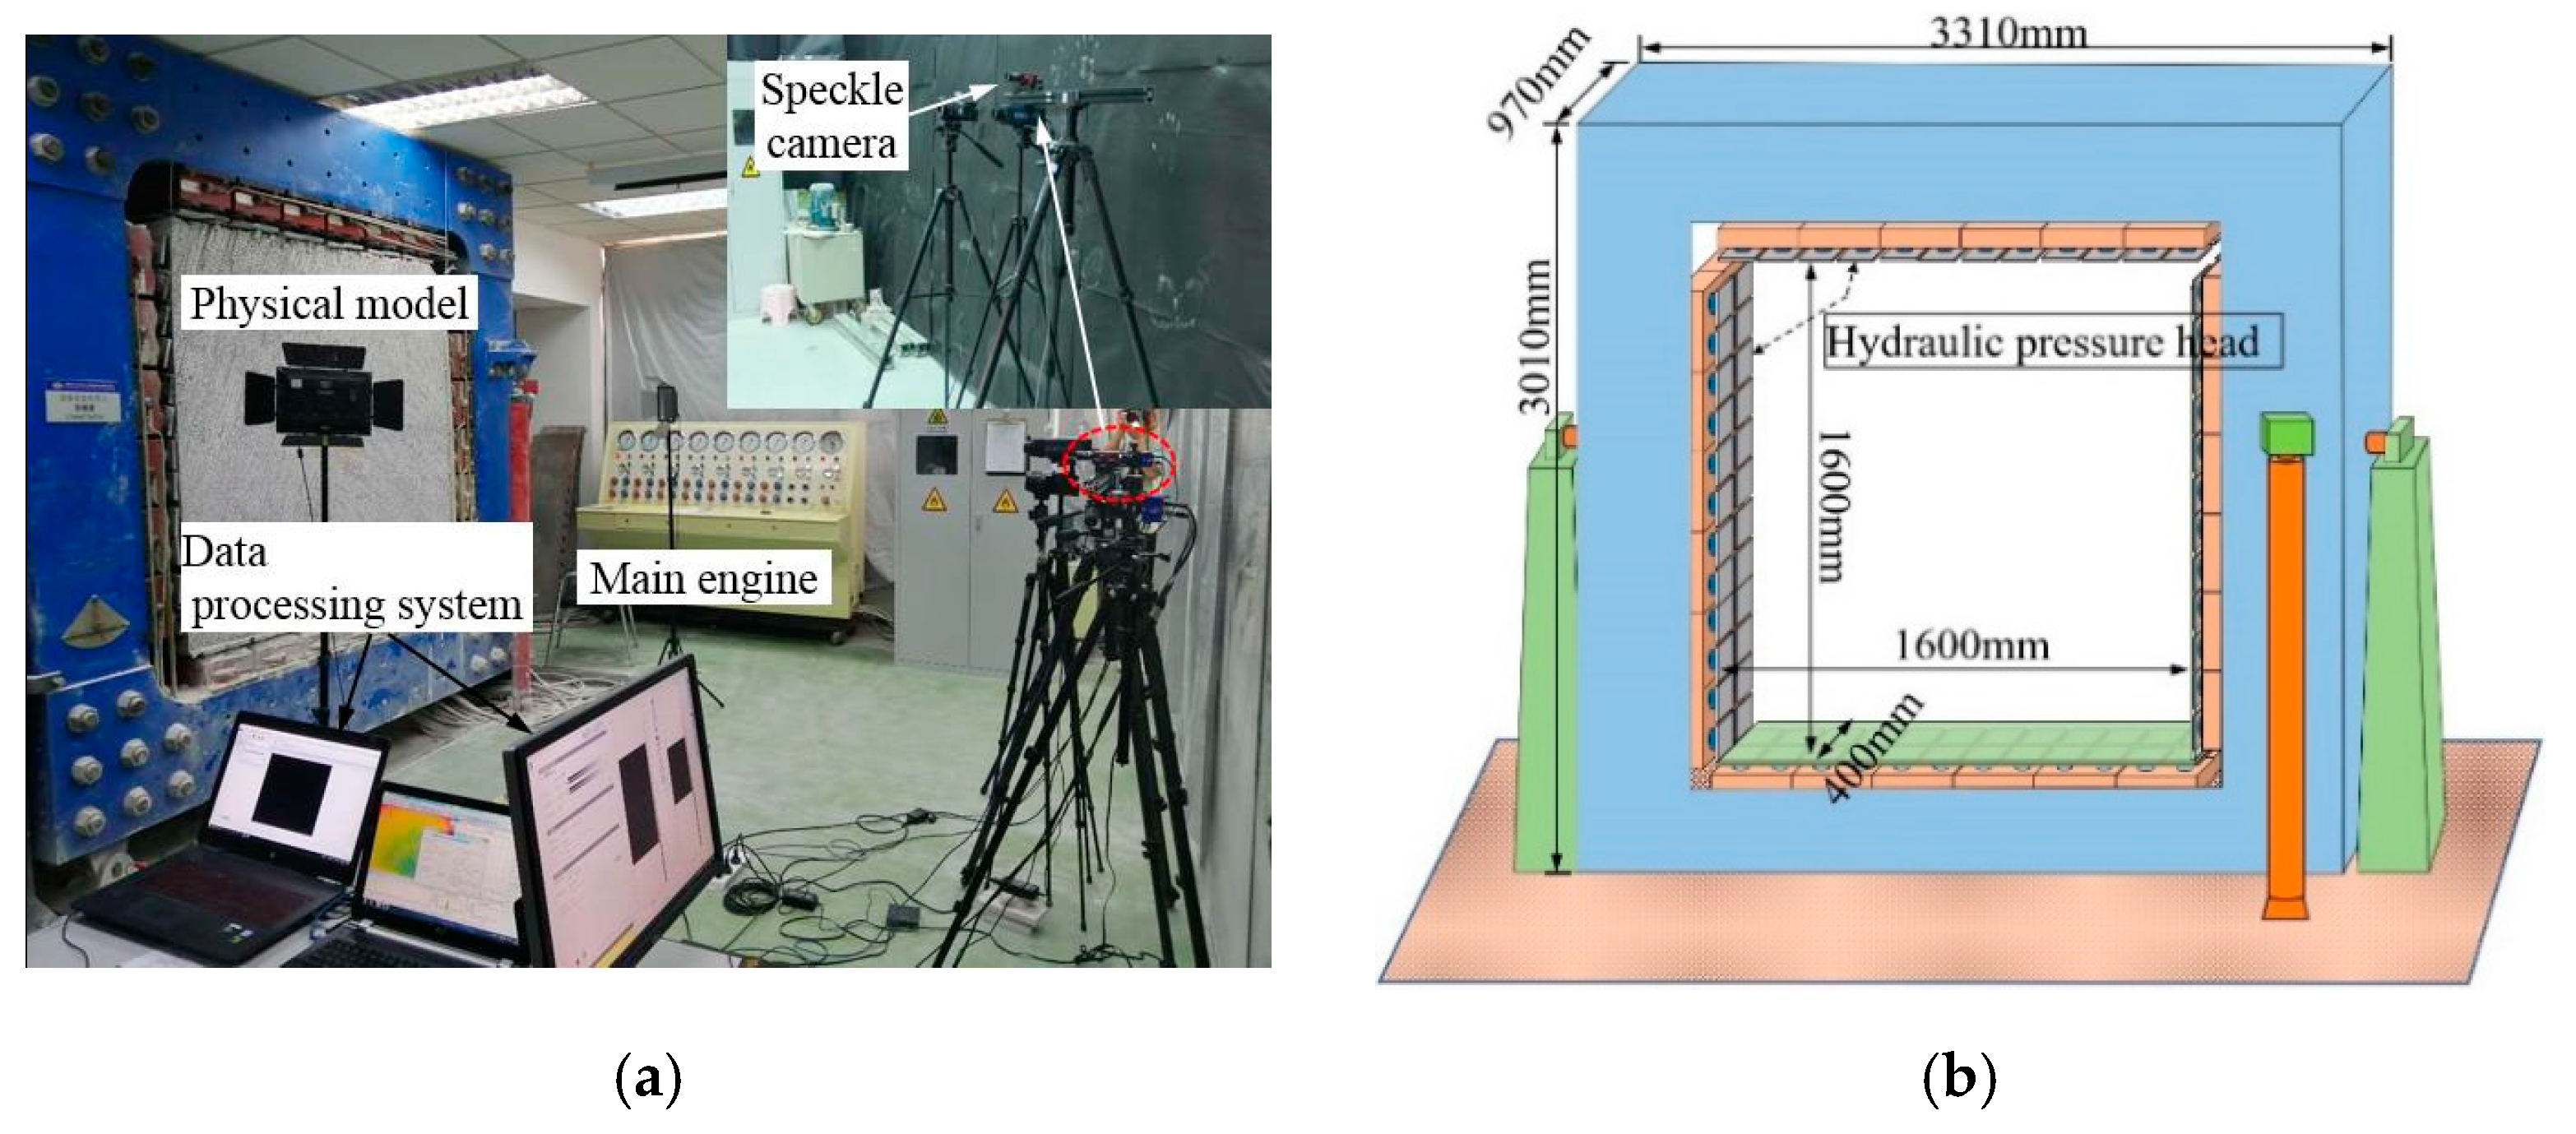
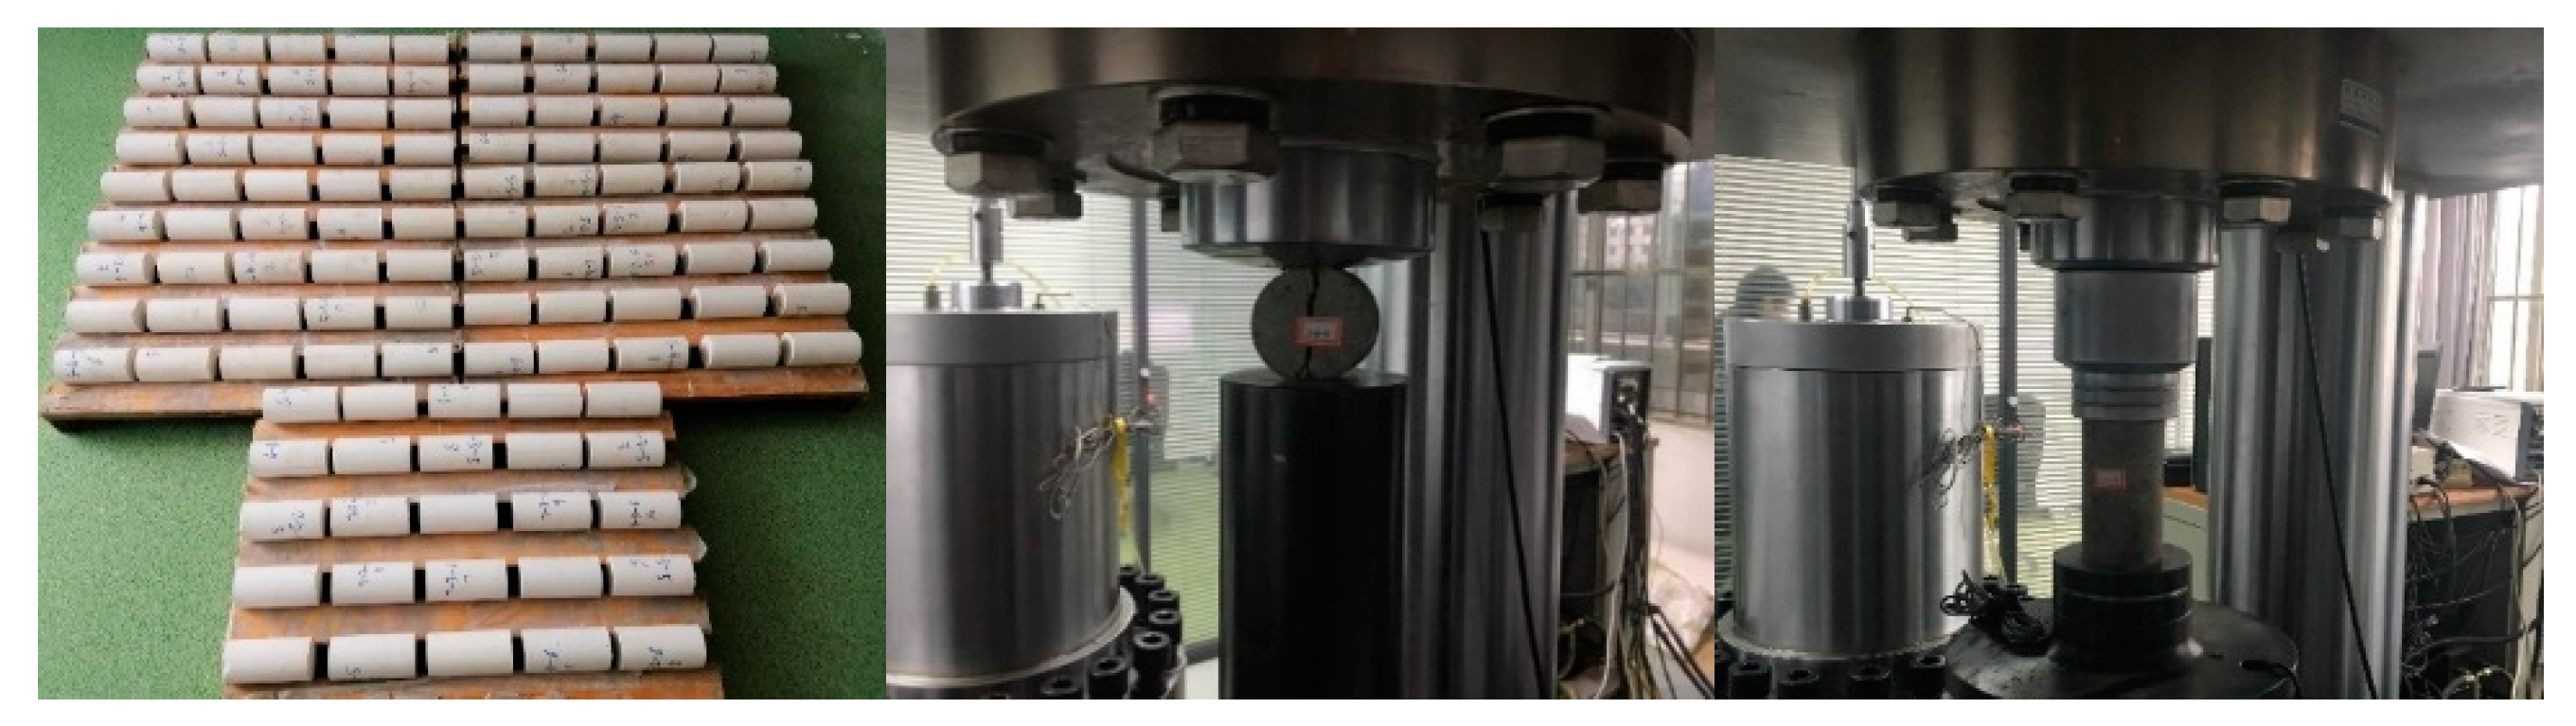
4.1. Testing System
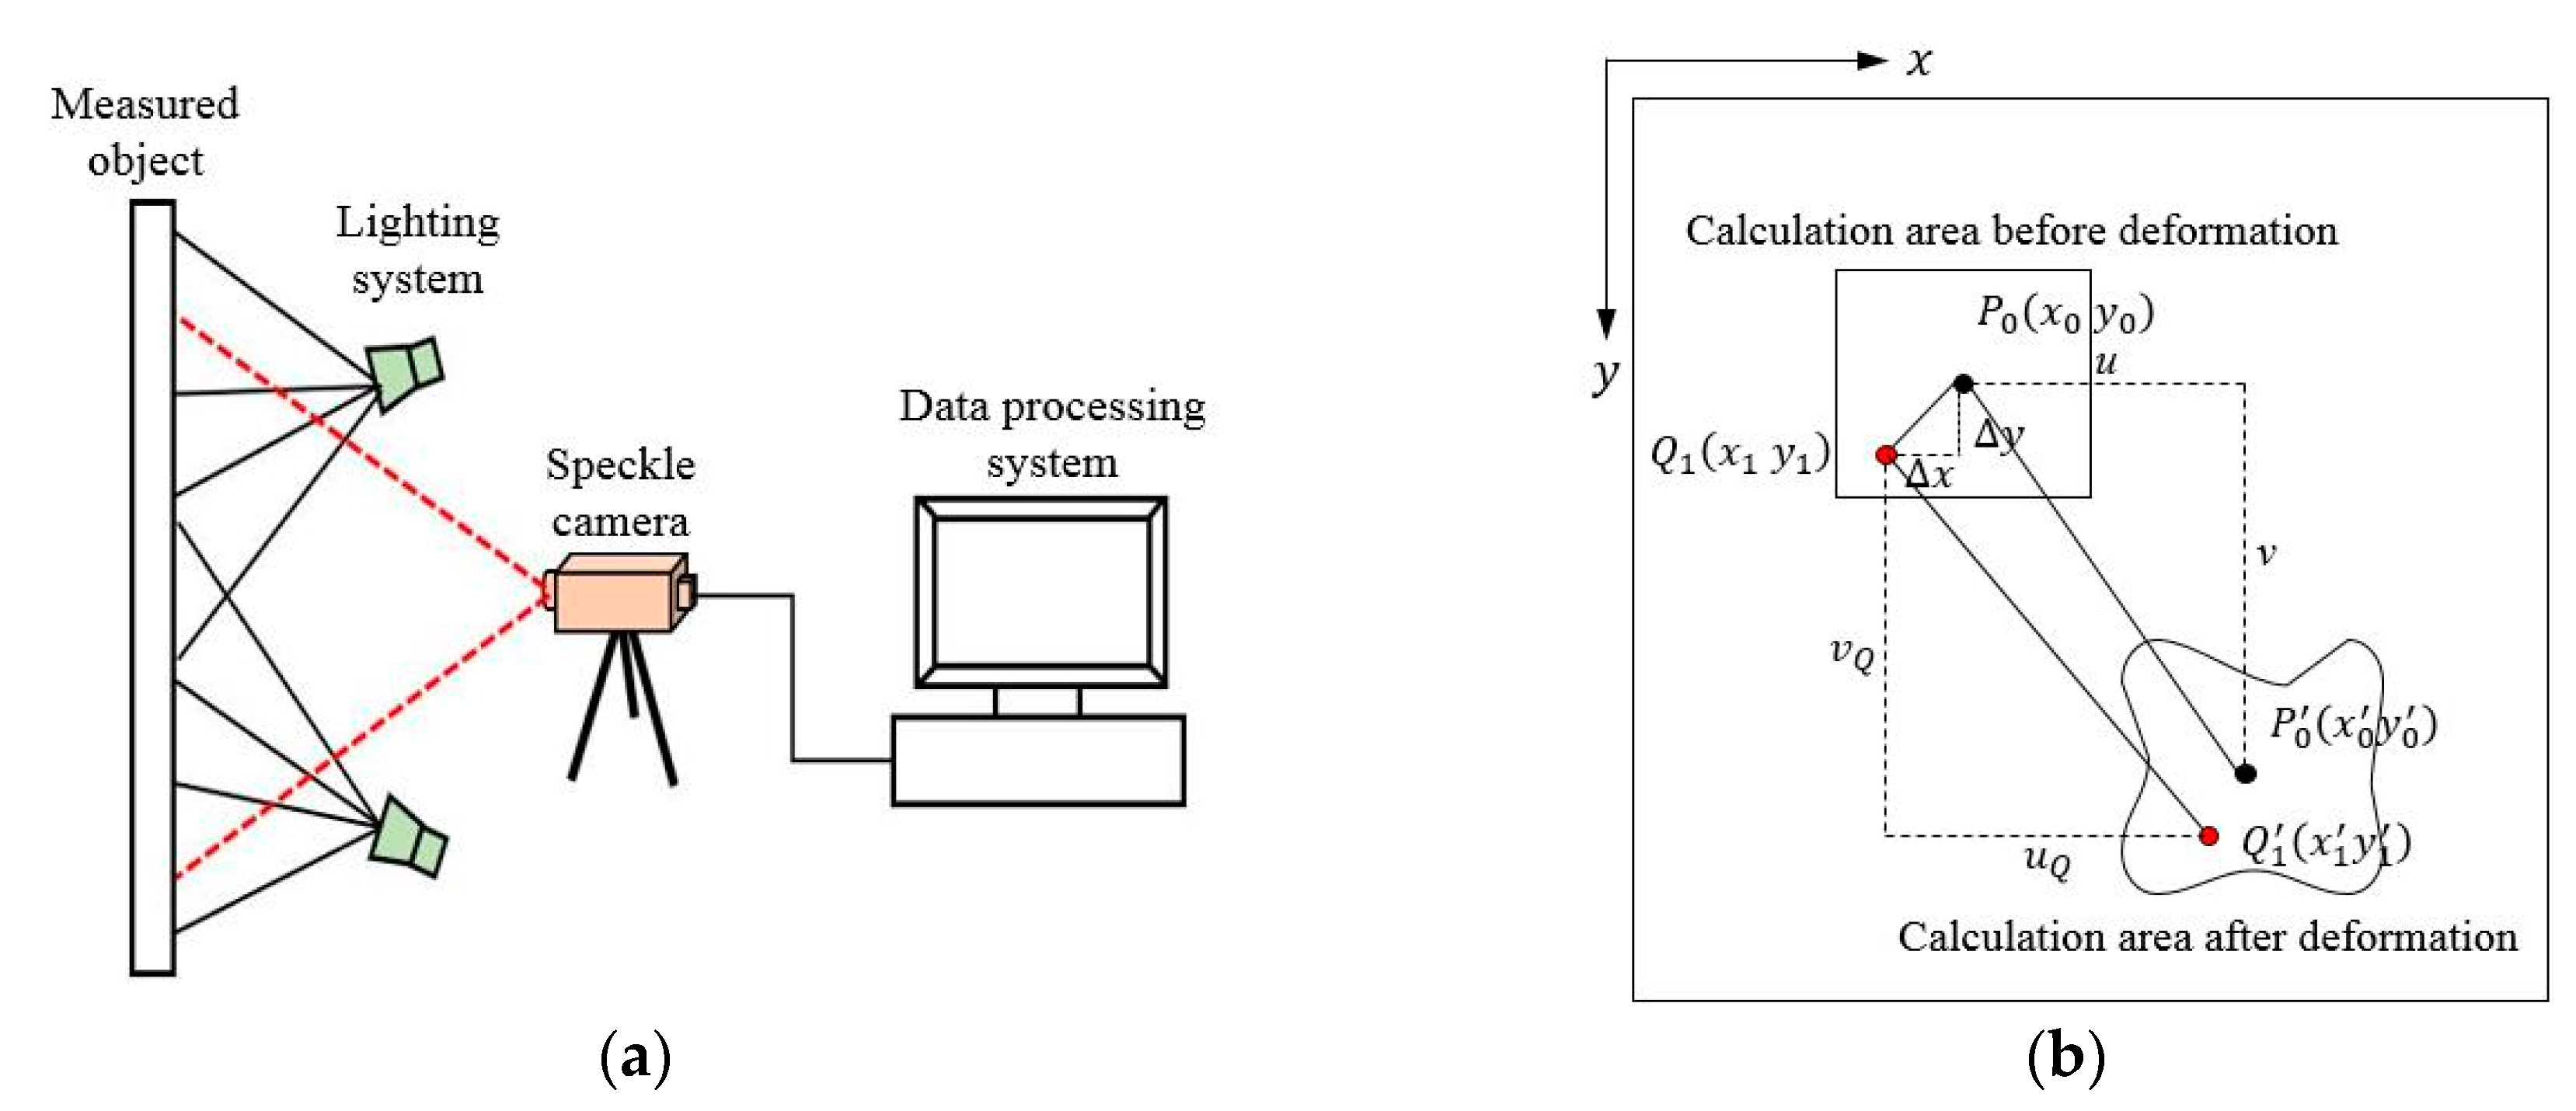
4.2. Test Monitoring System
4.3. Model Test
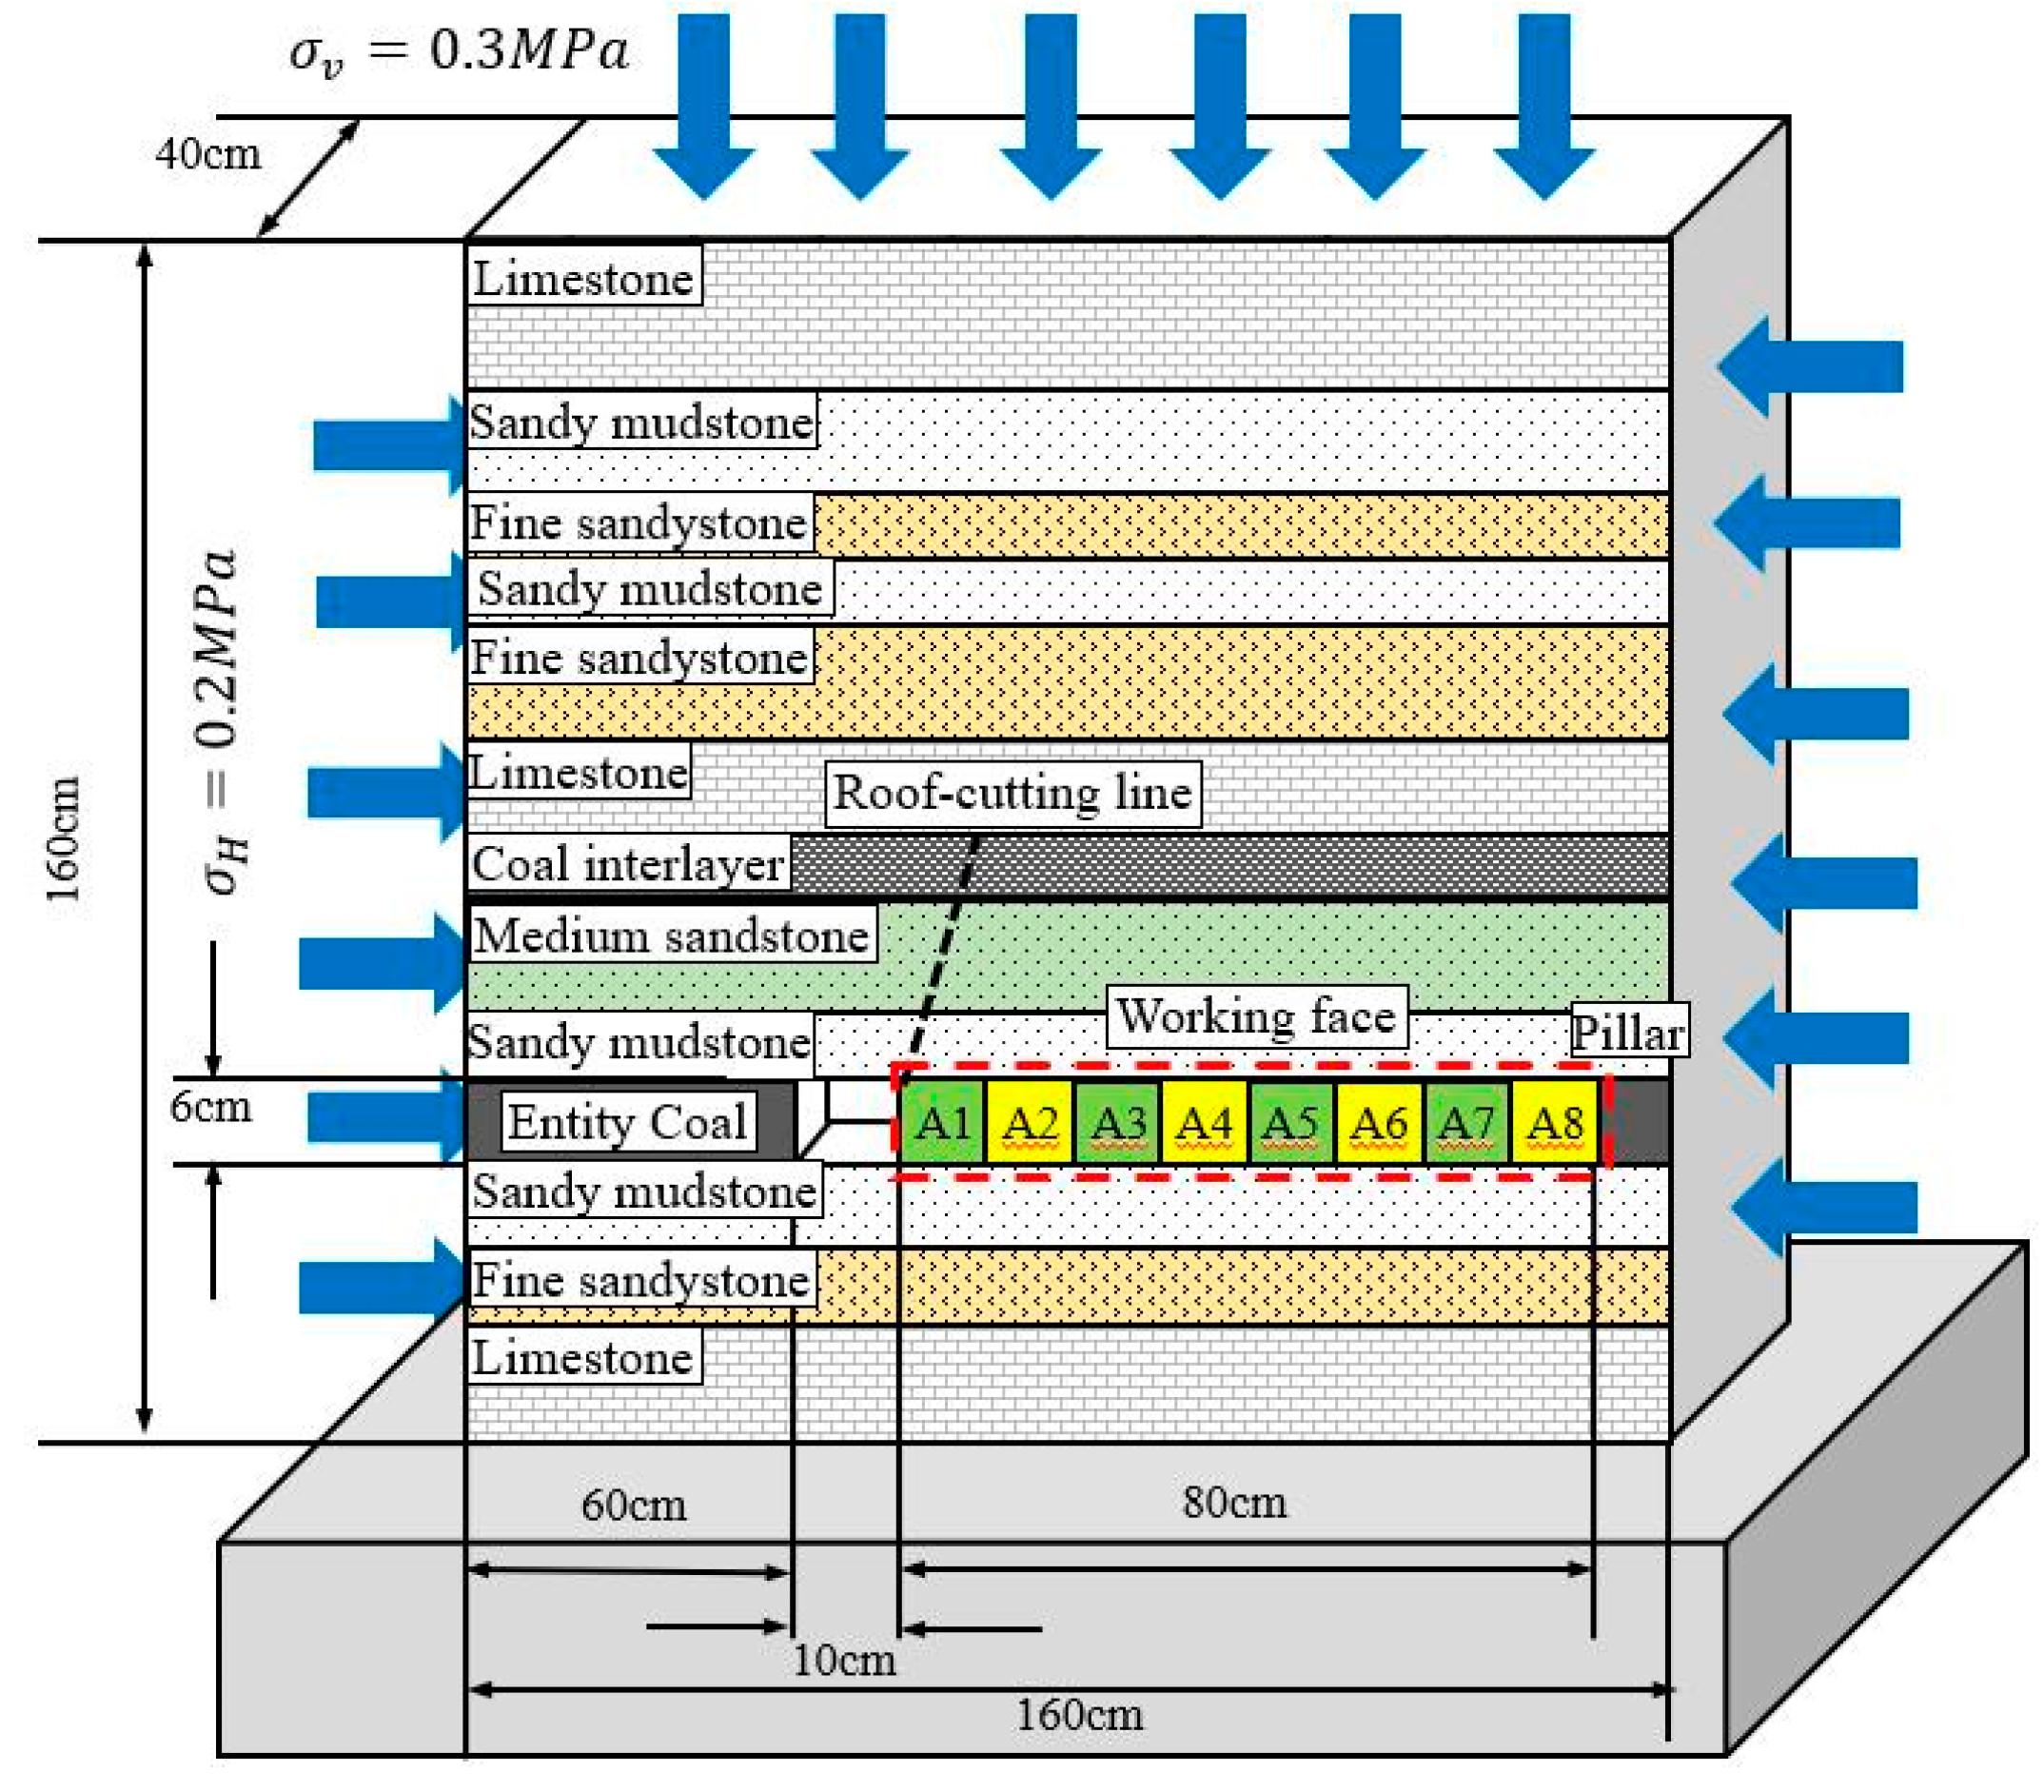
4.3.1. Model Similar Design
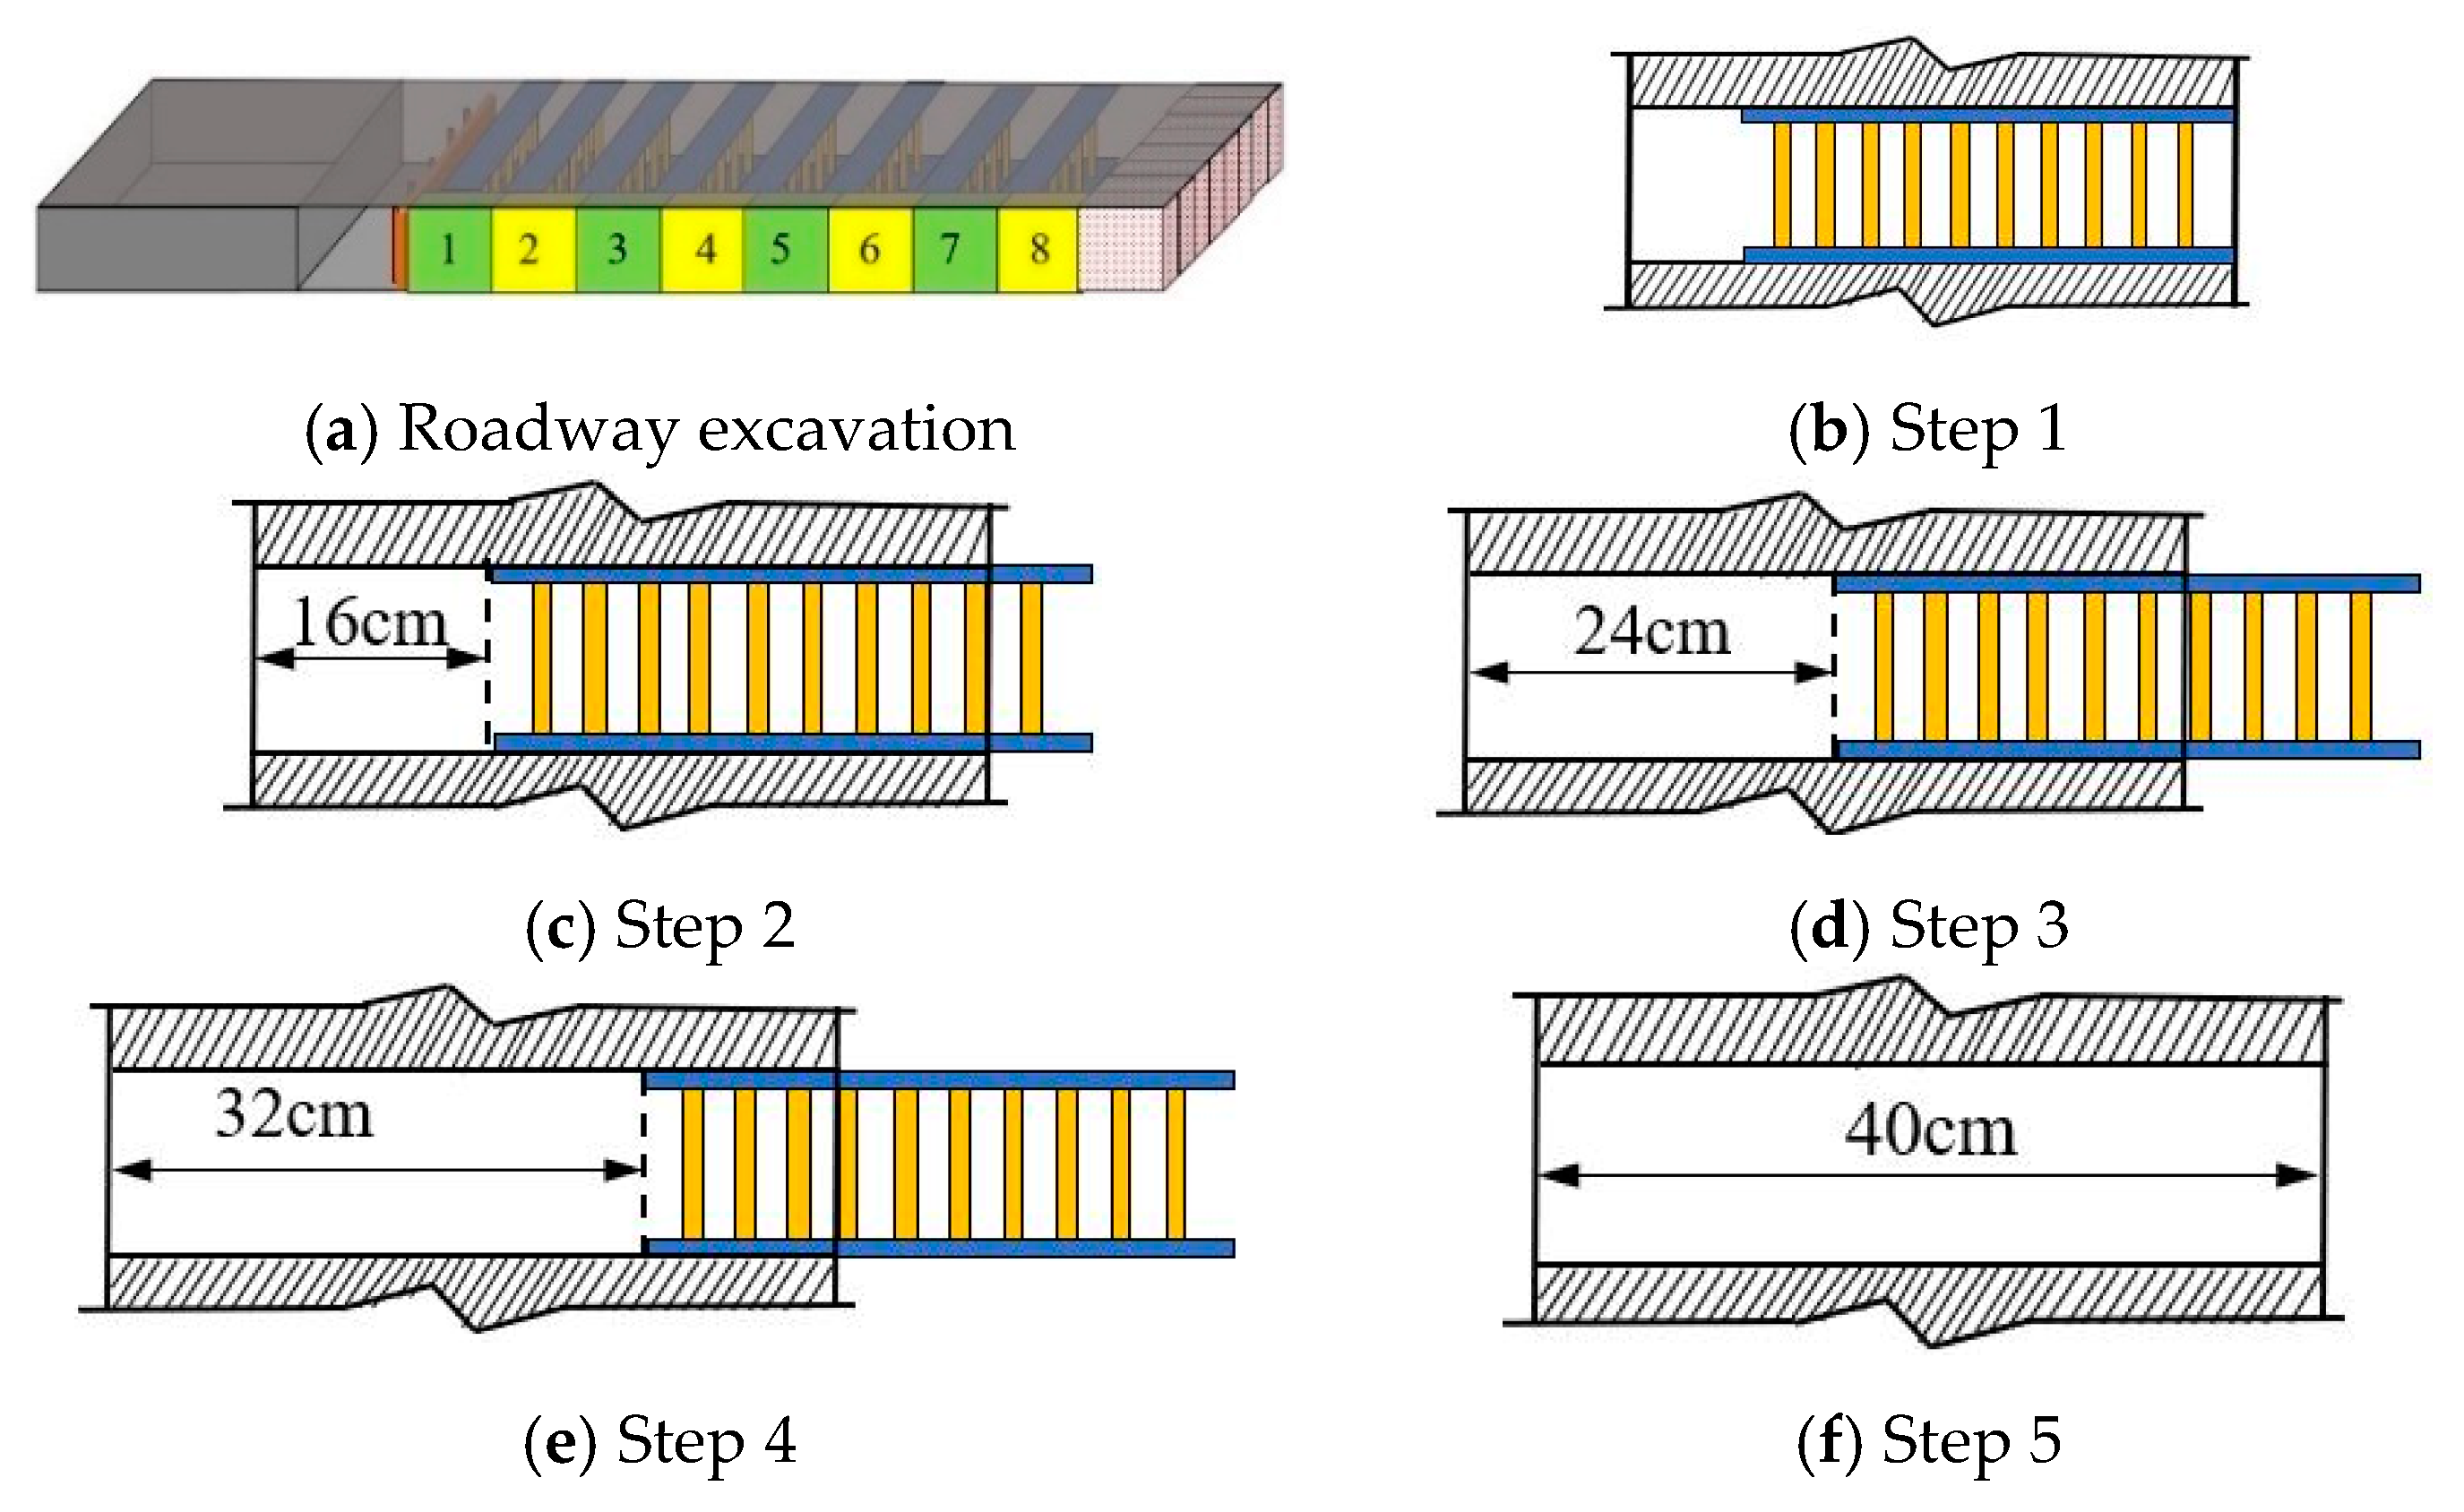
4.3.2. Excavation Design
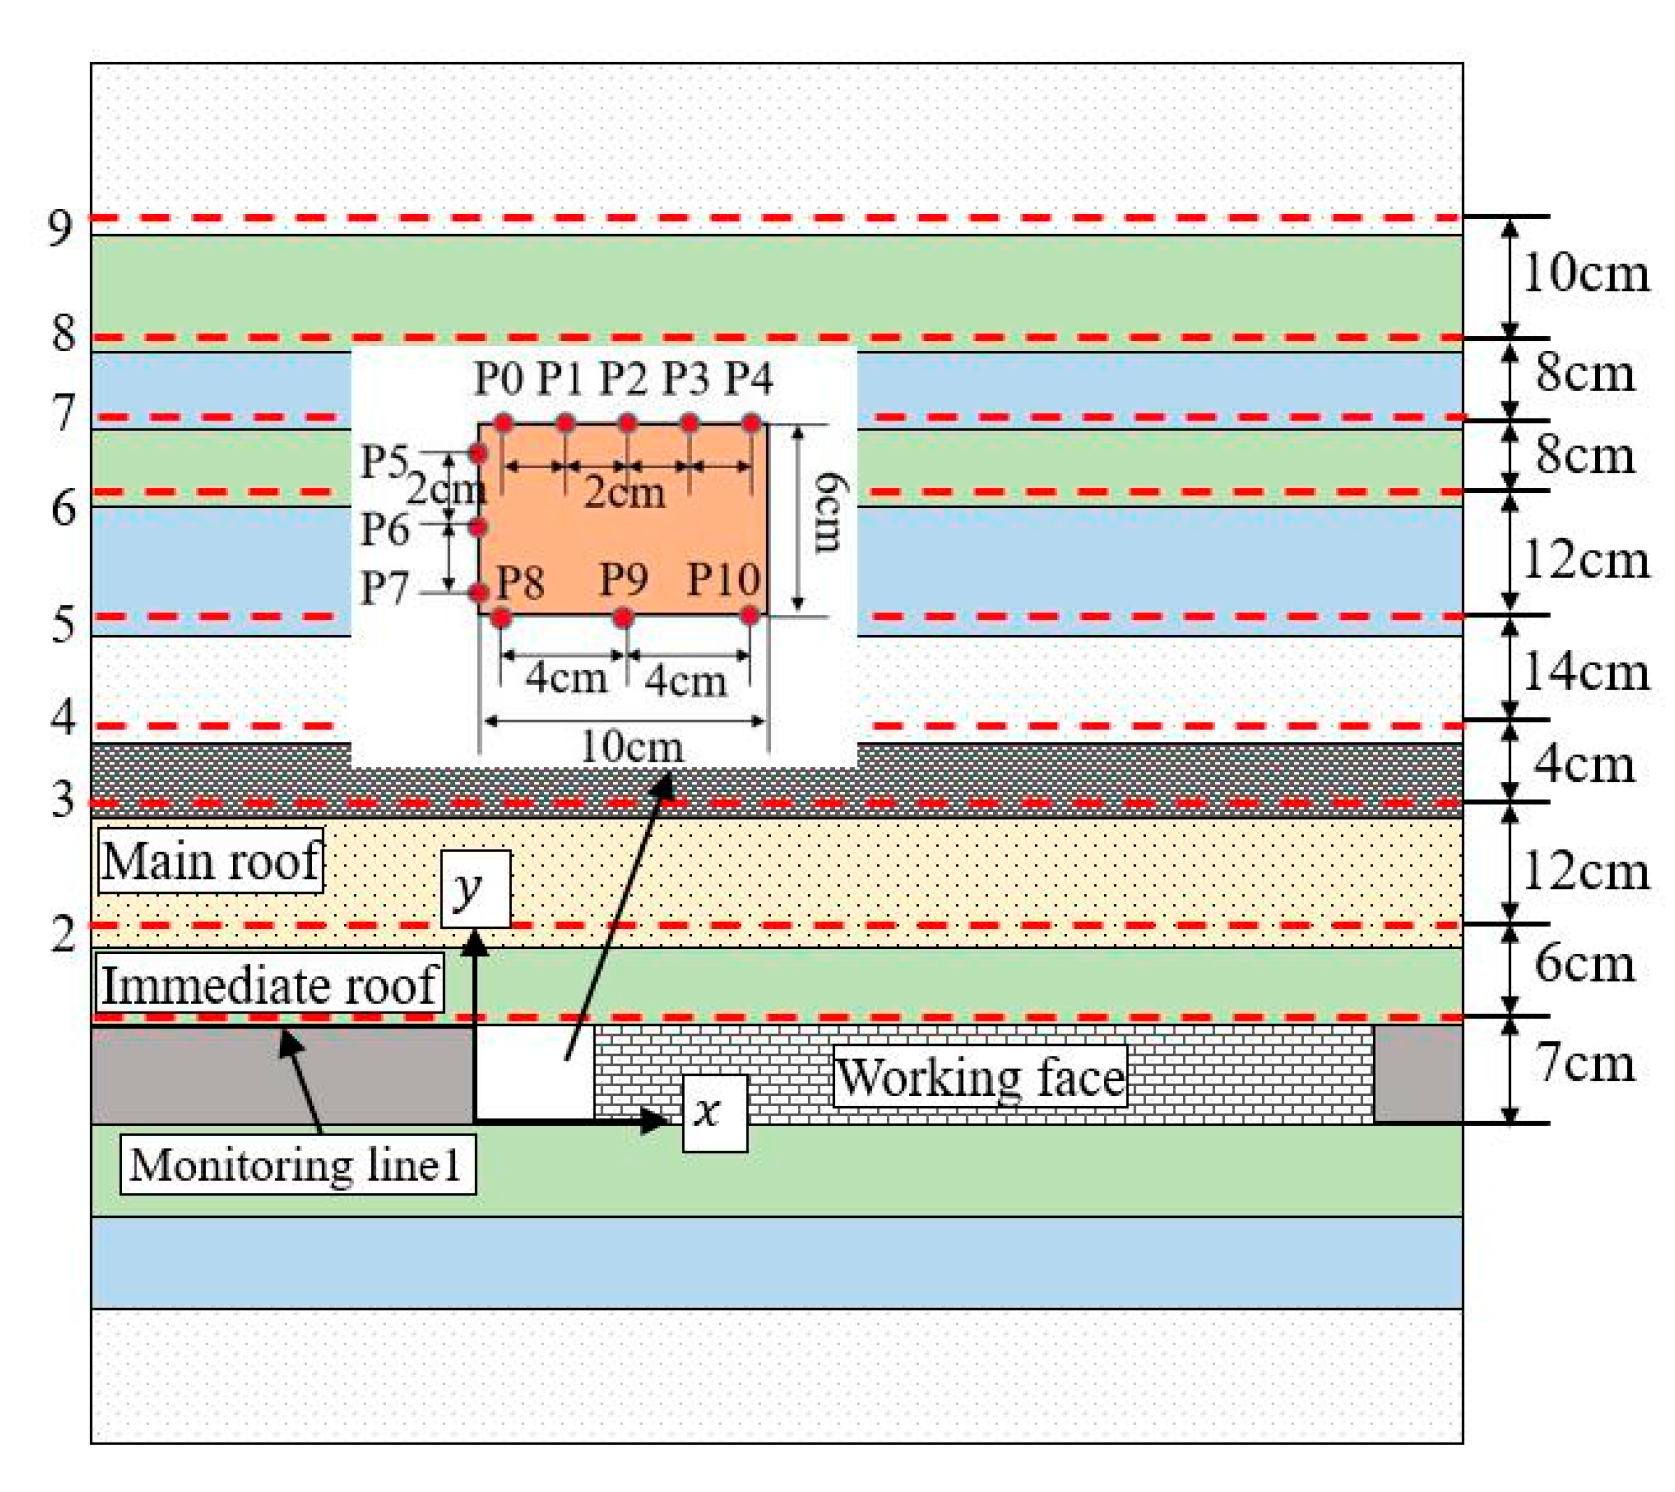
4.3.3. Monitoring Design
4.4. Results
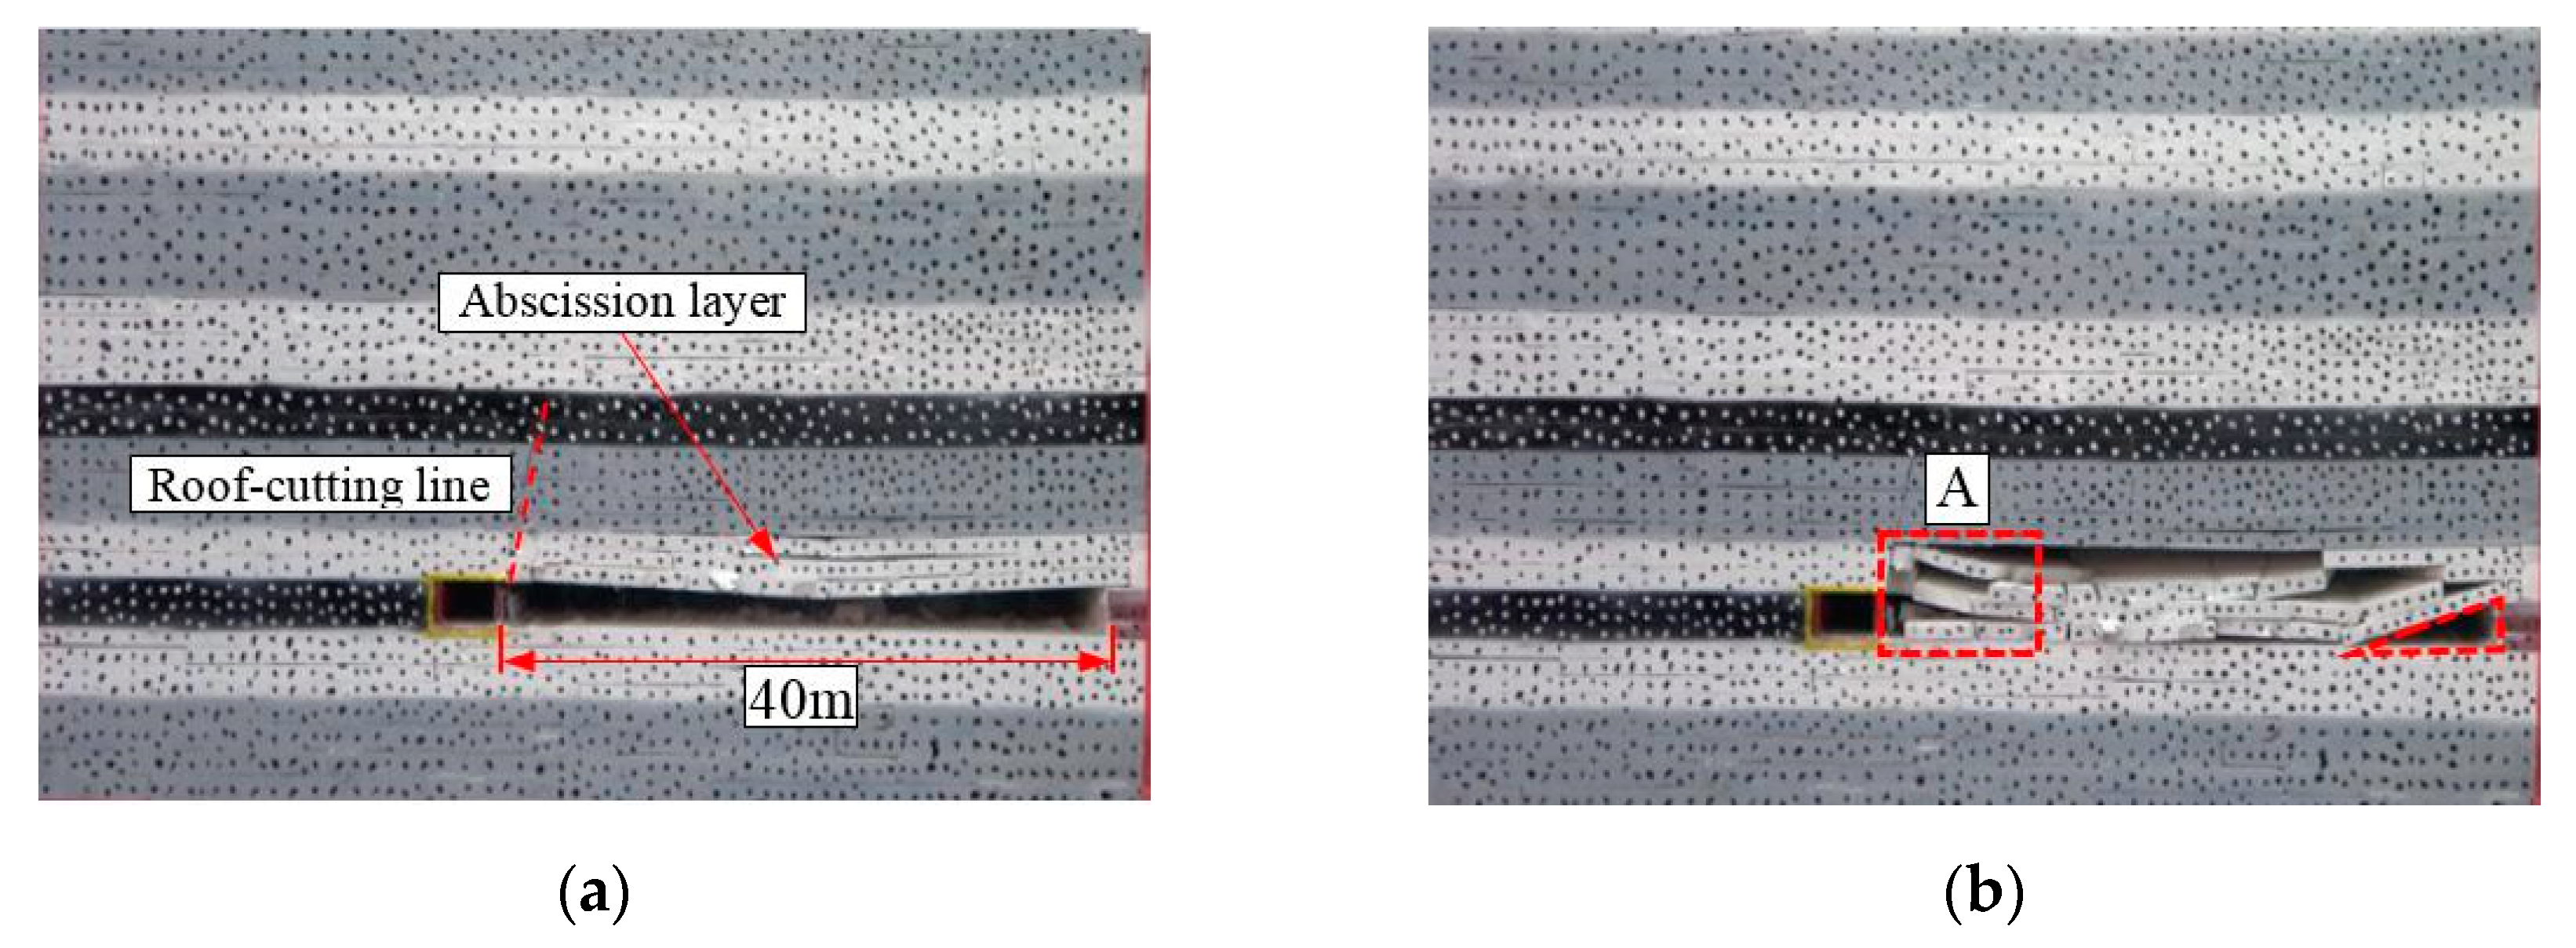
4.4.1. Experimental Process
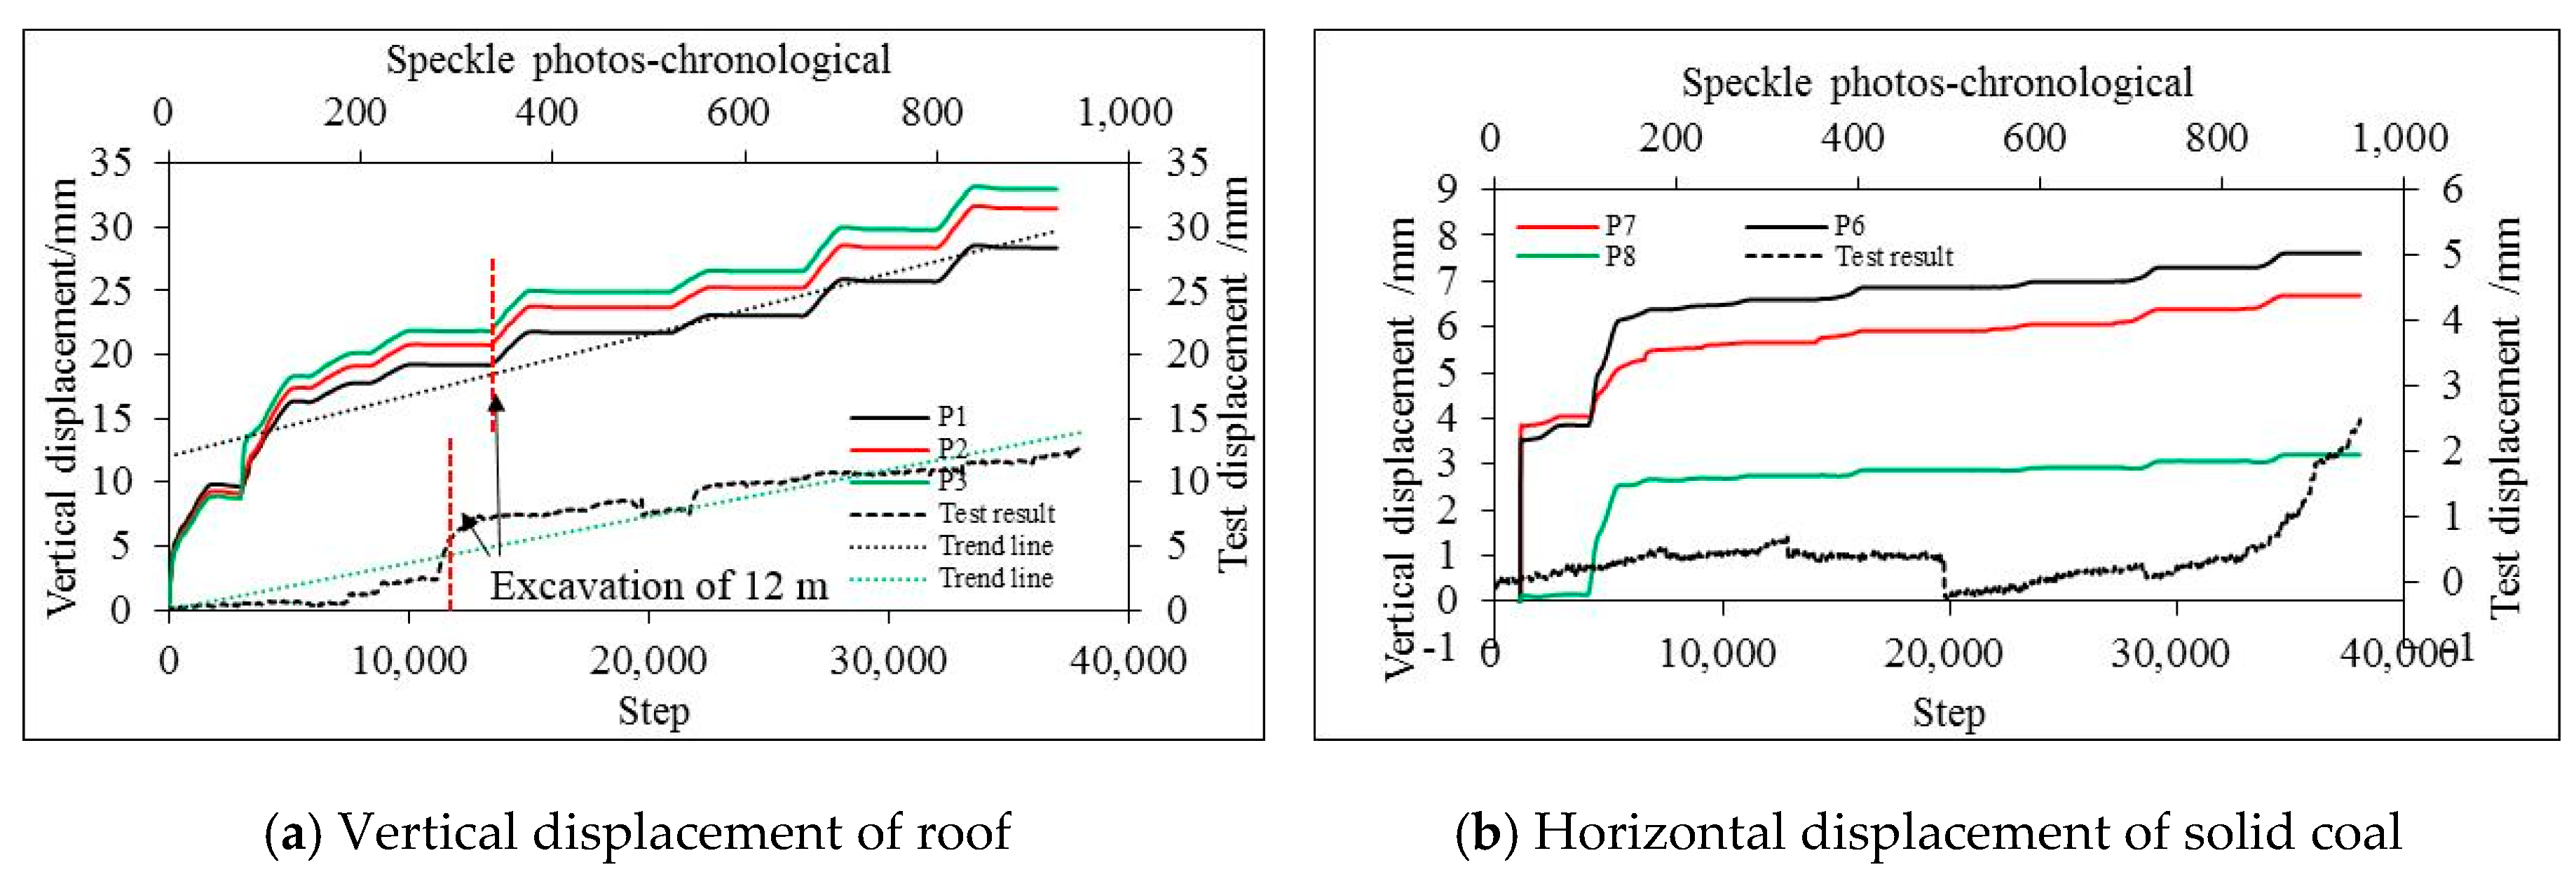
4.4.2. Displacement Analysis
4.4.3. Analysis of the Retained Roadway Deformation
5. FLAC3D Modeling
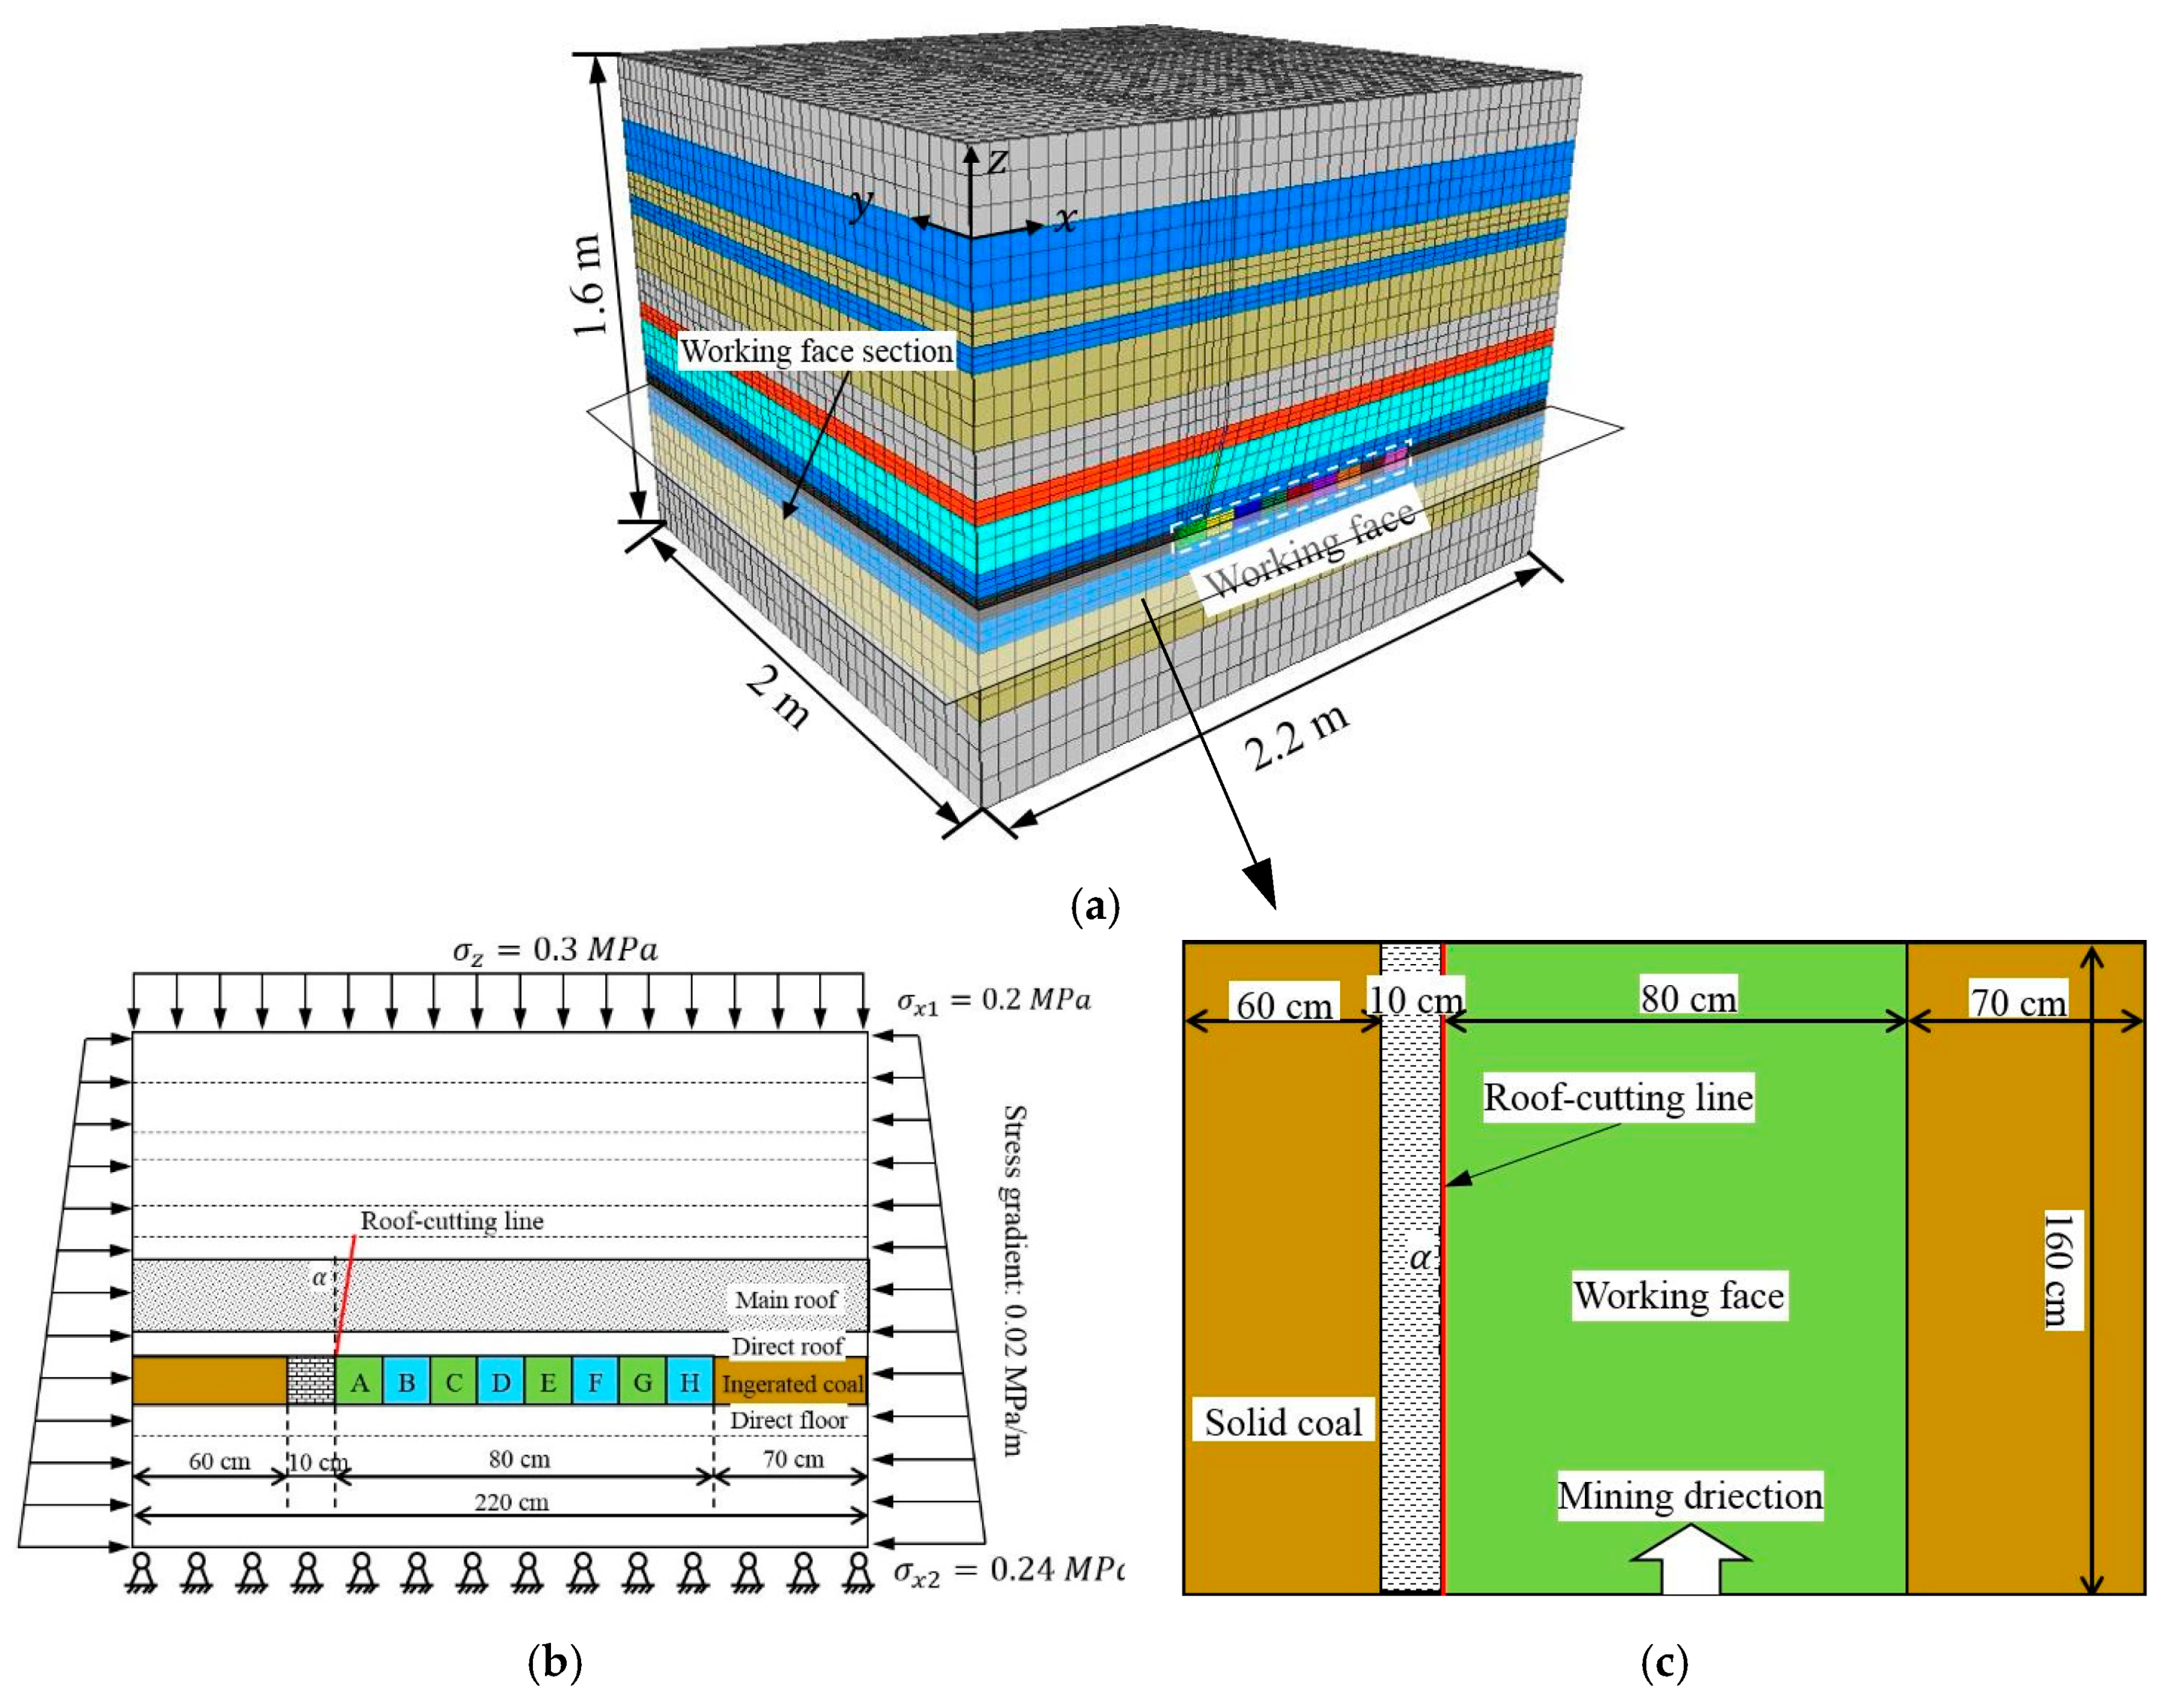
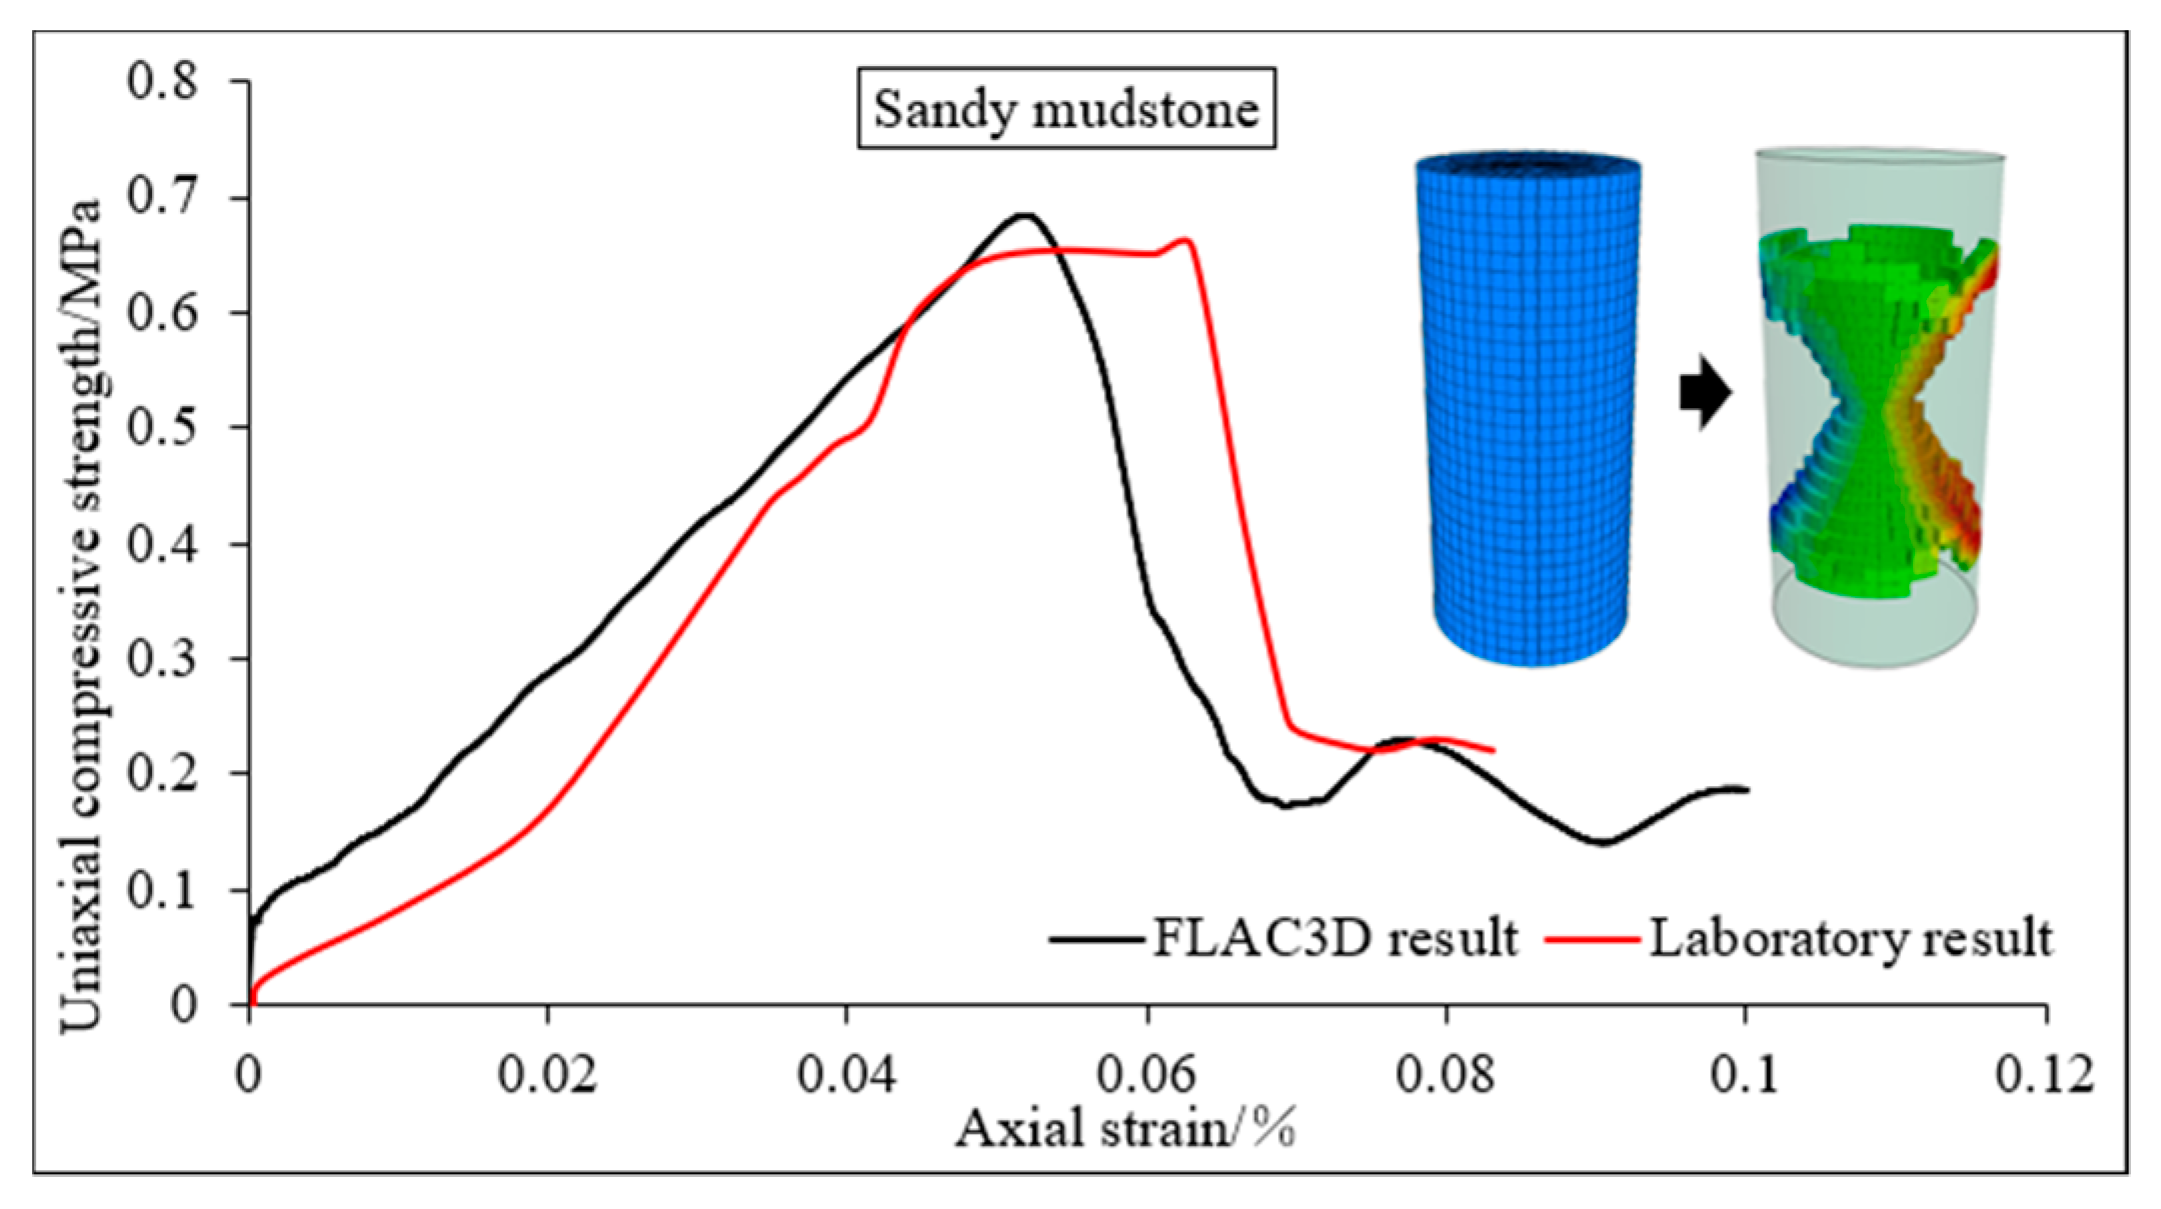
5.1. Model Setup and Calibrations
5.2. Simulation Results
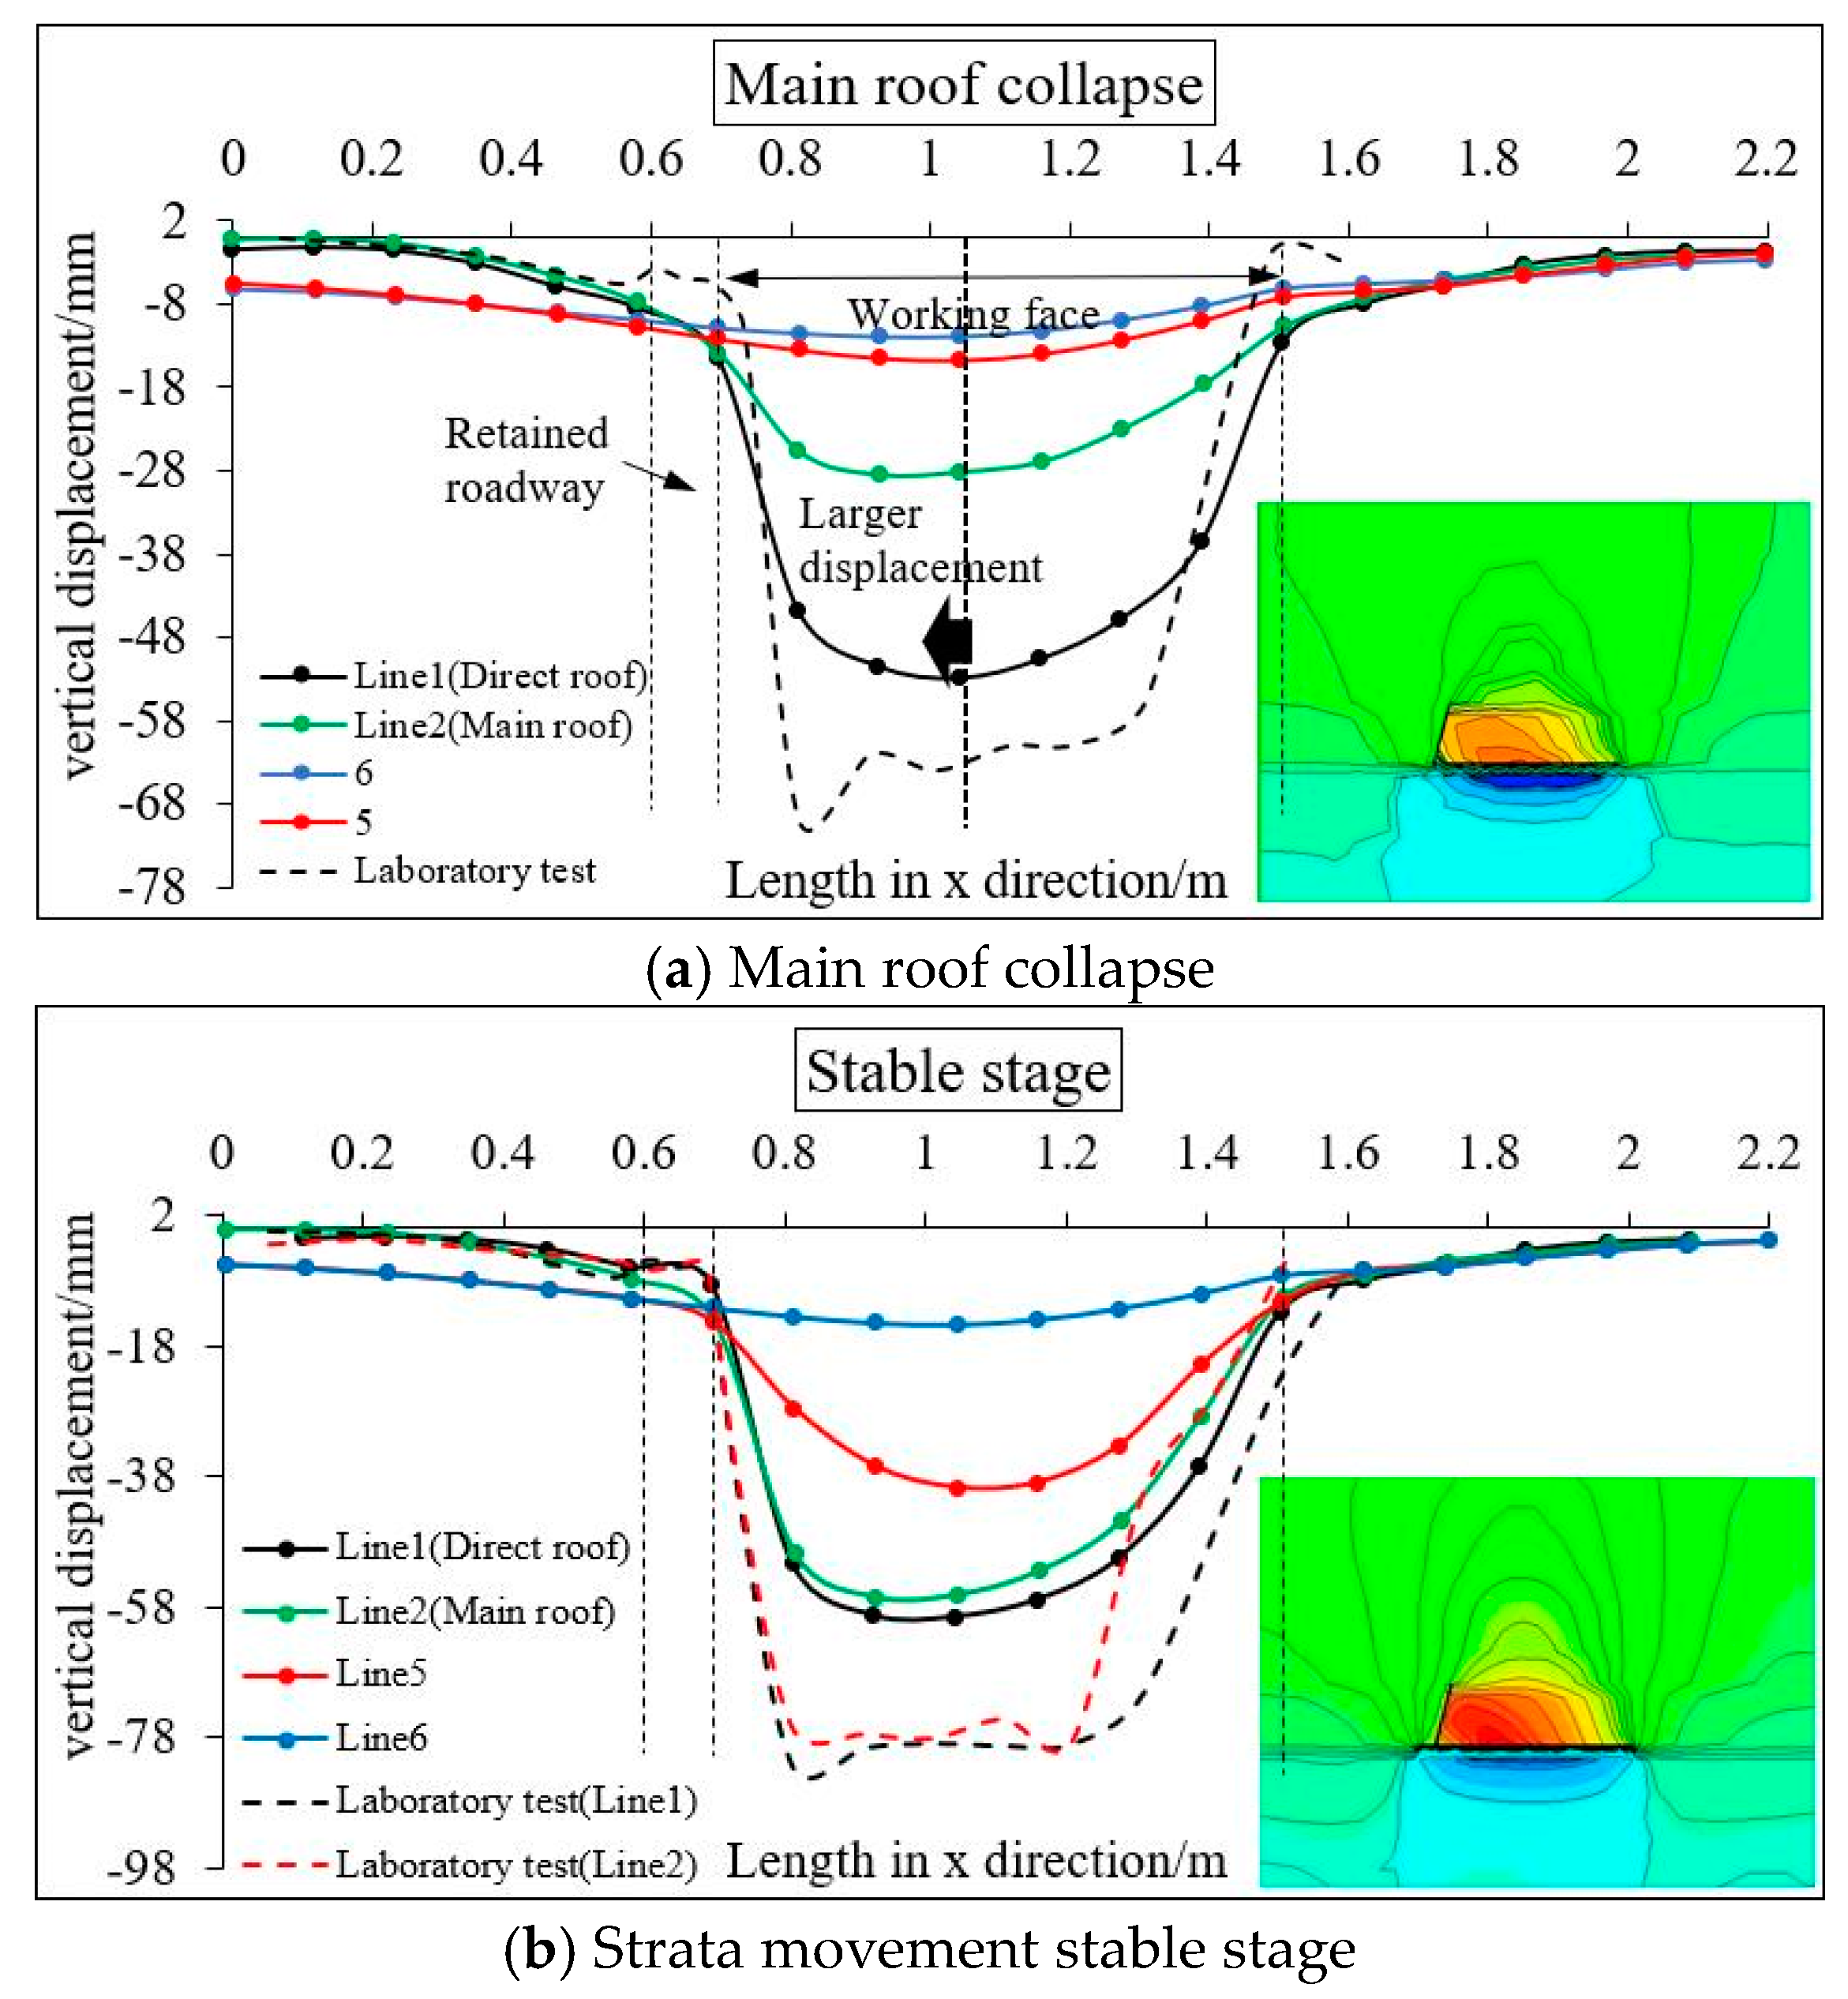
5.2.1. Analysis of the Strata Movement
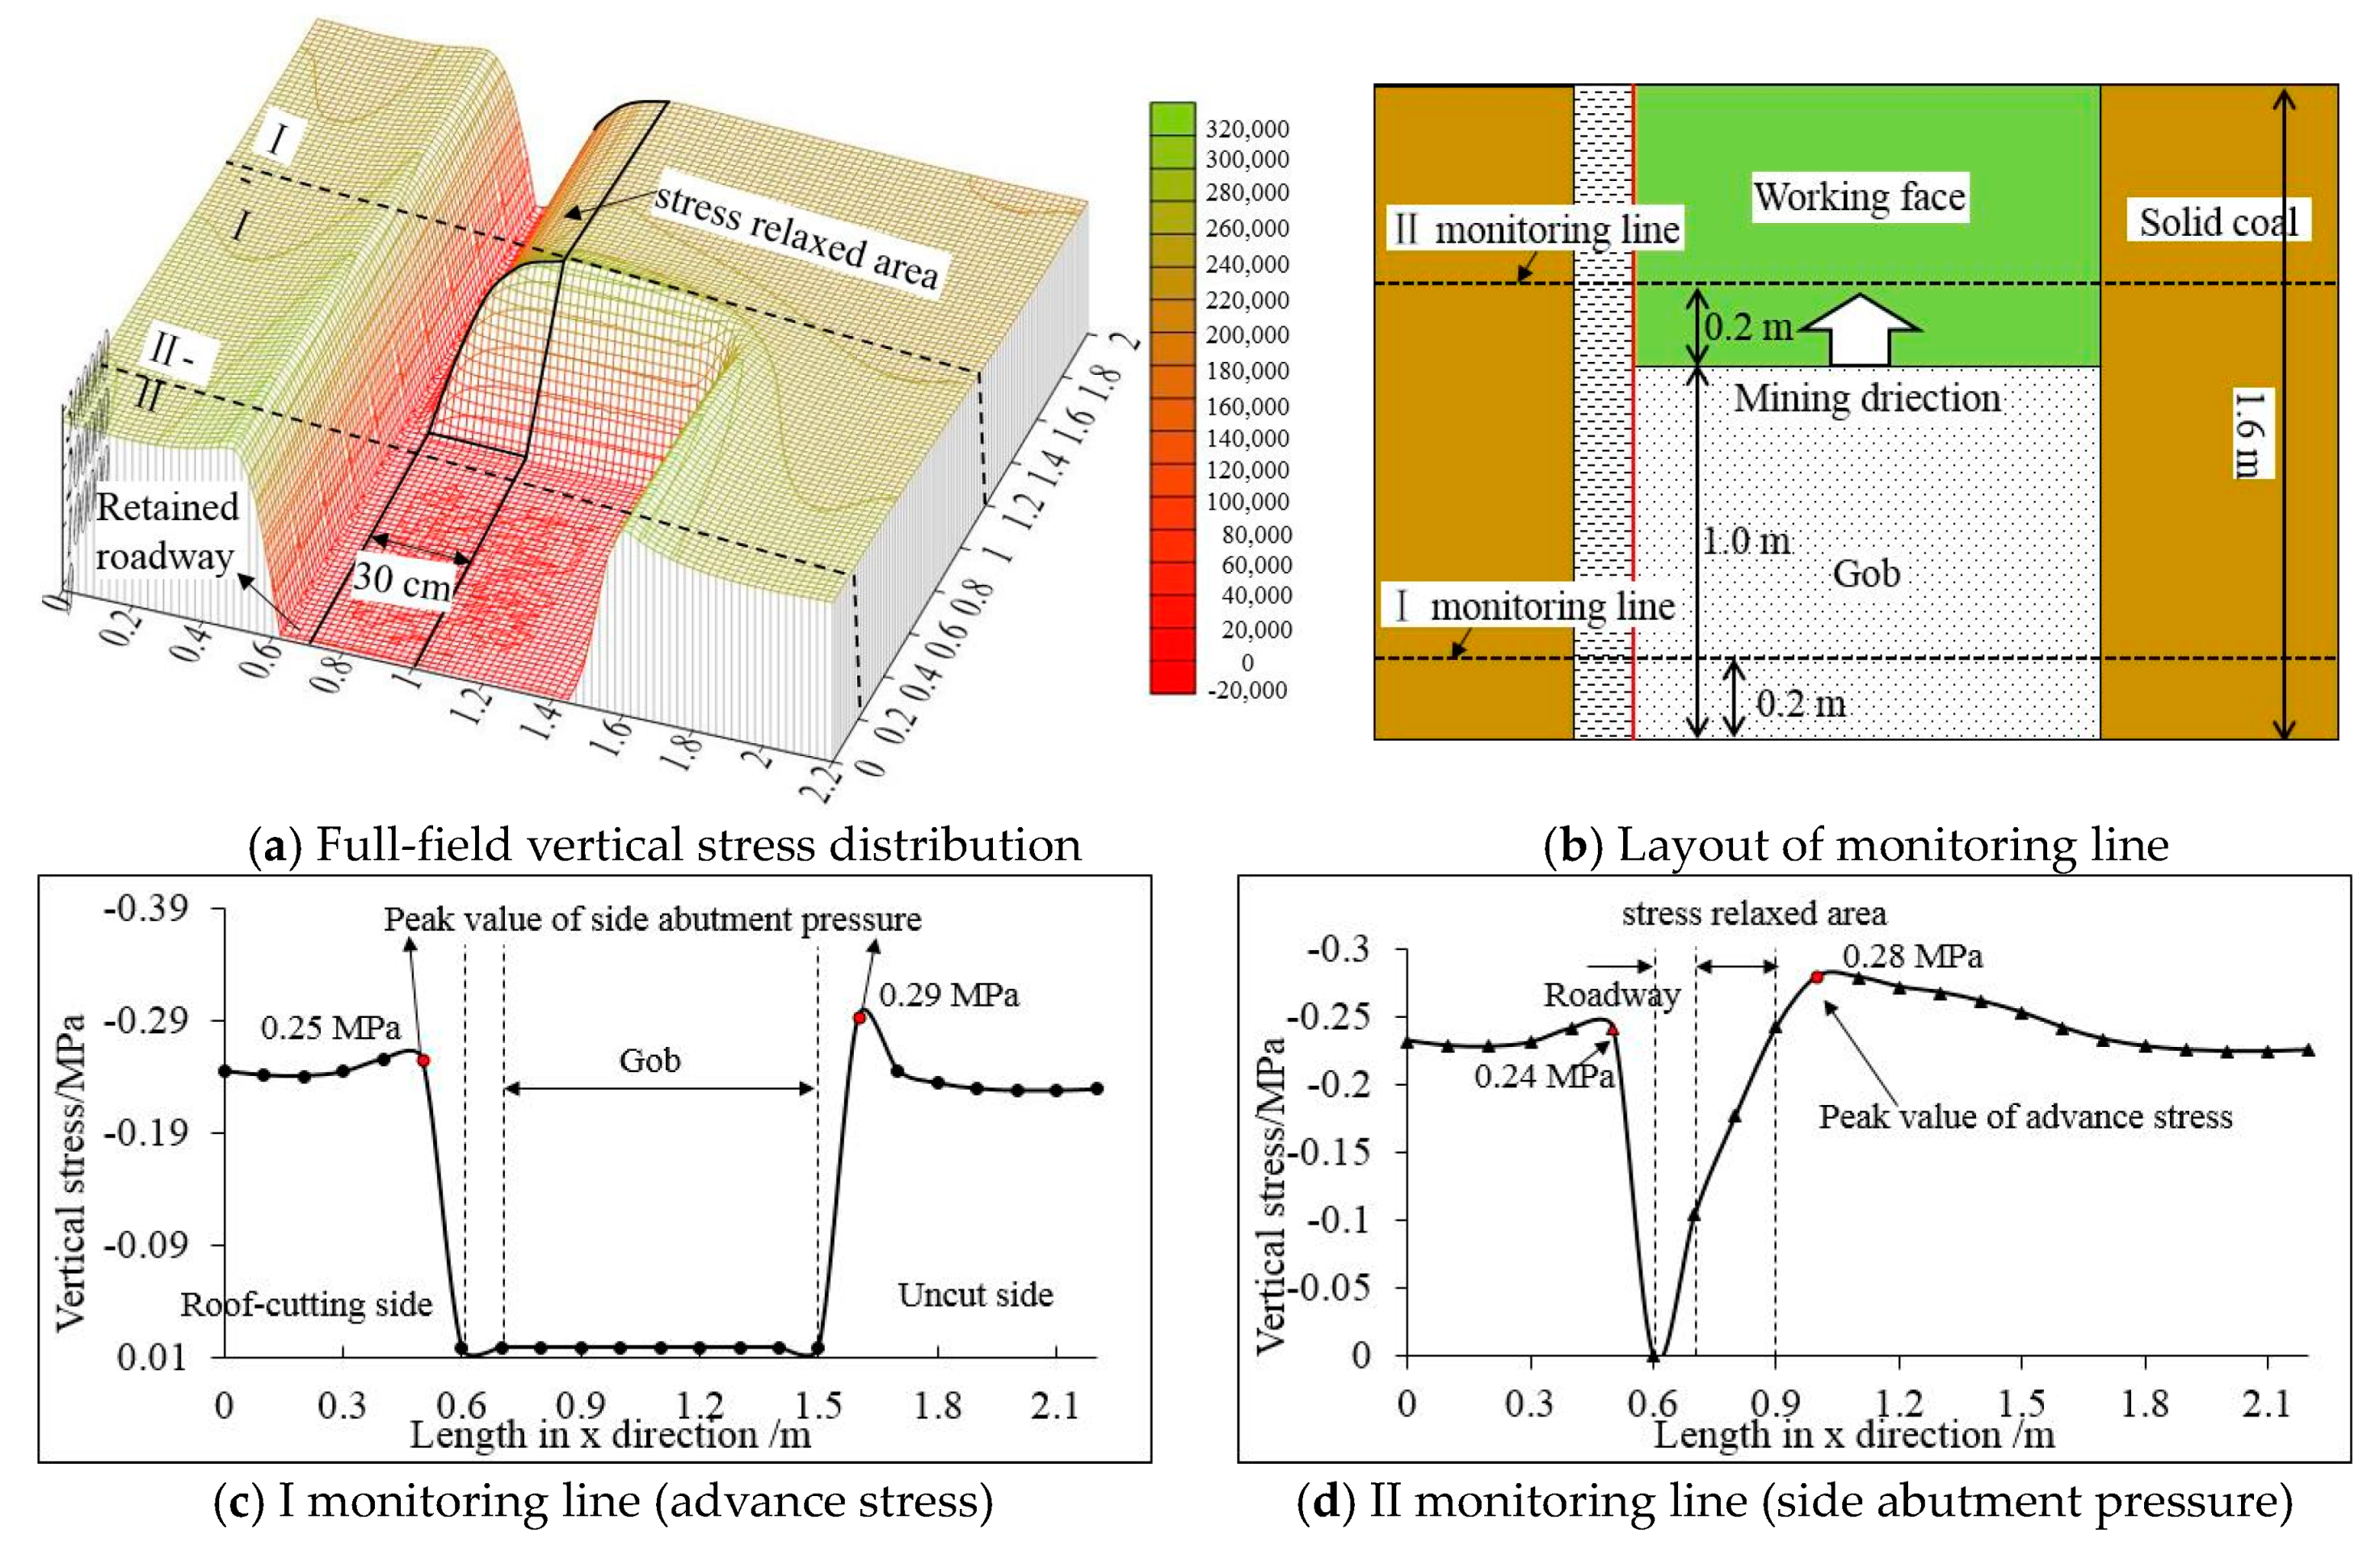
5.2.2. Analysis of the Stress Distribution Law
5.2.3. Analysis of the Retained Roadway Deformation
6. On-Site Monitoring
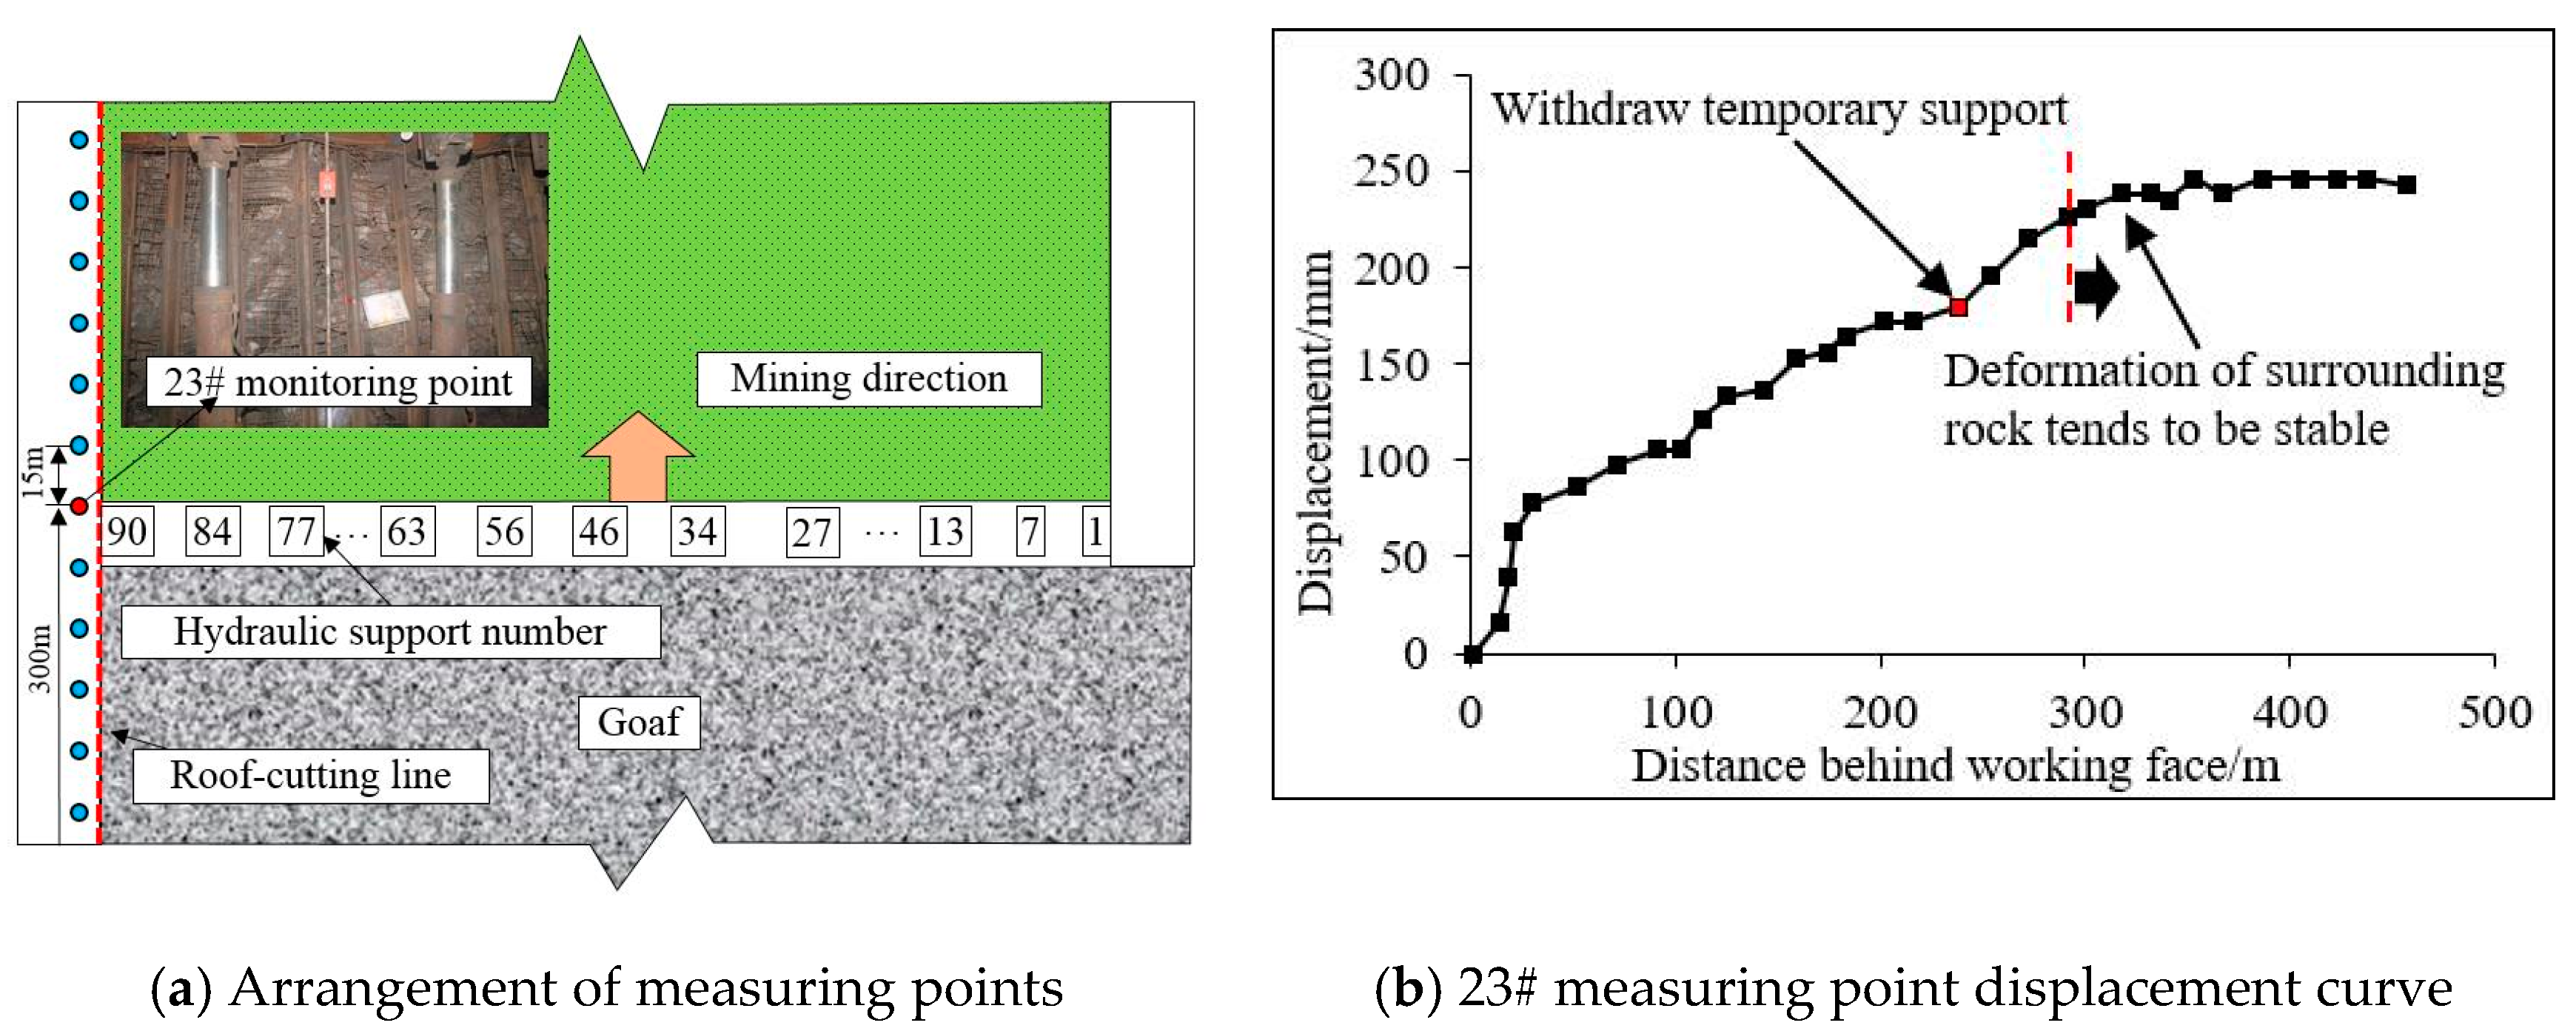
6.1. Roof Deformation Monitoring
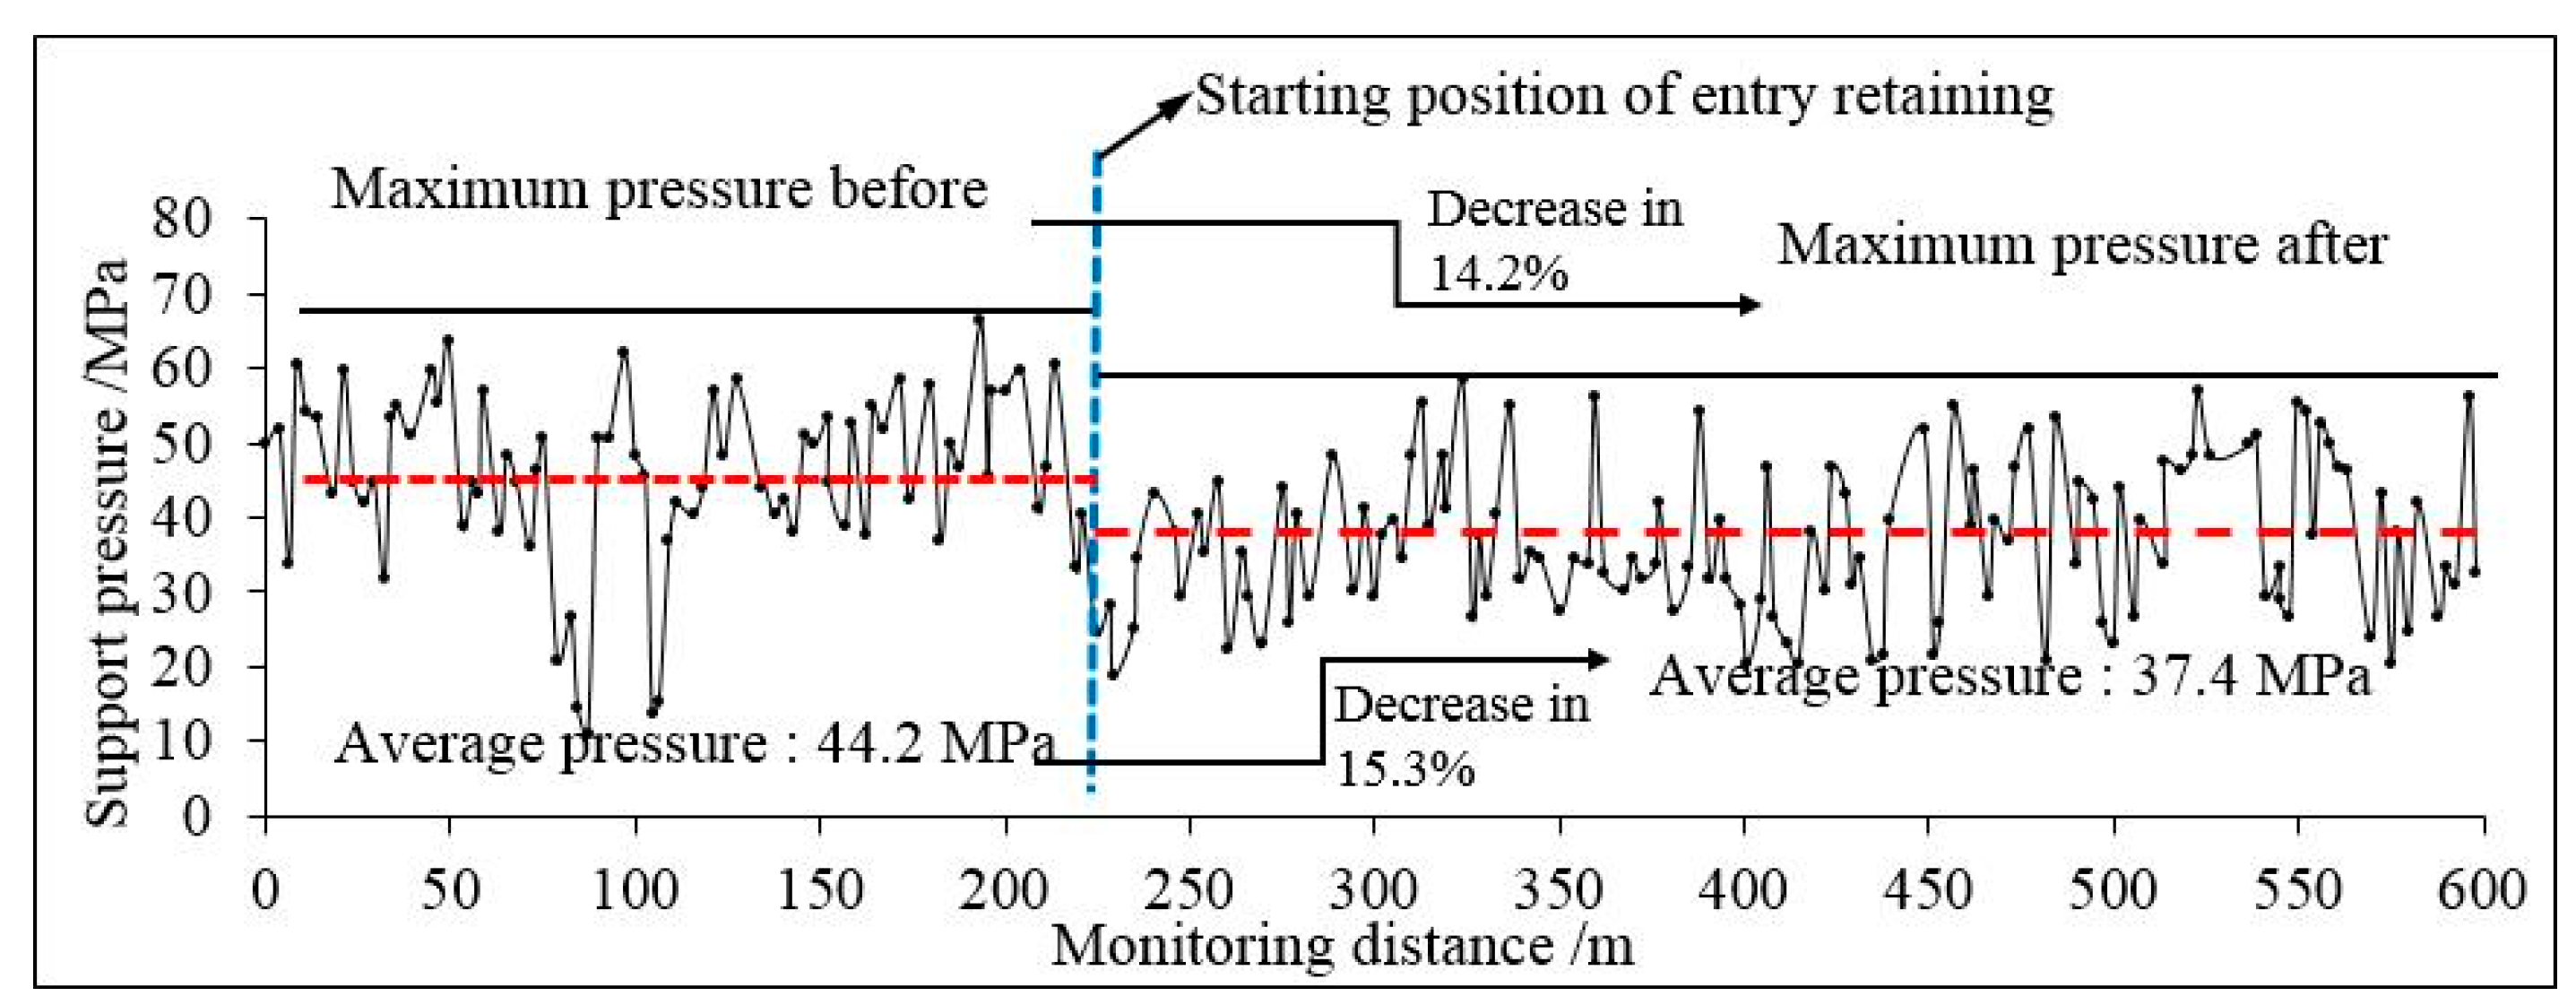
6.2. Mine Pressure Monitoring
7. Conclusions
- A structural model of the roadway surrounding rock was developed. The simplified cantilever beam mechanical model was established, and the deformation equation of the roof was derived to show that the deflection deformation was the largest on the roof cutting side.
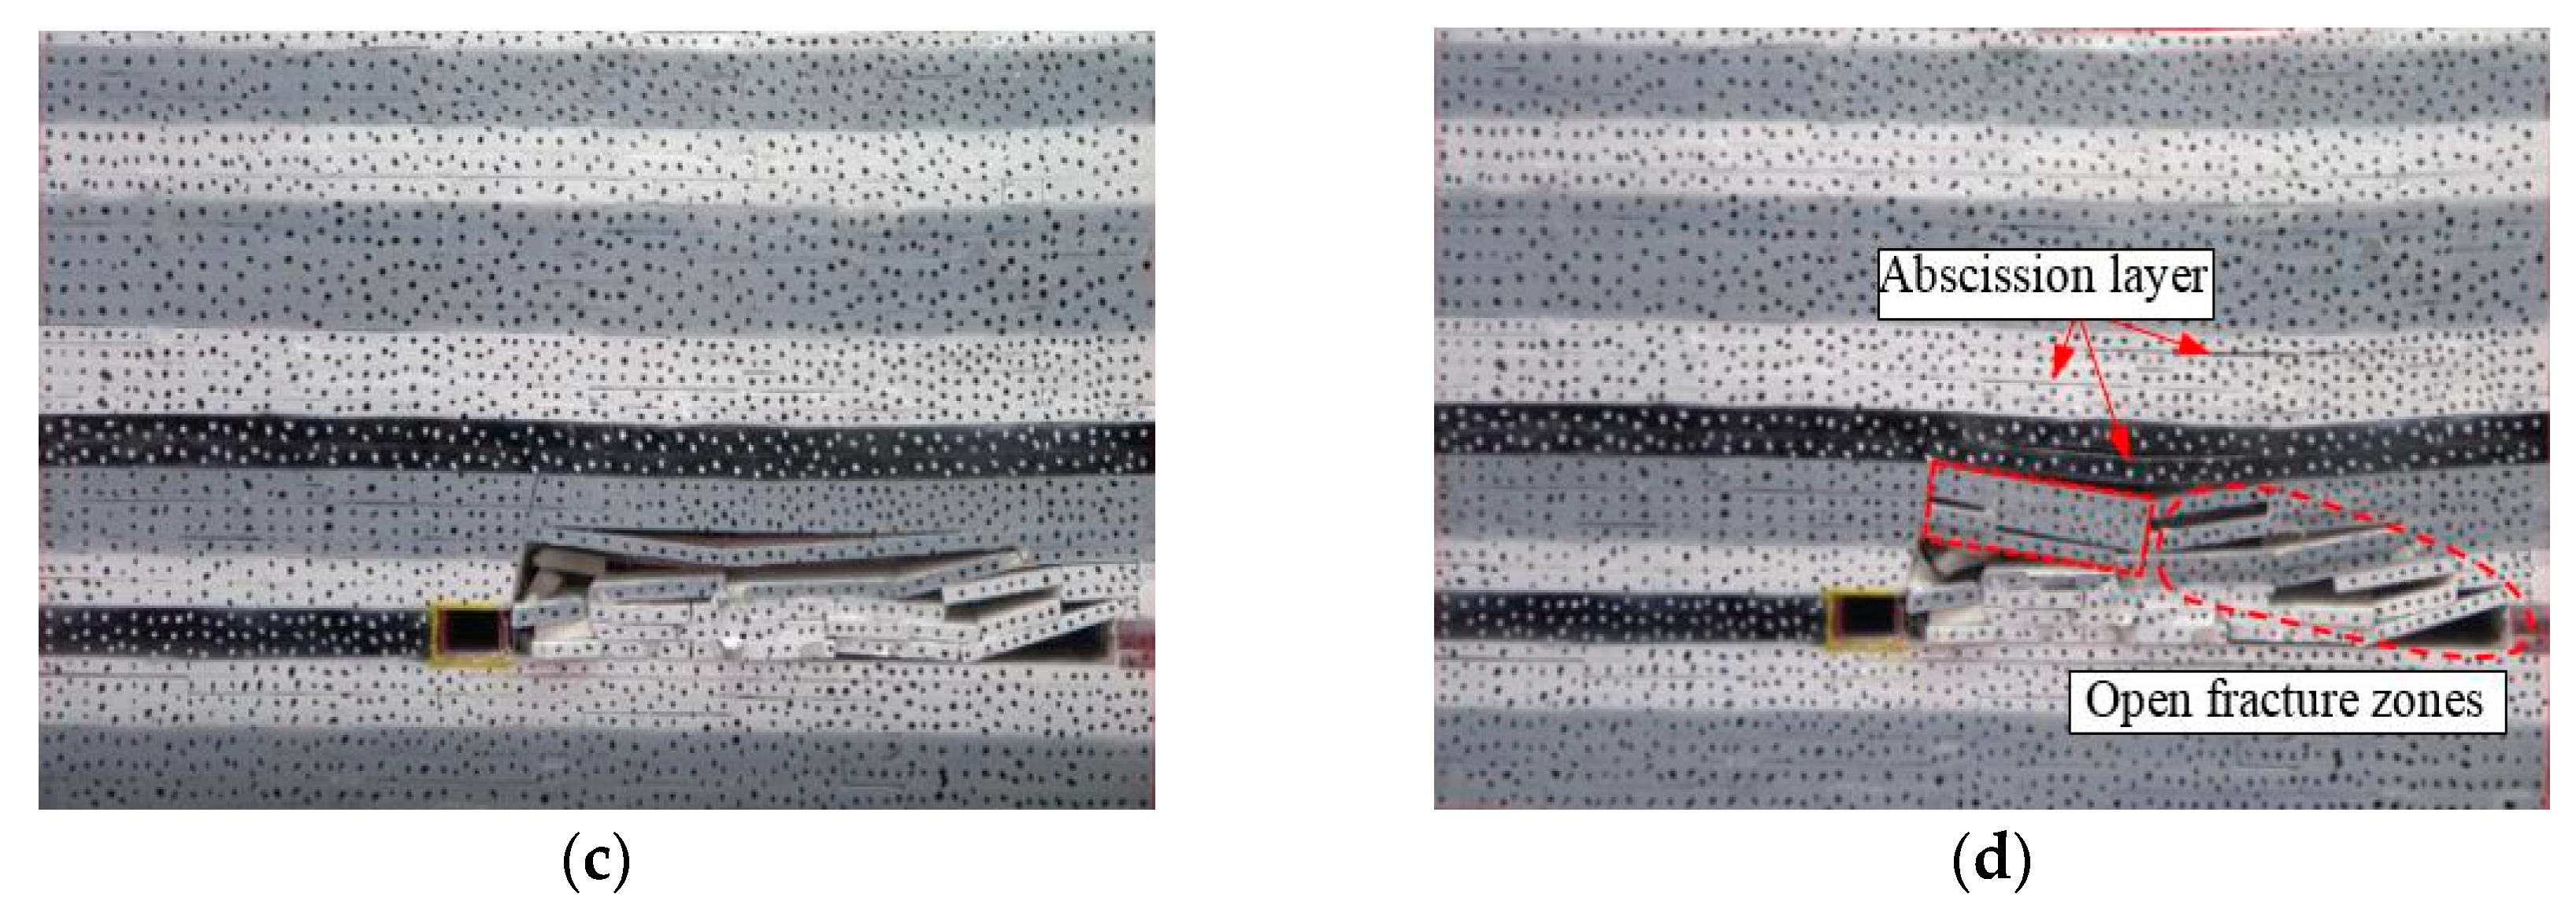
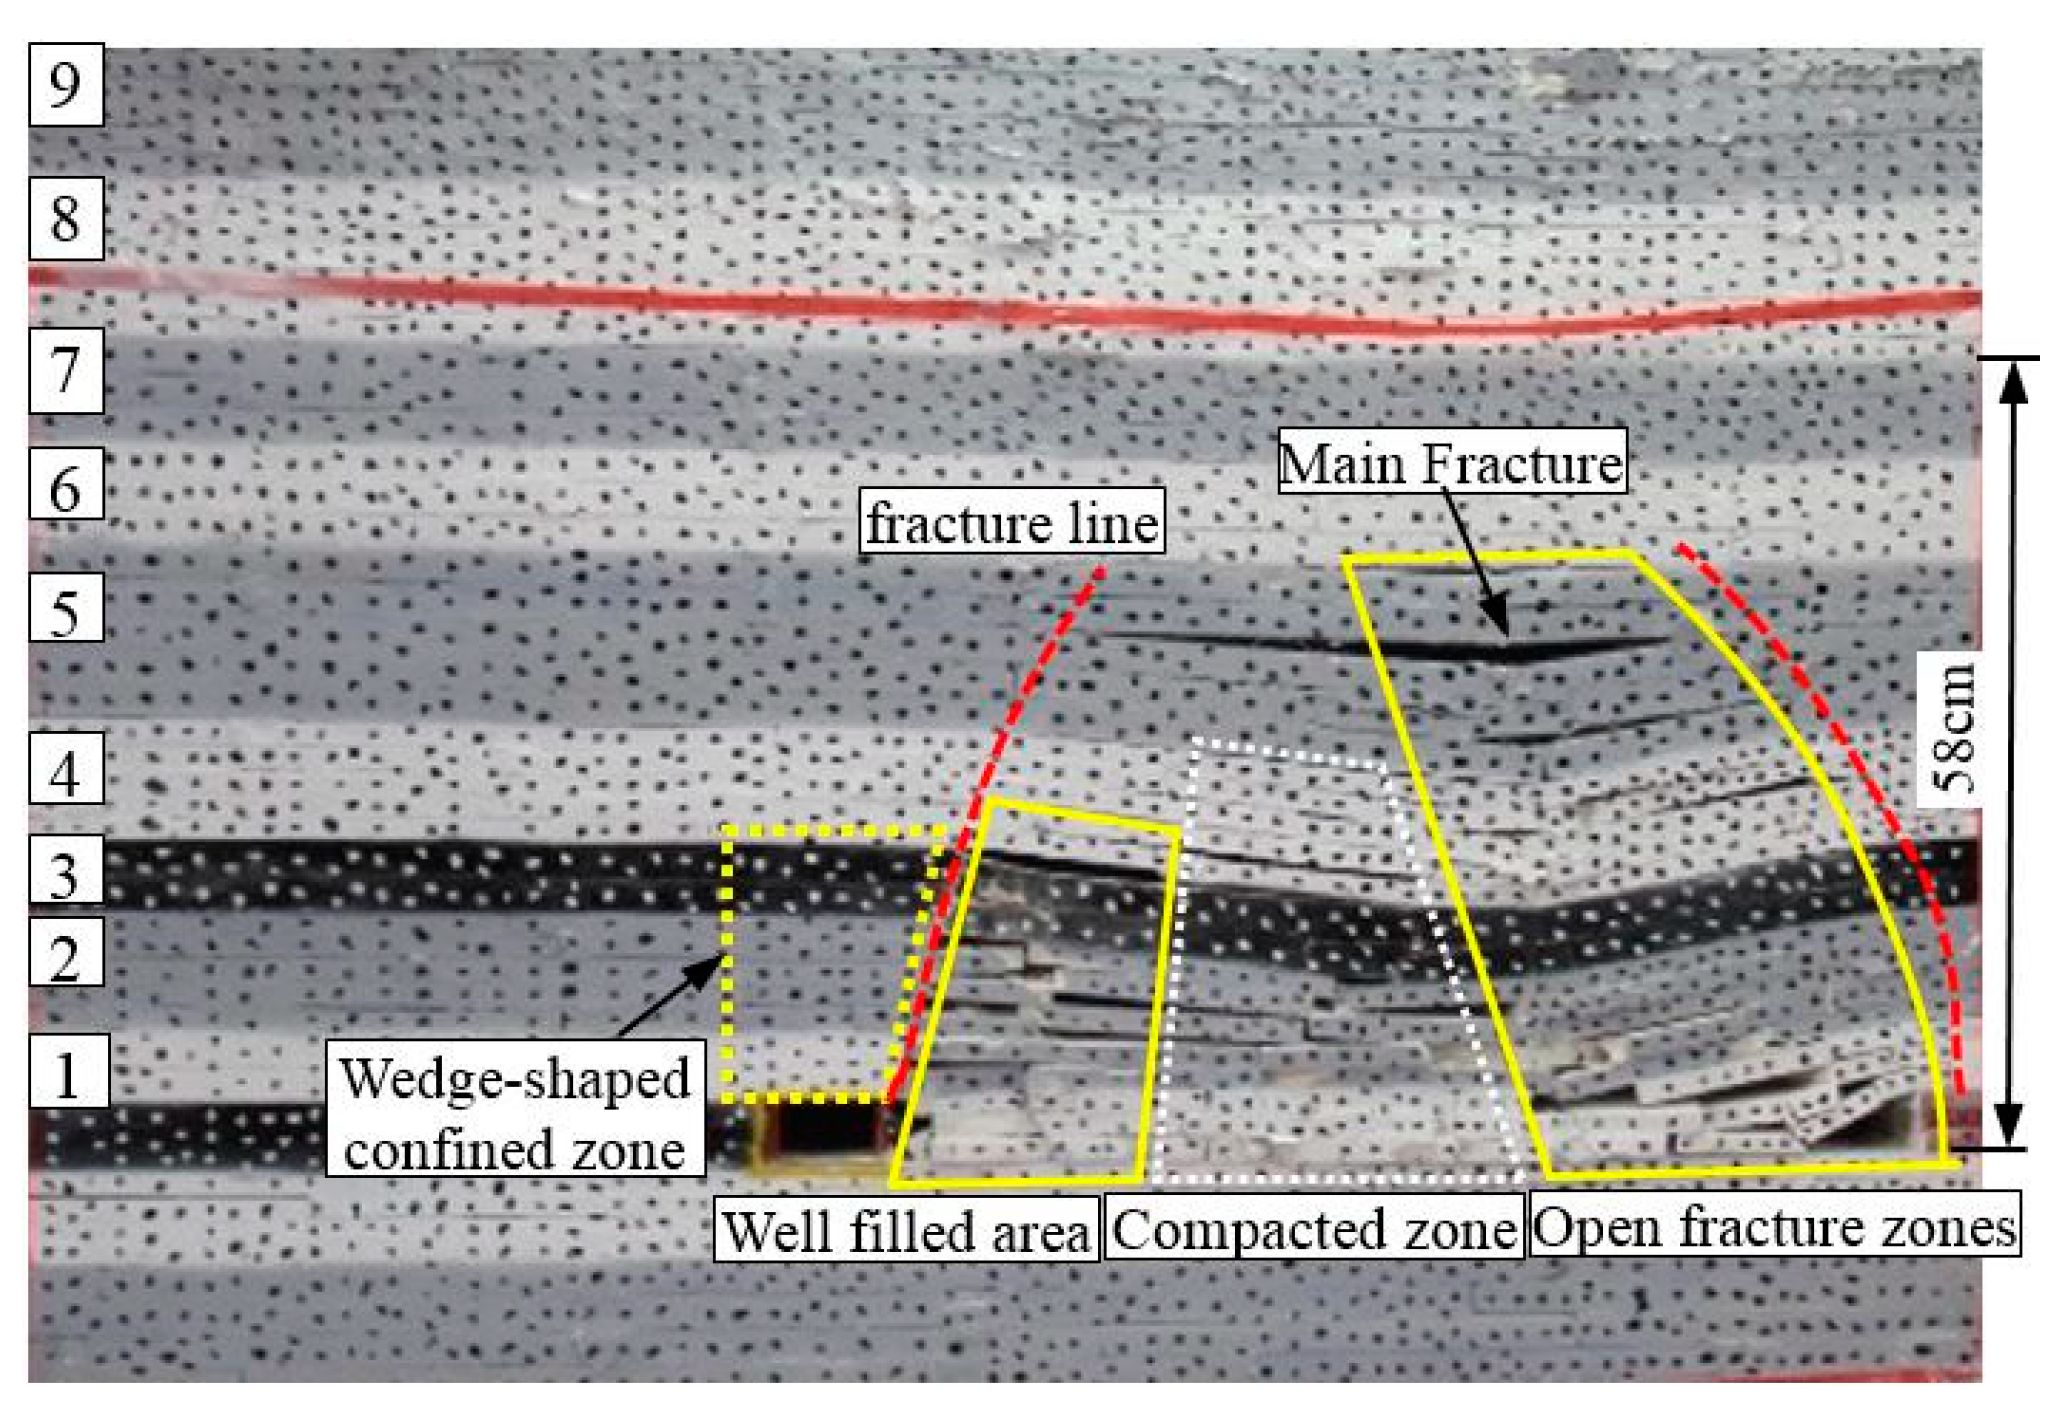
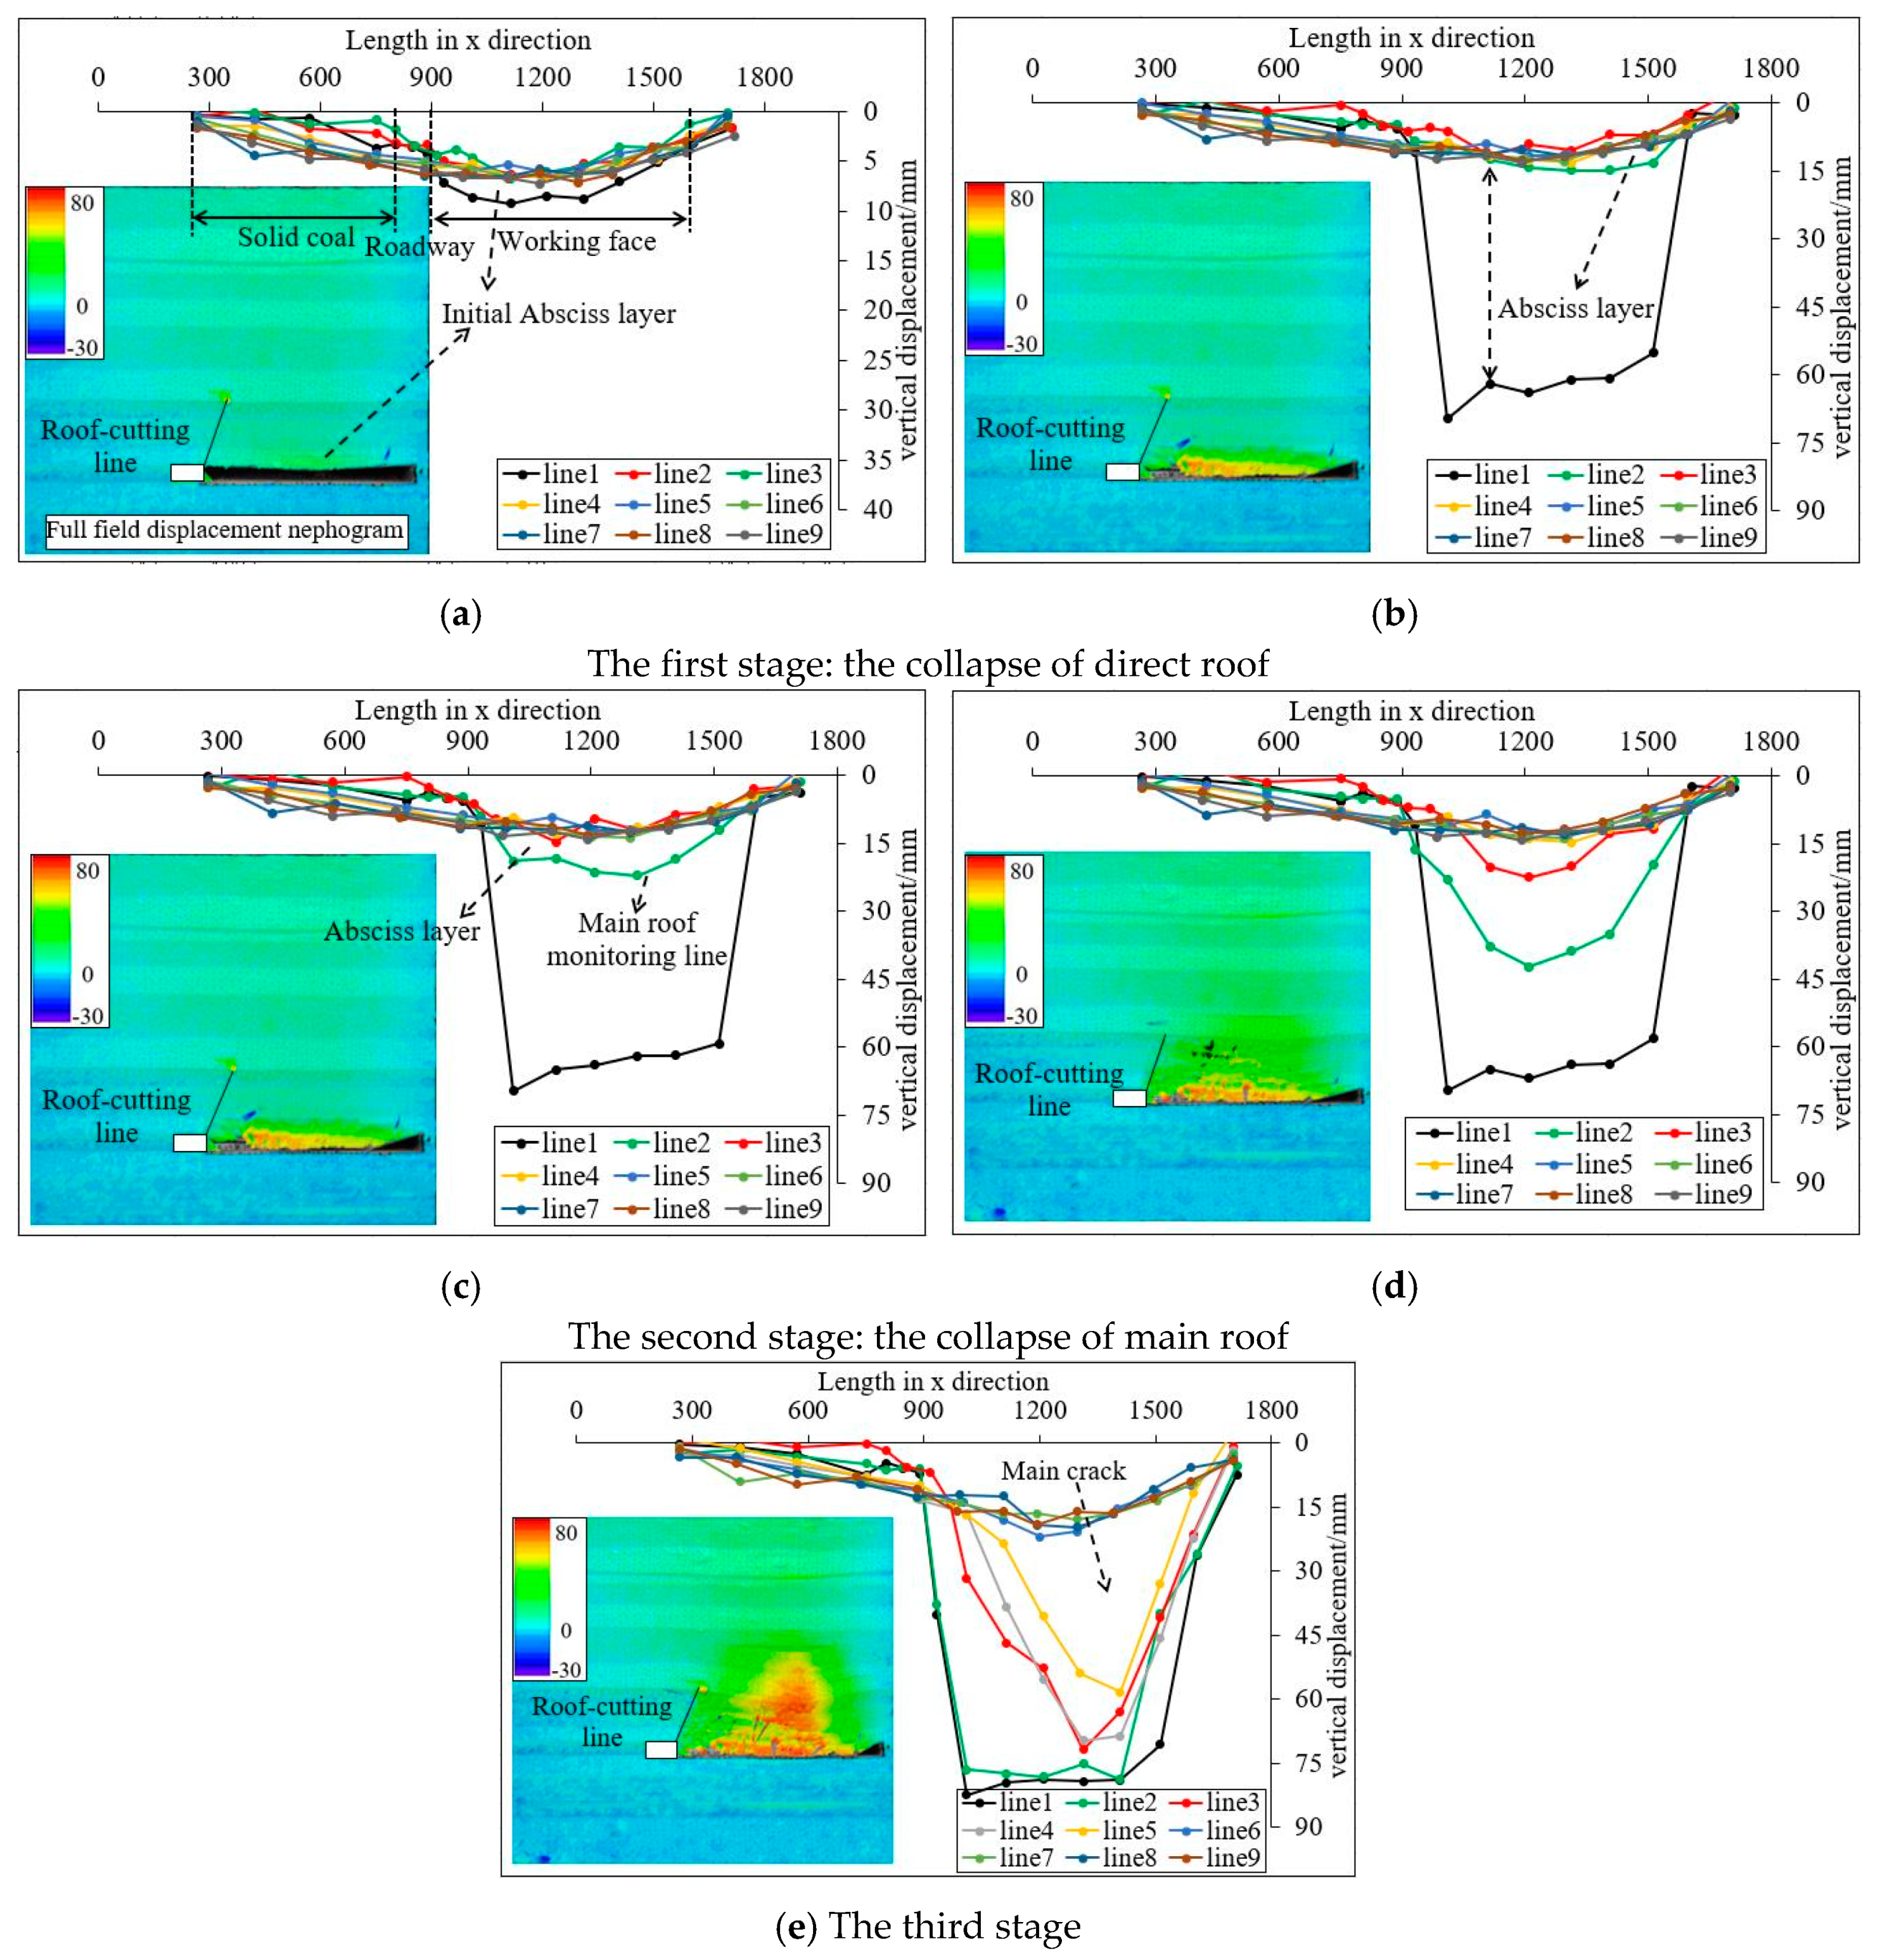
- The model test results showed that in the early stage of the strata movement, the rock mass at the roof cutting side collapsed first, and the displacement was larger than that of the uncut side. In the later stages, the subsidence displacement of the strata within the height range of the roof cutting was asymmetrically distributed. The displacement was smaller further away from the cutting seam. Outside of the roof cutting height, the bending fracture of the rock layer was virtually unaffected. The displacement curve gradually formed a symmetrical distribution as the distance from the working face increased.
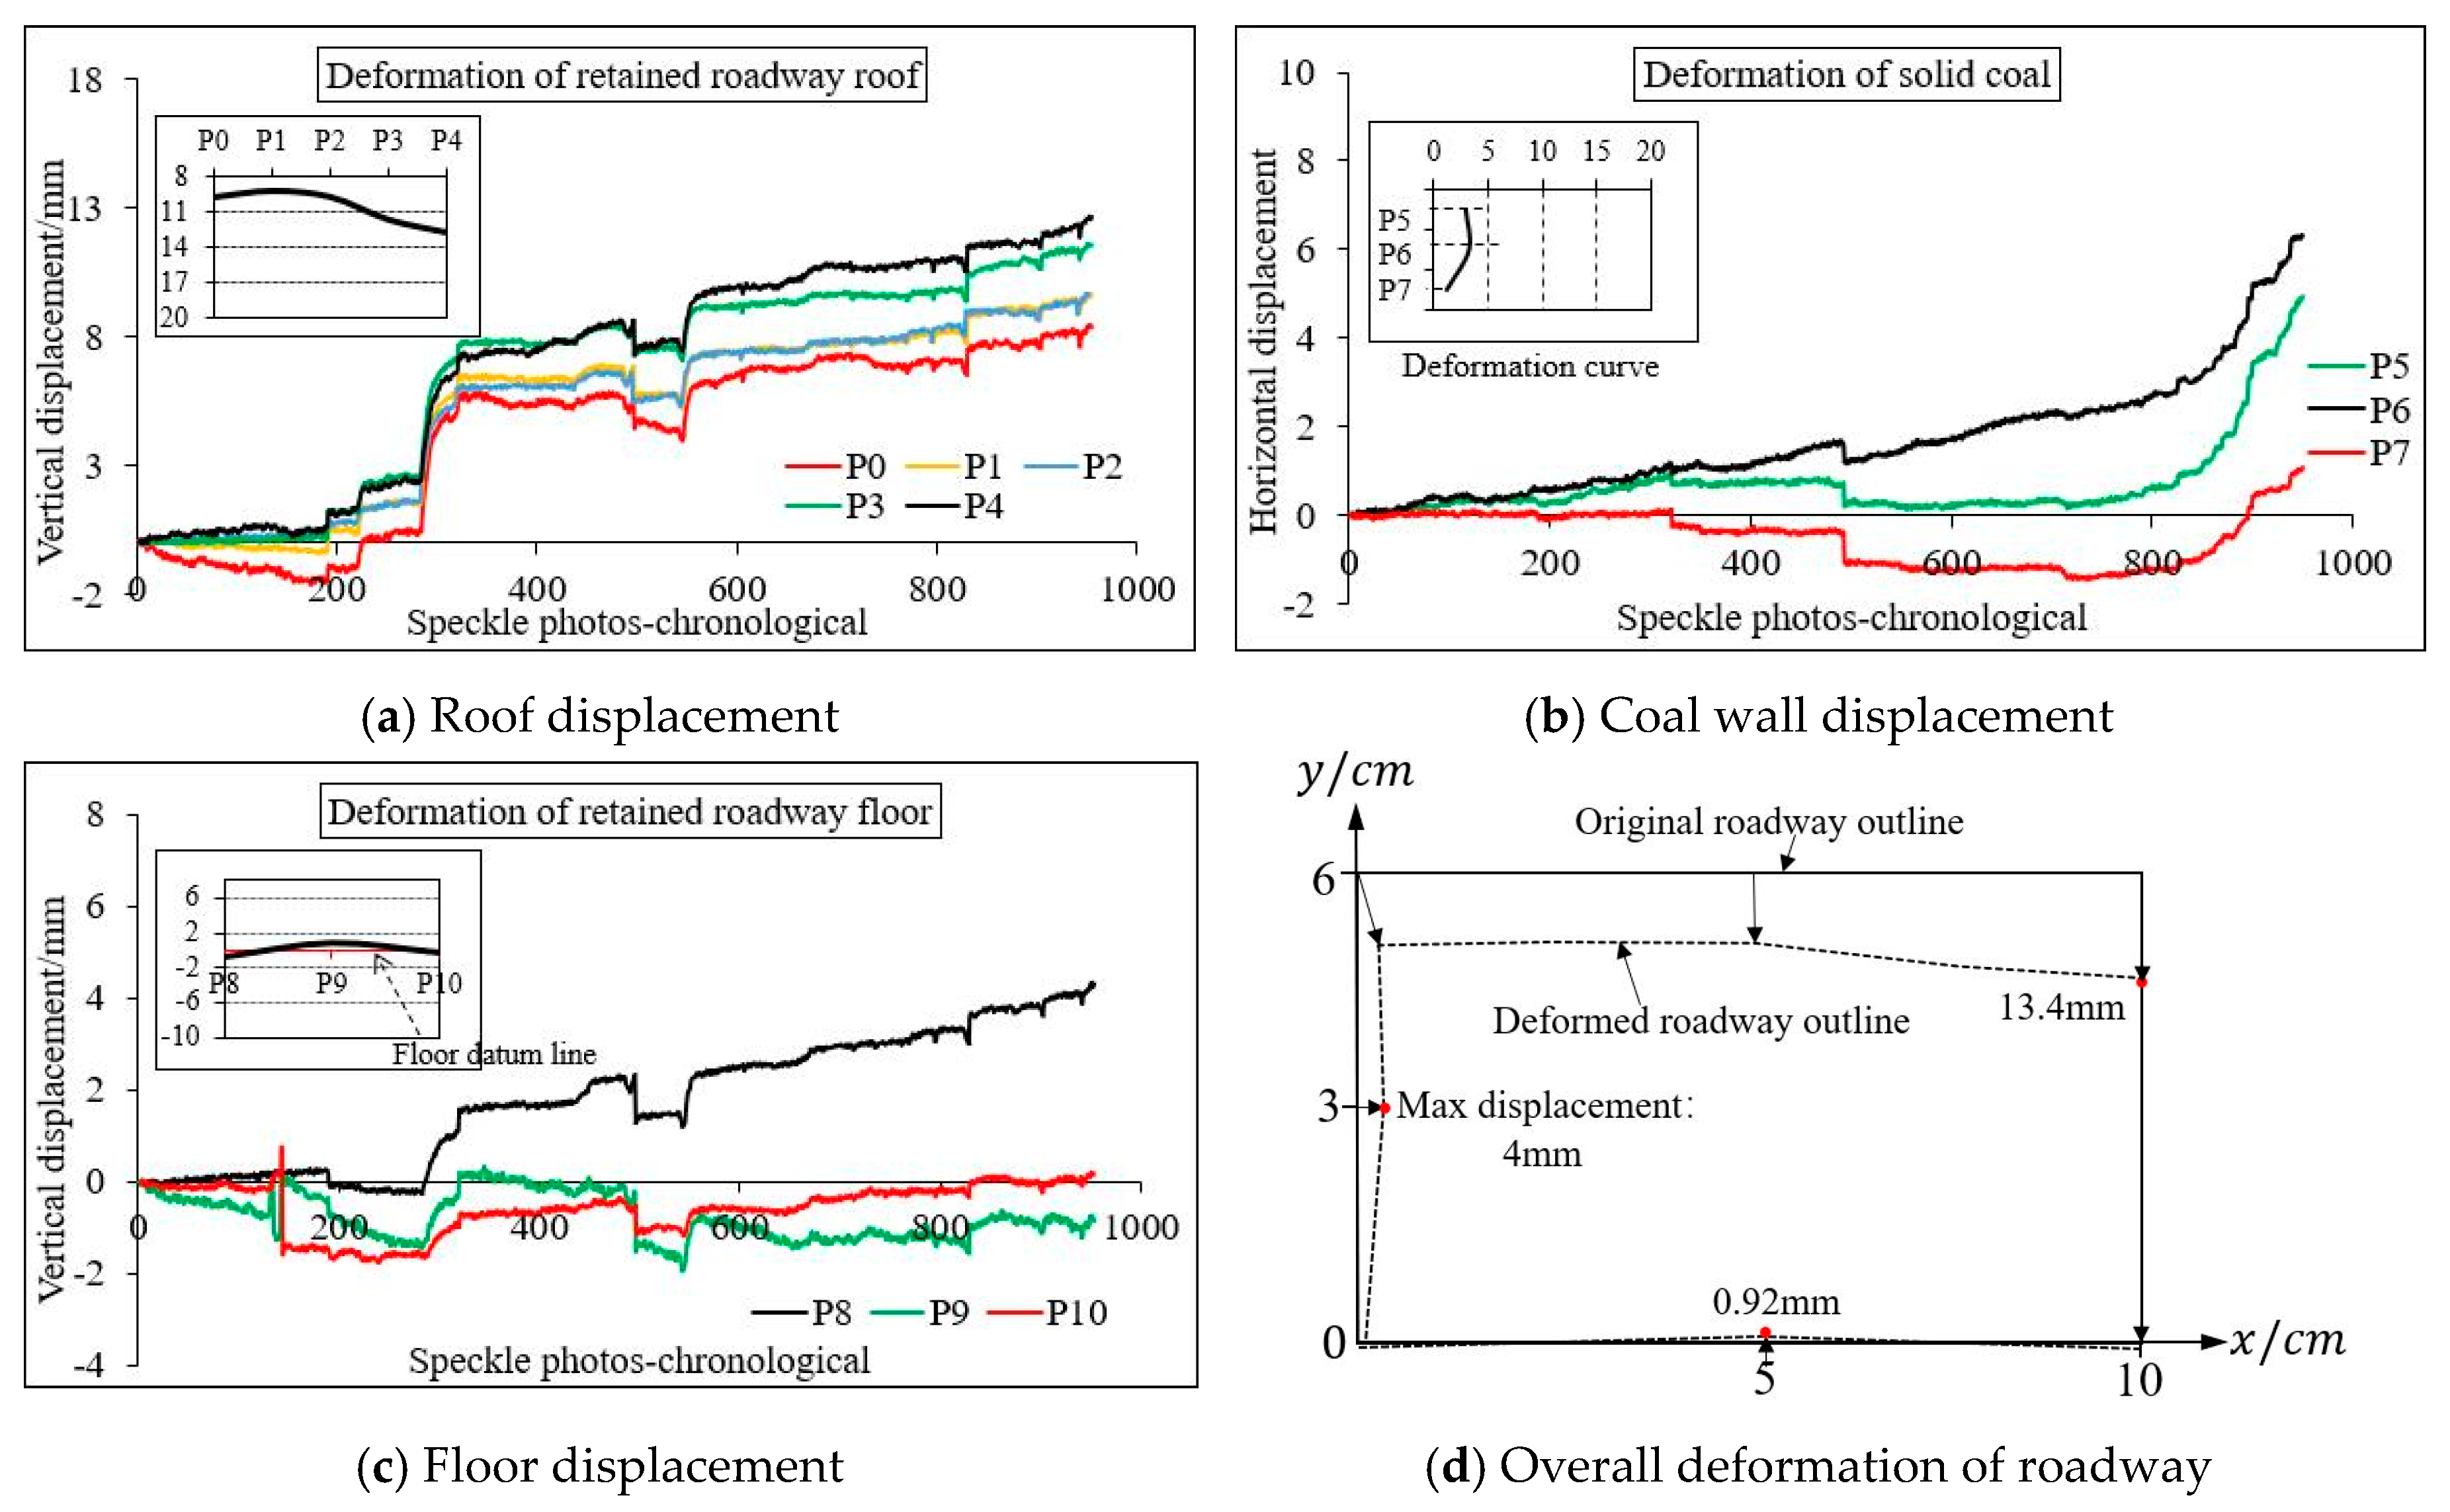
- Based on the FLAC3D simulation, the subsidence law of the overlying strata was consistent, although the simulated value was smaller than the measured value. The reason for this is that the compression deformation of the whole model was considered in the physical test. The result of the displacement monitoring of the retained roadway indicated that the simulated value was larger mainly because the roadway in the model test had supporting measures, but the supporting effect was not considered in the numerical simulation.
- The field monitoring results showed a strong influence of the mining dynamic pressure on the retained roadway roof within 30 m behind the working face with a large displacement deformation rate. Farther from the working face, the displacement deformation rate stabilized. The average stress of the hydraulic support near the retained roadway decreased from 44.3 MPa to 37.5 MPa after the roof cutting (i.e., 15.3% decrease). The pressure was effectively reduced by the roof cutting, thereby forming a stress reduction area. These results will help future mining operations optimize roof cutting designs for a safe and efficient operation and provide analytical models and tools for future supplemental studies.
Author Contributions
Funding
Acknowledgments
Conflicts of Interest
References
- Azadeh, A.; Osanloo, M.; Ataei, M. A new approach to mining method selection based on modifying the Nicholas technique. Appl. Soft Comput. 2010, 10, 1040–1061. [Google Scholar] [CrossRef]
- Ghasemi, E.; Ataei, M.; Shahriar, K. An intelligent approach to predict pillar sizing in designing room and pillar coal mines. Int. J. Rock Mech. Min. Sci. 2014, 65, 86–95. [Google Scholar] [CrossRef]
- He, M.C.; Xie, H.P.; Peng, S.P.; Jiang, Y.D. Study on rock mechanics of deep mining. Chin. J. Rock Mech. Eng. 2005, 16, 2803–2813. [Google Scholar]
- Lollino, P.; Martimucci, V.; Paris, M. Geological survey and numerical modeling of the potential failure mechanisms of underground caves. Geosyst. Eng. 2013, 16, 100–112. [Google Scholar] [CrossRef]
- Bai, J.B.; Zhou, H.Q.; Hou, C.J.; Tu, X.Z.; Yue, D.Z. Development of side support technology for gob side entry retaining. J. China Univ. Min. Technol. 2004, 2004, 59–62. [Google Scholar]
- He, M.C.; Gao, Y.B.; Yang, J.; Gong, W.L. An Innovative Approach for Gob-Side Entry Retaining in Thick Coal Seam Longwall Mining. Energies 2017, 10, 1785. [Google Scholar] [CrossRef] [Green Version]
- Wang, Q.; Jiang, B.; Pan, R.; Li, S.C.; He, M.C.; Sun, H.M.; Qin, Q.; Yu, H.C.; Luan, Y.C. Failure mechanism of surrounding rock with high stress and confined concrete support system. Int. J. Rock Mech. Min. Sci. 2018, 102, 89–100. [Google Scholar] [CrossRef]
- Wang, Q.; He, M.C.; Yang, J.; Gao, H.K.; Jiang, B.; Yu, H.C. Study of a no-pillar mining technique with automatically formed gob-side entry retaining for longwall mining in coal mines. Int. J. Rock Mech. Min. Sci. 2018, 110, 1–8. [Google Scholar] [CrossRef]
- Sun, X.M.; Liu, X.; Liang, G.F.; Wang, D.; Jiang, Y.L. Study on key parameters of thin coal seam roof cutting and pressure relief gob side entry retaining. J. Rock Mech. Eng. 2014, 33, 1449–1456. [Google Scholar]
- Wang, P.; Jiang, L.S.; Li, X.Y.; Qin, G.P.; Wang, E.Y. Physical Simulation of Mining Effect Caused by A Fault Tectonic. Arab. J. Geosci. 2018, 11, 741. [Google Scholar] [CrossRef]
- Gao, Y.B.; Wang, Y.J.; Yang, J.; Zhang, X.Y.; He, M.C. Meso- and macroeffects of roof split blasting on the stability of gateroad surroundings in an innovative nonpillar mining method. Tunn. Undergr. Space Technol. 2019, 90, 99–118. [Google Scholar] [CrossRef]
- Wang, Y.J.; Gao, Y.B.; Wang, E.Y.; He, M.C.; Yang, J. Roof deformation characteristics and preventive techniques using a novel non-pillar mining method of gob-side entry retaining by roof cutting. Energies 2018, 11, 627. [Google Scholar] [CrossRef]
- Guo, Z.B.; Wang, Q.; Wang, H.H.; Ma, Z.M.; Yin, S.Y.; Hu, H.L. Analysis of the swelling characteristics and lateral pressure of the mudstone in the rubble side of the cut top Lane. J. China Univ. Min. Technol. 2018, 47, 987–994. [Google Scholar]
- Jiang, L.S.; Wang, P.; Zheng, P.Q.; Luan, H.J.; Zhang, C. Influence of Different Advancing Directions on Mining Effect Caused by a Fault. Adv. Civ. Eng. 2019, 2019, 1–16. [Google Scholar] [CrossRef] [Green Version]
- Kang, H.P.; Niu, D.L.; Zhang, Z.; Lin, J.; Li, Z.H.; Fan, M.J. Deformation characteristics and support technology of surrounding rock in deep gob side entry retaining. Chin. J. Rock Mech. Eng. 2010, 29, 1977–1987. [Google Scholar]
- Lee, Y.J.; Bassett, R.H. Application of a photogrammetric technique to a model tunnel. Tunn. Undergr. Space Technol. 2006, 21, 79–95. [Google Scholar] [CrossRef]
- Pan, B.; Qian, K.M.; Xie, H.M.; Asundi, A. Two-dimensional digital image correlation for in-plane displacement and strain measurement: A review. Meas. Sci. Technol. 2020, 20, 062001. [Google Scholar] [CrossRef]
- Abanto-Bueno, J.; Lambros, J. Investigation of crack growth in functionally graded materials using digital image correlation. Eng. Fract. Mech. 2002, 69, 1695–1711. [Google Scholar] [CrossRef]
- Zhu, W.S.; Zhang, Q.B.; Zhu, H.H.; Li, Y.; Yin, J.H.; Li, S.C.; Sun, L.F.; Zhang, L. Large-scale geomechanical model testing of an underground cavern group in a true three-dimensional (3-D) stress state. Can. Geotech. J. 2010, 47, 935–946. [Google Scholar] [CrossRef]
- Wang, P.; Jiang, L.S.; Zheng, P.Q.; Qin, G.P.; Zhang, C. Inducing-modes analysis of rock burst in fault-affected zone with a hard thick stratum occurrence. Environ. Earth Sci. 2019, 78, 467. [Google Scholar] [CrossRef]
- Zhang, N.; Han, C.L.; Yi, J.G.; Zheng, X.G. Theory and practice of surrounding rock control in gob side entry retaining. J. Chin. Coal Soc. 2014, 39, 1635–1641. [Google Scholar]
- Yamamoto, K.; Kusuda, K. Failure mechanisms and bearing capacities of reinforced foundations. Geotext. Geomembr. 2001, 19, 127–162. [Google Scholar] [CrossRef]
- Sterpi, D.; Cividini, A. A physical and numerical investigation on the stability of shallow tunnels in strain softening media. Rock Mech. Rock Eng. 2004, 37, 277–298. [Google Scholar] [CrossRef]
- Seki, S.; Kaise, S.; Morisaki, Y.; Azetaka, S.; Jiang, Y. Model experiments for examining heaving phenomenon in tunnels. Tunn. Undergr. Space Technol. 2008, 23, 128–138. [Google Scholar] [CrossRef]
- Ghabraie, B.; Ren, G.; Smith, J.; Holden, L. Application of 3D laser scanner, optical transducers and digital image processing techniques in physical modelling of mining-related strata movement. Int. J. Rock Mech. Min. Sci. 2015, 80, 219–230. [Google Scholar] [CrossRef]
- Li, Z.K.; Liu, H.; Dai, R.; Su, X. Application of numerical analysis principles and key technology for high fidelity simulation to 3-D physical model tests for underground caverns. Tunn. Undergr. Space Technol. 2005, 20, 390–399. [Google Scholar] [CrossRef]
- Indraratna, B.; Nemcik, J.A.; Gale, W.J. Review and interpretation of primary floor failure mechanism at a longwall coal mining face based on numerical analysis. Geotechnique 2000, 50, 547–557. [Google Scholar] [CrossRef]


| Geometric similarity ratio | |
| Volume-weight ratio | |
| Stress similarity ratio | |
| Deformation modulus similarity ratio | |
| Similar ratio of strain, friction angle, friction coefficient, Poisson’s ratio |
| No. | Lithology | UCS (MPa) | Tensile Strength (MPa) | Elastic Modulus (GPa) | Cohesion (MPa) | Internal Friction angle (°) | Unit Weight (kN/m3) | |
|---|---|---|---|---|---|---|---|---|
| 1 | Limestone | Prototype | 85 | 5.21 | 3.73 | 11 | 41 | 2730 |
| Model | 1.7 | 0.104 | 0.075 | 0.22 | 41 | 2730 | ||
| 2 | Sandy mudstone | Prototype | 16 | 0.6 | 1.2 | 1.5 | 36 | 2630 |
| Model | 0.32 | 0.012 | 0.024 | 0.03 | 36 | 2630 | ||
| 3 | Fine stone | Prototype | 32 | 1.19 | 1.1 | 2.2 | 35 | 2500 |
| Model | 0.64 | 0.024 | 0.022 | 0.044 | 35 | 2500 | ||
| 4 | Coal | Prototype | 14.5 | 0.35 | 1.5 | 0.86 | 20 | 1400 |
| Model | 0.29 | 0.007 | 0.03 | 0.0172 | 20 | 1400 | ||
| 5 | Medium sandstone | Prototype | 63 | 4.13 | 2.2 | 6.3 | 40 | 2600 |
| Model | 1.26 | 0.083 | 0.044 | 0.126 | 40 | 2600 |
© 2020 by the authors. Licensee MDPI, Basel, Switzerland. This article is an open access article distributed under the terms and conditions of the Creative Commons Attribution (CC BY) license (http://creativecommons.org/licenses/by/4.0/).
Share and Cite
Zhu, D.; Wang, J.; Gong, W.; Sun, Z. Model Test and Numerical Study on Surrounding Rock Deformation and Overburden Strata Movement Law of Gob-Side Entry Retaining via Roof Cutting. Minerals 2020, 10, 458. https://doi.org/10.3390/min10050458
Zhu D, Wang J, Gong W, Sun Z. Model Test and Numerical Study on Surrounding Rock Deformation and Overburden Strata Movement Law of Gob-Side Entry Retaining via Roof Cutting. Minerals. 2020; 10(5):458. https://doi.org/10.3390/min10050458
Chicago/Turabian StyleZhu, Daoyong, Jiong Wang, Weili Gong, and Zheng Sun. 2020. "Model Test and Numerical Study on Surrounding Rock Deformation and Overburden Strata Movement Law of Gob-Side Entry Retaining via Roof Cutting" Minerals 10, no. 5: 458. https://doi.org/10.3390/min10050458