Article

Liberation of Gold Using Microwave-Nitric Acid Leaching and Separation-Recovery of Native Gold by Hydro-Separation

1
Research Institute of Agriculture and Life Sciences, Seoul National University, Seoul 08826, Korea
2
Department of Energy and Resource Engineering, Chosun University, Gwangju 61452, Korea
*
Author to whom correspondence should be addressed.
Minerals 2020, 10(4), 327; https://doi.org/10.3390/min10040327
Submission received: 26 February 2020 / Revised: 3 April 2020 / Accepted: 3 April 2020 / Published: 6 April 2020
(This article belongs to the Special Issue Hydrometallurgical Processing of Base Metal Sulphides)

Abstract

:
The purpose of this study was to liberate gold from sulfide minerals in a gold concentrate through microwave-nitric acid leaching and to separate the light minerals in an insoluble residue using a hydro-separation process. The representative sulfide minerals in the gold concentrate were pyrite with minor galena. Mineralogical characterization was conducted on the gold concentrate using 1715.20 g/t based on lead-fire assays. During the leaching experiment, the effect of nitric acid concentration was studied. The results indicated that the metal leaching rate of the gold concentrate increased with increasing nitric acid concentration. After the microwave-nitric acid leaching, the resulting main feature was consistent with the increased exposure to reactive sulfide minerals and decrease in weight. Characterization techniques such as X-ray diffraction (XRD), scanning electron microscope energy dispersive spectroscopy (SEM-EDS) and scanning electron microscope backscattered electron imaging (SEM-BSE) were performed to characterize the minerals in the insoluble residue using microwave-nitric acid leaching and the hydro-separation process. The XRD patterns of the insoluble residues were compared. The intensities of the pyrite peak decreased and disappeared under different nitric acid concentrations, whereas intensities of the quartz peak increased. The hydro-separation process focused on the separation of heavy (e.g., native gold) and light (e.g., quartz) minerals from the insoluble residues. After the hydro-separation treatment process, the heavy minerals exhibited typical diffraction lines of gold, as obtained using the XRD analysis.

1. Introduction

Gold is mainly produced from pyrite and arsenopyrite [1]. The gold produced from sulfide minerals is divided into visible and invisible gold [2]. Whereas visible gold can be observed using an optical microscope or a scanning electron microscope (SEM), invisible gold is very difficult to observe using these techniques. The fact that gold is present as microparticles makes it difficult to observe using an optical microscope (detection limit = 1 µm or less) or SEM (detection limit = 0.1 µm) [3]. Therefore, gold that is produced in these states cannot be observed with the resolutions of these microscopes [4].
However, when gold is produced in a microparticle size, its presence can be confirmed through qualitative or quantitative analysis based on energy dispersive spectroscopy (EDS) or electron microprobe analysis (EPMA) after selecting the bright gold microparticles using backscattered electron (BSE) imaging. In the SEM-BSE images, minerals with low average atomic numbers, such as quartz, fluorspar, and muscovite, appear in dark or gray color, whereas native gold, electrum (Au–Ag alloy), and platinum group elements (PGEs) with high average atomic numbers appear in bright or a white color [5]. In addition, when invisible gold is chemically bound to sulfide minerals as a solid solution, its presence can be easily and quantitatively confirmed through EPMA or secondary ion mass spectrometry analysis [6].
Gold is recovered by applying cyanide or non-cyanide solvent to the gold-bearing concentrate and dissolving the gold. However, this method cannot effectively dissolve gold because invisible gold is trapped by sulfide minerals as microparticles or forms a solid solution. In addition, these solvents can dissolve not only the gold but also the sulfide minerals. Therefore, the consumption of cyanide or non-cyanide solvent increases, resulting in an increase in the gold-production cost.
However, when a gold-bearing concentrate is subjected to microwave-nitric acid leaching, only the sulfide minerals are selectively and completely dissolved within a few minutes (approximately 12 min), and gold is not dissolved. In other words, when the sulfide minerals are completely dissolved and removed, the invisible gold trapped inside such minerals is naturally separated [7]. The invisible gold liberated from the sulfide minerals is left in insoluble residues while maintaining its own morphology and size. Of course, in this instance, silica minerals such as quartz and muscovite are also included in the insoluble residues without being dissolved by the nitric acid. Therefore, the liberated gold particles are still mixed with silica minerals in the insoluble residues. Kim et al. (2019) separated and recovered gold from insoluble residues using a lead-fire assay [8]. Their study, however, could not identify the morphology of the gold particles mixed in the insoluble residues. However, when insoluble residues containing gold particles were observed through SEM-BSE images, gold particles in bright or white color could be easily distinguished. Hydro separation can readily separate the gold particles (which are heavy minerals) from silica minerals (which are light minerals). In other words, discharging light minerals such as quartz and retaining heavy minerals such as gold particles in a glass tube are possible by adjusting the speed of water injected into the glass tube [9]. Therefore, through observation of the heavy minerals separated by hydro separation using X-ray diffraction (XRD) analysis and SEM-BSE images, the separation efficiency of invisible gold and the morphology of the invisible gold trapped in sulfide minerals can be identified. In addition, because hydro separation can separate heavy from light minerals using water in an ecofriendly manner, it can be effectively used to separate platinum group minerals and weathered gold ores in the oxidation zone.
Therefore, the purpose of the current study was to identify whether gold in gold-bearing ore minerals exists as microparticles or as a solid solution by conducting optical microscopy, SEM-EDS, and SEM-BSE analyses. The objective of this study was to investigate the effect of microwave-nitric acid leaching in gold concentrate and the possible separation of light minerals from insoluble residue using the hydro-separation process. This study contributes to the alternative treatment of a complex or refractory gold concentrate, which improves the process performance of fine and invisible-gold recovery. We focus on the development of a simple microwave-nitric acid leaching process.

2. Materials and Methods

2.1. Gold Concentrates

The gold-concentrate sample used in this study was obtained from Jinsan Gold Mine (Geumsan, Korea) and was separated from black shale debris by gravity using a shaking table. The chemical analysis revealed that the contents were 11.9% Fe, 0.80% Cu, 0.28% Pb, 0.20% Zn, and 1715.20 g/t (Table 1). The gold particles obtained using the lead-fire assay are shown using a stereoscopic microscope in Figure 1. XRD analysis was conducted on the concentrate samples, which mainly consisted of adularia, calcite, fluorspar, muscovite, pyrite, and quartz (Figure 2).

2.2. Microwave-Nitric Acid Leaching Experiment

Gold and PGEs are elements with a severe nugget effect. Therefore, very large analysis errors occur owing to the nugget effect in the sampling process. To minimize the nugget effect, the entire sample (5 kg) was sufficiently mixed [10], and 100.0 g samples were prepared using the cone and quartering method [11].
Microwave-nitric acid leaching was performed in a 5-L Erlenmeyer flask containing 1 L of nitric acid (1.0 to 6.0 M) and 100.0 g of gold concentrate. The processing times were set to 15 min in all tests. The Erlenmeyer flask was placed in an industrial microwave system (2.45 GHz, 3 kW) [12]. The generated fume gas was discharged to four gas-cleaning vessels, an activated carbon-adsorption device, and discharge ducts via the reflux condenser and gas outlet. After the leaching experiment, the contents were cooled to ambient temperature. The leaching solution was filtered using a filter paper (No. 53). The weight of the leach residue was measured after leaching. The insoluble residues were analyzed using atomic-absorption spectrophotometry (AAS) and fire assay.

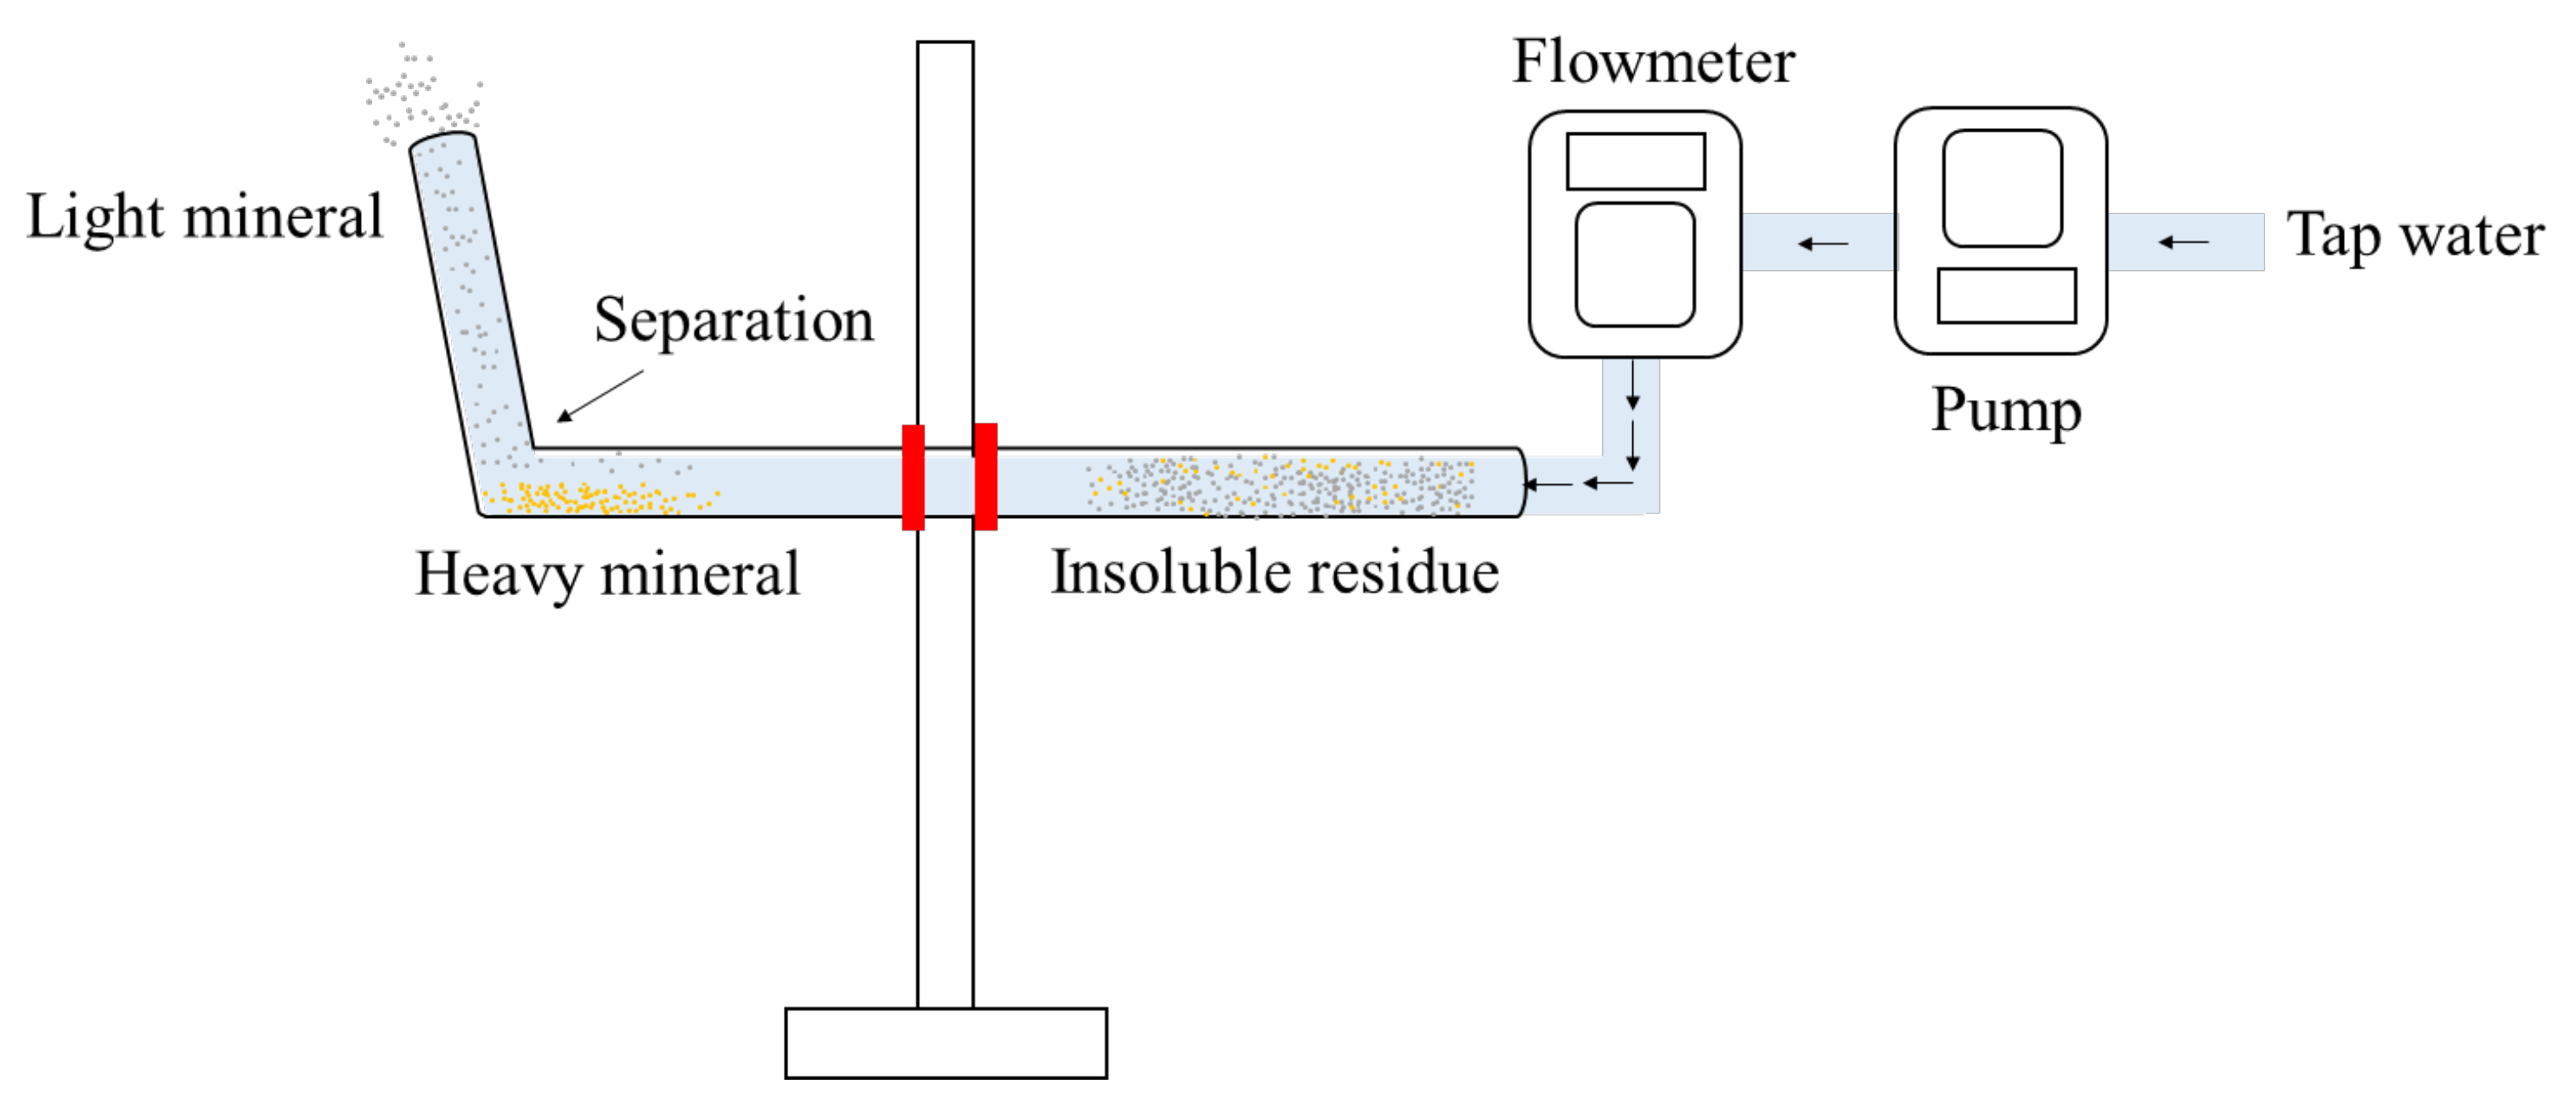
2.3. Hydro-Separation

The light and heavy minerals included in the insoluble residue were separated using hydro separation. Hydro separation is a process (Figure 3) in which the light and heavy minerals included in an insoluble residue are separated according to their Stokes’ behavior in a pulsating water flow [13]. Tap water at a flow rate of 410–420 mL/min was injected into the glass tube and discharged. In this instance, light minerals such as quartz were discharged, whereas heavy minerals such as native gold were left at the bottom of the horizontal glass tube. After collecting the heavy minerals, XRD, SEM-BSE and SEM-EDS analyses were conducted.

2.4. Analysis Method

After the leaching experiment, the residue was analyzed using AAS (AA-7000, Shimadzu, Japan) to determine the amount of metal leached. Furthermore, the gold content in the residues was analyzed using a lead-fire assay [14]. The concentrate, insoluble residue, and heavy minerals were subjected to XRD (X’Pert Pro MRD, PANalytical, Amsterdam, The Netherlands) analysis. Cu–Kα X-ray was used at an acceleration voltage of 40 kV, a current of 30 mA. The 2θ section from 10° to 70° was analyzed for the insoluble residues, whereas for the heavy minerals the 2θ section analyzed was used 20° to 95°. Field emission scanning electron microscopy (S4800, Hitachi, Tokyo, Japan) and BSE diffraction (C960593, Hitachi, Tokyo, Japan) images were obtained under 15 kV voltage and 10 nA current conditions. The SEM and BSE images of the same samples were simultaneously obtained. In addition, EDS (energy dispersive analyzer, ISIS310, Jeol, Tokyo, Japan) quantitative analysis was conducted under the conditions of an acceleration voltage of 15 kV, a current of 10 nA, and an electron beam diameter of 0.1 µm. In the SEM-BSE images, EDS point or area analysis was conducted for mineral surfaces that appeared to be bright or white.

3. Results

3.1. Ore Sample

The observation of the ore minerals by polarization microscopy revealed that the main sulfide minerals consisted of small quantities of pyrite and chalcopyrite. Microscopic observations were performed on polished samples, but native gold or electrum was not found (Figure 4a). The pyrite crystals were angular and irregularly shaped with varying size distribution. Textures such as pores and cracks were found. SEM-EDS analysis was conducted on the macrocrystalline (maximum length = 1105 µm) pyrite crystals, but Au was not detected on the surfaces of both idioblastic and anhedral crystals (Figure 4b, Table 2). However, we found that Ag minerals (Figure 4c, Table 2) and ultrafine Pb minerals (Figure 4d, Table 2) were trapped inside these pyrite crystals through the SEM-BSE and SEM-EDS analyses. The major components of the pyrite were Fe, Pb, and S; small amounts of Si were detected in the elemental using SEM-EDS analysis (Table 2). When the SEM-EDS analysis was conducted on the ultrafine (maximum length = 106 µm) pyrite crystals (Figure 5, Table 3), Au was detected from the surface of the anhedral particles.

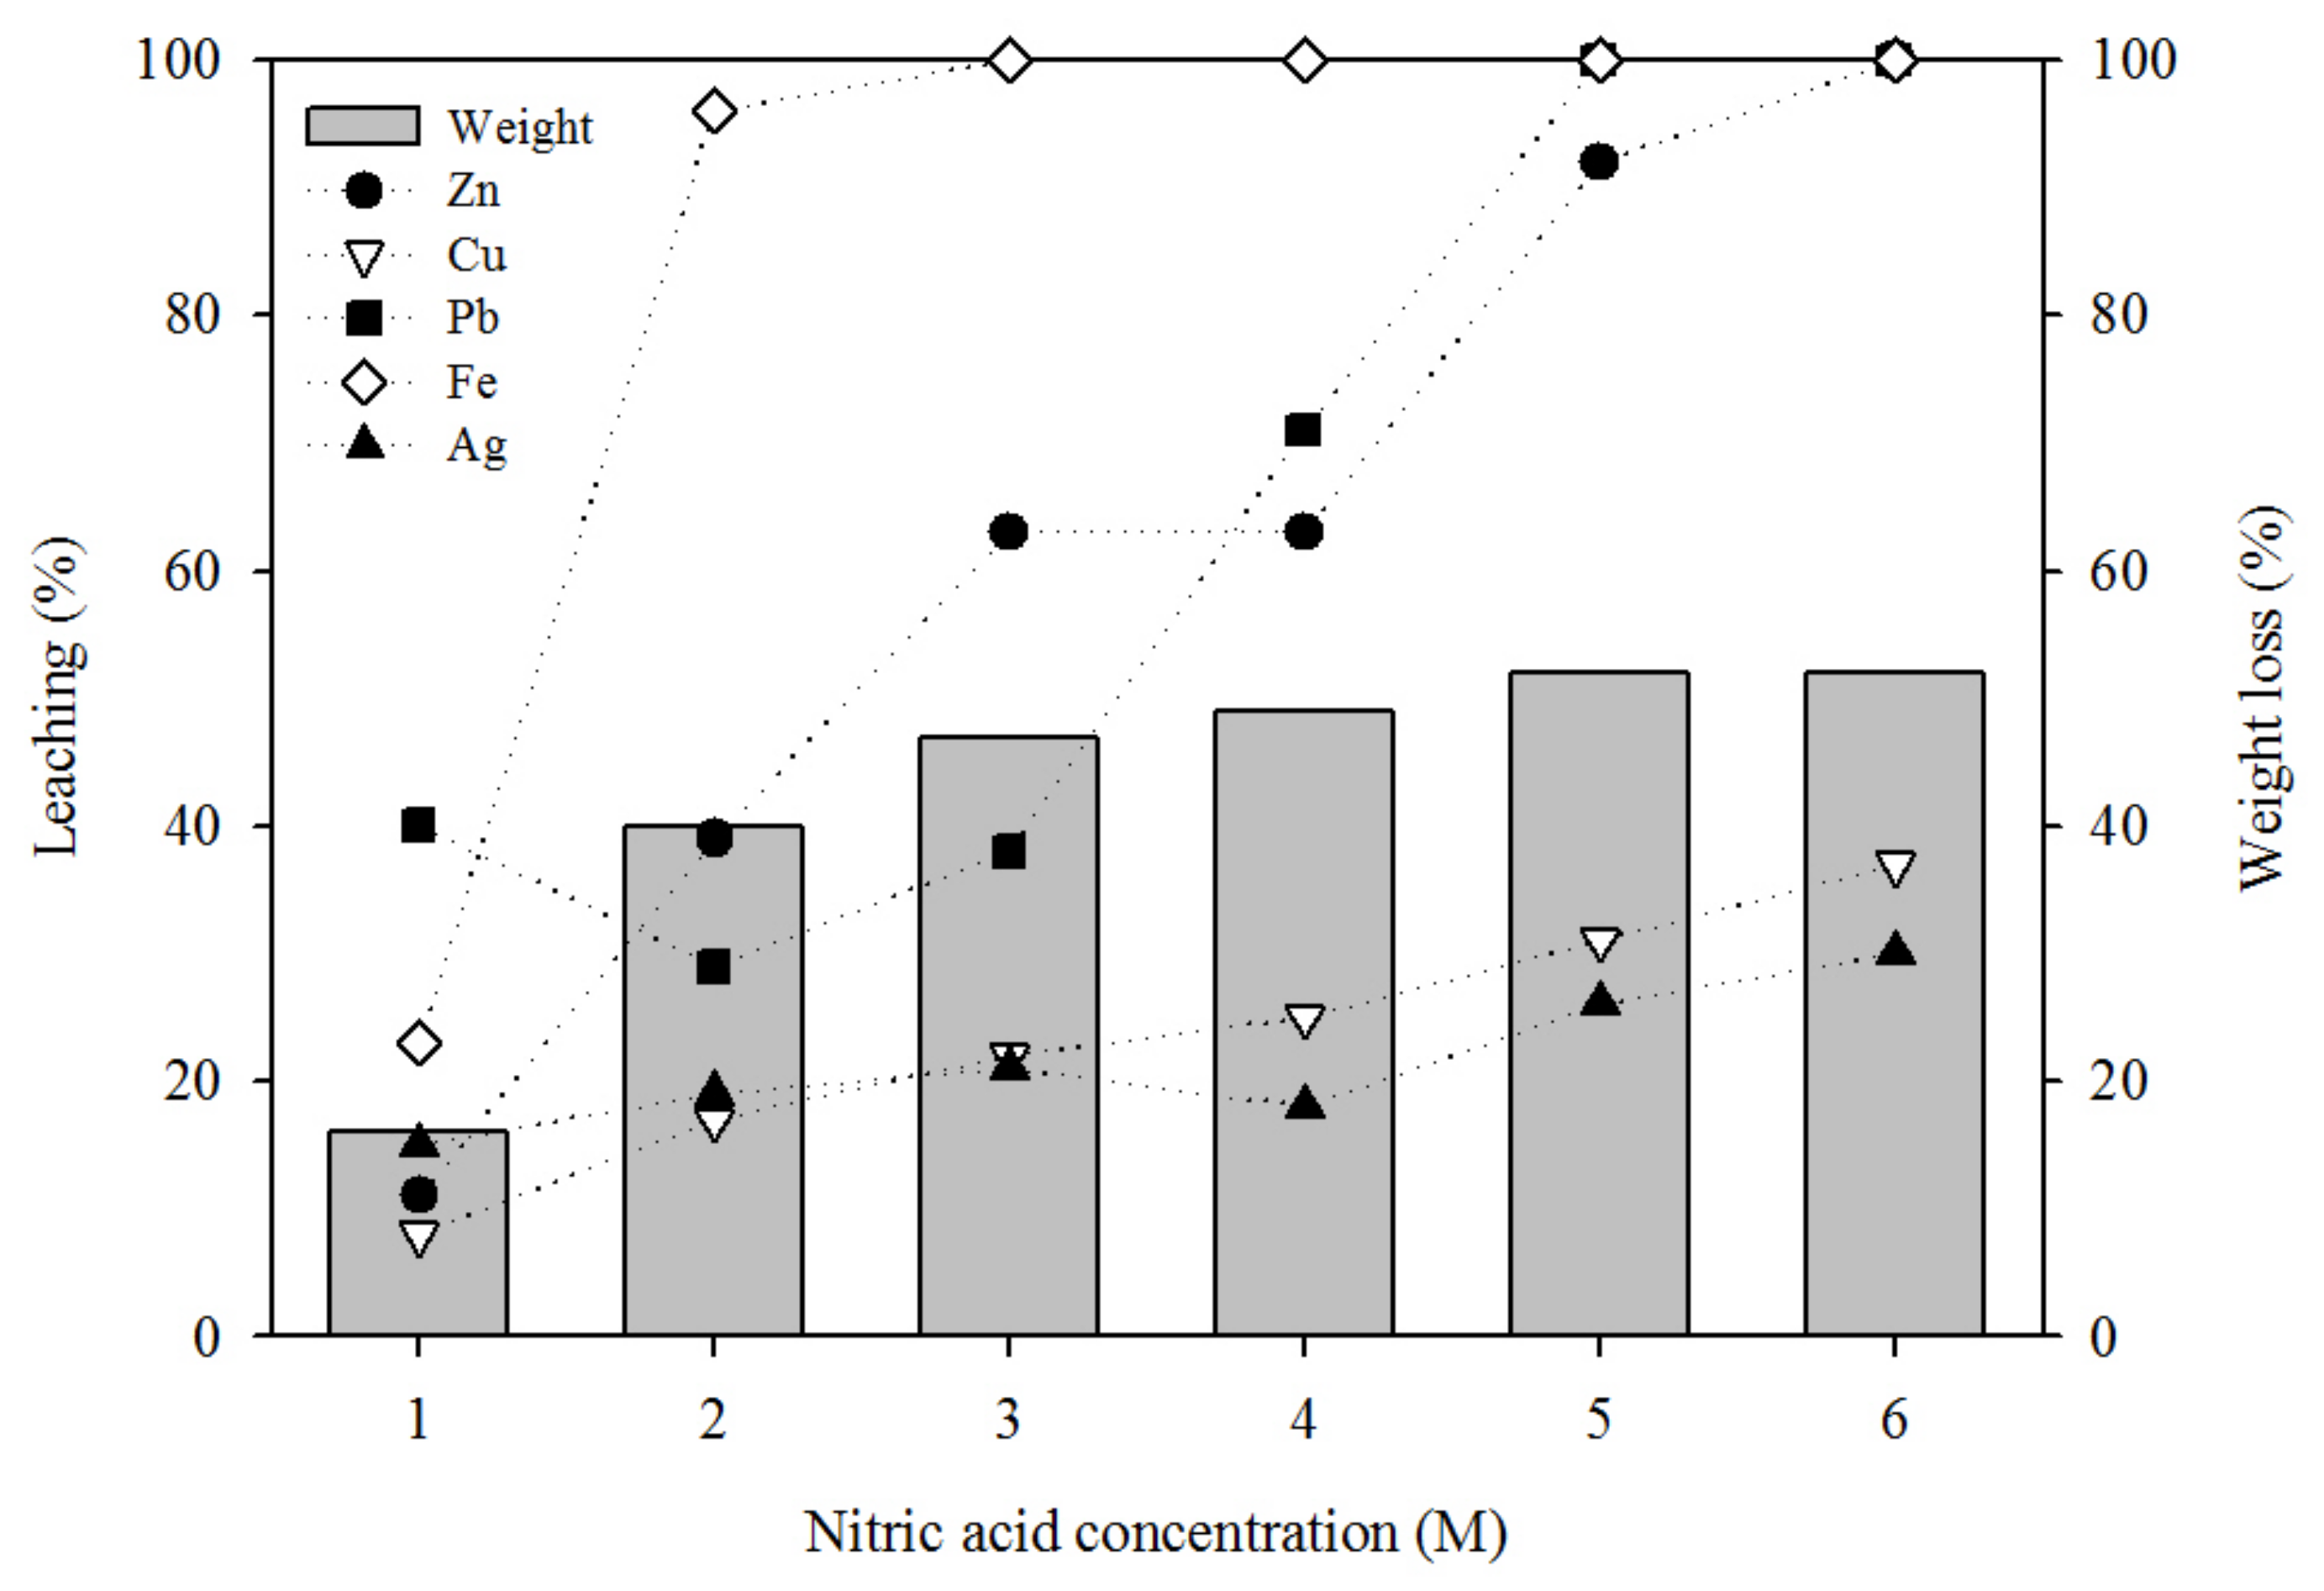
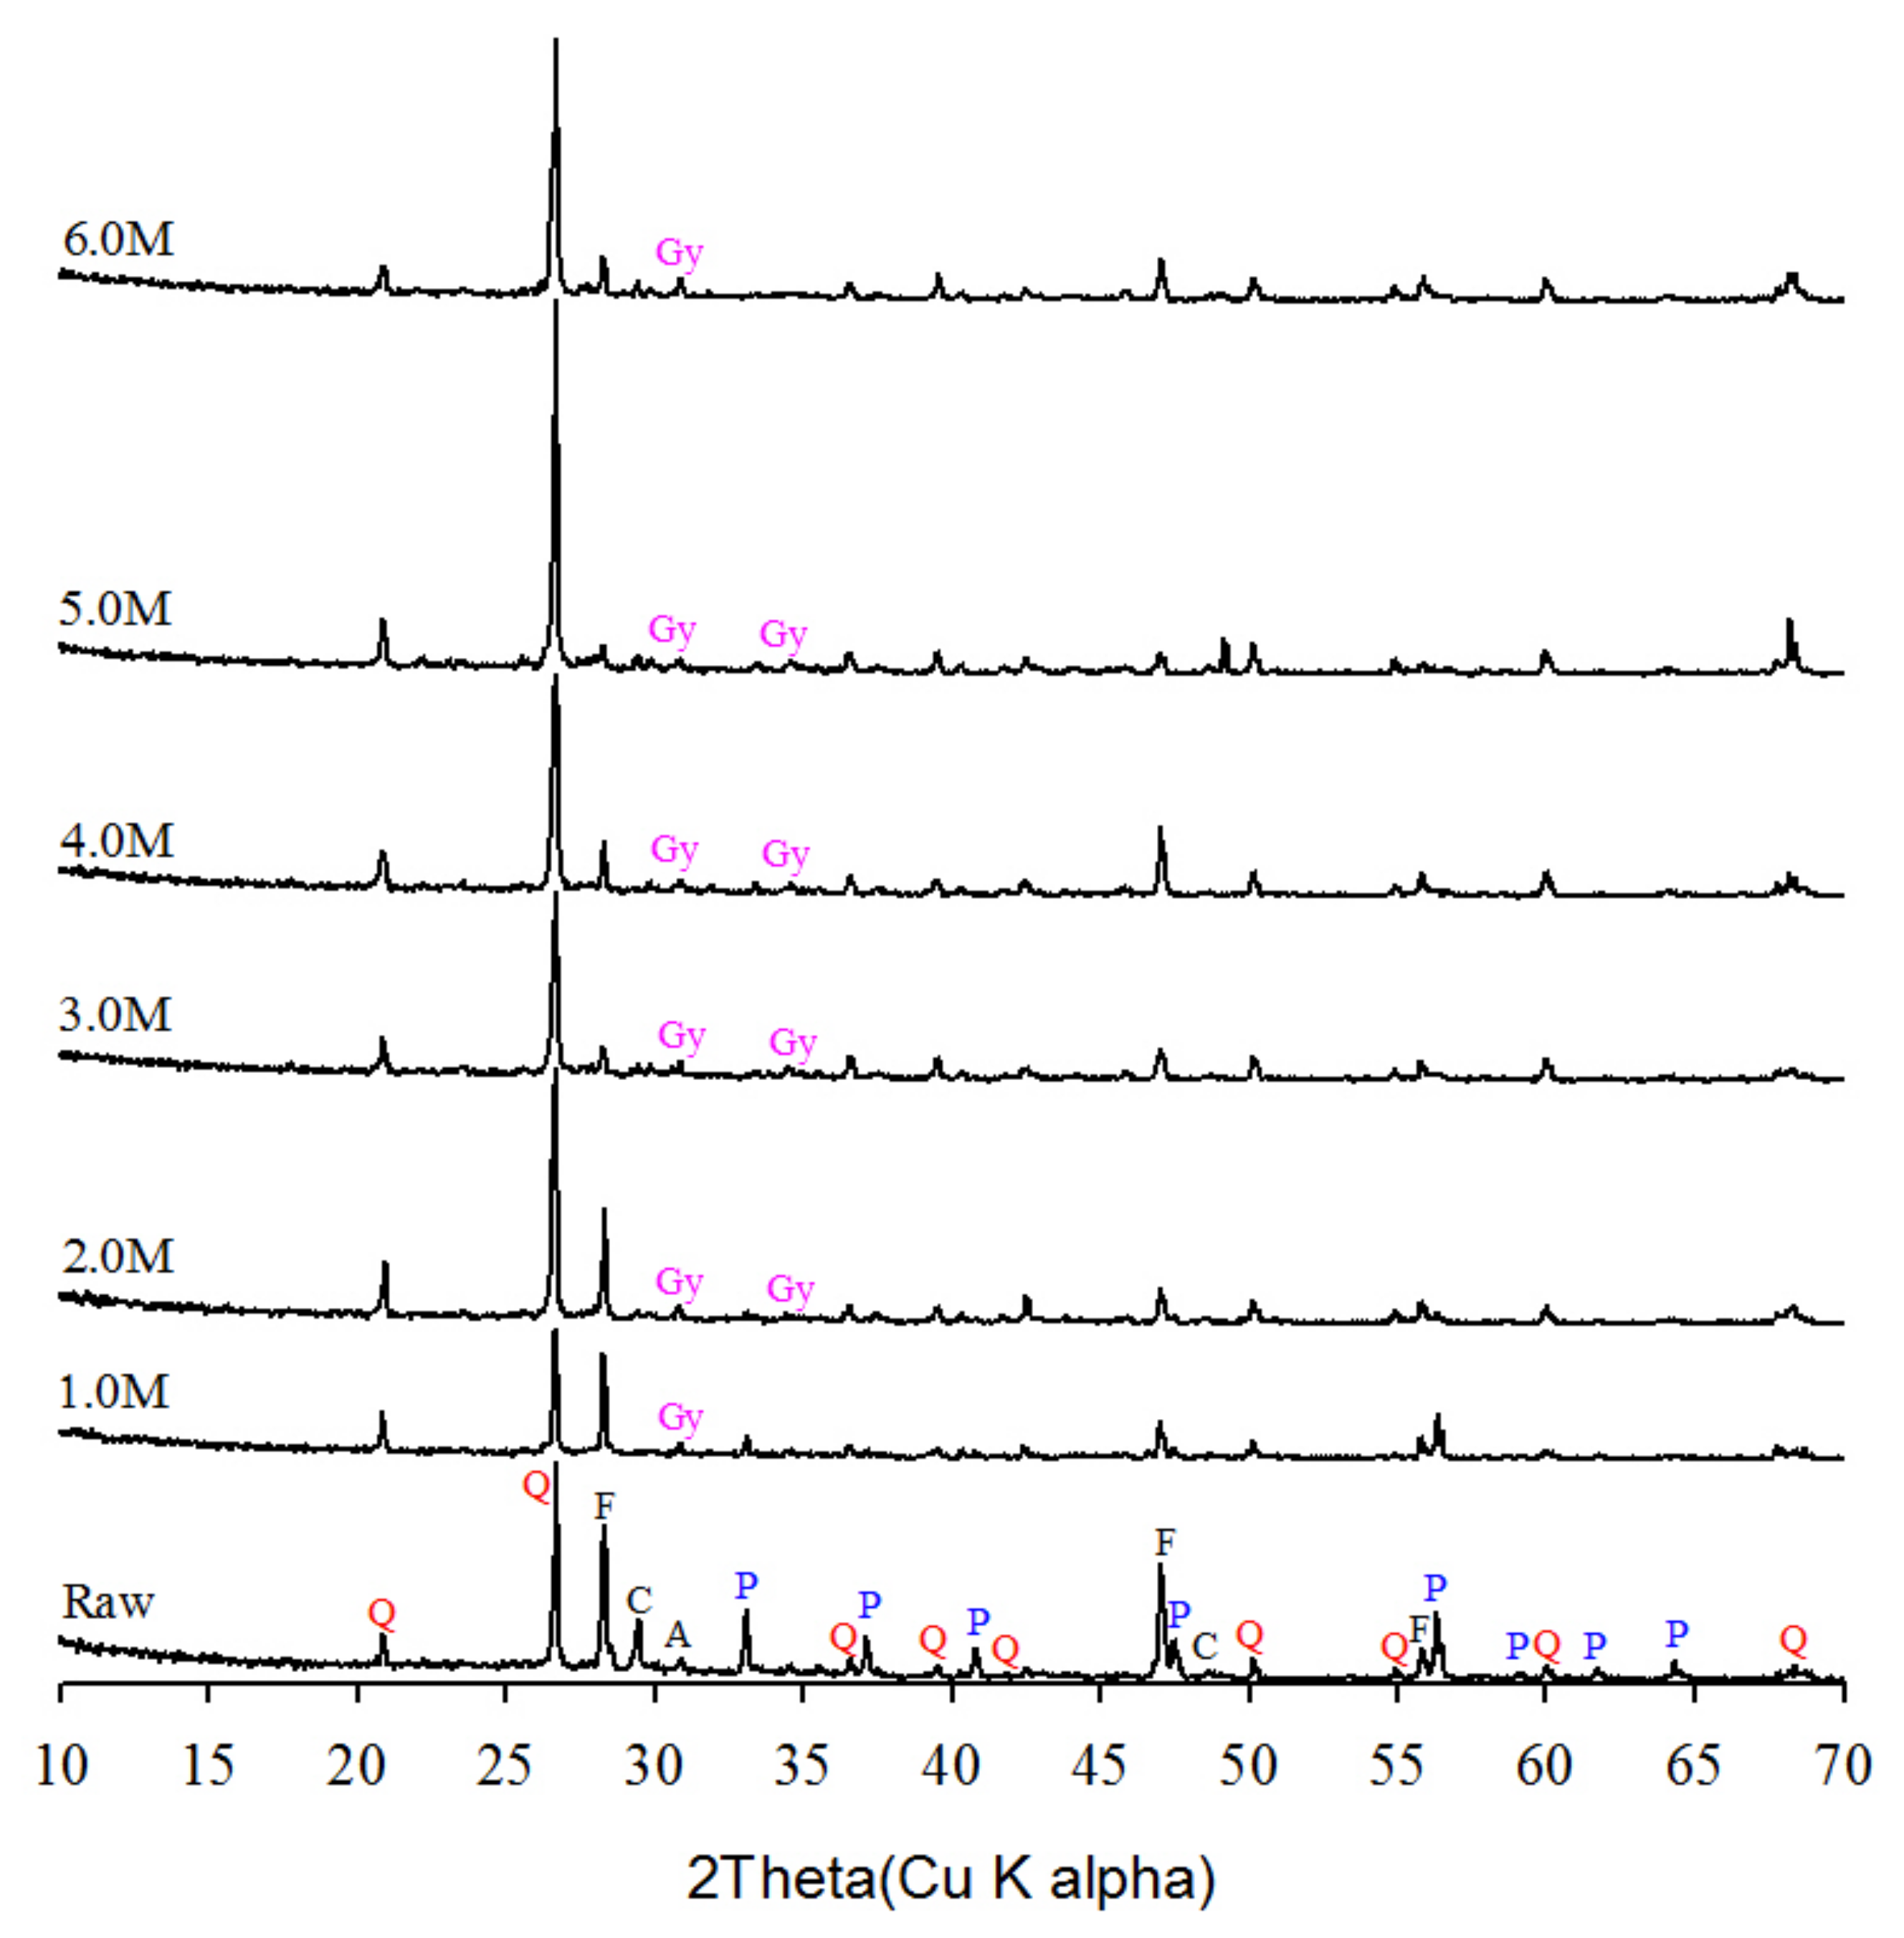
3.2. Microwave-Nitric Acid Leaching: Effect of Nitric Acid Concentrate

For sub-samples of the concentrate (100 g), the microwave-nitric acid leaching experiment was performed using 1 L of nitric acid. As shown in Figure 6, Cu, Pb, Zn, Ag and Fe showed increasing leaching efficiency with increasing nitric acid concentration from 1.0 up to 6.0 M. The extractions of Cu and Ag increased as the nitric acid concentration increased, and the maximum values at 6 M were found to be 37% and 30%, respectively. In addition, the Pb extraction decreased such that the values were 29% at 2.0 M and 38% at 3.0 M. The lower leaching efficiency of Pb can be attributed to passivation by basic sulfate [15,16]. Because higher nitric acid concentrations produce additional sulfate, there will be less sulfur on the surface. Upon increasing the nitric acid concentration from 1.0 to 5.0 M, the Pb leaching increased from 40.0% at 1.0 M to 100.0% at 5.0 M. Complete leaching, however, occurred at 3 M for Fe, 5 M for Pb, and 6 M for Zn. Au was not detected in any of the leaching solutions, with nitric acid concentrations ranging from 1 to 6 M and remained in the insoluble residue. As the concentration of nitric acid increased, weight reductions were observed (Figure 6). This indicates that the fraction of dissolved metal ions increased as the concentration of nitric acid increased.

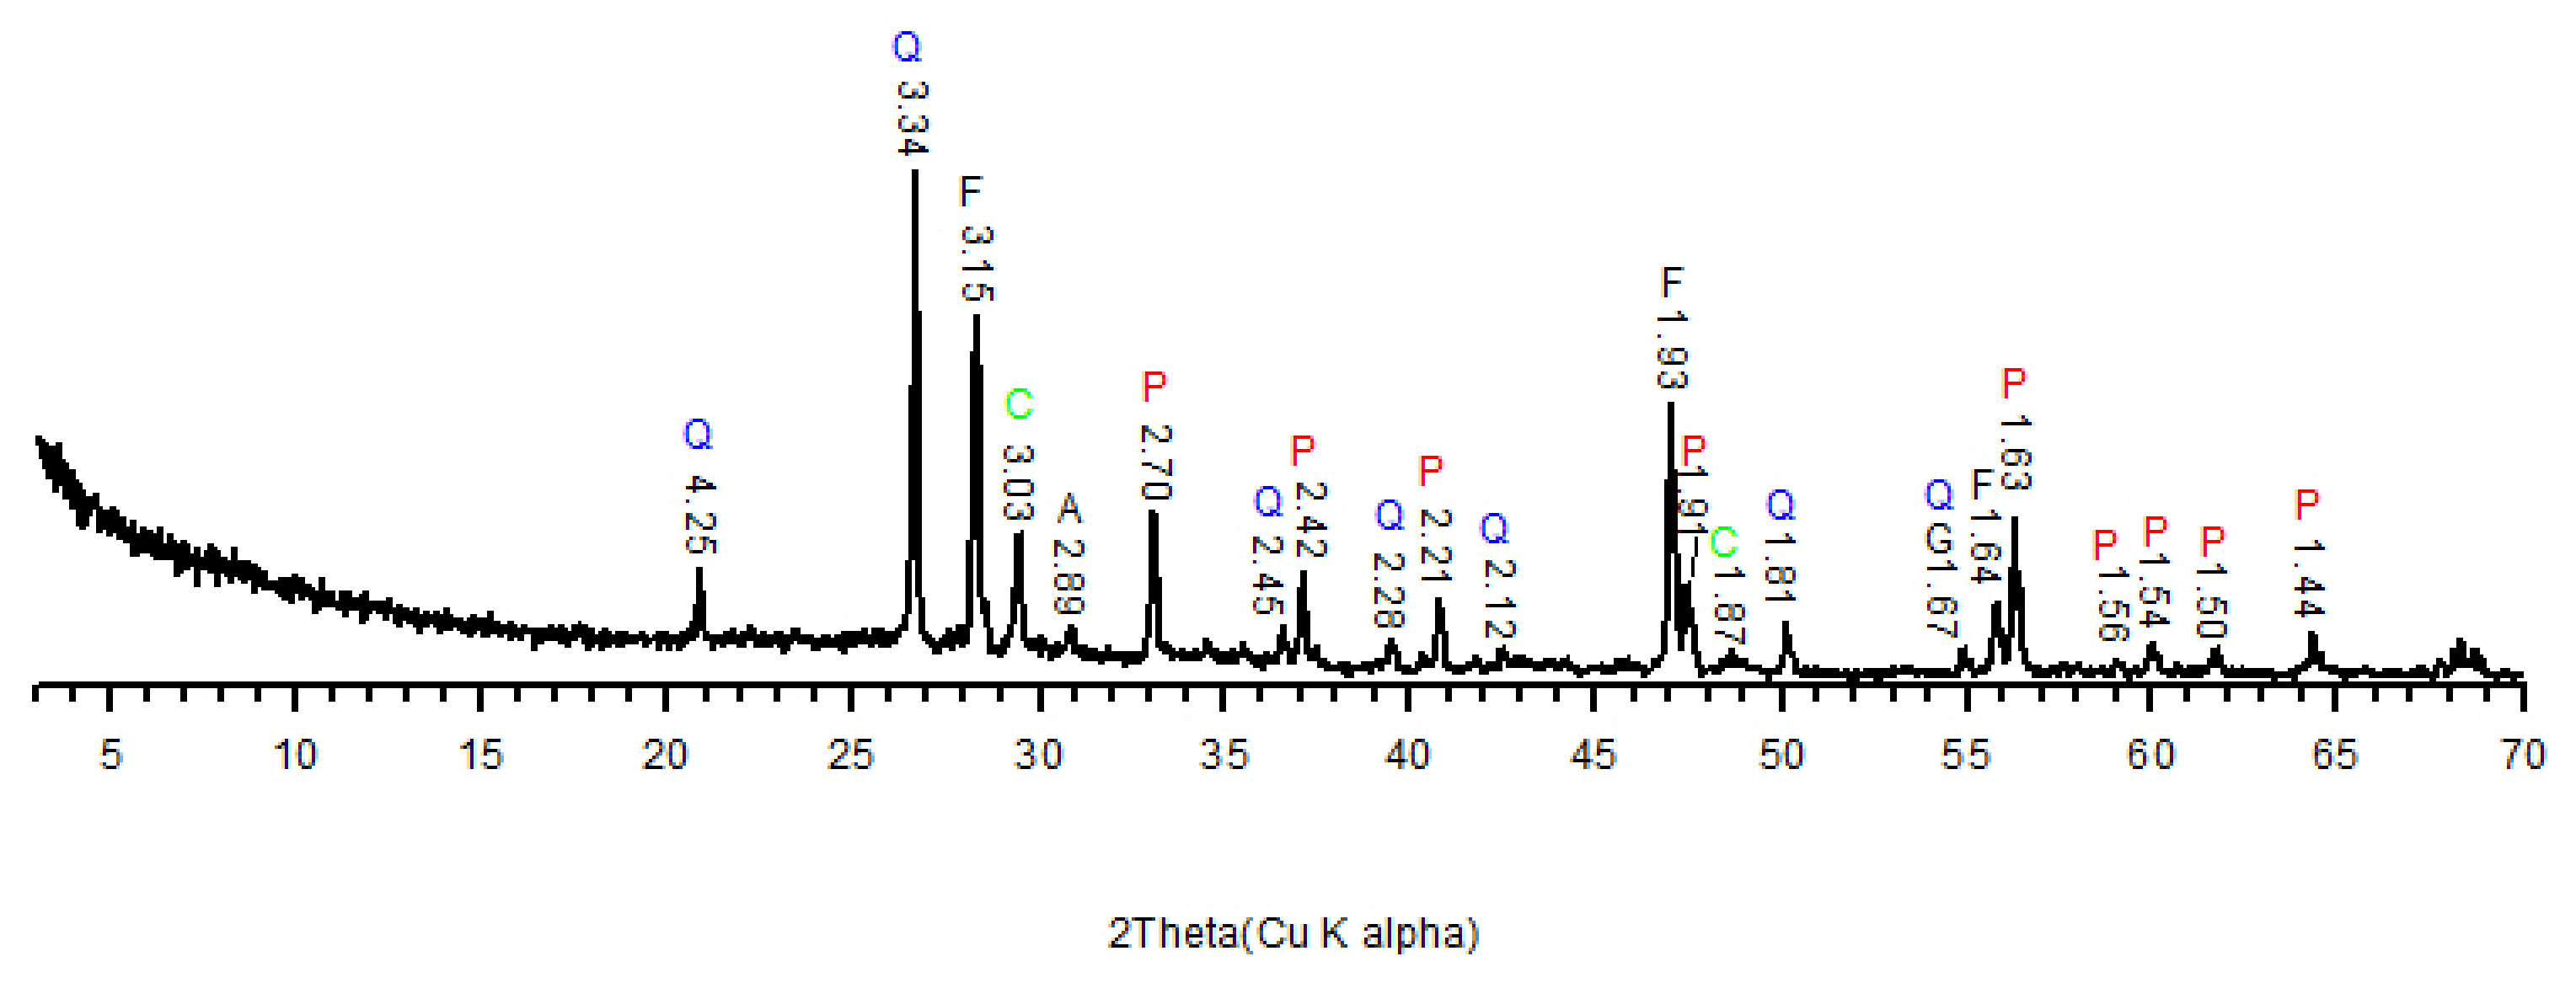
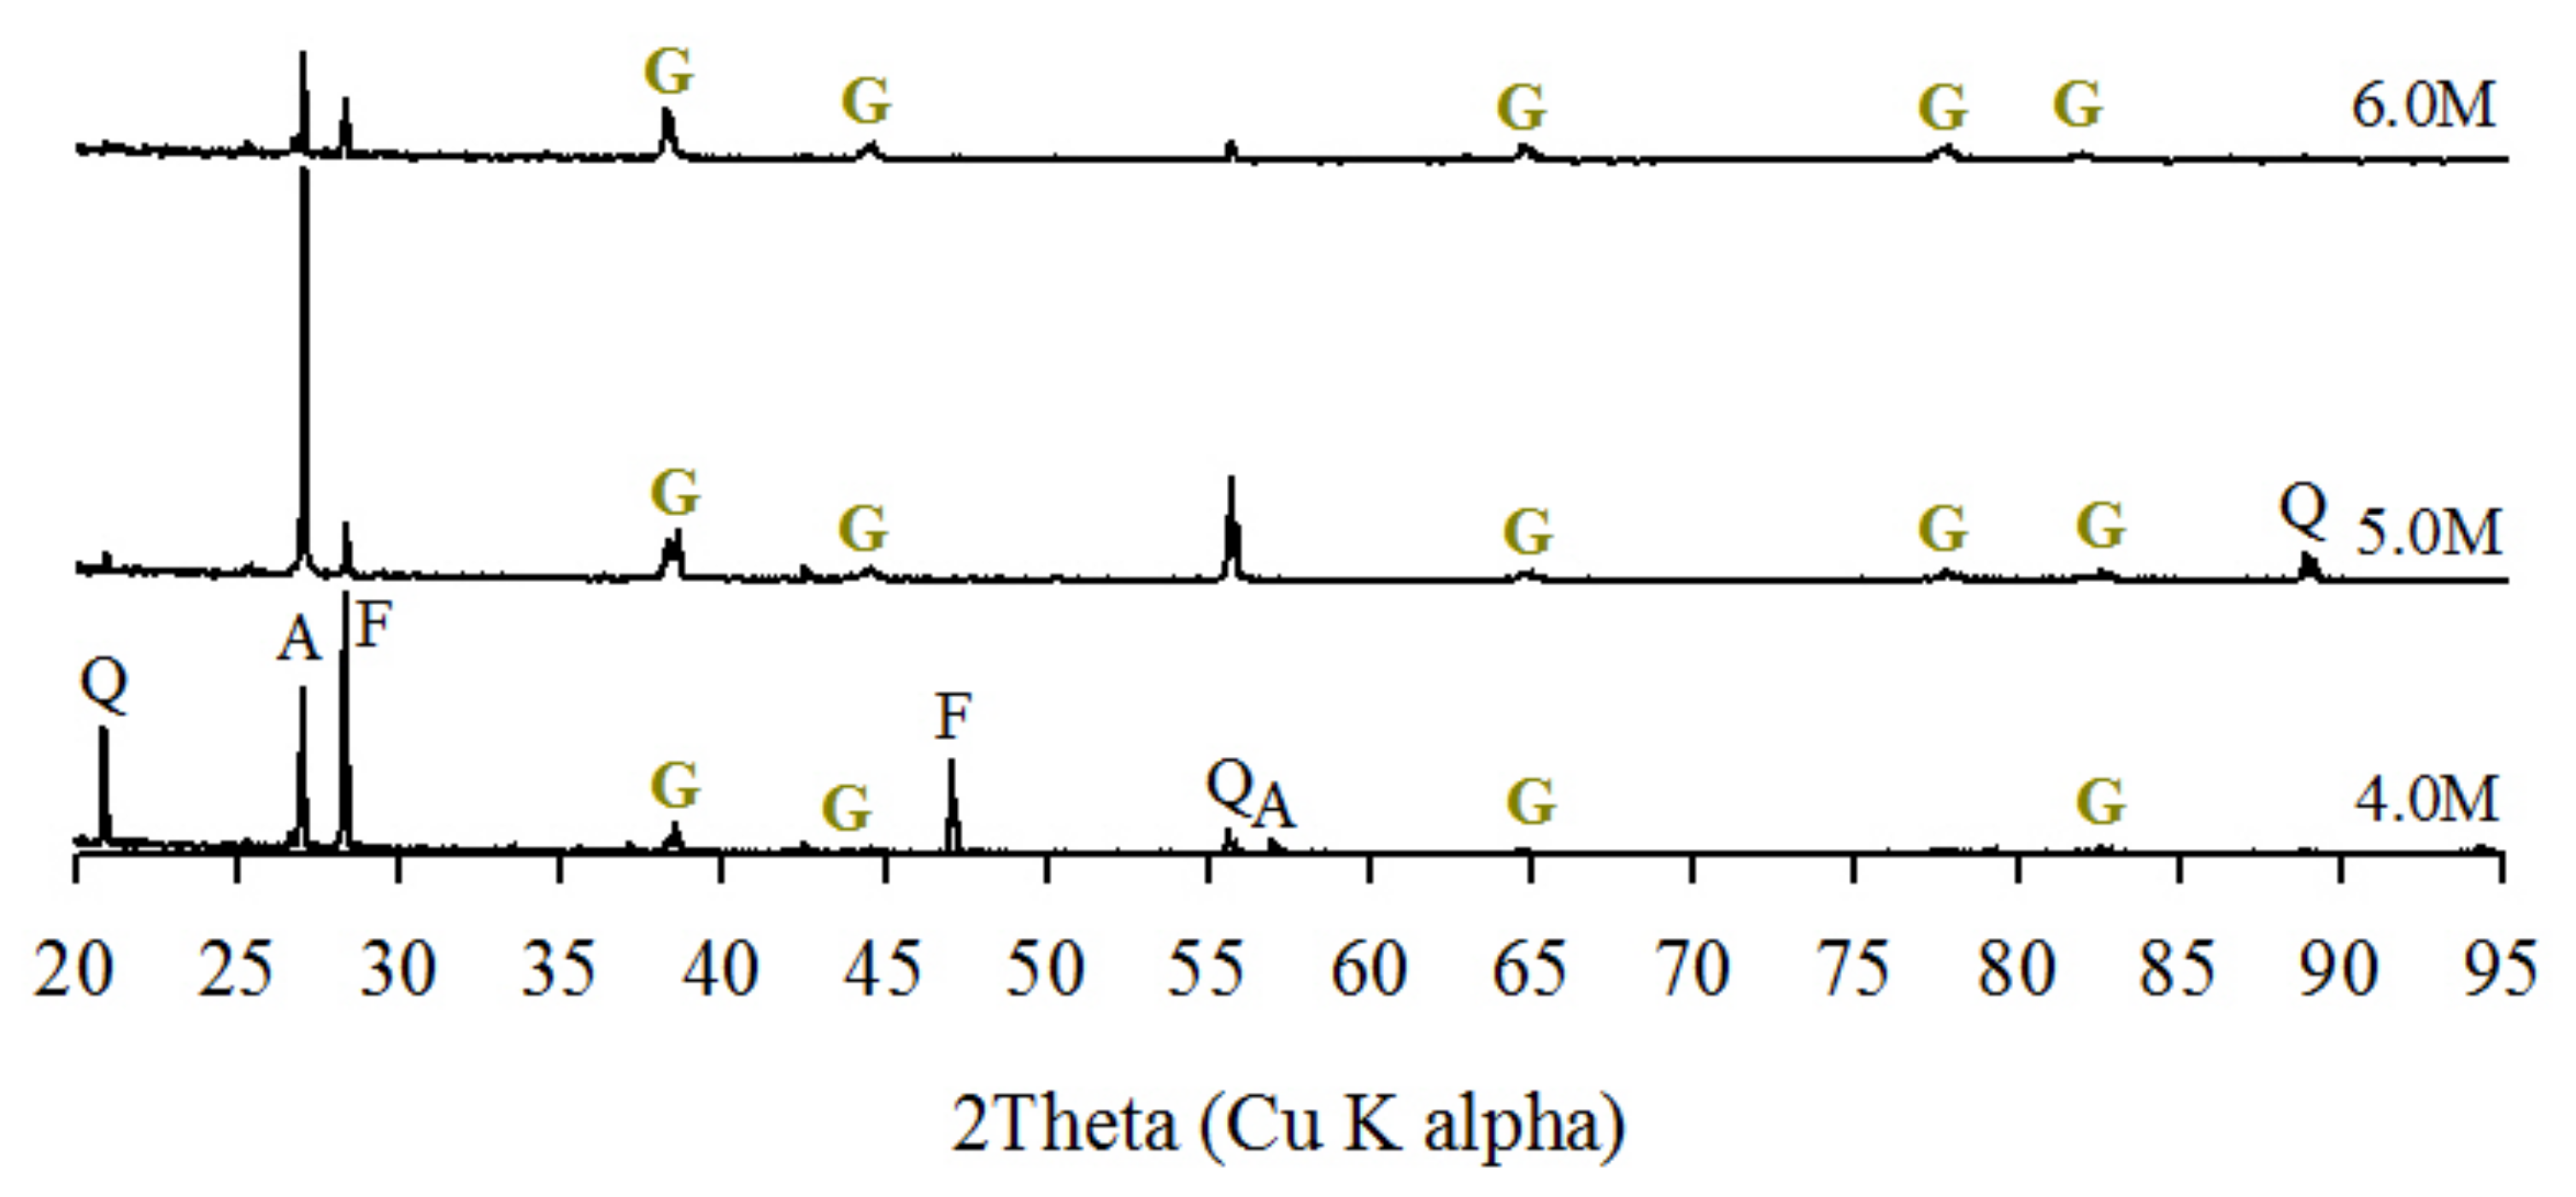
3.3. Characterization of Insoluble Residue and Heavy Minerals Using Hydro-Separation

Insoluble residues were collected by performing the microwave-nitric acid leaching experiment for each nitric acid concentration (1–6 M). When XRD analysis was conducted on these insoluble residues, quartz, fluorspar, adularia, gypsum, and pyrite were detected (Figure 7). Whereas pyrite was detected at 1 M, it had disappeared at 2 M, while the intensity of the quartz peaks increased in the leach residues. This confirms the dissolution of pyrite during the microwave-nitric acid leaching. However, gypsum appeared in all insoluble residues. The reactions of the pyrite with the nitric acid can be expressed in Equations (1) and (2) [17]. Gypsum appeared to have been formed through the reaction of the fluorspar with the nitric acid, as expressed in Equation (3) [17].
FeS2 + 4HNO3 = Fe(NO3)3 + NO(g) + 2S0 + 2H2O
2HNO3 + S0 → H2SO4 + 2NO(g)
CaF2 + H2SO4 + 2H2O = CaSO4·2H2O + 2HF
The SEM-EDS analyses were conducted on the collected insoluble residues (Figure 8). First, minerals that were bright or white in the SEM-BSE images were selected. When the minerals that contained bright or white columnar crystals in the 1 M insoluble residue were subjected to SEM-EDS area analysis, they were found to be pyrite (Figure 8a). In addition, EDS analysis was conducted on the bright or white minerals and the dark grey minerals attached to their surfaces. As a result, the bright or white columnar crystals in the insoluble residue of 1 M were found to be galena. It was observed that this galena penetrated into the cracks developed in pyrite crystals. In BSE images, galena that contains Pb always appears to be bright or white [5]. When EDS analysis was conducted on all bright or white minerals in the BSE images of 2, 3, 4, 5, and 6 M, Ag and Au were detected in all of them. Therefore, all of these bright or white minerals were found to be native gold or electrum [5]. In the SEM-BSE images of the 2 and 3 M insoluble residues, the bright or white minerals were combined with the sulfide minerals (gray color) (Figure 8b,c). In the 4–6 M insoluble residues, however, all the bright or white minerals were liberated from the sulfide minerals (Figure 8d–f, respectively). When SEM-EDS analysis was conducted on the bright or white minerals in the SEM-BSE images of 2–6 M, Ag and Au were detected in all of them. In addition, when SEM-EDS analysis was conducted on the dark minerals on the surface of the native gold or electrum shown in Figure 8d–f, they were found to be silicate minerals. This is because microwave-nitric acid leaching at a nitric acid concentration of higher than 1 M dissolves pyrite but not silicate minerals.
The heavy minerals were recovered by applying hydro-separation to selected insoluble residues (4–6 M). XRD analysis (2θ = 20° to 95°) was conducted on these heavy minerals. The diffraction lines of gold (38.18°, 44.39°, 64.57°, 77.54°, and 81.72°) were found in all heavy minerals of the 4–6 M residues. This result appeared to be due to the complete liberation of the heavy minerals at 4–6 M (Figure 9).
The SEM-BSE image and SEM-EDS analyses were conducted on the heavy minerals that were recovered at each nitric acid concentration (4–6 M). When all the bright and white minerals in the SEM-BSE images were subjected to SEM-EDS analysis (point analysis, red dot), Ag and Au were detected in all of them (Figure 10). In the SEM-BSE images of the hydro-separated heavy minerals, the frequency of the gangue minerals decreased, but that of native gold or electrum showed a tendency to increase. In particular, when the native gold or electrum of the 5 and 6 M residues was magnified and shown in Figure 11, we found through the SEM-EDS analysis that quartz (gray minerals, arrow) was attached to the surface of the native gold or electrum crystals.

4. Conclusions

In this study, the liberation of gold from gold-bearing ore minerals as microparticles or as a solid solution was studied using optical microscopy, SEM-BSE imaging and SEM-EDS analyses. More specifically, the characteristics of insoluble residues obtained using microwave-nitric acid leaching of a gold concentrate and hydro-separation to recover the heavy minerals were investigated. From the leaching experiments, XRD analysis indicated that pyrite in the sulfide minerals was decomposed to a small extent by nitric acid at <1.0 M. When the nitric acid concentration was increased from 2.0 to 6.0 M the pyrite was decomposed and the gold content of the residue was increasingly enhanced. Hydro-separation of the leach residues enabled the separation of the heavy and light minerals allowing gold or electrum to be identified in the heavy fraction. The liberation and mineral composition of the leach residues and heavy minerals were investigated using XRD and SEM-EDS analyses. The results of this study can be summarized as follows:
1.
Observation of the ore minerals using polarization microscopy revealed that the main sulfide mineral in the concentrate was pyrite. The pyrite crystals were angular and irregularly shaped, with a varying size distribution. Textures such as pores and cracks were found. SEM-EDS analysis was conducted on the produced ultrafine pyrite crystals, and Au was detected at the surface of the anhedral crystal.
2.
After microwave-nitric acid leaching, the metal extractions increased with the nitric acid concentration due to the oxidation of insoluble sulfides into soluble sulfate phases. The weight reduction reached 52% at 5.0 and 6.0 M.
3.
Comparison of the XRD patterns for the insoluble residues revealed that the intensities of the pyrite peak decreased and disappeared at 2.0 M nitric acid concentration and above, whereas those of the quartz peak increased. It was concluded that the pyrite in the sulfide minerals can be destroyed. SEM-EDS analysis was conducted on the insoluble residues, and this showed that gold particles were combined with gangue minerals (and/or trace levels of residual sulfide minerals).
4.
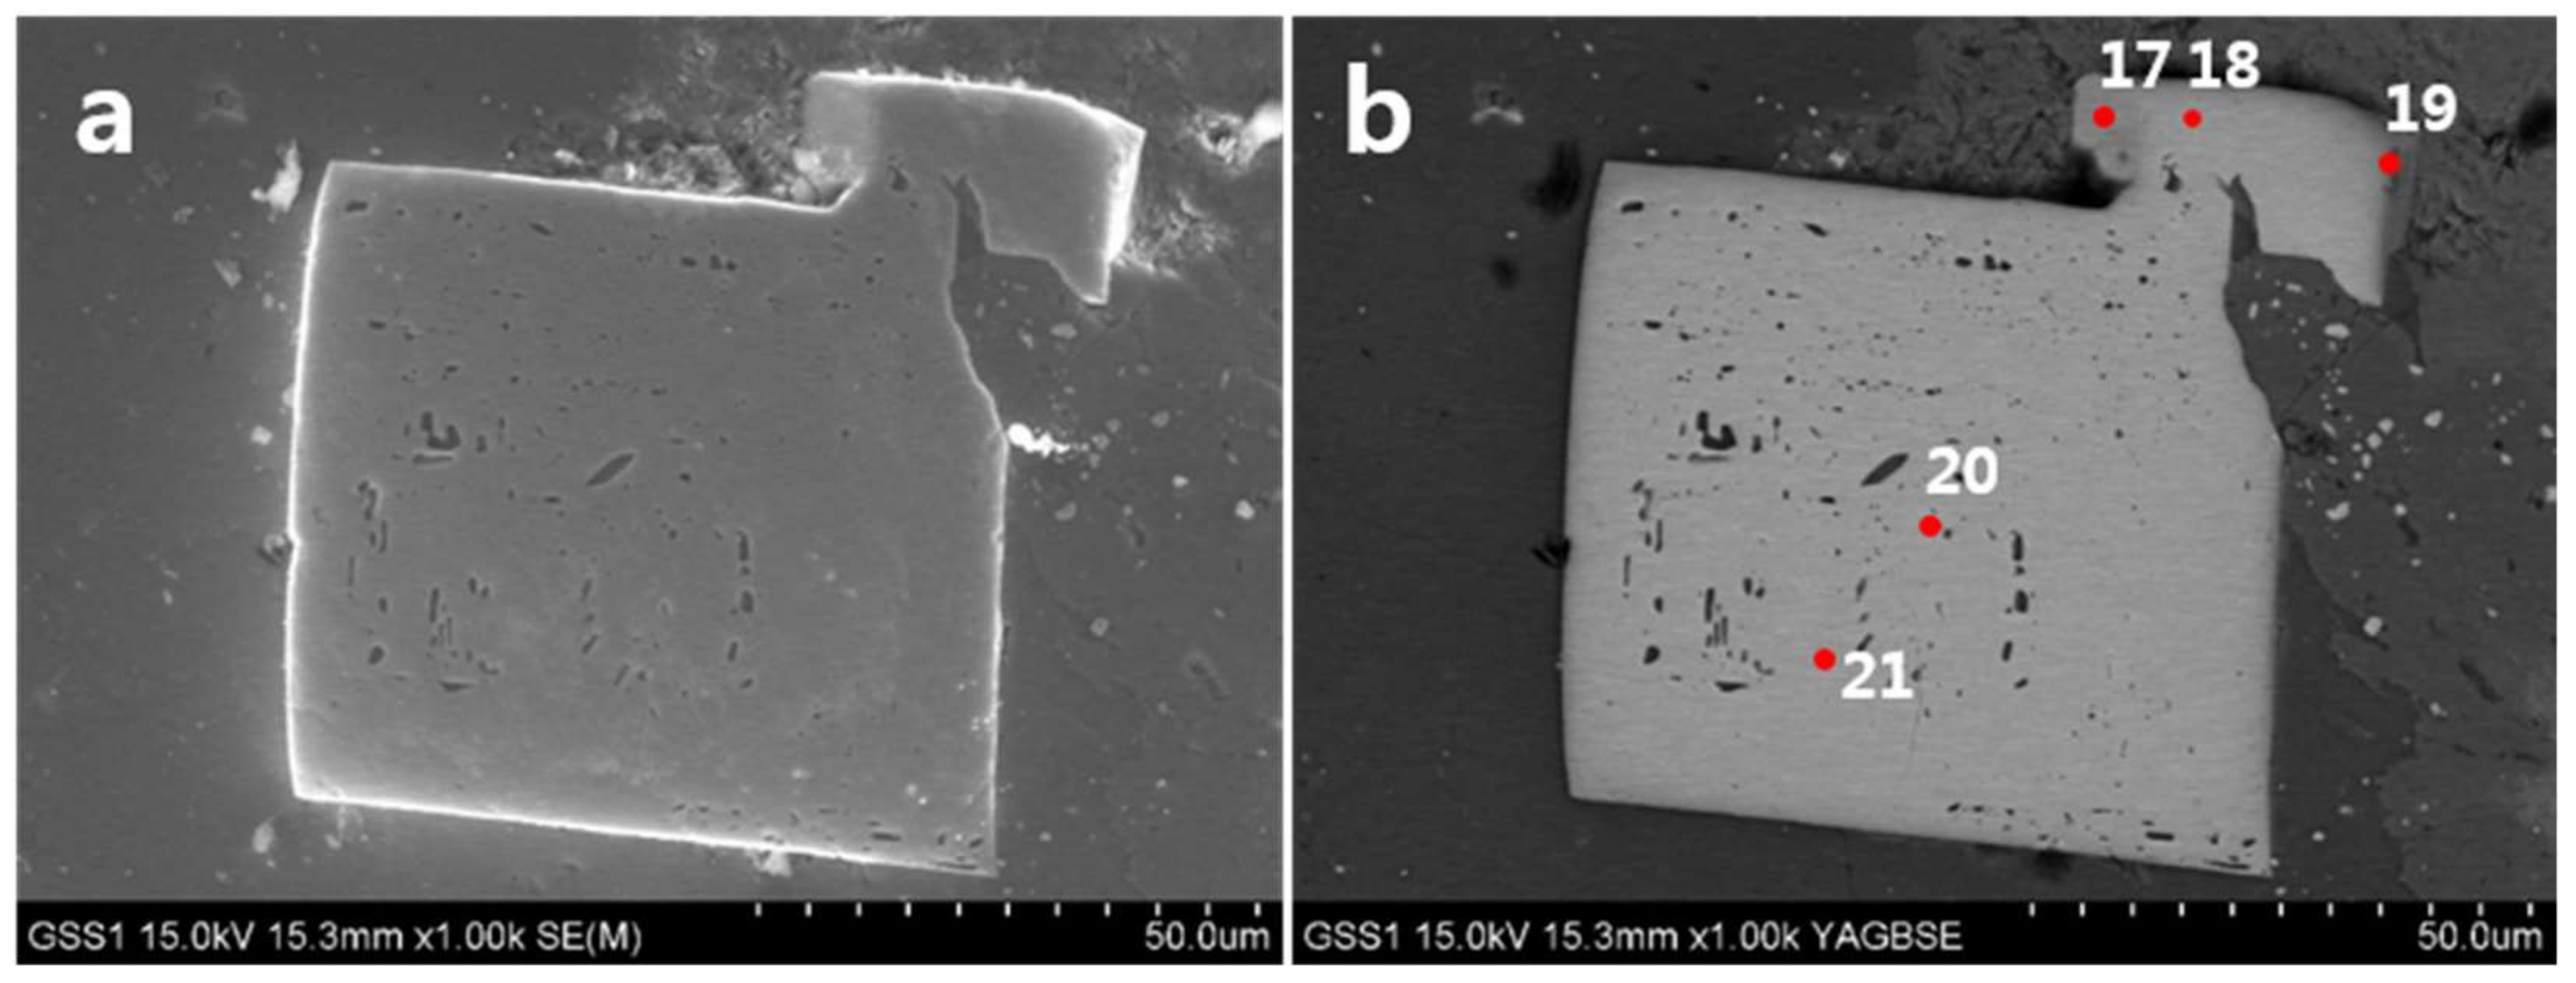
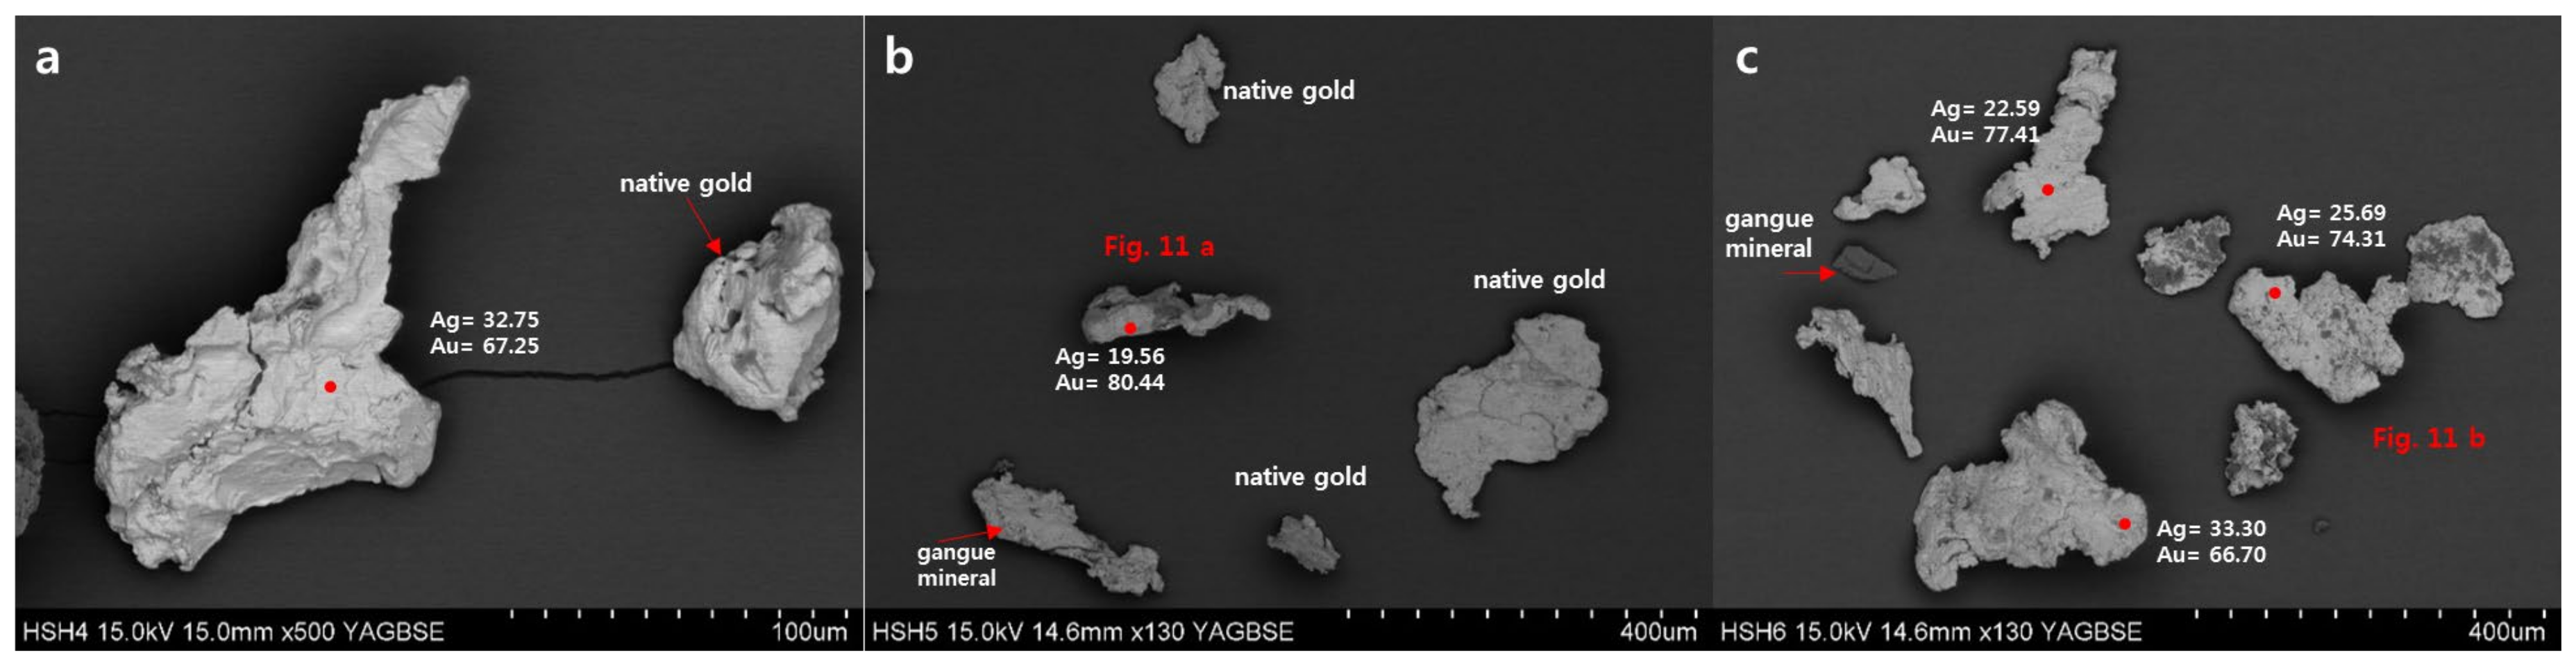
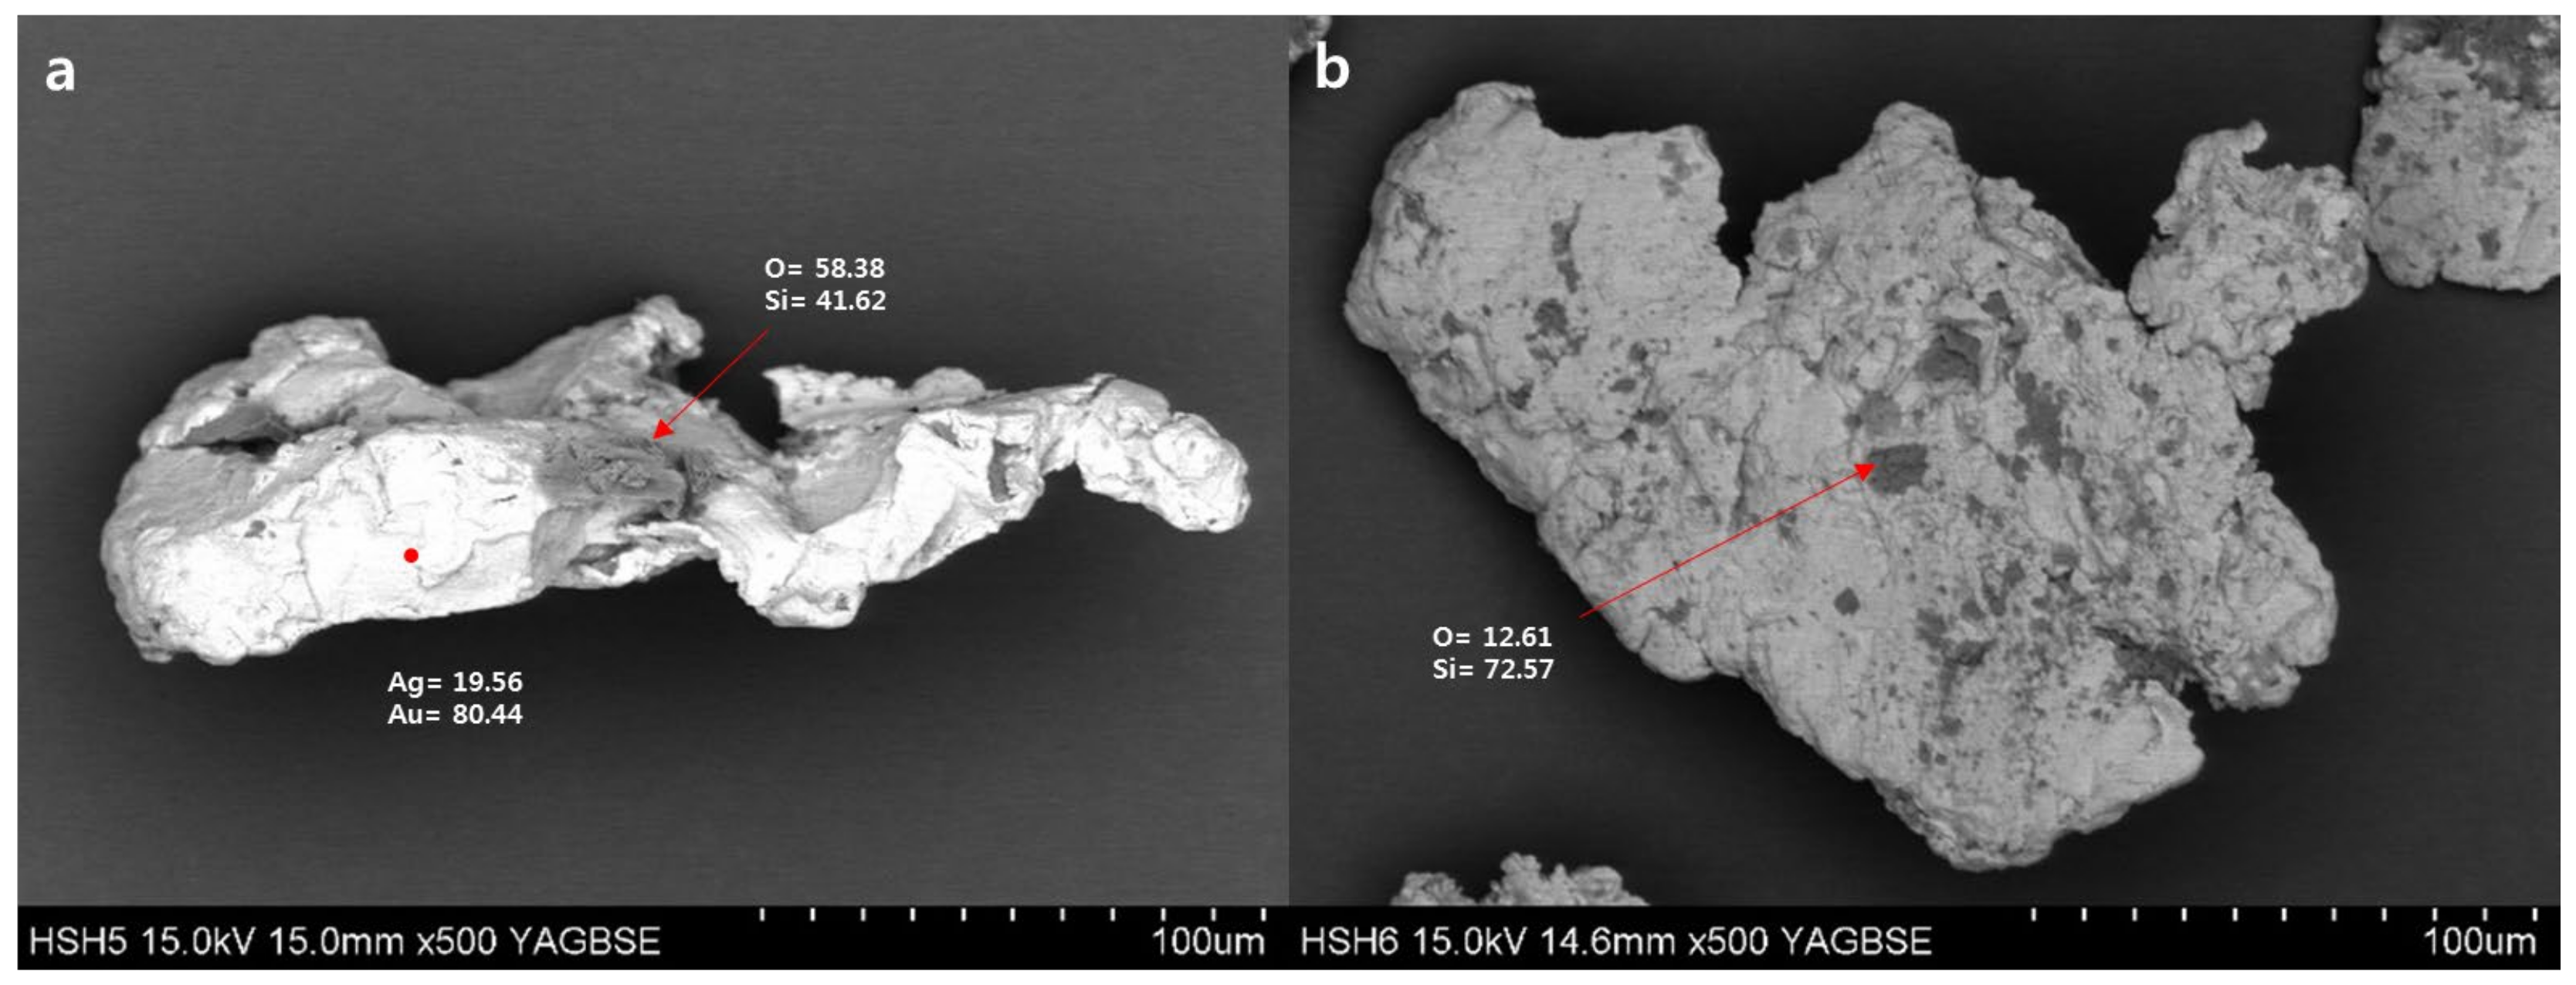
XRD analysis was conducted on the heavy minerals obtained by performing hydro-separation on the insoluble residues. The gangue minerals decreased, and the native gold or electrum increased as the nitric acid concentration increased. In particular, the heavy minerals after leaching with 4.0–6.0 M nitric acid exhibited typical gold diffraction lines. SEM-EDS analysis was conducted on the heavy minerals, and it was shown that silicate minerals and quartz were attached to the surface of the native gold after leaching with 4.0–6.0 M nitric acid concentrations.

Author Contributions

Validation, formal analysis, investigation, visualization, J.J.L.; writing—original draft preparation, writing—review and editing, K.H.C. and C.Y.P. All authors have read and agreed to the published version of the manuscript.

Funding

This study was supported by the Korea Ministry of Environment (MOE), South Korea, as an Advanced Industrial Technology Development Project (No. 2016000140010).

Conflicts of Interest

The authors declare no conflicts of interest.

References

  1. Hough, R.; Noble, R.; Reich, M. Natural gold nanoparticles. Ore Geol. Rev. 2011, 42, 55–61. [Google Scholar] [CrossRef]
  2. Reich, M.; Deditius, A.; Chryssoulis, S.; Li, J.-W.; Ma, C.-Q.; Parada, M.A.; Barra, F.; Mittermayr, F. Pyrite as a record of hydrothermal fluid evolution in a porphyry copper system: A SIMS/EMPA trace element study. Geochim. Cosmochim. Acta 2013, 104, 42–62. [Google Scholar] [CrossRef]
  3. Ashley, P.; Creagh, C.; Ryan, C. Invisible gold in ore and mineral concentrates from the Hillgrove gold-antimony deposits, NSW, Australia. Miner. Depos. 2000, 35, 285–301. [Google Scholar] [CrossRef]
  4. Allan, G.; Woodcock, J. A review of the flotation of native gold and electrum. Miner. Eng. 2001, 14, 931–962. [Google Scholar] [CrossRef]
  5. Vikentyev, I.V.; Yudovskaya, M.A.; Mokhov, A.V.; Kerzin, A.L.; Tsepin, A.I. Gold and PGE in massive sulfide ore of the Uzelginsk deposit, Southern Urals, Russia. Can. Mineral. 2004, 42, 651–665. [Google Scholar] [CrossRef] [Green Version]
  6. Alp, İ.; Celep, O.; Paktunç, D.; Thibault, Y. Influence of potassium hydroxide pretreatment on the extraction of gold and silver from a refractory ore. Hydrometallurgy 2014, 146, 64–71. [Google Scholar] [CrossRef]
  7. Kim, H.S.; Oyunbileg, P.; Park, C.-Y. A Study on the Removal of Penalty Elements and the Improvement of Gold Contents from Gold Concentrate Using Microwave-nitric Acid Leaching. J. Mineral. Soc. Korea 2019, 32, 1–14. [Google Scholar] [CrossRef] [Green Version]
  8. Lee, J.-J.; Myung, E.-J.; Park, C.-Y. The Effective Recovery of Gold from the Invisible Gold Concentrate Using Microwave-nitric Acid Leaching Method. J. Mineral. Soc. Korea 2019, 32, 185–200. [Google Scholar] [CrossRef]
  9. Cabri, L.J.; Rudashevsky, N.S.; Rudashevsky, V.N.; Gorkovetz, V.Y. Study of native gold from the Luopensulo deposit (Kostomuksha area, Karelia, Russia) using a combination of electric pulse disaggregation (EPD) and hydroseparation (HS). Miner. Eng. 2008, 21, 463–470. [Google Scholar] [CrossRef]
  10. Wang, Y.; Baker, L.A.; Brindle, I.D. Determination of gold and silver in geological samples by focused infrared digestion: A re-investigation of aqua regia digestion. Talanta 2016, 148, 419–426. [Google Scholar] [CrossRef] [PubMed]
  11. Rao, C.; Reddi, G. Platinum group metals (PGM); occurrence, use and recent trends in their determination. TrAC Trends Anal. Chem. 2000, 19, 565–586. [Google Scholar] [CrossRef]
  12. Lee, J.-J.; On, H.-S.; Park, C.-Y. Gold Recovery from Geumsan Concentrate Using Microwave-nitric Acid Leaching and Lead-fire Assay. J. Mineral. Soc. Korea 2019, 32, 113–126. [Google Scholar] [CrossRef]
  13. Cabri, L.; Rudashevsky, N.; Rudashevsky, V.; Lastra, R. Hydroseparation: A new development in process mineralogy of platinum-bearing ores. CIM Bull. 2006, 99, 1–7. [Google Scholar]
  14. Choi, N.-C.; Kim, B.-J.; Cho, K.-H.; You, D.-S.; Park, C.-Y. Enhancement of gold recovery during lead fire assay by salt-roasting. Geosyst. Eng. 2014, 17, 226–234. [Google Scholar] [CrossRef]
  15. Kim, E.; Horckmans, L.; Spooren, J.; Vrancken, K.; Quaghebeur, M.; Broos, K. Selective leaching of Pb, Cu, Ni and Zn from secondary lead smelting residues. Hydrometallurgy 2017, 169, 372–381. [Google Scholar] [CrossRef]
  16. Zárate-Gutiérrez, R.; Lapidus, G.; Morales, R. Aqueous oxidation of galena and pyrite with nitric acid at moderate temperatures. Hydrometallurgy 2012, 115, 57–63. [Google Scholar] [CrossRef]
  17. Ibrahim, T.M.; El-Hussaini, O.M. Production of anhydrite–gypsum and recovery of rare earths as a by-product. Hydrometallurgy 2007, 87, 11–17. [Google Scholar] [CrossRef]
Figure 1. Stereoscopic microscope image of a gold particle from raw concentrate by lead-fire assay.
Minerals 10 00327 g001
Figure 2. X-ray diffraction (XRD) patterns of the raw concentrate. A: adularia; C: calcite; F: fluorspar; P: pyrite; Q: quartz.
Minerals 10 00327 g002
Figure 3. Schematic diagram of the hydro-separation process.
Minerals 10 00327 g003
Figure 4. Reflected light photomicrograph (a) and SEM-backscattered electron (BSE) image (bd) of a pyrite grain of the ore sample.
Minerals 10 00327 g004
Figure 5. SEM-EDS (a) and SEM-BSE image (b) of fine pyrite grain on the ore sample.
Minerals 10 00327 g005
Figure 6. Effect of the HNO3 concentration on the leaching efficiencies of Cu, Pb, Zn, Ag, and Fe and weight loss from the gold concentrate. Leaching conditions: HNO3 Concentration; 1.0 to 6.0 M, reaction time; 15 min.
Minerals 10 00327 g006
Figure 7. Comparative XRD patterns of raw concentrate and leach residue after microwave-nitric acid leaching as a function of nitric acid concentration. A: adularia; C: calcite; F: fluorspar; P: pyrite; Q: quartz and Gy: gypsum. Leaching conditions: HNO3 Concentration; 1.0 to 6.0 M, reaction time; 15 min.
Minerals 10 00327 g007
Figure 8. SEM-BSE image and SEM-EDS of native gold grains, sulfide minerals and gangue minerals on the insoluble residue ((af); nitric acid 1.0–6.0 M, respectively). Red dots and arrows are EDS spot positions.
Minerals 10 00327 g008
Figure 9. XRD patterns of the heavy fraction from insoluble residue by hydro-separation. A: adularia; Ch: chalcopyrite; F: fluorspar; G: gold; M: magnetite; P: pyrite; Q: quartz.
Minerals 10 00327 g009
Figure 10. SEM-BSE image and SEM-EDS of native gold grains and gangue minerals from hydro-separation. Red dots and arrows are EDS spot positions. The heavy minerals ((ac); nitric acid 4.0–6.0 M, respectively).
Minerals 10 00327 g010
Figure 11. Close up SEM-BSE image of native gold particles in Figure 10b,c. Red dots and arrows are EDS spot positions, and the numbers are concentration of elements in wt.%. (a) Figure 10b; (b) Figure 10c.
Minerals 10 00327 g011
Table 1. Chemical composition of raw concentrate by atomic-absorption spectrophotometry (AAS) (wt.%) and lead-fire assay.
ElementFeCaCuPbZnAg (g/t)Au (g/t)
wt.%11.93.830.800.280.201031715.20
Table 2. SEM-EDS analyses (wt.%) for a coarse pyrite grain (Figure 4) on the ore sample.
Spot PositionFeSSiOPbAl
134.861.3 3.94
232.662.5 4.90
335.664.5
433.461.7 4.99
534.865.2
633.561.7 4.85
724.8632.737.7129.42 5.27
828.5345.892.4221.43 1.72
933.960.8 5.37
Spot positionFeSSiOAgPb
101.78 11.9247.7638.55
111.55 12.0347.8538.56
121.86 12.5045.8739.77
132.240.8411.5844.5136.933.90
Spot positionFeSPbAs
1410.930.059.1
153.7917.478.70.11
162.1710.887.1
Table 3. SEM-EDS analyses (wt.%) for fine pyrite grain (Figure 5b) on the ore sample.
Spot PositionSFeOCoAuPb
1761.234.8 2.111.91
1858.128.2 1.921.5410.3
1943.520.533.61.421.01
2061.229.4 9.44
2161.929.6 8.52

