Evaluation of Bio-Based Extraction Methods by Spectroscopic Methods

 ,
,  ,
,
Abstract
:1. Introduction
2. Materials and Methods
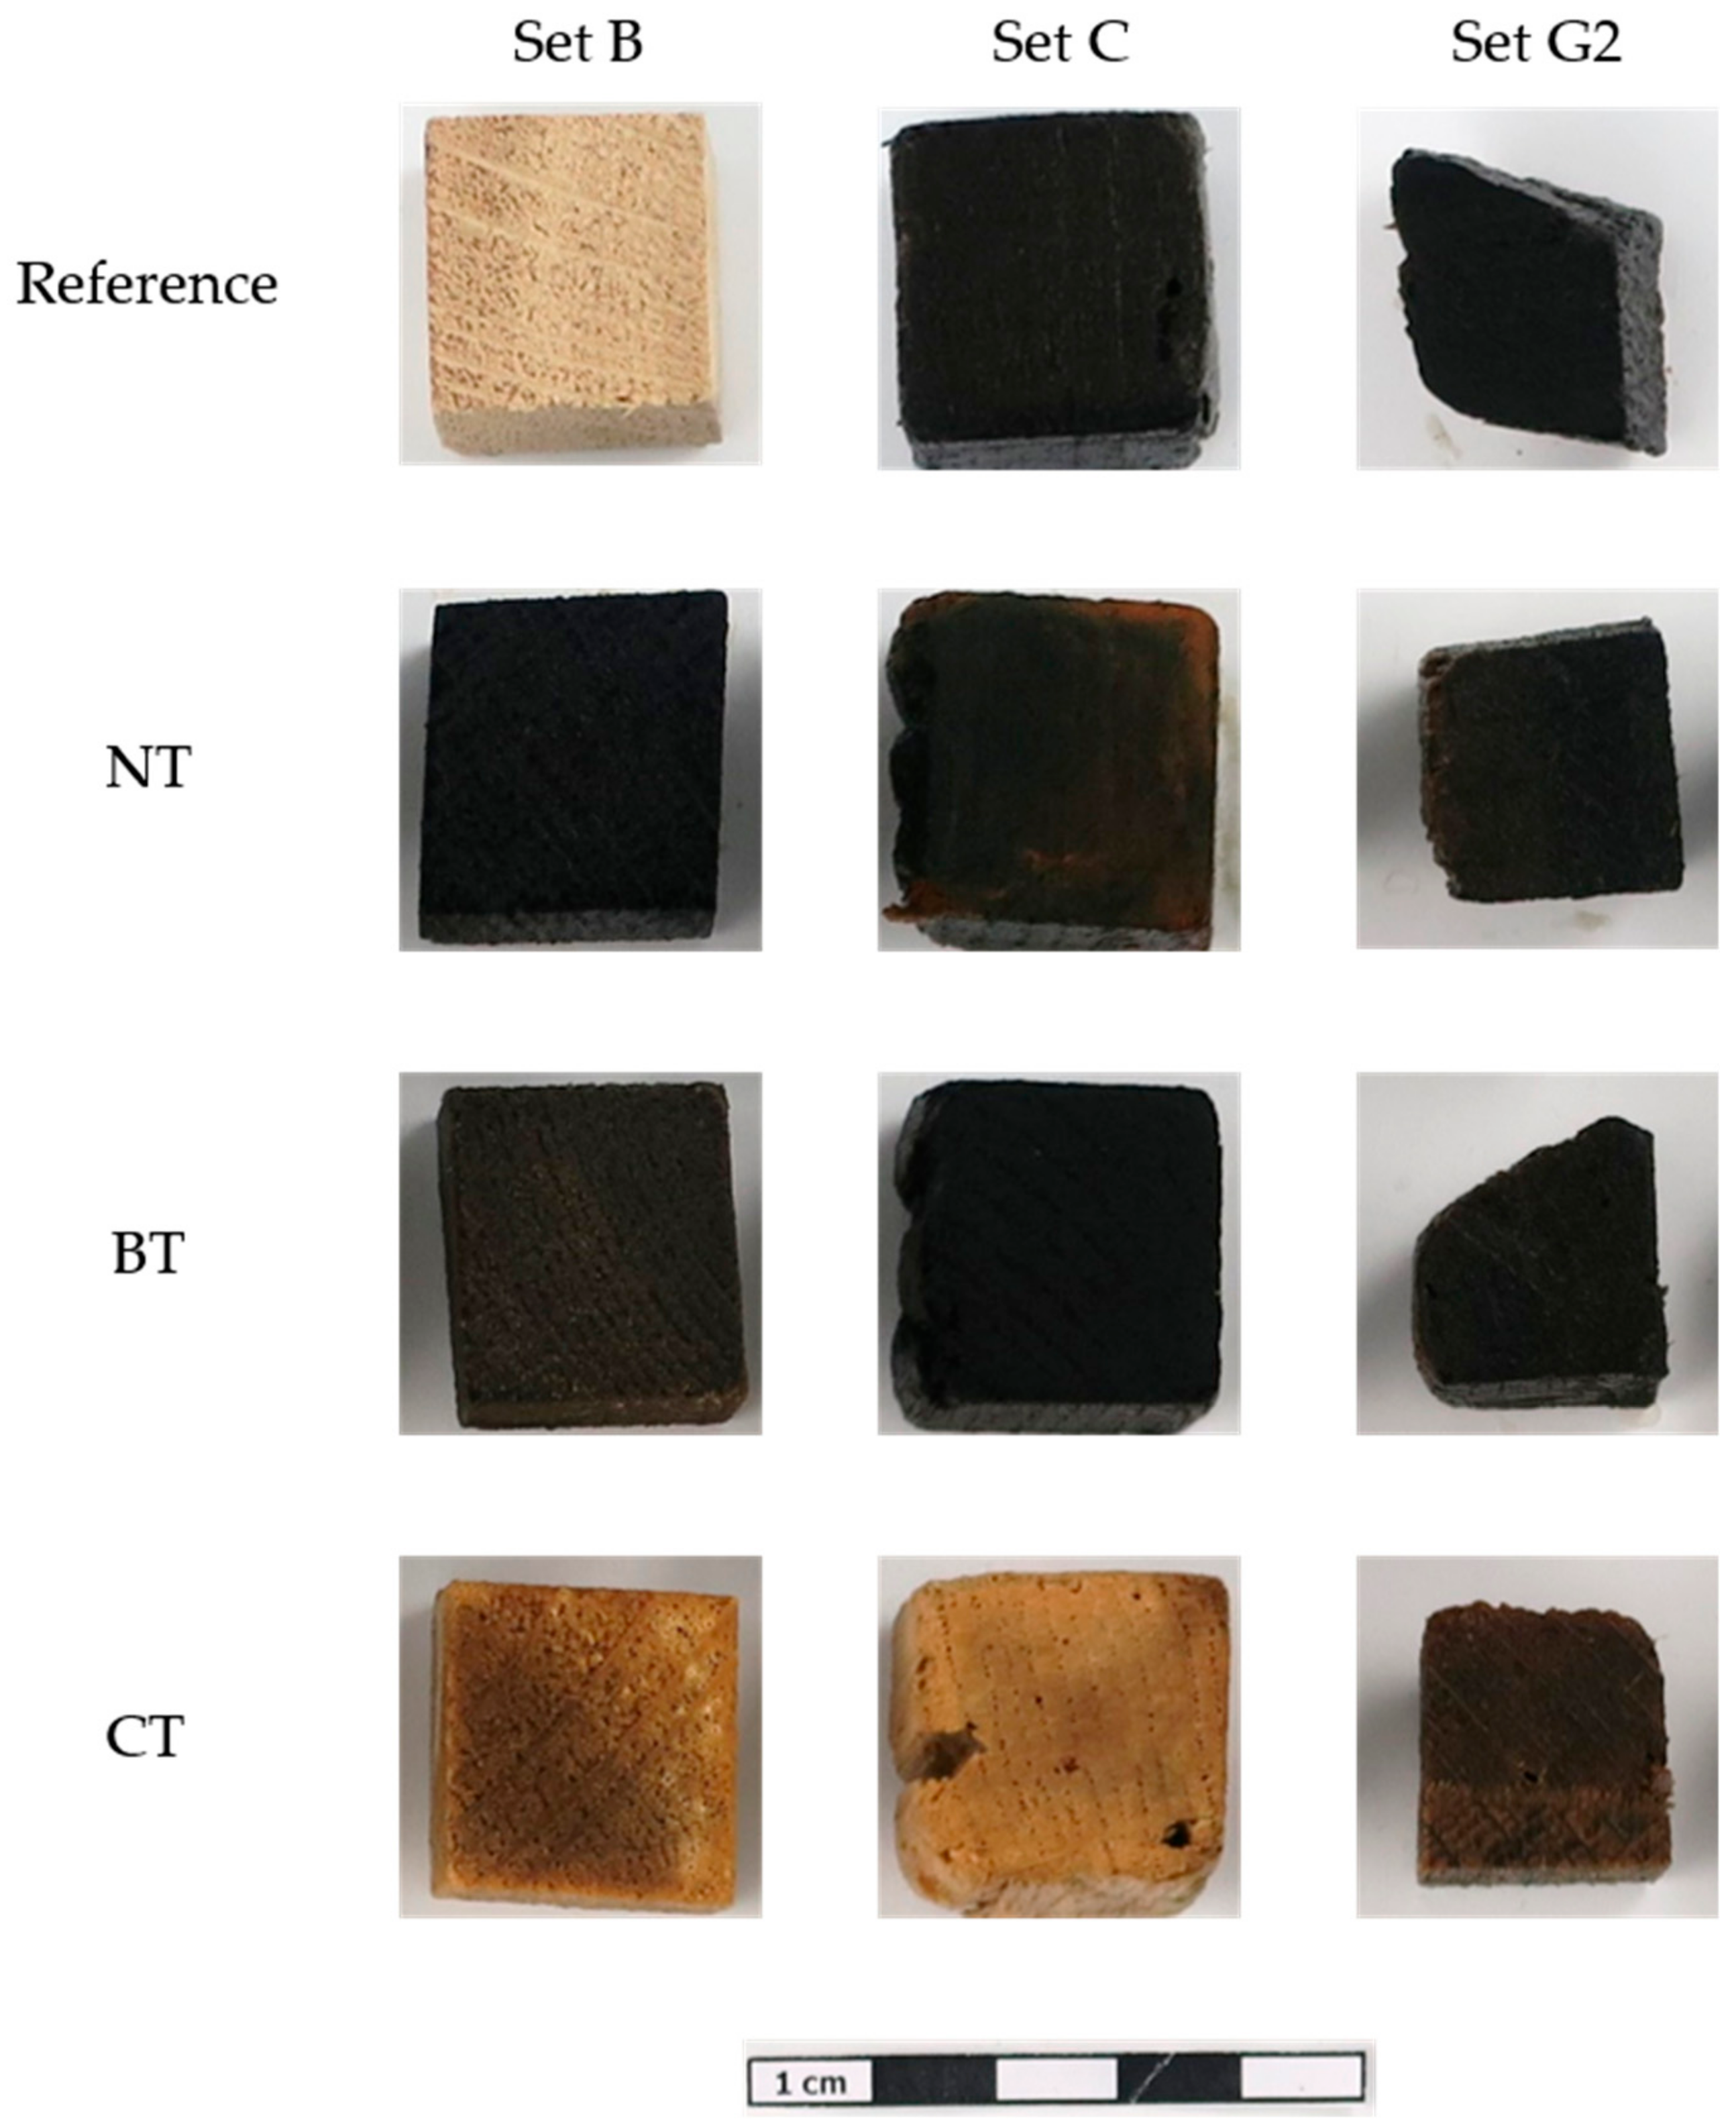
2.1. Wood Samples
2.2. Extraction Methods
2.2.1. Biological Extraction
2.2.2. Chemical Extraction
2.3. Analytical Protocol
2.3.1. ATR-FTIR Spectroscopy
2.3.2. Raman Spectroscopy
2.4. Statistic Approach
3. Results
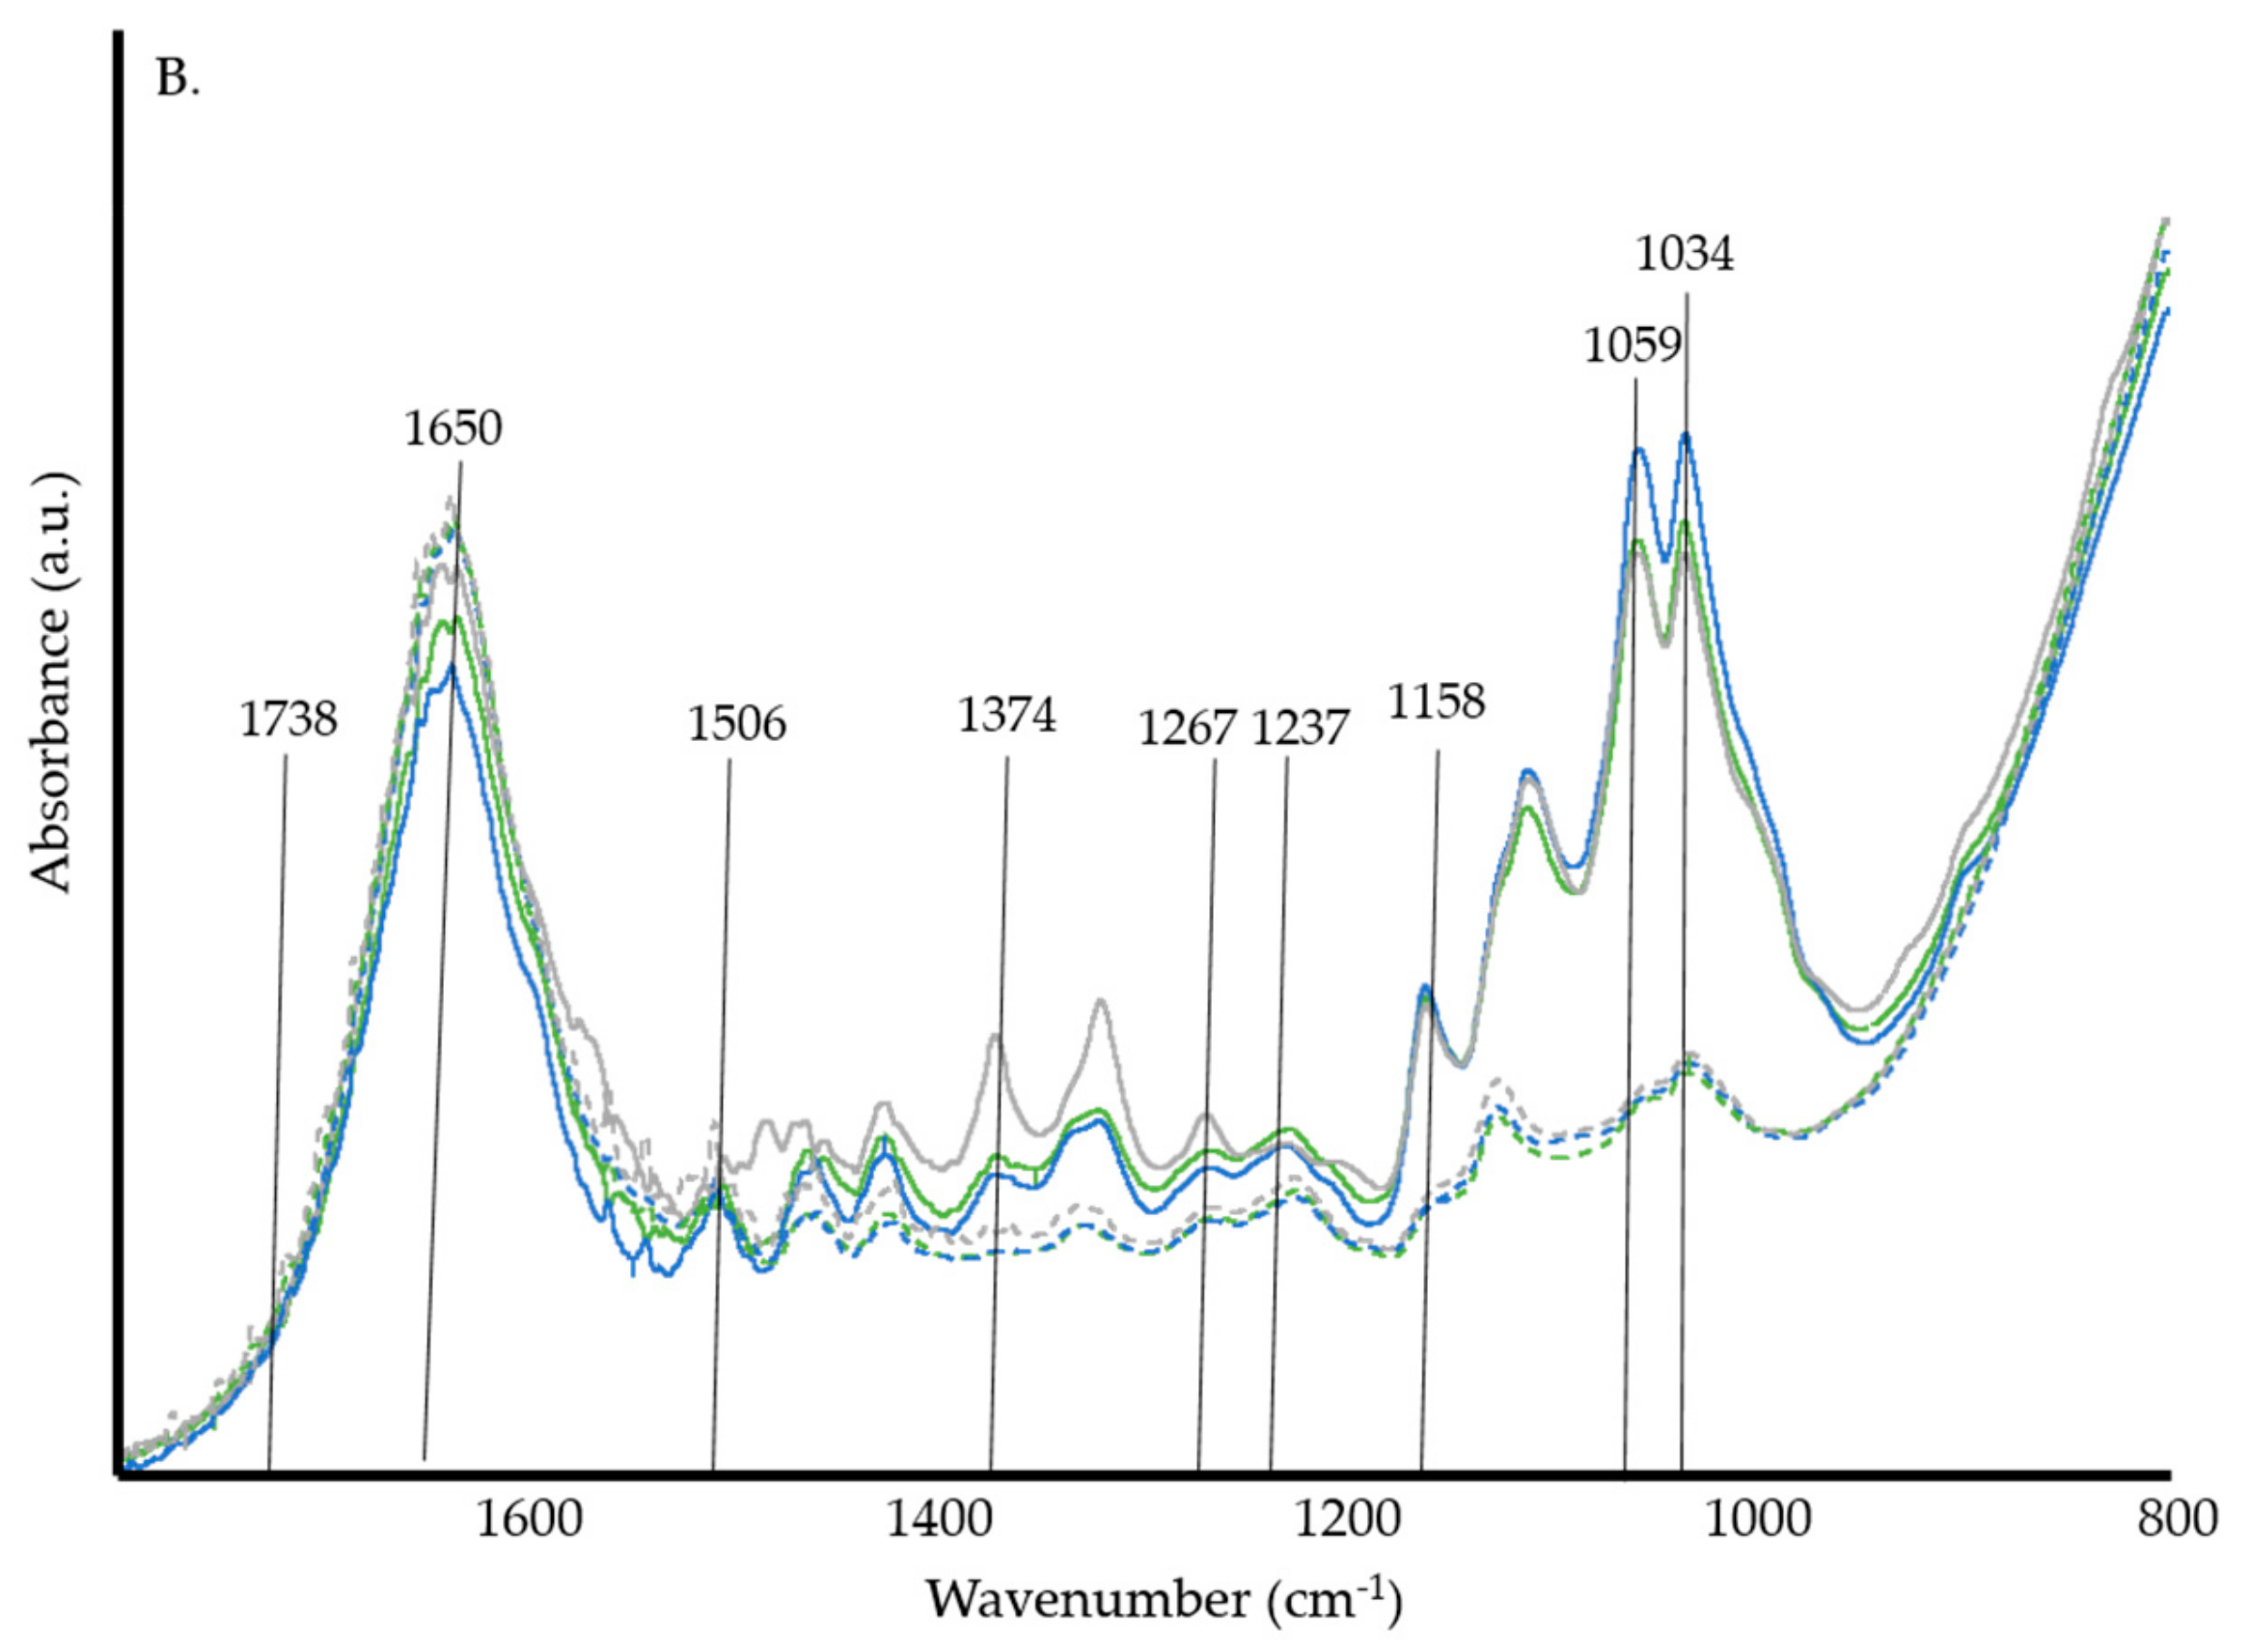
3.1. ATR-FTIR Spectrosocpy
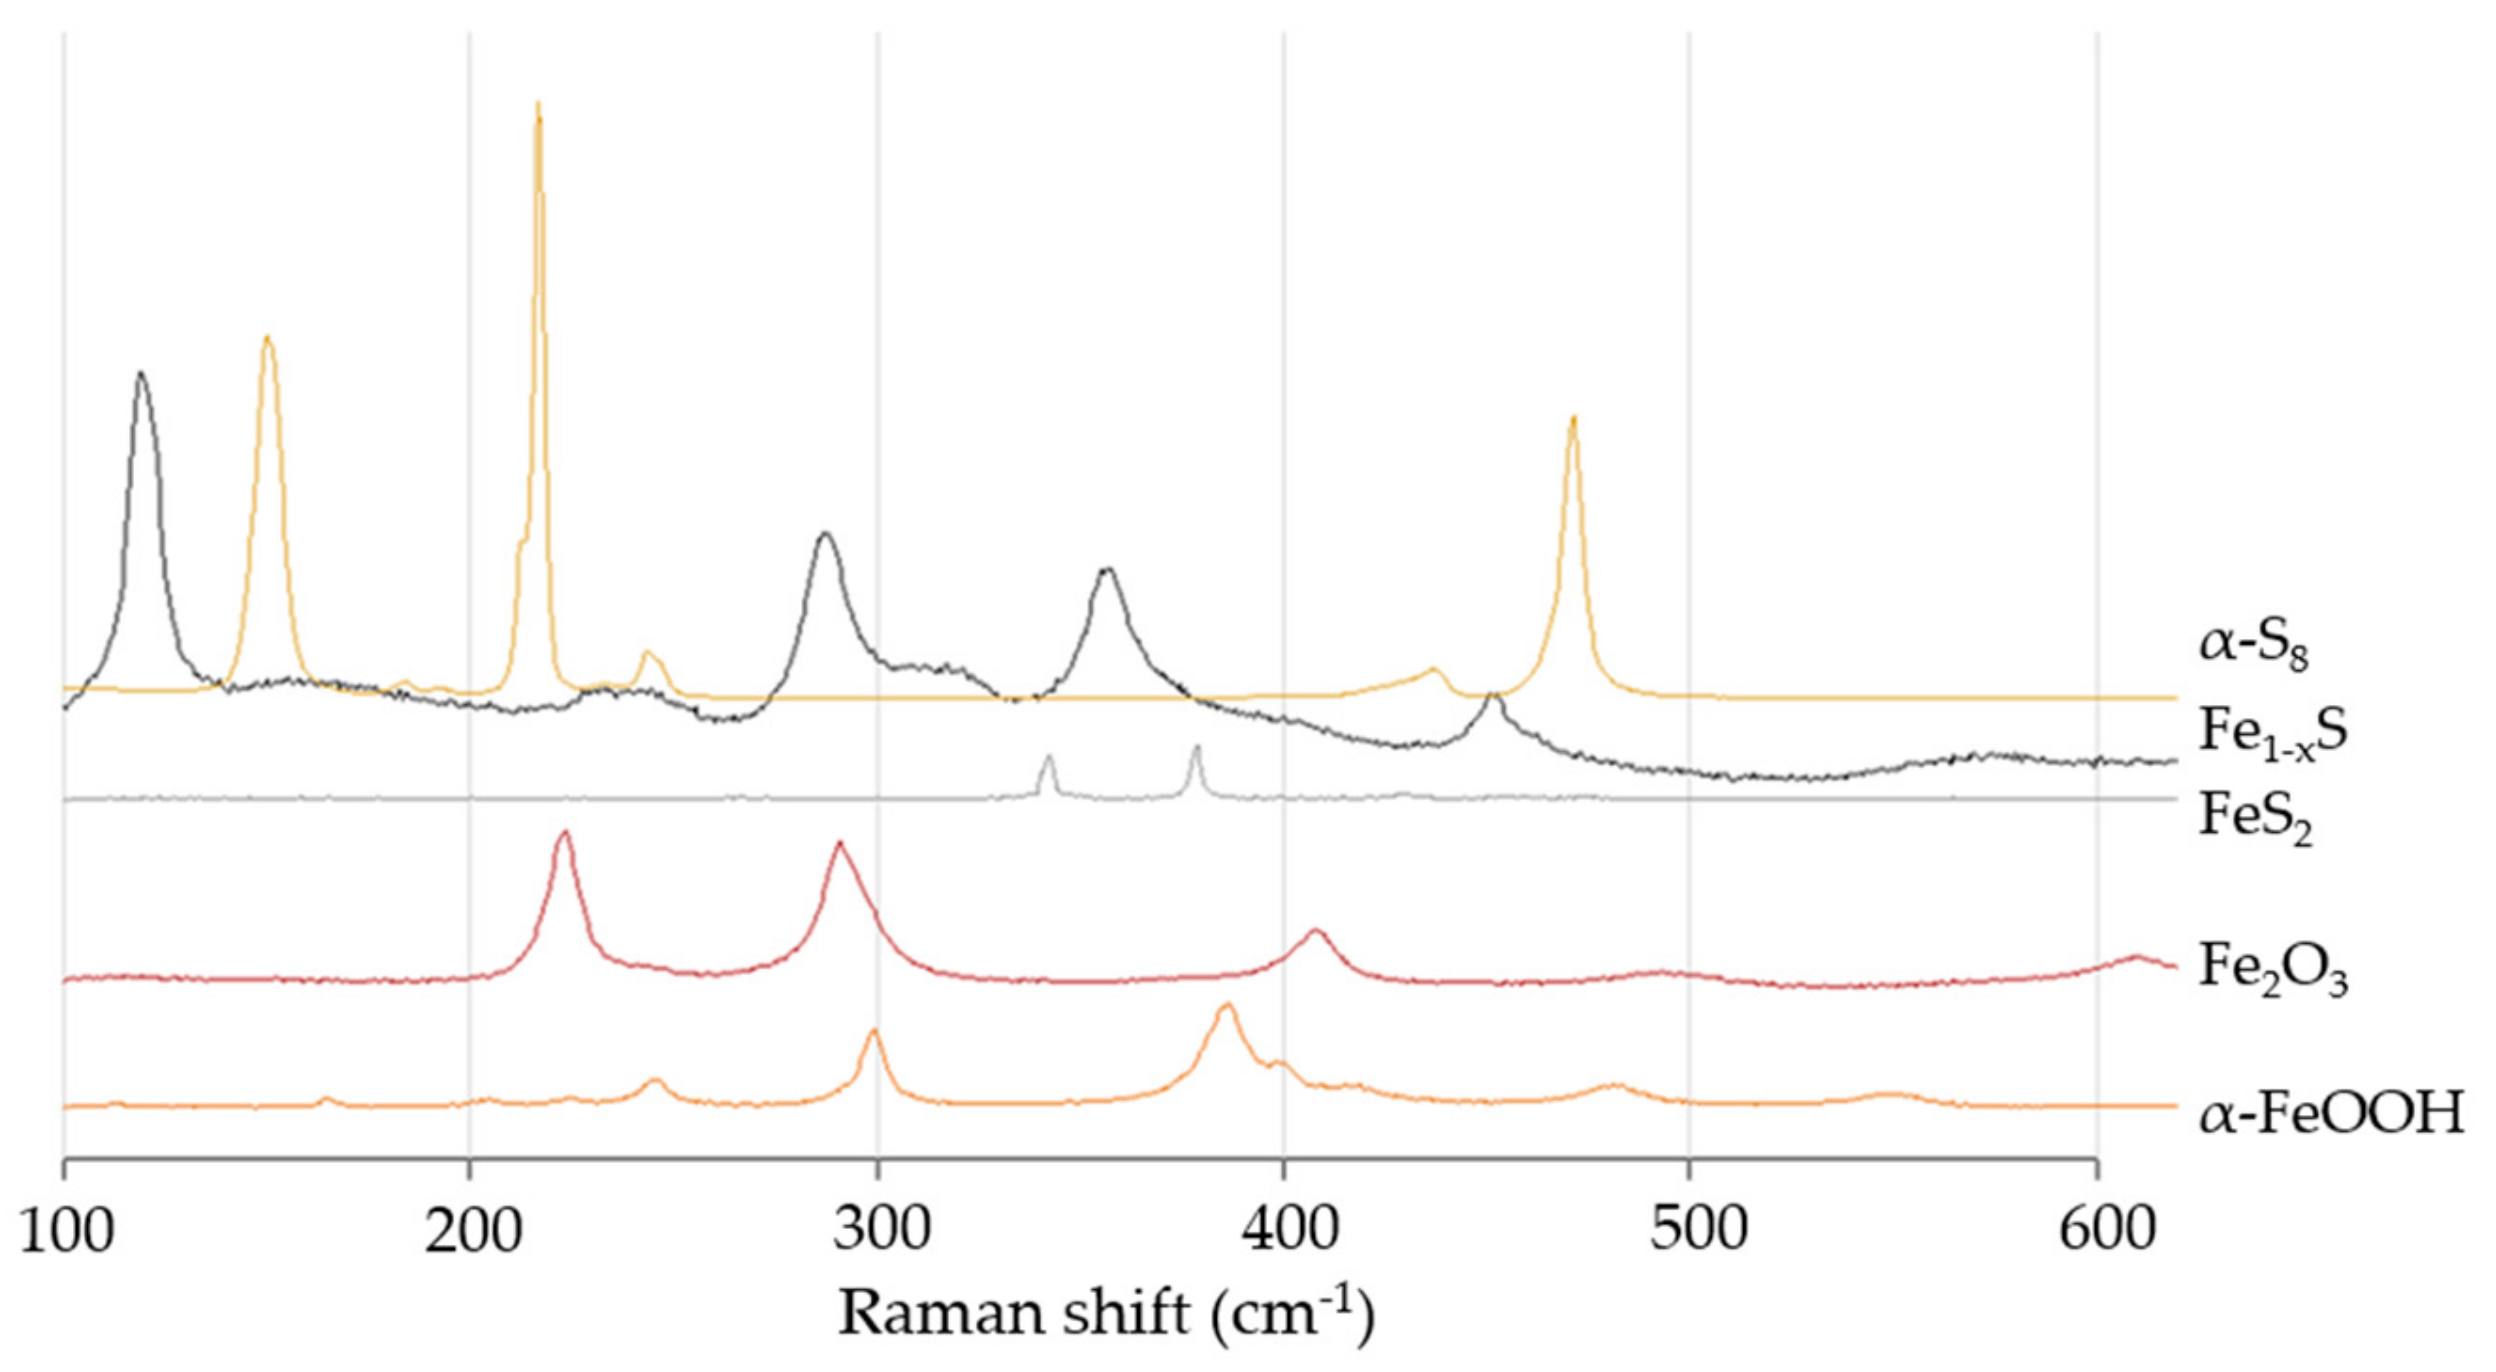
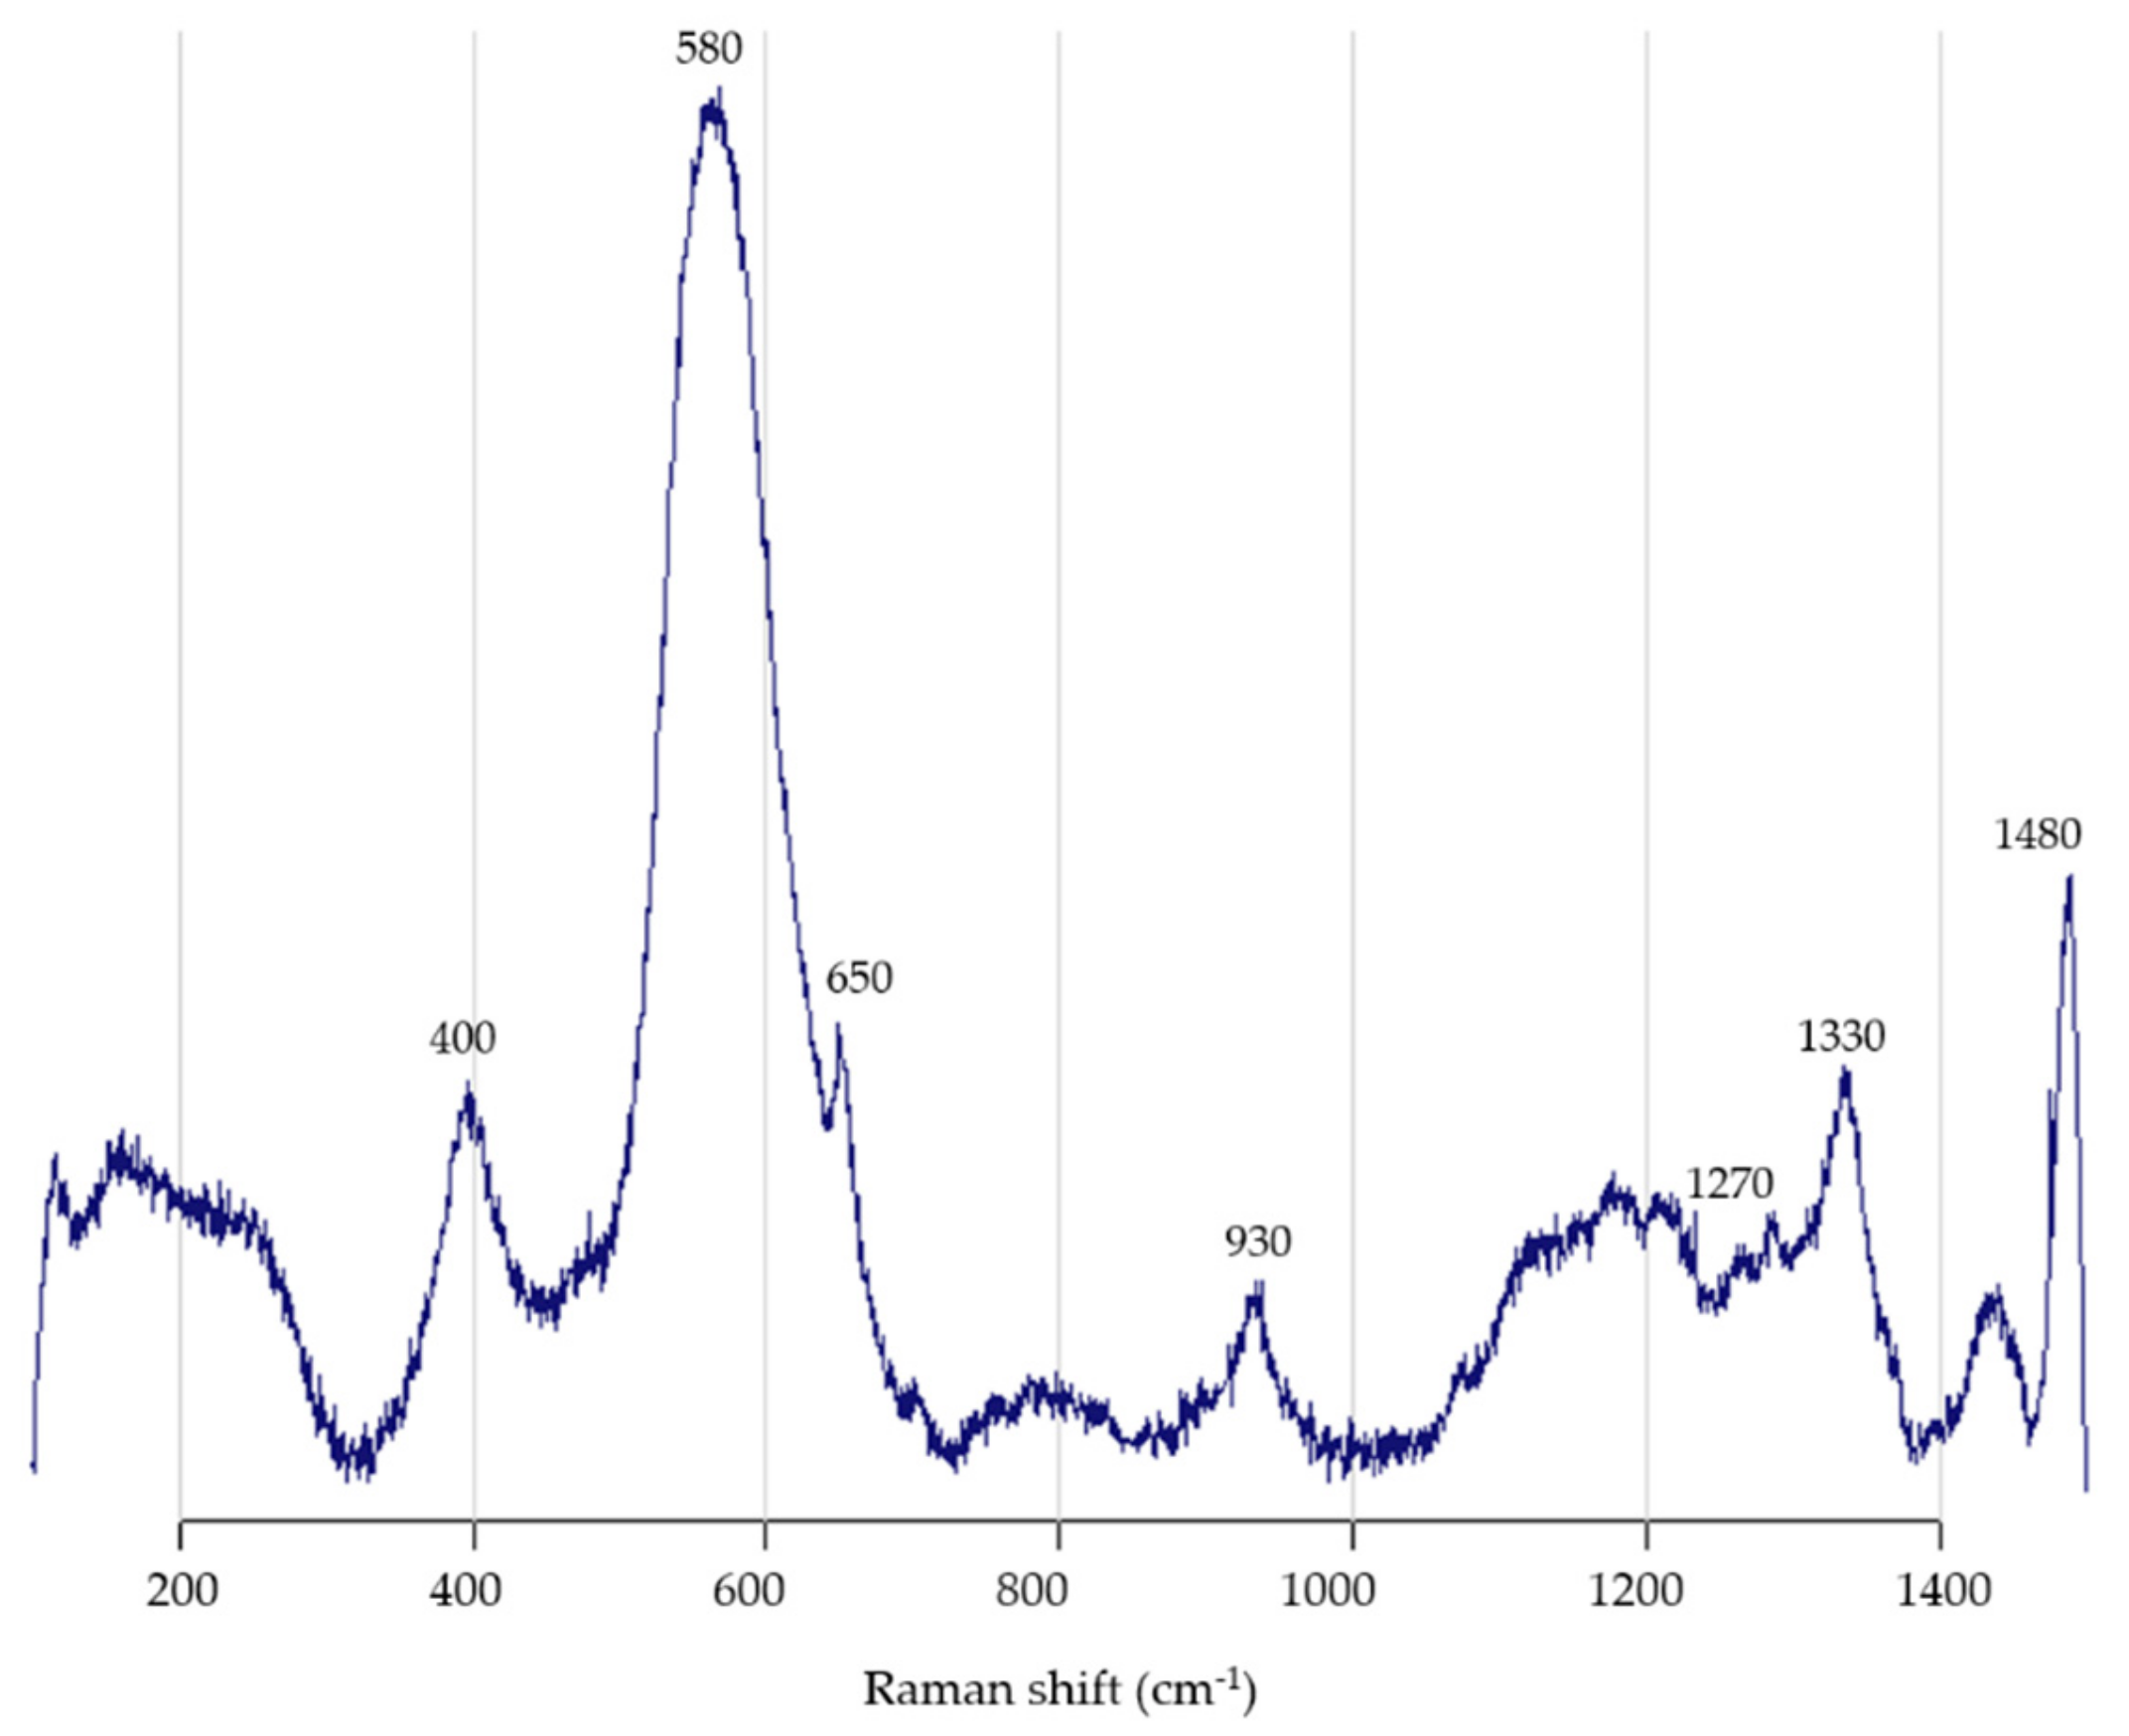
3.2. Raman Spectroscopy
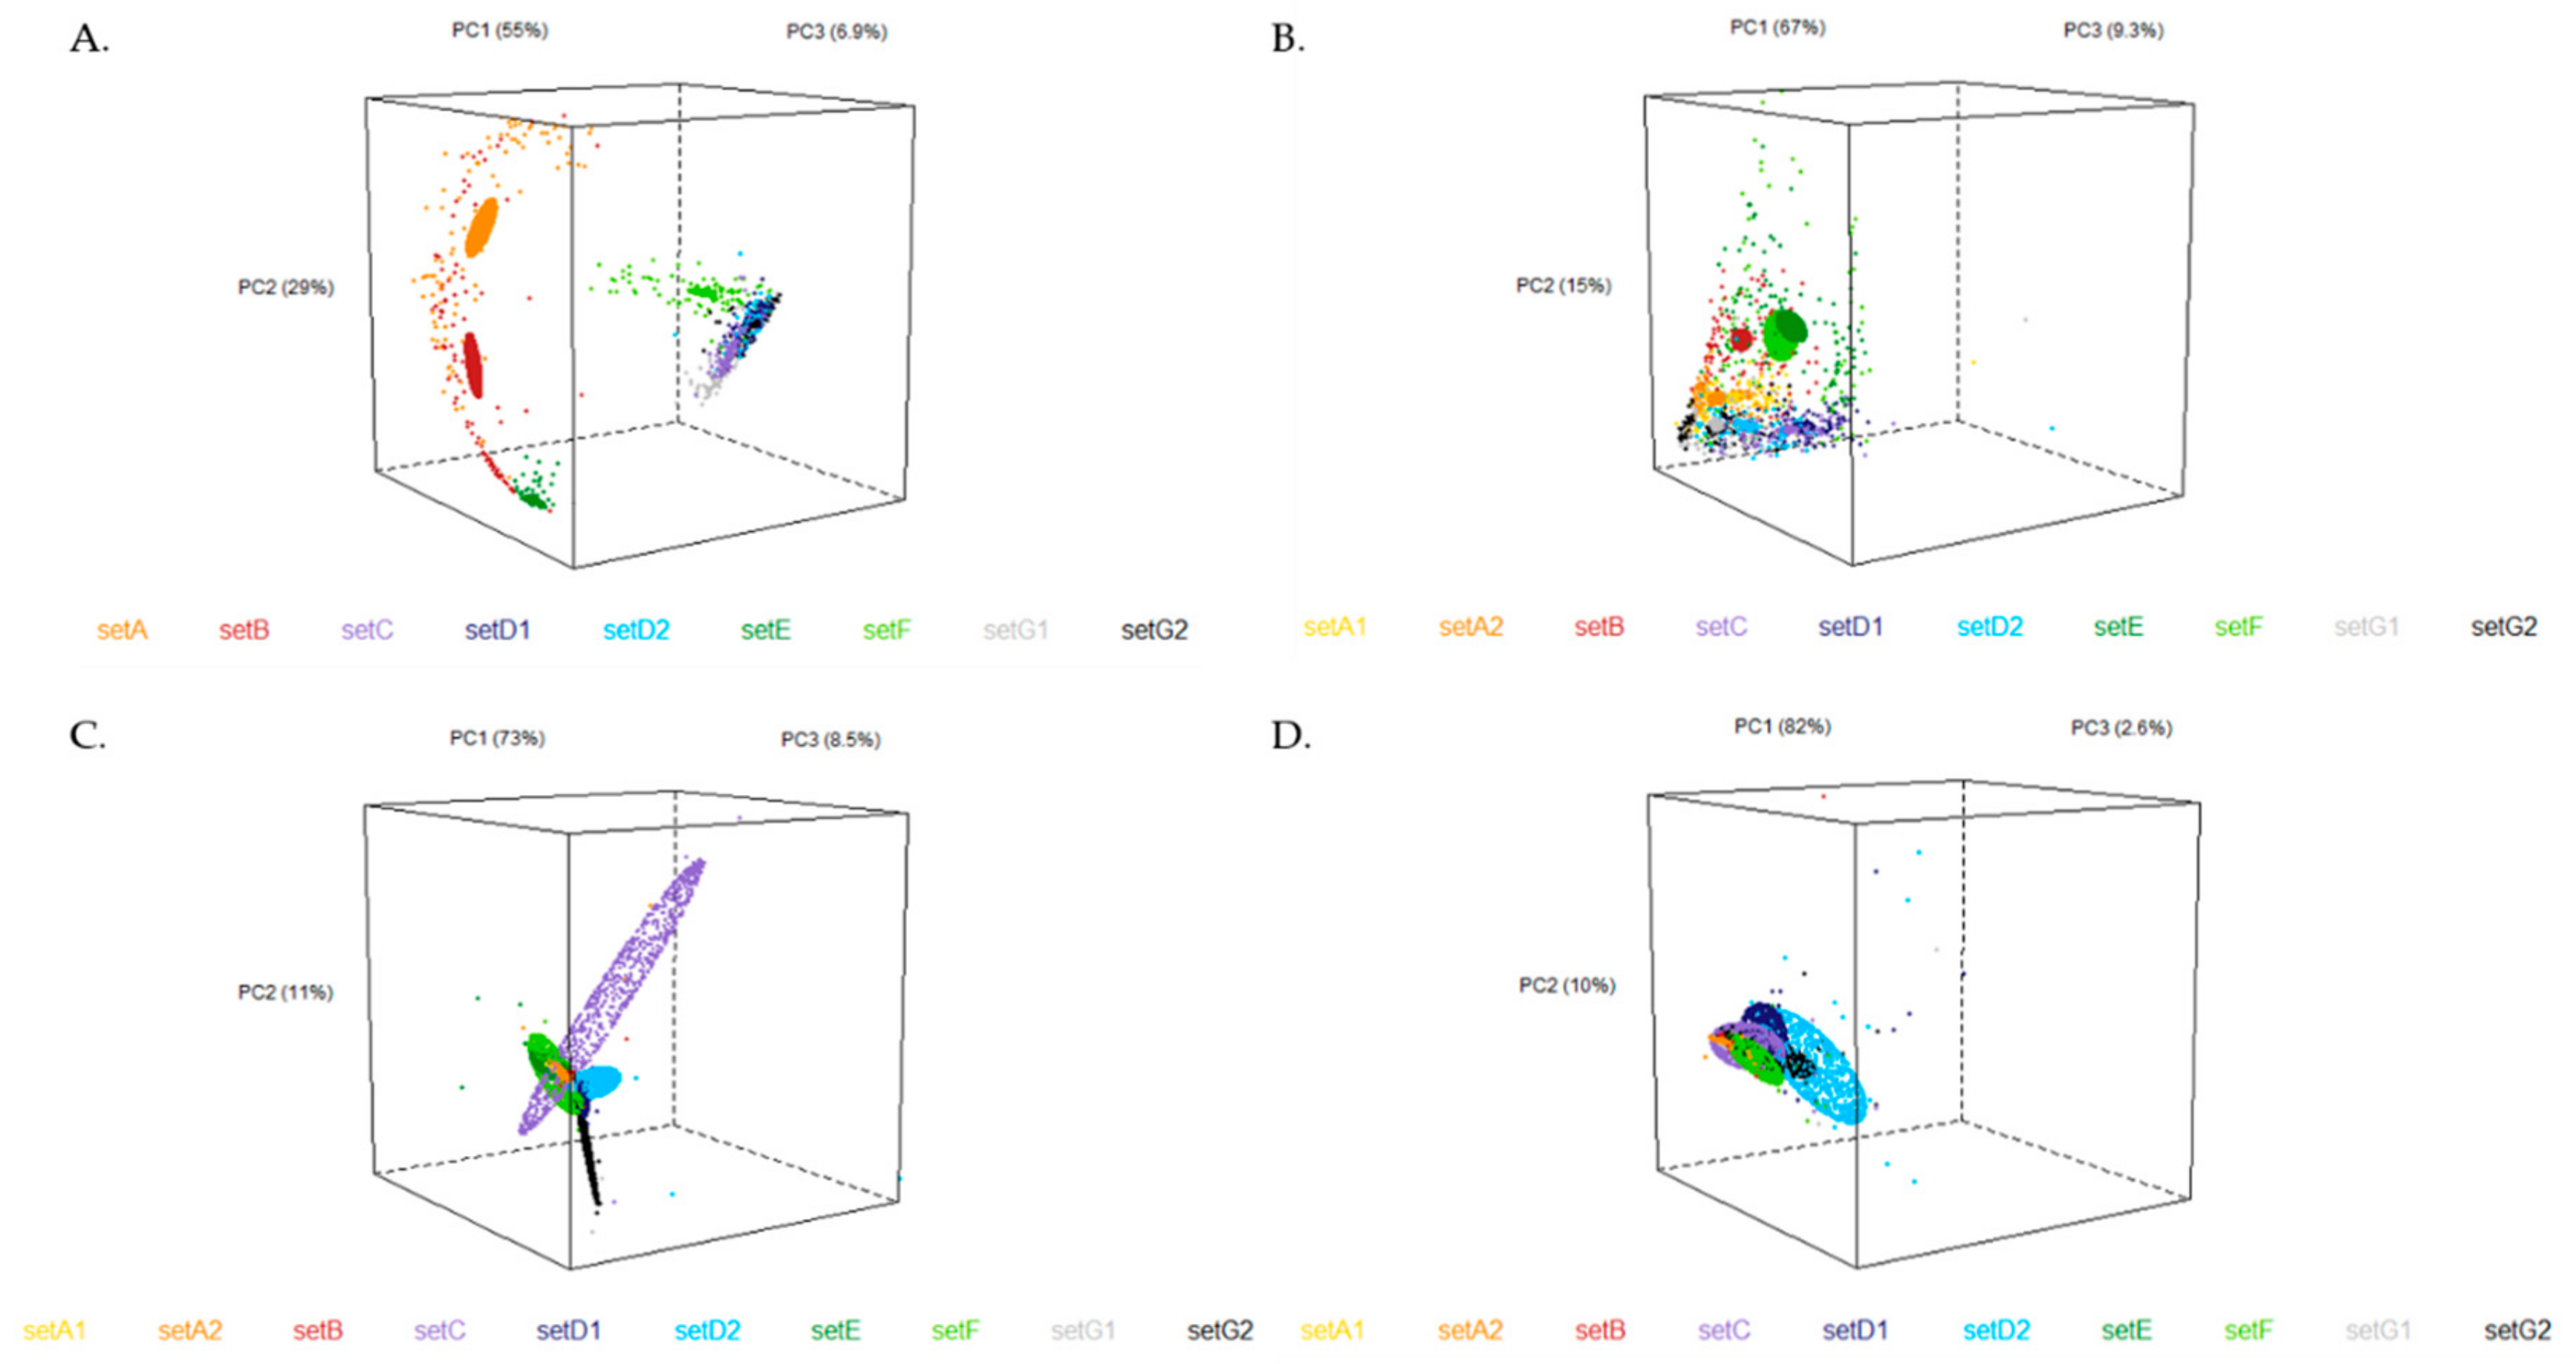
3.3. Chemometrics
4. Discussion
4.1. ATR-FTIR Spectroscopy
4.2. Raman Spectroscopy
4.3. Application to Real Artefacts
5. Conclusions
Author Contributions
Funding
Acknowledgments
Conflicts of Interest
References
- Björdal, C.G.; Daniel, G.; Nilsson, T. Depth of burial, an important factor in controlling bacterial decay of waterlogged archaeological poles. Int. Biodeterior. Biodegrad. 2000, 45, 15–26. [Google Scholar] [CrossRef]
- Björdal, C.G.; Nilsson, T. Reburial of shipwrecks in marine sediments: a long-term study on wood degradation. J. Archaeol. Sci. 2008, 35, 862–872. [Google Scholar] [CrossRef]
- Björdal, C.G.; Nilsson, T.; Daniel, G. Microbial decay of waterlogged archaeological wood found in Sweden. Applicable to archaeology and conservation. Int. Biodeterior. Biodegrad. 1999, 43, 63–73. [Google Scholar] [CrossRef]
- Fors, Y.; Richards, V. The effects of the ammonia neutralizing treatment on marine archaeological Vasa wood. Stud. Conserv. 2010, 55, 41–54. [Google Scholar] [CrossRef] [Green Version]
- Fors, Y.; Sandström, M. Sulfur and iron in shipwrecks cause conservation concerns. Chem. Soc. Rev. 2006, 35, 399–415. [Google Scholar] [CrossRef]
- Fors, Y.; Nilsson, T.; Risberg, E.D.; Sandström, M.; Torssander, P. Sulfur accumulation in pinewood (Pinus sylvestris) induced by bacteria in a simulated seabed environment: Implications for marine archaeological wood and fossil fuels. Int. Biodeterior. Biodegrad. 2008, 62, 336–347. [Google Scholar] [CrossRef]
- Singh, A.P.; Butcher, J.A. Bacterial degradation of wood cell walls: A review of degradation patterns. J. Inst. Wood Sci. 1991, 12, 143–157. [Google Scholar]
- Sørensen, J.; Christensen, D.; Jørgensen, B.B. Volatile Fatty acids and hydrogen as substrates for sulfate-reducing bacteria in anaerobic marine sediment. Appl. Environ. Microbiol. 1981, 42, 5–11. [Google Scholar] [CrossRef] [Green Version]
- Rémazeilles, C.; Saheb, M.; Neff, D.; Guilminot, E.; Tran, K.; Bourdoiseau, J.A.; Sabot, R.; Jeannin, M.; Matthiesen, H.; Dillmann, P.; et al. Microbiologically influenced corrosion of archaeological artefacts: Characterisation of iron (II) sulfides by Raman spectroscopy. J. Raman Spectrosc. 2010, 41, 1425–1433. [Google Scholar] [CrossRef]
- Rémazeilles, C.; Tran, K.; Guilminot, E.; Conforto, E.; Refait, P. Study of Fe (II) sulphides in waterlogged archaeological wood. Stud. Conserv. 2013, 58, 297–307. [Google Scholar] [CrossRef]
- Wetherall, K.M.; Moss, R.M.; Jones, A.M.; Smith, A.D.; Skinner, T.; Pickup, D.M.; Goatham, S.W.; Chadwick, A.V.; Newport, R.J. Sulfur and iron speciation in recently recovered timbers of the Mary Rose revealed via X-ray absorption spectroscopy. J. Archaeol. Sci. 2008, 35, 1317–1328. [Google Scholar] [CrossRef]
- Preston, J.; Smith, A.D.; Schofield, E.J.; Chadwick, A.V.; Jones, M.A.; Watts, J.E.M. The effects of Mary Rose conservation treatment on iron oxidation processes and microbial communities contributing to acid production in marine archaeological timbers. PLoS One 2014, 9. [Google Scholar] [CrossRef] [PubMed] [Green Version]
- Almkvist, G.; Norbakhsh, S.; Bjurhager, I.; Varmuza, K. Prediction of tensile strength in iron-contaminated archaeological wood by FT-IR spectroscopy-a study of degradation in recent oak and Vasa oak. Holzforschung 2016, 70, 855–865. [Google Scholar] [CrossRef]
- Berenguer, M.A.; Monachon, M.; Jacquet, C.; Junier, P.; Rémazeilles, C.; Schofield, E.J.; Joseph, E. Biological oxidation of sulfur compounds in artificially degraded wood. Int. Biodeterior. Biodegradation 2019, 141, 62–70. [Google Scholar] [CrossRef]
- Sandström, M.; Jalilehvand, F.; Damian, E.; Fors, Y.; Gelius, U.; Jones, M.; Salomé, M. Sulfur accumulation in the timbers of King Henry VIII’s warship Mary Rose: A pathway in the sulfur cycle of conservation concern. Proc. Natl. Acad. Sci. USA 2005, 102, 14165–14170. [Google Scholar] [CrossRef] [Green Version]
- Almkvist, G.; Persson, I. Extraction of iron compounds from wood from the Vasa. Holzforschung 2006, 60, 678–684. [Google Scholar] [CrossRef]
- Junier, P.; Joseph, E. Microbial biotechnology approaches to mitigating the deterioration of construction and heritage materials. Microb. Biotechnol. 2017, 10, 1145–1148. [Google Scholar] [CrossRef]
- Joseph, E.; Junier, P. Metabolic processes applied to endangered metal and wood heritage objects: Call a microbial plumber! N. Biotechnol. 2019. [Google Scholar] [CrossRef]
- Albini, M.; Letardi, P.; Mathys, L.; Brambilla, L.; Schröter, J.; Junier, P.; Joseph, E. Comparison of a bio-based corrosion inhibitor versus benzotriazole on corroded copper surfaces. Corros. Sci. 2018, 143, 84–92. [Google Scholar] [CrossRef]
- Tran, K.; Bertout, N.; Dalard, F.; Magnin, J.P. Trials on chemical and microbiological processes for the oxidation of sulphur compounds in archaeological wood. In Proceedings of the 9th ICOM Group on Wet Organic Archaeological Materials Conference, Copenhagen, Denmark, 7–11 June 2004; pp. 227–241. [Google Scholar]
- Bosch, J.; Lee, K.Y.; Jordan, G.; Kim, K.W.; Meckenstock, R.U. Anaerobic, nitrate-dependent oxidation of pyrite nanoparticles by thiobacillus denitrificans. Environ. Sci. Technol. 2012, 46, 2095–2101. [Google Scholar] [CrossRef]
- Albelda-Berenguer, M.; Monachon, M.; Joseph, E. Siderophores: From natural roles to potential applications. Adv. Appl. Microbiol. 2019, 106, 193. [Google Scholar] [PubMed]
- Neilands, J.B. Siderophores: structure and function of microbial iron transport compounds. J. Biol. Chem. 1995, 270, 26723–26726. [Google Scholar] [CrossRef] [Green Version]
- Rapti, S.; Rivers, S.; Pournou, A. Removing iron corrosion products from museum artefacts: Investigating the effectiveness of innovative green chelators. In Proceedings of the International Conference “Science in Technology”, SCinTE, Athens, Greece, 5–7 November 2015. [Google Scholar]
- Homann, V.V.; Edwards, K.J.; Webb, E.A.; Butler, A. Siderophores of Marinobacter aquaeolei: Petrobactin and its sulfonated derivatives. BioMetals 2009, 22, 565–571. [Google Scholar] [CrossRef] [PubMed] [Green Version]
- Pelé, C.; Guilminot, E.; Labroche, S.; Lemoine, G.; Baron, G. Iron removal from waterlogged wood: Extraction by electrophoresis and chemical treatments. Stud. Conserv. 2013, 0, 1–17. [Google Scholar] [CrossRef]
- Sandak, A.; Sandak, J.; Babiński, L.; Pauliny, D.; Riggio, M. Spectral analysis of changes to pine and oak wood natural polymers after short-term waterlogging. Polym. Degrad. Stab. 2014, 99, 68–79. [Google Scholar] [CrossRef]
- Norbakhsh, S.; Bjurhager, I.; Almkvist, G. Impact of iron (II) and oxygen on degradation of oak—Modeling of the Vasa wood. Holzforschung 2014, 68, 649–655. [Google Scholar] [CrossRef]
- Odegaard, N.; Carroll, S.; Zimmt, W.S. Material Characterization Tests for Objects of Art and Archaeology, 2nd ed.; Archetype Publications Ltd.: London, UK, 2000. [Google Scholar]
- Giachi, G.; Guidotti, M.C.; Lazzeri, S.; Sozzi, L.; Macchioni, N. Wood identification of the headrests from the collection of the Egyptian Museum in Florence. J. Archaeol. Sci. Rep. 2016, 9, 340–346. [Google Scholar] [CrossRef]
- Dobrică, I.; Bugheanu, P.; Stănculescu, I.; Ponta, C. FT-IR spectral data of wood used in Romanian. Analele Univ. din Bucuresti 2008, I, 33–37. [Google Scholar]
- Bourdoiseau, J.A.; Jeannin, M.; Sabot, R.; Rémazeilles, C.; Refait, P. Characterisation of mackinawite by Raman spectroscopy: Effects of crystallisation, drying and oxidation. Corros. Sci. 2008, 50, 3247–3255. [Google Scholar] [CrossRef]
- Schwertmann, U. Solubility and dissolution of iron oxides. Iron Nutr. Interact. Plants 1991, 130, 1–25. [Google Scholar]
- Pandey, K.K.; Theagar, K.S. Analysis of wood surfaces and ground wood by diffuse reflectance (DRIFT) and photoacoustic (PAS) Fourier transform infrared spectroscopic techniques. Holz als Roh-und Werkst 1997, 55, 383–390. [Google Scholar] [CrossRef]
- Pandey, K.K.; Nagveni, H.C. Rapid characterisation of brown and white rot degraded chir pine and rubberwood by FTIR spectroscopy. Holz als Roh-und Werkst. 2007, 65, 477–481. [Google Scholar] [CrossRef]
- Bouchard, M.; Smith, D.C. Catalogue of 45 reference Raman spectra of minerals concerning research in art history or archaeology, especially on corroded metals and coloured glass. Spectrochim. Acta–Part A Mol. Biomol. Spectrosc. 2003, 59, 2247–2266. [Google Scholar] [CrossRef]
- Agarwal, U.P.; Ralph, S.A. FT-Raman spectroscopy of wood: Identifying contributions of lignin and carbohydrate polymers in the spectrum of black spruce (Picea mariana). Appl. Spectrosc. 1997, 51, 1648–1655. [Google Scholar] [CrossRef]
- Giachi, G.; Capretti, C.; Macchioni, N.; Pizzo, B.; Donato, I.D. A methodological approach in the evaluation of the efficacy of treatments for the dimensional stabilisation of waterlogged archaeological wood. J. Cult. Herit. 2010, 11, 91–101. [Google Scholar] [CrossRef]
- Schweingruber, F.H. Microscopic Wood Anatomy; Swiss Federal Institute of Forestry Research: Birmensdorf, Switzerland, 1978. [Google Scholar]
- Paaver, U.; Matto, V.; Raal, A. Total tannin content in distinct Quercus robur L. galls. J. Med Plants Res. 2010, 4, 702–705. [Google Scholar]
- Sand, W.; Gehrke, T.; Jozsa, P.-G.; Schippers, A. (Bio)chemistry of bacterial leaching—Direct vs. indirect bioleaching. Hydrometallurgy 2001, 59, 159–175. [Google Scholar] [CrossRef]
- Brandl, H. Microbial leaching of metals. In Proceeding of the Biotechnology Set; Wiley-VCH Verlag GmbH: Weinheim, Germany, 2001; pp. 191–224. [Google Scholar]
- Sandström, M.; Jalilehvand, F.; Persson, I.; Gelius, U.; Frank, P.; Hall-Roth, I. Deterioration of the seventeenth-century warship Vasa by internal formation of sulphuric acid. Nature 2002, 415, 893–897. [Google Scholar] [CrossRef]
- Kelly, D.P.; Wood, A.P. Confirmation of \emph{{T}hiobacillus denitrificans} as a species of the genus \emph{{T}hiobacillus}, in the β-subclass of the \emph{{P}roteobacteria}, with strain {NCIMB} 9548 as the type strain. Int. J. Syst. Evol. Microbiol. 2000, 50, 547–550. [Google Scholar] [CrossRef]
- Wiedenhoeft, A.C.; Miller, R.B. 2. Structure and Function of Wood. Handb. Wood Chem. Wood Compos. 2005, 2, 9–33. [Google Scholar]
- Gardner, D.J. Wood surface properties. Wood Struct. Prop. 2002, 2, 87–89. [Google Scholar]
- McQueen, C.M.; Tamburini, D.; Łucejko, J.J.; Braovac, S.; Gambineri, F.; Modugno, F.; Colombini, M.P.; Kutzke, H. New insights into the degradation processes and influence of the conservation treatment in alum-treated wood from the Oseberg collection. Microchem. J. 2017, 132, 119–129. [Google Scholar] [CrossRef] [Green Version]
- Tamburini, D.; Łucejko, J.J.; Modugno, F.; Colombini, M.P. Characterisation of archaeological waterlogged wood from Herculaneum by pyrolysis and mass spectrometry. Int. Biodeterior. Biodegradation 2014, 86, 142–149. [Google Scholar] [CrossRef]
- Ramseyer, D. Archaeology and waterlogged wood. Museum Int. 1983, 39, 18–25. [Google Scholar] [CrossRef]
- Caillat, L.; Meunier, L. Regeneration of PEG solutions used for waterlogged wood consolidation. In Proceedings of the 13th ICOM-CC Group on Wet Organic Archaeological Materials Conference, Florence, Italy, 16–21 May 2016; pp. 305–320. [Google Scholar]


| Set Name | Wood Species | Wood Type | Artificially Contaminated | Wood Origin |
|---|---|---|---|---|
| A1 | Balsa | Fresh | Yes | Commercial |
| A2 | Balsa | Fresh | Yes | Commercial |
| B | Oak | Fresh | Yes | Carpenter |
| C | Oak | Archaeologic | Yes | ADB |
| D1 | Oak | Archaeologic | No | ADB |
| D2 | Oak | Archaeologic | No | SNM |
| E | Pine | Fresh | Yes | Carpenter |
| F | Pine | Archaeologic | Yes | ADB |
| G1 | Pine | Archaeologic | No | ADB |
| G2 | Oak | Archaeologic | No | SNM |
| Set Name | Extraction Method | R1 (H/L) | R2 (C/L) | R3 (H/L) |
|---|---|---|---|---|
| Fresh balsa | - | 1.16 (±0.05) | 1.07 (±0.03) | 1.65 (±0.24) |
| Fresh oak | - | 1.08 (±0.04) | 1.01 (±0.03) | 1.55 (±0.20) |
| Fresh pine | - | 1.05 (±0.01) | 1.00 (±0.00) | 1.21 (±0.04) |
| A1 | BT | 0.91 (±0.03) | 0.94 (±0.01) | 1.05 (±0.07) |
| CT | 0.93 (±0.02) | 0.94 (±0.00) | 1.10 (±0.07) | |
| NT | 0.88 (±0.02) | 0.93 (±0.01) | 0.97 (±0.05) | |
| A2 | BT | 0.93 (±0.02) | 0.94 (±0.01) | 1.07 (±0.07) |
| CT | 0.92 (±0.03) | 0.95 (±0.01) | 1.07 (±0.07) | |
| NT | 0.89 (±0.02) | 0.94 (±0.01) | 0.99 (±0.05) | |
| B | BT | 0.95 (±0.04) | 0.94 (±0.01) | 1.21 (±0.13) |
| CT | 0.98 (±0.03) | 0.94 (±0.01) | 1.30 (±0.11) | |
| NT | 0.92 (±0.04) | 0.98 (±0.03) | 1.17 (±0.11) | |
| C | BT | 0.87 (±0.01) | 0.91 (±0.01) | 0.95 (±0.03) |
| CT | 0.85 (±0.01) | 0.91 (±0.01) | 0.90 (±0.03) | |
| NT | 0.90 (±0.01) | 0.92 (±0.01) | 0.99 (±0.03) | |
| D1 | BT | 0.89 (±0.02) | 0.91 (±0.01) | 0.98 (±0.03) |
| CT | 0.88 (±0.03) | 0.91 (±0.01) | 0.95 (±0.08) | |
| NT | 0.90 (±0.01) | 0.92 (±0.01) | 1.01 (±0.03) | |
| D2 | BT | 0.86 (±0.01) | 0.91 (±0.01) | 0.94 (±0.03) |
| CT | 0.87 (±0.06) | 0.92 (±0.03) | 0.96 (±0.12) | |
| NT | 0.85 (±0.02) | 0.92 (±0.00) | 0.91 (±0.04) | |
| E | BT | 1.01 (±0.06) | 0.97 (±0.02) | 1.47 (±0.20) |
| CT | 1.00 (±0.05) | 0.96 (±0.02) | 1.42 (±0.18) | |
| NT | 0.97 (±0.03) | 0.95 (±0.01) | 1.24 (±0.11) | |
| F | BT | 0.95 (±0.09) | 0.95 (±0.03) | 1.31 (±0.37) |
| CT | 0.98 (±0.09) | 0.96 (±0.03) | 1.37 (±0.34) | |
| NT | 0.98 (±0.06) | 0.95 (±0.02) | 1.27 (±0.26) | |
| G1 | BT | 0.85 (±0.02) | 0.92 (±0.01) | 0.93 (±0.07) |
| CT | 0.87 (±0.04) | 0.93 (±0.02) | 0.98 (±0.10) | |
| NT | 0.84 (±0.01) | 0.92 (±0.01) | 0.90 (±0.06) | |
| G2 | BT | 0.85 (±0.01) | 0.91 (±0.01) | 0.89 (±0.02) |
| CT | 0.88 (±0.03) | 0.91 (±0.01) | 0.95 (±0.09) | |
| NT | 0.83 (±0.00) | 0.92 (±0.01) | 0.84 (±0.03) |
| Set Name | Sulfur | Partially Oxidized Mackinawite | Wood Substrate |
|---|---|---|---|
| A1 | NT | NT | NT, BT, CT |
| A2 | CT | NT | NT, BT, CT |
| B | NT | NT, BT, CT | |
| C | CT | NT | NT, BT, CT |
| D1 | NT, BT, CT | ||
| D2 | NT, BT, CT | ||
| E | NT, CT | NT | NT, BT, CT |
| F | CT | NT | NT, BT, CT |
| G1 | NT, BT, CT | ||
| G2 | NT, BT, CT |
© 2020 by the authors. Licensee MDPI, Basel, Switzerland. This article is an open access article distributed under the terms and conditions of the Creative Commons Attribution (CC BY) license (http://creativecommons.org/licenses/by/4.0/).
Share and Cite
Monachon, M.; Albelda-Berenguer, M.; Lombardo, T.; Cornet, E.; Moll-Dau, F.; Schramm, J.; Schmidt-Ott, K.; Joseph, E. Evaluation of Bio-Based Extraction Methods by Spectroscopic Methods. Minerals 2020, 10, 203. https://doi.org/10.3390/min10020203
Monachon M, Albelda-Berenguer M, Lombardo T, Cornet E, Moll-Dau F, Schramm J, Schmidt-Ott K, Joseph E. Evaluation of Bio-Based Extraction Methods by Spectroscopic Methods. Minerals. 2020; 10(2):203. https://doi.org/10.3390/min10020203
Chicago/Turabian StyleMonachon, Mathilde, Magdalena Albelda-Berenguer, Tiziana Lombardo, Emilie Cornet, Friederike Moll-Dau, Janet Schramm, Katharina Schmidt-Ott, and Edith Joseph. 2020. "Evaluation of Bio-Based Extraction Methods by Spectroscopic Methods" Minerals 10, no. 2: 203. https://doi.org/10.3390/min10020203