Article

Chemical Weathering of Granite in Ice and Its Implication for Weathering in Polar Regions

1
Korea Polar Research Institute, Incheon 21990, Korea
2
Department of Polar Science, University of Science and Technology, Incheon 21990, Korea
3
School of Earth and Environmental Sciences, Seoul National University, Seoul 08826, Korea
*
Author to whom correspondence should be addressed.
Minerals 2020, 10(2), 185; https://doi.org/10.3390/min10020185
Submission received: 30 December 2019 / Revised: 14 February 2020 / Accepted: 15 February 2020 / Published: 19 February 2020
(This article belongs to the Special Issue Clays and Micro-Organisms: From Nature to Industry)

Abstract

:
Recently, it has been reported that some chemical reactions are enhanced in below-freezing conditions. Despite the high denudation typical of polar regions, chemical weathering that occurs under ice has not been investigated. In this study, we investigated the dissolution of granite in ice. The mixture of granite and deionized water (DW) or solution adjusted to pH 2 or 3 was split into two groups: the test group was frozen at −20 °C, while the control was maintained at room temperature. After 29 days of batch experiments, the filtrate was analyzed to measure the concentrations of cations and silica. The filtered powder was analyzed to investigate the mineral compositions and crystallinities of the granite before and after the experiments. Despite the low temperature, a significant quantity of cations (Na+, K+, Mg2+, Ca2+) were dissolved out, even from the ice samples. During X-ray diffraction (XRD) analysis, the decreased crystallinities of granite in ice samples were identified regardless of the pH condition. To verify the observed freeze concentration effect, the concentration of granite in the ice grain boundaries was observed using optical microscopy with a cold chamber. The low concentration of silica in the ice samples could explain the silica anomaly in polar regions. This study also provides a new perspective for the dissolution mechanism in polar regions.

1. Introduction

Chemical weathering has been studied for its ability to sequester atmospheric carbon dioxide. Silicate weathering has a net effect of sequestration of atmospheric carbon dioxide relative to geologic time, whereas carbonate weathering has no net effect [1]. Chemical weathering occurs when minerals or rocks react with acidic or oxidizing substances [2]. It is known that chemical weathering is mainly dependent on climate (e.g., temperature and precipitation), parent material, and biota [3,4,5]. Meanwhile, mechanical weathering means fragmentation of minerals or rocks or loss of materials and occurs without a chemical reaction [2]. Mechanical weathering is affected by elevation, relief, and runoff from the watershed [4].
Polar regions have low annual precipitation, extremely cold temperatures, and no higher-order plants [6,7]. Thus, the extent of chemical weathering in polar regions is generally thought to be negligible. Nevertheless, some studies have found that chemical weathering in polar regions is comparable to temperate regions [8,9]. These studies concluded that the unexpected high chemical denudation in polar regions is the result of accelerated mechanical weathering along continuously exposed outcropping at a high flow rate [10]. Some studies also reported a high flux of cations (e.g., K+ and Ca2+) and relatively low silica flux in polar regions [8]. In previous studies, many factors such as rapid runoff, salt weathering, and micro-organisms have been suggested to promote chemical weathering in polar regions [10,11,12]. Moreover, some studies emphasized the importance of moisture availability to chemical weathering in these regions [13,14]. However, chemical weathering of rocks and minerals in a frozen state has not been studied extensively [7,9]. In this study, we investigated the chemical weathering of granite in ice under water-available conditions.
It has been reported that some chemical reactions can be accelerated in ice [15,16]. For example, nitrite oxidizes to nitrate ~1000 times faster in ice than in aqueous solution [17]. It is also reported that the dissolution of iron oxide to form soluble iron is significantly accelerated in ice, whereas such a reaction is negligible in aqueous solution [16,18]. These previous studies suggested that the enhanced dissolution of bioavailable iron is the result of a proton assisted reaction at the ice grain boundaries and the freeze concentration effect. When a solution is solidified, the solutes are rejected from the bulk ice and concentrated in the interfacial water layer along the ice grain boundary [17]. In the Antarctic Peninsula, the dominant parent materials are volcanic and granitic [19]. In this study, the effect of freezing on the dissolution of granite was investigated to reveal the dissolution mechanism of silicate minerals in polar regions.

2. Materials and Methods

2.1. Materials

A bulk granite sample (1 kg) was purchased from Ward’s Science (#470026, granite (gray)). This granite was mainly composed of SiO2 and Al2O3 as oxides (Table 1), and quartz, plagioclase, and mica were the dominant mineral compositions. DW used in this experiment was prepared with the Barnstead water purification system and checked before use as to whether it had 18.2 MΩcm TC of resistivity. Ammonium molybdate tetrahydrate [(NH4)6Mo7O24∙4H2O, Aldrich], hydrochloric acid (HCl, Aldrich, Incheon, Korea), oxalic acid (HO2CCO2H, Aldrich, Incheon, Korea), 4-methylaminophenol sulfate (C7H9NO∙1/2H2SO4, Aldrich), sodium sulfite (Na2SO3, Aldrich), sulfuric acid [H2SO4, Aldrich], and sodium metasilicate nonahydrate (Na2O3Si∙9H2O, Aldrich) were used to analyze the silica (SiO2) concentration of the filtrate. Concentrated hydrochloric acid was used to make an acidic solution in batch experiments. The reagents used in this study were higher than ACS grade.

2.2. Pretreatment and Batch Experiments

A bulk rock sample was sliced into small chips with a diamond blade and washed with distilled water. The pieces were then air-dried and ground to a powder using a ring mill (Figure 1). Concentrated HCl was diluted to make the desired pH solution. A sterile petri dish with a 60 mm diameter was used as the reactor. After pouring 10 mL of HCl solution or DW into 0.1 g of granite powder, the petri dish was sealed with parafilm. Each sample was made in triplicates for reproducibility. Aqueous samples were kept at room temperature and in darkness. Ice samples were frozen at −20 °C in an air-controlled freezer for 29 days. Aqueous and ice samples for the first day of the experiment (reaction time = 0 days) were filtered immediately after the HCl solution was poured into the granite powder. The total time for this procedure was sub-thirty minutes. The ice samples were thawed with lukewarm water at 30−40 °C. Then, the aqueous and thawed ice samples were filtered using a 0.2 μm pore size filter. After filtering the time = 0 days samples, the measured pH values were 9.74 for DW, 3.94 for pH 3 solution, and 2.01 for pH 2 solution.

2.3. Chemical and Optical Analyses

The chemical composition of the sample material was analyzed using a micro X-ray fluorescence analyzer (μ-XRF, M4 Tornado, Bruker, Karlsruhe, Germany). The X-ray (Mo) source was operated at 50 kV and 600 μA and interacted with the sample for 1 s/scanning point. The distribution and amounts (wt.%) of K, Na, Ca, Mg, Al, Fe, Ti, Mn, and Si were measured at 20 points and, subsequently, averaged over these observation points. The error ranges for the m-XRF quantifications (wt.%) were approximately <0.1% for K, Na, Ca, Mg, Al, Fe, Ti, and Mn, and 0.4% for Si. The pH meter (Thermo Scientific, Orion 3 star, Singapore) was used to measure the pH of solutions. An ion chromatography system (Dionex ICS-1100, CERS 500 4 mm, CS12A) was used to analyze the cation concentration in the filtrate. The instrumental detection limits were: Na+ 0.03 mg·L−1, K+ 0.01 mg·L−1, Mg2+ 0.05 mg·L−1, and Ca2+ 0.12 mg·L−1. Methanesulfonic acid (CH3SO3H, Aldrich) was used in cation concentration analysis as an eluent. The eluent flow rate was 1.00 mL min−1, and the suppressor was set to 59 mA. SiO2 concentrations were analyzed colorimetrically with a UV-Vis spectrophotometer (Shimadzu, UV-2600, Kyoto, Japan) at 810 nm [20]. When treating the cation concentration data, time = 0-day values were subtracted from each cation concentrations to set the start point as 0 mg L−1. After filtering, the remaining solid material was air-dried. XRD analyses were performed using a Rigaku MiniFlex(II) automated diffractometer using Cu-Kα radiation. Random mount samples were prepared and measured at a scan speed of 1.5°/min and 0.02° step over the range of 2-theta angles (2°–80°). Then Search-Match software was used to identify mineral assemblages [21]. Microscopic image was observed (Leica microsystem, Lens HC PLAN 10 × 20 BR, L 50 × /0.50, Wetzlar, Germany) to investigate the ice grain boundary and freeze concentration effect. When observing the ice grain boundary optically, the solution was frozen on the linkam stage to −20 °C with the rate of −2 °C min−1.

3. Results

3.1. Filtrate Analysis

The main oxide compositions of granite are silicon dioxide (SiO2) and aluminum oxide (Al2O3); however, base cations (e.g., K+, Na+, Ca2+, Mg2+) also exist as a small fraction as oxides form (Table 1). After 29 days of the batch experiment, 0.27 mg L−1 of Na+, 1.21 mg L−1 of K+, 0.18 mg L−1 of Mg2+, and 2.65 mg L−1 of Ca2+ were dissolved with DW in the aqueous phase (Figure 2). In the ice samples with DW, the dissolution of cations from granite powder was negligible. After 29 days of being saturated in the pH 3 solution, Na+, K+, Mg2+, and Ca2+ concentrations of filtrate increased as follows: 0.68 mg L−1 of Na+, 3.44 mg L−1 of K+, 1.17 mg·L−1 of Mg2+, and 5.59 mg L−1 of Ca2+. The dissolved cation concentrations in the ice conditions were lower than those in aqueous solution; however, the cation concentrations in ice samples with pH 3 solution were 140%, 216%, 544%, and 172% higher than each cation concentration in the aqueous solution with DW. The dissolution of granite powder for the frozen samples was notable with the pH 3 solution, in contrast to the negligible case with DW in ice. When a pH 2 solution was added to granite powder, the dissolution continued after seven days as opposed to after seven days with the pH 3 solution (Figure 3). After seven days, cation concentrations with pH 2 solution and granite powder in ice sample filtrate exceeded that of filtrate with DW in aqueous solution. After 29 days, 1.19 mg L−1 of Na+, 9.63 mg L−1 of K+, 7.50 mg L−1 of Mg2+, and 13.45 mg L−1 of Ca2+ were dissolved in aqueous solution. Filtrate of the ice samples yielded 0.46 mg L−1 of Na+, 4.22 mg L−1 of K+, 3.34 mg L−1 of Mg2+, and 9.43 mg L−1 of Ca2+(Table 2).

3.2. XRD Analysis and Amorphous Silica Formation

The results of the XRD analysis are represented in Figure 4. No other peaks from secondary phase minerals were observed in both aqueous and ice samples. Aqueous experiment samples showed similar trends and intensities of XRD patterns as the granite powder before the experiment. However, general peak intensities were reduced in ice experiment samples compared to aqueous samples and initial granite for mica, plagioclase, and quartz. In the analysis of SiO2 concentrations in the filtrate, the concentration in the aqueous solution experiment increased with time (Figure 5). However, SiO2 concentrations in the ice experiment decreased from the initial concentration to zero, while other cation concentrations increased. In this case, the initial concentration was not subtracted from each filtrate concentration for SiO2 concentrations.

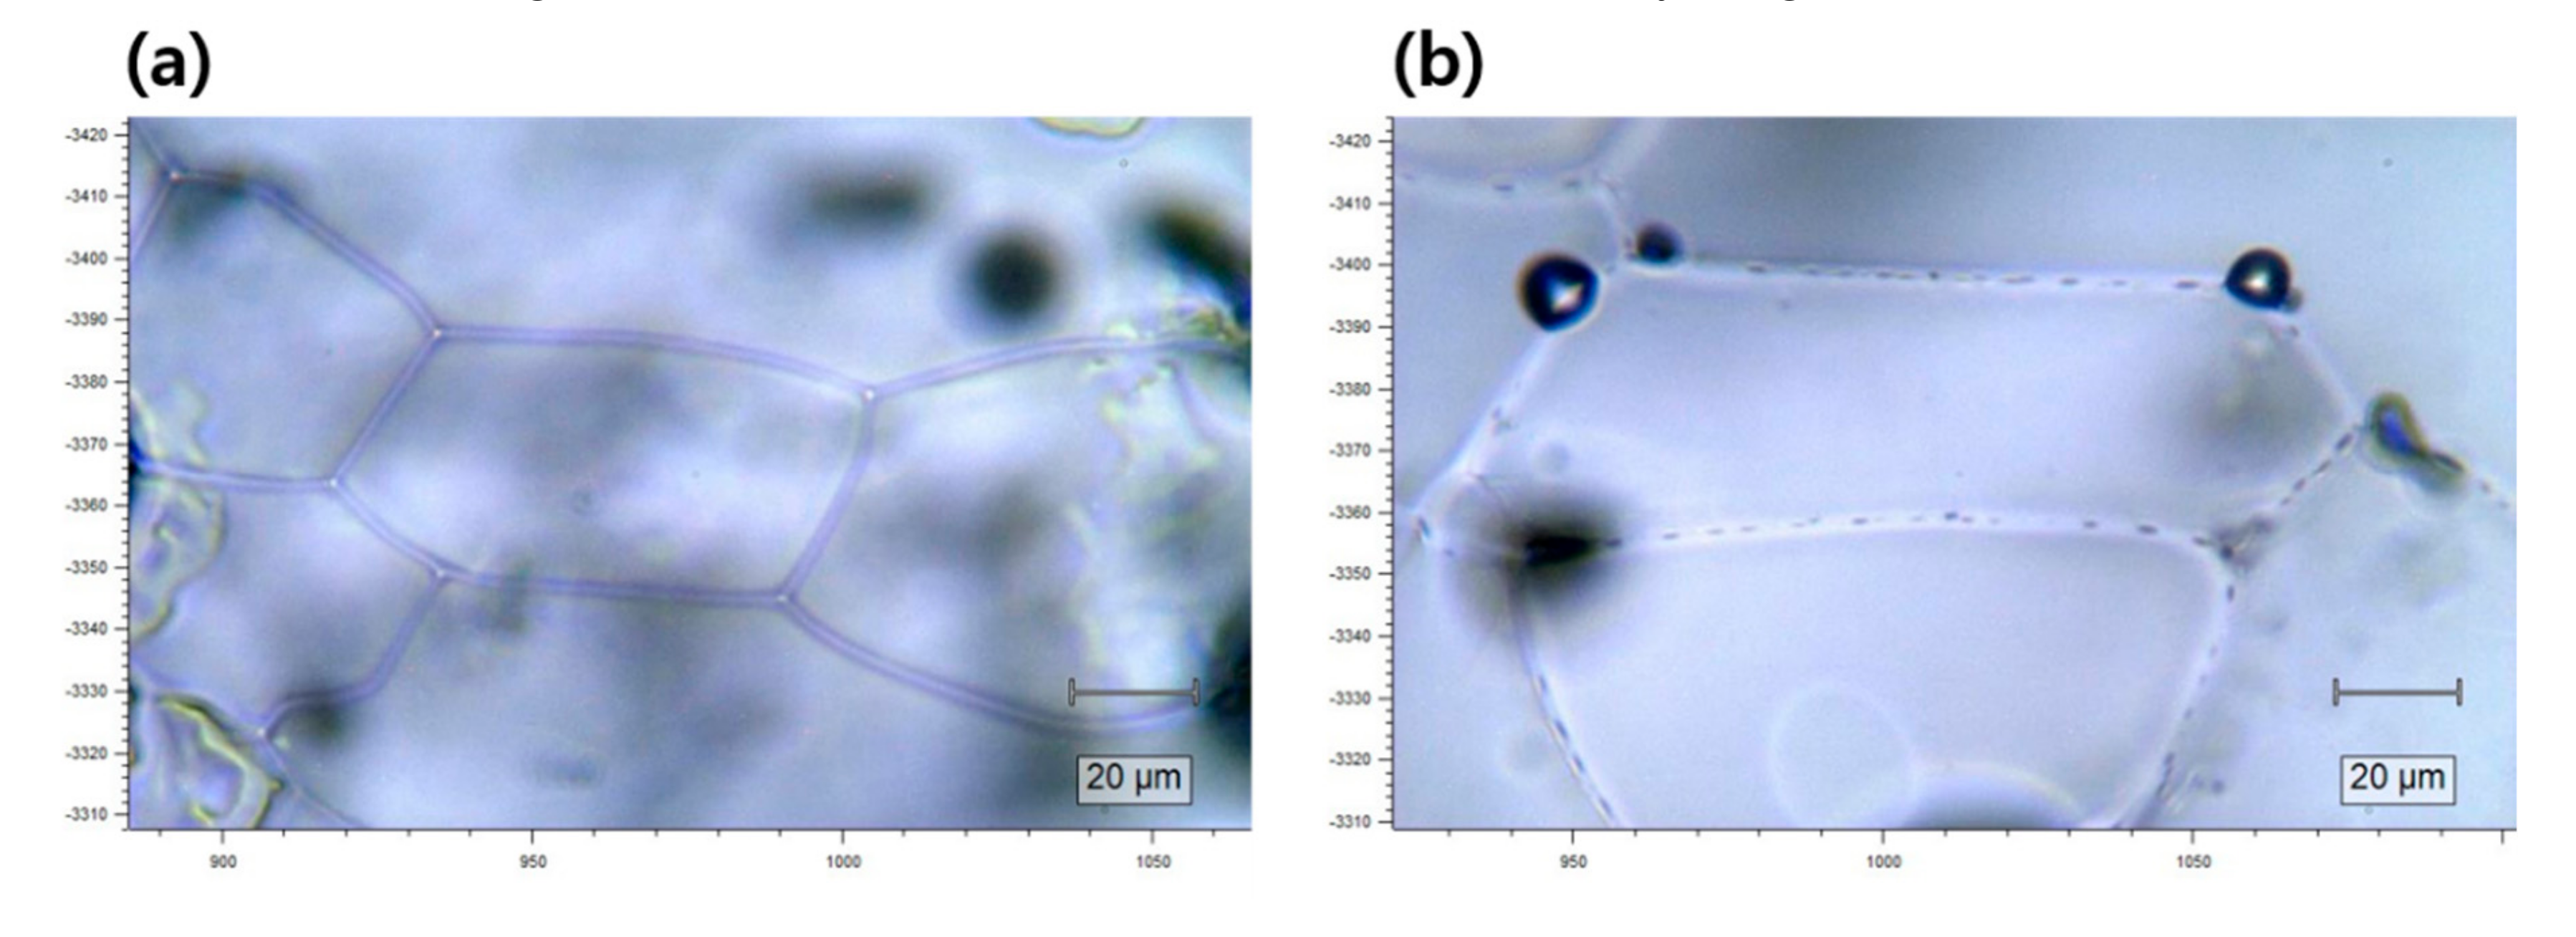
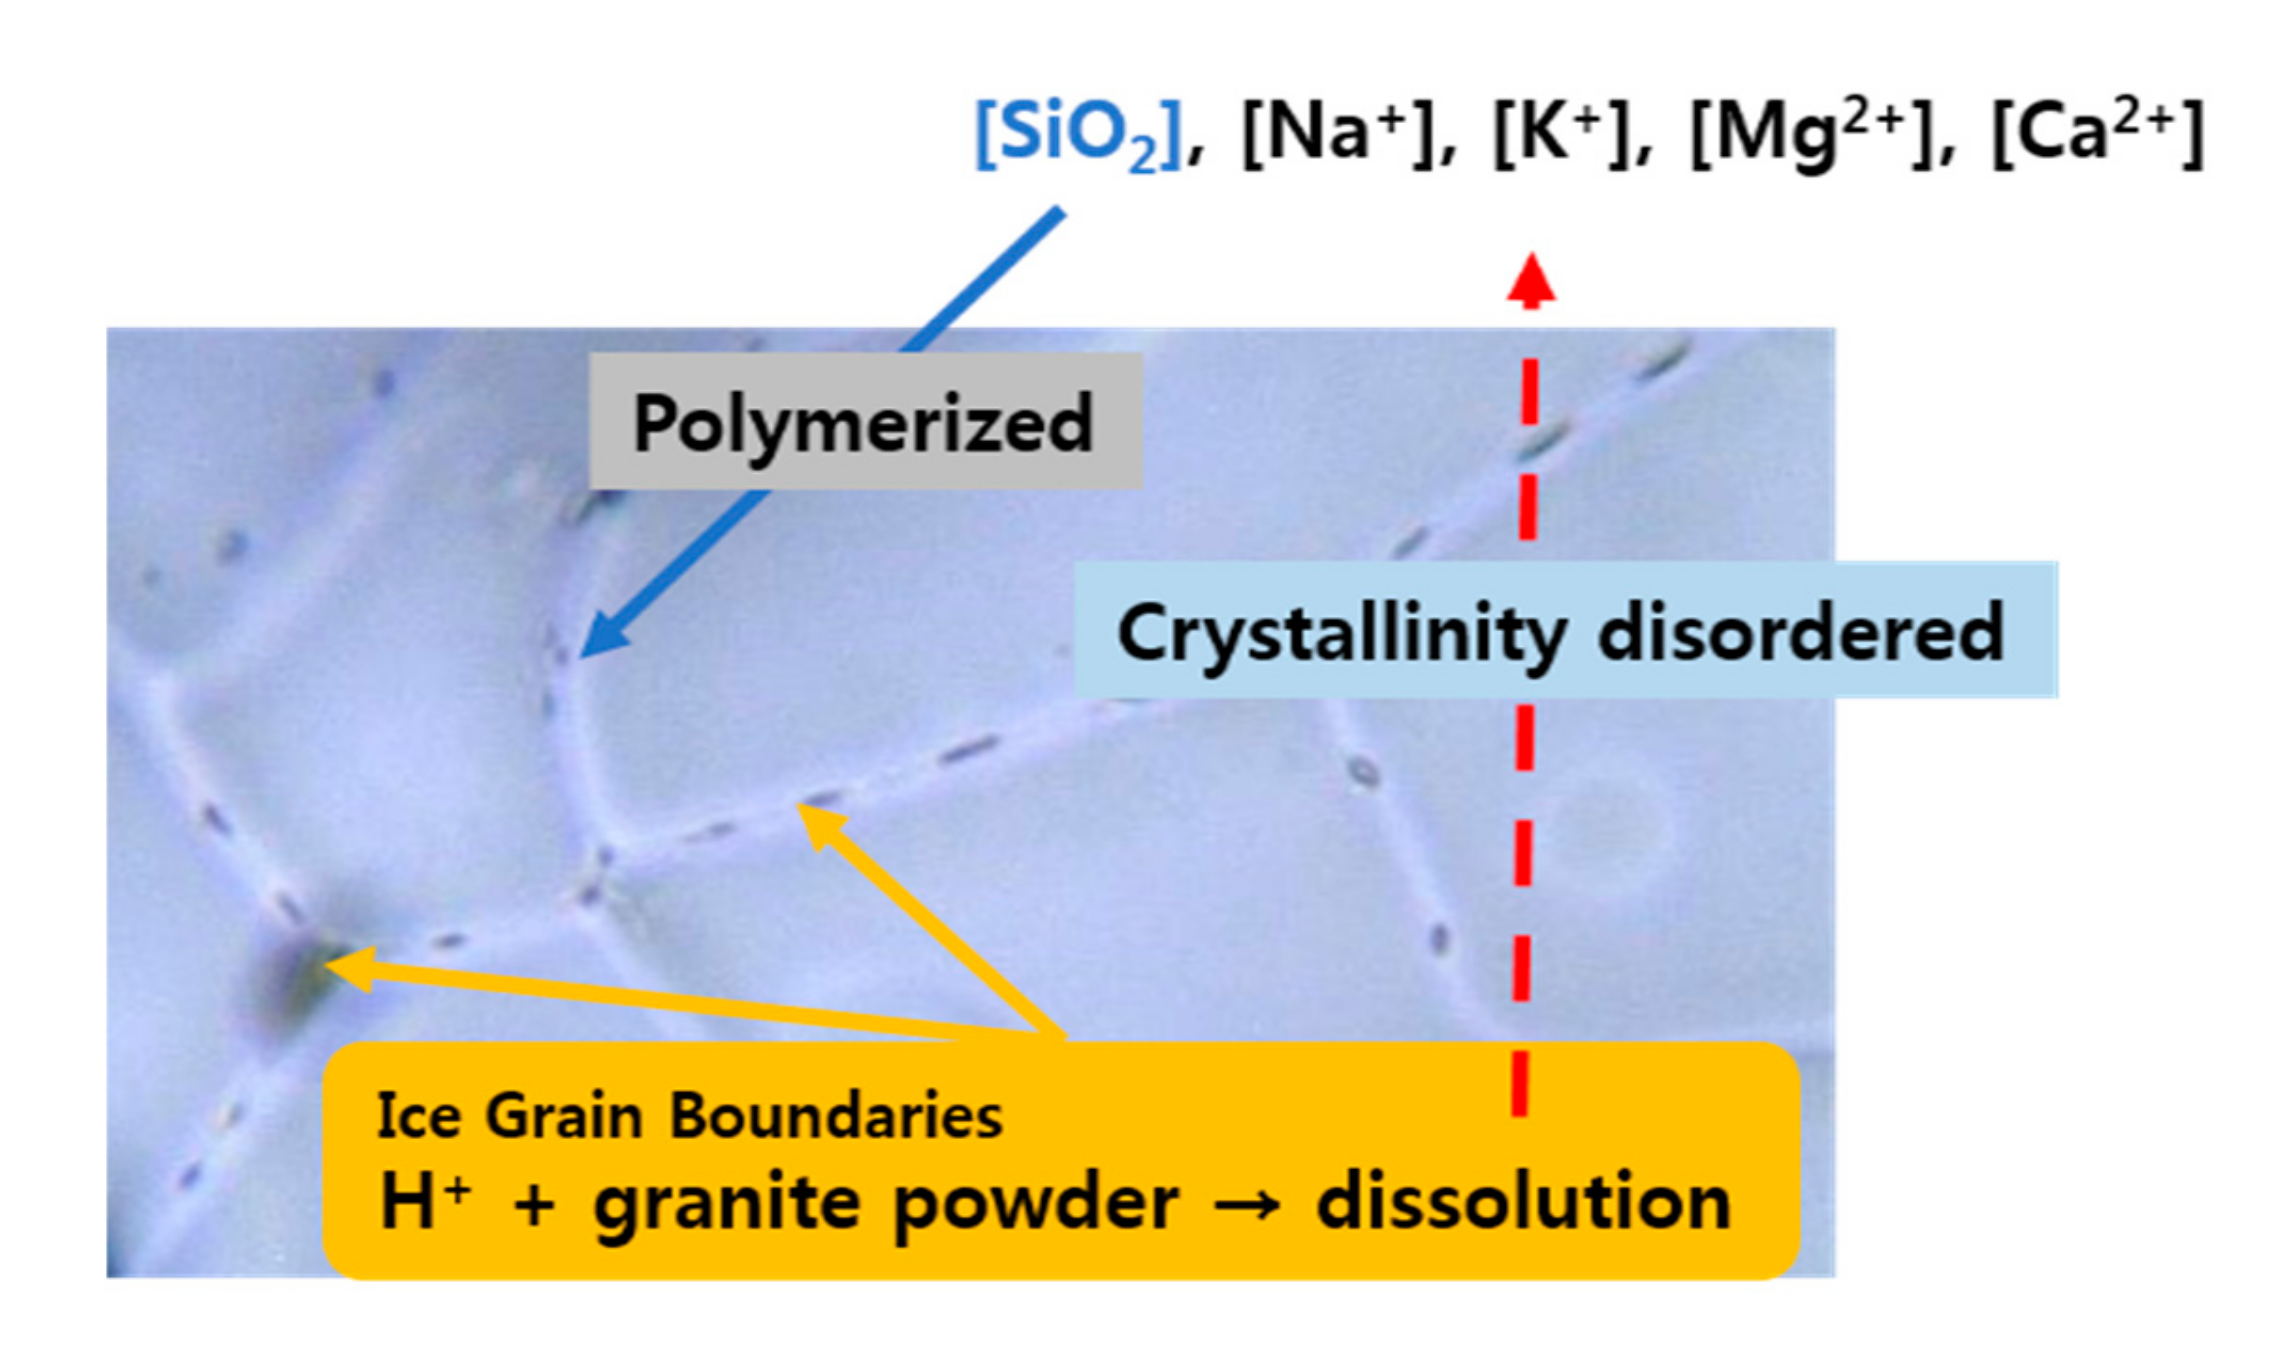
3.3. Optical Images of Ice Grain Boundaries

When the HCl solution of pH 3 was frozen, an ice grain boundary formed. We were able to identify it using a microscope (Figure 6a). It is known that solutes are rejected from bulk ice and concentrated in the water layer along the ice grain boundary [17]. The interfacial water layer at the ice grain boundaries in our samples was found to contain high concentrations of solute. It has been reported that when an acid solution becomes frozen, the pH at the ice grain boundary decreases several orders than the solution pH because of the concentrated hydrogen ions [22]. After the mixture of pH 3 solution and granite powder was frozen, the granite powder became concentrated at the ice grain boundaries (Figure 6b). Granite powder was rejected during bulk ice formation, and the powder grains were trapped at the ice grain boundaries. Therefore, the dissolution of granite powder can occur at the ice grain boundaries as a result of concentrated hydrogen ions.

4. Discussion

4.1. The Mechanism behind the Dissolution of Granite in Ice

The cation concentrations in aqueous experiments were obviously higher than ice experiments, however, the dissolution of cations in ice was also considerable. The cation concentrations of filtrate with pH 2 solution were much higher than those of the pH 3 and DW experiments, both in aqueous and ice phases. Our results were consistent with previous research that reported high dissolution of silicate minerals at similarly low pH [5]. In previous studies, the chemical weathering in ice has not been considered. In studies of polar regions, the chemical weathering has been studied in summertime during an aqueous phase of meltwater [7,9]. However, the dissolution of granite also unexpectedly occurred to a certain degree in ice in this study.
It should be noted that the identification of the exact timing of reaction in frozen samples (during the freezing process, frozen state, or melting process) is still a controversial issue although the freezing and thawing time is significantly shorter than that of the frozen state. The best way to know the timing of reaction is to analyze the ions during the frozen state. Unfortunately, the in-situ measurement is not technically available at the present time. In spite of the uncertainty, we thought that most of the dissolution process of granite in ice takes place during the frozen state and not the freezing or melting processes because of the comparably very short time to freeze and melt (about 30 min) samples. Furthermore, the amount of dissolved ions from granite during the thawing process could be very small based on the reaction rate in aqueous samples as shown in Figure 3. The duration of the frozen state until the first sample time (7 days, 168 h) is 336 times longer than melting time (about 30 min) and the amount of dissolved ions might be negligible. Furthermore, the enhanced dissolution of ions from granite between 7 and 14 days (Figure 3) also confirms that the significant dissolution of ions from granite takes place during the frozen state and not during thawing process. Nevertheless, the similar amount of dissolved ions from granite during 7–14 days at pH 3 is not sufficient to dispel the quick dissolution during the melting process. In order to generalize the comparable dissolution of granite in the ice phase, more experiments including a short time scale and various pH ranges should be carried out in the near future.
It was optically identified that the granite powder was trapped in the ice grain boundary. In the process of ice formation, the solutes, protons, and small particles are rejected from the bulk ice and concentrate in the ice grain boundary region, which is called the “freeze concentration effect”. It is also known that the pH of ice grain boundaries is lower by several orders than that of the solution before freezing [17]. In the surface-reaction model suggested by Furrer and Stumm, the dissolution rate is proportional to the concentration of surface species (protonates sites in this case) and the adsorption of H+ to the surface, which occurred in interfacial regions between hydrous oxides and aqueous solution [5,23]. The proton-promoted rate of dissolution can be described as:
RH = kH[≡SOH2+]n
where kH is the rate constant, [≡SOH2+] is the concentration of hydrogen ions adsorbed to the surface, and n is the reaction order. n represents the number of protonation steps required for cation release from the surface and is equal to the oxidation number of the central cation in the oxide (e.g., n = 4 for SiO2). Moreover, the dissolution rate of silicate minerals increases exponentially with a higher concentration of hydrogen ions at a pH below the acid transition point [5]. The acid transition point of silicate minerals is typically at pH 4–5. This can be described as:
RH = kH[H+]n
where kH is a rate constant and n is an exponent that varies with mineral composition. In the ice grain boundary region, a lower pH than that of the original solution (pH 2 and 3) increased the rate of granite dissolution exponentially under the acid transition point (this reaction was restricted to the ice grain boundaries). Furthermore, the adsorption of hydrogen ions to the surface of the granite powder increased according to the freeze concentration effect in the ice grain boundary region.

4.2. Silica Polymerization in Ice and Its Implication for Polar Regions

In previous studies about chemical weathering conducted in polar regions, the cation concentrations of the meltwater in polar regions have been comparable to temperate regions, but the silica concentrations have been relatively low [24]. These studies concluded that the reason for the high cation concentrations is the high runoff and rapid flow rate of the meltwater in summertime. During this time, high runoff and rapid flow rate exposes rock to weathering agents (water and CO2) continuously [8,10]. Previous studies emphasized the rapid dissolution of carbonate minerals, rather than focusing on silicate minerals. Our study has, therefore, expanded previous research by showing an increase in silica concentration (accompanied by other dissolved cations) during aqueous conditions, and a decreased silica concentration under ice conditions, even at low pH, and without carbonate minerals present in the source rock (Figure 5).
Some studies have reported that polymerized silica could be formed in ice, then the silica concentration could be reduced when a solution is stored in a frozen state, and when the solution has low salinity [25,26]. In the colorimetric method for silica concentration, molybdate acts as the color reagent. Molybdate only forms complexes with reactive silica, which is mono-type [20]. Therefore, the polymerized silica formed in ice could not make a complex with molybdate in this study. This explains the reduced silica concentrations present after the ice experiment. During XRD analysis, the intensities of granite powder for quartz, plagioclase, and mica are decreased as a result of the dissolution in the ice experiment (Figure 4). One more possible interpretation for the XRD results is the reaggregated silica in ice, which is dissolved once. Amorphous forms of solid can cause decreased and broadened peaks in XRD analyses [27,28]. In the ice experiments, the dissolved silica from the dissolution of granite could be polymerized to an amorphous form and aggregated at the surface of the granite powder.
Quartz is the slowest material of the silicate minerals to be dissolved with acid [29]. As such, our aqueous experiment contained only a small fraction of cations, which were dissolved rapidly in the acid solutions (Figure 2 and Figure 3) and there was no considerable difference between the quartz intensities of granite powder before and after aqueous experiments (Figure 4). However, the intensities of the peaks for quartz decreased in XRD analysis in ice samples. This suggests a polymerization of dissolved quartz into an amorphous solid. These reactions in ice could also be possible in polar regions. Therefore, the results of previous studies that reported the unexpected high concentration of cations and relatively low silica concentration in polar regions could be explained by the reactions in the ice observed in this study. Moreover, it was reported that a significant amount of silica is supplied from the ice sheet to seawater in an amorphous form in Greenland [30]. Comparable chemical weathering and formation of amorphous silica in ice in this study could be the plausible explanation for the field data collected in Greenland. Furthermore, the amorphous silica which is formed in ice could be the unrecognized form of silica in polar regions.

5. Conclusions

In this study, we conducted granite dissolution experiments in ice and investigated the mechanism of the dissolution, which, to the best of our knowledge, has not been considered in previous studies. Although the dissolution of granite was negligible in ice with DW, it was significant in ice with pH 2 and 3 solutions. Optical images show that the dissolution in ice is due to the freeze concentration effect of hydrogen ions at the ice grain boundaries (Figure 7). During XRD analysis, the intensities of the mineral peaks (quartz, plagioclase, and mica) decreased in the ice samples whereas no intensity decrease was identified in the aqueous phase samples. The results of XRD and silica concentration analyses suggested the probability of existence of amorphous silica in polar regions, which could be formed from the chemical reactions occurring in the ice. Previous studies investigating weathering in polar regions were focused on the weathering in the aqueous phase or the mechanical weathering with ice. This study provides the new insight that chemical weathering could occur as a result of the chemical reactions related to the freeze concentration effect in ice grain boundaries.

Author Contributions

K.K. designed the study concept, data interpretation, and revised the manuscript. H.Y.C. contributed to the data production, experimental settings, and manuscript preparation. J.J. conducted XRD and XRF analyses and interpreted the data. D.H.L. revised the manuscript. S.K. and M.K.L. interpreted XRD and SiO2 data. J.I.L. and K.-C.Y. interpreted cation concentration data. Y.I.L. revised the manuscript. All authors have read and agreed to the published version of the manuscript.

Funding

This research was funded by Korea Polar Research Institute (KOPRI) project (PE20030).

Acknowledgments

This research was supported by the Korea Polar Research Institute (KOPRI) project (PE20030).

Conflicts of Interest

The authors declare no conflicts of interest.

References

  1. Berner, R.A. Weathering, plants, and the long-term carbon cycle. Geochim. Cosmochim. Acta 1992, 56, 3225–3231. [Google Scholar] [CrossRef]
  2. Schlesinger, W.H.; Bernhardt, E.S. Biogeochemistry: An Analysis of Global Change; Academic Press: New York, NY, USA, 2013. [Google Scholar]
  3. White, A.F.; Blum, A.E. Effects of climate on chemical_ weathering in watersheds. Geochim. Cosmochim. Acta 1995, 59, 1729–1747. [Google Scholar] [CrossRef]
  4. Gaillardet, J.; Dupre, B.; Louvat, P.; Allègre, C. Global silicate weathering and CO2 consumption rates deduced from the chemistry of large rivers. Chem. Geol. 1999, 159, 3–30. [Google Scholar] [CrossRef]
  5. Drever, J.; Stillings, L. The role of organic acids in mineral weathering. Colloids Surf. A Physicochem. Eng. Asp. 1997, 120, 167–181. [Google Scholar] [CrossRef]
  6. Bockheim, J.G. Properties and Classification of Cold Desert Soils from Antarctica. Soil Sci. Soc. Am. J. 1997, 61, 224–231. [Google Scholar] [CrossRef]
  7. Gooseff, M.N.; McKnight, D.; Lyons, W.B.; Blum, A.E. Weathering reactions and hyporheic exchange controls on stream water chemistry in a glacial meltwater stream in the McMurdo Dry Valleys. Water Resour. Res. 2002, 38. [Google Scholar] [CrossRef] [Green Version]
  8. Anderson, S.; Drever, J.I.; Humphrey, N.F. Chemical weathering in glacial environments. Geology 1997, 25, 399. [Google Scholar] [CrossRef]
  9. Nezat, C.A.; Lyons, W.B.; Welch, K. Chemical weathering in streams of a polar desert (Taylor Valley, Antarctica). GSA Bull. 2001, 113, 1401–1408. [Google Scholar] [CrossRef]
  10. Huh, Y. Chemical weathering and climate—A global experiment: A review. Geosci. J. 2003, 7, 277–288. [Google Scholar] [CrossRef]
  11. Bisson, K.; Welch, K.; Welch, S.; Sheets, J.M.; Lyons, W.B.; Levy, J.; Fountain, A.G. Patterns and Processes of Salt Efflorescences in the McMurdo region, Antarctica. Arct. Antarct. Alp. Res. 2015, 47, 407–425. [Google Scholar] [CrossRef] [Green Version]
  12. Maurice, P.A.; McKnight, D.; Leff, L.; Fulghum, J.E.; Gooseff, M.N. Direct observations of aluminosilicate weathering in the hyporheic zone of an Antarctic Dry Valley stream. Geochim. Cosmochim. Acta 2002, 66, 1335–1347. [Google Scholar] [CrossRef]
  13. Hall, K.; Thorn, C.E.; Matsuoka, N.; Prick, A. Weathering in cold regions: Some thoughts and perspectives. Prog. Phys. Geogr. Earth Environ. 2002, 26, 577–603. [Google Scholar] [CrossRef]
  14. Hall, K. Evidence for freeze–thaw events and their implications for rock weathering in northern Canada: II. The temperature at which water freezes in rock. Earth Surf. Process. Landf. 2007, 32, 249–259. [Google Scholar] [CrossRef]
  15. Kim, K.; Yoon, H.-I.; Choi, W. Enhanced Dissolution of Manganese Oxide in Ice Compared to Aqueous Phase under Illuminated and Dark Conditions. Environ. Sci. Technol. 2012, 46, 13160–13166. [Google Scholar] [CrossRef]
  16. Kim, K.; Choi, W.; Hoffmann, M.R.; Yoon, H.-I.; Park, B.-K. Photoreductive Dissolution of Iron Oxides Trapped in Ice and Its Environmental Implications. Environ. Sci. Technol. 2010, 44, 4142–4148. [Google Scholar] [CrossRef] [Green Version]
  17. Takenaka, N.; Ueda, A.; Daimon, T.; Bandow, H.; Dohmaru, T.; Maeda, Y. Acceleration Mechanism of Chemical Reaction by Freezing: The Reaction of Nitrous Acid with Dissolved Oxygen. J. Phys. Chem. 1996, 100, 13874–13884. [Google Scholar] [CrossRef]
  18. Kim, K.; Menacherry, S.P.M.; Kim, J.; Chung, H.Y.; Jeong, D.; Saiz-Lopez, A.; Choi, W. Simultaneous and Synergic Production of Bioavailable Iron and Reactive Iodine Species in Ice. Environ. Sci. Technol. 2019, 53, 7355–7362. [Google Scholar] [CrossRef]
  19. Bockheim, J.G. The Soils of Antarctica; Springer: New York, NY, USA, 2015. [Google Scholar]
  20. Coradin, T.; Eglin, D.; Livage, J. The silicomolybdic acid spectrophotometric method and its application to silicate/biopolymer interaction studies. J. Spectrosc. 2004, 18, 567–576. [Google Scholar] [CrossRef]
  21. Jung, J.; Yoo, K.-C.; Lee, K.-H.; Park, Y.K.; Lee, J.I.; Kim, J. Clay Mineralogical Characteristics of Sediments Deposited during the Late Quaternary in the Larsen Ice Shelf B Embayment, Antarctica. Minerals 2019, 9, 153. [Google Scholar] [CrossRef] [Green Version]
  22. Heger, D.; Klanova, J.; Klán, P. Enhanced Protonation of Cresol Red in Acidic Aqueous Solutions Caused by Freezing. J. Phys. Chem. B 2006, 110, 1277–1287. [Google Scholar] [CrossRef]
  23. Furrer, G.; Stumm, W. The coordination chemistry of weathering: I. Dissolution kinetics of δ-Al2O3 and BeO. Geochim. Cosmochim. Acta 1986, 50, 1847–1860. [Google Scholar] [CrossRef]
  24. Anderson, S. Biogeochemistry of Glacial Landscape Systems. Annu. Rev. Earth Planet. Sci. 2007, 35, 375–399. [Google Scholar] [CrossRef]
  25. Burton, J.D.; Leatherland, T.M.; Liss, P.S. The Reactivity of Dissolved Silicon in Some Natural Waters. Limnol. Oceanogr. 1970, 15, 473–476. [Google Scholar] [CrossRef]
  26. Macdonald, R.; McLaughlin, F. The effect of storage by freezing on dissolved inorganic phosphate, nitrate and reactive silicate for samples from coastal and estuarine waters. Water Res. 1982, 16, 95–104. [Google Scholar] [CrossRef]
  27. Bates, S.; Zografi, G.; Engers, D.; Morris, K.; Crowley, K.; Newman, A.W. Analysis of Amorphous and Nanocrystalline Solids from Their X-Ray Diffraction Patterns. Pharm. Res. 2006, 23, 2333–2349. [Google Scholar] [CrossRef]
  28. Biswas, R.K.; Khan, P.; Mukherjee, S.; Mukhopadhyay, A.K.; Ghosh, J.; Muraleedharan, K. Study of short range structure of amorphous Silica from PDF using Ag radiation in laboratory XRD system, RAMAN and NEXAFS. J. Non-Crystalline Solids 2018, 488, 1–9. [Google Scholar] [CrossRef]
  29. Hartmann, J.; West, A.J.; Renforth, P.; Köhler, P.; De La Rocha, C.L.; Dürr, H.; Scheffran, J.; Wolf-Gladrow, D.A. Enhanced chemical weathering as a geoengineering strategy to reduce atmospheric carbon dioxide, supply nutrients, and mitigate ocean acidification. Rev. Geophys. 2013, 51, 113–149. [Google Scholar] [CrossRef] [Green Version]
  30. Hawkings, J.; Wadham, J.L.; Benning, L.G.; Hendry, K.R.; Tranter, M.; Tedstone, A.J.; Nienow, P.; Raiswell, R. Ice sheets as a missing source of silica to the polar oceans. Nat. Commun. 2017, 8, 14198. [Google Scholar] [CrossRef]
Figure 1. Pretreatments and batch experiments of the bulk type of granite. (a) Bulk rock sample, (b) diamond blade, (c) small rock chips sliced with (b), (d) ring mill, (e) granite powder milled with (d), (f) aqueous sample at room temperature, and (g) ice sample at −20 °C.
Minerals 10 00185 g001
Figure 2. Chemical composition changes of filtrate after a batch experiment with a pH 3 solution and DW. (a) [Na+], (b) [K+], (c) [Mg2+], and (d) [Ca2+].
Minerals 10 00185 g002
Figure 3. Chemical composition changes of filtrate after batch experiment with pH 2 solution and DW. (a) [Na+], (b) [K+], (c) [Mg2+], and (d) [Ca2+].
Minerals 10 00185 g003
Figure 4. XRD patterns for a fresh granite sample and filtered solid material after the 29-day batch experiment under different conditions; quartz (Q), plagioclase (Pl), and mica (M).
Minerals 10 00185 g004
Figure 5. SiO2 concentration analysis of filtrate after a batch experiment with a pH 2 solution.
Minerals 10 00185 g005
Figure 6. Representative optical images of (a) pH 3 solution and (b) the mixture of pH 3 solution and granite powder frozen to −20 °C on the linkam stage with −2 °C min−1 of freezing.
Minerals 10 00185 g006
Figure 7. Scheme of dissolution of granite in ice.
Minerals 10 00185 g007
Table 1. Chemical composition of granite powder used in this study analyzed by X-ray fluorescence spectroscopy.
Oxide CompositionSiO2Al2O3K2ONa2OFe2O3CaOMgOTiO2MnO
Weight Percentage (%)72.5013.597.561.831.651.040.580.370.10
Table 2. Averaged dissolved cation concentrations after 29-day batch experiment analyzed by ion chromatography.
DW (aq)DW (ice)pH 3 (aq)pH 3 (ice)pH 2 (aq)pH 2 (ice)
[Na+]0.27n.a.0.680.391.190.46
[K+]1.210.013.442.619.634.22
[Mg2+]0.18n.a.1.170.987.503.34
[Ca2+]2.650.095.594.5613.459.43
(unit: mg L−1)

