Article

3D Fabric Analysis in Fault Rock Using Synchrotron μ-CT: A Statistical Approach to SPO (Shape Preferred Orientation) for Estimation of Fault Motion

1
Department of Earth System Sciences, Yonsei University, Seoul 03722, Korea
2
Korea Institute of Geoscience and Mineral Resources, Daejeon 34132, Korea
*
Author to whom correspondence should be addressed.
Minerals 2020, 10(11), 994; https://doi.org/10.3390/min10110994
Submission received: 18 September 2020 / Revised: 5 November 2020 / Accepted: 6 November 2020 / Published: 9 November 2020
(This article belongs to the Special Issue Microtexture Characterization of Rocks and Minerals)

Abstract

:
This study provides information about fault motion by statistically presenting shape and orientation information for tens of thousands of grains. The recently developed shape preferred orientation (SPO) measurement method using synchrotron micro-computed tomography was used. In addition, various factors that were not considered in previous SPO analysis were analyzed in-depth. The study area included the Yangsan and Ulsan fault zones, which are the largest fault zones in the southeastern part of the Korean Peninsula. Samples were collected from five outcrops in two regions. According to the field observation results, the samples in the area were largely divided into fault gouge and cataclasite, and as a result of SPO analysis, we succeeded in restoring the three-dimensional fault motion direction for each outcrop and identified the fault type. In addition, the analysis results of the fault gouge and cataclasite samples collected from the thin fault zone were interpreted using the focal mechanism solution. As a result, the statistical SPO analysis approach supplements the shortcomings of previous research methods on two-dimensional planes and can quantitatively infer the three-dimensional fault motion for various fault rock samples in the same sequence, thus, presenting useful evidence for structural analysis.

1. Introduction

Research on faults provides information on the ground stability of an area and important basic data for estimating the tectonic environment at the time of fault activation [1]. Accordingly, many studies have analyzed outcrop scales and micro shear fabrics embedded in fault rocks to infer the fault activation history in large-scale fault zones. However, while the shear sense indicators of the cohesive fault rock generated by ductile deformation are vary, the type of fabric that can be recognized as a shear sense indicator for the incohesive fault rock formed through the brittle deformation is relatively rare [2,3,4,5]. For instance, lattice preferred orientation (LPO) analysis of clay minerals using X-rays and anisotropy of magnetic susceptibility (AMS) analysis using the magnetic properties of minerals [6,7,8,9,10] are good methods for studying fault activation by investigating shear fabrics representative of incohesive fault rock. However, these methods cannot target all minerals, and more evidence is required for interpreting fault gouges.
For these reasons, the importance of measuring shape preferred orientation (SPO) has emerged. Two-dimensional (2D)-SPO measurements have previously been performed on planes to draw conclusions on shear senses and fluid flow directions. However, 2D data cannot be used to determine directions in three dimensions [11,12]. To solve this problem, the three-dimensional (3D)-SPO method was recently developed. According to a previous study that measured 3D-SPO, fault motion sense can be inferred by analyzing the shape characteristics of rigid grains and the orientation of the major axis of the grains evaluated through grain rotation [13,14]. Compared with past studies on 2D planes, reliability and data accuracy can be improved by using the large amount of data collected via micro-computed tomography (μ-CT). In addition, the SPO method can cover variable samples as compared with LPO or AMS methods [11,15,16]. However, the SPO method has not yet been applied to various fault rocks appearing in large-scale faults. Additionally, even if there are other possibilities for interpreting SPO results, detailed studies investigating this aspect are lacking [14]. In particular, previous studies have discussed only the orientation of the major axis. Therefore, we intend to infer the 3D fault motion using the outcrop of the Yangsan and Ulsan faults in the southeastern part of the Korean Peninsula, which displays a tectonic structure characterized by faults. Furthermore, by improving the understanding of the interpretation of SPO results and assessing a large amount of data statistically, we validate that the SPO data can be a shear-sense indicator for the large-scale faults.

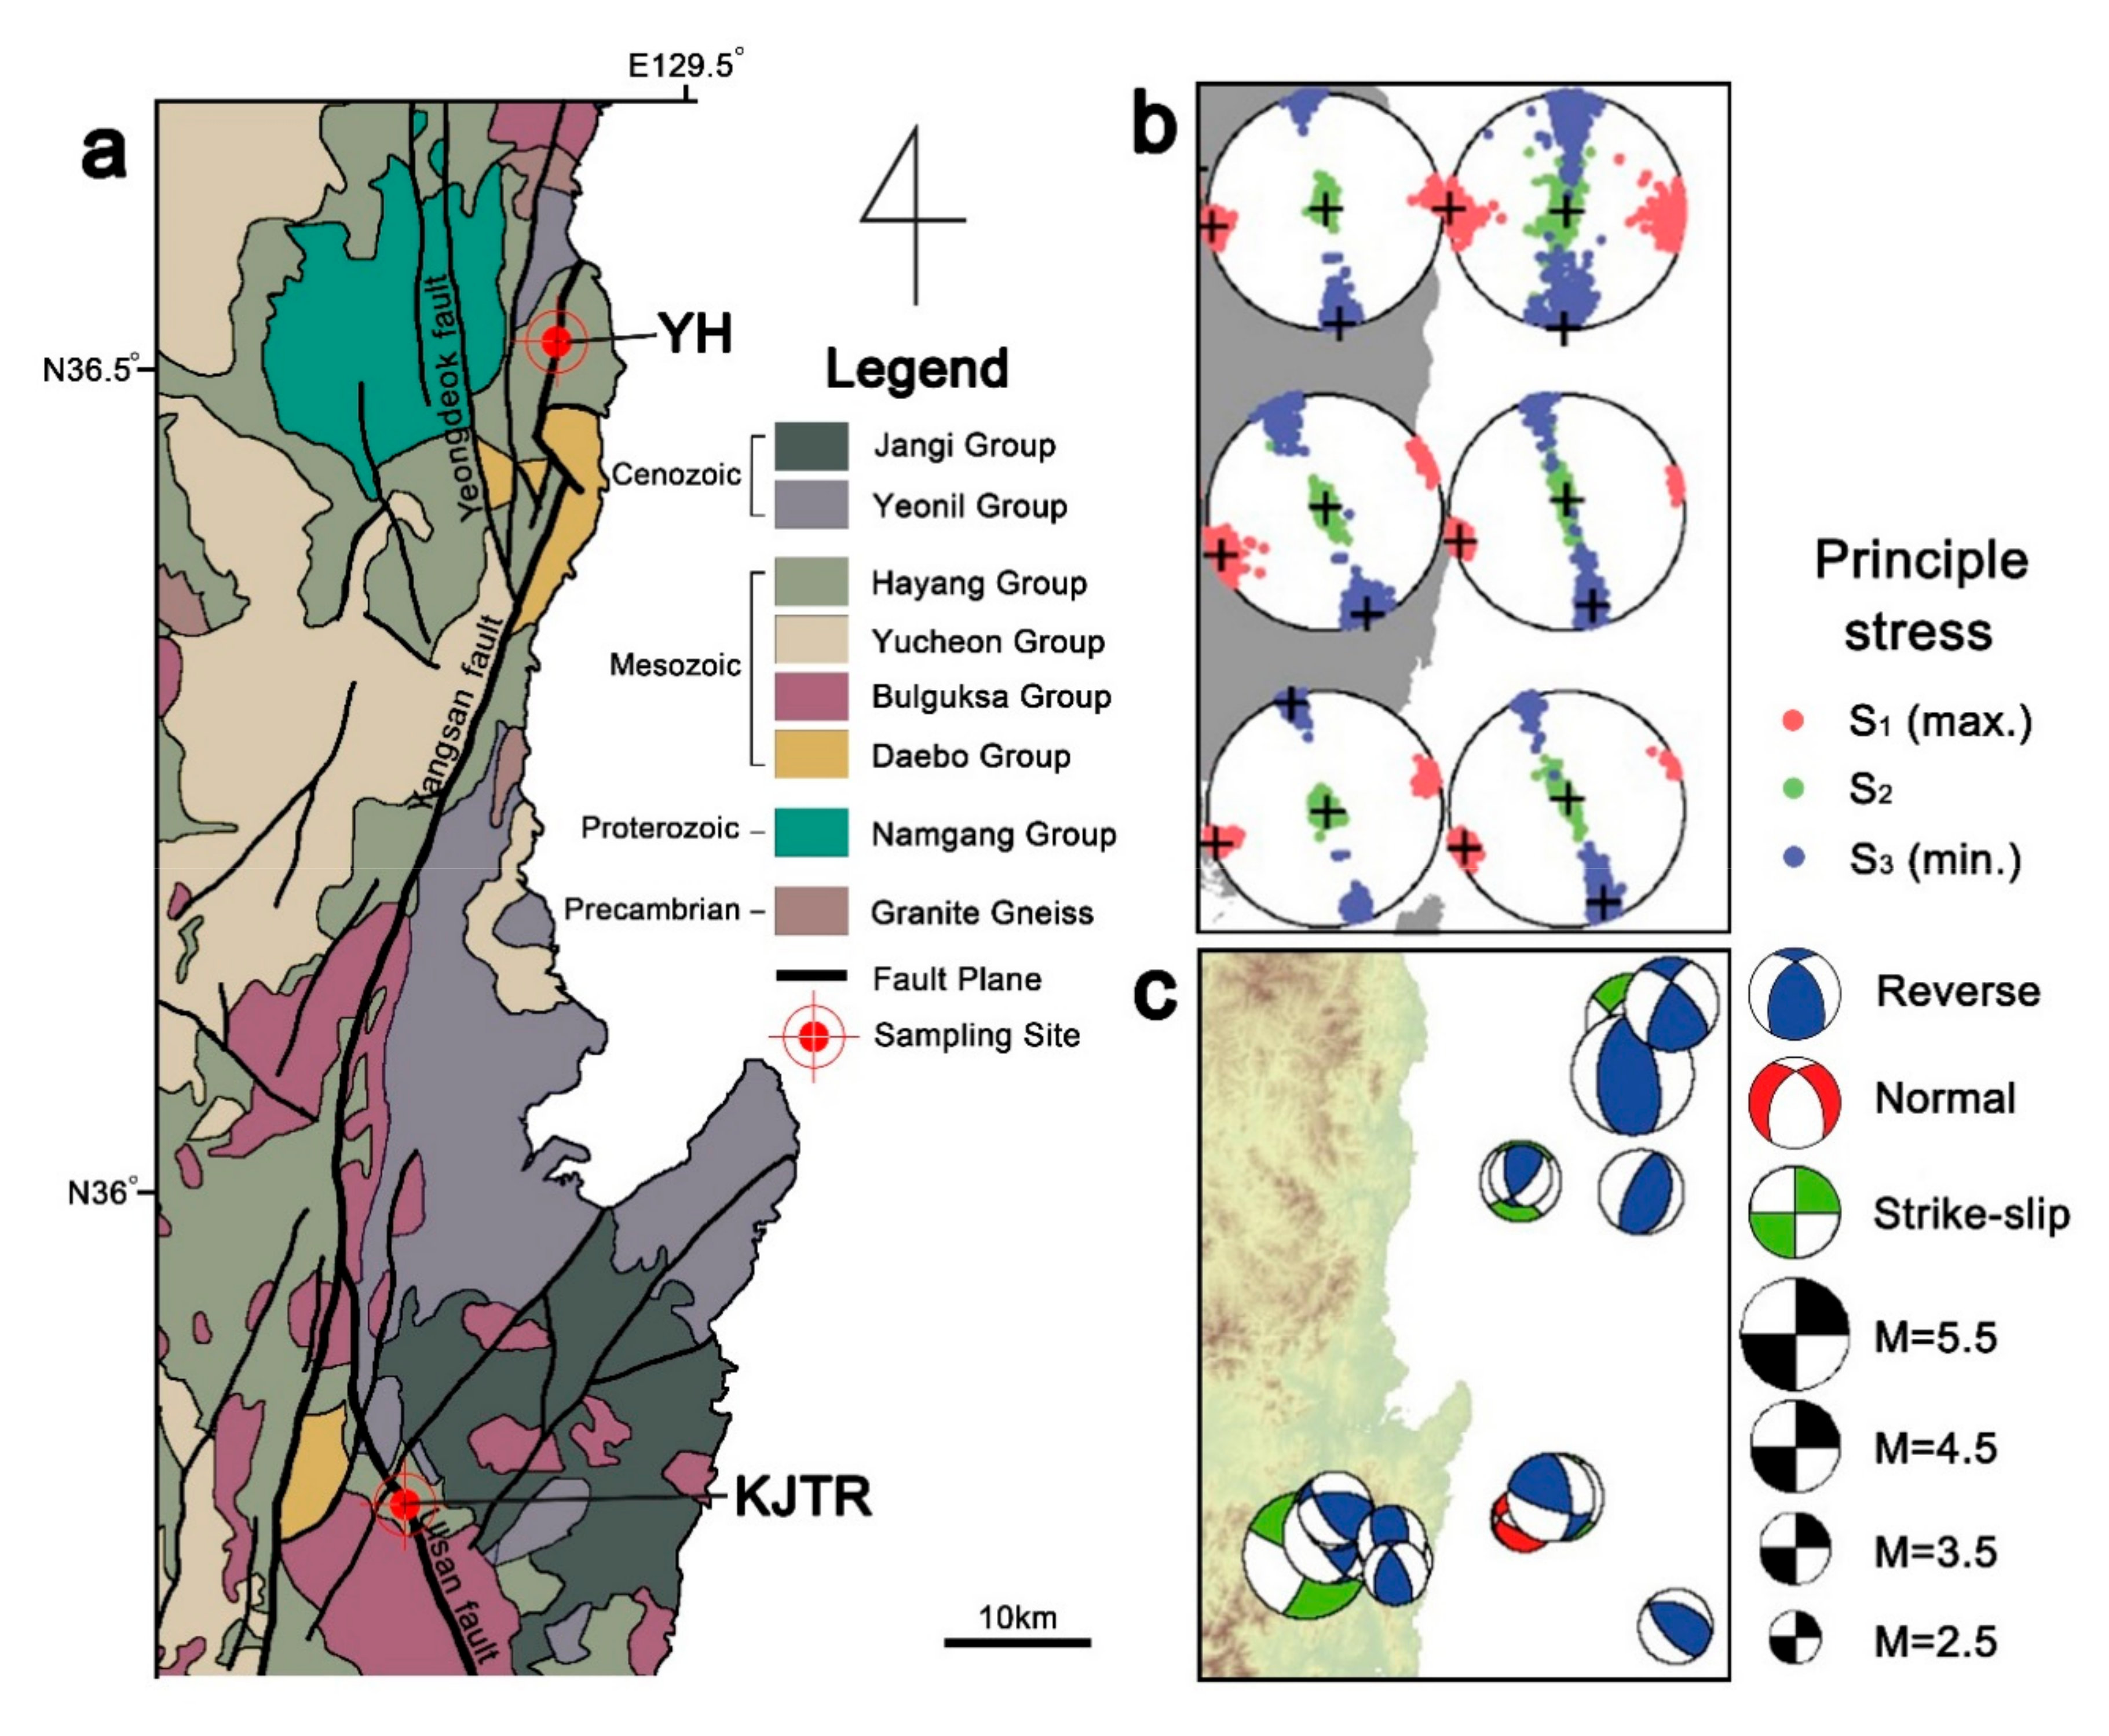
2. Geological Setting

Near the eastern boundary of the Eurasian Plate, the southeastern part of the Korean Peninsula is a region with many large faults that can be confirmed by shaded relief or satellite images. The Yangsan fault zone is one of the largest faults at >170 km long with an NNE-SSW strike, which is divided into nine segments (Figure 1, [17]). Since the Cretaceous, the Yangsan fault has been activated at least twice due to large events, such as the collision of the Indian Plate and the opening of the East Sea (Japan Sea) [18]. From K-Ar illite dating for the area where the main fault line of Yangsan fault penetrates, the fault activation ages of 19.6 and 26.1–27.9 Ma for the Bogyeongsa area in the northern part, and 41.5–43.5 and 50.7 Ma for the Sangcheon-ri area in the middle part have been reported [19,20]. In addition, the tectonic environment affecting the Yangsan fault zone is different for each period. During the Eocene, the tensile force in the E-W direction changed to a compressive force in the NE-WS direction, and in the late Paleogene, it changed again to tensile force in the WWN-EES direction due to opening of the East sea [21]. During this process, the Yangsan and Ulsan faults experienced both right-lateral and left-lateral motions. The Yeonghae area, which is the northernmost part of the Yangsan fault zone, is also thought to have been affected by the same tectonic environment. The host rocks distributed in and around the Yangsan fault site (YH) are upper Cretaceous sedimentary rocks. The Ocheondong Formation is composed of red sandstone and conglomerate; the Sinyangdong Formation of the Hayang group is composed of black shale, gray sandstone, and conglomerate. In addition, the Ipbong porphyry, which is considered a porphyry or porphyry tuff, is in contact with sedimentary rock [22]. The Paleoproterozoic green schist (1841.5 ± 9.6 Ma), Yeongdeok pluton with Mesozoic Triassic reddish granite (249.1 ± 2.3 Ma and 242.4 ± 2.4 Ma), and Changpo pluton with Jurassic fine granite (193.2 ± 1.9 to 188.0 ± 2.0 Ma and 192.9 ± 1.7 Ma) are distributed in the area [23]. According to a previous study on another fault outcrop in the same fault zone, the fault rock is composed of quartz and illite. In addition, dolomite is observed instead of the feldspar commonly found in other parts of the Yangsan fault [22].
The NNW-SSE striking Ulsan fault has a north end in contact with the Yangsan fault, and several previous studies have shown that it is closely related to the Yangsan fault (Figure 1). The Ulsan fault, which is thought to have been formed after the activation of the Yangsan fault, showed at least two times more activation [24]. The host rocks distributed in and around the Ulsan fault site (KJTR) are from the Cretaceous Bulguksa Formation composed of amphibole biotite granite or biotite granite (49.7 ± 0.1 Ma) and black shale [25]. In addition, the Cenozoic Yeonil Formation and the Beomgok-ri Formation, which are composed of conglomerate, andesite (21.3 ± 2.0 Ma), and tuff are in contact with the Bulguksa Formation [26,27]. According to a previous study on another fault outcrop in the same fault zone, fault rock is mainly composed of quartz, feldspar, and smectite; chlorite, illite, and kaolinite are rarely observed [28].
Recently, there have been two earthquakes of magnitude 5.4 (2017) and 5.8 (2016) in the study area. Therefore, investigations into the tectonic environment have begun with seismic wave-derived focal mechanisms. According to the seismic and geophysical prospecting results, the maximum principle axis (S1) is mainly in the EEN-WWS to E-W direction, and the minimum principle axis (S3) is in the NNW-SSE to N-S direction (Figure 1b, [29]). Therefore, the type of recently occurring earthquakes in the region are right-lateral strike slip fault or reverse fault (Figure 1c, [29]).

3. Experimental Method

3.1. Sampling Site

In the outcrop, the fault rock was divided into fault gouge, cataclasites, and damage zone, and among them, samples were collected in the fault gouge and cataclasites, which are distinguished by the size and amounts of clasts, and the presence of a foliated matrix [31]. The KJTR site is a fault outcrop (N 35°48′45.7″, E 129°17′13.6″) in the Cheongundong region corresponding to the northern part of the Ulsan fault. It is thought that the outcrop is located on the main fault trace. The KJTR-1, -2, -3, and -4 sites are outcrops exposed by excavating approximately 10 m of the area through which the main fault trace penetrates. While the fault damage zone is several meters thick, the individual fault core is less than 30 cm thick. The main fault zone rock is a yellowish fault gouge in the case of KJTR-1, and the clay mineral content is high. Furthermore, sub-millimeter-sized clasts are observed. In the case of KJTR-2, -3, and -4, yellowish-red cataclasites are observed and clasts cannot be confirmed with the naked eye. Fault types of the KJTR sites are transpressional faults that contain sinistral and reverse components. Generally, the fault plane dips more than 70° to the WSW except for KJTR-2 (low dip) and KJTR-3 (dips to ESE). Especially in the case of KJTR-4, the upper boundary with the Quaternary sedimentary layer is clearly observed at the outcrop and appears to have a reverse component of 1 m (Figure 2d). The YH site is a fault outcrop (N 36°31′19″, E 129°24′41″) in the Yeonghae region corresponding to the northern part of the Yangsan fault. The outcrop is distributed along the riverbed for approximately 200 m, is of approximately 60 cm high, and is developed in almost straight lines in the E-W direction (Figure 2e,f). The fault plane can be partially identified throughout the outcrop. The fault plane differs slightly depending on the outcrop, but it generally dips at approximately 70° in the NNW direction. Fault rocks in the outcrop are classified into fault gouge, cataclasite, and fault damage zones based on field observations. The fault is bordered by Paleoproterozoic biotite gneiss and Mesozoic Cretaceous sedimentary rock and has a N-S to NNW-SSE strike and a dip of 70° or higher. The cataclasites observed in outcrops are purple, yellow, and gray in color, and the thickness of each layer varies from several millimeters to several meters. The fault gouge is usually red or reddish-purple, parts of which contain clasts of sizes less than 3 cm. The fault gouge and cataclasite alternately appear with irregular thicknesses, and various structures can be identified, which can confirm the shear sense of each layer. The fault plane and fault rock type measured in each outcrop and the slip orientation and host rock information are summarized in Table 1. One sample (YH-1) from the fault gouge and two samples (YH-2, -3) from the cataclasite were collected at the YH site. Furthermore, four samples (fault gouge KJTR-1 and cataclasite KJTR-2, -3, -4) were collected from the fault rock, which are distributed in the main fault zone at the KJTR site (Figure 2). The orientation of each sample was recorded, and the collected samples were naturally dried for 2 days, and then cold-mounted using glycol methacrylate resin.

3.2. Synchrotron Computational Tomography

We obtained μ-CT images from the 6C Biomedical Imaging (BMI) beamline of the Pohang Light Source-II [32]. This beamline provides monochromatic X-ray beams between 10 and 50 keV and uses a multi-pole wiggler. In this experiment, a 25 keV X-ray beam with a double crystal monochromator based on the silicon (111) reflection (DCM-V2, Vactron, Daegu, Korea) was used. The sample was mounted on an air-bearing rotation stage (ABRS-150MP-M-AS, Aerotech, Pittsburgh) 36 m away from the beam source. An X-ray microscope including a CdWO4 scintillator facing the (010) direction (Miracrys LLC, Nizhny Novgorod, Russia) was installed 100 mm behind the sample. An objective lens with a magnification of 4× (UPLSAPO4X, Olympus, Tokyo, Japan) and a scientific CMOS A camera (Zyla 5.5, Andor, Belfast, UK) were used. The field-of-view (FOV) was 2.1 mm × 1.75 mm and CT images were taken every 1° during a 180° rotation. The exposure time was varied according to the degree of beam transmission for each sample and was set to 0.3–0.5 s.

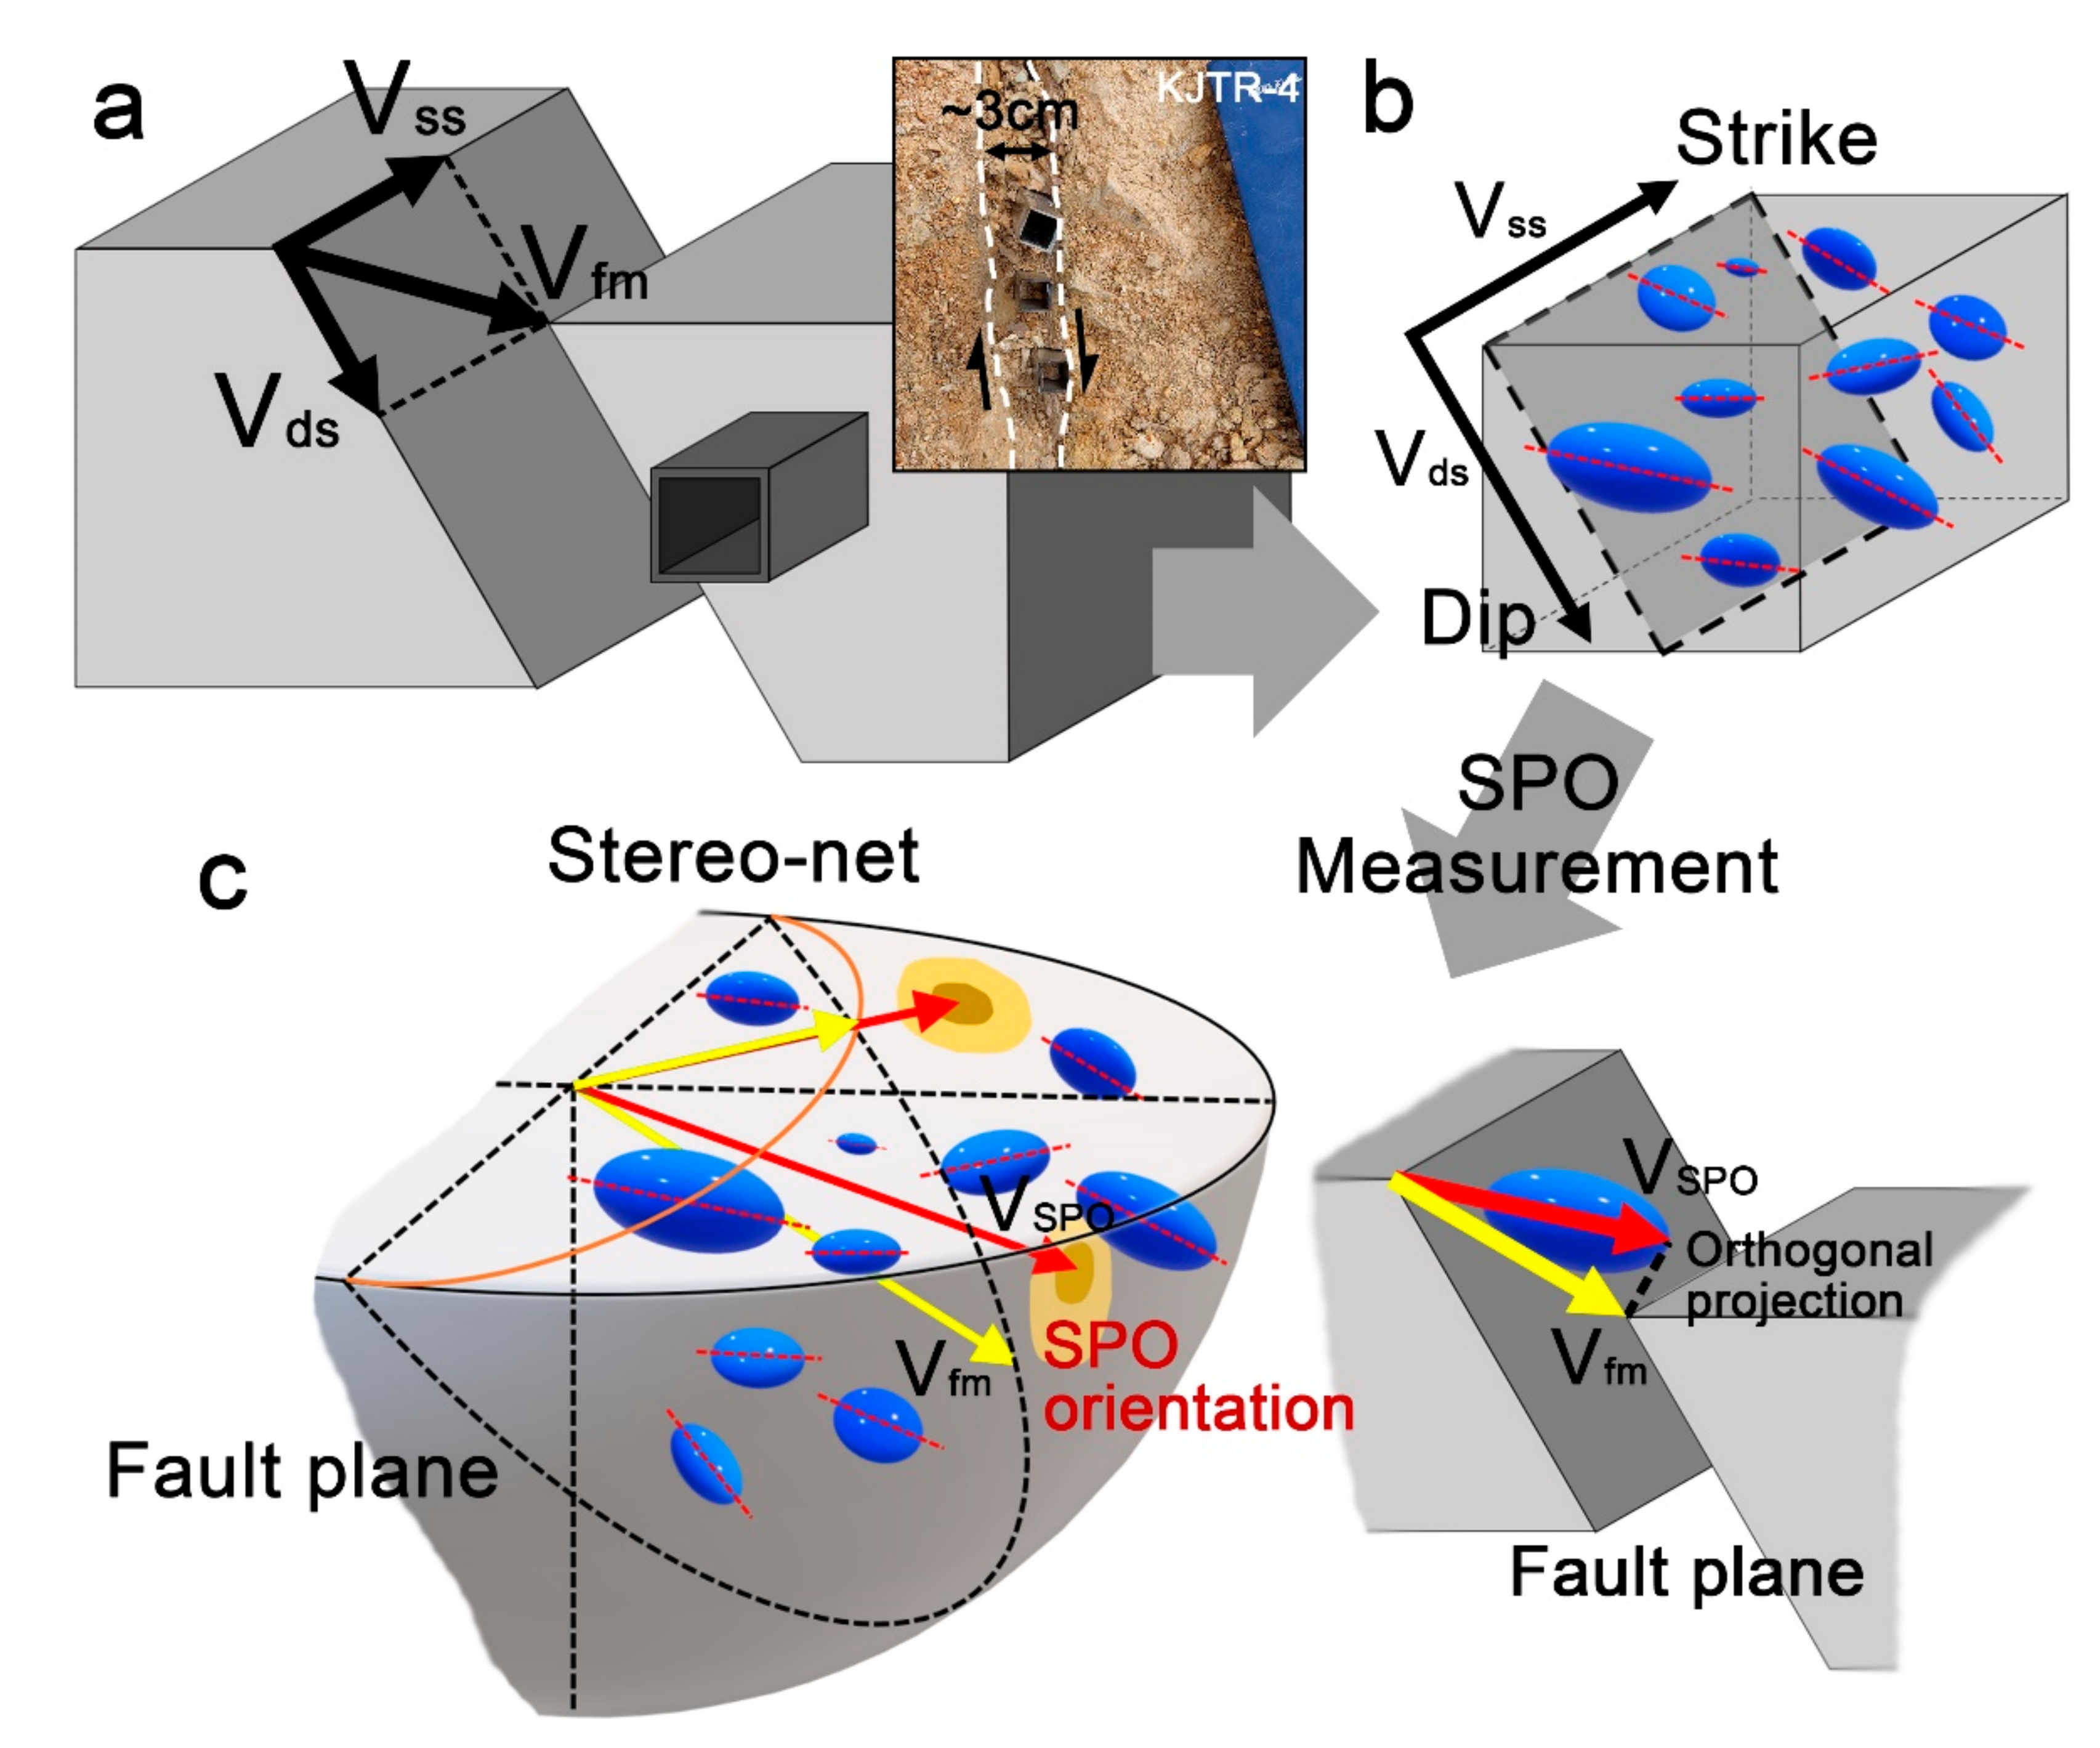
3.3. Shape Preferred Orientation Measurement Method

The method of measuring 3D-SPO of the collected sample was based on Sim et al. (2020) [14]. Octopus 8.9 software (XRE, Gent, Belgium) was used for image reconstruction and all image-related processes were performed using Amira 6.5 (Thermo Fisher Scientific, Hillsboro, OR, USA) and MATLAB (MathWorks, Natick, MA, USA). After reconstruction, all 3D computed tomography (3D-CT) images were cropped in a cube (800 µm × 800 µm × 800 µm) at the center of each sample. For image filtering, a nonlocal mean filter and an unsharp masking filter were used multiple times. In the final image, the sample intensity usually showed a distribution between 25 and 60 k [33,34]. All grains in the images were separated through a binarization process, and small particles with a volume of 100 voxels or less were removed. The grain, recognized as an individual, was transformed into an ellipsoid through an ellipsoid fitting process, which was calculated as the momentum of inertia [35]. In this process, the orientation and length information of each major, intermediate, and minor axes were automatically obtained. The acquired information was plotted on an equal-area stereonet and the SPO distribution index (SDI) was calculated using the information of the major, intermediate, and minor axes. The SDI indicates how the SPO data are scattered from the reference point, which indicates the most frequent orientation [14]. The SDI can be expressed as follows:
γ =   X φ X T   × 100   %
SDI γ =   φ
where SDIγ represents the maximum value of the angle between the γ% of grains surveyed and the densest point; φ has a value between 0° and 180°, and is the angle between the orientation that has the highest frequency (the densest point) and the major axis orientation of the target grain; Xφ is the number of objects in the major axis orientation placed under the spatial angle φ; and XT is the total number of objects; Therefore, the value of SDI, which determines the distribution density, ranges from 0° to 180°. In the stereogram results, which include the major axis SPO distribution, the fault motion orientation (Vfm), is estimated by orthogonal projection of the orientation with the highest SPO density (VSPO) (Figure 3c). This makes it possible to infer the fault motion direction more accurately as compared with the outcrop observation, which only determines the slip orientation by evaluating one 2D cross-section. After obtaining Vfm through the fault plane and VSPO, the fault type can be analyzed by separating Vfm into strike-slip (Vss) and dip-slip (Vds) components (Figure 3a,b).

4. Results

4.1. Three-Dimensional Computed Tomography (3D-CT) Image

CT images, obtained from the synchrotron, were processed through the reconstruction and image-filtering processes mentioned in Section 3.3. To minimize noise during filtering and to highlight grain boundaries, a nonlocal mean filter and an unsharp masking filter were used several times. The total applied filtering process was repeated approximately five to seven times for each image and the result of each filtering process was checked before proceeding to the next step. After the filtering process, a temperature-type filter was applied to visually confirm the grain. Representative CT images of samples corresponding to the fault gouge and cataclasite at the KJTR and YH sites, are presented in Figure 4. In the case of cataclasite (KJTR-3, Figure 4b and YH-2, Figure 4d), there were few large grains. In contrast, for the fault gouge (KJTR-1, Figure 4a and YH-1, Figure 4c), the grain size was generally large. In particular, in the KJTR-1 sample, many relatively large grains and few small grains were found. As it is difficult to directly observe the textures with only 3D-CT images, 2D cross-cut images are provided for each 3D image (Figure 5). In almost all samples (except YH-2), the foliation orientation of the matrix and weak SPO of grains were partially observed.

4.2. Shape Preferred Orientaiton (SPO) Analysis

The orientation of the major, intermediate, and minor axes of quartz grains in all samples were measured and presented on a stereogram (Figure 6 and Figure 7). A total of 33,230 grains were investigated, and the minimum grain size was 3.2 μm, while the maximum size did not exceed approximately 200 μm for all target samples. The frequency of each type of grain classified by grain size and aspect ratio is normalized and shown in Table 2. The aspect ratios of the grains to be investigated ranged from 1 to approximately 15. Detailed statistical information of the investigated grains was released to the (Supplementary Materials Figures S1–S4). In KJTR-1, -2, -3, and -4 samples, the proportion of samples with aspect ratio values of 1.5–2 and 2–3 are high. The YH-2 sample had relatively few grains with a small aspect ratio, while the YH-3 sample had multiple grains with a small aspect ratio (<3). The densest point in the major axis orientation was shown by trend and plunge form, and the SDI20 value. In Figure 5, the major axis length is taken as a proxy for grain size, and the grain size distribution and aspect ratio (a/c) are given as histograms. In samples KJTR-1, -2 and -4, the fault plane dipped steeply towards the west (WSW) and the major axis plunged shallowly towards the north. In sample KJTR-3, the fault plane dipped steeply towards the east (ESE) and the major axis plunged towards the southwest. Moreover, the major axes scatter was relatively low for all samples. The intermediate and minor axes plunged in various directions for each sample. For KJTR-1, the intermediate and minor axes scatter was very high, while in sample KJTR-2, the scatter of all axes was very low. In the KJTR-3 and -4 samples, two axes were distributed on a vertical plane of the densest point of the major axis. At the YH site, the fault plane dipped steeply towards the west (WNW). In all three samples, the major axis plunged shallowly towards the north (Figure 7). In addition, the relatively scattered intermediate axis direction orientation and concentrated minor axis direction orientation were revealed in the stereogram.
The KJTR-1, and YH-1 and -2 samples show large overall SDI values (Table 2). The KJTR-2, -3, and -4 and YH-3 samples show relatively low SDI values, which implies that the density of the major axis orientation is dense. The low SDI (SDI10 and SDI20) value is relatively high in the fault gouge samples (KJTR-1 and YH-1) and low in cataclasite samples except for YH-2. As for the high SDI (SDI40 and SDI50) value, the samples from the KJTR site are relatively low and the samples from the YH site are relatively high.

5. Discussion

5.1. Estimation of Fault Motion

5.1.1. Orientation of Major Axis

The method of estimating fault motion using SPO measurement results of quartz, which is considered to be a rigid body in fault rock, has been previously studied on a 2D plane. It has been confirmed through modeling that elliptical grains were aligned in the P-shear direction through rigid body rotation in a soft matrix [16]. In addition, as a result of measuring the SPO of the fault gouge and breccia quartz grains, it was confirmed that this alignment was also exhibited in natural fault rock samples [11]. Recently, the fault motion was estimated by measuring the SPO of the major axis of the grain in 3D through a CT image of the fault gouge [13,14]. According to previous studies, the densest points of the SPO are aligned in the P-shear direction; therefore, the fault motion direction can be estimated from the SPO. Finally, the fault type can be defined by dividing it into strike-slip and dip-slip components. All of the KJTR site samples presented here showed sinistral strike-slip fault motion with a reverse-slip component (Figure 6 and Table 2). However, there were slight differences in each sample. For KJTR-1, the sinistral-type strike-slip component is relatively strong and the reverse-type dip-slip component appears to be complex; in KJTR-2 and -4, most components are sinistral-type strike-slip components. In the case of samples from the YH site, the SPO is relatively scattered as compared with the KJTR site (Figure 7). Because of the scattered data, it is difficult to achieve reliable estimations from the samples of the KJTR site; however, YH-1 is a fault gouge of a dextral and reverse-type fault, and YH-2 and -3 are cataclasites of sinistral and normal-type fault. For more accurate calculations of the fault motion direction vector, the densest point was orthogonally projected onto the fault plane. The reflected fault motion direction is presented in Table 2 with the rake value. From the calculated rake values, we can predict complex motions that cannot be observed by 2D cross-sections in the field. Even at the same KJTR site, as seen for KJTR-3, the dip-slip component is larger than the strike-slip component. For KJTR-2 and -4, it seems to be the strike-slip type of fault. In addition, for the YH site, the motion of the strike-slip component was dominant.

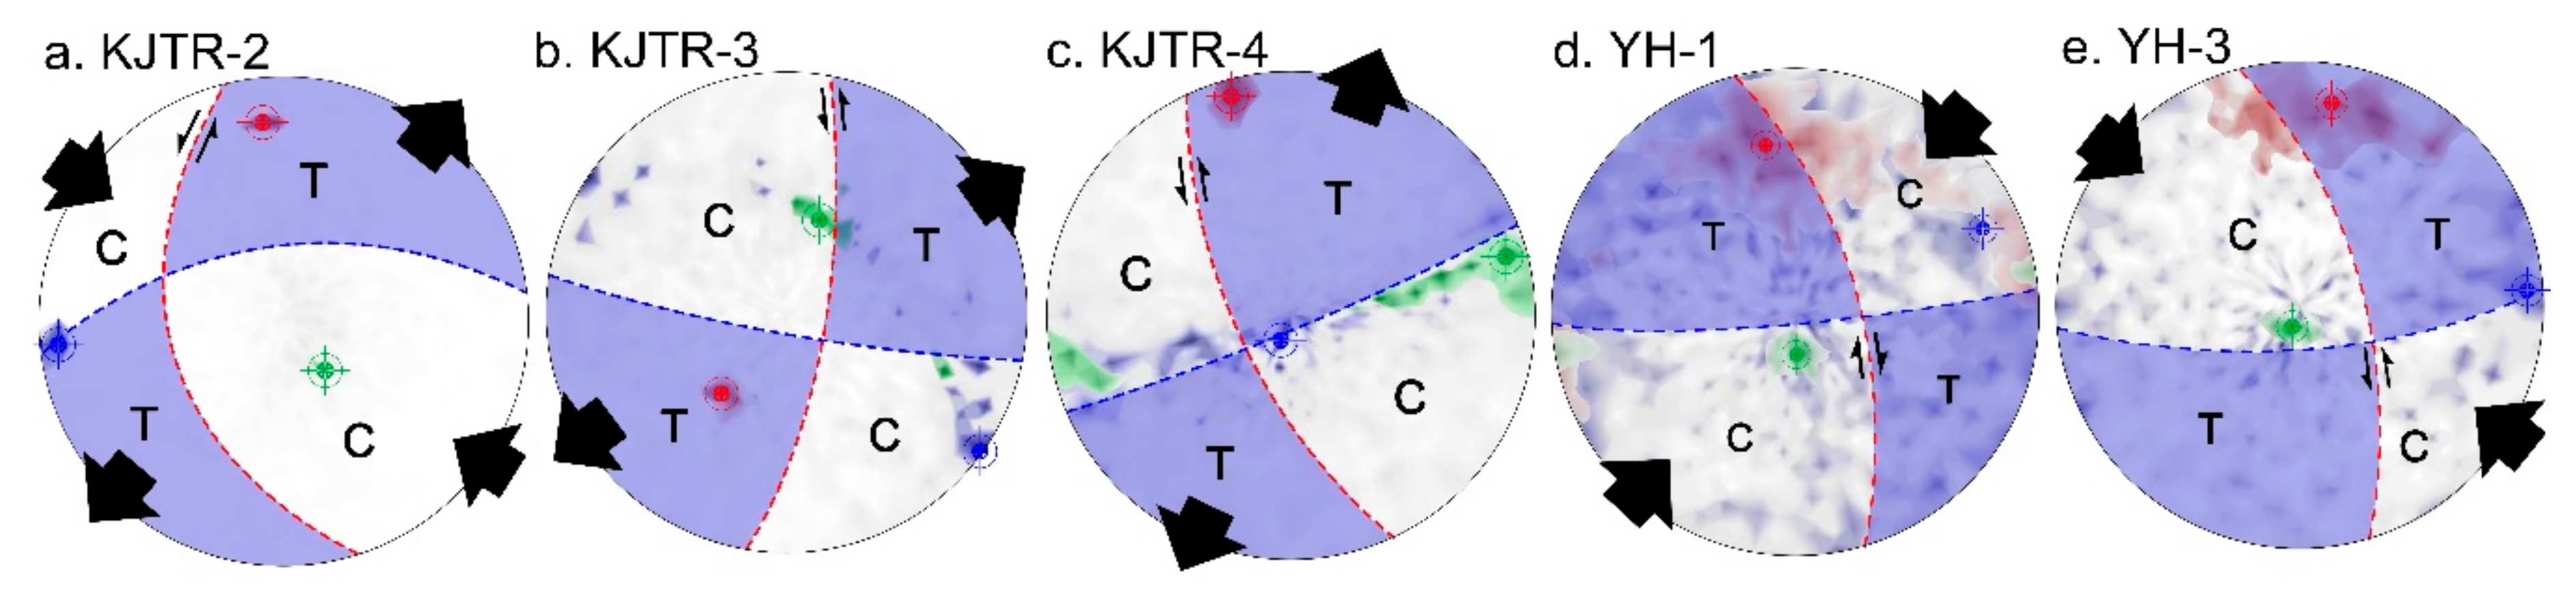
5.1.2. Distribution of Axes on Stereogram

Despite the aforementioned results, the fault motion analysis using the major axis orientation is difficult to apply to fault rocks that have experienced multiple events. Multiple fault activation events, especially in different directions, cause SPO dispersion. Additionally, even a single activation can affect the grain shape and orientation as the tectonic environment changes after activation. In addition, the plastic grain deformation process cannot be completely excluded during multiple fault activation. Furthermore, some of the SPO data (especially in the YH region), in this study, is scattered widely, which is due to the diversity of the active direction and the deformation of the grain shape. However, the large amounts of statistical grain shape and orientation information collected for the three axes are displayed in a stereogram (Figure 6 and Figure 7). Therefore, the limitations of the previous study were supplemented and information about intermediate and minor axes was extracted to obtain additional strain information. Previous studies have been conducted to investigate AMS that acquired information on the magnetic susceptibility of rocks, which was a similar concept to that used in this study [20,23,36,37,38]. The AMS ellipsoid of the rock was calculated by measuring the strength according to the orientation of magnetic susceptibility at least six times, and the strain was analyzed using the orientation and crystallographic characteristics of the major, intermediate, and minor axes [39]. In a similar way, mineral shape changes owing to the strain applied to a mineral can be evaluated using the finite strain theory. The concentration of the major axis orientations is possibly caused by tensile strain, and the concentration of the minor axis is possibly caused by compressive strain. Because the three axes shown in the SPO results are based on the point where the frequency of each axis of the investigated grains is the highest, they do not need to be perpendicular to each other; however, the whole area revealing with the high frequency of grains should be analyzed. Therefore, the distribution of each of the three axes may be different depending on the sample and the region, and different results may be shown. In particular, analyzing the result of the AMS ellipsoid of the previous study and the result of grain shape in this study for a similar context, the stereogram results of this study are similar to those of previous studies [39]. We match the locations of the minor and major axes as shortening and extension axes for each sample and present the stereogram according to the focal mechanism (Figure 8, [40]). Furthermore, the orientation of axis and fault plane of almost all the samples are consistent with field observation results. Therefore, if the grain is oblate due to compressive strain, the minor axis is relatively less scattered and the major and intermediate axes are distributed in a plane perpendicular to the minor axis (in the YH-1, -2, and -3 samples). In addition, in the case of the prolate grains owing to tensile strain, the major axis is relatively less scattered, and the intermediate and minor axes are distributed in a plane perpendicular to the major axis (in the KJTR-1, -3, and -4 samples). If all axes are concentrated, as in KJTR-2, it indicates a triaxial ellipsoid, which can be interpreted as the result of both tensile and compressive strain. Therefore, the form of SPO data is the basis for inferring the environment that created the fabric. Therefore, tension strain affected the major axis orientation in KJTR-3 and -4, compressive strain affected the minor axis orientation in YH-1, -2, and -3, and both tension and compression strain affected KJTR-2. However, for the KJTR-2 sample, although the positions of the three axes are clear, the theoretical positions do not match the observed ones. Samples KJTR-1 and YH-2 are difficult to analyze because the frequency and shape of the orientation of each axis are irregular and the shape is not uniform.

5.2. SPO Interpretation

In this study, the fault rock is separated into two types, i.e., fault gouge and cataclasite. The classification is based on the number and size of grains observed in the fault rock with the naked eye in the field, the touch texture that indicates the clay content, the difference in grain textures, and the color of each fault rock type observed in previous studies. Additionally, on the CT image, the grain size of the KJTR-1 sample was larger than that of the KJTR-2, -3, and -4 samples and grains existed independently in the matrix. The foliated matrix was very well observed in the YH-1 sample (Figure 4 and Figure 5). Classifying the SPO data by the fault rock type, fault gouge samples (KJTR-1 and YH-1) appear more diffusely on the stereogram and show relatively high SDI values. However, cataclasite shows low SDI values in all samples except YH-2 and shows a high density in the SPO distribution of the KJTR sample. From the SPO analysis, the grain alignment of the cataclasite appears to be relatively better than that of the fault gouge. This means that either the rigid body rotation of the quartz grain in the cataclasite occurs more ideally than in the fault gouge, or that the plastic deformation or broken grains, which are factors not considered in the SPO measurement, align in the cataclasite. In particular, owing to the differences in the results of samples collected over a wide area, such as at the YH site, we cannot exclude the possibility of the interpretation of different continuous events. However, the fault motion direction estimated from the fault gouge and the cataclasite showed similar results when examining the YH site samples of the same fault zone. Therefore, although the fault rock type may affect the SPO dispersion, there is no problem in estimating the fault motion. To investigate the fault motion of a fault zone that appears over a wide area due to several fault activations, it is necessary to conduct regional analysis by systematically collecting samples for each fault zone.
According to previous studies, general factors such as the grain size and aspect ratio of the grains in fault rock samples do not have a significant effect on SPO [14]. This study presented a large amount of data that can assess various types of SPO data that may affect the interpretation of fault motion. The SPO data presented in the results were investigated for more than 1000 grains obtained from at least three samples per outcrop; therefore, the sample set was large enough. The results are different depending on the fault rock sample characteristics from which the following two point of discussions are raised: First, when comparing the two sites of the KJTR and YH, the SPO of the YH-1, -2, and three samples collected from a relatively wide fault zone are very scattered (Figure 7). The distribution of the intermediate axis orientation as well as the major axis is scattered, as confirmed by the high SDI value (Table 2). According to a previous study conducted at the YH site, from K-Ar dating for illite, at least five fault activations were identified, and evidence of both right-lateral and left-lateral strike-slip fault types were observed [41]. Therefore, the complex multiple activities at the YH site affected the scattered SPO results. The SPO result of the KJTR site, which shows a relatively focused major axis orientation, is presumed to be due to the thin and clear main fault zone well revealed in field observations (Figure 2a–d). Second, various orientation distributions of the three axes appear in stereogram. The SPO result can be interpreted similarly to the AMS result, as mentioned in Section 5.1.2. The strength of the analysis method used in this study over AMS is that it can produce more reliable results from a large amount of data. Therefore, we analyzed SPO data through a focal mechanism solution to analyze SPO data with a complex pattern plotted on a stereogram using a large dataset. The focal mechanism solution is a seismic and geophysical method for calculating the fault motion and strain using seismic waves from which one can infer the tensile and compressive strain directions from the SPO data. It can be inferred that the tensile strain would have acted in the orientation where the distribution of the major axis was concentrated, and the compressive strain would have been applied in the orientation where the distribution of the minor axis was concentrated. In this process, the type of fault motion can be inferred by the pattern in the stereogram. In the case of the KJTR-3 and -4 samples, the pattern when the tension was applied was shown; therefore, the tension would have acted in the direction in which the major axis orientation was distributed (Figure 8b,c). Thus, it can be inferred that both samples have a dominant sinistral-type strike-slip component. In the case of the YH-1 and 3 samples, the patterns when compression was applied are shown; therefore, compression would have acted in the direction in which the minor axis orientation was distributed (Figure 8d,e). Thus, it can be inferred that YH-1 has a dominant dextral-type strike-slip component and YH-3 has a dominant sinistral-type strike-slip component. However, extension can be accomplished by the minimum compressive force. Consequently, whether tensile or compressive strain is applied, it is difficult to clearly determine the finite strain by analyzing only three axes of SPO. In addition, in the case of KJTR-2, both types of strain affected the fault system (Figure 8a). Therefore, it is inferred that the sinistral-type strike-slip component is the dominant factor affecting the fault. In the case of YH site samples, since the orientation of the axes is very scattered, it is difficult to estimate the fault motion using the focal mechanism, because, as mentioned above, various fabrics overlap owing to multiple fault activations. Nevertheless, a statistical analysis of the three axes of SPO provides information about the direction of 3D fault motion, and about the strain that led to fault activation. Therefore, aggregating an extensive SPO data from a large number of samples from various outcrops in a fault zone could provide basic information to infer tectonic environment and the fault evolution history.

6. Conclusions

The SPO analysis was performed on outcrops of the Yangsan and Ulsan fault zones, which are the largest faults in the southeastern Korean Peninsula. The direction of the fault slip was estimated from the major axis orientation using the recently developed 3D-SPO analysis method. Furthermore, the fault type was inferred using the focal mechanism solution from the distribution of stereogram data, revealing the orientation of the three axes. As a result of investigating seven samples in two regions, it was revealed that KJTR-2, -3, and -4 and YH-1 and -3 could be defined, as strike-slip faults. Among these, the sinistral strike-slip component was dominant in all samples except YH-1, and the dextral strike-slip component was dominant. Depending on the type, characteristics, and activation environment of the fault rock, the results of the SPO analysis can vary. In particular, the SPO data of fault rocks that have experienced multiple fault activation events are very scattered. Nevertheless, the 3D-SPO analysis method using μ-CT images is a reliable method for estimating the direction of fault slips in a thin fault core.

Supplementary Materials

The following are available online at https://www.mdpi.com/2075-163X/10/11/994/s1, Figure S1: The distribution of grain size and aspect ratio of investigated grains in KJTR samples, Figure S2: The distribution of grain size and aspect ratio of investigated grains in YH samples, Figure S3: The results showing the distribution of actual values of grain size (c) and aspect ratio (c/a) of grains to be investigated, Figure S4: Anisotropy, elongation, and flatness distributions of the investigated grains.

Author Contributions

Conceptualization, H.S. and Y.S.; Data curation, H.S. and S.H.; Formal analysis, H.S., S.H. and S.-J.C.; Funding acquisition, Y.S.; Methodology, H.S.; Project administration, Y.S. Software, H.S.; Supervision, Y.S.; Writing—Original draft, H.S.; Writing—Review and editing, H.S. and Y.S. All authors have read and agreed to the published version of the manuscript.

Funding

This study was funded by the Korea Meteorological Administration Research and Development Program under grant KMI2018-01910.

Acknowledgments

We would like to appreciate the reviewers and editor who reviewed this paper, and also thank those who helped us with the editing process. This study was supported by the study on submarine active faults and evaluation of possibility of submarine earthquakes in the southern part of the East Sea, Korea of the Ministry of Land, Infrastructure, and Transport.

Conflicts of Interest

The authors declare no conflict of interest.

References

  1. Wang, W.H.; Chen, C.H. Static stress transferred by the 1999 Chi-Chi, Taiwan, earthquake: Effects on the stability of the surrounding fault systems and aftershock triggering with a 3D fault-slip model. Bull. Seismol. Soc. Am. 2001, 91, 1041–1052. [Google Scholar] [CrossRef]
  2. Hippett, J.F.M. ‘V’-pull-apart microstructures: A new shear-sense indicator. J. Struct. Geol. 1993, 15, 1393–1403. [Google Scholar] [CrossRef]
  3. Mukherjee, S. Mineral fish: Their morphological classification, usefulness as shear sense indicators and genesis. Int. J. Earth Sci. 2011, 100, 1303–1314. [Google Scholar] [CrossRef]
  4. Leiss, B.; Siegesmund, S.; Weber, K. Texture asymmetries as shear sense indicators in naturally deformed mono- and polyphase carbonate rocks. Textures Microstruct. 1999, 33, 61–74. [Google Scholar] [CrossRef] [Green Version]
  5. Goscombe, B.D.; Passchier, C.W. Asymmetric boudins as shear sense indicators—An assessment from field data. J. Struct. Geol. 2003, 25, 575–589. [Google Scholar] [CrossRef]
  6. Rochette, P.; Jackson, M.; Aubourg, C. Rock magnetism and the interpretation of anisotropy of magnetic susceptibility. Rev. Geophys. 1992, 30, 209–226. [Google Scholar] [CrossRef]
  7. Van der Pluijm, B.A.; Ho, N.-C.; Peacor, D.R. High-resolution X-ray texture goniometry. J. Struct. Geol. 1994, 16, 1029–1032. [Google Scholar] [CrossRef] [Green Version]
  8. Wenk, H.-R.; Kanitpanyacharoen, W.; Voltolini, M. Preferred orientation of phyllosilicates: Comparison of fault gouge, shale and schist. J. Struct. Geol. 2010, 32, 478–489. [Google Scholar] [CrossRef]
  9. Vernet, E.; Casas-Sainz, A.M.; Roman-Berdiel, T.; Marcen, M.; Osacar, M.C. Variable magnetic fabrics under heterogeneous deformation across a shallow fault zone in the Iberian Chain (Monroyo thrust, N Spain). J. Iber. Geol. 2019, 45, 111–127. [Google Scholar] [CrossRef]
  10. Roman-Berdiel, T.; Casas-Sainz, A.M.; Oliva-Urcia, B.; Calvin, P.; Villalain, J.J. On the influence of magnetic mineralogy in the tectonic interpretation of anisotropy of magnetic susceptibility in cataclastic fault zones. Geophys. J. Int. 2019, 216, 1043–1061. [Google Scholar] [CrossRef]
  11. Cladouhos, T.T. Shape preferred orientation of survivor grains in fault gouge. J. Struct. Geol. 1999, 21, 419–436. [Google Scholar] [CrossRef]
  12. Smith, S.A.F.; Collettini, C.; Holdsworth, R.E. Recognizing the seismic cycle along ancient faults: CO2-induced fluidization of breccias in the footwall of a sealing low-angle normal fault. J. Struct. Geol. 2008, 30, 1034–1046. [Google Scholar] [CrossRef]
  13. Saur, H.; Senechal, P.; Boiron, T.; Aubourg, C.; Derluyn, H.; Moonen, P. First investigation of quartz and calcite shape fabrics in strained shales by means of X-ray tomography. J. Struct. Geol. 2020, 130, 103905. [Google Scholar] [CrossRef]
  14. Sim, H.; Song, Y.; Kim, J.; Yang, E.; Yun, T.S.; Lim, J.-H. Measurement of 3D-Shape Preferred Orientation (SPO) using synchrotron μ-CT: Application for estimation of fault motion sense in fault gouge. Minerals 2020, 10, 528. [Google Scholar] [CrossRef]
  15. Masuda, T.; Michibayashi, K.; Ohta, H. Shape preferred orientation of rigid particles in a viscous matrix: Re-evaluation to determine kinematic parameters of ductile deformation. J. Struct. Geol. 1995, 17, 115–129. [Google Scholar] [CrossRef]
  16. Shelley, D. Asymmetric shape preferred orientations as shear-sense indicators. J. Struct. Geol. 1995, 17, 509–517. [Google Scholar] [CrossRef]
  17. Choi, J.-H.; Kim, Y.-S.; Klinger, Y. Recent progress in studies on the characteristics of surface rupture associated with large earthquakes. J. Geol. Soc. Korea 2017, 53, 129–157. (In Korean) [Google Scholar] [CrossRef]
  18. Seo, K.; Ha, S.; Lee, S.; Kang, H.-C.; Son, M. Geometry and Kinematics of the Yeongdeok Fault in the Cretaceous Gyeongsang Basin, SE Korea. J. Petrol. Soc. Korea 2019, 28, 171–193. (In Korean) [Google Scholar]
  19. Sim, H.; Song, Y.; Son, M.; Park, C.; Choi, W.; Khulganakhuu, C. Reactivated Timings of Yangsan Fault in the Northern Pohang Area, Korea. Econ. Environ. Geol. 2017, 50, 97–104. (In Korean) [Google Scholar]
  20. Song, Y.; Park, C.; Sim, H.; Choi, W.; Son, M.; Khulganakhuu, C. Reactivated timings of Yangsan fault in the Sangcheon-ri area, Korea. Econ. Environ. Geol. 2016, 49, 97–104. (In Korean) [Google Scholar]
  21. Cheon, Y.; Cho, H.; Ha, S.; Kang, H.-C.; Kim, J.-S.; Son, M. Tectonically controlled multiple stages of deformation along the Yangsan Fault Zone, SE Korea, since Late Cretaceous. J. Asian Earth Sci. 2019, 170, 188–207. [Google Scholar] [CrossRef]
  22. Choo, C.-O.; Song, S.-J.; Jang, Y.-D. Mineralogy of the gouge zone in Yangsan Fault, Yeongdeok and its implications for fault activity. In Proceedings of the 2013 Conference of the Geological Society of Korea (2013), Jeju, Korea, October 2013; p. 261. (In Korean). [Google Scholar]
  23. Kang, H.-C.; Cheon, Y.; Ha, S.; Seo, K.; Kim, J.-S.; Shin, H.C.; Son, M. Geology and U-Pb age in the eastern part of Yeongdeok-gun Gyeongsangbuk-do, Korea. J. Petrol. Soc. Korea 2018, 27, 153–171. [Google Scholar]
  24. Han, S.-R.; Park, J.; Kim, Y.-S. Evolution modeling of the Yangsan-Ulsan fault system with stress changes. J. Geol. Soc. Korea 2009, 45, 361–377. (In Korean) [Google Scholar]
  25. Kim, C.-S.; Kim, G.-S. Petrogenesis of the early tertiary A-type Namsan alkali granite in the Kyongsang basin, Korea. Geosci. J. 1997, 1, 99–107. [Google Scholar] [CrossRef]
  26. Tateiwa, I. Geological Atlas of Chosen, No.2. Ennichi, Kyuruho and Choyo sheets, 1:50,000. Geol. Surv. Chosen 1924, 6. (In Japanese) [Google Scholar]
  27. Shin, S.-C. Revised fission-track ages and chronostratigraphies of the Miocene basin-fill volcanics and basements, SE Korea. J. Petrol. Soc. Korea 2013, 22, 83–115. (In Korean) [Google Scholar] [CrossRef] [Green Version]
  28. Chang, T.W.; Chae, Y.J.; Choo, C.O. Formation of alteration minerals in gouges of Quaternary faults at the eastern blocks of the Ulsan fault, Southeastern Korea. J. Miner. Soc. Korea 2005, 18, 205–214. (In Korean) [Google Scholar]
  29. Soh, I.; Chang, C.; Lee, J.; Hong, T.-K.; Park, E.-S. Tectonic stress orientations and magnitudes, and friction of faults, deduced from earthquake focal mechanism inversions over the Korean Peninsula. Geophys. J. Int. 2018, 213, 1360–1373. [Google Scholar] [CrossRef] [Green Version]
  30. KIGAM. Geological Map of Korea (1:1,000,000); Korea Institute of Geology, Mining and Minerals: Daejeon, Korea, 1995. [Google Scholar]
  31. Passchier, C.W.; Trouw, R.A. Microtectonics, 2nd ed.; Springer: Berlin/Heidelberg, Germany; New York, NY, USA, 2005; p. 114. [Google Scholar]
  32. Lim, J.H.; Seo, S.J.; Kim, H.Y.; Ryu, S.; Huang, J.Y.; Lee, C.S.; Seo, I.D.; Kim, S.G.; Lee, D.; Cho, M.H. Station for structural studies on macro objects: Beamline 6C Bio Medical Imaging at the Pohang Light Source-II. Biodesign 2017, 5, 53–61. [Google Scholar]
  33. Li, Z.; Yu, L.; Trzasko, J.D.; Lake, D.S.; Blezek, D.J.; Gletcher, J.G.; McCollough, C.H.; Manduca, A. Adaptive nonlocal means filtering based on local noise level for CT denoising. Med. Phys. 2014, 41, 011908. [Google Scholar] [CrossRef]
  34. Deng, G. A generalized unsharp masking algoritm. IEEE Trans. Image Process. 2011, 20, 1249–1261. [Google Scholar] [CrossRef] [PubMed]
  35. Kang, D.H.; Lee, J.H.; Choo, J.; Yun, T.S. Pore directivity of soils subjected to shearing: Numerical simulation and image processing. In Proceedings of the GeoCongress 2012: State of the Art in Practice and Geotechnical Engineering. American Society of Civil Engineers (ASCE), Reston, VA, USA, 25–29 March 2012; pp. 2342–2351. [Google Scholar]
  36. Ha, S.; Cheon, Y.; Kang, H.-C.; Kim, J.-S.; Lee, S.-K.; Son, M. Geometry and kinematics of the subsidiary faults of the Ilgwang fault, SE Korea. J. Geol. Soc. Korea 2016, 52, 31–50. [Google Scholar] [CrossRef]
  37. Cheon, Y.; Ha, S.; Son, M. Geometry and kinematics of fault systems in the Uiseong block of the Gyeongsang Basin, and their roles on the basin evolution. J. Geol. Soc. Korea 2017, 53, 241–264. [Google Scholar] [CrossRef]
  38. Song, Y.; Ha, S.; Lee, S.; Kang, H.-C.; Choi, J.-H.; Son, M. Quaternary structural characteristics and paleoseismic interpretation of the Yangsan Fault at Dangu-ri, Gyeongju-si, SE Korea, through trench survey. J. Geol. Soc. Korea 2020, 56, 155–173. [Google Scholar] [CrossRef]
  39. Cho, H.; Kim, M.-C.; Kim, H.; Son, M. Anisotropy of magnetic Susceptibility (AMS) of the Quaternary faults, SE Korea: Application to the determination of fault slip sense and paleo-stress field. J. Petrol. Soc. Korea 2014, 23, 75–103. [Google Scholar] [CrossRef] [Green Version]
  40. Marrett, R.; Allmendinger, R.W. Kinematic analysis of fault-slip data. J. Struct. Geol. 1990, 12, 973–986. [Google Scholar] [CrossRef]
  41. Hong, S. Mineralogical and Micro-Textural Characteristics of the Fault Rocks and Fault Re-Activation Ages of the Yangsan Fault in the Yeonghae Area. Master’s Thesis, Yonsei University, Seoul, Korea, 2020. [Google Scholar]
Figure 1. (a) Geological map of the southeastern part of Korea Peninsular (modified from the Korean Institute of Geoscience and Mineral Resources (KIGAM) geological map 1:1,000,000 [30]). Samples were obtained from the NNE-SSW striking Yangsan fault zone and NNW-SSE striking Ulsan fault zone; (b) Results of stress inversions using the misfit angle method (modified from Soh et al., 2018 [29]); (c) Map of the Southeastern Korean Peninsula showing the recent earthquake focal mechanisms (modified from Soh et al., 2018 [29]).
Minerals 10 00994 g001
Figure 2. Photos of outcrops from which samples were taken. (ad) Four samples (Ulsan fault site (KJTR)-1, -2, -3, -4) were collected from the trench outcrops shown at the KJTR site. The fault plane is represented by solid lines and the foliation observed in the surrounding rock and distinct layer boundaries observable in the field are represented by dotted lines; (e,f) Two samples (Yangsan fault site (YH)-1 and -2) were obtained from the fault zone at the YH site. Fault traces are shown as solid lines, and the bedrock-soil interface as dashed lines.
Minerals 10 00994 g002
Figure 3. Schematic diagram of the shape preferred orientation (SPO) measurements. (a) Schematic diagram showing the fault slip by separating it into strike- and dip-direction vectors; (b) The orientations of grains included in the sample obtained through coring are measured through three-dimensional computed tomography (3D-CT) images; (c) SPO data representing grain orientations and fault planes are projected onto the stereonet to infer the direction of fault motion (Vfm). Vss, vector of strike-slip; Vds, vector of dip-slip; Vfm, vector of fault motion; and VSPO, vector of densest point of SPO.
Minerals 10 00994 g003
Figure 4. Synchrotron CT image of fault rock samples. After the image filtering process, the temperature type filter was used, adjusting the filter value so that the grains inside the fault rock could be easily seen. (a) KJTR-1 (cataclasite) and (b) KJTR-3 (fault gouge), from the Ulsan fault; (c) YH-1 (fault gouge) and (d) YH-3 (cataclasite), corresponding to the Yangsan fault, show different textures.
Minerals 10 00994 g004
Figure 5. 2D images of a cross-section taken from the CT images (Figure 4) of each sample. (a) KJTR-1; (b) KJTR-3; (c) YH-1; (d) YH-2.
Minerals 10 00994 g005
Figure 6. SPO measurements of KJTR samples (KJTR-1, (a); KJTR-2, (b); KJTR-3, (c); KJTR-4, (d)) shown in stereoplots (lower-hemisphere, equal-area projection). Major axes are shown in red, intermediate axes in blue, and minor axes in green. For all axes, the dip azimuth, dip angle, and SPO distribution index (SDI20) values are given. Histograms show the distribution of grain sizes and aspect ratios. The number of grains analyzed, N, is given at the bottom.
Minerals 10 00994 g006
Figure 7. SPO measurements of YH samples (YH-1, (a); YH-2, (b); YH-3, (c)) shown in lower-hemisphere stereoplots (lower-hemisphere, equal-area projection). Major axes are shown in red, intermediate axes in blue, and minor axes in green. For all axes, the dip azimuth, dip angle, and SDI20 values are given. Histograms show the distribution of grain sizes and aspect ratios. The number of grains analyzed, N, is given at the bottom.
Minerals 10 00994 g007
Figure 8. Stereograms showing the SPO result of KJTR-2 (a), -3 (b), and -4 (c), and YH-1 (d) and -3 (e) samples analyzed by their focal mechanism (lower-hemisphere, equal-area projection). The direction in which the tensile strain works is colored blue. All samples except the YH-1 sample shows a sinistral type strike slip fault. T, tensile strain and C, compressive strain.
Minerals 10 00994 g008
Table 1. Information about the outcrops from which each sample was obtained. The types of fault rock and host rock, orientation of the fault plane, and orientation of the fault slip inferred from field observations are described.
SiteKJTR (Ulsan Fault)YH (Yangsan Fault)
SampleKJTR-1KJTR-2KJTR-3KJTR-4YH-1YH-2YH-3
Fault rock typeFault
gouge
CataclasiteCataclasiteCataclasiteFault
gouge
CataclasiteCataclasite
Fault plane78→24552→25376→10071→24570→255
Slip orientationSinistral
(reverse)
Sinistral
(reverse)
Sinistral
(reverse)
Sinistral
(reverse)
Complex
Host rockCretaceous biotite granite
Cretaceous black shale
Precambrian granite gneiss
Cretaceous red sandstone
Table 2. Densest point and fault motion direction, which is expressed by plunge and trend form, estimated fault type, and rake value. Frequency of a given grain size and aspect ratio for all target grains examined for SPO and SDI values for each sample are also provided. SDI examples with γ-values ranging from 10 to 50 for the 3D-SPO results of the fault gouge are presented for the KJTR-1, -2, -3, and -4 and YH-1, -2, and -3 samples.
SampleKJTR-1KJTR-2KJTR-3KJTR-4YH-1YH-2YH-3
Densest point
(plunge, trend)
(26,005)(19,357)(49,232)(08,345)(19,355)(23,003)(12,010)
Fault motion direction
(plunge, trend)
(23,330)(06,339)(50,173)(04,334)(20,353)(32,358)(20,353)
Estimated fault typesinistral
/reverse
sinistral
/reverse
sinistral
/reverse
sinistral
/reverse
dextral
/reverse
sinistral
/normal
sinistral
/normal
Rake66°83°38°86°69°56°69°
Total frequency17271689382110,587599459263486
Frequency by
grain size
(μm)
<6.4186450189315309751136546
6.4~8.86726708273879154118801802
8.8~11.2457317323257412851290672
11.2<412252778260421931620272
Frequency by
aspect ratio
<1.52552008811655976438922
1.5~267069716993485135313661694
2~3652567995356416622016674
3~411697178111710621078112
4 <3412868766941102884
SDI1018.4113.1911.3210.1116.6515.0512.45
2027.9320.4117.7317.7624.5231.6617.71
3035.1125.9723.4425.2333.0240.4826.56
4040.3333.7429.6532.4042.2247.8635.41
5046.5437.6736.1639.6651.2754.4346.06
Publisher’s Note: MDPI stays neutral with regard to jurisdictional claims in published maps and institutional affiliations.

