Figure 1.
Transmitted light photomicrographs of grossular–andradite garnets under crossed polarized light (a) and under plane polarized light (b); (c) Ti-rich garnet in plane polarized light; (d) backscattered electron images of garnet skarn showing a sharp contact between Ti-rich andradite and grossulare of later generation. Abbreviations: Ap—apatite, Grt—garnet, Prh—pehnite, Cal—calcite, Qz—quartz, Grs—grossular, Ti-Grt—Ti-rich garnet, Adr—andradite, Prp—pyrope, Sch—schorlomite, Sps—spessartine, Alm—almandine.
Figure 2.
X-ray powder diffraction patterns of a garnet skarn (d-spacings of the peaks are indicated).
Figure 2.
X-ray powder diffraction patterns of a garnet skarn (d-spacings of the peaks are indicated).
Figure 3.
Rietveld refinement plot for garnet skarn. The rows of vertical lines give the positions of all possible Bragg reflections for (from top to bottom) quartz, calcite, grossulare (Ca3Al1.8Fe0.2Si3O12), grossular–andradite (Ca3Al0.9Fe1.1Si3O12), and chlorite.
Figure 3.
Rietveld refinement plot for garnet skarn. The rows of vertical lines give the positions of all possible Bragg reflections for (from top to bottom) quartz, calcite, grossulare (Ca3Al1.8Fe0.2Si3O12), grossular–andradite (Ca3Al0.9Fe1.1Si3O12), and chlorite.
Figure 4.
(a) Transmitted light photomicrograph of grossular–andradite garnet showing sectorial birefringence in the rim (crossed polarized light); (b) photomicrographs of “fassaitic” clinopyroxene with anomalous blue and brown interference colors (transmitted crossed polarized light); (c) backscattered electron image of wollastonite (I generation) included in grossular–andradite garnet (polished section); (d) backscattered electron image of melilite grains in garnet matrix (polished section). Abbreviations: Grt—garnet, Cpx—clinopyroxene, Prh—pehnite, Fas—“fassaitic” clinopyroxene, Woll—wollastonite, Grs—grossular, Adr—andradite, Prp—pyrope, Mel—melilite.
Figure 5.
X-ray powder diffraction patterns of a clinopyroxene–garnet skarn (d-spacings of the peaks are indicated).
Figure 5.
X-ray powder diffraction patterns of a clinopyroxene–garnet skarn (d-spacings of the peaks are indicated).
Figure 6.
Rietveld refinement plot for clinopyroxene–garnet skarn. The rows of vertical lines give the positions of all possible Bragg reflections for (from top to bottom) quartz, calcite, grossulare (Ca3Al1.8Fe0.2Si3O12), grossular–andradite (Ca3Al0.9Fe1.1Si3O12), chlorite and clinopyroxene.
Figure 6.
Rietveld refinement plot for clinopyroxene–garnet skarn. The rows of vertical lines give the positions of all possible Bragg reflections for (from top to bottom) quartz, calcite, grossulare (Ca3Al1.8Fe0.2Si3O12), grossular–andradite (Ca3Al0.9Fe1.1Si3O12), chlorite and clinopyroxene.
Figure 7.
(a) Transmitted light photomicrograph showing Ti-rich garnet, grossular–andradite and clinopiroxene of the diopside–hedenbergite series (plane polarized light); (b) photomicrographs thaumasite (transmitted crossed polarized light); (c) backscattered electron image of wollastonite (II generation) and grossular–andradite garnet with intermediate composition (polished section); (d) backscattered electron image of “fassaitic” clinopyroxene included in grossular–andradite garnet and later almost pure andradite (polished section). Abbreviations: Ti-Grt—Ti-rich garnet, Grs—grossular, And—andradite, Cpx—clinopyroxene, Fas—“fassaitic” clinopyroxene, Woll—wollastonite, Prp—pyrope, Thau—thaumasite.
Figure 8.
X-ray powder diffraction patterns of a Pl-Cpx-Wo-Grt skarn (d-spacings of the peaks are indicated).
Figure 8.
X-ray powder diffraction patterns of a Pl-Cpx-Wo-Grt skarn (d-spacings of the peaks are indicated).
Figure 9.
Rietveld refinement plots for the Pl-Cpx-Wo-Grt skarn. Above, the measured (blue line) and calculated pattern (red line) are presented, underneath the difference curve is given. Below, the reflection positions of the phases given in the upper right corner are displayed.
Figure 9.
Rietveld refinement plots for the Pl-Cpx-Wo-Grt skarn. Above, the measured (blue line) and calculated pattern (red line) are presented, underneath the difference curve is given. Below, the reflection positions of the phases given in the upper right corner are displayed.
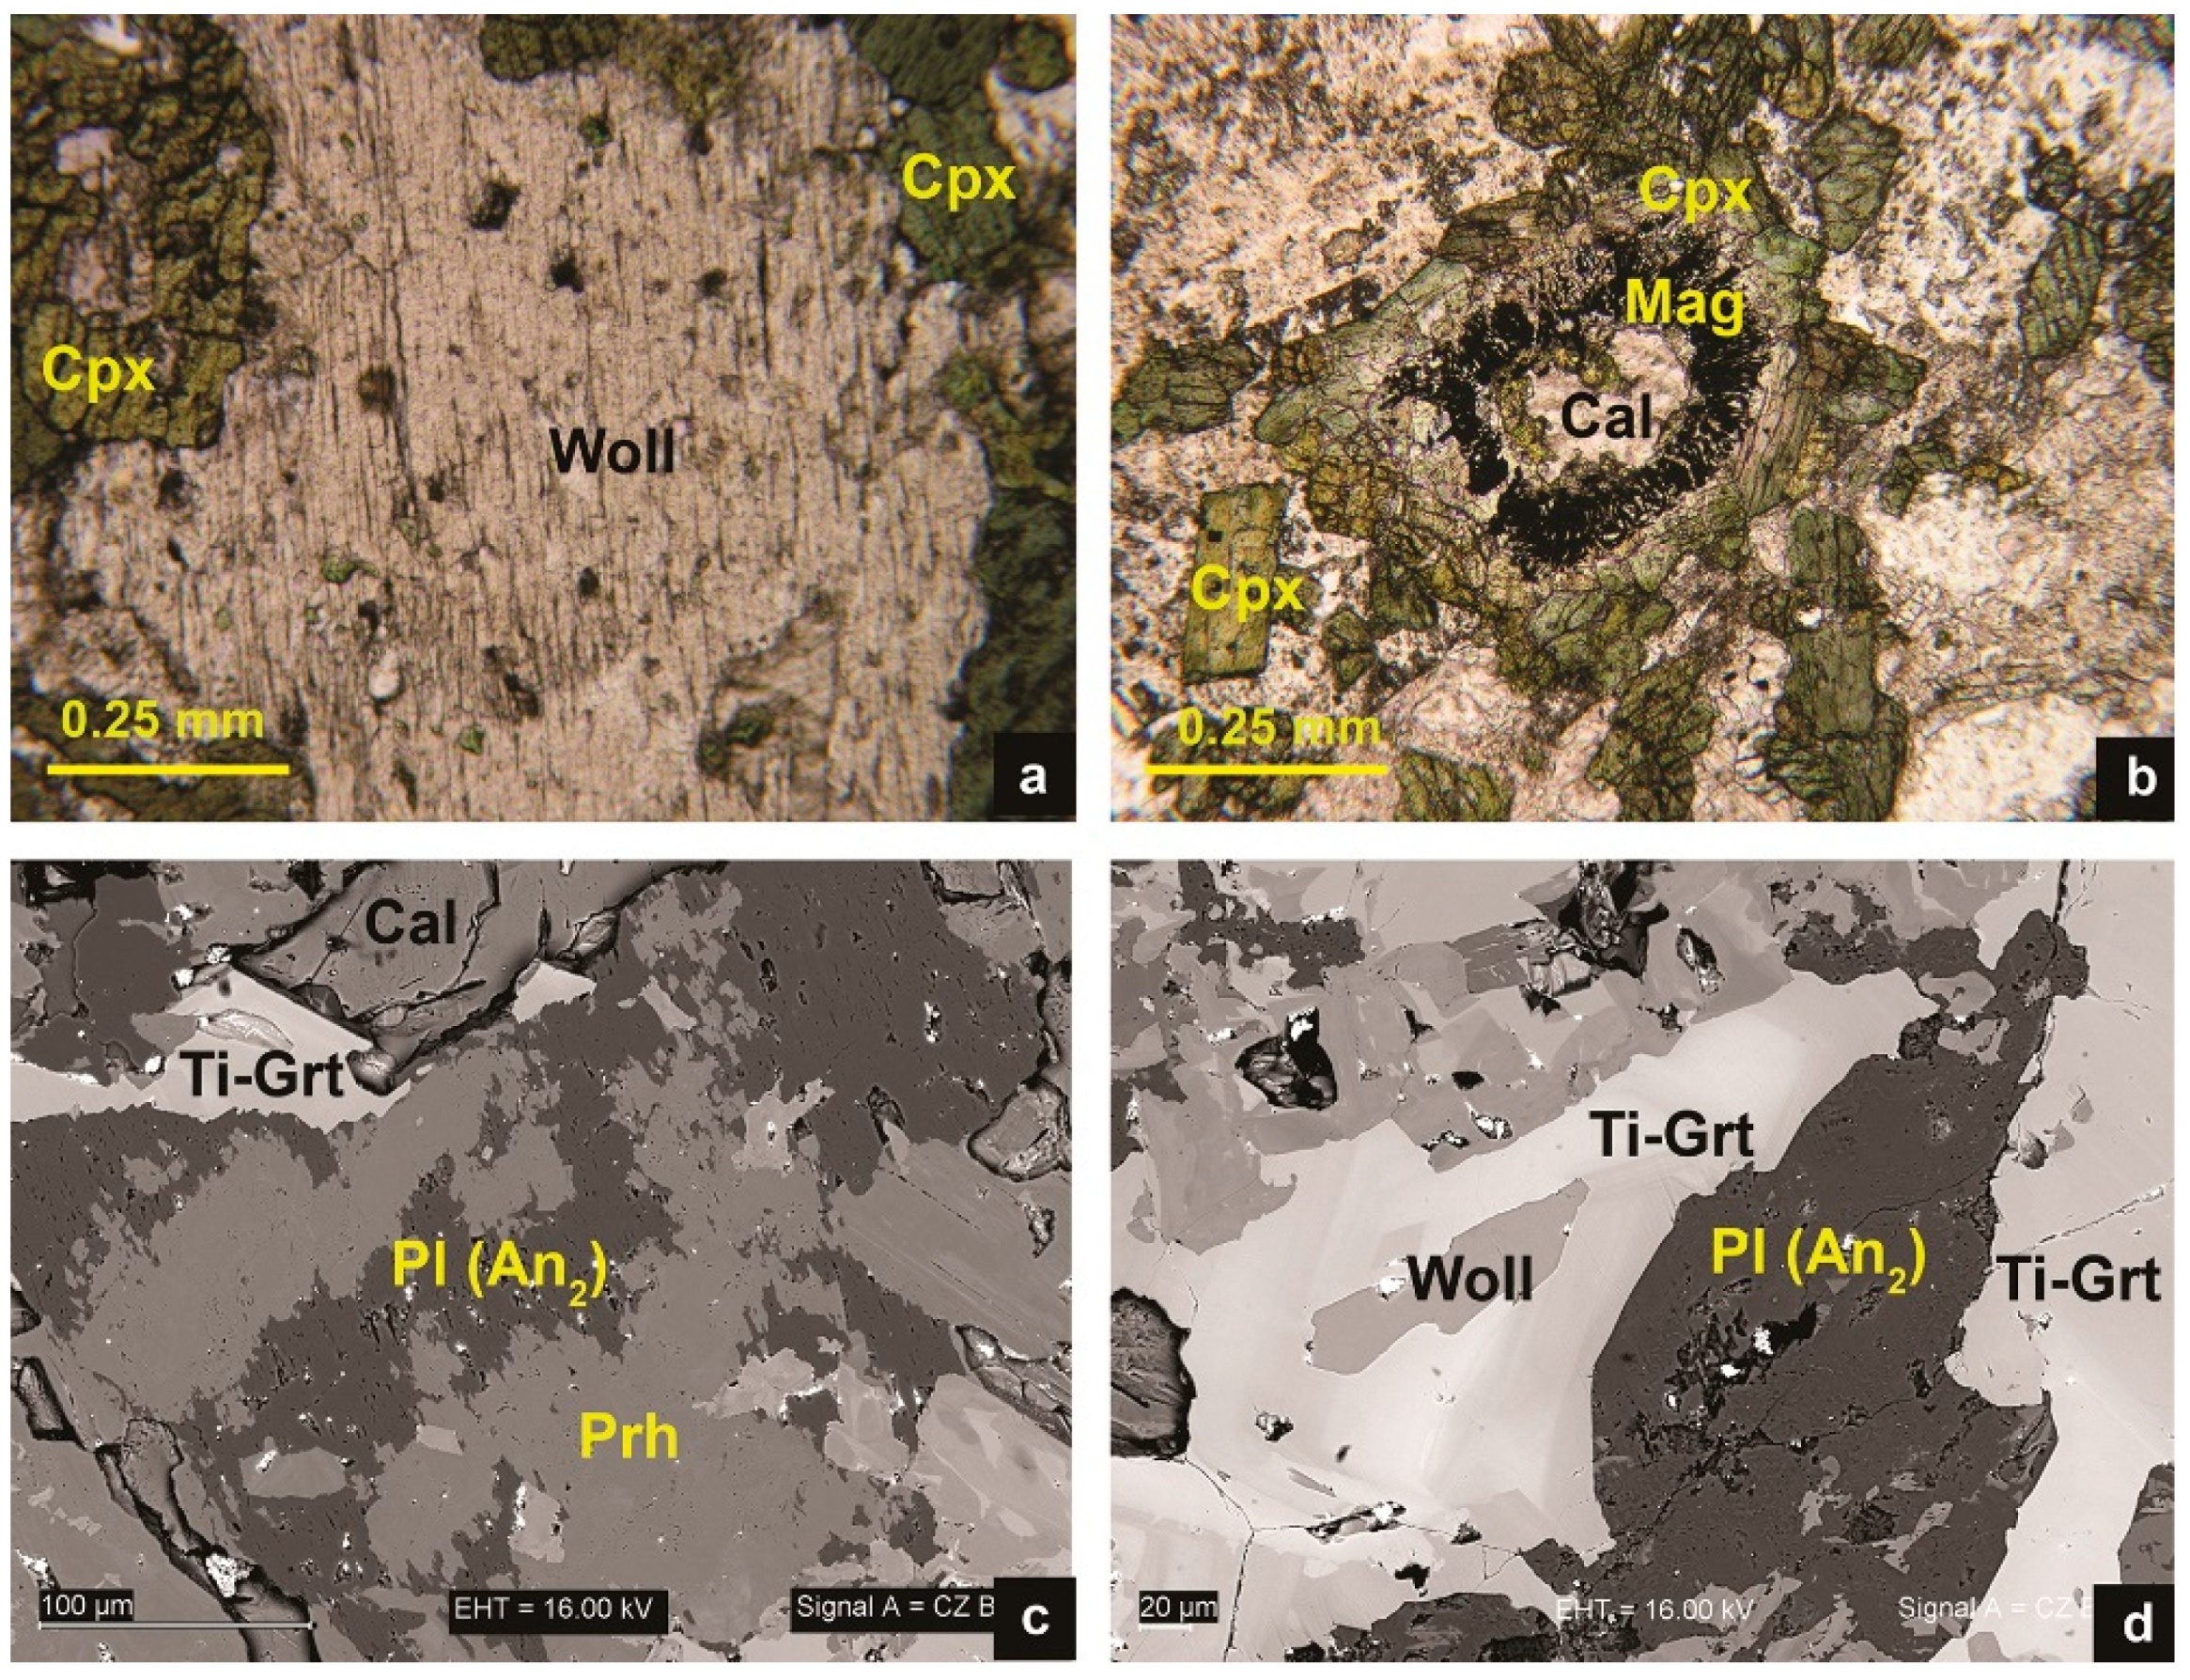
Figure 10.
(a,b) Transmitted light photomicrographs of Pl-Cpx-Wo skarn (plane polarized light); (c,d) backscattered electron images of Pl-Cpx-Wo skarn. Abbreviations: Woll—wollastonite, Cpx—clinopyroxene, Cal—calcite, Mag—magnetite, Ti-Grt—Ti-rich garnet, Pl—plagioclase, An—anorthite.
Figure 10.
(a,b) Transmitted light photomicrographs of Pl-Cpx-Wo skarn (plane polarized light); (c,d) backscattered electron images of Pl-Cpx-Wo skarn. Abbreviations: Woll—wollastonite, Cpx—clinopyroxene, Cal—calcite, Mag—magnetite, Ti-Grt—Ti-rich garnet, Pl—plagioclase, An—anorthite.
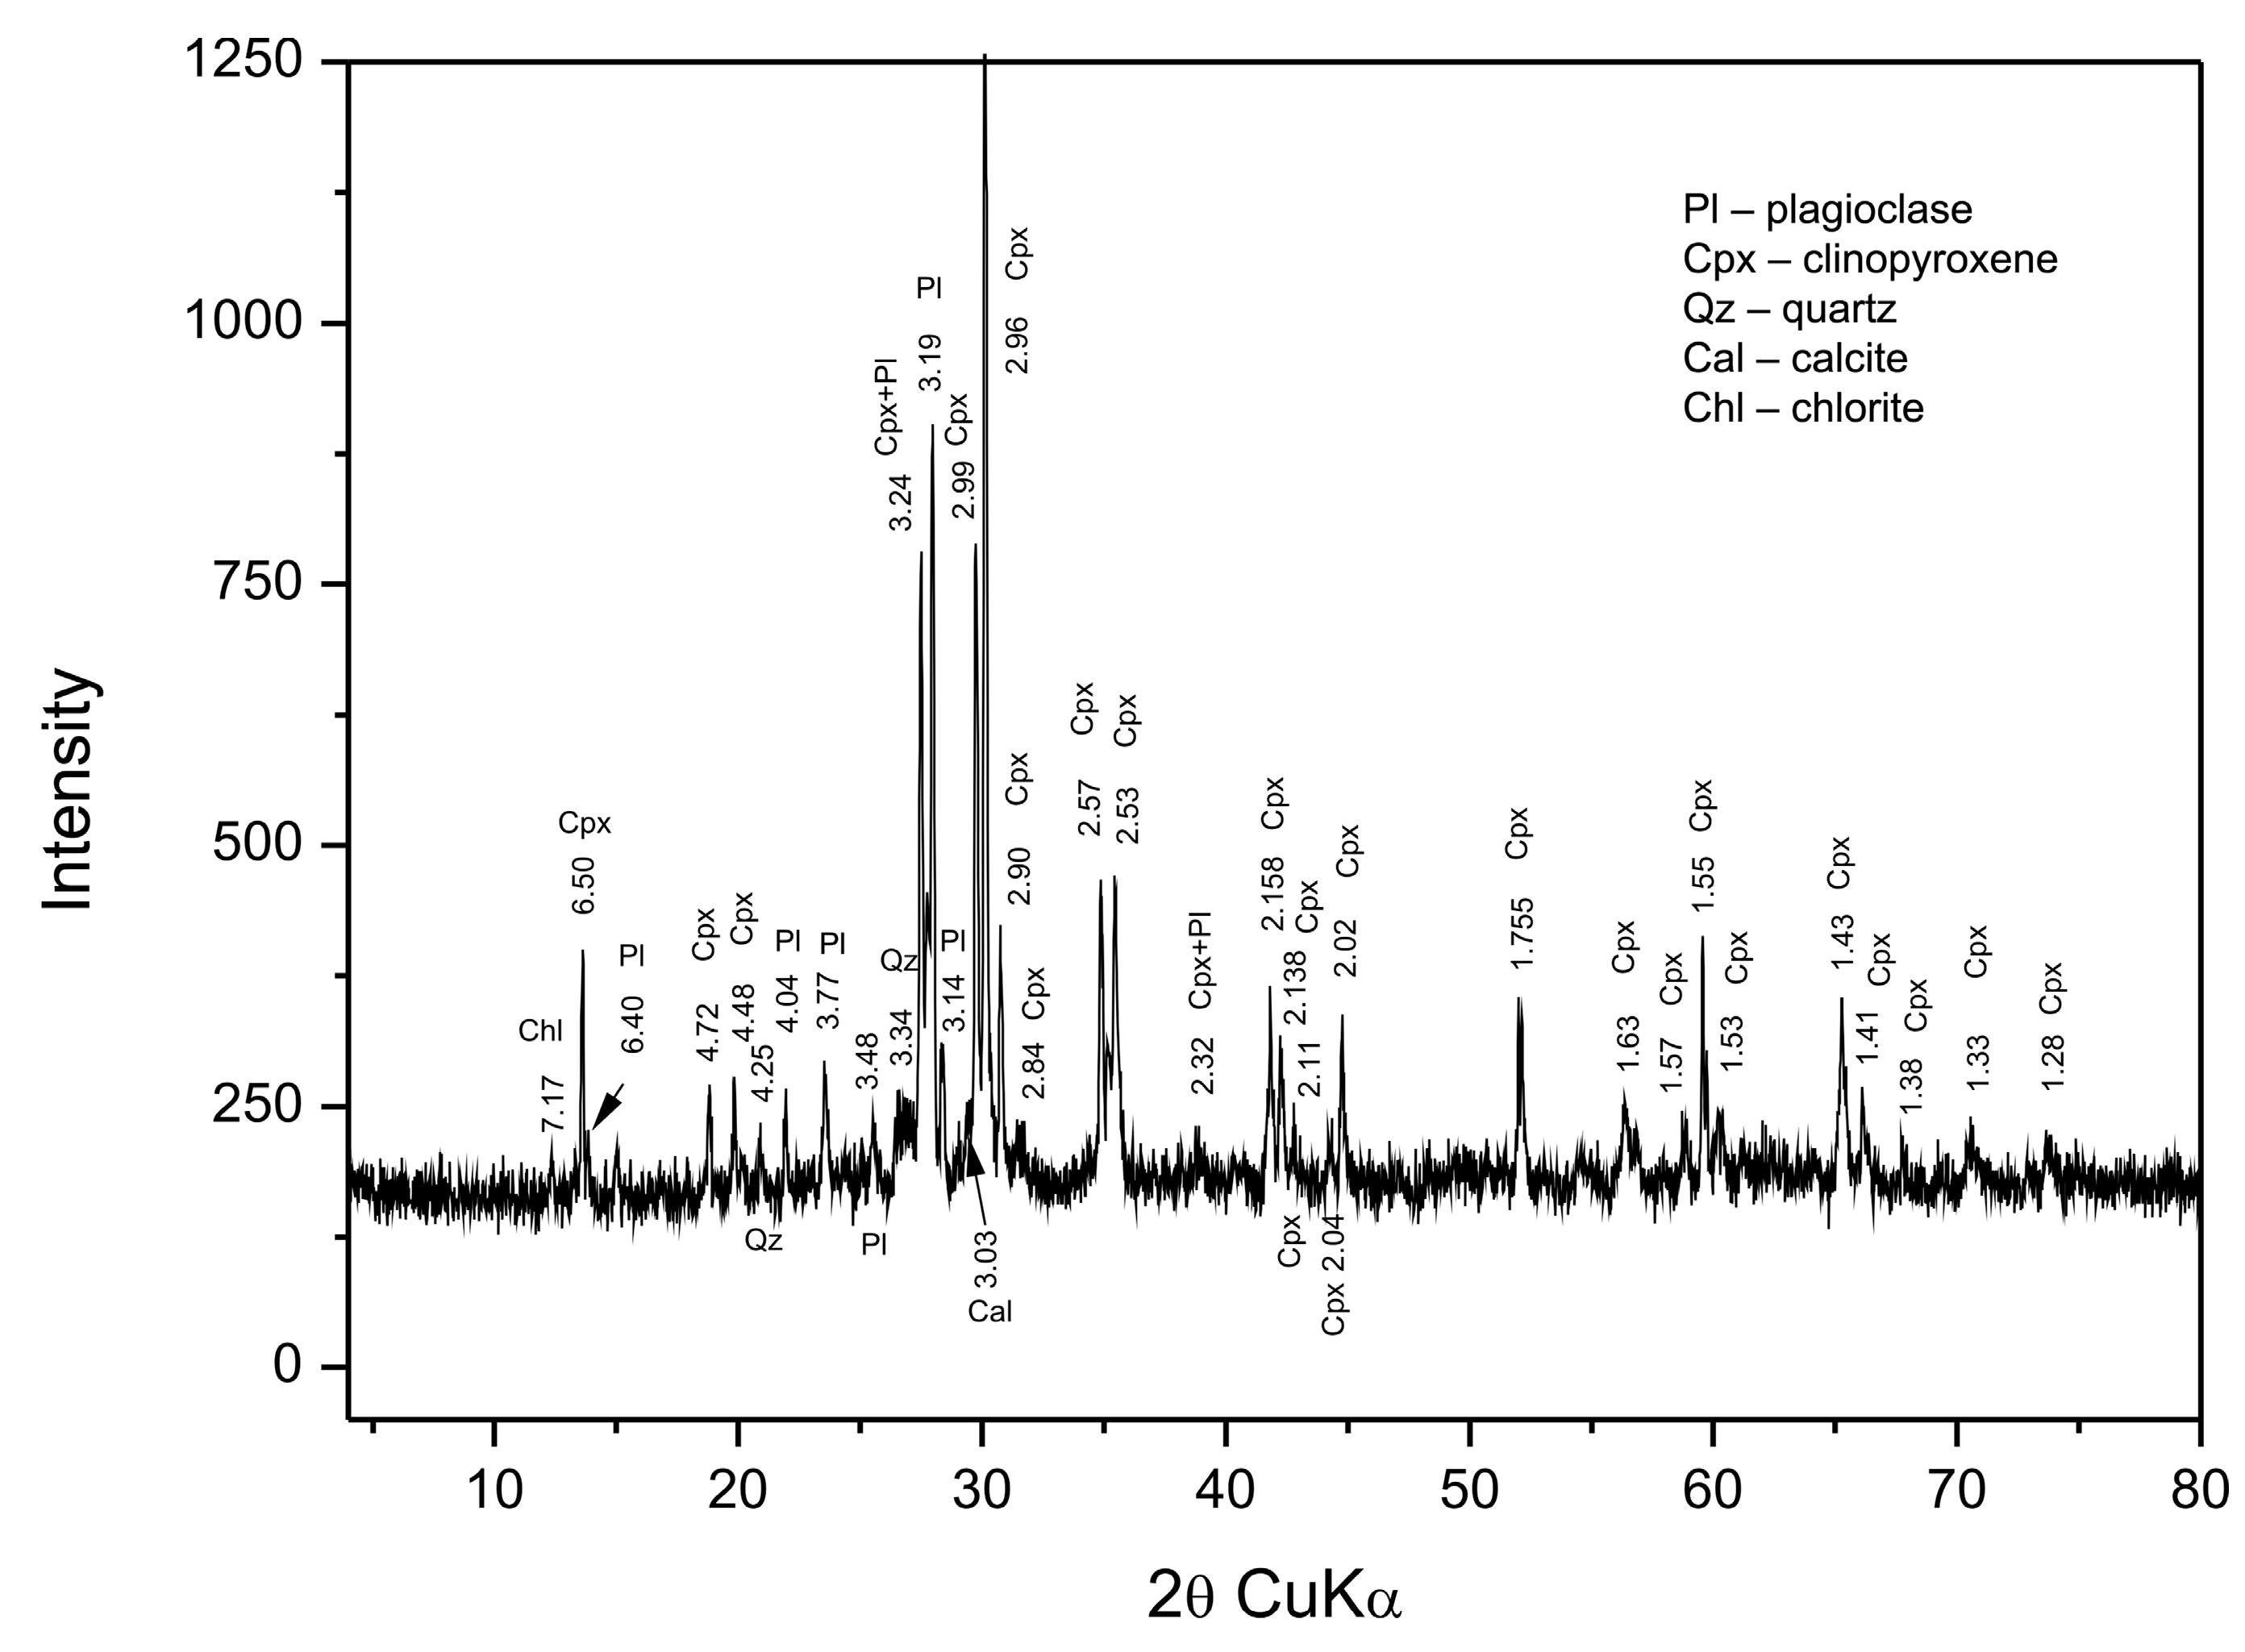
Figure 11.
X-ray powder diffraction patterns of Pl-Cpx-Wo skarn (d-spacings are indicated).
Figure 11.
X-ray powder diffraction patterns of Pl-Cpx-Wo skarn (d-spacings are indicated).
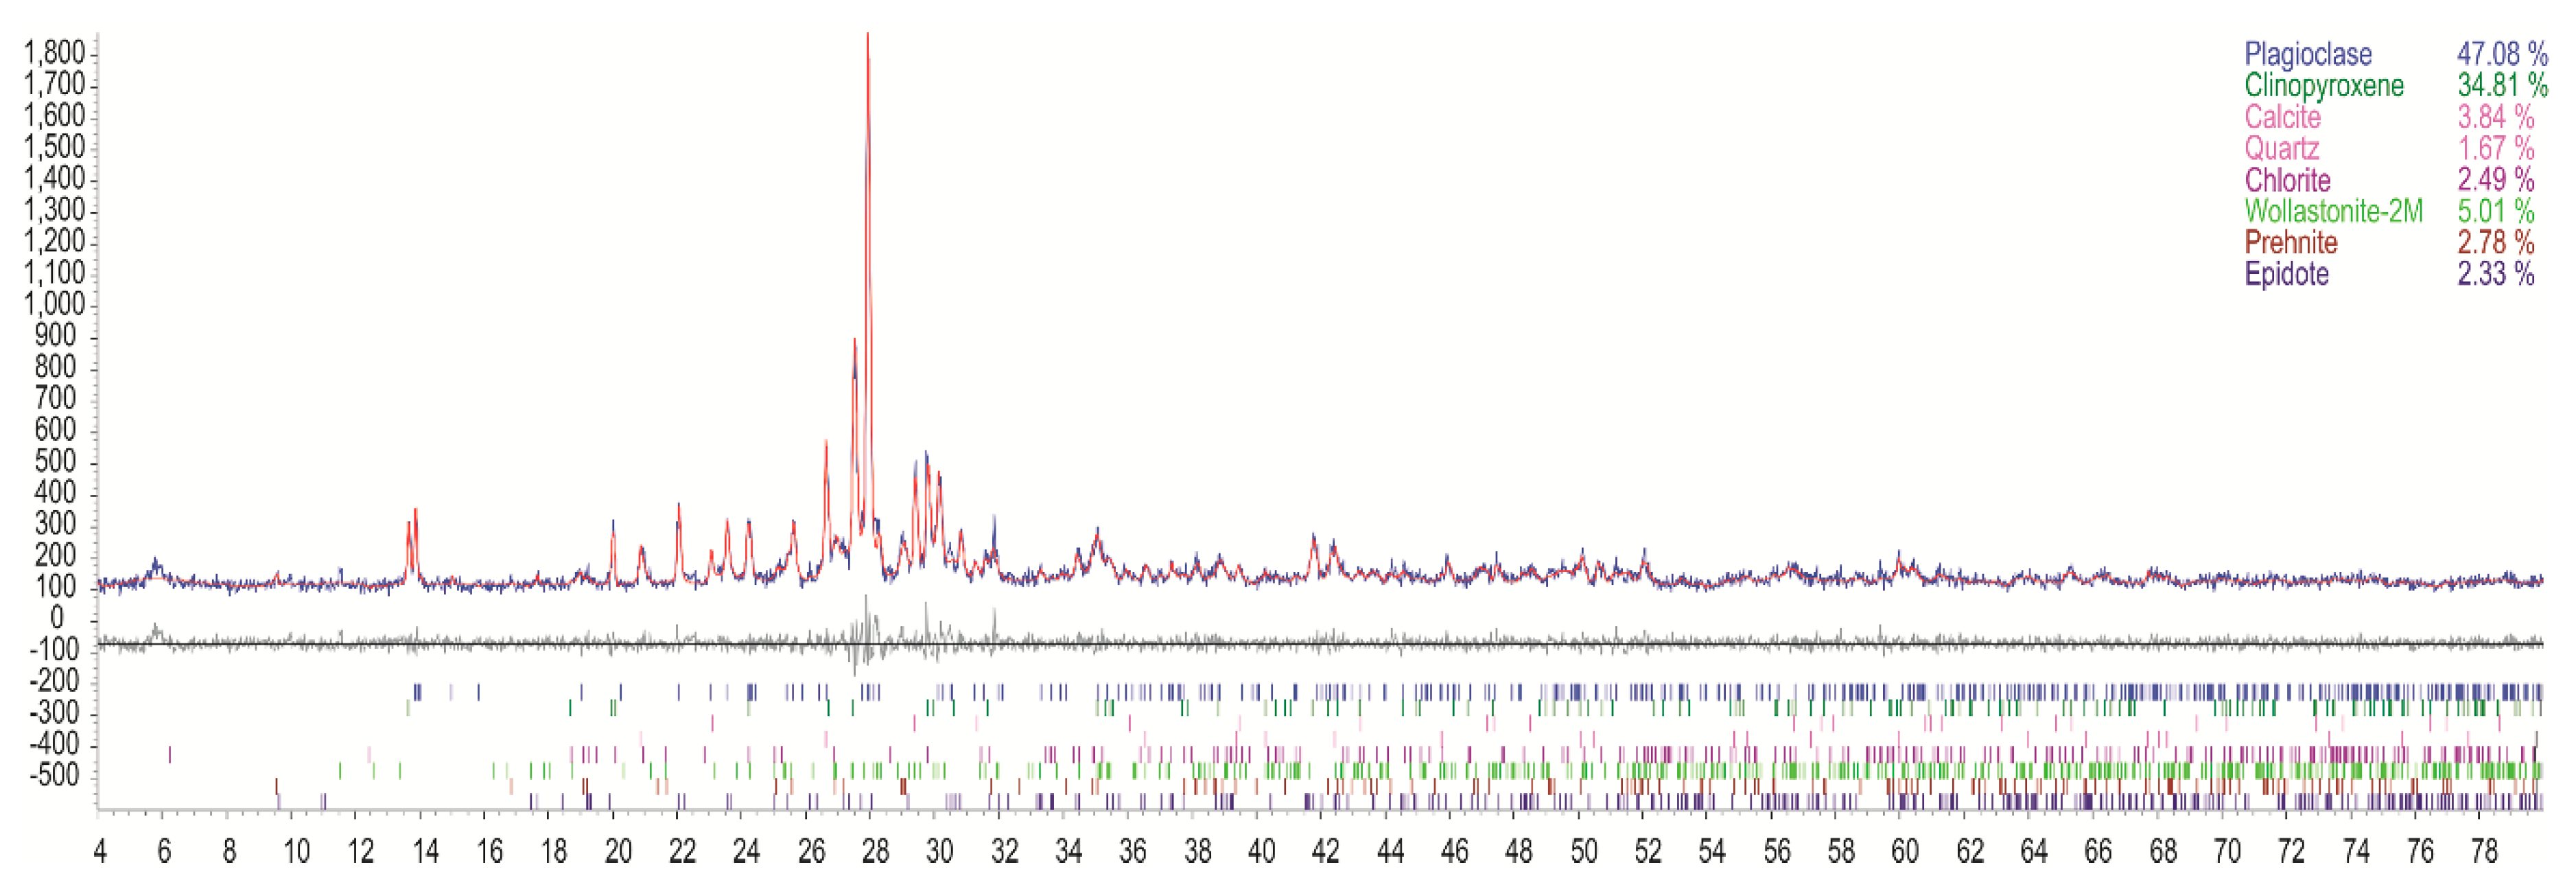
Figure 12.
Rietveld refinement plots for the Pl-Cpx-Wo skarn. Above, the measured (blue line) and calculated pattern (red line) are presented, underneath the difference curve is given. Below, the reflection positions of the phases given in the upper right corner are displayed.
Figure 12.
Rietveld refinement plots for the Pl-Cpx-Wo skarn. Above, the measured (blue line) and calculated pattern (red line) are presented, underneath the difference curve is given. Below, the reflection positions of the phases given in the upper right corner are displayed.
Figure 13.
Transmitted light photomicrographs of Pl-Cpx-Wo-Ep skarn under plane polarized light (a) and (b) under crossed polarized light; (c) photomicrograph of titanite crystal (plane polarized light); (d) backscattered electron images of Pl-Cpx-Wo-Ep skarn (polished section). Abbreviations: Woll—wollastonite, Cpx—clinopyroxene, Prh—prehnite, Ttn—titanite; Ti-Grt—Ti-rich garnet, Pl—plagioclase, Ep—epidote.
Figure 14.
X-ray powder diffraction patterns of Pl-Cpx-Wo-Ep skarn (d-spacings are indicated).
Figure 14.
X-ray powder diffraction patterns of Pl-Cpx-Wo-Ep skarn (d-spacings are indicated).
Figure 15.
Rietveld refinement plots for the Pl-Cpx-Wo-Ep skarn. Above, the measured (blue line) and calculated pattern (red line) are presented, underneath the difference curve is given. Below, the reflection positions of the phases given in the upper right corner are displayed.
Figure 15.
Rietveld refinement plots for the Pl-Cpx-Wo-Ep skarn. Above, the measured (blue line) and calculated pattern (red line) are presented, underneath the difference curve is given. Below, the reflection positions of the phases given in the upper right corner are displayed.
Figure 16.
Transmitted light photomicrographs of Pl-Cpx skarn under plane polarized light (a) and (b) under crossed polarized light; (c,d) backscattered electron images of Pl-Cpx skarn sowing the zoned clinopyroxene crystals with Mg-rich cores and Fe-rich rims (polished section). Abbreviations: Cpx—clinopyroxene, Pl—plagioclase, Prh—prehnite, An—anorthite.
Figure 17.
X-ray powder diffraction patterns of Pl-Cpx skarn (d-spacings are indicated).
Figure 17.
X-ray powder diffraction patterns of Pl-Cpx skarn (d-spacings are indicated).
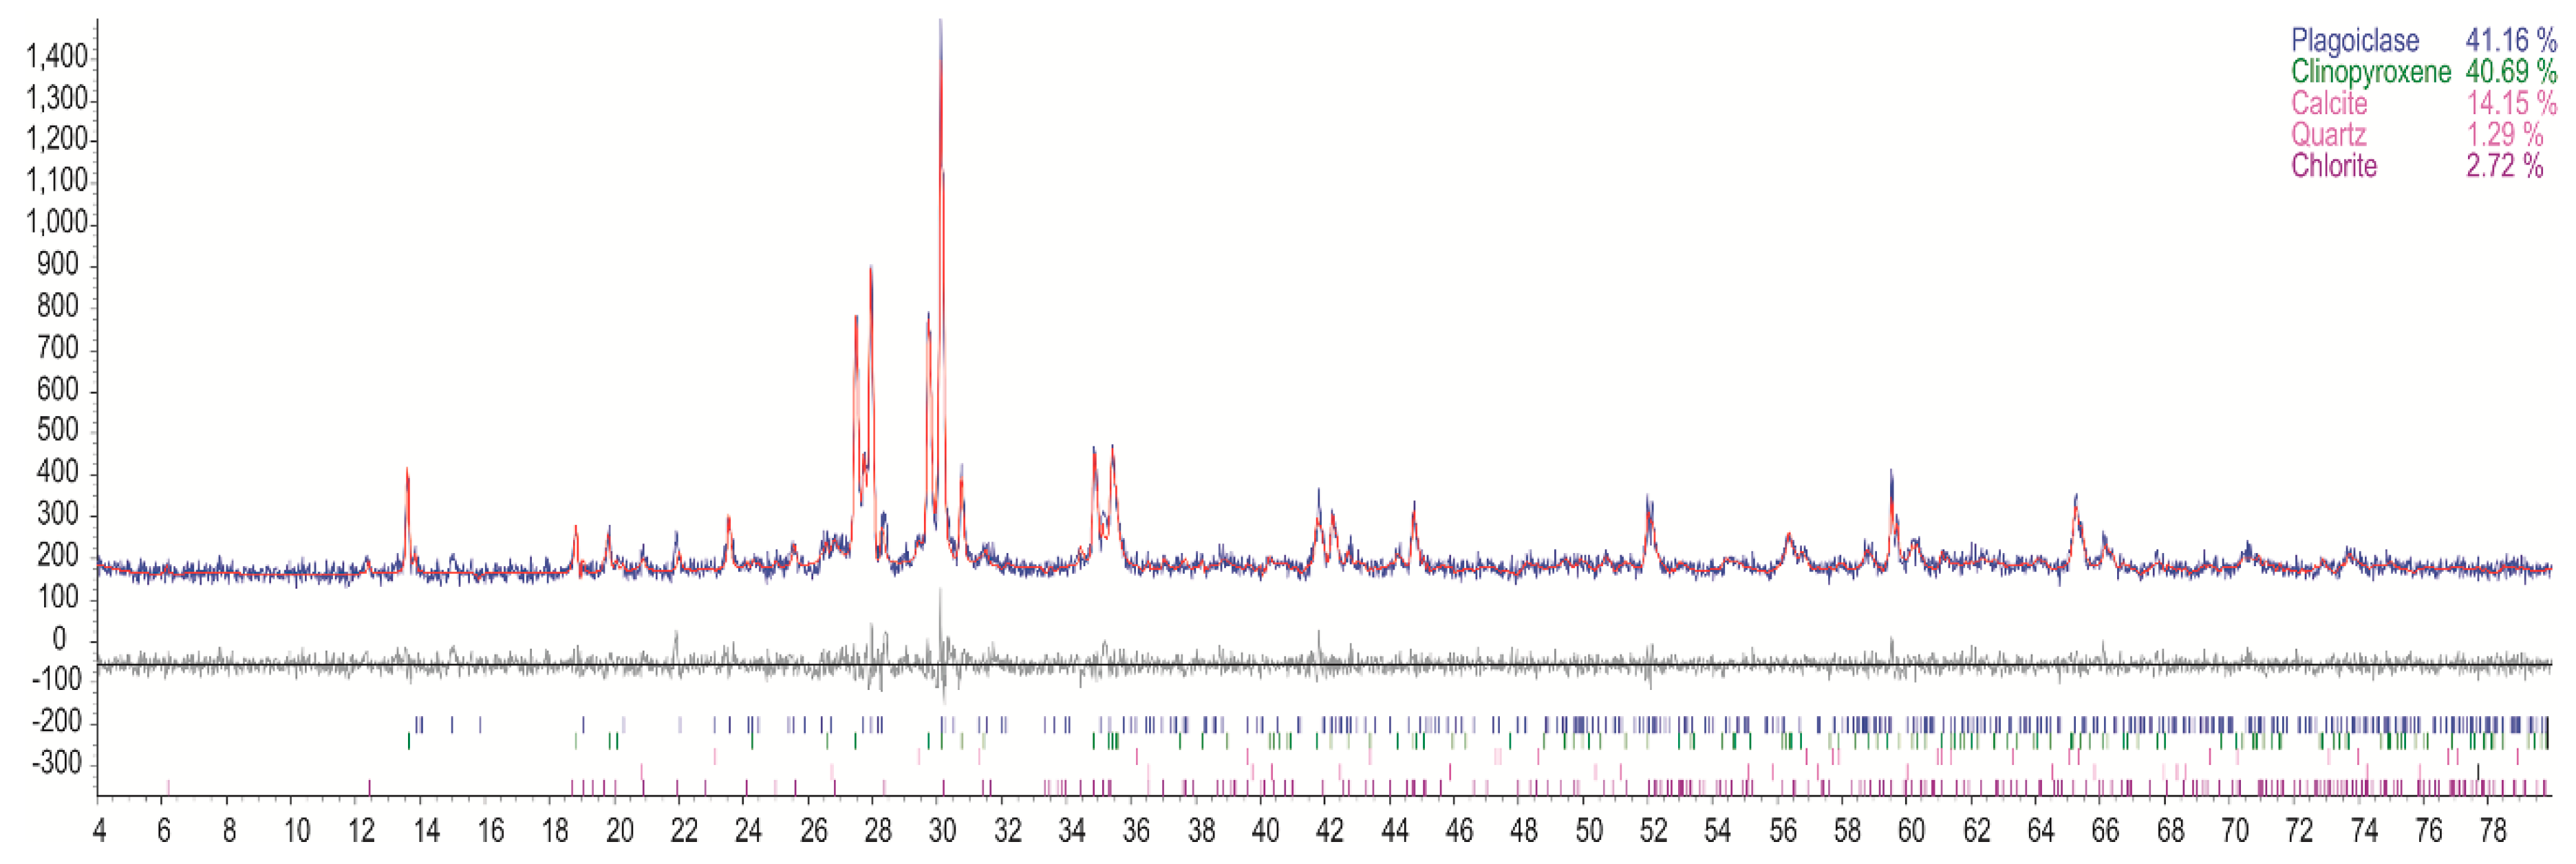
Figure 18.
Rietveld refinement plots for the Pl-Cpx skarn. Above, the measured (blue line) and calculated pattern (red line) are presented, underneath the difference curve is given. Below, the reflection positions of the phases given in the upper right corner are displayed.
Figure 18.
Rietveld refinement plots for the Pl-Cpx skarn. Above, the measured (blue line) and calculated pattern (red line) are presented, underneath the difference curve is given. Below, the reflection positions of the phases given in the upper right corner are displayed.
Table 1.
Sources of crystal structure data used to derive starting models of the minerals for the quantitative phase analysis.
Table 1.
Sources of crystal structure data used to derive starting models of the minerals for the quantitative phase analysis.
| Mineral | Sources of Crystal Structure Data |
|---|
| Albite | Armbruster et al. (1990) [42] |
| Labradorite | Wenk et al. (1980) [43] |
| Andradite | Lager et al. (1989) [44] |
| Grossular | Hasen and Finger (1978) [45] |
| Diopside | Levien and Prewitt (1981) [46] |
| Hedenbergite | Cameron et al. (1973) [47] |
| Esseneite | Cosca and Peacor (1987) [48] |
| Wollastonite 2M | Hesse (1984) [49] |
| Epidote | Dollase (1971) [50] |
| Prehnite | Papike and Zoltai (1967) [51] |
| Calcite | Effenberger et al. (1981) [52] |
| Quartz | Levien et al. (1980) [53] |
| Chlorite | Zanazzi et al. (2009) [54] |
Table 2.
Some refined parameters in the quantitative analysis of the garnet skarn and chemical compositions of garnets determined by X-ray powder diffraction (XRPD) and electron probe microanalysis (EPMA).
Table 2.
Some refined parameters in the quantitative analysis of the garnet skarn and chemical compositions of garnets determined by X-ray powder diffraction (XRPD) and electron probe microanalysis (EPMA).
| Minerals | Unit Cell Parameters (Å) | Chemical Compositions |
|---|
| | starting model | after refinement | XRPD | EPMA |
| Grossular | a = 11.846(1) [45] | a = 11.892(2) | Ca3(Al1.8, Fe3+0.2)2Si3O12 | (Ca2.96–2.98, Fe2+0–0.04Mg0–0.1)3(Al1.66–1.81, Fe3+0.17–0.26Ti0–0.01, Fe2+0–0.01)2(Si,Al)3O12 |
| Grossular–andradite | a = 12.057 [44] | a = 11.966(2) | Ca3(Al0.9Fe1.1)2Si3O12 | (Ca2.95–3.0, Mg0.01–0.08)3(Al0.77–0.95, Fe3+0.95–1.17Ti0–0.07, Fe2+0–0.01)2(Si,Al)3O12 |
Table 3.
Some refined parameters in the quantitative analysis of the clinopyroxene–garnet skarn and chemical compositions of the minerals determined by XRPD and EPMA.
Table 3.
Some refined parameters in the quantitative analysis of the clinopyroxene–garnet skarn and chemical compositions of the minerals determined by XRPD and EPMA.
| Minerals | Unit Cell Parameters (Å) | Chemical Compositions |
|---|
| | starting model | after refinement | XRPD | EPMA |
| Grossular | a = 11.846(1) [45] | a = 11.873(5) | Ca3(Al1.8, Fe3+0.2)2Si3O12 | (Ca2.92–3.00, Mg0.05–0.09)3(Al1.58–1.80, Fe3+0.12–0.30Fe2+0–0.06)2(Si,Al)3O12 |
| Grossular–andradite | a = 12.057 [44] | a = 11.952(4) | Ca3(Al0.9Fe1.1)2Si3O12 | (Ca2.93–3.00, Mg0–0.07)3(Al0.78–0.94, Fe3+1.00–1.10, Ti0–0.05)2(Si,Al)3O12 |
| Clinopyroxene | a = 9.79(1) [48] | a = 9.77(1) | Ca(Mg0.40Fe3+0.40Al0.20)(Si1.4, Al0.6)2O6 | Ca(Mg0.26–0.47, Fe3+0.31–0.44, AlVI0.10–0.18, Fe2+0–0.14, Ti0.02–0.08)(Si1.32–1.48, AlIV0.52–0.68)O6 |
| b = 8.822(9) | b = 8.83(1) |
| c = 5.37(1) | c = 5.36(6) |
| β = 105.81(9) | β = 105.78(1) |
Table 4.
Some refined parameters in the quantitative analysis of the Pl-Cpx-Wo-Grt skarn and chemical compositions of the minerals determined by XRPD and EPMA.
Table 4.
Some refined parameters in the quantitative analysis of the Pl-Cpx-Wo-Grt skarn and chemical compositions of the minerals determined by XRPD and EPMA.
| Minerals | Unit Cell Parameters (Å) | Chemical Compositions |
|---|
| | starting model | after refinement | XRPD | EPMA |
| Grossular–andradite | a = 12.057 [44] | a = 11,962(3) | Ca3(Al0.9Fe1.1)2Si3O12 | (Ca2.91–2.95, Mg0.06–0.09, Fe2+0–0.02)3(Al0.70–1.07, Fe3+0.85–1.28, Ti0.01–0.06, Fe2+0–0.02)2(Si,Al)3O12 |
| Clinopyroxene | a = 9.7456 [46] | a = 9.789(3) | Ca(Mg0.60Fe2+0.40)Si2O6 | Ca(Mg0.59–0.92 Fe2+0.03–0.31Fe3+0–0.16Al0–0.03)(Si1.85–2.00, Al0–0.13)2O6 |
| b = 8.9198 | b = 8.928(3) |
| c = 5.2516 | c = 5.260(2) |
| β = 105.86 | β = 105.77(1) |
| Plagioclase | a = 8.137 [42] | a = 8.140(2) | Na4Al4Si12O32 | Na3.92–4.0Ca0–0.1K0–0.04Fe3+0–0.03Al3.98–4.0Si11.95–11.97O32 |
| b = 12.785 | b = 12.780(4) |
| c = 7.1583 | c = 7.152(2) |
| α = 94.26 | α = 94.176(2) |
| β = 116.60 | β = 116.562(2) |
| γ = 87.71 | γ = 87.90(1) |
| Wollastonite | a = 15.409 [49] | a = 15.413(2) | Ca2Si2O6 | Ca1.92–1.96Mg0–0.03Fe2+0.02–0.03(Si1.96–1.99Al0.04–0.05)O6 |
| b = 7.322 | b = 7.336(5) |
| c = 7.063 | c = 7.070(3) |
| β = 95.30 | β = 95.24(5) |
Table 5.
Some refined parameters in the quantitative analysis of the Pl-Cpx-Wo skarn and chemical compositions of the minerals determined by XRPD and EPMA.
Table 5.
Some refined parameters in the quantitative analysis of the Pl-Cpx-Wo skarn and chemical compositions of the minerals determined by XRPD and EPMA.
| Minerals | Unit Cell Parameters (Å) | Chemical Compositions |
|---|
| | starting model | after refinement | XRPD | EPMA |
| Clinopyroxene | a = 9.7456 [46] | a = 9.750(3) | Ca(Mg0.70Fe2+0.30)Si2O6 | Ca0.99–1.0Na0.01(Mg0.65–0.72Fe2+0.21–0.25Fe3+0–0.06Al0–0.04Cr0–0.005Mn0.01–0.07)(Si1.96–1.99Al0.01–0.04)2O6 |
| b = 8.9198 | b = 8.916(2) |
| c = 5.2516 | c = 5.258(1) |
| β = 105.86 | β = 105.99(2) |
| Plagioclase | a = 8.1736 [43] | a = 8.150(2) | Na2.4Ca1.6Al4Si12O32 | Na0.99–3.92Ca0.07–2.50K0–0.5Mg0–0.18Fe3+0–0.05Al4.03–7.5Si8.86–12O32 |
| b = 12.8736 | b = 12.790(5) |
| c = 7.1022 | c = 7.140(1) |
| α = 93.462 | α = 94.185(2) |
| β = 116.054 | β = 116.5432(3) |
| γ = 90.475 | γ = 88.81(1) |
| Wollastonite | a = 15.409 [49] | a = 15.409(7) | Ca2Si2O6 | Ca1.97–1.99Mg0–0.02Fe2+0.02Cr0–0.005Mn0–0.05(Si1.98–1.99Al0–0.02)O6 |
| b = 7.322 | b = 7.320(3) |
| c = 7.063 | c = 7.063(2) |
| β = 95.30 | β = 95.36(3) |
| Prehnite | a = 4.646 [51] | a = 4.640(2) | Ca22AlSi3O10(OH)2 | Ca1.96–1.98Fe3+0.01–0.18Ti0–0.02Al1.80–1.96Si3O10(OH)2 |
| b = 5.483 | b = 5.482(2) |
| c = 18.486 | c = 18.485(7) |
Table 6.
Some refined parameters in the quantitative analysis of the Pl-Cpx-Wo-Ep skarn and chemical compositions of the minerals determined by XRPD and EPMA.
Table 6.
Some refined parameters in the quantitative analysis of the Pl-Cpx-Wo-Ep skarn and chemical compositions of the minerals determined by XRPD and EPMA.
| Minerals | Unit Cell Parameters (Å) | Chemical Compositions |
|---|
| | starting model | after refinement | XRPD | EPMA |
| Clinopyroxene | a = 9.7456 [46] | a = 9.752(2) | Ca(Mg0.60Fe2+0.40)Si2O6 | Ca(Mg0.45–0.67Fe2+0.23–0.44Fe3+0.04–0.14Al0.01–0.06Ti0.01–0.03)(Si1.79–1.89Al0.11–0.21)2O6 |
| b = 8.9198 | b = 8.919(2) |
| c = 5.2516 | c = 5.262(7) |
| β = 105.86 | β = 106.10(1) |
| Plagioclase | a = 8.1736 [43] | a = 8.167(3) | Na1.8Ca2.1Al5Si12O32 | Na0.13–3.24Ca0.50–3.77K0–0.11Fe3+0–0.15Al4.31–7.41Si8.40–11.70O32 |
| b = 12.8736 | b = 12.864(1) |
| c = 7.1022 | c = 7.122(1) |
| α = 93.462 | α = 93.625(2) |
| β = 116.054 | β = 116.44(7) |
| γ = 90.475 | γ = 89.87(2) |
| Wollastonite | a = 15.409 [49] | a = 15.377(1) | Ca2Si2O6 | Ca1.83–1.99Mg0–0.03Fe2+0.02–0.05Cr0–0.005Ti0–0.06(Si1.99–2.00Al0–0.01)O6 |
| b = 7.322 | b = 7.299(4) |
| c = 7.063 | c = 7.049(5) |
| β = 95.30 | β = 95.34(6) |
| Prehnite | a = 4.646 [51] | a = 4.640(2) | Ca22AlSi3O10(OH)2 | Ca1.93–2.00Fe3+0.16–0.38Al1.60–1.78Si3O10(OH)2 |
| b = 5.483 | b = 5.482(2) |
| c = 18.486 | c = 18.485(7) |
| Epidote | a = 8.914 [50] | a = 8.897(1) | Ca2(Al2Fe3+)[Si2O7] [SiO4]O(OH) | Ca21.98–2.39(AlFe3+0.49–0.96)[Si2O7] [SiO4]O(OH) |
| b = 5.640 | b = 5.635(7) |
| c = 10.162 | c = 10.152(1) |
| β = 115.4 | β = 115.378(4) |
Table 7.
Some refined parameters in the quantitative analysis of the Pl-Cpx skarn and chemical compositions of the minerals determined by XRPD and EPMA.
Table 7.
Some refined parameters in the quantitative analysis of the Pl-Cpx skarn and chemical compositions of the minerals determined by XRPD and EPMA.
| Minerals | Unit Cell Parameters (Å) | Chemical Compositions |
|---|
| | starting model | after refinement | XRPD | EPMA |
| Clinopyroxene | a = 9.7456 [46] | a = 9.745(1) | Ca(Mg0.60Fe2+0.40)Si2O6 | Ca0.95–0.97Na0.02–0.04(Mg0.42–0.60Fe2+0.21–033Fe3+0.15–0.20Al0–0.03Ti0.03–0.04V0–0.005Mn0.01Cr0–0.004)(Si1.74–1.81Al0.19–0.23Fe3+0–0.02)2O6 |
| b = 8.9198 | b = 8.899(5) |
| c = 5.2516 | c = 5.252(3) |
| β = 105.86 | β = 105.68(2) |
| Plagioclase | a = 8.1736 [43] | a = 8.174(2) | Na1.9Ca2.0Al6Si12O32 | Na0.47–3.26Ca0.52–3.59K0–0.11Fe3+0–0.2Al4.57–7.32Si8.46–11.54O32 |
| b = 12.8736 | b = 12.880(3) |
| c = 7.1022 | c = 7.112(2) |
| α = 93.462 | α = 93.345(1) |
| β = 116.054 | β = 116.30(5) |
| γ = 90.475 | γ = 90.29(1) |


