Article

Recovery of Iron Nanoparticles from Mine Wastewater Using Plant Extracts of Eucalyptus Globulus, Callistemon Viminalis and Persea Americana

by
Lovasoa C. Razanamahandry
1,*,
Assumpta C. Nwanya
2,
Michael O. Akharame
3,4,
Badeggi U. Muhammad
3,5,
Seteno K.O. Ntwampe
6 and
Elvis Fosso-Kankeu
6,*
1
African Union Development Agency, Economic Integration Division, Johannesburg 1685, South Africa
2
Department of Physics and Astronomy, University of Nigeria, Nsukka 410001, Nigeria
3
Department of Chemistry, Cape Peninsula University of Technology, Cape Town 7535, South Africa
4
Department of Environmental Management and Toxicology, University of Benin, Benin-City 3002, Nigeria
5
Department of Chemistry, Ibrahim Badamasi Babangida University, Lapai, Niger State, PMB 11 911101, Nigeria
6
Water Pollution Monitoring and Remediation Initiatives Research Group, School of Chemical and Minerals Engineering, North-West University, Private Bag X1290, Potchefstroom 2520, South Africa
*
Authors to whom correspondence should be addressed.
Minerals 2020, 10(10), 859; https://doi.org/10.3390/min10100859
Submission received: 20 August 2020 / Revised: 25 September 2020 / Accepted: 26 September 2020 / Published: 29 September 2020

Abstract

:
Mine wastewater (MW) is often rich in heavy metals that can have measurable effects on humans. The storage and treatment of MW remains a challenge for most mining companies. Iron (Fe) in MW was removed by using extracts from Eucalyptus globulus (EG); Callistemon viminalis (CV); and Persea americana (AS). Fe was removed from MW samples with an initial concentration of 5.53 mg Fe mL−1; 4.63 mg Fe mL−1 and 4.40 mg Fe mL−1 using EG leaves, CV flowers and AS seed extracts, respectively. Conditions of the MW decontamination were studied by varying the dosage of the plant extracts, the temperature of the medium and the contact time between the MW and the plant extracts. Undiluted plant extracts—which were mixed with the MW and heated at 45 °C for 3 h—gave the highest Fe-removal efficiency for CV (70%) and AS (53%) extracts, respectively. Similarly, EG extracts, albeit heated at 25 °C, showed a higher Fe-removal efficiency (85%) than the CV and AS extracts at low to high temperatures. The residual Fe concentration in the MW was 0.83 mg Fe mL−1, 1.39 mg Fe mL−1 and 2.07 mg Fe mL−1 for EG, CV and AS extracts, respectively. Residue solid-phase deposits from the precipitation reaction of the MW with the plant extracts were collected and analyzed. Fe was among the byproducts detected in the deposited material. The characterization of the annealed solid-phase deposits revealed Fe precipitates as maghemite-C (Fe2O3) and magnetite (FeFe2O4) nanoparticles. Therefore, the MW quality and form were improved, making it reusable for other purposes.

1. Introduction

Mining has been an economically important anthropogenic activity since the 16th century [1]. Precious metals such as gold (Au) and other minerals, including iron (Fe), are extracted from ore-rich deposits. Global iron-ore production was estimated at 3332 × 106 tons (metrics) in 2017 [2]. A percentage (3%) of this iron ore comes from Africa. Sub-Saharan African countries, Burkina Faso [3], Nigeria [4], Ghana [5], Mali, Tanzania, South Africa, Zambia and Zimbabwe are the primary suppliers of the beneficial precious metals [6]. Since 2013, South Africa is the largest iron ore supplier in Africa with a ratio of two-thirds of total iron-ore production in Africa [2]. Moreover, the industrial mineral extraction processes used for mining activity are more developed in South Africa; although, studies have revealed that more than 12 million people in Sub-Saharan Africa depend on artisanal mining [7,8,9,10,11]. Most artisanal miners in some African countries use rudimentary techniques and tools without the required mining licenses [12,13]. Therefore, potentially toxic elements (PTE) generated by artisanal mining are released into the environment [13]. Additionally, industrial mining companies generate large quantities of waste, such as gangue, tailings and effluents during the ore extraction and processing [4].
The accumulation of mining wastes in soils and waters poses a risk to the environment and human health [14]. Furthermore, the physical and chemical properties of the soil can be degraded and become unfavorable for plant growth, due to the large accumulated amount of PTE, which changes pH, electrical conductivity, cation exchange capacity, soil mineralogy, microbial and biologic activities of the soil [1,14,15,16,17,18]. Surface water and groundwater quality can be modified by mining activity that consumes a voluminous water quantity which is proportional to the wastewater generated. For example, an estimated 0.22 m3∙g−1 of gold extracted is released as wastewater into the environment [19]. Physical and chemical imbalances generated by the heavy metals and trace elements could destabilize the hydrological cycle, as a result of the impact of mining activity, which would affect surface and groundwater quality [20]. For example, several studies were conducted and revealed the deterioration of groundwater quality in illegal mining sites in Zamfara State, Nigeria [4,21,22,23]. Obiadi et al. (2016) also reported the highest levels of acidity, iron and sulfate in the groundwater near artisanal mining sites in the Enugu area of Nigeria [24].
Most of the heavy metals herein referred to as PTE, i.e., As, Cd, Pb, Fe and Hg, are known to be carcinogenic and were determined to have several adverse effects in humans [4]. Fe in particular, can induce damage to the nervous system and create a dysfunctional renal system as one of clinical outcomes in humans [25].
Various chemical and natural methods have been investigated to eliminate PTEs from mining wastewater, such as natural attenuation [26,27], biotreatment [13,28,29], ozonation, Fenton, Degussa process, alkali discoloration [30] and ionic absorption [31]. However, most of these technologies are expensive and require specialized installations [19]. Natural attenuation and biotreatment are eco-friendly; however, these methods are time consuming for metal removal operations at a large scale and their efficiency is limited by the concentration of the heavy metals in the wastewater.
Recently, phytoremediation was investigated as a method to biodecontaminate PTEs generated by mining activities as a mitigation strategy [17] and to restore the vegetation cover on polluted soils [17,32]. Nevertheless, this method can contribute to additional costs to ensure plants’ survival and requires adequate plantation conditions for the method to be effective. Moreover, the treatment of industrial effluents is still a challenge for long term sustainability of the process designed, which may also require a large plant footprint.
To minimize synthetic chemical usage and phytoremediation—which can result in further environmental contamination—and to manage the mining effluent with efficiency, this research proposes the use of plant extracts for mining wastewater treatment. The method proposed can be defined as environmentally benign, as the process is developed without using any chemical compounds—only plant extracts are applied. Plant extracts contain polyphenols compounds which could be used as catalyst of the precipitation reaction with the MW [33,34] and play the same role as an enzyme which is a biologic catalyst being used to treat wastewaters through a bioremediation approach [35]. In addition, this method converts the effluent contaminants from liquid to a solid-phase residue, which could be easily recovered. Furthermore, plant species Callistemon viminalis, Eucalyptus globulus, Persea americana have been reported as potential plants for phytoremediation [36]. Various findings have shown the potentiality of the Callistemon viminalis flowers [37], the Eucalyptus globulus leaves [38,39] and the Persea americana seeds [40] in metal nanoparticle synthesis, which indicates the feasibility of their extracts to encapsulate dissolved metal constituents in MW through the abundance of bioactive compounds within the plant extracts. Therefore, this study focused on Fe removal in MW, a process assessed using liquid extracts from flowers, leaves and seeds of Callistemon viminalis, Eucalyptus globulus, Persea americana plant, respectively.

2. Materials and Methods

2.1. Mining Wastewater Characterizations

Samples (n = 4) of wastewater from an industrial iron-processing company in South Africa were collected and characterized by measuring the initial Fe concentration. Samples were sent to Central Analytical Facilities (CAF), University of Stellenbosch (Stellenbosch, South Africa) for ensuring highest measurement quality. Inductively coupled plasma–mass spectrometry (ICP–MS, Agilent, Santa Clara, CA, USA) was used with all measurements being triplicated. The maximum of the mean value of the three measurements was considered for the experiments with various plant extracts.

2.2. Calibration Test

Five different concentrations (2; 4; 6; 8; 10 mg·mL−1) of Fe solution were prepared using 1 g·L−1 Fe Standard solution [Fe(NO₃)₃ in HNO₃ 0.5 mol·L−1] purchased from VHG Labs, Manchester, New Hampshire 03103, USA. Deionized water was used to dilute the sample. For each concentration, five calibration measurements were conducted with one control sample (C = 5 mg·mL−1). Measurements were conducted using the UV-vis-NIR spectrometer (Cary 5000, Agilent Technologies, Cheadle, UK) at wavelength (λ) = 450 nm.
Optimal conditions to remove the Fe present in the MW were studied by using plant extracts (n = 3) for different samples (EG = Sample 1; CV = Sample 2 and AS = Sample 3) with the fourth sample being used as a control.

2.3. Plant Extract Preparation

Flower and leaves of the Callistemon viminalis (CV) and Eucalyptus globulus (EG), respectively, were collected at the National Research Foundation iThemba Laboratory (Cape Town, South Africa) accelerator-based sciences, Western Cape, South Africa. Persea americana seeds (AS) were bought at a nursery, Somerset West Mall, Western Cape, South Africa. The plant parts were collected and washed, with those of CV and EG being cut into small pieces. Then, a mass of 10 g of each part was added into deionized water (500 mL) to extract the bioactive compounds within each plant part. The mixture was heated for 3 h under low temperature (45 °C). The extract solution was cooled and filtered (n = 3) using standard Whatman Grade No.1 filter paper (11 µm) to eliminate residual solids. The pH of each extract was measured using a pH meter (Jenway 3510, Camlab, Cambridge, UK). Measurements were repeated thrice with the following mean values being recorded, respectively, 4.3 (±0.043); 4.5 (±0.012) and 5.02 (±0.078) for EG, CV and AS samples, respectively.

2.4. Iron Removal Conditions

Each plant extract was separately added into the MW (1:1 v/v). The mixture of MW and plant extracts was left to precipitate under various experimental conditions, to accelerate and maximize the Fe precipitation. The following parameters were varied: (1) the dosage of the plant extracts, (2) the temperature of the medium and (3) the contact time of the two solutions.

2.4.1. Dosage of the Plant Extracts

Different concentrations (n = 6) of plant extracts were prepared for each plant species. Deionized water was used to dilute the extracts with dilution ratios 10:0; 9:1; 8:2; 7:3; 6:4 and 5:5. Subsequently, into a volume of 50 mL of each diluted extract, an equivalent volume of the MW (1:1, v/v) was added. The experimentation for this part of the study was conducted under ambient temperature, observing maximal time which culminates to the highest deposit from the precipitation.

2.4.2. Temperature Considerations

The undiluted plant extract of each plant (10:0 CV, 10:0 EG and 10:0 AS) was added into the MW with the same volumetric ratio as the experimentation on the effect of the dosage of the plant extracts. Three temperature levels were used, i.e., 5 °C; 25 °C and 45 °C, to test the reactivity gain or loss for each plant extract, as the temperature can have a negative effect on biologic materials such as the plant extracts. The precipitation reaction time was defined as a function of the deposit quantity.

2.4.3. Contact Time

The same undiluted plant extracts (10:0 CV, 10:0 EG and 10:0 AS) were added separately into the same volume ratio of the MW and left to react under ambient temperature. The absorption spectrum of the liquid medium mixture was monitored every 60 min by collecting 3 mL of the mixture which was analyzed using a UV-vis-NIR spectrometer (Cary 5000, Agilent Technologies, Cheadle, UK) at spectra wavelength analysis ranging from 200 to 800 nm, until the variation of the highest peak became insignificant.
At the end of all experimentations, the absorbance spectrum of the remaining MW/plant extract mixture was measured, and the percentage of the Fe removal being determined through the absorbance values obtained and the calibration test results. The precipitate was collected and dried in an oven at a temperature of 50 °C. The dried powders were annealed in an open-air furnace at 200 °C for 1 h and characterized.

2.5. Precipitate Characterizations

The dried and annealed powders compositions were studied. First, the crystalline structure of the minerals that form the dried powder was studied by the means of the X-ray diffraction (XRD) (Model Bruker AXS D8, Bruker, Billerica, MA, USA) by using a copper anode radiation CuKa with a wavelength (λ) = 1.5406 Å. The Monochromator crystal was used as a filter. The pattern was reviewed using the ICDD Grant-in-Aid (1990), USA [41]. Then, the surface morphology and the elemental compositions of each annealed powder samples were studied by scanning electron microscopy (SEM) (TESCAN VEGA3 a Czech Republic model, TESCAN, Brno, Czech Republic) and energy dispersive X-ray spectroscopy (EDX) (TESCAN VEGA3 a Czech Republic model, TESCAN, Brno, Czech Republic), respectively. SEM model is equipped with a tungsten filament used as an electron source operating in Nano space. The sample was carbon-coated prior to analysis, to improve the conductivity. The surface morphology was acquired using backscatter and secondary detectors, with a high voltage of 20 kV at different magnifications using Vega software. The compositional analysis was determined on selected area and spots using the INCA software from Oxford. The images are given with a scale bar of 10 µm.

3. Results and Discussion

3.1. Calibration Test

A calibration curve with R2 value 0.99522 at p = 5% was obtained. The slope and intercept values were 0.099 (±0.00308) and −0.0181 (±0.01862). Compared to Samples 1, 2, and 4, the C samples showed an average accuracy of 105.2% at 5 mg·mL−1 concentrations (n = 5) and errors of ±0.05783; ±0.03695; ±0.04376 and ±0.07056, respectively.

3.2. Mining Wastewater Characterizations

The mean value (n = 3) of the Fe concentration in the wastewater samples (n = 4) from the ICP-MS measurement results was 5.53 mg∙mL−1 ± 0.196, 4.63 mg∙mL−1 ± 0.101, 4.40 mg∙mL−1 ± 0.065, 4.39 mg∙mL−1 ± 0.066 for Samples 1, 2, and 4, respectively. Minimal variation was observed among the triplicate measurements, confirming the efficiency of the measurement method. Sample 1—which had the highest mean value of each sample—was considered as the initial concentration of the Fe concentration in the MW.

3.3. Iron (Fe) Removal

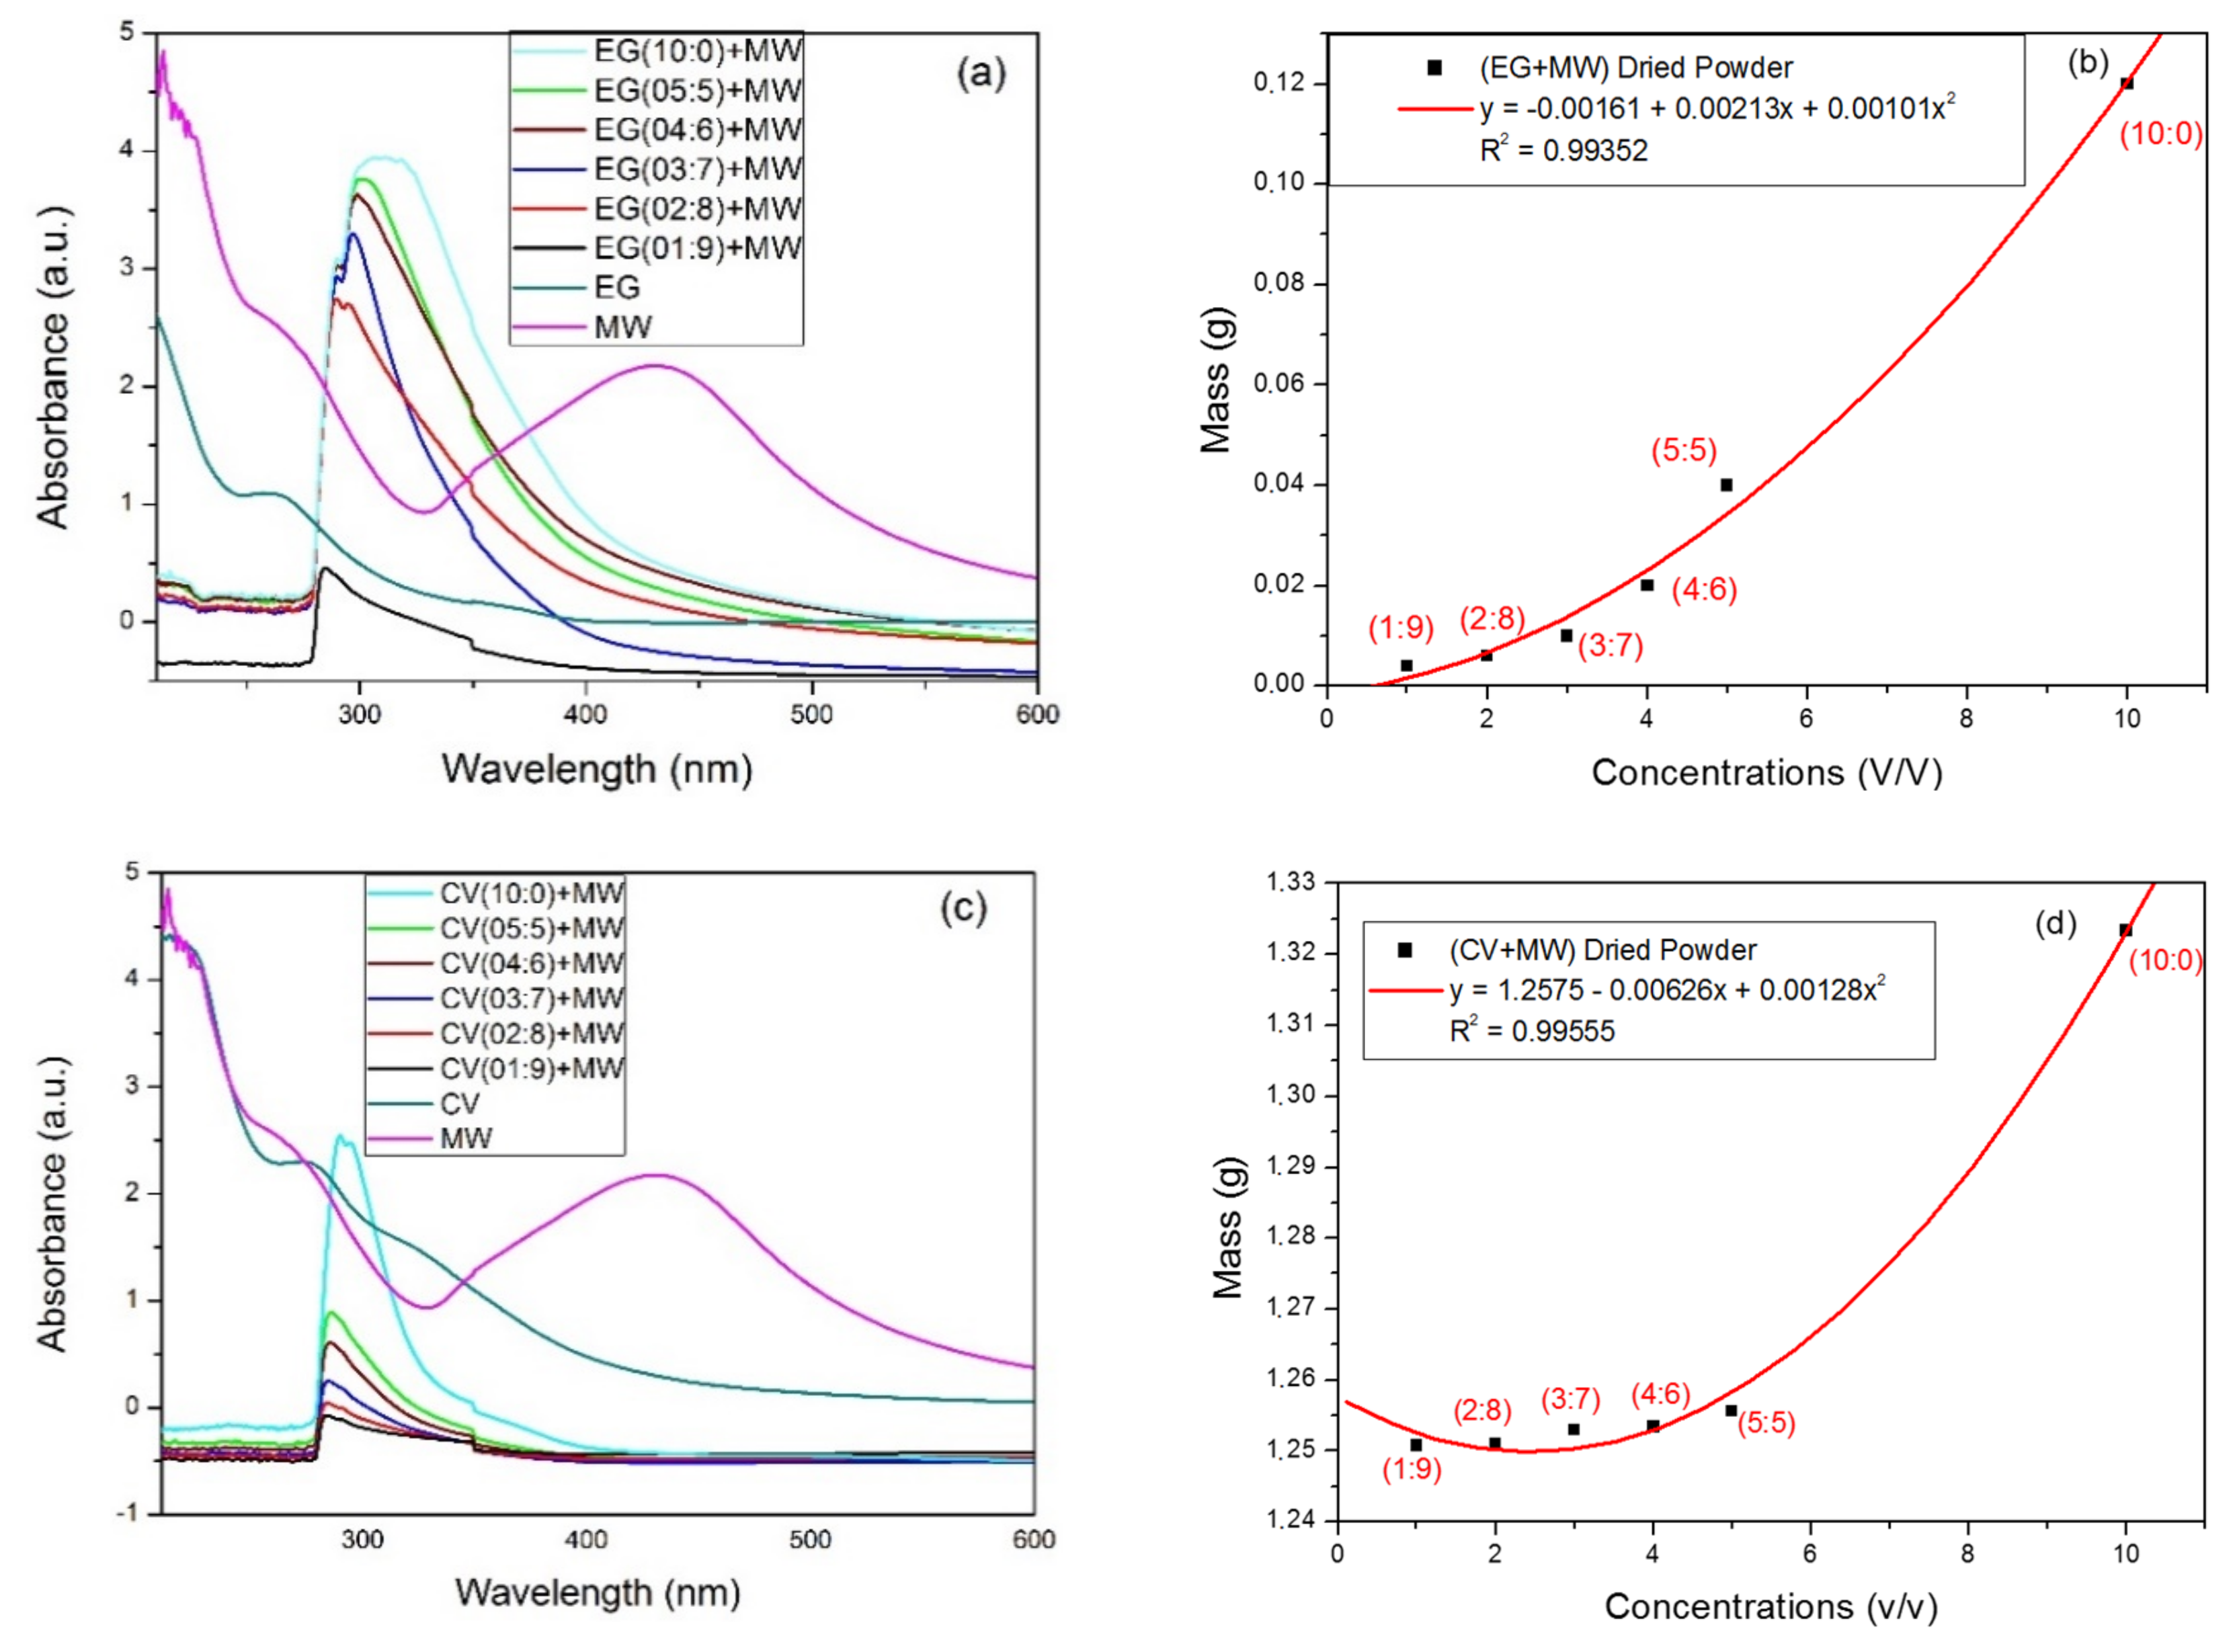
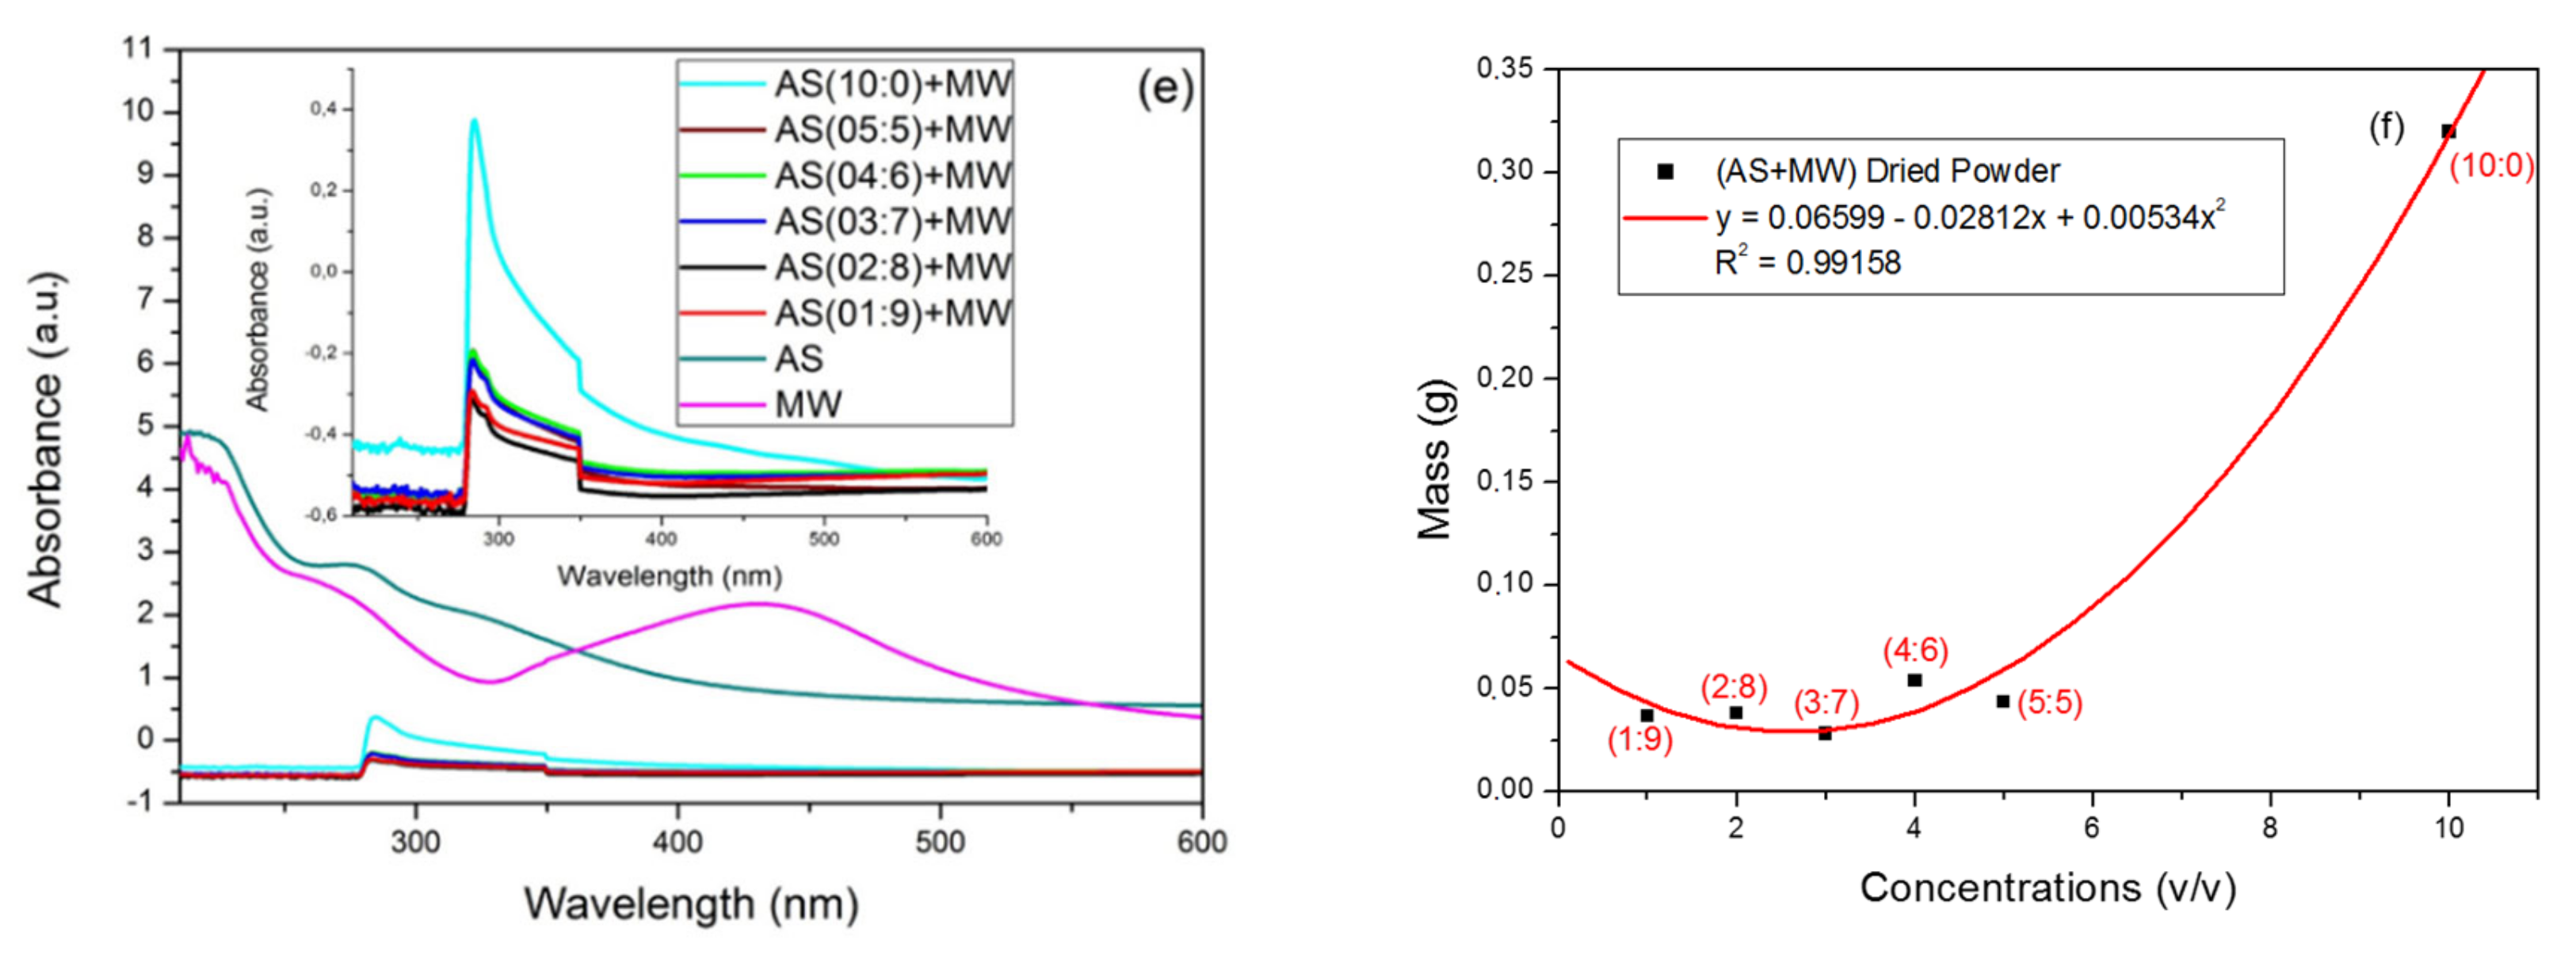
3.3.1. Effect of the Dosage of the Plant Extracts

The effect of dosage of the plant extracts on iron removal from the MW was studied with significant quantities of the precipitate being observed at the end of each experiment, as illustrated in Figure 1. The absorbance peaks of the MW reduced at the same wavelength (300 nm) after the addition of the plant extracts for all plant species extracts used (Figure 1a,c,e). Generally, the absorbance peaks decreased as a function of the concentration of the plant extracts, except for the following mixtures: AS (02:8) + MW and AS (01:9) + MW (Figure 1e). The absorbance peak of the AS (10:0) + MW was higher than that of AS (01:9) + MW mixture; albeit, a slight peak height difference was noticed. The deposits quantity (Figure 1b,d,f) had an exponential trend, from 50 to 300 mg, with the increase in the plant extract concentrations (R2 = 0.99; p = 5%).
The absorbance peak at a similar wavelength for all plant extracts suggested the formation of the same chemical element which is a byproduct formed during the precipitation reaction. Increases in plant extracts culminated into higher precipitate formation and rapidity in the precipitation reaction, asserting the efficacy of a higher concentration of the bioactive compounds in the extracts. It was hypothesized that other trace elements in the MW would form part of the deposit which can intensify the absorbance peak. Therefore, the byproduct chemical elements in the precipitate were further studied to ascertain deposit purity, which can be influenced by an increase in the plant extracts concentration used.

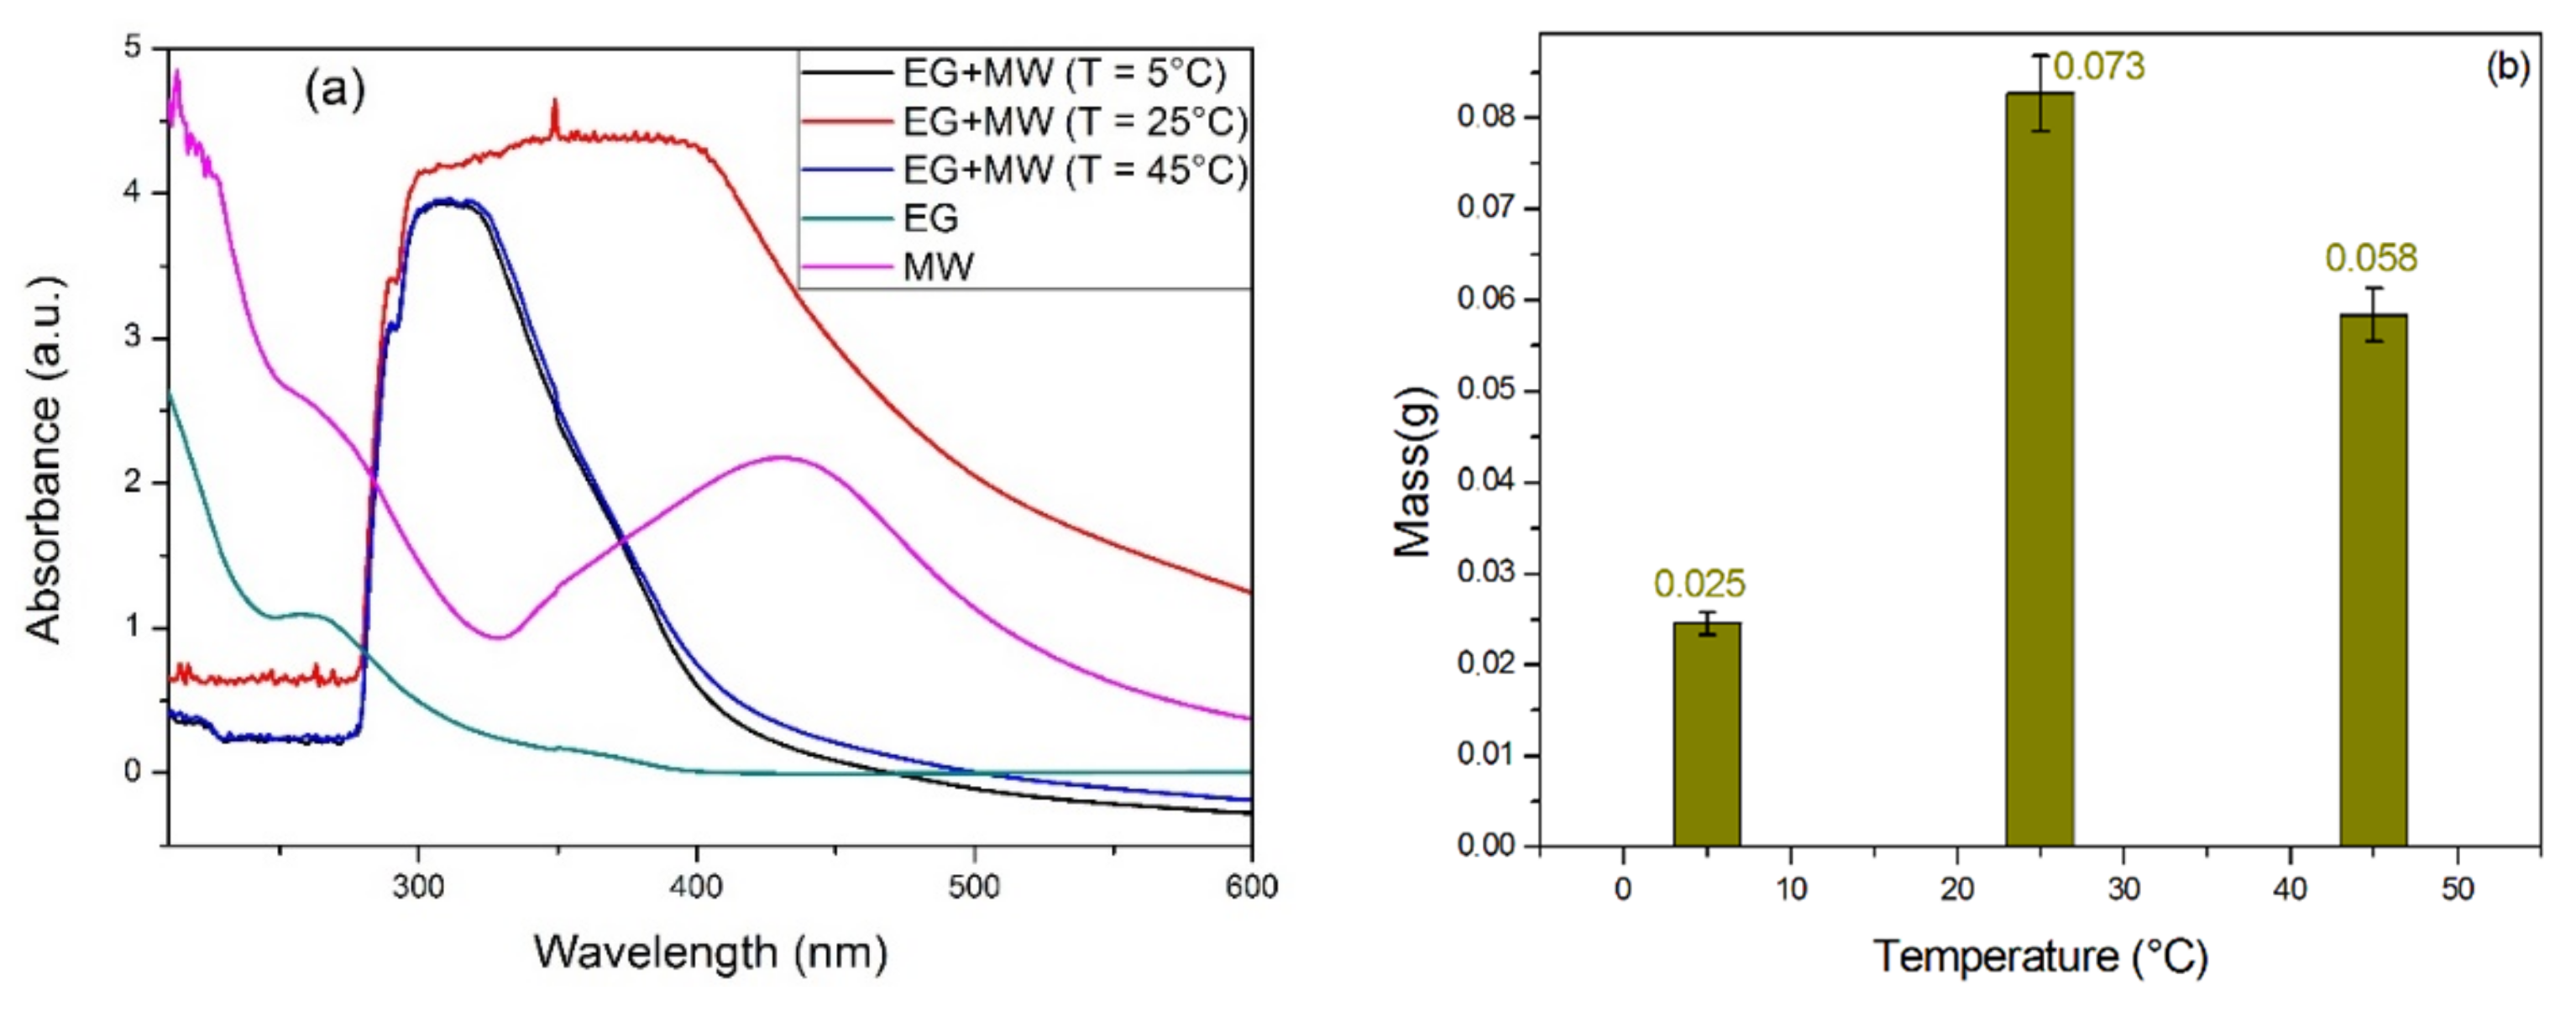
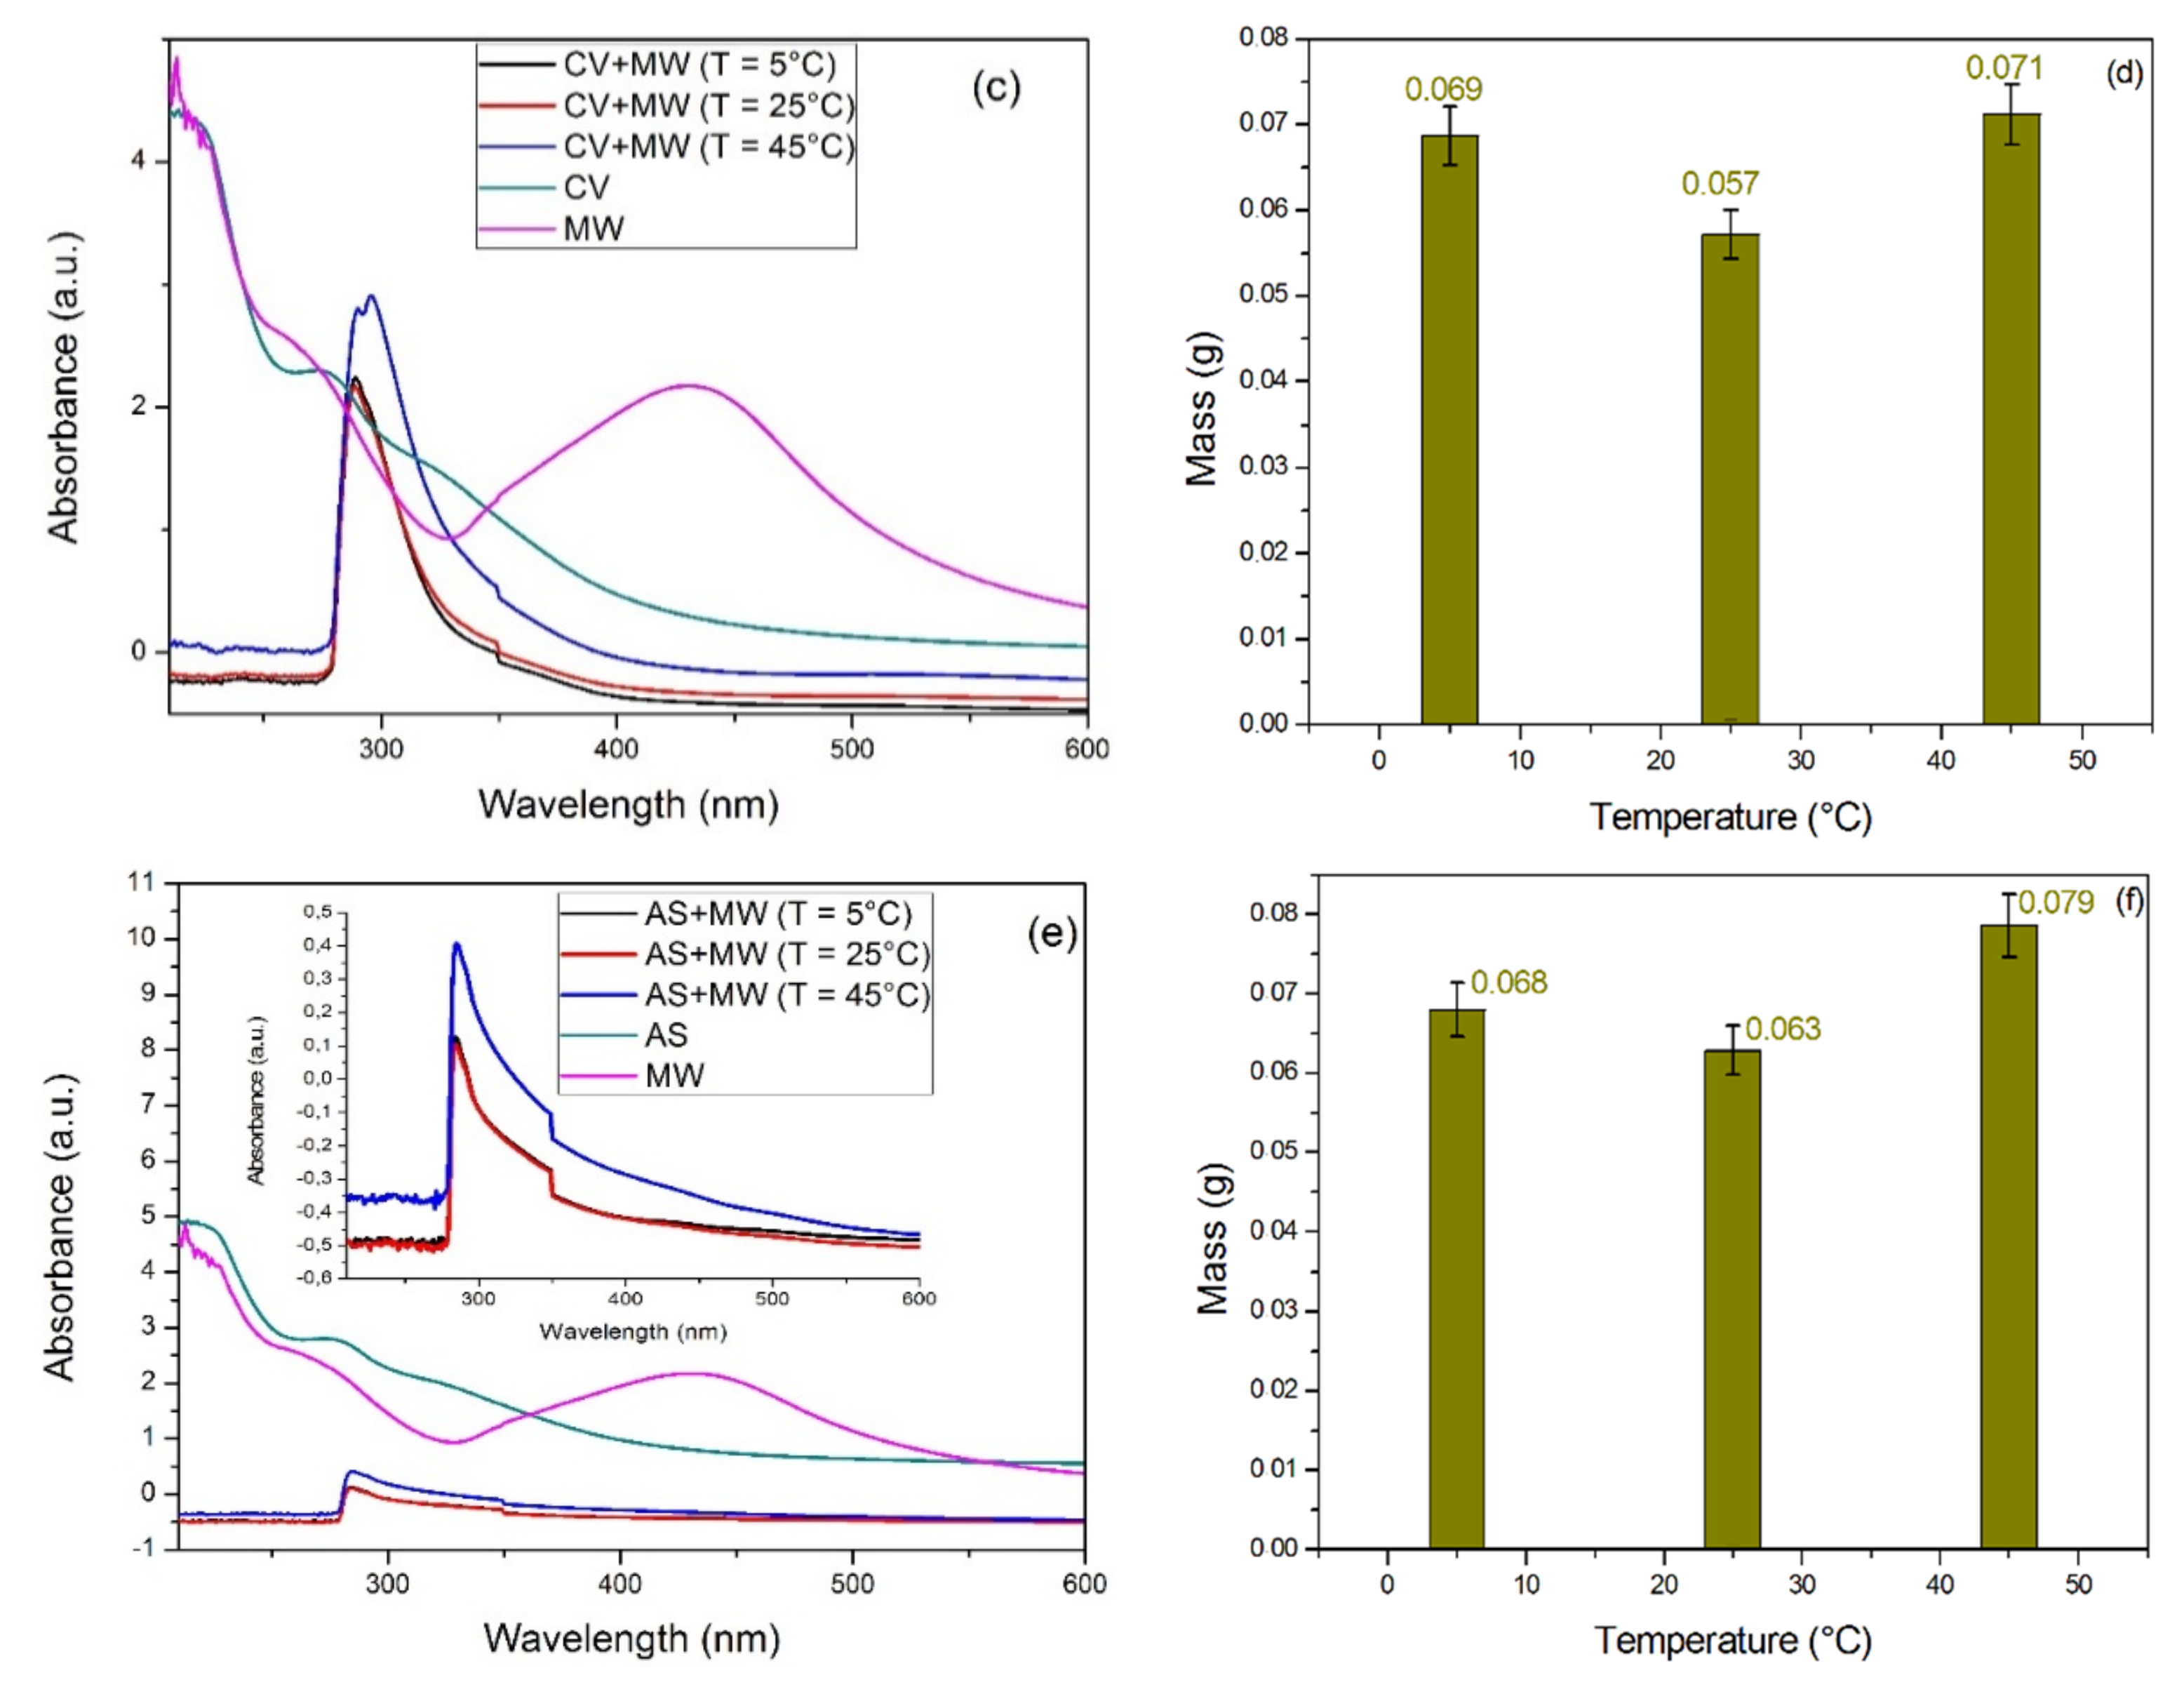
3.3.2. Effect of the Temperature

Similarly, the temperature effect on the mixture of the plant extract and MW was studied—see Figure 2. A similar trend was observed with regards to the absorbance peak of the MW, the highest being at a wavelength of 300 nm (Figure 2a,c,e), with the absorbance peak being highest at 45 °C for all plant extracts except for the mixture of EG + MW, which had a maximum absorbance peak at 25 °C. Insignificant differences were observed on the absorbance curve at 5 °C and 25 °C for CV + MW and AS + MW mixtures. A similar absorbance curve trend was observed for EG but at 5 °C and 45 °C. The precipitate quantity (Figure 2b,d,f) increased at the highest temperature 45 °C for the mixtures CV + MW and AS + MW and almost at a similar level for the other temperature values 5 °C and 25 °C. However, for the mixtures EG + MW the precipitate quantity was higher at 25 °C compared to 5 °C and 45 °C.
By observation, the bioactive compounds in the CV and AS seemed to require a high temperature (T = 45 °C) to precipitate most of the Fe in the MW than EG. It was determined that low and ambient temperature (i.e., 5 °C and 25 °C) were ineffective to decontaminate the MW; albeit, the EG bioactive compounds were effective at room temperature (T = 25 °C) than at a high temperature (T = 45 °C). Overall, the EG extracts were observed to react easily with the MW PTEs even at low (T = 5 °C) and high (T = 45 °C) temperatures, but with a lower byproduct formation than at ambient temperature.

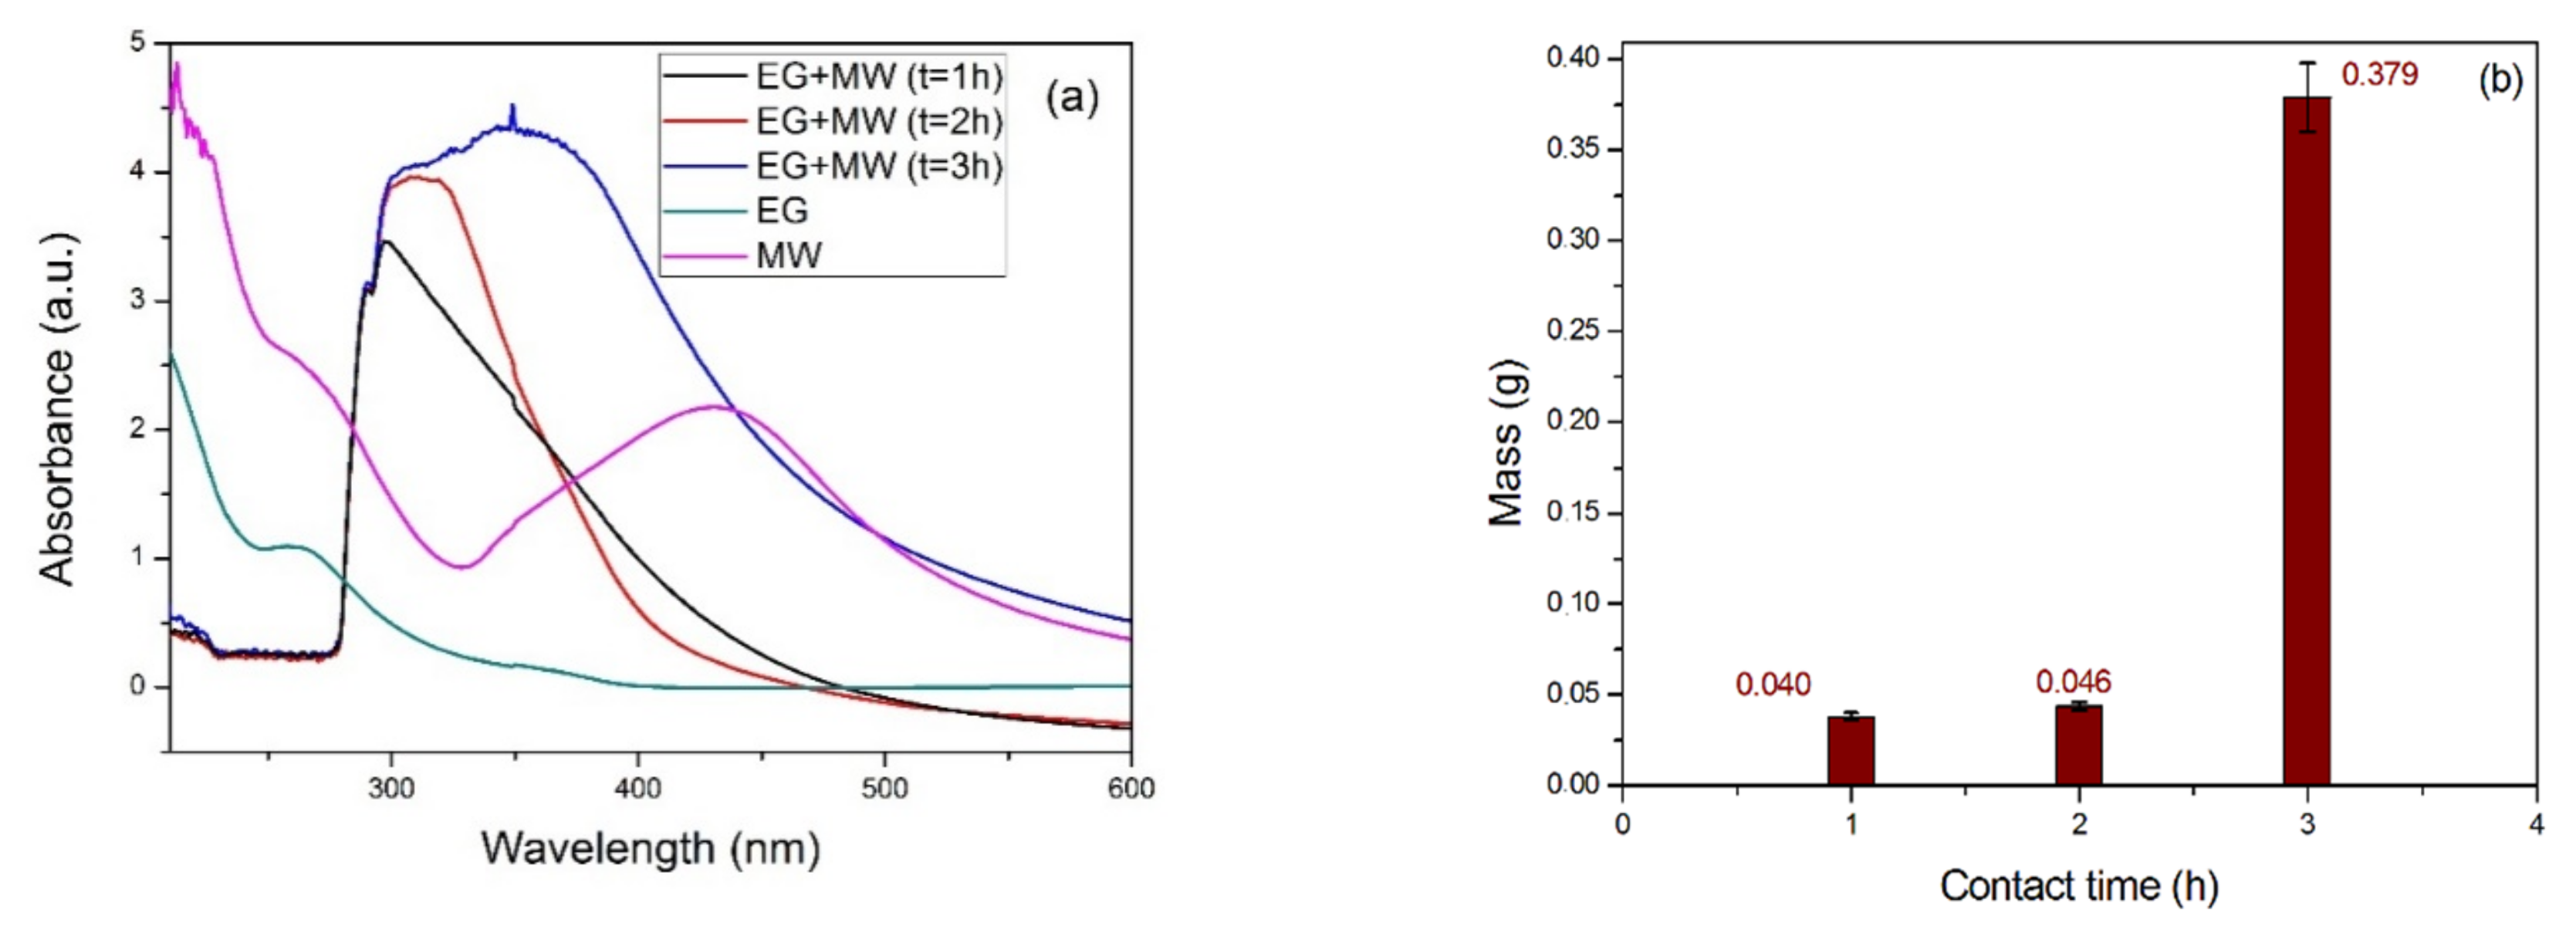
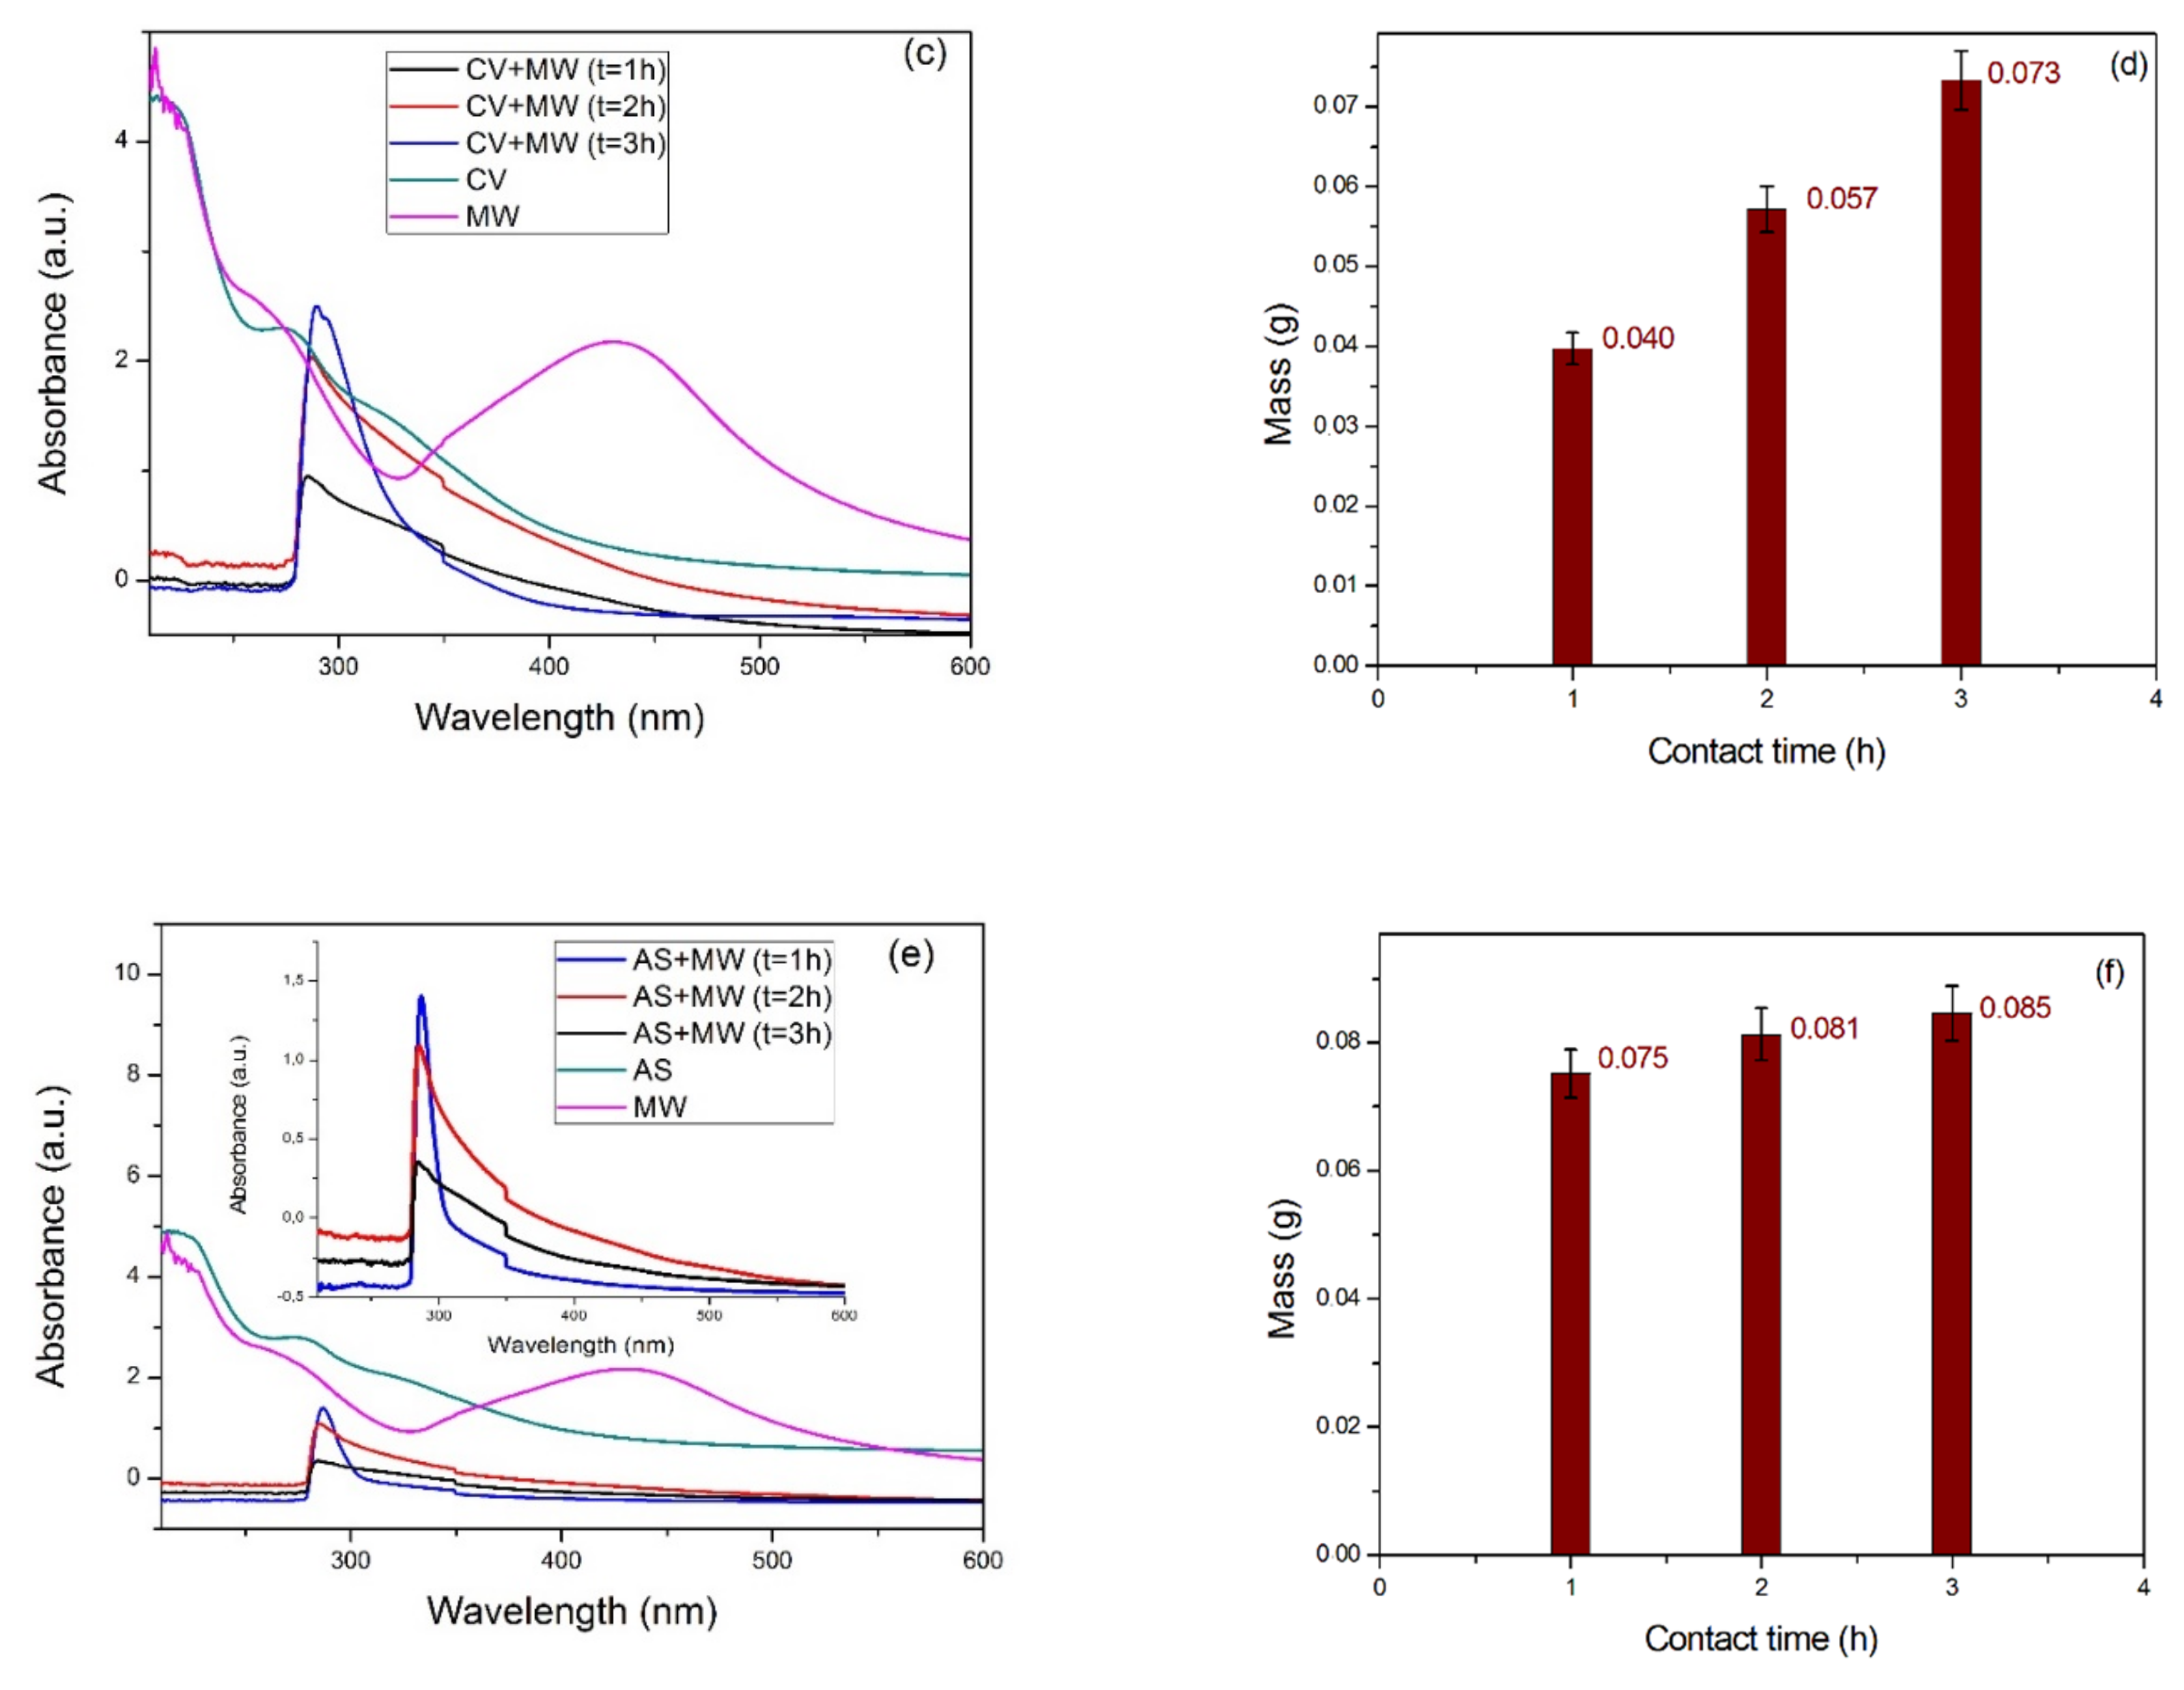
3.3.3. Effect of the Contact Time

Figure 3 shows the effect of the contact time on the MW decontamination by the plant extracts and the quantity of deposits formed. The absorbance value of each plant extract and MW mixture at each contact time interval increased thus the increased duration of the experiment. Additionally, the deposits quantity was determined to correlate with the contact time. The maximum contact time to obtain a maximum quantity of the deposits was determined to be 3 h. Minimal changes were observed after 3 h of MW and plant extracts contact time.
Table 1 illustrates the maximum removal of Fe in the mixture of plant extracts + MW for each parameter studied. A high removal rate was obtained for the mixture EG + MW for all tested parameters followed by the CV + MW and AS + MW. The parameter conditions determined to have a maximum Fe removal rate and precipitate formation were similar for CV + MW and AS + MW, which are conditions in which the use of the undiluted plant extracts were added to the MW and heated at 45 °C for 3 h. However, the plant extracts from EG consumes less energy (with low/minimal heating requirements at T = 25 °C) than the other plant extracts for effective decontamination of the MW.
The remaining Fe concentration varied from 0.83 to 2.64 mg Fe mL−1. The lowest concentration was for MW samples decontaminated using EG plant extracts with the highest residual Fe concentration being for MW bio-treated with AS plant extracts. The residual Fe concentration ranged higher than the permissible limit of Fe for drinkable water, which is 0.1 mg∙L−1 according to the World Health Organization [42,43]. However, continuous exposure of MW to the fresh plant extract could allow it to reach the least Fe concentration values lower than the maximum limit (5 mg∙mL−1) for irrigation water quality [44]. Therefore, the possibility for long term reuse of the treated MW for agricultural purposes using this MW bioremediation is feasible. Moreover, Nurmi and Sarathi have reported a recovery percentage of 87% (with 13% lost) of the Fe nanoparticles from aqueous solution by drying the precipitate [45]. The recovery percentage rate of this finding is almost the same as the highest removal rate percentage under temperature condition T = 25 °C of the mixture EG + MW.

3.4. Deposit Characterization

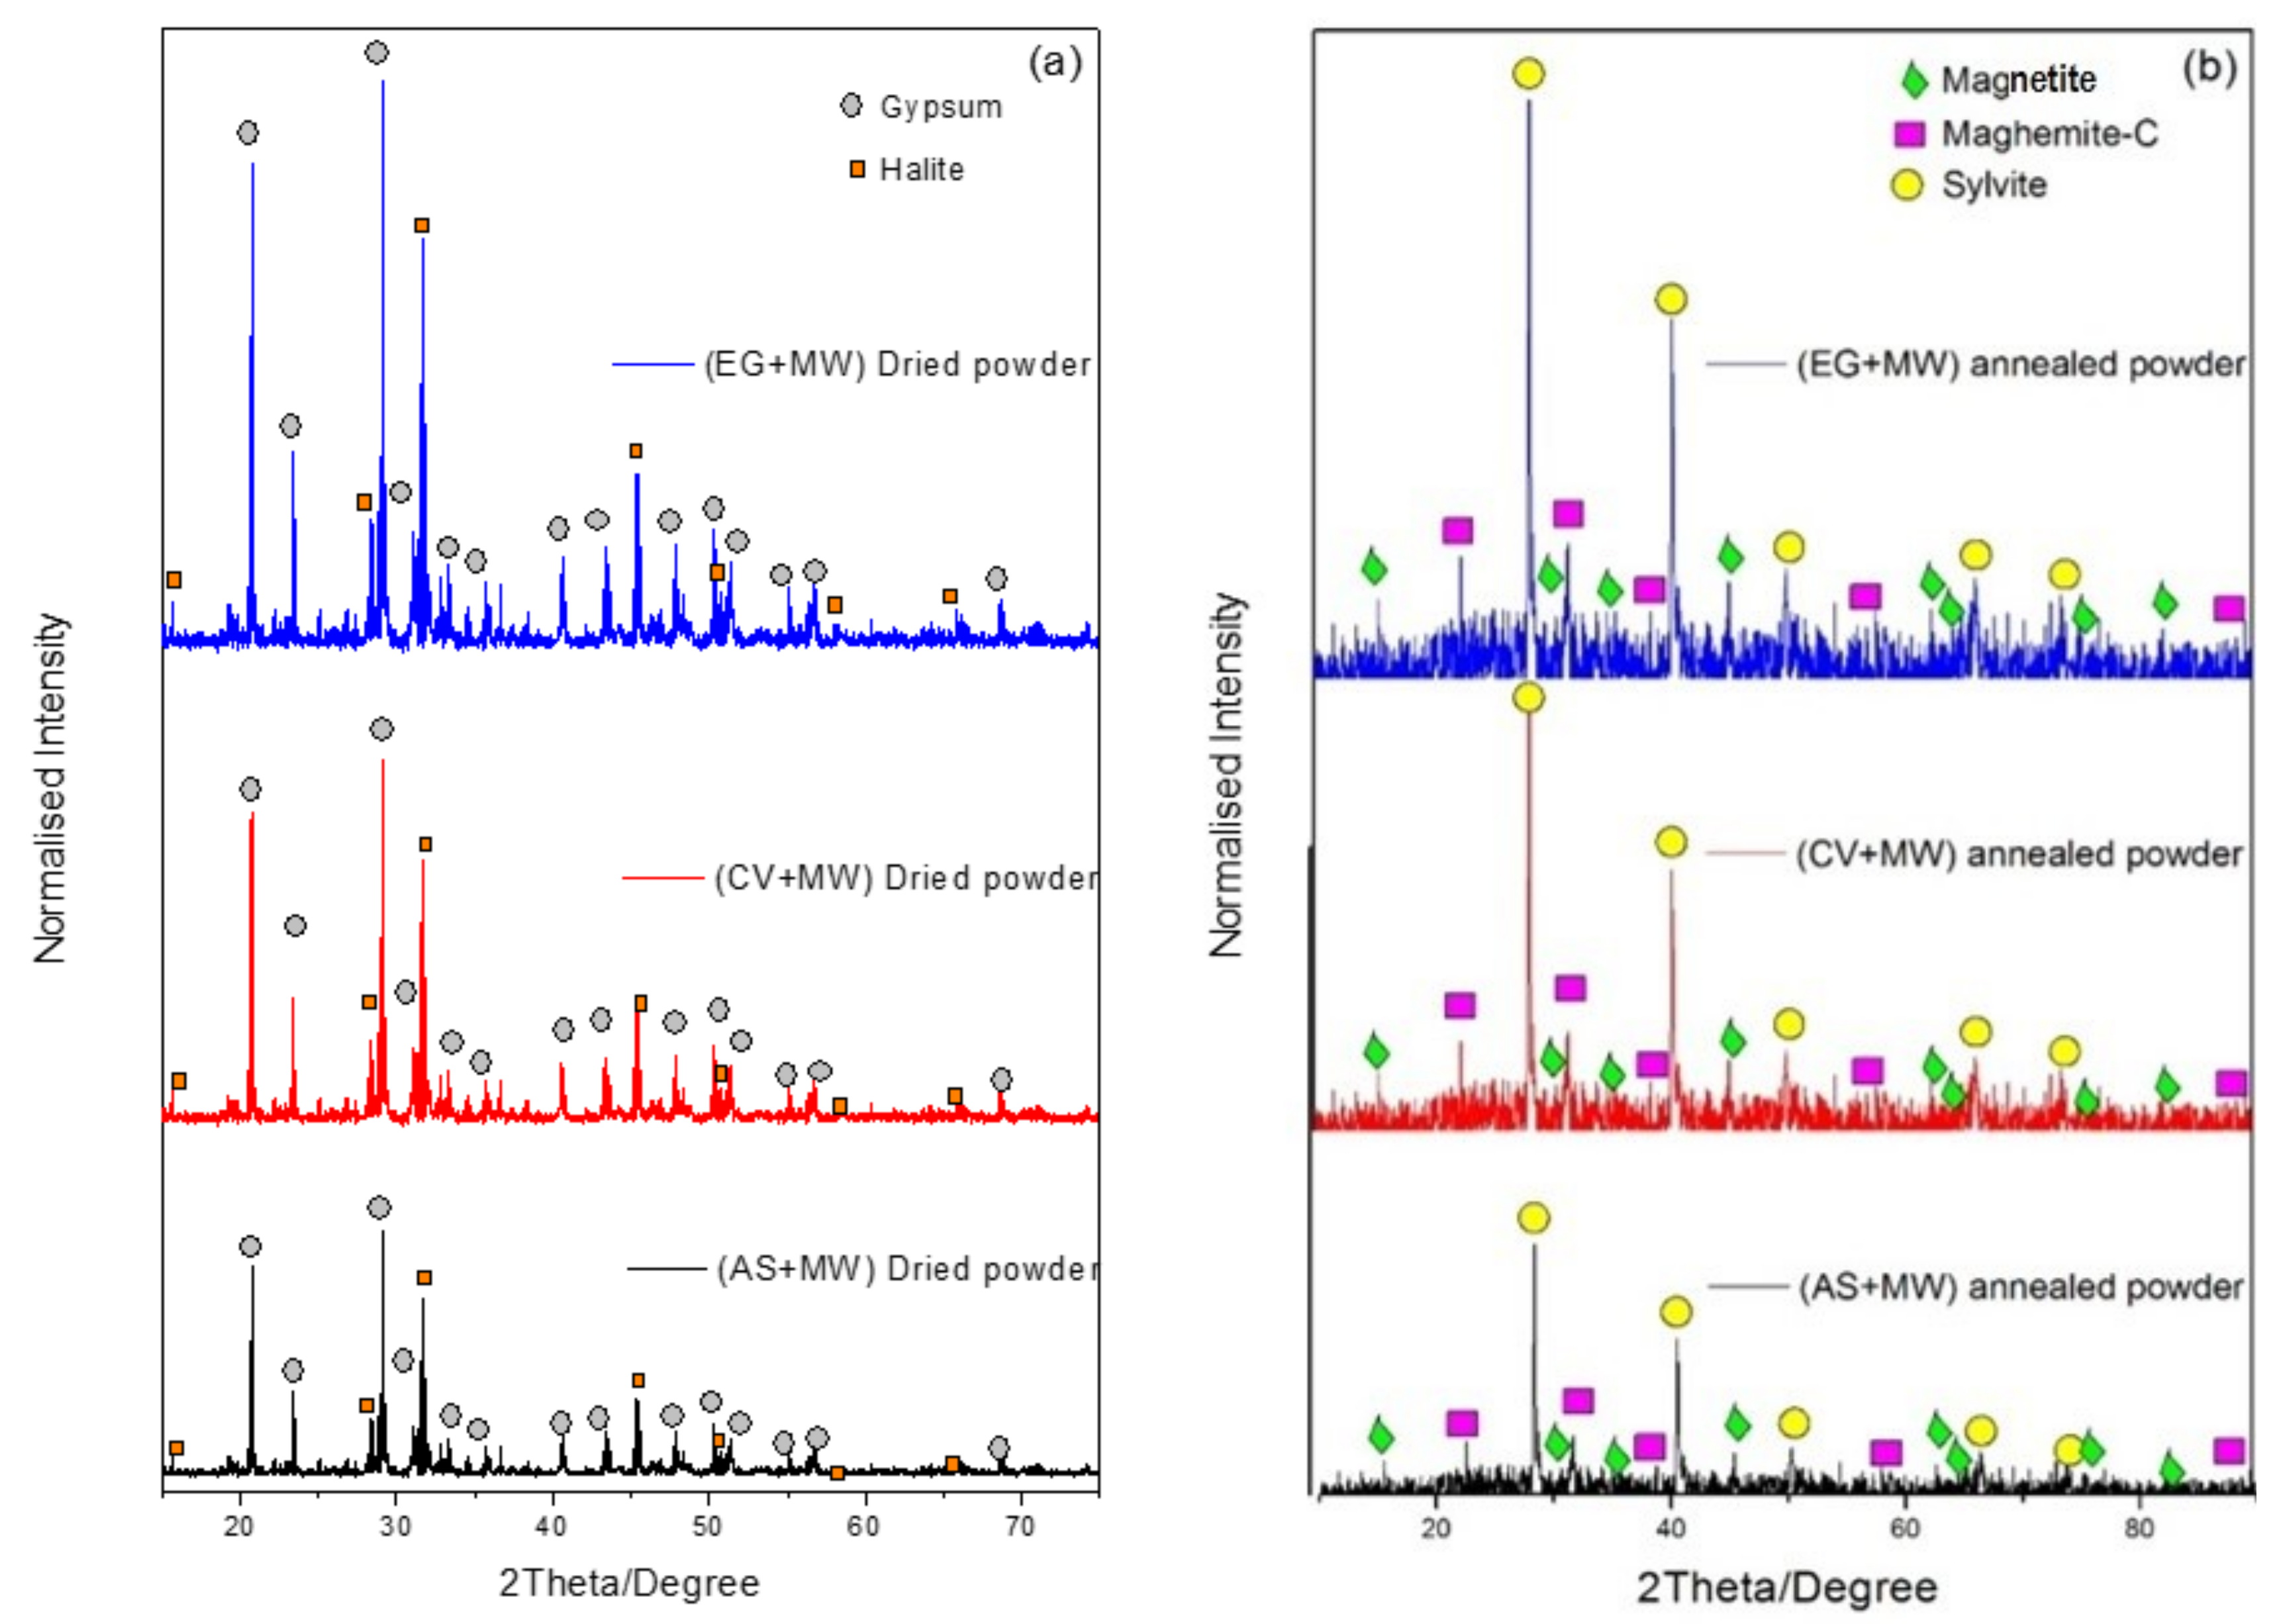
3.4.1. Precipitate (Deposit) Structure

Figure 4 shows the X-ray diffraction (XRD) patterns of the precipitate collected at the end of the MW treatment for individual plant extracts (EG, CV and AS) precipitation for both dried and annealed samples.
For the dried powders, two types of crystalline structures were observed for all plant extract types (Figure 4a). The first type of the crystalline structure is a crystallite form with a lattice-based-centered monoclinic named gypsum or calcium sulfate dihydrate (CaSO4·2H2O). The second crystalline structure called halite or sodium chloride (NaCl) has a lattice face-centered cubic crystallite form. However, the highest peak intensity for the dried powders varied for each plant extract. Very high peaks were obtained for the dried powders from the EG experiments followed by those of CV and AS. These results can further be confirmed by using HPLC/GC–MS to understand the peak variation of each plant extract and its chemicals constitution prior to describing the reaction of the Fe from the mixture of MW and plant extracts. Polyphenols have been reported by several studies as common bioactive compounds occurring in many plants, such as EG, CV and AS extracts [46,47,48,49].
However, the annealed powders confirmed the presence of the maghemite-C (Fe2O3) and magnetite (FeFe2O4) nanoparticles as well as sylvite (KCl) (Figure 4b). The presence of the iron oxide nanoparticles could be the result of the precipitation reaction between the MW and the plant extracts containing polyphenols, which can play the role of catalyst of the reaction [33]. The Cl and K observed are likely associated with the plant extracts or are present as trace elements in the MW.

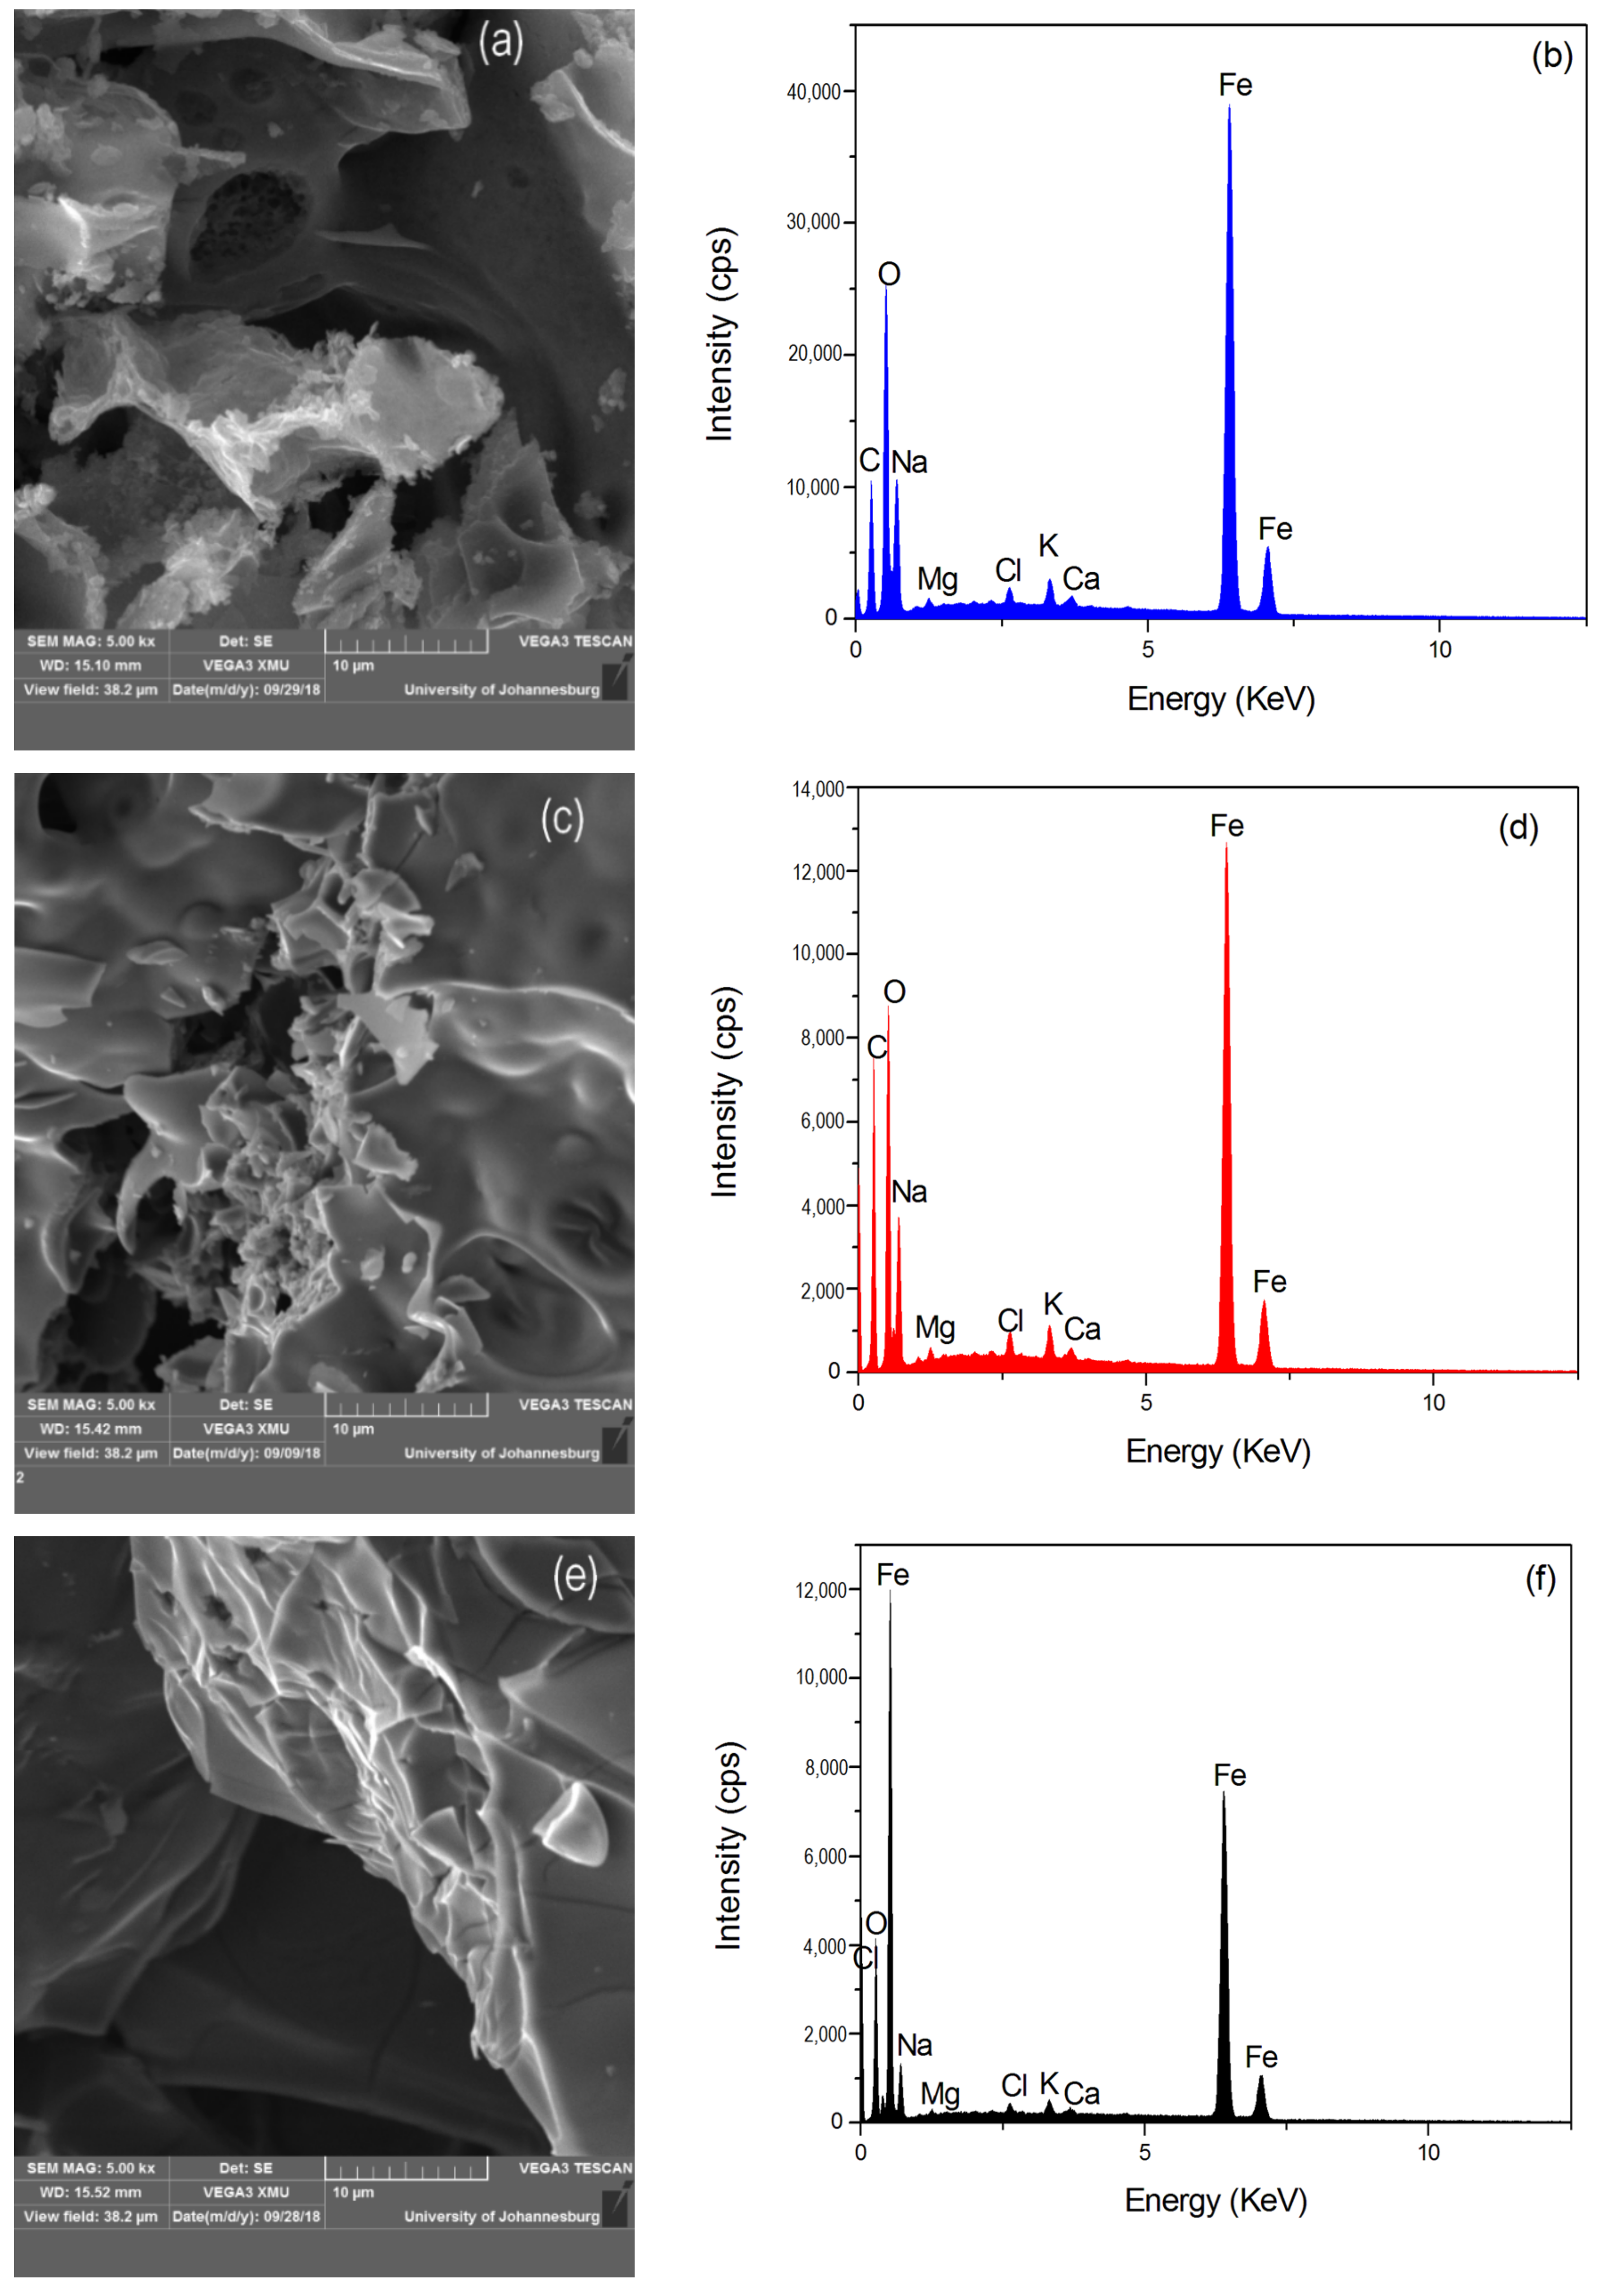
3.4.2. Precipitate Surface Morphologic and Elemental Composition

The morphological surface and elemental composition of the annealed powders are presented in Figure 5. The morphological surface of the annealed powders had multiple shapes, which are polymorphisms and nanosheets. Furthermore, the elemental composition of the samples showed various chemical elements such as Cl, Fe, Mg, K, O, C, Na and Ca. The annealing phase reveals the crystallinity shapes of the precipitate. Several findings have been reported on the crystallinity materials which could be obtained after annealing the dried powders of precipitates from wastewater with chemical compounds [50,51,52]. The presence of all these elements in the annealed powders could explain the various shapes that were observed by the SEM images (Figure 5a,c,e). The chemical elements Mg, K, O, C, Na and Ca were assumed to be from the plant extracts while the Fe, Cl elements were from the MW with the C element assumed to come from the coating substrate of the samples during the analyses (Figure 5b,d,f).

4. Conclusions

Mining wastewater (MW) decontamination using various plant extracts was investigated. Plant extract type, dosage of the plant extracts, temperature of the medium and contact time between the mixture of MW and plant extracts were determined to play a major role in the effectiveness of the iron (Fe) removal from the MW. Eucalyptus globulus extract had the highest efficiency for Fe removal, achieving 85% removal in 3 h at ambient temperature (25 °C). Extracts from the Callistemon viminalis and Persea americana required a high temperature to remove maximum Fe from the MW. This is unsuitable where energy savings or unreliability of electrical power is prevalent. To decontaminate MW rich in Fe, EG extracts are recommended, as the mixture consumes less energy to remove the most Fe from the MW. By using the EG, the removal process could be applied at room temperature (25 °C). This will be easily applied in a medium to large scale MW treatment systems with a controlled reactor, in particular for Fe decontamination even in the presence of trace elements, especially in a rural setting whereby technological advances are minimal and where the community is affected by artisanal mining activities. Possible reuse of the treated MW in other sectors like a water resource for irrigation or drinkable water for animals can be explored once the process is optimized. Also, the solid phase from the deposits contained stable nanoparticles of Fe, therefore, allowing to reduce the storage cost of the effluents in the liquid phase by decontaminating PTEs, in particular Fe. Besides, the magnetite nanoparticle deposits could be doped with other materials for medical application purposes, especially for anti-microbial [53] and superparamagnetic gels [54]. For future investigation, the bioactive compounds in the plant extracts should be characterized by HPLC/MS analysis to better understand the principle of the Fe reaction with the plant extracts.

Author Contributions

Conceptualization, L.C.R. and A.C.N.; methodology, L.C.R.; software, L.C.R.; validation, A.C.N., S.K.O.N. and E.F.-K.; formal analysis, L.C.R.; investigation, B.U.M., M.O.A., A.C.N. and S.K.O.N.; resources, L.C.R., S.K.O.N. and E.F.-K.; data curation, S.K.O.N.; writing—original draft preparation, L.C.R.; writing—review and editing, B.U.M., M.O.A., A.C.N. and S.K.O.N.; visualization, A.C.N.; supervision, S.K.O.N. and E.F.-K.; project administration, L.C.R., S.K.O.N. and E.F.-K.; funding acquisition, L.C.R. All authors have read and agreed to the published version of the manuscript.

Funding

Authors would like to thank the National Research Foundation (NRF)-TWAS (Unique Grant No 110793).

Acknowledgments

UNESCO–UNISA Africa Chair in Nanosciences/Nanotechnology Laboratories, College of Graduate Studies, University of South Africa (UNISA), Muckleneuk Ridge, Pretoria, South Africa and Bioresource Engineering Research Group (BioERG) are hereby acknowledged for their support.

Conflicts of Interest

The authors declare no conflict of interest.

References

  1. Grimaldi, M.; Guédron, S.; Grimaldi, C. Impact of gold mining on mercury contamination and soil degradation in Amazonian Ecosystems of French Guiana. Land-use Chang. Impacts Soil Process. Trop. Savannah Ecosyst. 2015, 1, 95–106. [Google Scholar] [CrossRef]
  2. Brown, T.J.; Idoine, N.E.; Raycraft, E.R.; Hobbs, S.F.; Shaw, R.A.; Everett, P.; Kresse, C.; Deady, E.A.; Bide, T. World Mineral Production 2013-17; Keyworth: Nottingham, UK, 2017. [Google Scholar]
  3. Razanamahandry, L.C.; Andrianisa, H.A.; Karoui, H.; Yacouba, H.; Manikandan, E.; Maaza, M. Cyanide dynamics in catchment areas affected by artisanal gold mining in Burkina Faso. In Artisanal Small Mining Conference 2018; South Africa Institute of Mining and Metallurgy (SAIMM): Johannesburg, South Africa, 2018. [Google Scholar]
  4. Mao, C.; Song, Y.; Chen, L.; Ji, J.; Li, J.; Yuan, X.; Yang, Z.; Ayoko, G.A.; Frost, R.L.; Theiss, F. Human health risks of heavy metals in paddy rice based on transfer characteristics of heavy metals from soil to rice. Catena 2019, 175, 339–348. [Google Scholar] [CrossRef]
  5. Arag, F.M.; Rud, J.P. Mining, Pollution and Agricultural Productivity: Evidence from Ghana. SFU 2012, 44, 1–53. [Google Scholar]
  6. Gajigo, O.; Mutambatsere, E.; Ndiaye, G. Gold Mining in Africa: Maximizing Economic Returns for Countries; African Development Bank Group: Abidjan, Cote d’Ivoire, 2012. [Google Scholar]
  7. Janneh, A.; Ping, J. Minerals and Africa’s Development: The International Study Group Report on Africa’s Mineral Regimes; Economic, C., Ed.; UNECA: Addis Ababa, Ethiopia, 2011. [Google Scholar]
  8. Schure, J.; Ingram, V.; Tieguhong, J.C.; Ndikumagenge, C. Is the god of diamonds alone? The role of institutions in artisanal mining in forest landscapes, CongoBasin. Resour. Policy 2011, 33, 363–371. [Google Scholar] [CrossRef] [Green Version]
  9. Adler, R.; Bergquist, B.A.; Adler, S.E.; Remy, J.; Guimarães, D.; Lees, P.S.J.; Niquen, W.; Velasquez-lópez, P.C.; Veiga, M.M. Challenges to measuring, monitoring, and addressing the cumulative impacts of artisanal and small-scale gold mining in Ecuador. Resour. Policy 2013, 38, 713–722. [Google Scholar] [CrossRef]
  10. Weng, L.; Endamana, D.; Klintuni, A.; Levang, P.; Margules, C.R.; Sayer, J.A. Asian investment at artisanal and small-scale mines in rural Cameroon. Extr. Ind. Soc. 2015, 2, 64–72. [Google Scholar] [CrossRef]
  11. Razanamahandry, L.C.; Andrianisa, H.A.; Karoui, H.; Podgorski, J.; Yacouba, H. Prediction model for cyanide soil pollution in artisanal gold mining area by using logistic regression. Catena 2018, 162, 40–50. [Google Scholar] [CrossRef]
  12. Veiga, M.M.; Angeloci-santos, G.; Meech, J.A. Review of barriers to reduce mercury use in artisanal gold mining. Extr. Ind. Soc. 2014, 1, 351–361. [Google Scholar] [CrossRef]
  13. Razanamahandry, L.C.; Andrianisa, H.A.; Karoui, H.; Kouakou, K.M.; Yacouba, H. Biodegradation of free cyanide by bacterial species isolated from cyanide-contaminated artisanal gold mining catchment area in Burkina Faso. Chemosphere 2016, 157, 71–78. [Google Scholar] [CrossRef]
  14. Silva, E.; Caixeta, G.; Borges, T.; Mendes, M.; Carrijo, L.; Melo, A.; Guimarães, R.; Roberto, L.; Guilherme, G. Combining biochar and sewage sludge for immobilization of heavy metals in mining soils. Ecotoxicol. Environ. Saf. 2019, 172, 326–333. [Google Scholar] [CrossRef]
  15. Ha, N.T.H.; Sakakibara, M.; Sano, S.; Nhuan, M.T. Uptake of metals and metalloids by plants growing in a lead-zincmine area, Northern Vietnam. J. Hazard. Mater. 2011, 186, 1384–1391. [Google Scholar] [CrossRef] [PubMed]
  16. Kabata-Pendias, A. Trace Elements in Soils and Plants, 4th ed.; Taylor & Francis Group: Abingdon, UK, 2011. [Google Scholar]
  17. Martínez-sánchez, M.J.; García-lorenzo, M.L.; Pérez-sirvent, C.; Bech, J. Trace element accumulation in plants from an aridic area affected by mining activities. J. Geochem. Explor. 2012, 123, 8–12. [Google Scholar] [CrossRef] [Green Version]
  18. Gu, J. Mining, pollution and site remediation. Int. Biodeterior. Biodegrad. 2018, 128, 1–2. [Google Scholar] [CrossRef]
  19. Betancourt-Buitrago, L.A.; Ossa-Echeverry, O.E.; Rodriguez-Vallejo, J.C.; Barraza, J.M.; Marriaga, N.; Machuca-Martínez, F. Anoxic photocatalytic treatment of synthetic mining wastewater using TiO2 and scavengers for complexed cyanide recovery. Photochem. Photobiol. Sci. 2018, 18, 853–862. [Google Scholar] [CrossRef]
  20. Karmakar, B.H.N.; Das, P.K. Impact of Mining on Ground and Surface Waters; International Mine Water Association: Wendelstein, Germany, 2012. [Google Scholar]
  21. Gyam, E.; Appiah-adjei, E.K.; Amaning, K. Potential heavy metal pollution of soil and water resources from artisanal mining in Kokoteasua, Ghana Groundwater for Sustainable Development Potential heavy metal pollution of soil and water resources from artisanal mining in Kokoteasua, Ghana. Groundw. Sustain. Dev. 2019, 8, 450–456. [Google Scholar] [CrossRef]
  22. Mallo, S.J. The Menace of acid mine drainage: An impending challenge in the mining of Lafia-Obi coal, Nigeria. Continental J. Eng. Sci. 2011, 6, 2141–4068. [Google Scholar]
  23. Oladipo, M.O.; Njinga, R.L.; Elele, U.U.; Salisu, A. Heavy metal contaminations of drinking water sources due to illegal gold mining activities in Zamfara state-Nigeria. J. Chem. Biochem. 2014, 2, 31–44. [Google Scholar]
  24. Obiadi, I.I.; Obiadi, C.M.; Akudinobi, B.E.; Maduewesi, U.V.; Ezim, E.O. Effects of coal mining on the water resources in the communities hosting the Iva valley and Okpara coal mines in Enugu state, Southeast Nigeria. Sustain. Water Resour. Manag. 2016, 2, 207–216. [Google Scholar] [CrossRef]
  25. Swartjes, F.A.; Janssen, P.J.C.M. Assessment of health risks due to arsenic from iron ore lumps in a beach setting. Sci. Total Environ. 2016, 563–564, 405–412. [Google Scholar] [CrossRef]
  26. Vymazal, J. Constructed wetlands for treatment of industrial wastewaters: A review. Ecol. Eng. 2014, 73, 724–751. [Google Scholar] [CrossRef]
  27. Dobrosz-Gómez, I.; Ramos García, B.D.; GilPavas, E.; García Gómez, M.Á. Kinetic study on HCN volatilization in gold leaching tailing ponds. Miner. Eng. 2017, 110, 185–194. [Google Scholar] [CrossRef]
  28. Gupta, N.; Balomajumder, C.; Agarwal, V.K.K. Enzymatic mechanism and biochemistry for cyanide degradation: A review. J. Hazard. Mater. 2010, 176, 1–13. [Google Scholar] [CrossRef] [PubMed]
  29. Luque-Almagro, V.M.; Moreno-Vivián, C.; Roldán, M.D. Biodegradation of cyanide wastes from mining and jewellery industries. Curr. Opin. Biotechnol. 2016, 38, 9–13. [Google Scholar] [CrossRef] [PubMed] [Green Version]
  30. Dai, X.; Simons, A.; Breuer, P. A review of copper cyanide recovery technologies for the cyanidation of copper containing gold ores. Miner. Eng. 2012, 25, 1–13. [Google Scholar] [CrossRef]
  31. Al-Saydeh, S.A.; El-Naas, M.H.; Zaidi, S.J. Copper removal from industrial wastewater: A comprehensive review. J. Ind. Eng. Chem. 2017. [Google Scholar] [CrossRef]
  32. Mahar, A.; Wang, P.; Ali, A.; Awasthi, M.K.; Lahori, A.H.; Wang, Q.; Li, R.; Zhang, Z. The effects of biochar and compost amendments on copper immobilization and soil microorganisms in a temperate vineyard. Ecotoxicol. Environ. Saf. 2016, 126, 111–121. [Google Scholar] [CrossRef]
  33. Alhumaimess, M.S.; Essawy, A.A.; Kamel, M.M.; Alsohaimi, I.H.; Hassan, H.M.A. Biogenic-Mediated Synthesis of Mesoporous Cu2O/CuO Nano-Architectures of Superior Catalytic Reductive towards Nitroaromatics. Nanomaterials 2020, 10, 781. [Google Scholar] [CrossRef] [Green Version]
  34. Essawy, A.A.; Alsohaimi, I.H.; Alhumaimess, M.S.; Hassan, H.M.A.; Kamel, M.M. Green synthesis of spongy Nano-ZnO productive of hydroxyl radicals for unconventional solar-driven photocatalytic remediation of antibiotic enriched wastewater. J. Environ. Manag. 2020, 271, 110961. [Google Scholar] [CrossRef]
  35. Razanamahandry, L.C.; Onwordi, C.T.; Saban, W.; Bashir, A.K.H.; Mekuto, L.; Malenga, E.; Manikandan, E.; Fosso-Kankeu, E.; Maaza, M.; Ntwampe, S.K.O. Performance of various cyanide degrading bacteria on the biodegradation of free cyanide in water. J. Hazard. Mater. 2019, 380, 120900. [Google Scholar] [CrossRef]
  36. Luo, J.; He, W.; Xinli, X.; Wu, J.; Gu, X.W.S. The phytoremediation efficiency of Eucalyptus globulus treated by static magnetic fields before sowing. Chemosphere 2019, 226, 891–897. [Google Scholar] [CrossRef]
  37. Sone, B.T.; Manikandan, E.; Gurib-Fakim, A.; Maaza, M. Sm2O3 nanoparticles green synthesis via Callistemon viminalis’ extract. J. Alloys Compd. 2015, 650, 357–362. [Google Scholar] [CrossRef]
  38. Saleem, S.; Ahmed, B.; Khan, M.S.; Al-Shaeri, M.; Musarrat, J. Inhibition of growth and biofilm formation of clinical bacterial isolates by NiO nanoparticles synthesized from Eucalyptus globulus plants. Microb. Pathog. 2017, 111, 375–387. [Google Scholar] [CrossRef]
  39. Siripireddy, B.; Mandal, B.K. Facile green synthesis of zinc oxide nanoparticles by Eucalyptus globulus and their photocatalytic and antioxidant activity. Adv. Powder Technol. 2017, 28, 785–797. [Google Scholar] [CrossRef]
  40. Bashir, A.K.H.; Furqan, C.M.; Kaviyarasu, K.; Tchokonté, M.B.T.; Maaza, M. Structural, optical and Mössbauer investigation on the biosynthesized α-Fe2O3: Study on different precursors. Phys. E Low-dimensional Syst. Nanostructures 2019, 111, 152–157. [Google Scholar] [CrossRef]
  41. Syvinski, W.; McCarthy, G. ICCD Grant-in-Aid; North Dakota State University: Fargo, ND, USA, 1990. [Google Scholar]
  42. World Health Organization. Heavy metals-environmental aspects. Environ. Health Criteria 1989, 85. [Google Scholar]
  43. Cheng, W.H.; Yap, C.K. Potential human health risks from toxic metals via mangrove snail consumption and their ecological risk assessments in the habitat sediment from Peninsular Malaysia Malacca. Chemosphere 2015, 135, 156–165. [Google Scholar] [CrossRef]
  44. Fipps, G. Irrigation Water Quality Standards and Salinity Management and Salinity Management Water Analysis, Texas A&M; Texas A&M AgriLife Extension Service: College Station, TX, USA, 2013. [Google Scholar]
  45. Nurmi, J.T.; Sarathy, V. Recovery of iron / iron oxide nanoparticles from solution: Comparison of methods and their effects. J. Nanoparticle Res. 2011, 13, 1937–1952. [Google Scholar] [CrossRef]
  46. Shah, G.; Kaur, M.; Singh, P.S.; Rahar, S.; Dhabliya, F.; Arya, Y.; Shri, R. Pharmacognostic parameters of Eucalyptus globulus leaves. Pharmacogn. J. 2012, 4, 38–43. [Google Scholar] [CrossRef] [Green Version]
  47. Gómez, F.; Sánchez, S.; Iradi, M.; Azman, N.; Almajano, M. Avocado seeds: Extraction optimization and possible use as antioxidant in food. Antioxidants 2014, 3, 439–454. [Google Scholar] [CrossRef] [Green Version]
  48. Farhadi, D.; Karimi, A.; Sadeghi, G.; Sheikhahmadi, A.; Habibian, M.; Raei, A.; Sobhani, K. Effects of using eucalyptus (Eucalyptusglobulus L.) leaf powder and its essential oil on growth performance and immune response of broiler chickens. Iran. J. Vet. Res. 2017, 18, 60–62. [Google Scholar]
  49. Tremocoldi, M.A.; Rosalen, P.L.; Franchin, M.; Massarioli, A.P.; Denny, C.; Daiuto, É.R.; Paschoal, J.A.R.; Melo, P.S.; De Alencar, S.M. Exploration of avocado by-products as natural sources of bioactive compounds. PLoS ONE 2018, 13, 1–12. [Google Scholar] [CrossRef] [PubMed] [Green Version]
  50. Hua, M.; Zhang, S.; Pan, B.; Zhang, W.; Lv, L.; Zhang, Q. Heavy metal removal from water/wastewater by nanosized metal oxides: A review. J. Hazard. Mater. 2012, 211–212, 317–331. [Google Scholar] [CrossRef] [PubMed]
  51. Akharame, M.O.; Oputu, O.U.; Pereao, O.; Fagbayigbo, B.O.; Razanamahandry, L.C.; Opeolu, B.O.; Fatoki, O.S. Nanostructured Polymer Composites for Water Remediation. In Nanostructured Materials for Treating Aquatic Pollution; Springer: Cham, Switzerland, 2019; pp. 275–306. [Google Scholar]
  52. Razanamahandry, L.C.; Sackey, J.; Furqan, C.M.; Ntwampe, S.K.O.; Fosso-Kankeu, E.; Manikandan, E.; Maaza, M. Removal of Free Cyanide by a Green Photocatalyst ZnO Nanoparticle Synthesized via Eucalyptus globulus Leaves. In Photocatalysts in Advanced Oxidation Processes for Wastewater Treatment; John Wiley & Sons, Inc.: Hoboken, NJ, USA, 2020; pp. 271–288. [Google Scholar]
  53. Taufiq, A.; Saputro, R.E.; Yuliantika, D.; Sunaryono, S.; Diantoro, M.; Hidayat, A.; Hidayat, N.; Munasir, M. Excellent antimicrobial performance of co-doped magnetite double-layered ferrofluids fabricated from natural sand. J. King Saud Univ. Sci. 2020, 4–10. [Google Scholar] [CrossRef] [PubMed]
  54. Filho, E.; Brito, E.; Da Silva, B.R.; Streck, L.; Bohn, F.; Fonseca, J.L.C. Superparamagnetic polyacrylamide/magnetite composite gels. J. Dispers. Sci. Technol. 2020, 1–9. [Google Scholar] [CrossRef]
Figure 1. Effect of dosage of plant extracts on iron removal in a mining wastewater and the deposits quantity at the end of the precipitation reaction time. (a) Eucalyptus globulus (EG) + mining wastewater (MW) mixture absorbance spectrum; (b) deposits of EG + MW mixture; (c) Callistemon viminalis (CV) + MW mixture absorbance spectrum; (d) deposits of CV + MW mixture; (e) Persea americana (AS) + MW mixture absorbance spectrum; (f) deposits of AS + MW mixture.
Minerals 10 00859 g001aMinerals 10 00859 g001b
Figure 2. Effect of the temperature of the liquid mixture medium on iron removal in mining wastewater. (a) EG + MW mixture absorbance spectrum; (b) deposits of EG + MW mixture; (c) CV + MW mixture absorbance spectrum; (d) deposits of CV + MW mixture; (e) AS + MW mixture absorbance spectrum; (f) deposits of AS + MW mixture.
Minerals 10 00859 g002aMinerals 10 00859 g002b
Figure 3. Effect of contact time of the liquid mixture medium on iron removal in mining wastewater. (a) EG + MW mixture absorbance spectrum; (b) deposits of EG + MW mixture; (c) CV + MW mixture absorbance spectrum; (d) deposits of CV + MW mixture; (e) AS + MW mixture absorbance spectrum; (f) deposits of AS + MW mixture.
Minerals 10 00859 g003aMinerals 10 00859 g003b
Figure 4. Diffraction (XRD) of the deposits powders collected after precipitation. (a) EG + MW, CV + MW and AS + MW dried powders; (b) EG + MW, CV + MW and AS + MW annealed powders.
Minerals 10 00859 g004
Figure 5. Electron microscopy (SEM) images of (a) EG, (c) CV, (e) and AS; elemental composition of the annealed powders (b) EG, (d) CV and (f) AS.
Minerals 10 00859 g005
Table 1. Removal rate and remaining concentration (mg∙mL−1).
Test ParametersMixturesRemoval Rate (%)Residual [Fe] (mg∙mL−1)
Dosage of the plant extractsEG (10:0) + MW801.11
CV (10:0) + MW671.52
AS (10:0) + MW402.64
TemperatureEG + MW (T = 25 °C)850.83
CV + MW (T = 45 °C)701.39
AS + MW (T = 45 °C)412.60
Contact timeEG + MW (t = 3 h)830.94
CV + MW (t = 3 h)651.62
AS + MW (t = 3 h)532.07

