Article

The Reduction Behavior of Ocean Manganese Nodules by Pyrolysis Technology Using Sawdust as the Reductant

1
School of Resources and Safety Engineering, Wuhan Institute of Technology, Wuhan 430073, China
2
Key Laboratory for Green Chemical Process of Ministry of Education, Wuhan Institute of Technology, Wuhan 430073, China
3
School of Environmental Ecology and Biological Engineering, Wuhan Institute of Technology, Wuhan 430205, China
*
Authors to whom correspondence should be addressed.
Minerals 2020, 10(10), 850; https://doi.org/10.3390/min10100850
Submission received: 13 August 2020 / Revised: 17 September 2020 / Accepted: 23 September 2020 / Published: 26 September 2020
(This article belongs to the Section Mineral Processing and Extractive Metallurgy)

Abstract

:
Ocean manganese nodules, which contain abundant Cu, Co, Ni and Mn resources, were reduced using biomass (sawdust) pyrolysis technology. Valuable metals were further extracted by acid leaching after the reduction process with high efficiency. The effects of sawdust dosage, reduction temperature, and time were investigated to obtain optimal operating parameters. The extraction rates of Mn, Cu, Co, and Ni reached as high as 96.1%, 91.7%, 92.5%, and 94.4%, respectively. Results from TGA show that the main pyrolysis process of sawdust occurs at temperature range of 250–375 °C with a mass loss of 59%, releasing a large amount of volatile substances to reduce the ocean manganese nodules. The pyrolysis activation energy of sawdust was calculated to be 52.68 kJ∙mol−1 by the non-isothermal kinetic model. Additionally, the main reduction reaction behind the main sawdust pyrolysis process was identified by the comparison of the assumed and actual TG curve. The thermodynamic analysis showed that the high valence manganese minerals were gradually reduced to Mn2O3, Mn3O4, and MnO by CO generated from sawdust pyrolysis. The shrinking core model showed that the reduction process is controlled by the surface chemical reaction with activation energy of 45.5 kJ∙mol−1. The surface of reduced ore and acid leached residue exhibited a structure composed of relatively finer pores and rougher morphology than the raw ore.

1. Introduction

Due to rapid economic growth and technological advances, the easily explored and high-grade non-ferrous resources on Earth’s surface are being exhausted. For example, the average grade of copper contained in the rocks has decreased from 4% (in the year 1990) to 0.5% [1]. With the remaining low-grade and refractory ore, it is costlier and more technically difficult to extract those valuable metals [2]. More attention has been paid to the exploration and investigation of ocean mineral resources in recent years. Ocean manganese nodules, also called ocean polymetallic nodules, are rock concretions formed of concentric layers of Fe and Mn hydroxides/oxide at depths of approximately 4000–6000 m [3,4], containing large amounts of valuable non-ferrous metal resources, such as Cu, Co, Ni, Mn, and so on [5,6]. Their formation is the result of millions of years of mineral precipitation surrounding objects such as fish teeth, bones, etc. [7]. In addition, ocean manganese nodules are exploited two-dimensionally, reducing the costs in the mining process compared with three-dimensional terrestrial deposits. As a promising alternative resource for the manufacture of advanced technology, deep-sea mining can relieve the shortage of high-grade elements on the Earth’s surface, and the shortage of critical elements [8].
Mn is the main constituent element of manganese nodules, existing in the form of phyllomanganate (δ-MnO2), in which Cu, Co, and Ni are irregularly distributed [9,10]. Those valuable metals are filled in the interstitial sites of manganese oxide mineral lattice in ionic form [11]. Furthermore, the structure of the manganese oxide mineral cannot be destroyed in either acidic or alkaline conditions, leading to a difficult situation for the extraction of valuable metals via traditional separation methods [12]. To release the valuable metals wrapped up in manganese oxide, it is necessary to destroy the manganese mineral lattice by chemical reduction to reclaim the other metals in the nodules [13]. Thus, the high valence manganese oxide can be reduced to acidic, soluble manganese to release valuable metals. Additionally, the extraction rates of Cu, Co, and Ni keep consistent with the reduction degree of Mn [14].
The extraction processes developed so far for ocean manganese modules can be mainly summarized by two categories: hydrometallurgy and pyro-hydrometallurgy processes [7,15,16]. Organic and inorganic reagents, such as HCHO, NH3OHCl, phenols, NO2, SO2, Na2SO3, H2O2, CH3OH, FeS2, coal, sucrose, glucose, lignite, sawdust, and nickel matte, are mainly used as reductants in different media to dissolve the targeted elements in hydrometallurgy process [17,18,19,20]. However, the hydrometallurgy process has the disadvantages of poor selectivity, low leaching efficiency, and high acid consumption [21,22]. As a highly efficient method for metal extraction, the pyro-hydrometallurgy process is carried out under high temperature using coal as reductant, and valuable elements are reduced to metallic states, causing them to alloy with Mn and Fe, leading to tedious subsequent treatments to separate those metals [2]. Moreover, this process demands high energy consumption, and air pollution can be caused by NOx and SOx generated by the use of coal. In recent years, some processes have been developed to reduce the contaminations. A two-stage reduction treatment was proposed for the pyrometallurgical route [16], and reductants from waste such as tailings and steel scrap [23] were reused for the extraction of ocean manganese nodules. It is of great significance to utilize a more environmentally friendly and efficient reductant to replace the nonrenewable coal-based reductant.
As a neutral carbon resource, biomass is a clean energy widely distributed all over the world [24]. Additionally, it can be used as alternative reductant of some oxide minerals, such as hematite and pyrolusite, in the reducing process. Biomass pyrolysis reduction technology is an increasingly popular ore extraction technology [24,25]. The oxide minerals can be reduced at a relatively low temperature rapidly with little pollution [26]. However, rare research had studied the reduction behavior of ocean manganese nodules by biomass pyrolysis technology. In this study, the valuable metals locked in ocean manganese nodules were extracted by reducing high valence manganese to acid-soluble manganese using sawdust as the pyrolysis reductant. The effects of reduction factors on valuable metal extraction were investigated, and the reduction behavior and reduction mechanism were analyzed by thermodynamic analysis and kinetic models. The purpose of the present study is to offer a new approach for the extraction of valuable metals in ocean manganese nodules and provide basic data and theoretical guidance for biomass pyrolysis technology for reduction.

2. Materials and Methods

2.1. Materials and Reagents

The ocean manganese nodules were collected from the China Pioneer Area of the Eastern Pacific Ocean (Clarion Clipperton Zone). The ocean manganese nodules were dried under 105 °C for 8 h to remove the moisture in ocean manganese nodules and then crushed to less than 2 mm for the experiments. The sawdust was obtained from Hubei, China and ground to fine powder with a particle size of less than 1 mm. The chemical elements and industry analysis results are given in Table 1. All reagents used in the experiments were of analytical grade purchased from Sinopharm Chemical Reagent Co., Ltd., Shanghai, China.
The chemical composition and X-ray diffraction (XRD) analysis of the ocean manganese nodules used in this work are presented in Table 2 and Figure 1. The nodules were mainly composed of MnO2 (36.5%), Fe2O3 (17.89%), and SiO2 (21.11%). The contents of CuO, Co3O4, and NiO were 1.32%, 0.27%, and 1.76%, respectively. The XRD analysis of ocean manganese nodules was performed on a Bruker D8 ADVANCE diffractometer (Billerica, MA, US) with Cu λ = 1.5418 Å radiation generated at 40 kV and 40 MA. The XRD result shows that the main minerals of the manganese were vemadite and todorokite, and the main gangue minerals were zussmanite, paravauxite, and quartz. The X-ray diffraction peaks of oceanic manganese nodules are numerous and disorderly, indicating that the crystallization degree was poor. The peaks of valuable metals containing Cu, Co, and Ni cannot be observed, revealing that those valuable metals did not exist as isolated minerals but were ionic in the lattice of manganese minerals.

2.2. Experimental Methods

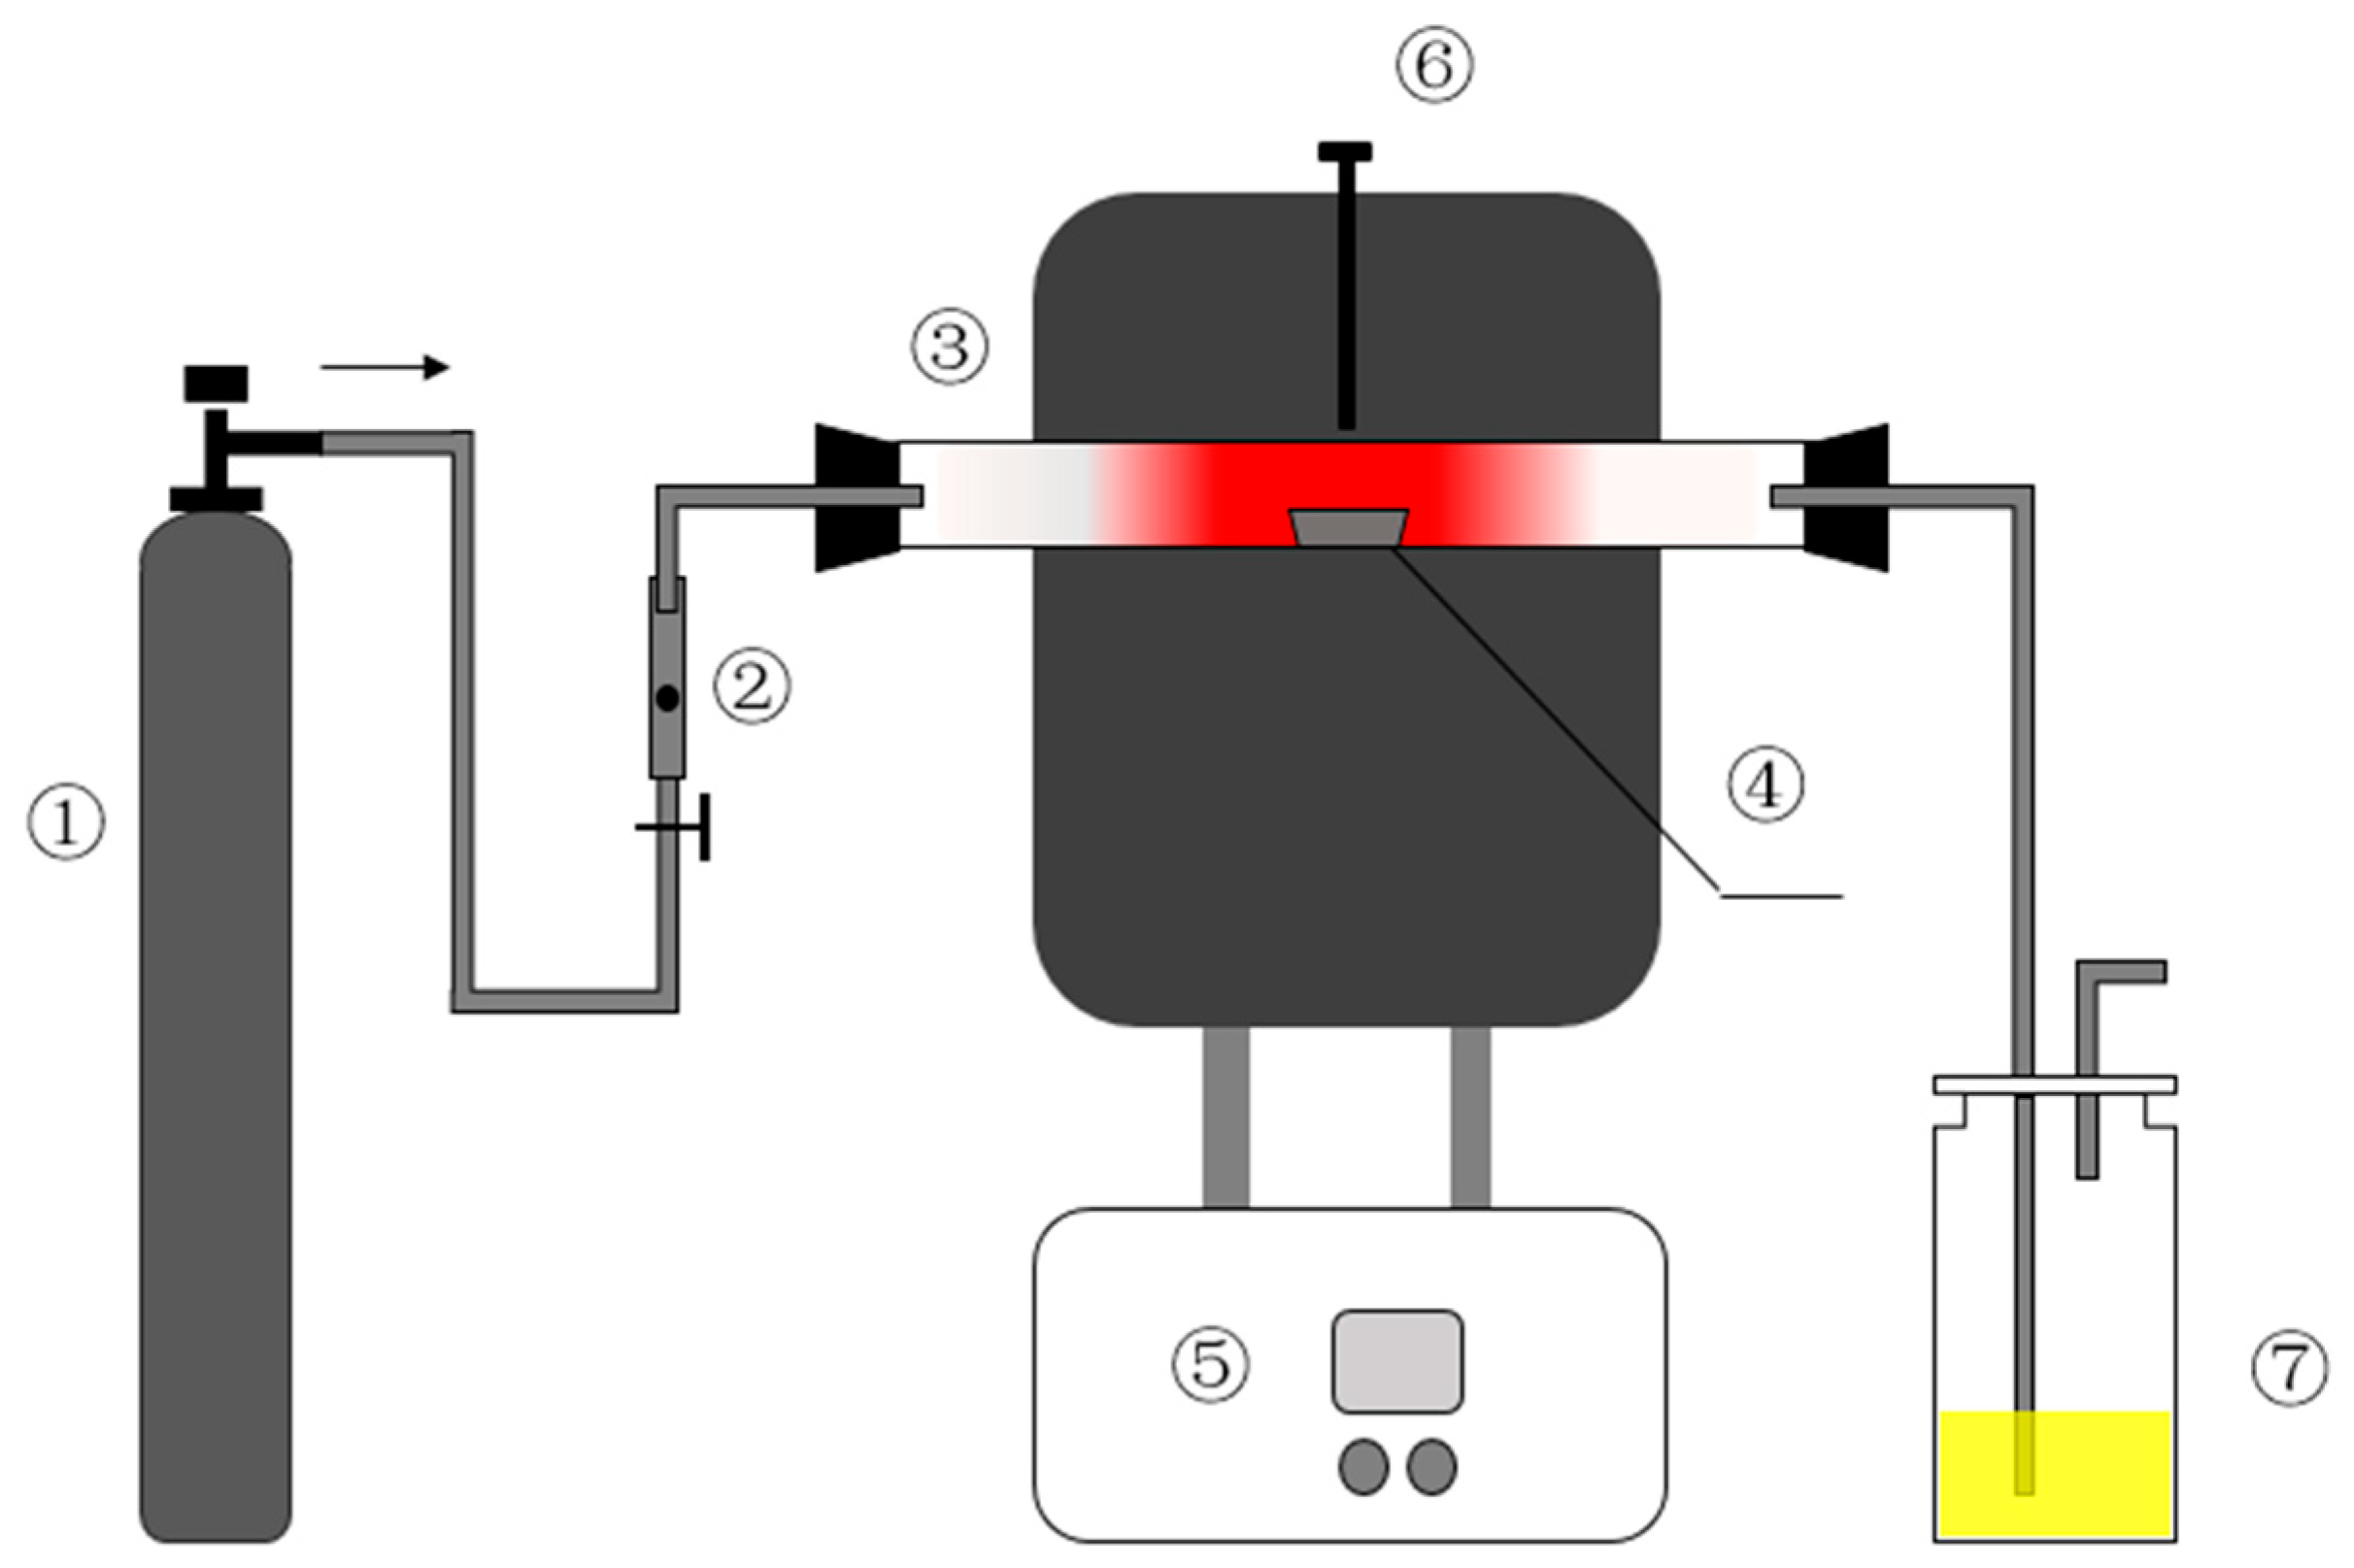
2.2.1. Experimental Apparatus and Procedure

Biomass (sawdust) pyrolysis and the ocean manganese nodules’ reduction process were carried out via self-designed quartz tube furnace. The schematic diagram of pyrolysis reduction device is shown in Figure 2. Biomass and ocean manganese nodules were mixed at a specific ratio in the porcelain boat. Then the mixed samples were put in the middle of the quartz tube. Before the pyrolysis reduction process, the air in the tube was drained by purging with pure nitrogen gas. The ore samples were reduced by biomass pyrolysis technology under nitrogen flow at specific temperatures ranging from 300 to 500 °C. After the reduction process, the samples were cooled to room temperature under the protection of nitrogen. The experiments were repeated in triplicate.

2.2.2. Extraction Efficiencies of Valuable Metals

To extract the Cu, Co, and Ni in the reduced residue, an acid leaching process was conducted in a 100 mL conical flask under the conditions of sulfuric acid, 1.0 mol/L, liquid to solid ratio of 10:1, temperature of 60 °C, and leaching time of 60 min. The reduction-leaching residue was filtered and dried after acid leaching. Additionally, the extraction efficiencies were calculated by analyzing the contents of Cu, Co, Ni, and Mn in reducing-leaching residue using UV (UV-1750, Shimadzu, Kyoto, Japan) spectrophotometric methods involving sodium diethyldithiocarbamate trihydrate, 1-nitroso-2-naphthol, dimethylglyoxime, and periodate potassium, respectively [20].

2.2.3. Pyrolysis and Reduction Process

The sawdust pyrolysis properties and reduction process were performed by thermogravimetric analysis (TGA, TGA-50, Shimadzu, Kyoto, Japan). The ocean manganese nodules and sawdust were uniformly mixed in certain proportions. The samples of 10 to 15 mg were input for TGA analysis. Before initiating the heating program, the system was purged with nitrogen for 10 min to ensure that the oxygen-free environment was established. The mass loss was continuously recorded in situ during a linear temperature increase from 303 to 1073 K with a heating rate at 10 K/min.
The surface morphology and composition analysis of ocean manganese nodules before and after pyrolysis reduction and acid leaching the residue were conducted by scanning electron microscopy (SEM) with energy dispersive spectrometry (EDS) (SEM-EDS, JSM-7001F, Shimadzu, Kyoto, Japan). The main operating parameters were as follows: accelerating voltage of 15 kV; applied current of 5 nA.

3. Results

3.1. Pyrolysis and Reduction Process in the Tube Furnace

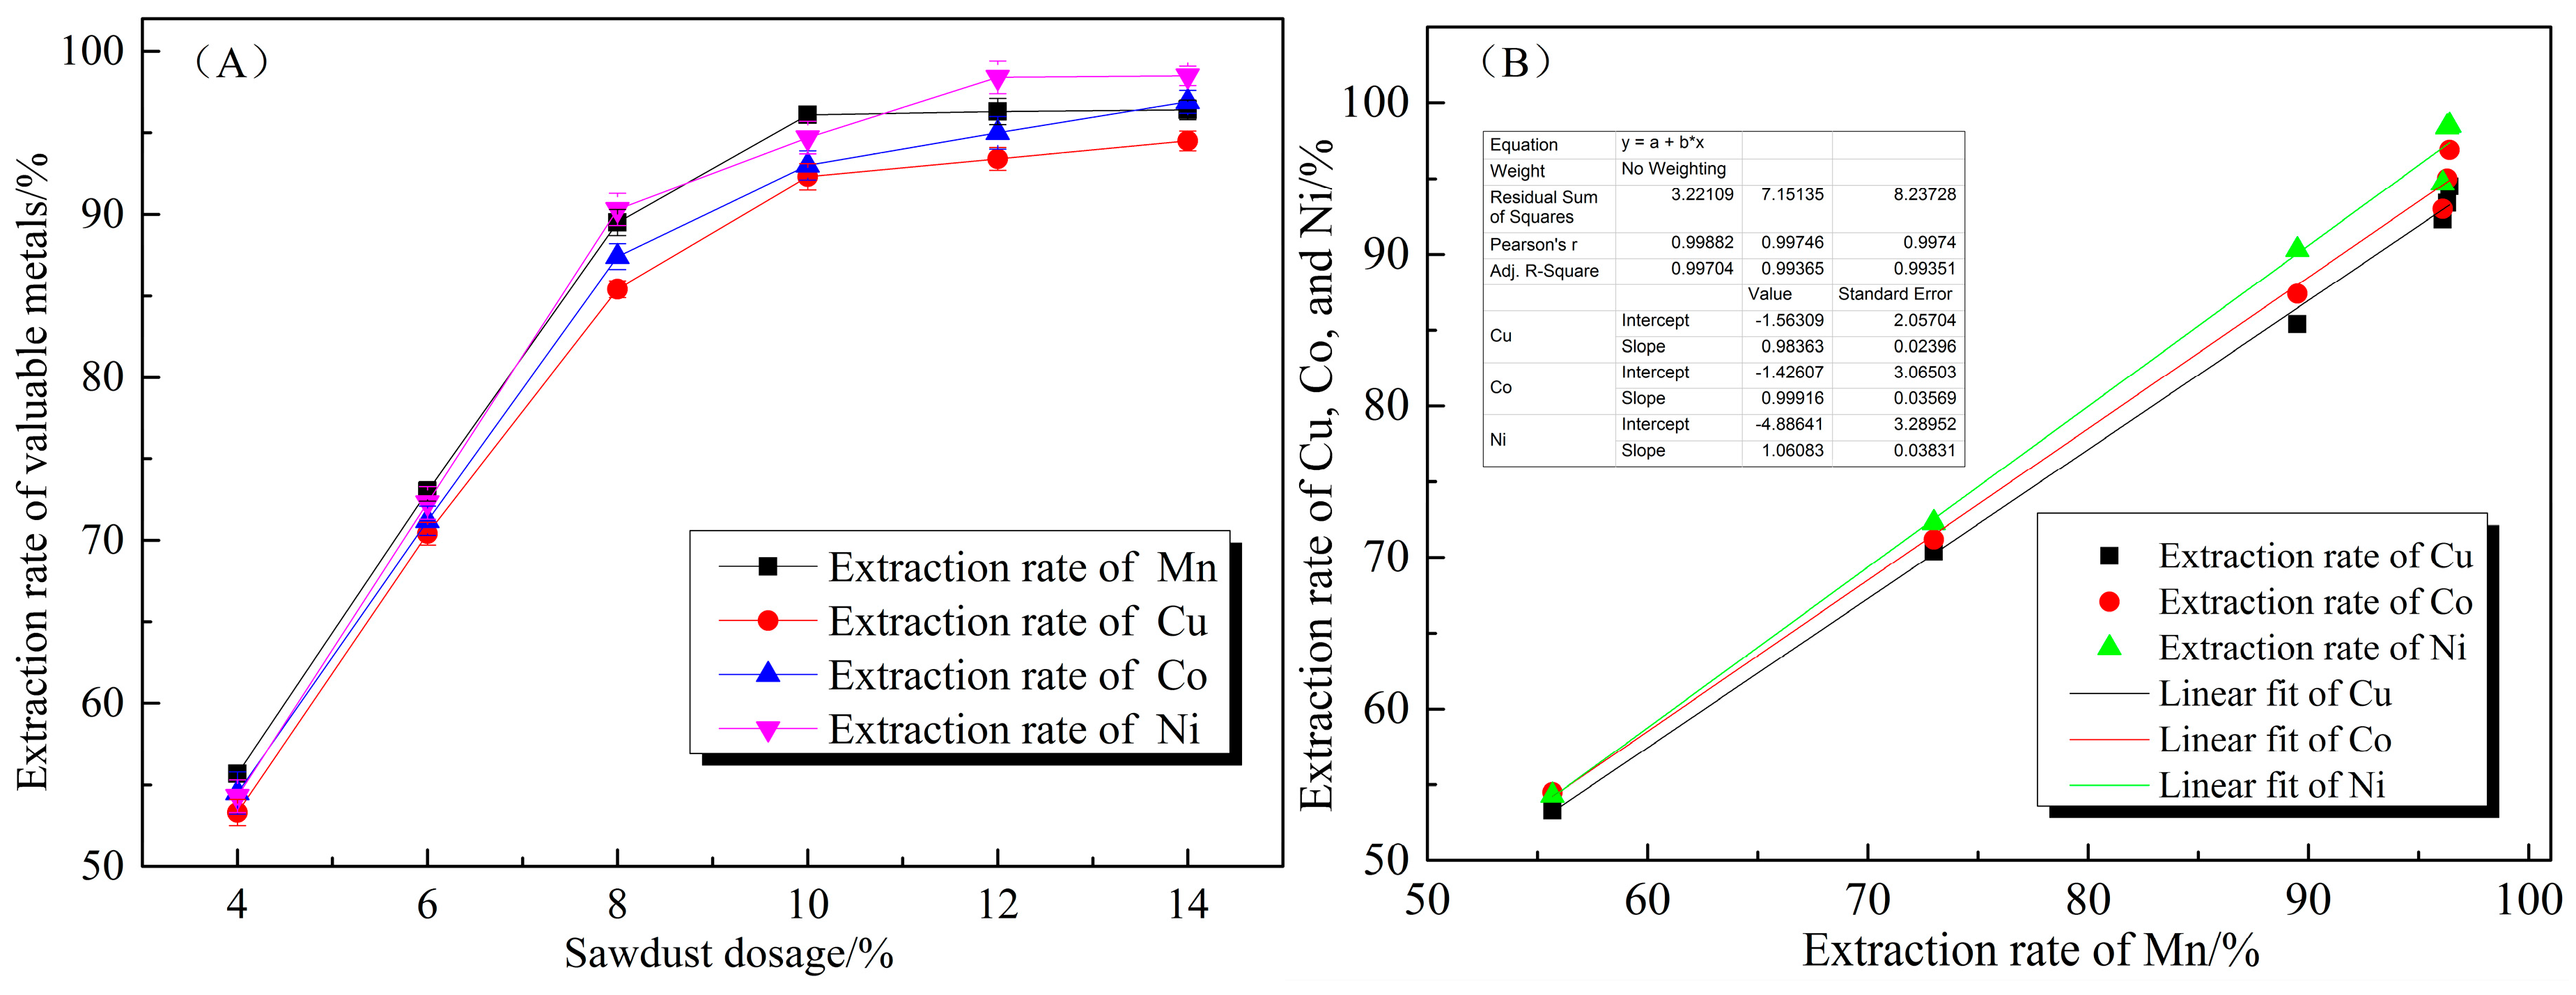
3.1.1. The Effect of Sawdust Dosage on Valuable Metal Extraction

The effects of sawdust dosage on the extraction rates of valuable metals were examined under the conditions of reduction temperature of 500 °C, reduction time of 30 min, and nitrogen flow rate of 500 mL/min. As shown in Figure 3A, the sawdust dosage (wt.%) ranging from 4.0% to 14.0% had a significant influence on the extraction rates of valuable metals. The extraction rates of Mn, Cu, Co, and Ni increased with the increasing sawdust dosage from 4.0% to 10.0% and then remained at relatively high levels. The extraction rates of Mn, Cu, Co, and Ni reached 96.6%, 92.3%, 93.0%, and 94.7%, respectively. The ocean manganese nodules can be reduced by the reductive volatile substances generated in the process of pyrolysis. The concentration of reductive volatile substances increases with rising sawdust dosage, resulting in a more sufficient reaction with oceanic manganese nodules. Furthermore, as shown in Figure 3B, the linear relationships between Mn extraction rate and Cu, Co, and Ni extraction rates can be observed. The fitting coefficient (R2) and the slopes of the fitted curves are all close to 1, revealing that Cu, Co, and Ni closely coexist with Mn. Therefore, the extractions of Cu, Co, and Ni depend on the reduction degree of manganese.

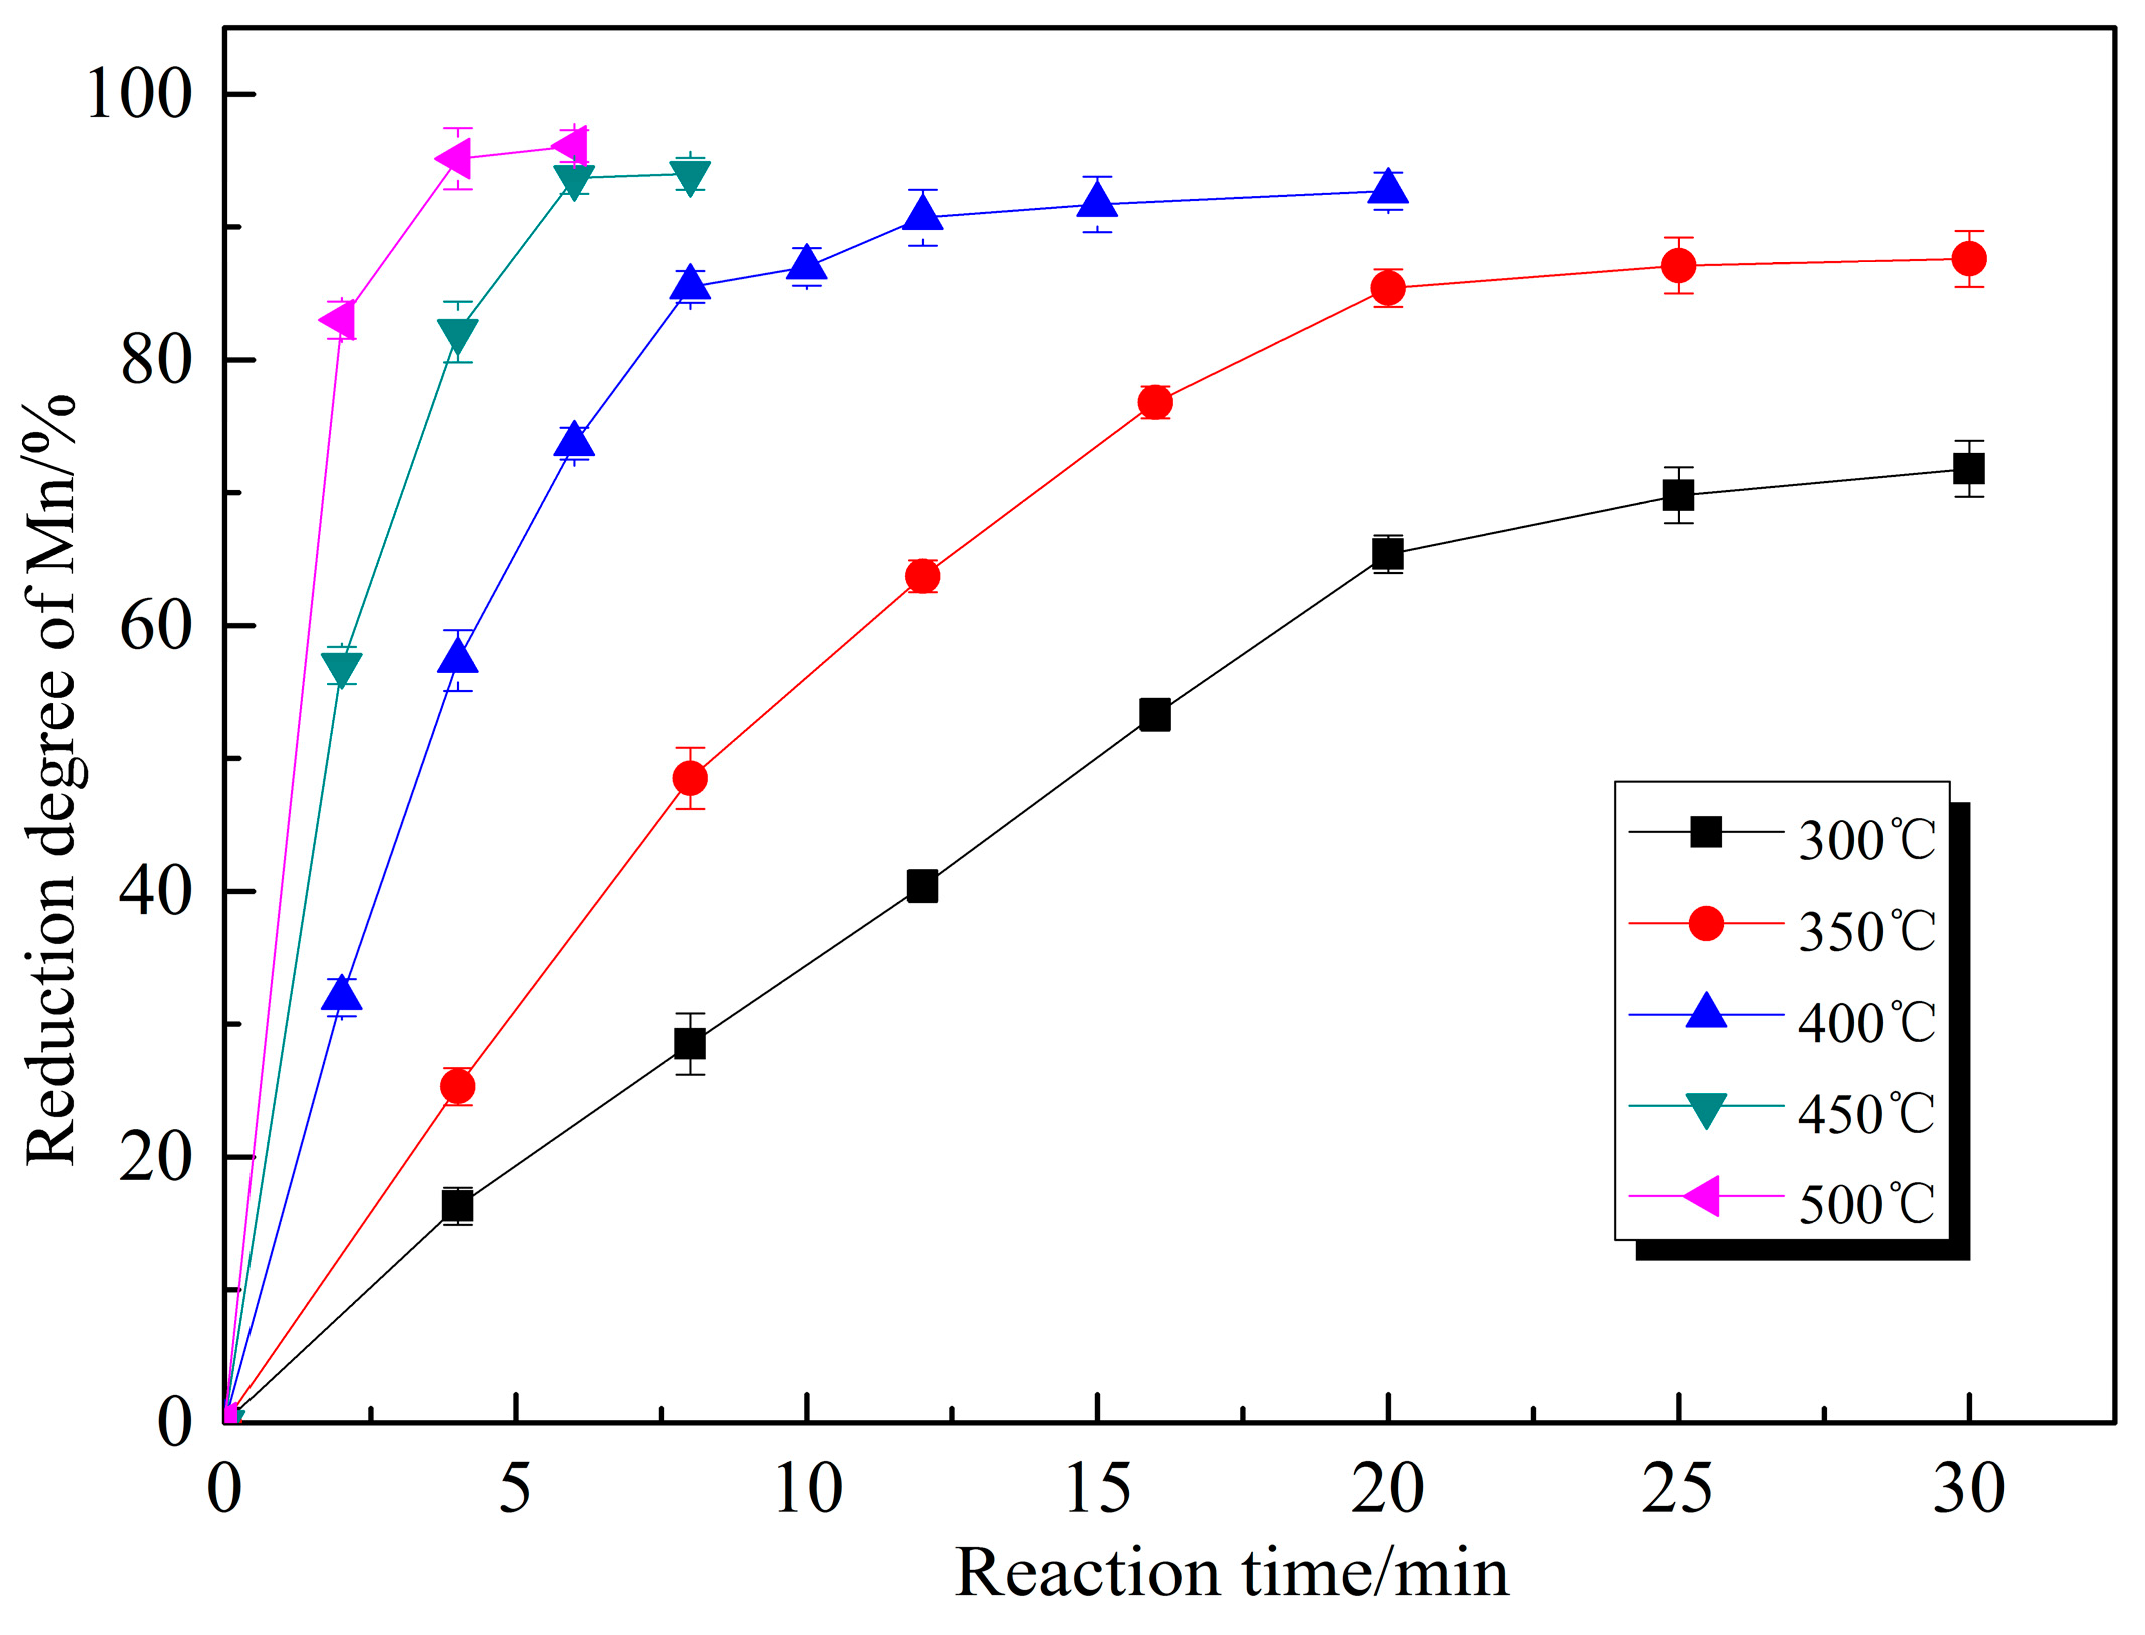
3.1.2. The Effect of Temperature on the Reduction Degree of MnO2

The effect of reaction temperature on the reduction of Mn was investigated at 300, 350, 400, 450, and 500 °C under the conditions of sawdust dosage of 10.0%, nitrogen flow rate of 500 mL/min, and reaction time ranging from 0 to 30 min. According to the results shown in Figure 4, the reaction temperature is a significant factor during the pyrolysis reduction process. The reduction degree of MnO2 increases with the increase of reaction time. It is obvious that the higher temperature is conducive to shortening the time required and increasing the reduction degree of Mn. The reduction degrees of Mn can reach 71.8% (30 min), 87.6% (30 min), 92.7% (20 min), 94.0% (8 min), and 96.1% (6 min) under the temperatures of 300, 350, 400, 450, and 500 °C, respectively. Due to the exponential dependence of the rate constant in the Arrhenius equation, the chemical reaction is accelerated and the reaction rate is also improved with the increase of temperature. The extraction rates of Mn, Cu, Co, and Ni reach 96.1%, 91.7%, 92.5%, and 94.4% after 6 min reduction at 500 °C, respectively.

3.2. Sawdust Pyrolysis Properties

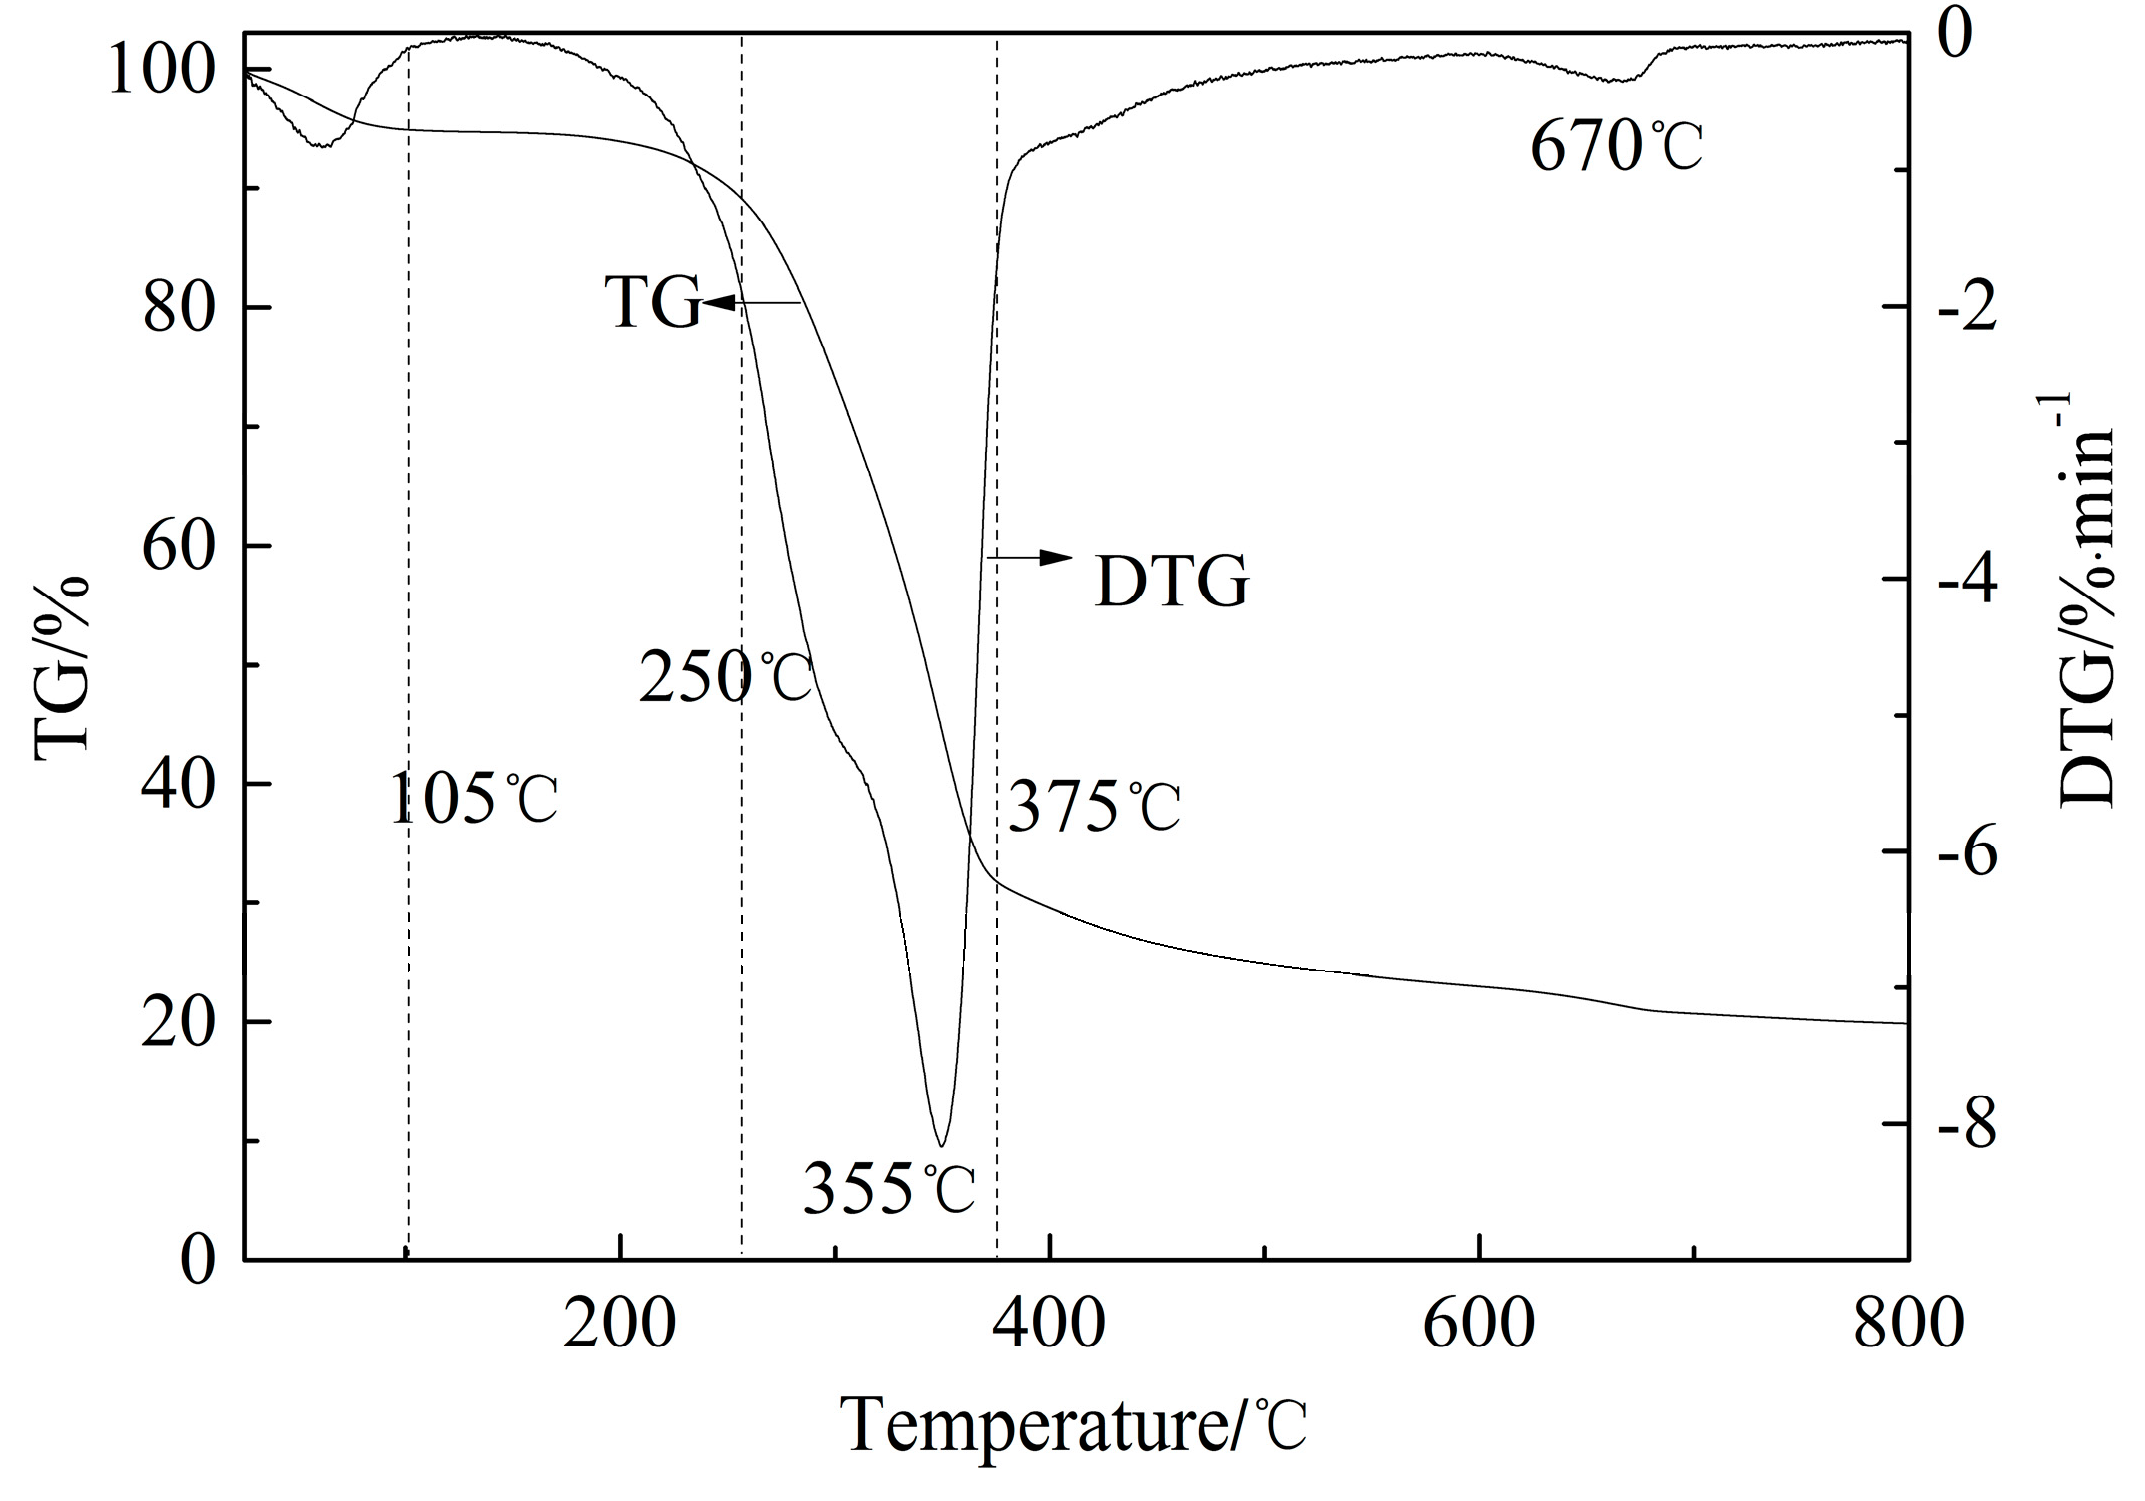
3.2.1. Thermogravimetric Analysis of Sawdust

Biomass can be thermally decomposed to low molecular weight gases, which are considered as the direct reductive agents to reduce high valence manganese minerals; thus, it is important to study the pyrolysis process of biomass. The sawdust’s pyrolysis properties were investigated by thermogravimetric analysis. According to TG and DTG curves presented in Figure 5, the pyrolysis process of sawdust can be divided into four stages: moisture evaporation (25–105 °C), bound water removal (105–250 °C), the main pyrolysis process (250–375 °C), and afterward, slight pyrolysis (375–800 °C).
During the moisture evaporation stage, the surface water is heated and purged by nitrogen with a slight weight loss of 5%. In the bound water removal process, the amorphous part of the high polymer inside sawdust begins to depolymerize for the formation of carbonyl, carboxyl, and peroxide hydroxyl, and a small amount of hydrogen is produced at the same time [27]. The DTG and TG curves both drop slowly during this process. The volatile reductive substances are generated due to the decomposition of hemicellulose and cellulose, and partial decomposition of lignin in the main pyrolysis stage. The TG curve decreases sharply with a mass loss of 59% and a large peak can be observed at 355 °C, indicating that the pyrolysis reaction of sawdust occurs heavily in this temperature range. At temperatures greater than 375 °C, the weight loss decreases slowly which is attributed to the slow degradation of the remaining lignin [28]. The DTG curve peak at 670 °C is ascribed to the further pyrolysis of lignin to form porous biomass char with graphite structure.

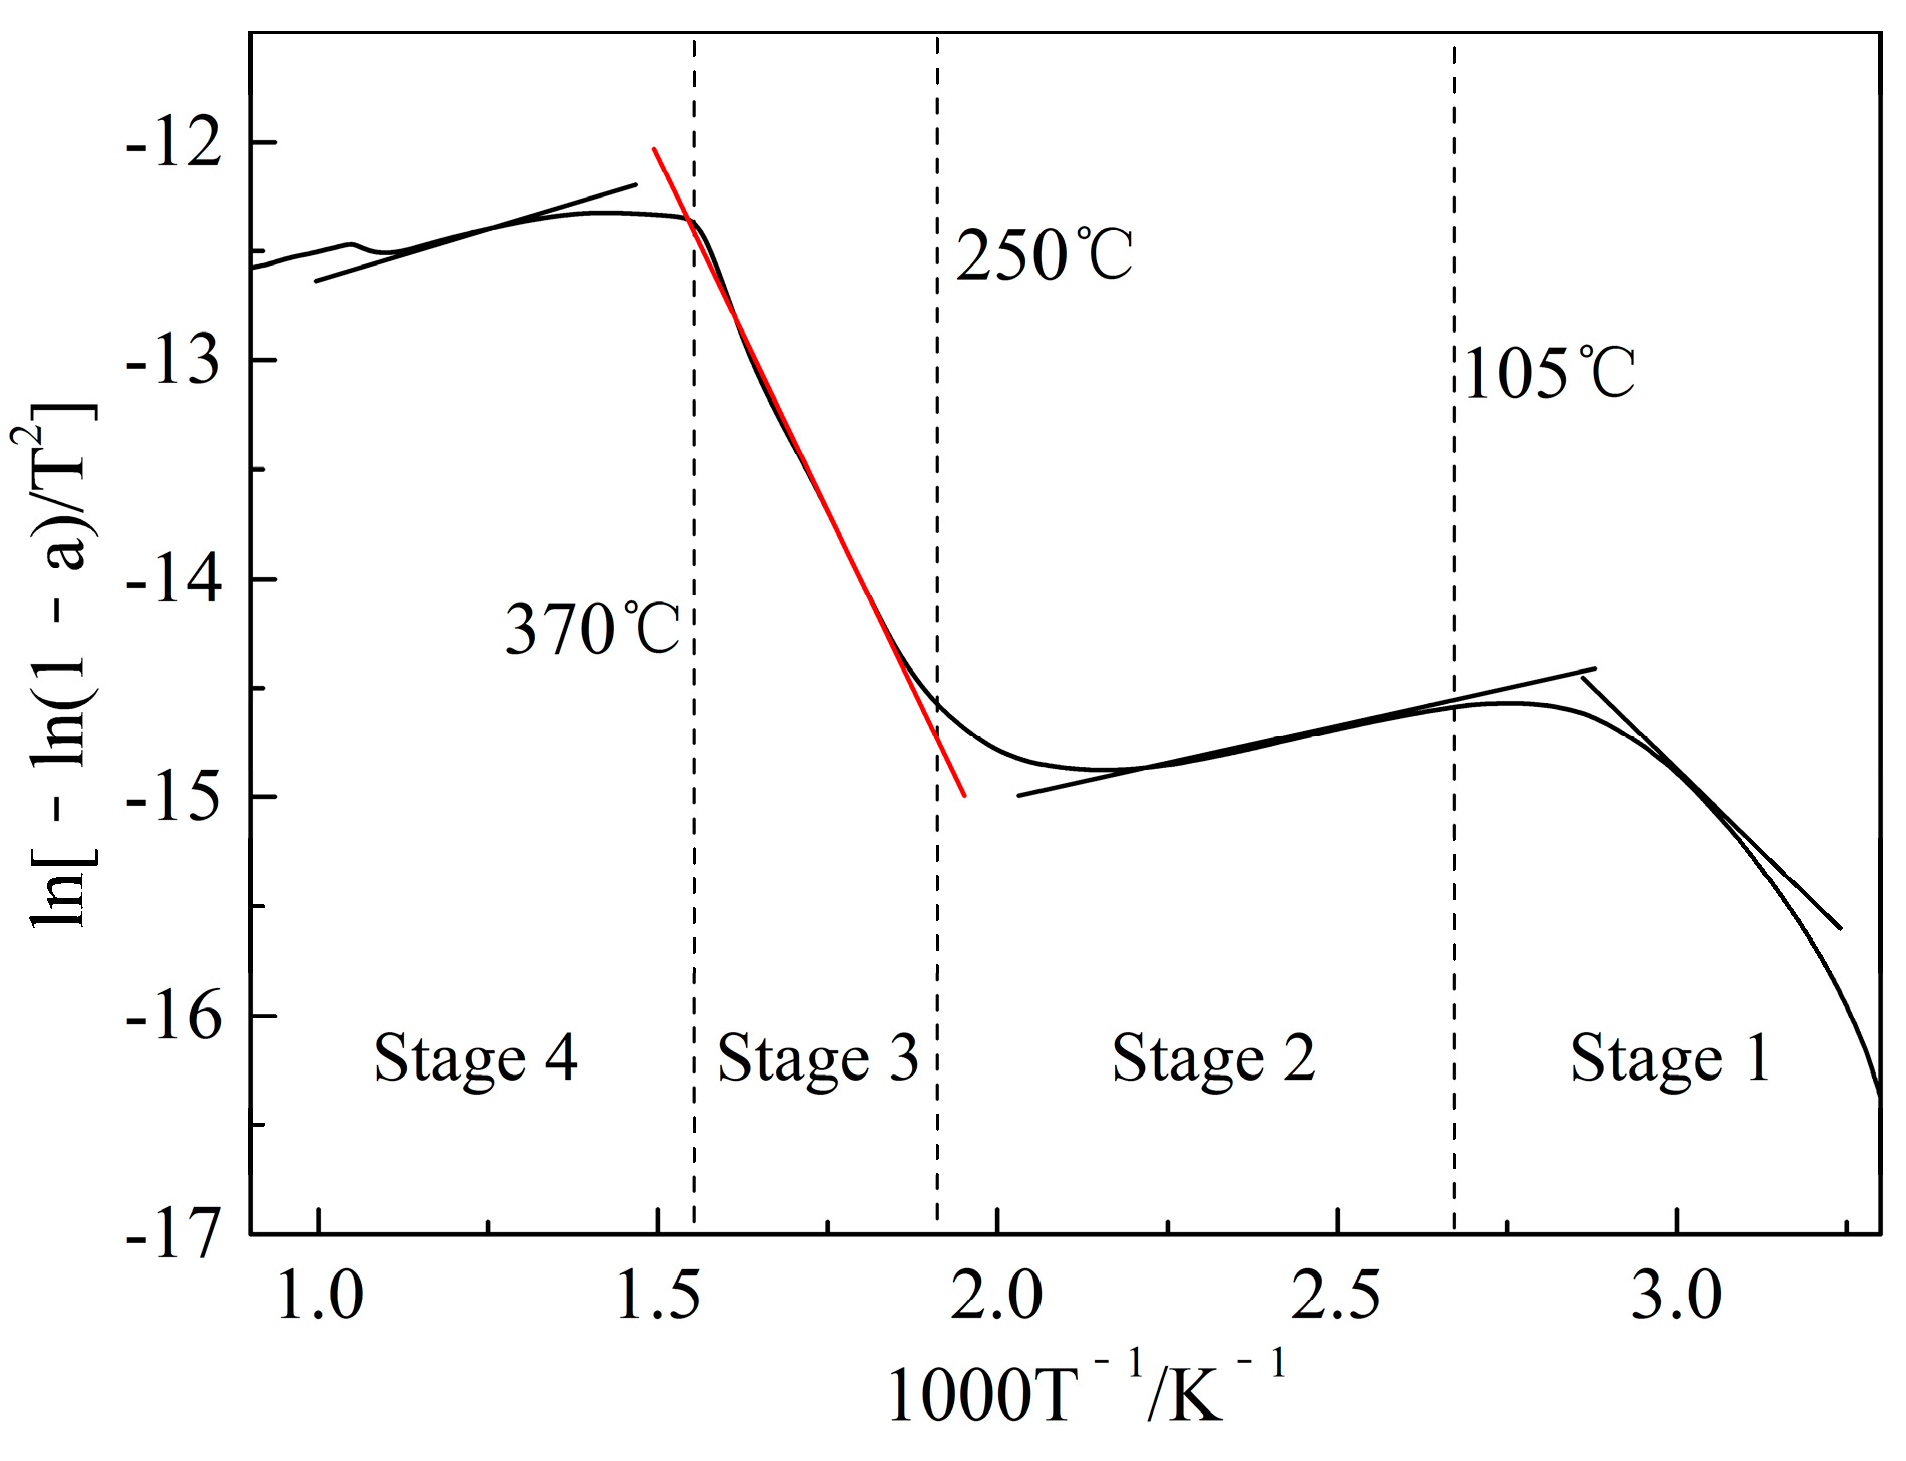
3.2.2. Pyrolysis Kinetic Model of Sawdust

The main products generated in the process of pyrolysis were sawdust char, tar, and pyrolysis gas [29]. With regard to kinetic analysis, the pyrolysis relative mass loss rate can be calculated from the TG data based on the following equation [28]:
α = m 0 m t m 0 m
where α is the relative mass loss rate at time t; m0, mt, and m refer to the initial, actual, and final masses of the sawdust, respectively.
It is assumed that the volatile substances produced by pyrolysis do not undergo a secondary reaction. An independent parallel first-order reaction kinetic model was used for kinetic analysis of sawdust pyrolysis process. The kinetic equation can be presented as follows:
d α d t = A exp ( E R T ) ( 1 α )
where A is pre-exponential or frequency factor (min−1), E is the activation energy (J∙mol−1), R is the gas constant (8.314 J/(mol·K)), and T is the temperature (K).
With relation to the kinetic processes of a heterogeneous system in non-isothermal condition, a simplified expression for a first-order reaction developed by Coats and Redfern is often adopted [30]. The following equation can be used.
ln [ ln ( 1 α ) T 2 ] = E R T + ln [ A R β E ( 1 2 R T E ) ]
where β is the heating rate, 10 K/min.
The value of temperature is far less than that of activation energy in most regular reactions, so the equation can be simplified as follows:
ln [ ln ( 1 α ) T 2 ] = E R T + ln ( A R β E )
Figure 6 shows the plot of ln[−ln(1−α)/T2] versus 1000/T. The slopes (−E/R) and intercepts (lnAR/βE) of different pyrolysis stages were obtained by plotting the tangent lines. The moisture evaporation stage and main pyrolysis process are endothermic reactions with the activation energy of 24.53 and 52.68 kJ∙mol−1, respectively. The processes of bound water removal and subsequent slight pyrolysis are exothermic reactions. In the main pyrolysis process, the kinetic model can be established as: α = 1 E x p [ T 2 E x p ( 6480 / T 2.36 ) ] at a heating rate of 10 K/min.

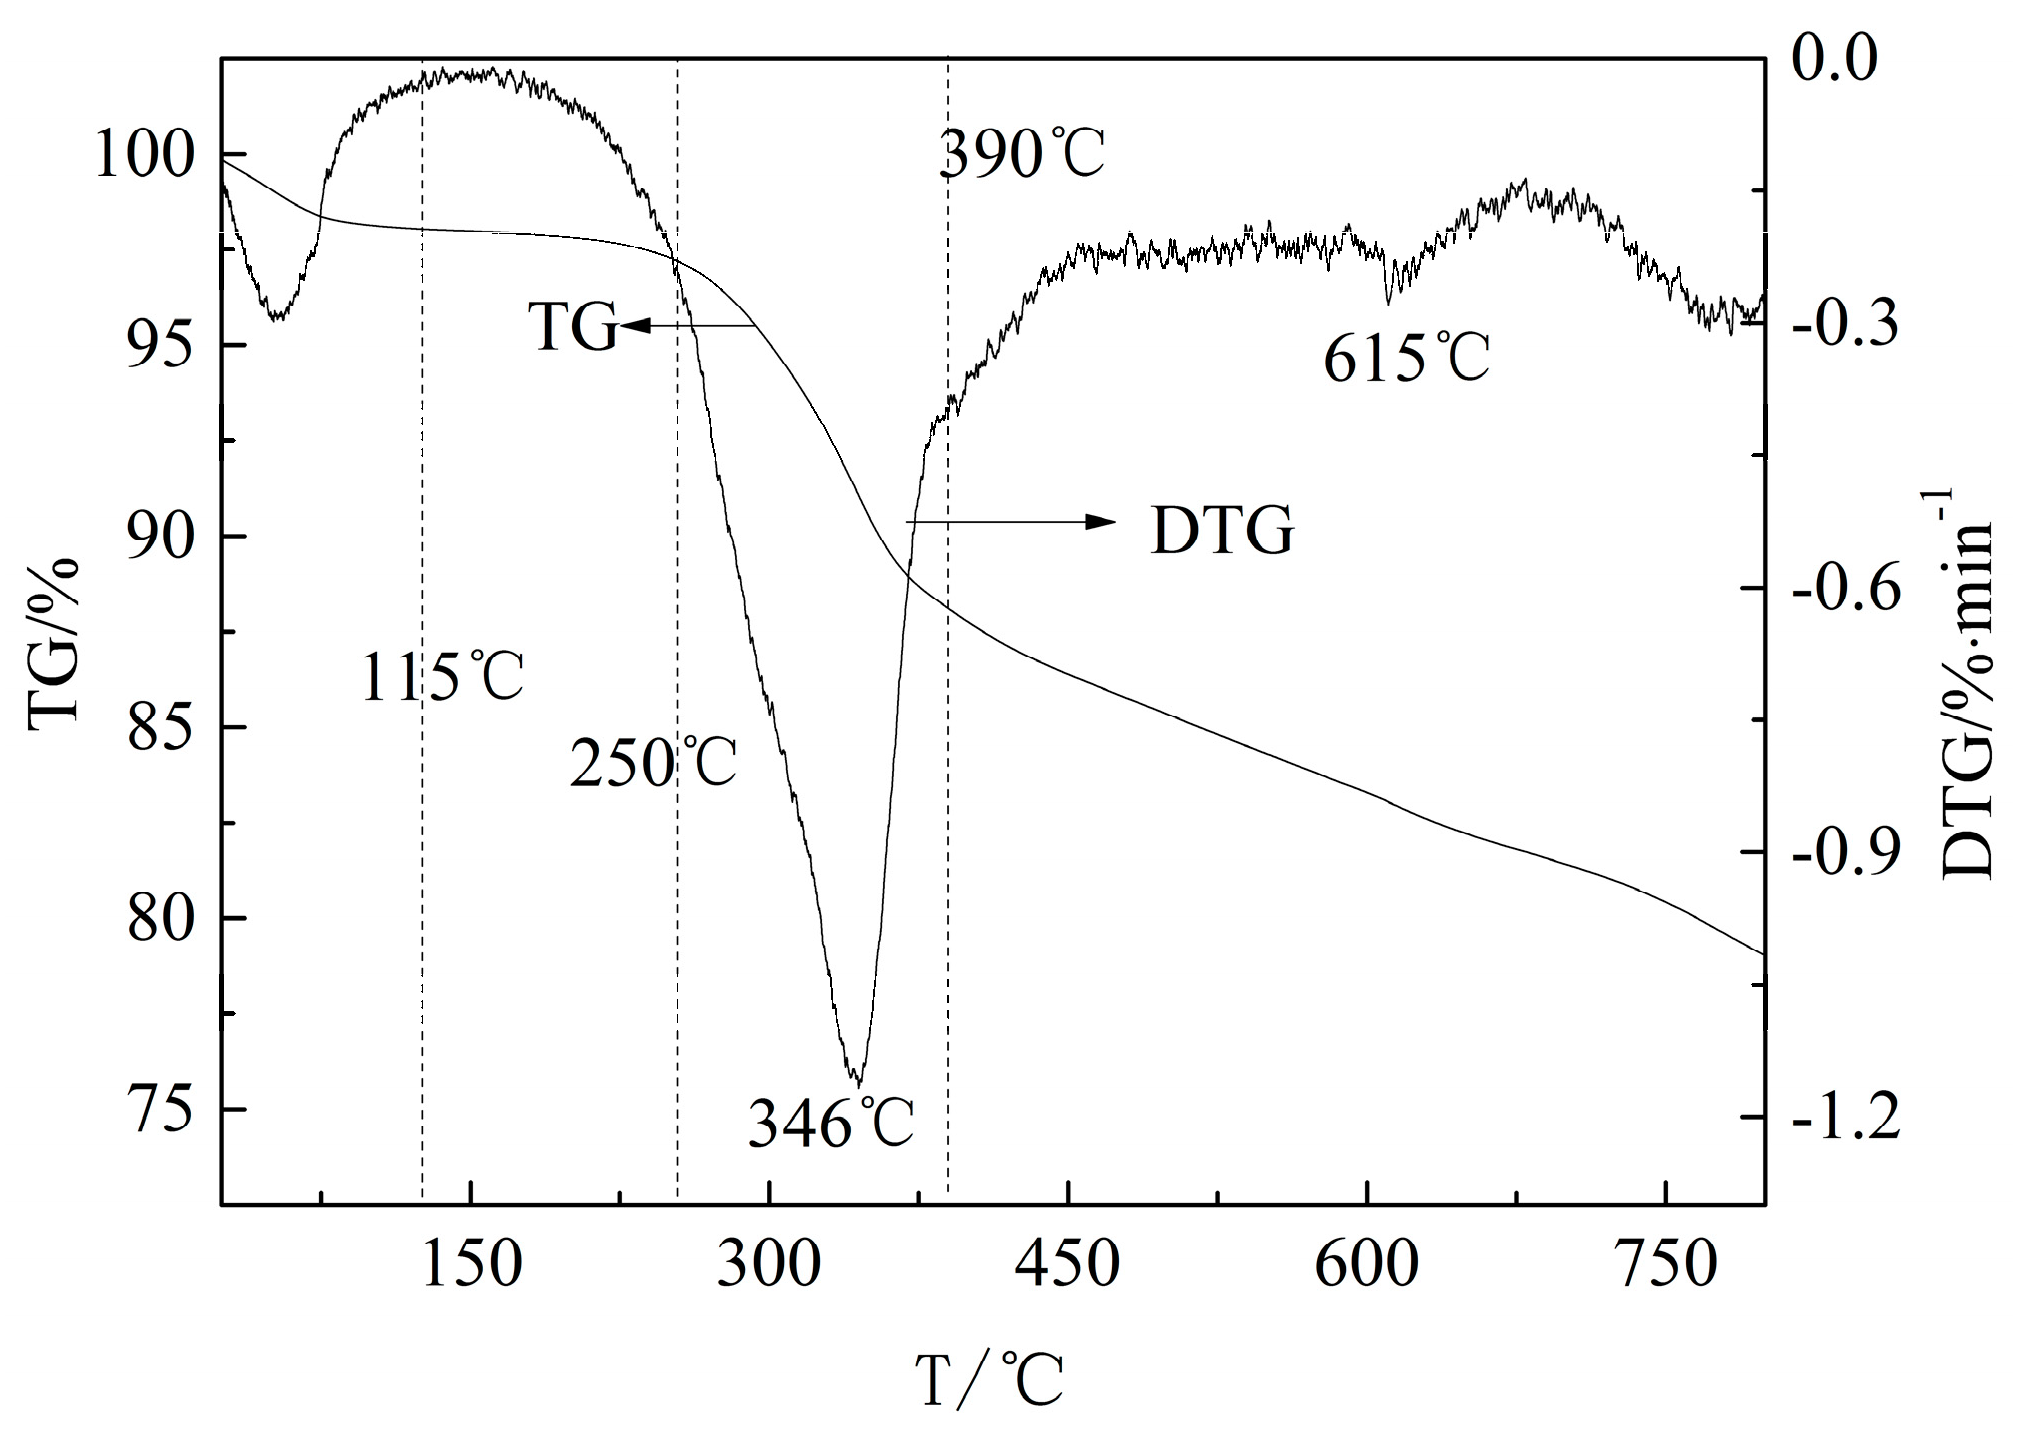
3.3. The Analysis of the Reduction Process Using Sawdust Pyrolysis

The reduction process of ocean manganese nodules was performed by thermogravimetric analysis. The TG and TDG curves of the reduction process were gathered at the mass ratio of ocean manganese nodules:sawdust = 5:1. As shown in Figure 7, the curves of TG and DTG for the reduction process are roughly similar to that of sawdust pyrolysis (Figure 5). The slow decline of TG curve is due to the moisture evaporation and bound water removal process of sawdust. Additionally, no chemical reactions between sawdust and ocean manganese nodules occur when the temperature is below 250 °C. According to results of Figure 4 and Figure 5, the TG curve in Figure 7 decreases significantly during the temperature range of 250–390 °C, which is ascribed to the combined effects of sawdust pyrolysis and reduction of ocean manganese nodules. The DTG peak (346 °C) of the reduction process appears 9 °C lower than that of sawdust pyrolysis process (355 °C), indicating that the oxygen deprivation of ocean manganese nodules promotes the mass loss of the system. The TG curve continues decreasing steadily as the temperature increases from 390 to 800 °C. The ocean manganese nodules can be further reduced by the reductive volatile gas generated by sawdust pyrolysis. Thus, the main reduction process of ocean manganese nodules may occur during the temperature range of 390–800 °C.
To further investigate the pyrolysis and reduction process, a comparison of the assumed TG curve without reduction and the actual TG curve was conducted. The assumed TG curve without reduction was obtained on the assumption that the sawdust pyrolysis was an independent process without any physical and chemical interactions with the other process. The assumed TG curve can be calculated using the following equation.
TGassumed=1/6TGsawdust + 5/6 × 100
As shown in Figure 8, the assumed TG curve does not match with the actual TG curve in the non-reaction temperature range (25–250 °C). In the actual measurement, sawdust and ocean manganese nodules are mixed and heated more uniformly than sawdust pyrolysis alone. The surface water and bound water of sawdust escape more easily, leading to a lower TG curve than the assumed TG curve. A large amount of volatile tar is generated by sawdust pyrolysis in the temperature range of 250–390 °C. Additionally, the adsorption of tar on the surfaces of ocean manganese nodules results in less mass loss than in the assumed TG curve. Thus, the actual TG curve is higher than the assumed TG curve. With the increase of temperature, the reduction process occurs with the oxygen deprivation of ocean manganese nodules. The actual TG curve keeps decreasing at the temperature range of 390–800 °C. Therefore, the actual measured TG value is lower than the assumed TG value in the reduction process.

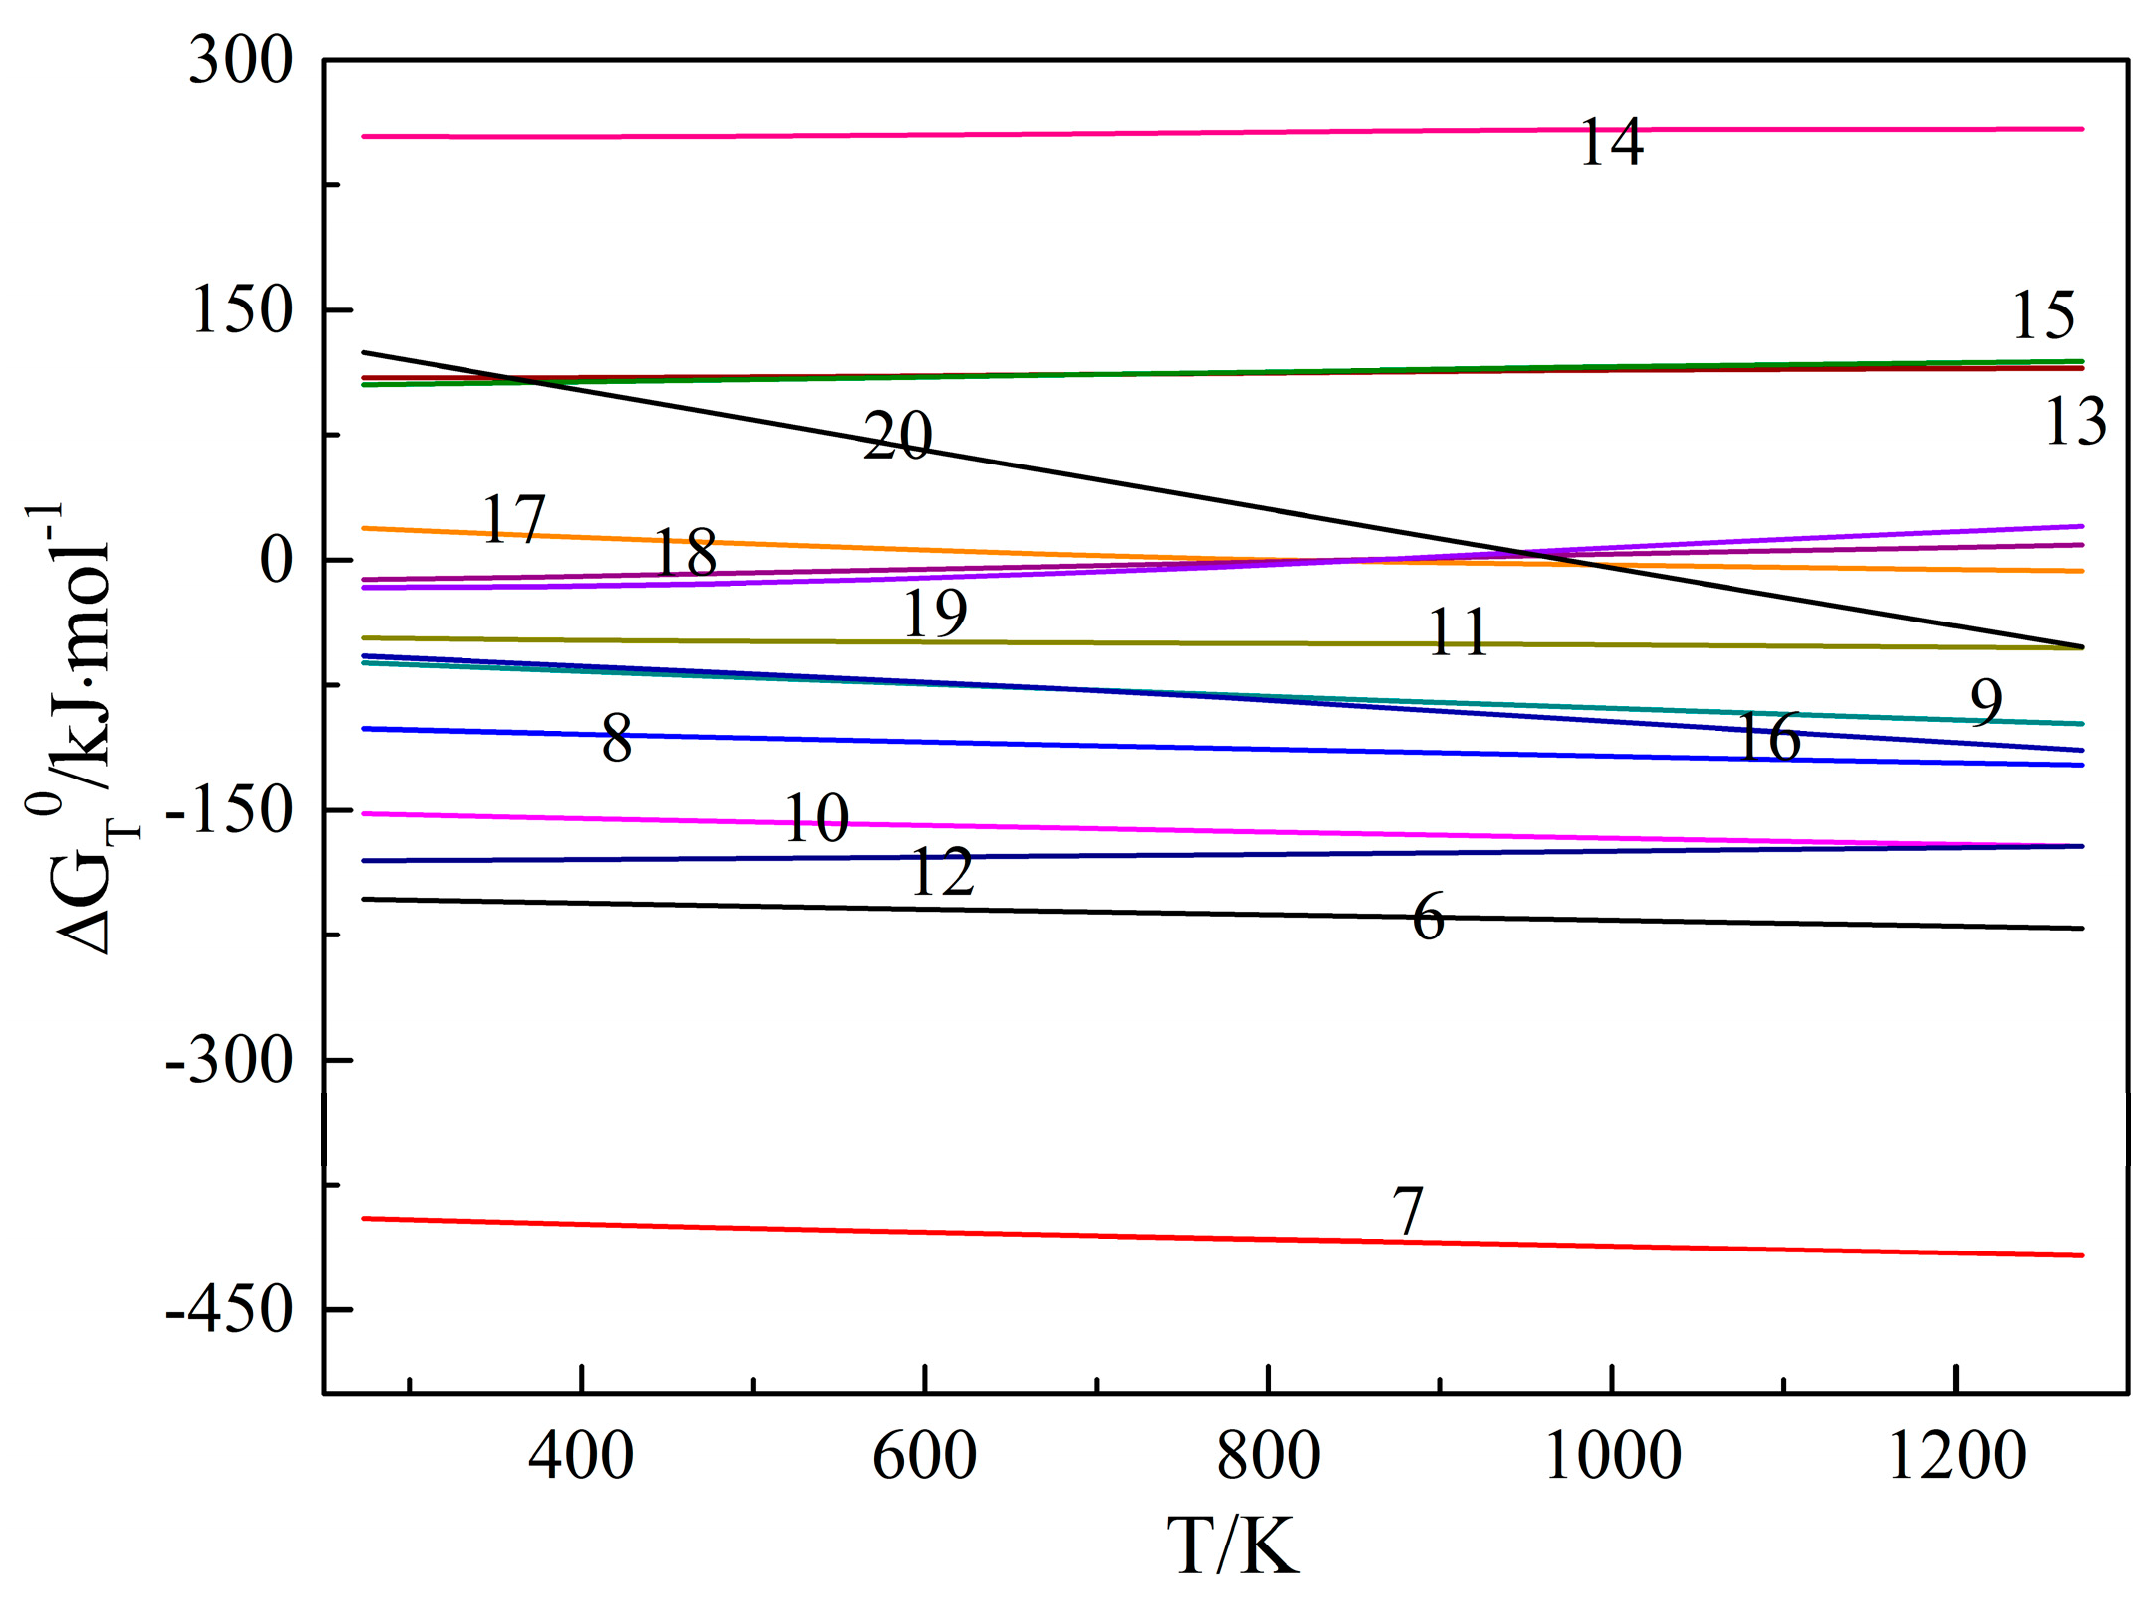
3.4. Thermodynamic Analysis

The composition of volatile gas listed in Table 3 was measured by gas chromatography. The gases generated by the pyrolysis of sawdust are mainly composed of CO2, CO, H2, CH4, C2H4, and C2H6. Additionally, the reductive gases are mainly composed of CO with a content of 28.82%, which is generated by the fracturing of carbonyl and ether bonds in the sawdust structure [31].
The main oxides of Mn and Fe can be reduced in the presence of CO at a certain temperature. Additionally, the possible reaction equations (Equations (6)–(20)) are as follows. The standard Gibbs free energy changes of Equations (6)–(20) were calculated using HSC 6.0 software.
2MnO2 + CO → Mn2O3 + CO2
△GT0 = [−0.0173T − 198.92] J·mol−1, Spontaneous
3MnO2 + 2CO → Mn3O4 + 2CO2
△GT0 = [−0.0217T − 390.06] J·mol−1, Spontaneous
Mn2O3 + CO → 2MnO + CO2
△GT0 = [−0.0217T − 95.828] J·mol−1, Spontaneous
Mn3O4 + CO → 3MnO + CO2
△GT0 = [−0.0368T − 52.07] J·mol−1, Spontaneous
MnO2 + CO → MnO + CO2
△GT0 = [−0.0195T − 147.38] J·mol−1, Spontaneous
MnO2 + 2CO → Mn + 2CO2
△GT0 = [−0.0054T − 45.898] J·mol−1, Spontaneous
3Mn2O3 + CO → 2Mn3O4 + CO2
△GT0 = [0.0086T − 183.34] J·mol−1, Spontaneous
Mn2O3 + 3CO → 2Mn + 3CO2
△GT0 = [0.0069T + 106.75] J·mol−1, Nonreactive
Mn3O4 + 4CO → 3Mn + 4CO2
△GT0 = [0.0059T + 251.96] J·mol-1, Nonreactive
MnO + CO → Mn + CO2
△GT0 = [0.0141T + 101.45] J·mol−1, Nonreactive
3Fe2O3 + CO → 2Fe3O4 + CO2
△GT0 = [−0.0582T − 38.871] J·mol−1, Spontaneous
Fe3O4 + CO → 3FeO + CO2
△GT0 = [−0.0231T + 20.643] J·mol−1, Tr > 620 °C
FeO + CO → Fe + CO
△GT0 = [0.0218T − 18.535] J·mol−1, Tr < 577 °C
Fe3O4 + 4CO → 3Fe + 4CO2
△GT0 = [0.0424T − 34.962] J·mol−1, Tr < 552 °C
C + CO2 → 2CO
△GT0 = [−0.1768T + 172.3] J·mol−1, Tr > 702 °C
where △GT0 is the standard Gibbs free energy change; Tr is the reduction temperature range.
The relationships between temperature and standard Gibbs energy change were plotted in Figure 9. The negative values of Equations (6)–(12) and (16) in the whole temperature range indicate that those reactions are spontaneous, and Mn2O3, Mn3O4, and MnO are the main reduction products with sawdust pyrolysis technology. The standard Gibbs free energy changes of Equations (13)–(15) are positive, revealing that the high valence manganese oxide cannot be directly reduced to metallic manganese by CO. According to the Tr values of Equations (16)–(19), Fe2O3 can be easily reduced to Fe3O4 that cannot be further reduced to FeO at the temperature of 500 °C. Although the standard Gibbs energy changes of Equations (18) and (19) are negative at 500 °C, the reaction constants are too small to drive the reactions, indicating that the oxide of Fe cannot be reduced to metallic Fe [32,33]. The gasification of carbon occurs at temperatures higher than 702 °C (Equation (20)), demonstrating that the ocean manganese nodules are mainly reduced by CO generated by sawdust’s pyrolysis process.

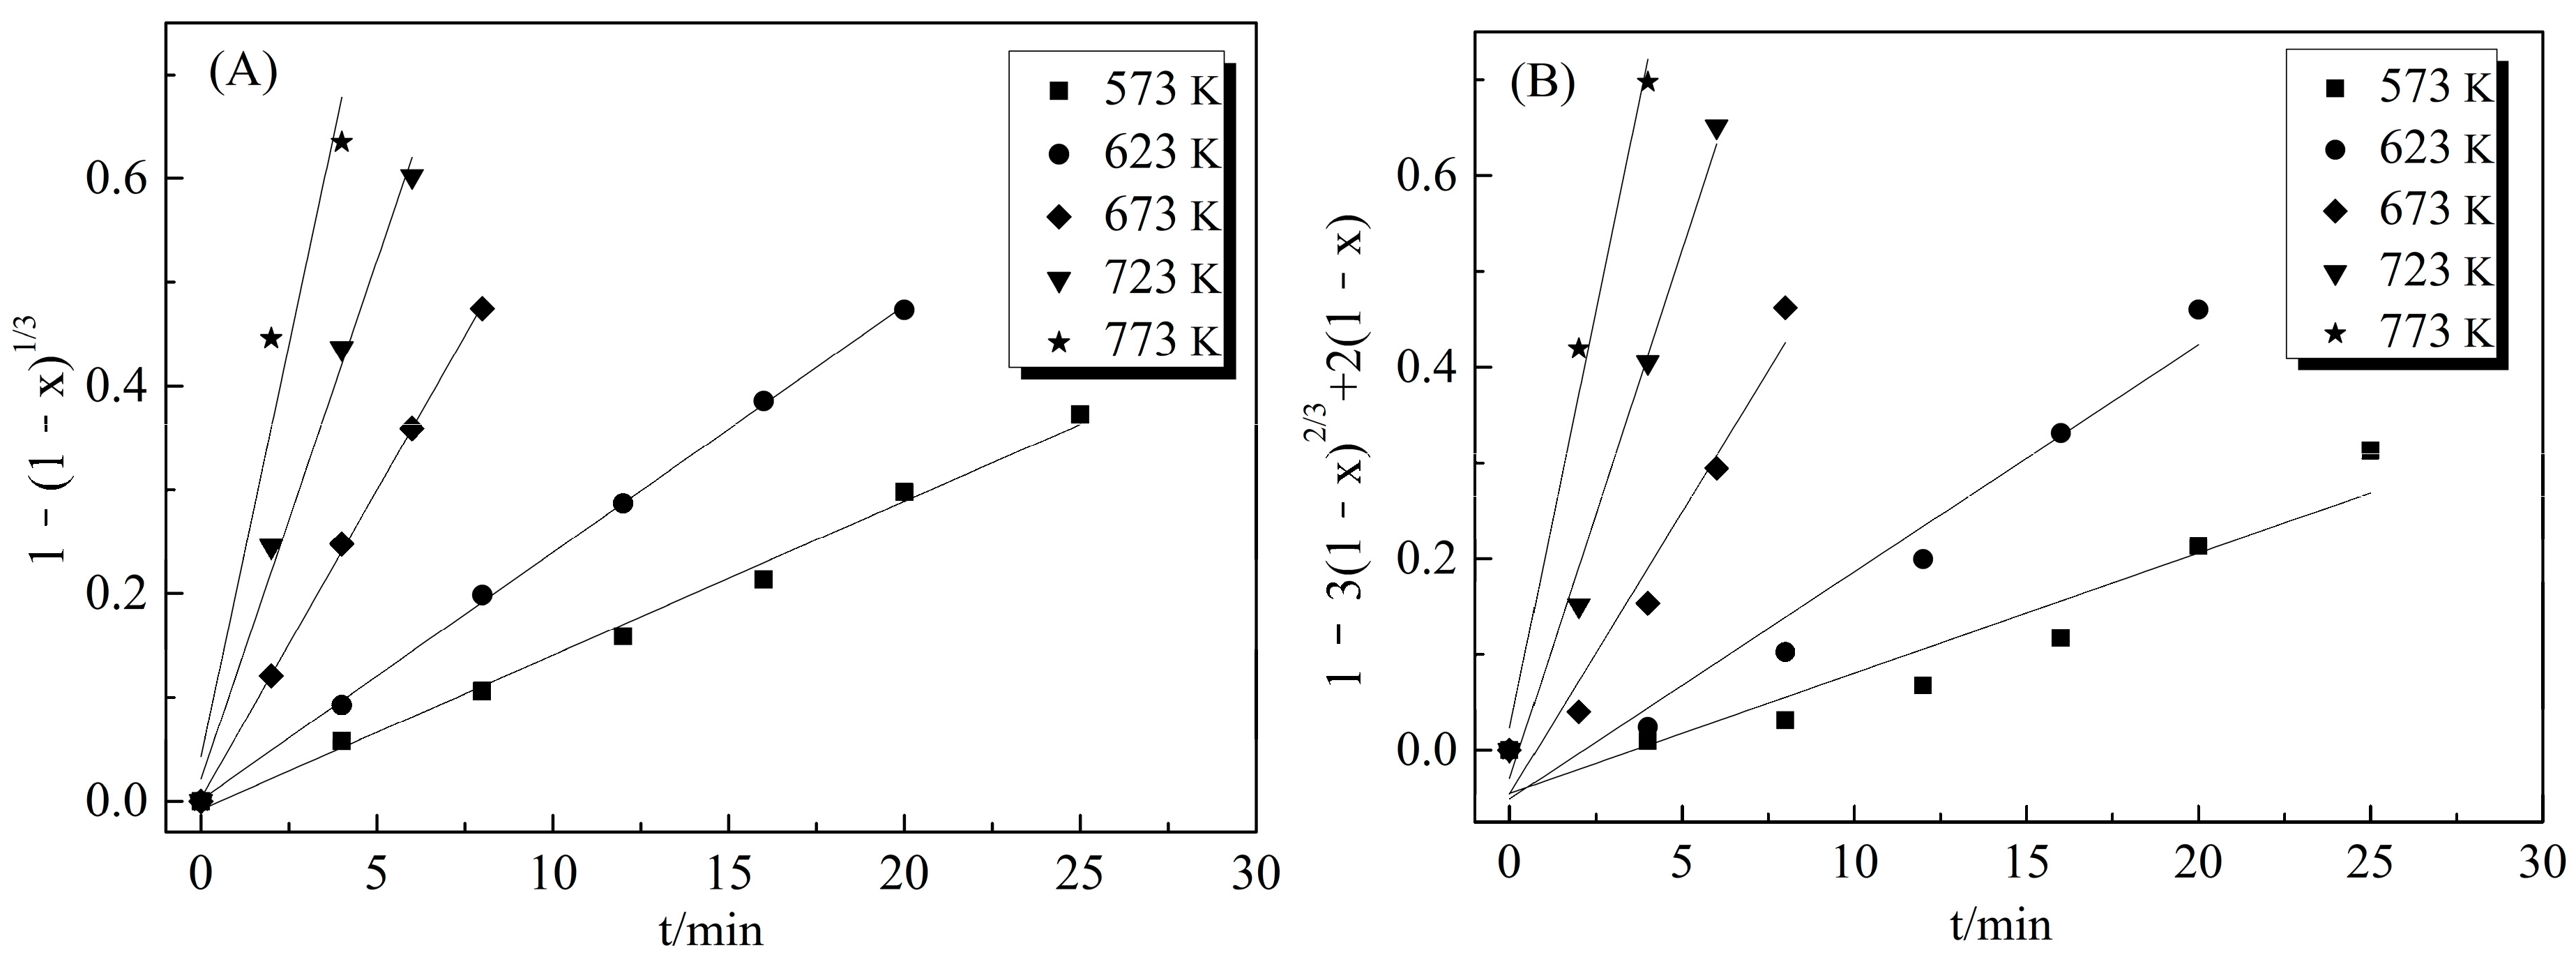
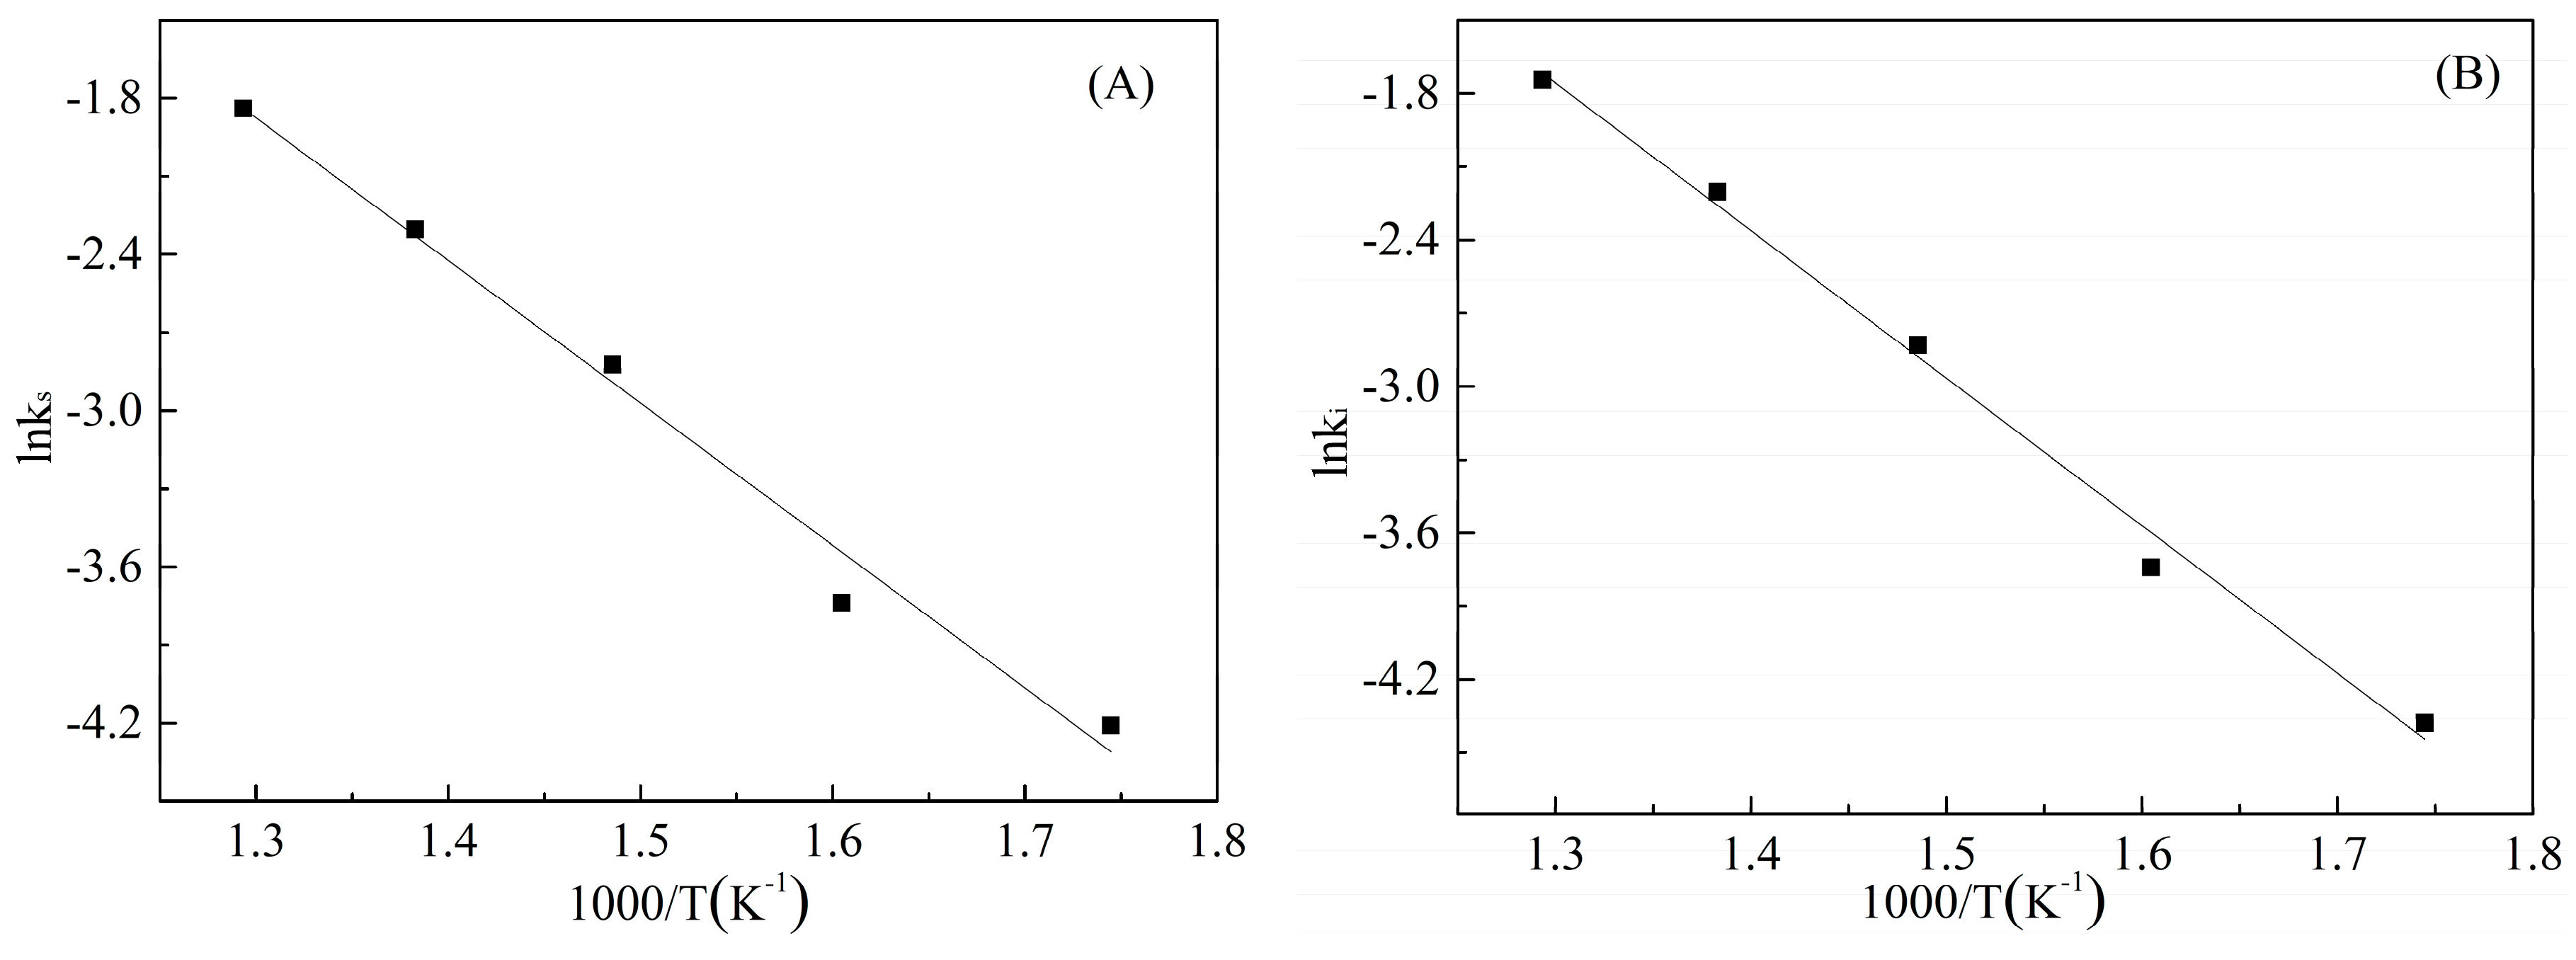
3.5. Reduction Kinetic Analysis

The reduction products (Mn2O3, Mn3O4 and MnO) were gradually formed at the outer particle layers and moving inward toward the core. The reduction process can be described by the shrinking core model.
If the process is controlled by the resistance of a chemical surface reaction, then the Equation (21) can be used to represent the process [34].
1 ( 1 x ) 1 / 3 = k s t
If the process is controlled by the inner diffusion, then the Equation (22) can be used to describe the kinetics [35].
1 3 ( 1 x ) 2 / 3 + 2 ( 1 x ) = k i t
where x is the reduction degree of ocean manganese nodules, ks and ki are the reaction rate constants associated with temperature, and t is the reaction time.
In order to determine the kinetic parameters and rate controlling step of reduction process, the experimental data presented in Figure 4 were analyzed on the shrinking core model using Equations (21) and (22), respectively. The linear fits of surface chemical controlling and inner diffusion controlling are shown in Figure 10A,B.
The kinetic parameters of the shrinking core model are listed in Table 4. The reaction rate constants increase with the increase of temperature, and the linear fitting correlation coefficient of surface chemical controlling is better than that of the inner diffusion controlling model.
The activation energy of the reduction reaction can be calculated using the Equation (23).
ln k = E a / R T + ln A 2
where Ea denotes the activation energy (J·mol−1), R is the gas constant (8.314 J/(mol·K)), T is the temperature (K), and A2 is a pre-exponential factor.
Arrhenius linear fittings of the reduction reaction controlled by the surface chemical reaction and inner diffusion are shown in Figure 11. According to Equation (23), the value of activation energy can be obtained by the confirmation of the slope of the Arrhenius linear fitting curve. The Arrhenius linear fitting equation of surface chemical reaction controlling can be expressed as lnk = −5.47 × 1000/T + 5.23 with the calculated activation energy of 45.5 kJ∙mol−1. The Arrhenius linear fitting equation of inner diffusion controlling can be written as lnk = −6.04 × 1000/T + 6.09 with the calculated activation energy of 50.2 kJ∙mol−1, which is beyond the normal range of inner diffusion. Therefore, the reduction process of ocean manganese nodules is mainly controlled by the surface chemical reaction, and the kinetic model can be expressed as t × E x p [ 6040 / T + 6.09 ] = 1 ( 1 x ) 1 / 3 .

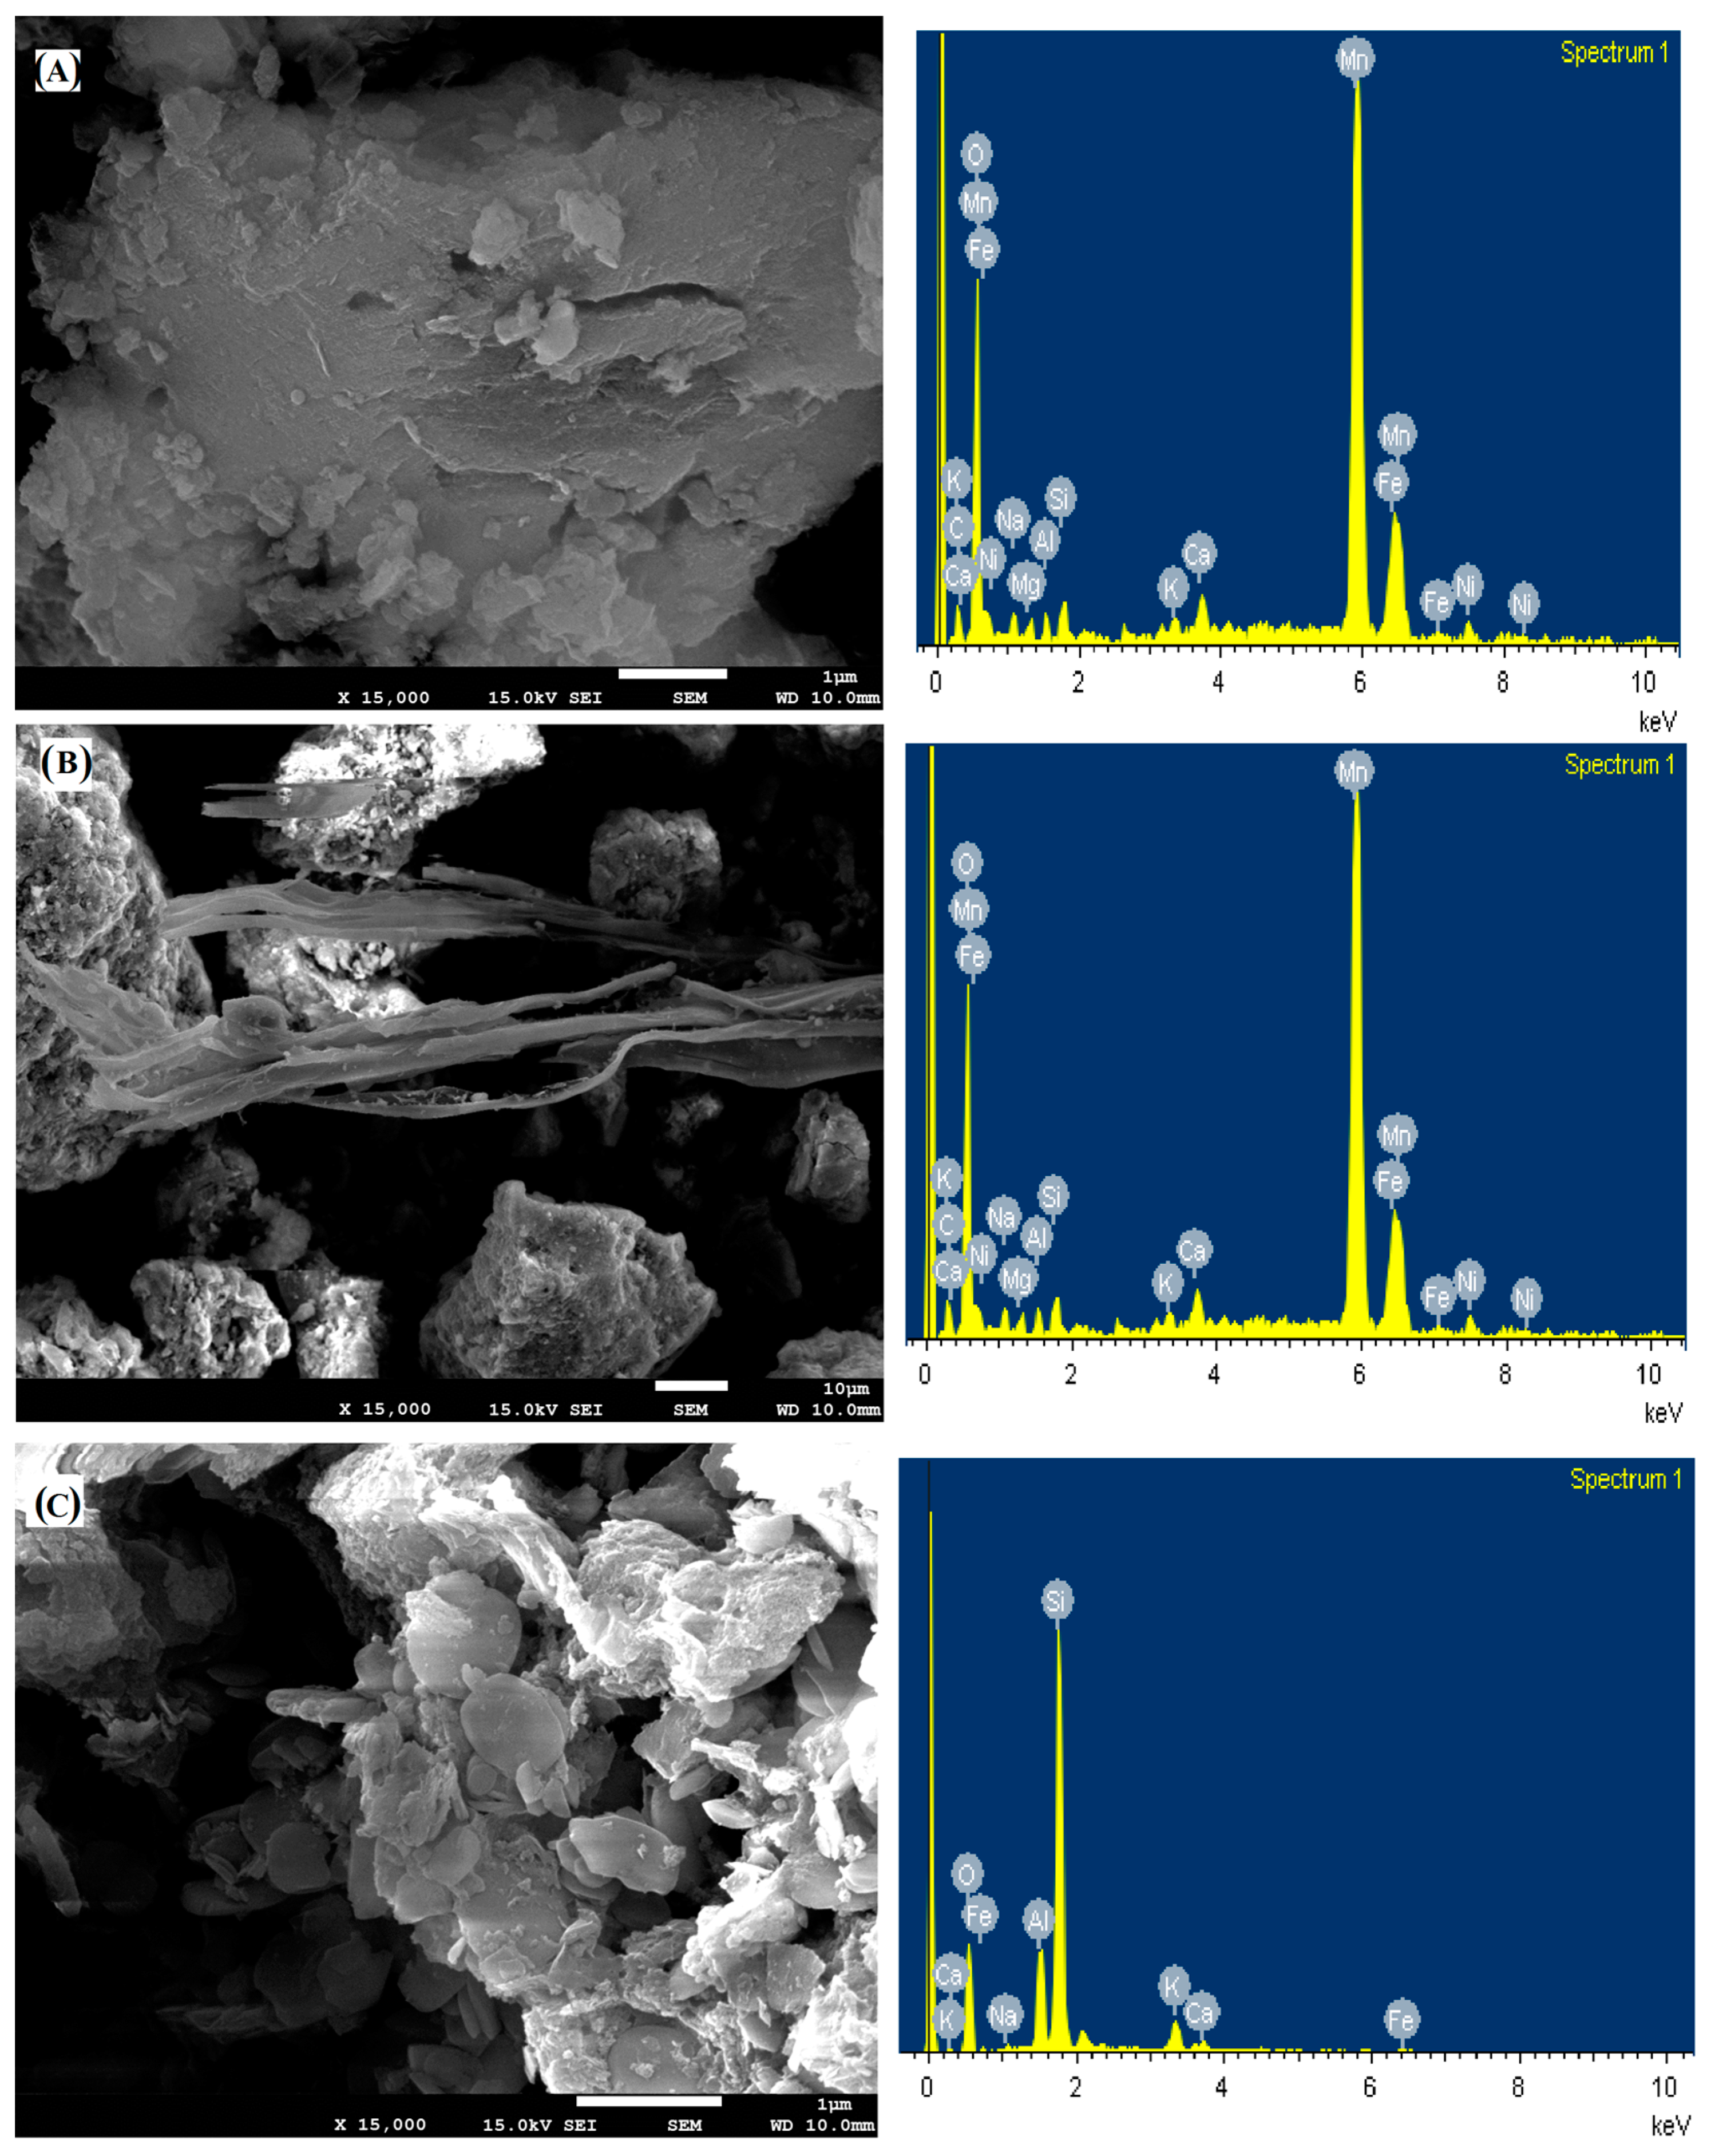
3.6. Microstructure Characterization

The scanning electron microscopy with energy dispersive spectrometry (SEM-EDS) of ocean manganese nodules, reduced ocean manganese nodules, and acid leaching residue, was carried out to investigate the microstructural changes during the extraction processes of valuable metals. The surface of raw ore (Figure 12A) was observed to contain a small number of fine particles, which was due to the accumulation of the large particles during the crushing process. The raw ore particles are impact with a relatively smooth surface. After ocean manganese nodules were reduced by sawdust pyrolysis gas, the surface of ore exhibited a structure composed of relatively finer pores and rougher morphology with the presence of the pyrolysis char (Figure 12B). The deprivation of oxygen during the reduction process might promote those morphological changes on the surfaces of ocean manganese nodules. Fe, Mn, and Ni can be detected by the EDS of the raw ore and reduced ore. After the acid leaching process, the manganese was dissolved by the acid solution, leading to a complex porous structure (Figure 12C) without the appearance of Mn and other valuable metals Cu, Co, and Ni.
The reduction performance of ocean manganese nodules was compared with recently reported studies of both hydrometallurgy and pyro-hydrometallurgy processes. As shown in Table 5, the reduction process of hydrometallurgy can be carried out at room temperature with a longer reduction time compared with pyro-hydrometallurgy. Additionally, the valuable metals can be reduced to alloy at temperatures higher than 1100 °C. However, the extraction efficiencies of Cu, Co, and Ni are lower than hydrometallurgy and this work. Compared with the traditional extraction methods, the valuable metals can be extracted at lower temperatures (compared with pyro-hydrometallurgy) and shorter reduction times (compared with hydrometallurgy) using biomass pyrolysis technology. Furthermore, the reductive substance is the volatile gas generated by pyrolysis process, and no other impurity ions are introduced in the subsequent acid leaching process after the reduction process using sawdust as the reductant.

4. Conclusions

  • The ocean manganese nodules can be reduced by sawdust pyrolysis technology. The valuable metals locked in by high valence manganese minerals can be further extracted by acid leaching after the reduction process. Cu, Co, and Ni in ocean manganese nodules closely coexist with Mn, and their extraction rates keep consistent with the reduction degree of Mn. Under the optimal conditions of sawdust dosage of 10.0%, reduction temperature of 500 °C, and reduction time of 6 min, the extraction rates of Mn, Cu, Co, and Ni reach as high as 96.1%, 91.7%, 92.5%, and 94.4%, respectively. The reduction temperature is lower than for the traditional pyro-hydrometallurgy using a carbon-based reductant. Compared with the hydrometallurgy method, the reduction time is significantly decreased. Moreover, no other impurity ions were introduced into the acid leaching process by the reductant.
  • The sawdust pyrolysis process involved four stages: moisture evaporation (25–105 °C), bound water removal (105–250 °C), the main pyrolysis process (250–375 °C), and afterward, slight pyrolysis (375–800 °C). Large amounts of volatile substances are released in the main pyrolysis process with a mass loss of 59%. Additionally, the main pyrolysis’s reductive volatile gas is CO with a content of 28.82%. According to the pyrolysis’s non-isothermal kinetic model established by thermogravimetric analysis, the sawdust’s main pyrolysis process is an endothermic reaction with the activation energy of 52.68 kJ∙mol−1; the kinetic model can be established as: α = 1 E x p [ T 2 E x p ( 6480 / T 2.36 ) ] .
  • The main reduction process of ocean manganese nodules occurs at a temperature higher than 390 °C—see comparison with the assumed and actual TG curves. The high valence manganese nodules are gradually reduced to Mn2O3, Mn3O4, and MnO by reductive volatile gas generated in the pyrolysis process. The shrinking core model shows that the reduction process is controlled by the surface chemical reaction with activation energy Ea of 45.5 kJ∙mol−1; the kinetic equation is expressed as t × E x p [ 6040 / T + 6.09 ] = 1 ( 1 x ) 1 / 3 . The surface of reduced ore exhibited a structure composed of relatively finer pores and had a rougher morphology than the raw ore. After the acid leaching process, Mn, Cu, Co, and Ni are dissolved into solution, leading to a more complex porous structure.

Author Contributions

Conceptualization, X.-y.D., C.-q.X., and R.-a.C.; methodology, X.-y.D. and D.-s.H.; validation, X.-y.D., D.-s.H., C.-q.X., R.-a.C., and J.-g.H.; data curation, X.-y.D. and J.-g.H.; formal analysis, X.-y.D. and J.-g.H.; investigation X.-y.D. and J.-g.H.; resources R.-a.C.; funding acquisition, X.-y.D. and R.-A.C.; supervision C.-q.X. and R.-a.C. All authors have read and agreed to the published version of the manuscript.

Funding

This work was financially supported by the National Natural Science Foundation of China–Yunnan Joint Fund (U1802252), the National Key R&D Program of China (2018YFC1801800), the National Natural Science Foundation of China (number 21808176), and the Scientific Research Foundation of Wuhan Institute of Technology (19QD58).

Conflicts of Interest

The authors declare no conflict of interest.

References

  1. Toro, N.; Robles, P.; Jeldres, R.I. Seabed mineral resources, an alternative for the future of renewable energy: A critical review. Ore Geol. Rev. 2020, 103699. [Google Scholar] [CrossRef]
  2. Zhao, F.; Jiang, X.X.; Wang, S.D.; Feng, L.Y.; Li, D. The recovery of valuable metals from ocean polymetallic nodules using solid-state metalized reduction technology. Minerals 2019, 10, 20. [Google Scholar] [CrossRef] [Green Version]
  3. Xiao, L.J.; Fang, M.; Zhang, W.M. Advance and present state of the research in oceanic metalliferous nodule mining. Met. Mine 2000, 8, 11–14. [Google Scholar]
  4. Senanayake, G. Acid leaching of metals from deep-sea manganese nodules—A critical review of fundamentals and applications. Min. Eng. 2011, 24, 1379–1396. [Google Scholar] [CrossRef]
  5. Feng, Y.L.; Kang, J.X.; Li, H.R.; Du, Z.W.; Deng, X.Y.; Wang, H.J. Characteristics of polymetallic nodules and low-grade nickel sulfide ore coupled leaching. J. Cent. South Univ. 2018, 49, 1582–1589. [Google Scholar]
  6. Courtois, C.; Clauer, N. Rare earth elements and strontium isotopes of polymetallic nodules from southeastern Pacific Ocean. Sedimentology 2010, 27, 687–695. [Google Scholar] [CrossRef]
  7. Toro, N.; Jeldres, R.I.; Órdenes, J.A.; Robles, P. Manganese nodules in Chile, an alternative for the production of Co and Mn in the future—A review. Minerals 2020, 10, 674. [Google Scholar] [CrossRef]
  8. Hein, J.R.; Mizell, K.; Koschinsky, A.; Conrad, T.A. Deep-ocean mineral deposits as a source of critical metals for high-and green-technology applications: Comparison with land-based resources. Ore Geol. Rev. 2013, 51, 1–14. [Google Scholar] [CrossRef]
  9. Wegorzewski, A.V.; Kuhn, T.; Dohrmann, R.; Wirth, R.; Grangeon, S. Mineralogical characterization of individual growth structures of Mn-nodules with different Ni + Cu content from the central Pacific Ocean. Am. Miner. 2015, 100, 2497–2508. [Google Scholar] [CrossRef]
  10. Zhao, F.; Jiang, X.X. Effect of sulfur-bearing substance on metallic reduction of oceanic polymetallic nodules. Nonferrous Met. 2014, 1, 15–18. [Google Scholar]
  11. Wegorzewski, A.V.; Grangeon, S.; Webb, S.M.; Heller, C.; Kuhn, T. Mineralogical transformations in polymetallic nodules and the change of Ni, Cu and Co crystal-chemistry upon burial in sediments. Geochim. Cosmochim. Ac. 2020, 282, 19–37. [Google Scholar] [CrossRef]
  12. Wegorzewski, A.V.; Kuhn, T. The influence of suboxic diagenesis on the formation of manganese nodules in the Clarion Clipperton nodule belt of the Pacific Ocean. Mar. Geol. 2014, 1, 123–138. [Google Scholar] [CrossRef]
  13. Pelegrin, R.M.; Aja, R.; Miyares, R.C. Optimization of the existing methods for recovery of base metals from polymetallic nodules. Int. J. Offshore Polar 2015, 25, 71–78. [Google Scholar]
  14. Kang, J.X.; Feng, Y.L.; Li, H.R.; Du, Z.W.; Deng, X.Y.; Wang, H.J. Enhancement of Acidithiobacillus ferrooxidans on polymetallic nodule and low-grade nickel sulfide ore simultaneous bioleaching. Chin. J. Nonferrous Met. 2018, 28, 2580–2589. [Google Scholar]
  15. Wegorzewski, A.V.; Köpcke, M.; Kuhn, T.; Stinikova, M.A.; Wotruba, H. Thermal pre-treatment of polymetallic nodules to create metal (Ni, Cu, Co)-rich individual particles for further processing. Minerals 2018, 8, 523. [Google Scholar] [CrossRef] [Green Version]
  16. Sommerfeld, M.; Friedmann, D.; Kuhn, T.; Friedrich, B. “Zero-waste”: A sustainable approach on pyrometallurgical processing of manganese nodule slags. Minerals 2018, 8, 544. [Google Scholar] [CrossRef] [Green Version]
  17. Barik, R.; Sanjay, K.; Mishra, B.K.; Mohapatra, M. Micellar mediated selective leaching of manganese nodule in high temperature sulfuric acid medium. Hydrometallurgy 2016, 165, 44–50. [Google Scholar] [CrossRef]
  18. Parhi, P.K.; Park, K.H.; Nam, C.W.; Park, J.T.; Barik, S.P. Extraction of rare earth metals from deep sea nodule using H2SO4 solution. Int. J. Min. Process. 2013, 119, 89–92. [Google Scholar] [CrossRef]
  19. Zhou, C.; Li, T.; Xie, T.; Zhang, Y. Optimization and kinetics of treating cassava bioethanol wastewater with low-grade pyrolusite in sulfuric acid solution. Desalin. Water Treat. 2016, 57, 16822–16830. [Google Scholar] [CrossRef]
  20. Kang, J.X.; Feng, Y.L.; Li, H.R.; Du, Z.W.; Deng, X.Y.; Wang, H.J. Electrochemical behavior of ocean polymetallic nodules and low-grade nickel sulfide ore in acidithiobacillus ferrooxidans-coupled bio-leaching. Minerals 2019, 9, 70. [Google Scholar] [CrossRef] [Green Version]
  21. Zhou, L.; Ju, D.C.; Zhou, X.Z.; Xu, Y.S. The distribution of polymetallic nodules in deep sea and progress in extraction process of their valuable elements. Acta Mineral. Sin. 2019, 39, 649–656. [Google Scholar]
  22. Toro, N.; Herrera, N.; Castillo, J.; Torres, C.M.; Sepulveda, R. Initial investigation into the leaching of manganese from nodules at room temperature with the use of sulfuric acid and the addition of foundry slag—Part I. Minerals 2018, 8, 565. [Google Scholar] [CrossRef] [Green Version]
  23. Torres, D.; Ayala, L.; Saldaña, M.; Cánovas, M.; Nieto, S.; Castillo, J.; Robles, P.; Toro, N. Leaching manganese nodules in an acid medium and room temperature comparing the use of different Fe reducing agents. Metals 2019, 9, 1316. [Google Scholar] [CrossRef] [Green Version]
  24. Li, H.; Liu, X.M.; Zhao, X.B.; Chen, J.L.; Yin, H.F. Medium-low temperature reduction of high-iron Bayer process red mud using biomass pine sawdust. Chin. J. Eng. 2017, 39, 1331–1338. [Google Scholar]
  25. Zhang, H.; Zhu, G.; Yan, H.; Zhao, Y.; Li, T.; Feng, X. Reduction of Low-grade Manganese Dioxide Ore Pellets by Biomass Wheat Stalk. Acta Met. Sini. 2013, 26, 167–172. [Google Scholar] [CrossRef]
  26. Zhang, H.; Zhu, G.; Yan, H.; Li, T.; Feng, X. Thermogravimetric analysis and kinetics on reducing low-grade manganese dioxide ore by biomass. Met. Mater. Trans. B 2013, 44, 878–888. [Google Scholar] [CrossRef]
  27. Mehrabian, R.; Scharler, R.; Obernberger, I. Effects of pyrolysis conditions on the heating rate in biomass particles and applicability of TGA kinetic parameters in particle thermal conversion modelling. Fuel 2012, 93, 567–575. [Google Scholar] [CrossRef]
  28. Cai, J.M.; Xu, D.; Dong, Z.J.; Yu, X.; Yang, Y.; Banks, S.W.; Bridgwater, A.V. Processing thermogravimetric analysis data for isoconversional kinetic analysis of lignocellulosic biomass pyrolysis: Case study of corn stalk. Renew. Sust. Energ. Rev. 2018, 82, 2705–2715. [Google Scholar] [CrossRef] [Green Version]
  29. Mishra, R.K.; Mohanty, K. Pyrolysis kinetics and thermal behavior of waste sawdust biomass using thermogravimetric analysis. Bioresour. Technol. 2018, 251, 63–74. [Google Scholar] [CrossRef]
  30. Coats, A.W.; Redfern, J.P. Kinetic parameters from thermogravimetric data. Nature 1964, 201, 68–69. [Google Scholar] [CrossRef]
  31. Yang, H.P.; Yan, R.; Chen, H.P.; Lee, D.H.; Zheng, C.G. Characteristics of hemicellulose, cellulose and lignin pyrolysis. Fuel 2007, 86, 1781–1788. [Google Scholar] [CrossRef]
  32. Zhang, S.Y.; Feng, Y.L.; Li, H.R. The study on magnetizing roast hematite with biomass. Min. Eng. 2016, 14, 31–33. [Google Scholar]
  33. Dai, T.; Gong, Z.J.; Li, B.W.; Wu, W.F. Experiment and mathematical simulation on magnetization reduction roasting of limonite particles with CO at low temperature. Chin. J. Process Eng. 2014, 14, 624–630. [Google Scholar]
  34. Deng, X.Y.; Feng, Y.L.; Li, H.R.; Du, Z.W.; Kang, J.X.; Guo, C.L. Preparation of sodium manganate from low-grade pyrolusite by alkaline predesilication-fluidized roasting technique. Trans. Nonferrous. Met. Soc. China 2018, 28, 1045–1052. [Google Scholar] [CrossRef]
  35. Wang, R.C.; Zhai, Y.C.; Ning, Z.Q.; Ma, P.H. Kinetics of SiO2 leaching from Al2O3 extracted slag of fly ash with sodium hydroxide solution. Trans. Nonferrous. Metl. Soc. China 2014, 24, 1928–1936. [Google Scholar] [CrossRef]
Figure 1. X-ray diffraction (XRD) pattern of ocean manganese nodules.
Minerals 10 00850 g001
Figure 2. Schematic diagram of the pyrolysis reduction device (①—nitrogen bottle; ②—gas flow meter; ③—quartz tube; ④—sample; ⑤—temperature control system; ⑥—thermocouple; ⑦—tail gas treatment).
Minerals 10 00850 g002
Figure 3. The effect of sawdust dosage on the extraction rates of Mn, Cu, Co, and Ni (A); linear relationships between Mn extraction rate and Cu, Co, and Ni extraction rates (B).
Minerals 10 00850 g003
Figure 4. The effect of temperature on the reduction degree of MnO2.
Minerals 10 00850 g004
Figure 5. TG/DTA curves of sawdust pyrolysis.
Minerals 10 00850 g005
Figure 6. The plot of ln[−ln(1 – α)/T2] versus 1000/T.
Minerals 10 00850 g006
Figure 7. TG and TDG curves for reducing ocean manganese nodules using sawdust.
Minerals 10 00850 g007
Figure 8. The comparison of the assumed TG curve and actual TG curve.
Minerals 10 00850 g008
Figure 9. The relationships between T and △GT0 for Equations (6)–(20).
Minerals 10 00850 g009
Figure 10. The linear fit of the reduction’s kinetic model; (A) surface chemical controlling; (B) inner diffusion controlling.
Minerals 10 00850 g010
Figure 11. Arrhenius linear fittings of the reduction reaction controlled by the surface chemical reaction (A) and inner diffusion (B).
Minerals 10 00850 g011
Figure 12. Scanning electron microscopy images with energy dispersive spectrometry (SEM-EDS) of ocean manganese nodules (A), reduced ore (B), and acid leaching residue (C).
Minerals 10 00850 g012
Table 1. Chemical elements and industry analysis results of sawdust (wt.%).
Chemical Elements AnalysisIndustry Analysis
CHONSMoistureFixed CarbonVolatilesAsh
43.695.1336.921.370.087.4274.5116.611.46
Table 2. Chemical composition analysis of the ocean manganese nodules (wt.%).
MnO2Fe2O3CuOCo3O4NiONa2OK2OMgO
36.517.891.320.271.762.551.213.36
Al2O3SiO2CaOTiO2ClSP-
6.6321.112.871.241.440.640.71-
Table 3. The composition of the pyrolysis gas (vol%).
COCO2H2CH4C2H6C2H4Total/%
28.8263.090.465.031.461.45100.31
Table 4. Kinetic parameters of shrinking core model.
Rate Controlling StepsT/Kk(ks/ki)lnkR2
Controlled by surface
chemical reaction
5730.0149−4.209760.992
6230.0238−3.737650.999
6730.0594−2.823460.999
7230.0999−2.303890.988
7730.1588−1.84030.896
Controlled by inner
diffusion
5730.0126−4.378030.889
6230.0237−3.741860.948
6730.0589−2.831570.945
7230.1104−2.204010.982
7730.1744−1.746290.973
Table 5. A comparison of performances for the reduction of ocean manganese nodules, including results from the literature and this study.
Reduction MethodsReductantReduction ConditionsExtration EfficiencyRef.
HydrometallurgyNickel sulfide ore30 °C, 168 h, pH 1.897.3%(Mn), 92.2%(Cu), 97.8%(Co), and 95.4%(Ni)[20]
FeC25 °C, 20 min97%(Mn)[23]
Pyro-hydrometallurgyAnthracite1100 °C, 2.5 h86.48%(Ni), 86.74%(Co), 83.91%(Cu), 5.63%(Mn), and 91.46%(Fe)[2]
This workSawdust (10%)500 °C, 6 min96.1%(Mn), 91.7%(Cu), 92.5%(Co), and 94.4%(Ni)-

