Article

Zircon U–Pb Geochronology, Whole-Rock Geochemistry and Petrogenesis of Biotite Granites in the Gaudeanmus Area, Namibia

1
Beijing Research Institute of Uranium Geology, Beijing 100029, China
2
Key Laboratory of Uranium Resource Exploration and Evaluation Technology, China National Nuclear Corporation, Beijing 100029, China
*
Author to whom correspondence should be addressed.
Minerals 2020, 10(1), 76; https://doi.org/10.3390/min10010076
Submission received: 4 December 2019 / Revised: 6 January 2020 / Accepted: 7 January 2020 / Published: 17 January 2020
(This article belongs to the Section Mineral Deposits)

Abstract

:
The Gaudeanmus area is located at the southern Central Zone of the Damara orogenic belt in south-western Africa. In this paper, we investigate the whole rock major and trace element compositions and Sr–Nd–Pb isotopic compositions of the biotite granite, and determine the age of the samples utilising U–Pb zircon dating methods. Our results provide an LA–collector inductively plasma mass spectrometer (ICP–MS) zircon U–Pb age for the biotite granite of 540 ± 4 Ma (i.e., earliest Cambrian). The biotite granites show the characteristics of metaluminous compositions belonging to high-K calc–alkaline to shoshonite series. The granites contain high alkali and rare earth elements (REE), are enriched in large-ion lithophile elements (Rb, K, Pb), and depleted in high field-strength elements (Nb, Ta, Ti). The REE patterns are characterised by enrichment of LREEs relative to HREEs and medium negative Eu anomalies in the chondrite-normalised REE diagram. These rocks have high initial 87Sr/86Sr ratios (0.71400–0.71768); low εNd(t) value (−12.0 to −7.1); Sm–Nd isotope crust model ages ranging from 1711 to 2235 Ma; and large variations in 206Pb/204Pb (18.0851–19.2757), 207Pb/204Pb (15.6258–15.7269), and 208Pb/204Pb ratios (38.7437–40.5607). Such geochemical signatures indicate that the biotite granite rocks derive mainly from partial melting of ancient crustal rocks resembling the local basement meta-sedimentary rocks. However, minor mantle-derived materials may have also been involved in the formation of these rocks. Combining with regional tectonic evolution, we consider that the biotite granite intrusions in the Gaudeanmus area formed in a transitional tectonic regime that went from compressional to extensional tectonics.

1. Introduction

The central zone of the Damara orogenic belt in Namibia is characterized by a large amount of intrusive rocks exposed, with an exposed area of at least 75,000 km2 and more than 300 intrusive bodies. Among the exposed intrusive rocks, 96% are granitic rocks and 4% are gabbro and granodiorite rock [1]. The size of the granite intrusions in the central zone varies from the Donkerhuk granitoids (5000 km2) to a large number of small stocks [1] and to a few meters thick sheeted leucogranites [2]. According to Marlow [3], these granites of the Central Zone include basement Abbabis gneiss, Red granite, Salem-type granite, and the alaskite [4,5]. The Gaudeanmus area is located at the southern Central Zone of the Damara orogenic belt. The biotite granites in Gaudeanmus area outcrop in the northwestern part of the study area, which belonged to Salem-type granite [1,3,6,7,8]. The Salem-type granite is the most widely distributed granite in the central zone, which is the general name of granodiorite, granite, and quartz monzonite formed in different ages [3]. Brandt pointed out that Salem-type granites include pre-orogenic, synorogenic, and post-orogenic granitoids [9]. As one of the productions of Damara Orogeny, there has yet to be a systematical study that encompasses its source region, genetic type, and tectonic environment. This paper reports the Early Cambrian biotite granites from the Gaudeanmus area and presents new zircon U–Pb isotope age determinations, whole-rock major and trace element compositions, and Sr–Nd–Pb isotopic characteristics for the biotite granites, and discusses their petrogenesis and tectonic implications.

2. Regional Geology and Petrography

The Damara Orogen occurred during the Neoproterozoic to Early Palaeozoic (650 Ma to 460 Ma); forms part of the Pan Africa Mobile Belt, a feature which transects the African continent; and is the product of a collision between the Congo and the Kalahari cratons [10,11]. The Damara orogenic belt is divided into north–east inland branches and north–south coastline branches. The inland branches extend to Zimbabwe through Namibia and Botswana. The two branches can be subdivided into different zones according to faults, with linear structural zones interpreted by aeromagne [1,12]. The more than four hundred kilometers wide inland branch between Congo and Kalahari cratons from NW to SE has been subdivided into NE-trending Northern Platform, Northern Zone, northern Central Zone, southern Central Zone, Okahandja Lineament Zone, Southern Zone, and a Southern Margin Zone (Figure 1) [1]. The northern boundary of the central zone of the inland branch is the Otjihorongo thrust, and the southern boundary is the Okahandja lineament. The Omaruru lineament divides the central zone of the inland branch into the northern central zone and the southern central zone. The southern central zone is different from the northern central zone in terms of lithofacies characteristics, basement outcrops, and the occurrence of Damara granites [13,14].
The Gaudeanmus area is located at the southern Central Zone of the Damara orogenic belt. The southern Central Zone is characterized by the dome structure with pre-Damaran basement as the core, extensive granitoid intrusions [1], and low pressure and high temperature metamorphism (high amphibolite facies to granulite facies) [16,17]. The strata in the central zone are mainly composed of the pre-Damaran basement and the Neoproterozoic Damara Sequence, which is unconformably above the pre-Damaran basement (Figure 2). The pre-Damaran Abbabis basement is largely composed of quartzo-feldspathic augen gneiss with minor amphibolites, schists, and calc-silicates units [18,19]. The poly-cyclic basement granite-gneisses forming the oldest group have been dated at 2093 ± 51 Ma, and some intrusive components exhibit Grenvillian ages 1027 ± 8 Ma [20,21]. The Neoproterozoic Damara Sequence is composed of the fluvial Nosib group and calcareous, glacio-marine Swakop Group. The lower Nosib Group included the the Etusis formation and Khan formation, while the upper Swakop Group included the Rössing formation, Chuos formation, Karibib formation, and Kuiseb formation [8,22,23,24,25,26,27].
The Salem-type granites in the Gaudeanmus area outcrop in the northwestern and southeastern part of the study area. They mainly comprise porphyritic granites, with some biotite granites, exhibiting the form of a batholith (Figure 2). Biotite granite outcrops in the northwestern side of Gaudeanmus area, but the outcrop area is relative small. Biotite granite intrudes pre-Damaran Abbabis basement and Neoproterozoic Damara Sequence, whereas alaskite intrudes biotite granite units (Figure 3a). The rock biotite-rich and weak foliations are present. These are medium-to-coarse grained, grey in colour, and massive. Biotite granite is composed of potassium feldspar (15–35%), plagioclase (20–40%), quartz (35–40%), and biotite (15–20%), with minor garnet and magnetite. Accessory minerals include zircon, apatite, and titanite. Myrmekite develops at plagioclase and K-feldspar grain boundaries (Figure 3b). Plagioclase is locally commonly sericitized and biotite is generally altered to chlorite. Potassium feldspar, plagioclase, and quartz granites show evidence of deformation after crystallisation.

3. Analytical Methods

3.1. LA–Collector Inductively Plasma (ICP)–Mass Spectrometer (MS) Zircon U–Pb Age Determination

In order to study the geochronology of biotite granites, about 5 kg of samples were collected from Gaudeanmus area. Zircon grains were separated from crushed samples by density and magnetic techniques, and then carefully purified by hand-picking under a binocular microscope, according to size, color, and shape. Zircon grains were set in an epoxy mount, which was then ground and polished to expose half the crystals for analysis [29]. Zircon internal structures were imaged using transmitted and reflected light microscopy and cathodoluminescence (CL) imaging. Cathodoluminescence (CL) images were undertaken utilising scanning electron microscopy at the Beijing SHRIMP center and the electron probe laboratory at the Institute of Mineral Resources, Chinese Academy of Geological Sciences (Beijing, China).
The determination of the U–Pb age of zircon was performed on a Finnigan Neptune type multi-collector inductively plasma mass spectrometer (MC–ICP–MS) instrument and accompanying Newwave UP 213 nm laser ablation system, at the Key Laboratory of Metallogeny Resource Assessment, Institute of Mineral Resources, Chinese Academy of Geological Sciences (Beijing, China). The laser spot sizes were 25 μm in diameter. Zircon standard GJ-1 was used as an external standard to normalize isotopic fractionation during analysis (207Pb/206Pb age is 608 ± 1.5 Ma, Jackson et al. [30]). Data were reduced using the ICP-MS DataCal 10.9 software of [31] (Wuhan, China). Common Pb was corrected using the ComPbCorr3_151 correction procedure for zircons with common 206Pb concentrations of >1% [32]. U–Pb Concordia age and diagrams were calculated using ISOPLOT3.0 software (Berkeley, CA, USA) [33].

3.2. Geochemical Analysis

Samples collected from the Gaudeanmus study area (Table 1) were crushed in steel ball mill and ground in an agate mill to a grain size of <200 mesh in the Mineral Separation Laboratory of Regional Geological Survey in Langfang, Hebei Province. Major-element, trace-element, rare-earth element, and Sr–Nd–Pb isotopic compositions were performed at the Centre of analyses and detection at Beijing Research Institute of Uranium Geology (BRIUG) (Beijing, China).
For major element analyses, mixtures of whole rock powders (0.5 g) and Li2B4O7 + LiBO2 (4.5 g) were made into glass discs and analyzed by X-ray fluorescence spectroscopy. The chemical assay method was applied for the determination of FeO, and loss on ignition (LOI) was analyzed by the wet chemical method. The analytical uncertainties were generally within 0.1–1% (relative standard deviation (RSD)). Detailed analytical procedures are given in Norrish and Hutton [34]. Trace element (including REE) were determined by a Finnigan–MAT HR–ICP–MS (Element I) (Centre of analyses and detection at BRIUG, Beijing, China), with analytical uncertainties less than 10% for most elements. The detailed analytical procedures are similar to those described by Qu et al. [35].
Sample powders were digested in sealed Teflon bombs with a mixture of HF, HNO3, and HClO4 acids, and then analyzed using a Finnigan Triton Thermal Ionisation Mass Spectrometer (TIMS) instrument (Centre of analyses and detection at BRIUG, Beijing, China). The concentrations of Rb, Sr, Sm, and Nd were obtained through the isotope dilution method, which were effectively separated and purified with an anion-exchange column. The mass fractionation corrections for Sr and Nd isotopic ratios are based on 146Nd/144Nd = 0.7219 and 86Sr/88Sr = 0.1194, respectively. More details about the analytical procedures are given in Zhang et al. [36]. Whole rock Pb isotope was separated with resin exchange. After the samples were dried, lead isotopes for each example were determined with an MAT-261 TIMS instrument (Centre of analyses and detection at BRIUG, Beijing, China). Relative standard deviation (RSD) for a 1 μg lead content was not higher than 0.005% for 208Pb/206Pb. Repeated analyses of NBS 981 yielded average values of 206Pb/204Pb = 16.941 ± 6, 207Pb/204Pb = 15.494 ± 0.006, and 208Pb/204Pb = 36.718 ± 0.018, respectively.

4. Analytical Results

4.1. Zircon U–Pb Geochronology

In all samples of the biotite granite, the zircon grains are mostly colorless and/or pale yellow, transparent, and commonly euhedral to subhedral crystal forms, ranging in size from 110 to 250 μm. The grain sizes vary greatly with a length to width ratio of 2:1 to 3:1. CL images show (Figure 4a) most of the zircon grains have clearly oscillatory zoning, indicative of their magmatic origin [37,38]. Partial zircon grains preserve internal cores with growth rims. The zircon grains of biotite granites have Th/U ratios of 0.29 to 1.42 (average 0.56), which also reflects their magmatic character [39].
A selection of the biotite granite samples was chosen for LA–ICP–MS zircon U–Pb isotopic dating analyses; thirty U–Pb analyses were done on thirty different zircons with the data reported in Table 2 and plotted on a conventional U–Pb concordia shown in Figure 4b. A few analyses are discordant, having suffered Pb-loss as a consequence of analytical problems or subsequent geological processes, and are thus discarded. Excluding the analyses of two zircon grains that display inheritance, the fourteen remaining analyses plot on or close to a concordia curve (Figure 4b). The weighted mean 206Pb/238U age of 540 ± 4 Ma (MSWD = 0.97, Figure 4c), when discordant zircons are ignored, can be considered the age of emplacement of the biotite granite units. Partial zircon grains preserve internal cores without growth rims, indicating existence of inherited zircon. These two analyses provide 207Pb/206Pb ages of 1907 Ma and 1033 Ma, close to the interpreted age of the Abbabis basement, and which may reflect the inherited character of the original magma source.

4.2. Geochemistry of Whole-Rock Samples

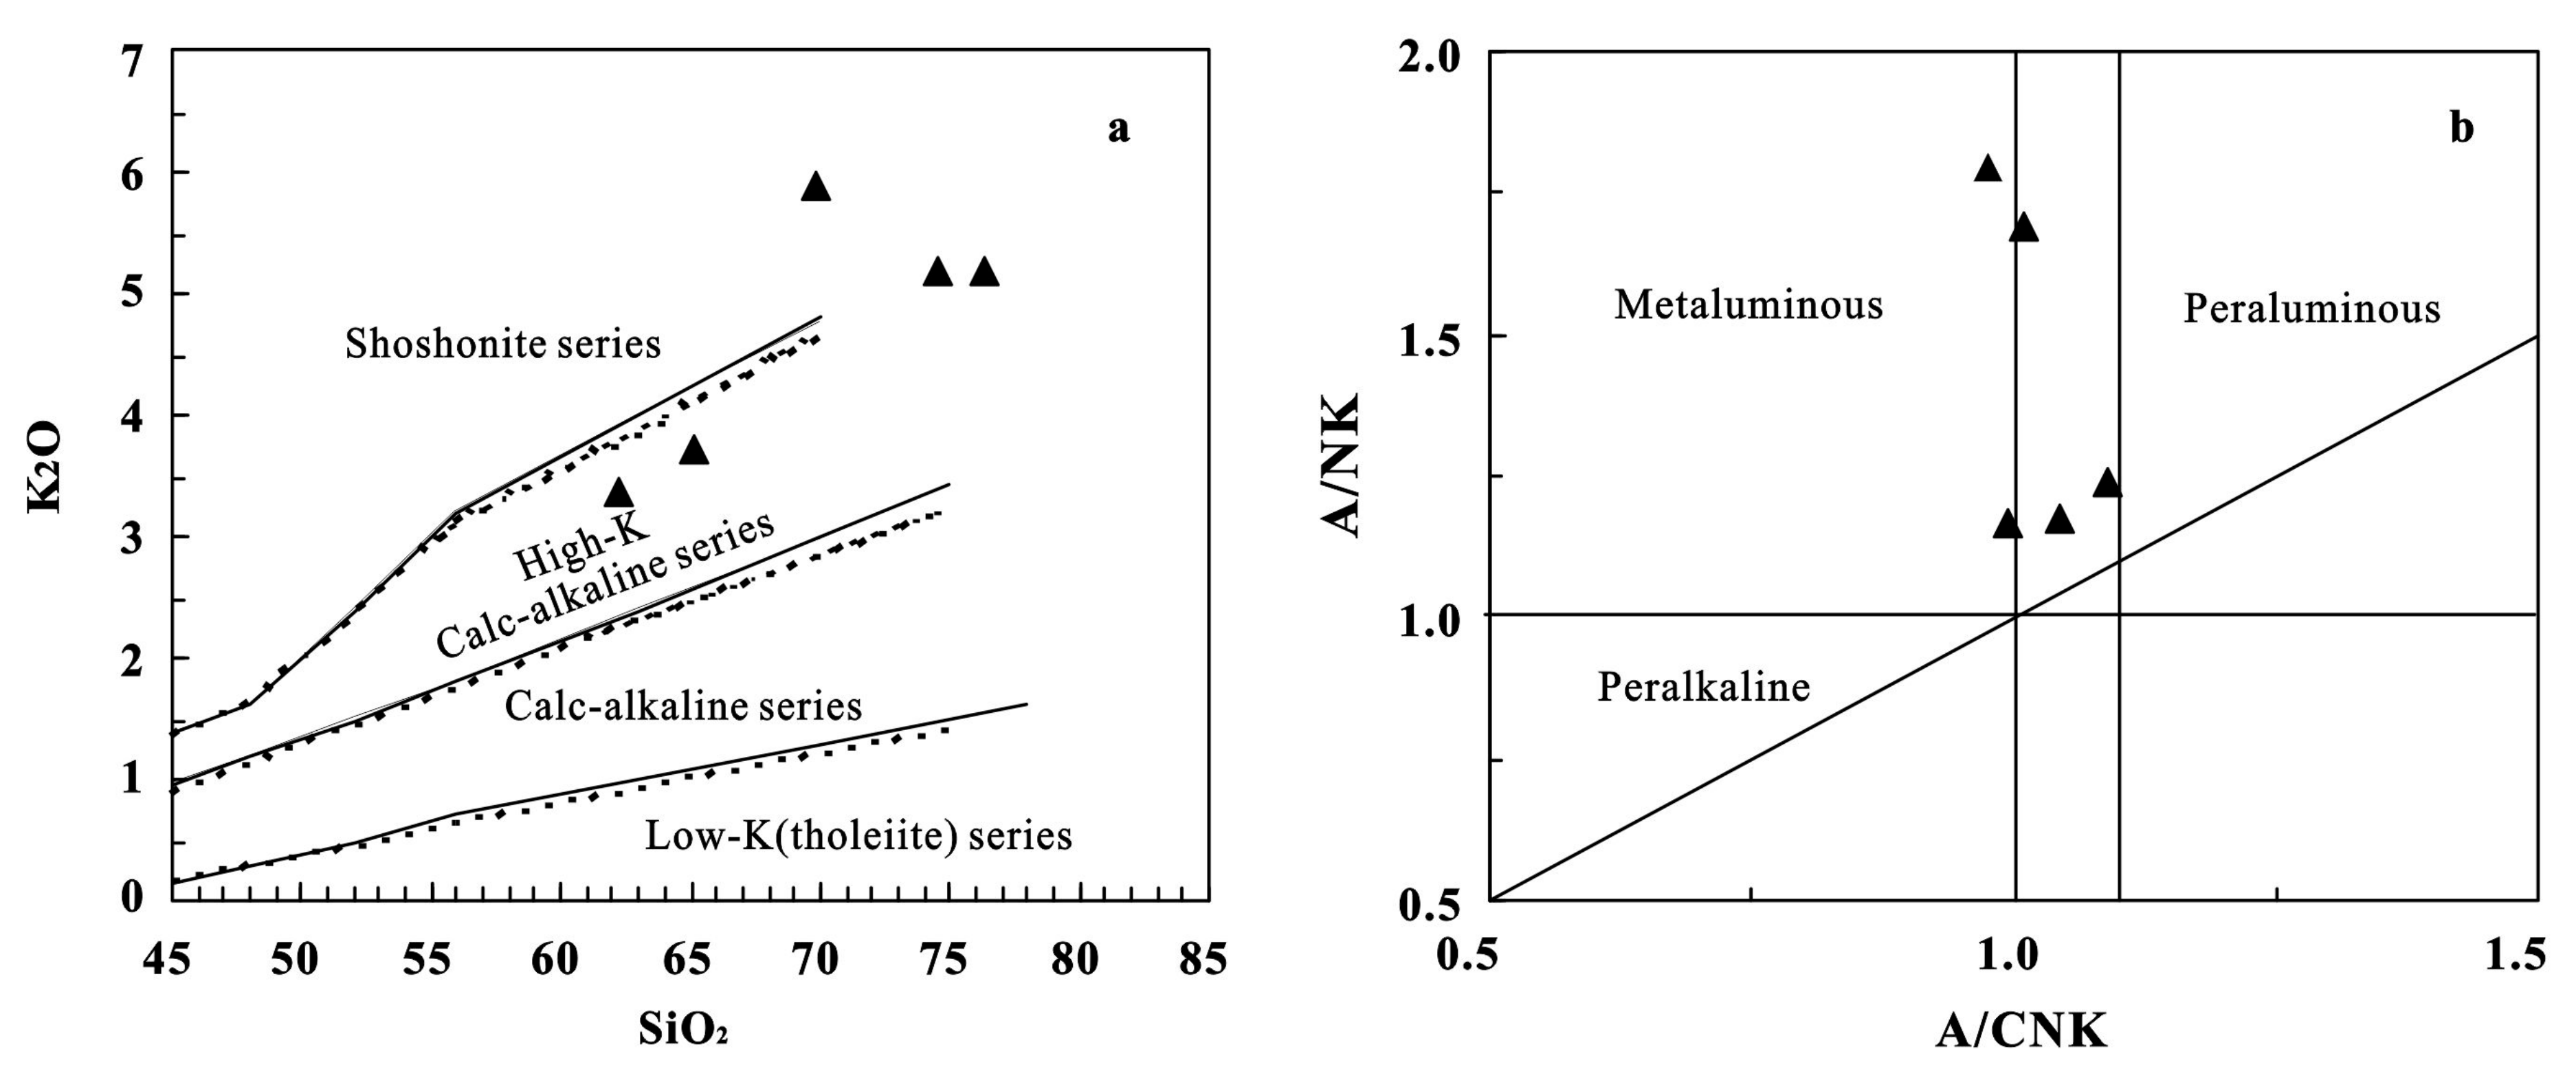
4.2.1. Major Element Compositions

Analysed whole-rock geochemical data for biotite granites are reported in Table 3. Biotite granites have SiO2 contents ranging from 62.24 wt% to 76.42 wt%, Al2O3 varies between 11.17 wt% and 14.44 wt%, and there is a high content of total alkalis. The samples display K2O + Na2O (oxide wt%) varying between 6.07% and 8.90%, yielding K2O/Na2O ratios of between 1.26 and 2.17, and low values for TiO2 (0.20 wt%–1.37 wt%), MnO (0.005 wt%–0.130 wt%), and P2O5 (0.03 wt%–0.38 wt%). Except sample 11H-30, other samples have a high content of Fe, and FeO > Fe2O3; Fe2O3T contents range from 0.96 wt% to 8.38 wt% (average 4.60 wt%), which may reflect the high biotite contents and presence of minor magnetite in these rocks.
The A/CNK ratios for the biotite granite samples (mole ratio of Al2O3/(CaO + Na2O + K2O)) vary from 0.98 to 1.10, and A/NK (mole ratio of Al2O3/(Na2O + K2O)) from 1.16 to 1.19. The majority of the samples plot within the metaluminus to peraluminous field in the A/NK–A/CNK diagram [40] (Figure 5b). The analysed samples of biotite granite belong to the high-K calc-alkaline to shoshonite series (Figure 5a). As can be observed in Table 3, biotite granite samples display variable composition, but on Harker type diagrams (Figure 6), there is a linear decrease in TiO2, Fe2O3T, Al2O3, MnO, CaO, and P2O5, and an increase in K2O and K2O/Na2O with increasing silica. The linear trends in major element plots for the biotite granite units may be explained by magmatic differentiation, showing the characteristics of homogeneous evolution.

4.2.2. Trace Element Compositions

Trace element analysis results are listed in Table 3. The biotite granites samples have total rare earth element (∑REE) contents ranging from 94.95 ppm to 355.14 ppm. In the chondrite-normalised rare-earth element patterns (Figure 7), all the analysed samples have similar chondrite-normalised REE patterns. They are characterised by LREE-enriched (82.66–334.06 ppm) and HREE-depleted (12.29–32.74 ppm) profiles with LREE/HREE of 6.37 to 15.85 and (La/Yb)N ratios (subscript N represents chondrite normalised value) of 7.00 to 35.40. Samples of 11H-30 and 11H-33 have flat HREE distribution, which may be related to some enrichment in minerals that favour the incorporation of rare earth element mineral into their lattice, such as garnet. The biotite granite samples studied display weakly negative δEu of 0.27 to 0.54, increasing with falling SiO2 contents, which is related to the difference in the amount of plagioclase fractionation. Sample 11H-33 has δEu of 0.987, which may be the result of analytical uncertainties.
In the primitive mantle-normalized trace element spider diagram (Figure 7), biotite granite samples show similar rare earth element patterns, enriched in large-ion lithopile elements (Rb, K, Pb), and depleted in high field-strength elements (Nb, Ta, Ti). Negative P and Ti anomalies suggest fractionation of apatite and Fe–Ti oxides. Deficiency of Nb, Ta, Sr, P, and Ba shows that granites may have the characteristics of continental crustal composition.

4.2.3. Sr–Nd–Pb Isotopic Characteristics

The analytical results for Sr–Nd–Pb isotopes in biotite granite samples from the Gaudeanmus study area are reported in Table 4. The results herein suggest an LA–ICP–MS zircon U–Pb age for the biotite granite of 540.2 ± 4 Ma. Ancient Nd isotope crust model ages are calculated through a two-stage model, according to the references listed in Table 4 and Li and McCulloch [42] and Shen et al. [43].
These biotite granite samples have age-corrected initial 87Sr/86Sr ratios (ISr) varying from 0.71400 to 0.71768 (average 0.71548), 143Nd/144Nd ratios ranging from 0.511326 to 0.512003 (average 0.511468), the εNd(t) ranging from −12.0 to −7.1, and ancient Nd isotope crust model ages ranging from 1171 to 2235Ma. fsm/Nd values for the biotite granite are mainly between −0.51 and −0.14, indicating that the rare earth elements, Sm and Nd, have an indistinctive distribution, so ancient Nd isotope crust model ages calculated on the data are reliable. Sr and Nd isotopic compositions for the biotite granite vary greatly, indicating that these were formed by a hybridisation process of mantle-derived magma and sialic magma [44]. εNd(t)–(87Sr/86Sr) [45] (Figure 8), SiO2–(87Sr/86Sr) (Figure 9a), and SiO2–εNd(t) (Figure 9b) diagrams indicate that the biotite granite units derive mainly from partial melting of ancient crustal rocks resembling the basement meta-sedimentary rocks. However, minor mantle-derived materials may have also been involved in the formation of these rocks.
As presented by whole-rock lead isotope analysis (Table 4), the 206Pb/204Pb of Pb isotopic composition of the biotite granites from Gaudeanmus area is 18.0851–19.2757, and the value of 207Pb/204 is 15.6258–15.7269, while 208Pb/204Pb is 38.7437–40.5607. Isotope ratios of Pb in biotite granite samples are greater than for common Pb, indicating that much of the radiogenic Pb is produced. Magmatic zircon from the biotite granite samples from the study area provide a weighted mean 206Pb/238U age of 540.2 ± 4 Ma. The initial lead ratios of the biotite granite samples, that is, (206Pb/204Pb)t, (207Pb/204Pb)t, and (208Pb/204Pb)t are 17.0978–18.6865, 15.5652–15.6926, and 36.1932–38.1856, respectively, all of which are higher. There is a significant difference between the present lead ratios and initial lead ratios for the studied sample suite. This variation may be the result of an inherited age and relatively high U and Th concentrations in the biotite granite units. As shown in Pb isotopic structure model diagram (see Figure 10) [46], the Pb isotopic composition of the biotite granite from the study area falls between those of the upper crust and orogenic belts, closely resembling to upper crust. It is shown that Pb is mainly derived from the upper crust, with a somewhat influence of other materials.

5. Discussion

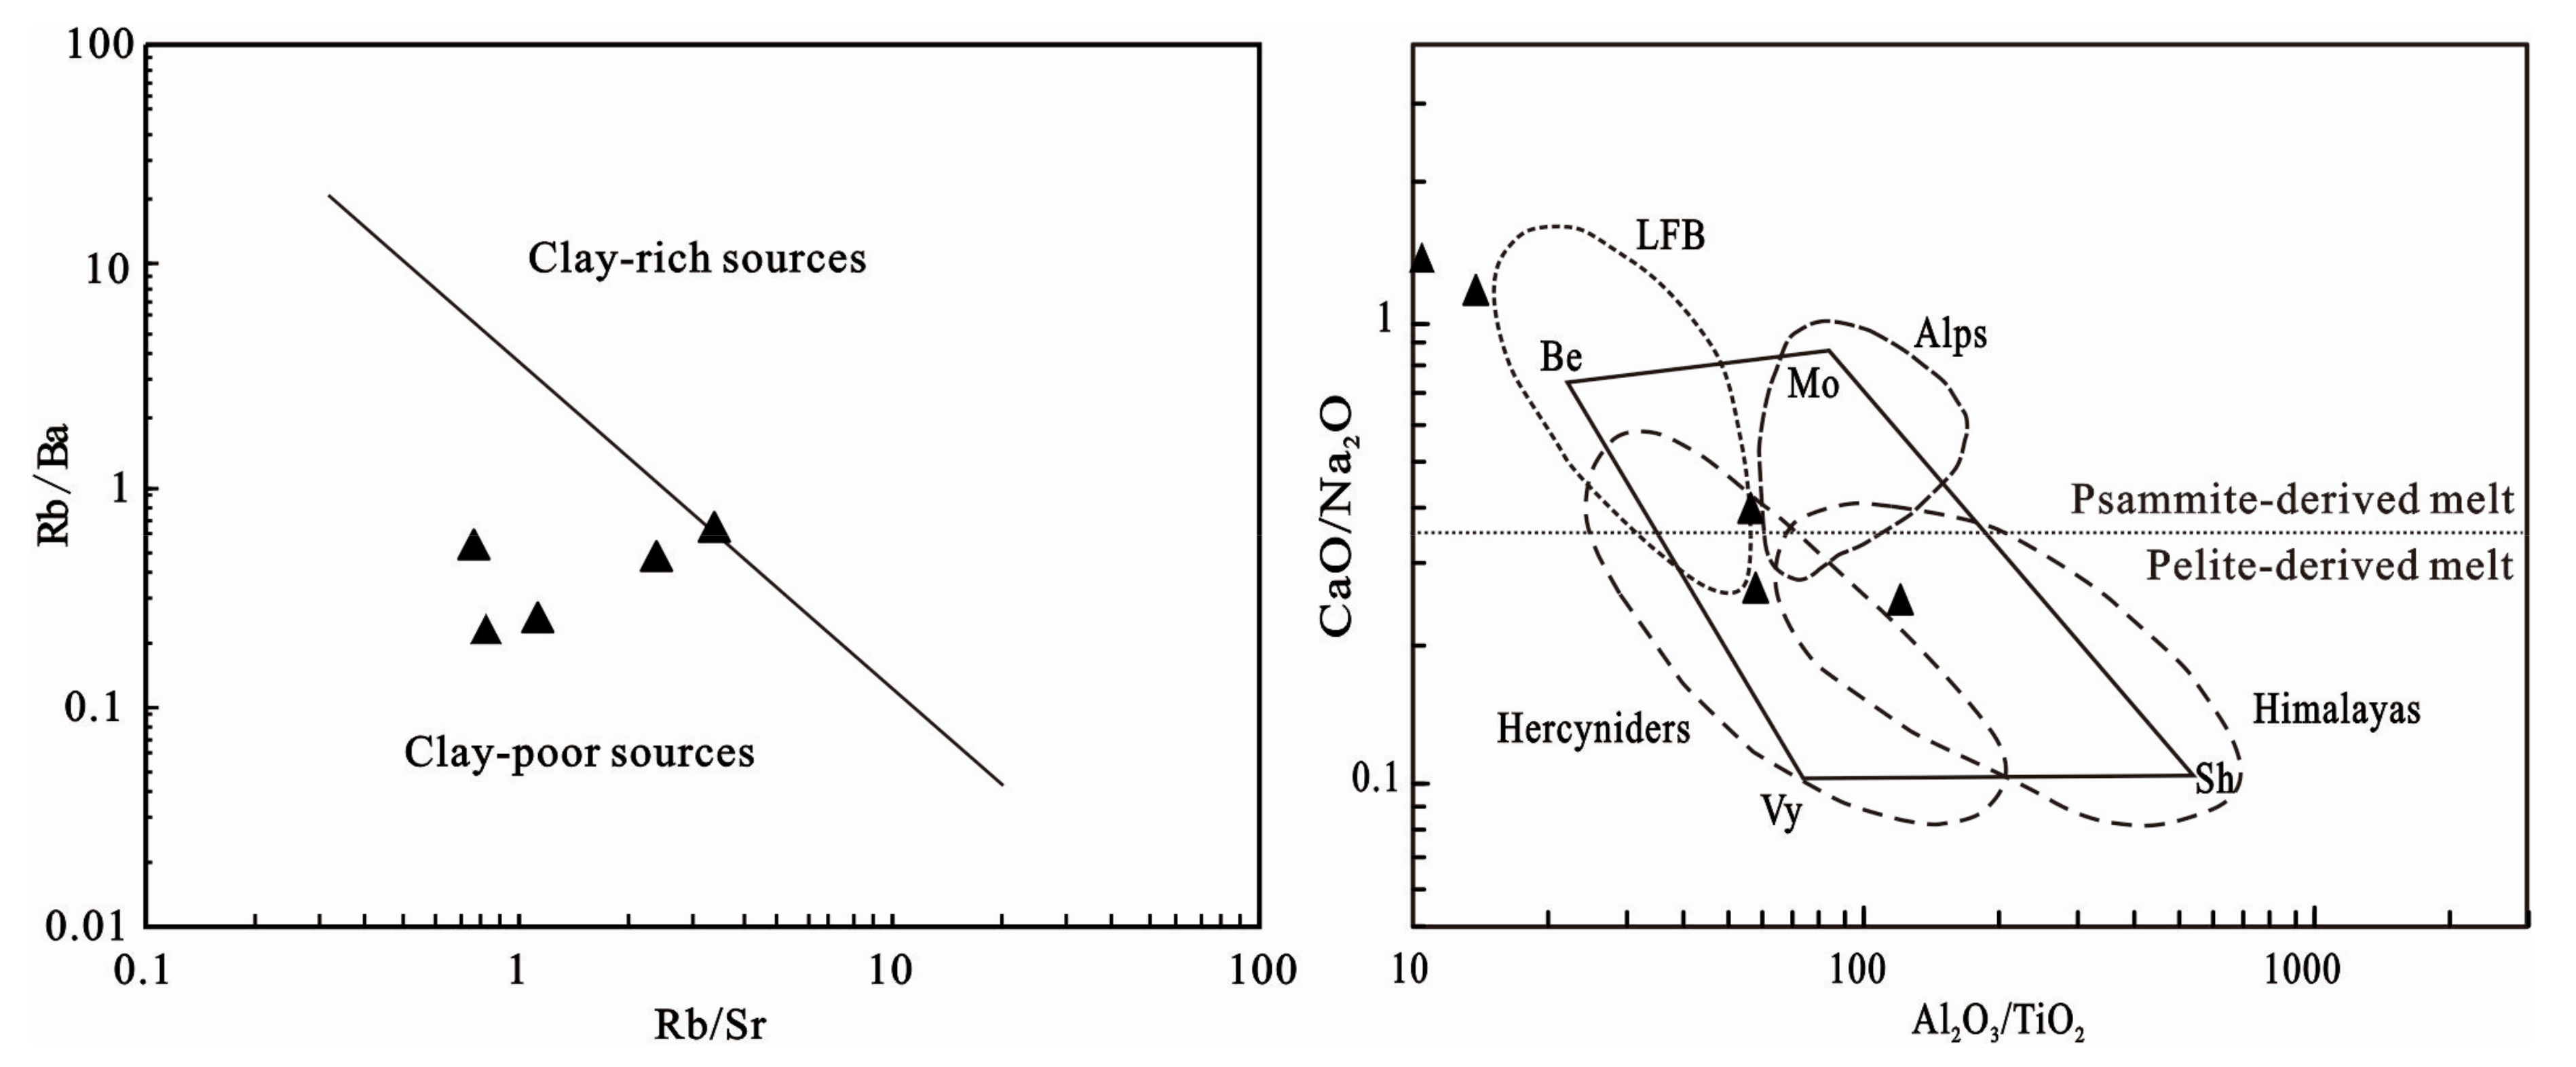
5.1. Potential Sources Components

Biotite granite in the Gaudeanmus area exhibits metaluminus to peraluminous characteristics, with enriched in large-ion lithophile elements (U, Th, Pb), indicating it is crustally derived. The Nb/Ta ratios of biotite granites varies from 7.67 to 18.05 (average 12.94), close to the average value of the crust (around 11, Taylor and Mclenann [47]), and far from the average value of mantle (17.5, Sun and McDonough [41]); negative anomalies for Nb and Ta also display the characteristics of continental crust. Inherited zircon is a valuable monitor for magma source [48]. Inherited zircon of biotite granite in the Gaudeanmus area has 207Pb/206Pb ages close to the determined age of Abbabis poly-cyclic basement granite-gneisses [20,21], which indicates that their material might have originated from this ancient basement or a similar old source region of lithosphere. Sr–Nd–Pb isotopic research can be used to infer the characteristic of the potential sources components for granitic magma [49]. The characteristic of Sr–Nd–Pb isotope also indicates that biotite granite is mainly derived from partial melting of ancient crustal rocks, with a lesser influence of mantle-derived materials.
In the Rb–Ba–Sr diagram [50] of the biotite granite (Figure 11), our samples of biotite granite plots mainly on the filed of clay-poor sources. According to the ratios of Al2O3/TiO2 and CaO/Na2O, strongly pre-aluminous granites were divided into four types, including European Alps, Himalayas, Hercynides, and Lachlan Fold Belt granites. Biotite granite samples have the characteristic of low ratios of Al2O3/TiO2 and CaO/Na2O, similar to the granites from Hercynides and Lachlan Fold Belt (Figure 11) [50]. Therefore, we draw a conclusion that the study area biotite granite samples are mainly derived from partial melting of ancient basement, clay-poor source rocks.

5.2. Petrogenesis

The studied Gaudeanmus area Biotite granite rocks have SiO2 contents ranging from 62.24% to 76.42%, high alkalis, and relatively rich potassium. A/CNK ratios for the biotite granite rocks vary from 0.98 to 1.10, exhibiting metaluminous characteristics. In the chondrite-normalised REE patterns, all biotite granite samples show a slightly LREE enriched pattern with negative Eu anomaly, suggesting it is derived from the crust. In the primitive mantle-normalised trace element spider diagram, biotite granite samples show similar trace element patterns, enriched in large-ion lithopile elements (Rb, Th, U, K, Pb), and depleted in high field-strength elements (Nb, Ta, Ti), indicating it is the characteristic of continental crust composition. However, Sr, Nd, and Pb isotopic compositions of biotite granite have large variation, indicating that the granites cannot form merely through partial melting of crust rocks, but formed by hybridisation process of mantle-derived magma and sialic magma [44]. The diagrams of SiO2–(87Sr/86Sr)i, SiO2–εNd(t) and Pb isotope also show the characteristics of an hybrid origin. The granite generally experienced strong crystallisation differentiation, after magma crystallization, such a small volume mantle material mixing/assimilation (forming hybrid-magma) would not significantly modify the major element composition of these rocks. Therefore, it is inferred that biotite granite likely formed by a hybrid process of mantle-derived magma and sialic magma.

5.3. Tectonic Environment and Petrogenetic Processes

Granite tectonic environment discrimination not only need, according to their geochemical characteristics, to a large extent, but also need to carry on a comprehensive research on many aspects of their own rock structural characteristics and tectonic background of output [51]. Biotite granite intrusions outcrop in the northwestern side of Gaudeanmus area, exhibiting the form of a batholith, but the outcrop area is relative small and the rock weakly foliated. The original structure near the contact zone is also disturbed, but shows the active emplacement of rock mass structure.
Previous studies suggested that the Khomasari craton subducted northward toward the Congo craton, and the Khomas Ocean began to close approximately between 580 and 570 Ma [52,53]. With the closure of the Khomas ocean, the continent to continent collision in the Damara belt occurred between 550 and 540 Ma, followed by the late- to post-tectonic granitic magmatic intrusion between 535 and 470 Ma [53]. As discussed earlier, the determined LA–ICP–MS zircon U–Pb age of biotite granite in the Gaudeanmus area is 540.2 ± 4 Ma (MSWD = 0.97), which represents the crystallisation ages of the zircon and the emplacement ages of the plutons.
In the process of magma crystallisation, similar elements with similar total distribution coefficient will not significantly change during partial melting or crystallisation, so these elements could be used to trace the magma source. In the Rb–(Yb + Ta) tectonic discrimination diagram (Figure 12) [54], the majority of our samples fall into the overlapping area of the syn-collision granites (syn-COLG), volcano arc granites (VAG), and post-collision granites (post-COLG). In the Rb/30–Hf–Ta × 3 tectonic discrimination diagram (Figure 12) [55], the majority of granite samples fall into the post-collision granites (post-COLG) field; basically all of the granite samples are located in the post-collision granites (post-COLG) area. Combined with the geochemical characteristics, rock structural characteristics, and tectonic background, we consider that the biotite granites in the Gaudeanmus area are formed in a post-Collision environment.
Therefore, we propose the formation mechanism of biotite granite may be as follows. The collision of Congo Craton and Kalahari craton resulted in crustal thickening, and later, when the geodynamic regime changed from compression to extension, lithospheric extension led to the partial melting of the mantle material. Underplating of mantle-drived magma produced a high temperature at the base of the crust, and induced massive anatexis of the Abbabis Complex to generate sialic magma. Thus, hybridization between the minor mantle-derived magma and massive sialic magmas form the hybrid magmas that evolved, coupled with assimilation of country crustal rocks during magma ascent, led to formation of the biotite granite in Gaudeanmus area at 540 Ma.

6. Conclusions

Combining the above determined LA–ICP–MS zircon U–Pb isotope chronology and characteristics with our determined whole rock geochemistry and Sr–Nd–Pb isotopic analyses of biotite granite samples collected from the Gaudeanmus study area, we reach the following conclusions:
(1)
LA–ICP–MS zircon U–Pb age of biotite granite in the Gaudeanmus area is 540.2 ± 4 Ma (MSWD = 0.97), which shows that intrusion was emplaced and crystallised in the earliest Cambrian (Terreneuvian epoch).
(2)
Whole rock geochemical analysis demonstrates that the study area biotite granite rocks were formed by hybrid process of mantle-drived magma and sialic magma, mainly derived from partial melting of ancient basement clay-poor source rocks. The biotite granite rocks in the Gaudeanmus area are formed in a post-Collision environment.
(3)
The geodynamic regime changed from compression to extension; lithospheric extension led to the partial melting of the mantle material. Underplating of mantle-derived magma induced massive anatexis of the Abbabis Complex to generate sialic magma. Hybridization between the minor mantle-derived magma and massive sialic magmas form the hybrid magmas that evolved, coupled with assimilation of country crustal rocks during magma ascent, led to formation of the biotite granite in Gaudeanmus area.

Author Contributions

Conceptualization, S.W. and H.F.; Methodology, S.W. And J.C.; Validation, J.C.; Formal Analysis and Data Curation, D.C.; Project Administration, H.F. All authors have read and agreed to the published version of the manuscript.

Funding

This study was supported by the China Geological Bureau of nuclear industry (201928-3), China National Nuclear Corporation (LTD1602) and the National Natural Science Foundation of China (41602080).

Acknowledgments

The authors would like to thank three anonymous reviewers for their comments and suggestions.

Conflicts of Interest

The authors declare no conflict of interest.

References

  1. Miller, R.G. The Pan-African Damara Orogen of South West Africa/Namibia. In Evolution of the Damara Orogen of South West Africa/Namibia; Miller, R.G., Ed.; Special Publications; Geological Society of South Africa: Johannesburg, South Africa, 1983; Volume 11, pp. 431–515. [Google Scholar]
  2. Haack, U.; Hoefs, J.; Gohn, E. Constraints on the origin of Damara granites by Rb/Sr and delta 18O data. Contrib. Mineral. Petrol. 1982, 79, 279–289. [Google Scholar] [CrossRef]
  3. Marlow, A.G. Geology and Rb–Sr Geochronology of Mineralised and Radioactive Granites and Alaskites, Namibia. In Evolution of the Damara Orogen of South West Africa/Namibia; Miller, R.G., Ed.; Special Publications; Geological Society of South Africa: Johannesburg, South Africa, 1983; Volume 11, pp. 289–298. [Google Scholar]
  4. Nex, P.A.M.; Kinnaird, J.A. Granites and their mineralization in the Swakop River area around Goanikontes, Namibia. Commun. Geol. Surv. Namib. 1995, 10, 51–56. [Google Scholar]
  5. Tack, L.; Bowden, P. Post-collisional granite magmatism in the central Damaran (Pan-African). J. Afr. Earth Sci. 1999, 28, 653–674. [Google Scholar] [CrossRef]
  6. Smith, D.A.M. The geology of the area around the Khan and Swakop Rivers in South West Africa. Mem. Geol. Surv. S. Afr. 1965, 1, 113. [Google Scholar]
  7. Jacob, R.E. Granite Genesis and Associated Mineralisation in Part of the Central Damara Belt. In Mineralisation in Metamorphic Terranes; Verwoerd, W.J., Ed.; Special Publications; Geological Society of South Africa: Johannesburg, South Africa, 1978; Volume 4. [Google Scholar]
  8. Miller, R.G. The Geology of Namibia; Special Publications; Geological Survey of Namibia: Windhoek, Namibia, 2008; Volumes I–II. [Google Scholar]
  9. Brandt, R. Preliminary report on the Stratigraphy of the Damara sequence and the geology and gochemistry of Damaran granites in an area between Walvis Bay and Karibib. Commun. Geol. Surv. Namib. 1985, 1, 31–43. [Google Scholar]
  10. Coward, M.P. The Tectonic History of the Damara Belt. In Evolution of the Damara Orogen of South West Africa/Namibia; Miller, R.G., Ed.; Special Publications; Geological Society of South Africa: Johannesburg, South Africa, 1983; Volume 11, pp. 409–421. [Google Scholar]
  11. Oliver, G.J.H. Mid-crustal detachment and domes in the central zone of the Damaran Orogen, Namibia. J. Afr. Earth Sci. 1994, 19, 331–344. [Google Scholar] [CrossRef]
  12. Corner, B. An Interpretation of the Aeromagnetic Data Covering the Western Portion of the Damara Orogen in South West Africa/Namibia. In Evolution of the Damara Orogen of South West Africa/Namibia; Miller, R.G., Ed.; Special Publications; Geological Society of South Africa: Johannesburg, South Africa, 1983; Volume 11, pp. 339–354. [Google Scholar]
  13. Nex, P.A.M.; Kinnaird, J.A.; Oliver, G.J.H. Petrology, geochemistry and mineralisation of post-collisional magmatism around Goanikontes, southern Central Zone, Damara Orogen, Namibia. J. Afr. Earth Sci. 2001, 33, 481–502. [Google Scholar] [CrossRef]
  14. Nex, P.A.M.; Oliver, G.J.H.; Kinnaird, J.A. Spinel-bearing assemblages and P–T–t evolution of the Central Zone of the Damara Orogen, Namibia. J. Afr. Earth Sci. 2001, 32, 471–489. [Google Scholar] [CrossRef]
  15. Gao, Y.; Fan, H.H.; Chen, D.H.; Nie, J.T.; Wang, S.Y. The Alaskite-type Uranium Deposit: A Product of Coupling of Tectonism with Magmatism. Geol. Explor. 2012, 48, 1058–1066. [Google Scholar]
  16. Basson, I.J.; Greenway, G. The Rössing Uranium Deposit: A product of late-kinematic location of uraniferous granites in the Central Zone of the Damara Orogen, Namibia. J. Afr. Earth Sci. 2004, 38, 413–435. [Google Scholar] [CrossRef]
  17. Kinnaird, J.A.; Nex, P.A.M. A review of geological controls on uranium mineralization in sheeted leucogranites within the Damaran Orogen, Namibia. Appl. Earth Sci. 2007, 116, 68–85. [Google Scholar] [CrossRef]
  18. Jacob, R.E.; Kroner, A.; Burger, A.J. Areal extent and first U–Pb age of the Pre-Damara Abbabis complex in the central Damara belt of South West Africa (Namibia). Geol. Rund. 1978, 67, 706–718. [Google Scholar] [CrossRef]
  19. Robb, L.J. Uraniferous Leucogranites from the Namaqualand Metamorphic Complex: Part 1–Geology, Geochemistry and Petrogenesis. In Mineral Deposits of South Africa; Anhaeusser, C.R., Maske, S., Eds.; Mineral Deposits of South Africa: Johannesburg, South Africa, 1986; Volume 2, pp. 1609–1628. [Google Scholar]
  20. Kröner, A.; Retief, E.A.; Compston, W.; Jacob, R.E.; Burger, A.J. Single-age and conventional zircon dating of remobilised basement gneisses in the central Damara belt of Namibia. S. Afr. J. Geol. 1991, 94, 379–387. [Google Scholar]
  21. Foster, D.A.; Goscombe, B.D.; Newstead, B.; Mapani, B.; Mueller, P.A.; Gregory, L. Muvangua, E. U–Pb age and Lu-Hf isotopic data of detrital zircons from Neoproterozoic Damara sequence: Implications for pre-Gondwana proximity of Congo and Kalahari. Gondwana Res. 2015, 28, 179–190. [Google Scholar] [CrossRef] [Green Version]
  22. Kukla, P.A.; Stanistreet, I.G. Record of the Damaran Khomas Hochland accretionary prism in central Namibia: Refutation of an “ensialic” origin of a Late Proterozoic orogenic belt. Geology 1991, 19, 473–476. [Google Scholar] [CrossRef]
  23. Hoffman, P.F.; Hawkins, D.P.; Isachsen, C.E.; Bowring, S.A. Precise U–Pb zircon ages for early Damaran magmatism in the Summas Mountains and Weltwitschia Inlier, northern Damara belt, Namibia. Commun. Geol. Surv. Namib. 1996, 11, 47–52. [Google Scholar]
  24. Hoffman, P.F.; Kaufman, A.J.; Halverson, G.P.; Schrag, D.P. A Neoproterozoic snow-ball earth. Science 1998, 281, 1342–1346. [Google Scholar] [CrossRef] [Green Version]
  25. Hoffmann, K.H.; Condon, D.J.; Bowring, S.A.; Crowley, J.L. U–Pb zircon date from the Neoproterozoic Ghaub Formation, Namibia: Constraints on Marinoan glaciation. Geology 2004, 32, 817–820. [Google Scholar] [CrossRef]
  26. Henry, G. The Sedimentary Evolution of the Damara Sequence in the Lower Khan River Valley, Namibia. Ph.D. Thesis, University of the Witwatersrand, Johannesburg, South Africa, 1992. [Google Scholar]
  27. DeKock, G.S.; Eglington, B.; Armstrong, R.A.; Harmerand, R.E.; Walraven, F. U–Pb and Pb–Pb ages of the Naauwpoort rhyolite, Kawakeup leptite and Okongava Diorite: Implications for the onset of rifting and of orogenesis in the Damara belt, Namibia. Commun. Geol. Surv. Namib. 2000, 12, 81–88. [Google Scholar]
  28. Wang, S.Y.; Fan, H.H.; Chen, J.Y.; Gu, D.Z.; Chen, D.H.; Gao, Y.; Nie, J.T. Petrogenesis and tectonic setting of porphyritic granites in the Gaudeanmus Area, Namibia. Glob. Geol. 2013, 32, 773–782. [Google Scholar]
  29. Song, B.; Zhang, Y.H.; Wan, Y.S.; Jian, P. Mount making and procedure of the SHRIMP dating. Geol. Rev. 2002, 48, 26–30. [Google Scholar]
  30. Jackson, S.E.; Pearson, N.J.; Griffin, W.L.; Belousova, E.A. The application of laser ablation- inductively coupled plasma-mass spectrometry to in situ U–Pb zircon geochronogy. Chem. Geol. 2004, 211, 47–69. [Google Scholar] [CrossRef]
  31. Liu, Y.S.; Hu, Z.C.; Gao, S.; Günther, D.; Xu, J.; Gao, C.G.; Chen, H.H. In situ analysis of major and trace elements of anhydrous minerals by LA-ICP-MS without applying an internal standard. Chem. Geol. 2008, 257, 34–43. [Google Scholar] [CrossRef]
  32. Anderson, T. Correction of common lead in U–Pb analyses that do not report 204Pb. Chem. Geol. 2002, 192, 59–79. [Google Scholar] [CrossRef]
  33. Ludwig, K.R. User’s Manual for Isoplot 3.0.: A Geochronological Tolkit for Microsoft Excel; Special Publication; Berkeley Geochronology Center: Berkeley, CA, USA, 2003; pp. 1–71. [Google Scholar]
  34. Norrish, K.; Hutton, J.T. An accurate X-ray spectrographic method for the analysis of a range of geological samples. Geochim. Cosmochim. Acta 1969, 33, 431–453. [Google Scholar] [CrossRef]
  35. Qu, X.M.; Hou, Z.Q.; Li, Y.G. Melt components derived from a subducted slab in late orogenic ore-bearing porphyries in the Gangdese copper belt, southern Tibetan Plateau. Lithos 2004, 74, 131–148. [Google Scholar] [CrossRef]
  36. Zhang, L.G.; Xing, F.M. Feldspar Pb isotopic compositions and geological significance of Mesozoic granites in Anhui province. Acta Petrol. Sin. 1993, 9, 254–257. [Google Scholar]
  37. Koschek, G. Origin and significance of the SEM cathodoluminescence from zircon. J. Microsc. 1993, 171, 223–232. [Google Scholar] [CrossRef]
  38. Wu, Y.B.; Zheng, Y.F. Zircon genetic mineralogy and its constraint on application of zircon U–Pb dating result. Chin. Sci. Bull. 2004, 49, 1589–1604. [Google Scholar]
  39. Belousova, E.; Griffin, W.; O’Reilly, S.Y.; Fisher, N. Igneous zircon: Trace element composition as an indicator of source rock type. Contrib. Mineral. Petrol. 2002, 143, 602–622. [Google Scholar] [CrossRef]
  40. Peccerillo, A.; Taylor, S.R. Geochemistry of Eocene Calc-alkaline volcanic rocks from the Kastamonu Area, Northern Turkey. Contrib. Mineral. Petrol. 1976, 58, 63–81. [Google Scholar] [CrossRef]
  41. Sun, S.S.; McDonough, W.F. Chemical and isotopic systematic of oceanic basalts: Implications for mantle composition and processes. Geol. Soc. 1989, 42, 313–345. [Google Scholar] [CrossRef]
  42. Li, X.H.; McCulloch, M.T. Secular variation in the Nd isotopic composition of Neoproterozoic sediments from the southern margin of Yangze Block: Evidence for a Proterozoic continental collision in southease China. Precambrian Res. 1996, 76, 67–76. [Google Scholar] [CrossRef]
  43. Shen, W.Z.; Ling, H.F.; Li, X.W.; Huang, X.L.; Wang, D.Z. Study on the Nd–Sr Isotopic Compositions of Granitoids in SE China. Geol. J. China Univ. 1999, 5, 22–32. [Google Scholar]
  44. Wei, J.Y.; Wang, Y.G. Isotope Geochemistry; Geological Publishing House: Beijing, China, 1988; pp. 19–36. [Google Scholar]
  45. Jahn, B.M.; Wu, F.Y.; Lo, C.H.; Tsai, C.H. Crust-mantle interaction induced by deep subduction of the continental crust: Geochemical and Sr–Nd isotopic evidence from post-collisional mafic-ultramafic intrusions of the northern Dabie complex, central China. Chem. Geol. 1999, 157, 119–146. [Google Scholar] [CrossRef]
  46. Zartman, R.E.; Doe, B.R. Plumbotectonics: The model. Tectonophysics. 1981, 75, 135–162. [Google Scholar] [CrossRef]
  47. Taylor, S.R.; Mclenann, S.M. The Continetal Crust: Its Composition and Evolution; Blackwell Scientific Publication: Oxford, UK, 1985; pp. 1–32. [Google Scholar]
  48. Keay, S.; Steele, D.; Compostn, W. Identifying granite sources by SHRIMP U–Pb zircon geochronology: An application to the Lachlan foldbelt. Contrib. Mineral. Petrol. 1999, 137, 323–341. [Google Scholar] [CrossRef]
  49. Li, C.N. Trace Element Lithology of Magmatic Rock; China University of Geoscience Press: Wuhan, China, 1992; pp. 1–195. [Google Scholar]
  50. Sylvester, P.J. Post-collisional strongly peraluminous granites. Lithos 1998, 45, 29–44. [Google Scholar] [CrossRef]
  51. Gong, R.X.; Lu, C.Z. Petrogeochemistry of Late Mesozoic alkali-rich potassium-high granitoid in western Zhejiang and its significance. Acta Petrol. Sin. 2008, 24, 2343–2351. [Google Scholar]
  52. Goscombe, B.; Gray, D.; Armstrong, R.; Foster, D.A.; Vogl, J. Event geochronology of the pan-african kaoko belt, namibia. Precambrian Res. 2005, 140, 103–131. [Google Scholar] [CrossRef]
  53. Gray, D.R.; Foster, D.A.; Goscombe, B.; Passchier, C.W.; Trouw, R.A.J. 40Ar/39Ar thermochronology of the Pan-African Damara Orogen, Namibia, with implications for tectonothermal and geodynamic evolution. Precambrian Res. 2006, 150, 49–72. [Google Scholar] [CrossRef]
  54. Pearce, J.A.; Harris, N.B.W.; Tindle, A.G. Trace element discrimination diagrams for the tectonic interpretation of granitic rocks. J. Petrol. 1984, 25, 956–983. [Google Scholar] [CrossRef] [Green Version]
  55. Harris, N.B.W.; Pearce, J.A.; Tindle, A.G. Geochemical characteristics of collision-zone magmatism. Geol. Soc. 1986, 19, 67–81. [Google Scholar] [CrossRef]
Figure 1. Map illustrating the principal subdivisions of the Damara Orogen based on Gao et al. [15] showing the location of significant uranium anomalies within the Central Zone.
Minerals 10 00076 g001
Figure 2. Geological map of Gaudeanmus area, Namibia (based on Wang et al. [28]).
Minerals 10 00076 g002
Figure 3. Field photograph and microphotograph for the biotite granite in the Gaudeanmus area, Namibia. (a) Alaskite intruding into biotite granite; (b) myrmekite develops at plagioclase and K-feldspar grain boundaries, crossed polarised light. Pl—plagioclase, Mc—microcline, My—myrmekite, Ser—sericite, Qz—quartz.
Minerals 10 00076 g003
Figure 4. (a) Cathodoluminescence (CL) images of selected zircon grains for representative biotite granite samples, also shown are locations of analysis spots (shown as small red circles); (b) U–Pb concordia diagrams; and (c) a line graph of determined U–Pb ages.
Minerals 10 00076 g004
Figure 5. SiO2–K2O diagram (a) and aluminous index diagram (b) for Biotite granite (after Peccerillo and Taylor [40]).
Minerals 10 00076 g005
Figure 6. Harker variation diagrams for biotite granite samples.
Minerals 10 00076 g006
Figure 7. Chondrite-normalised rare-earth element (REE) patterns and primitive mantle-normalised trace element patterns for the studied biotite granite samples (the normalization factors after Sun and McDonough [41]).
Minerals 10 00076 g007
Figure 8. εNd(t)–(87Sr/86Sr) diagram for biotite granite in the Gaudeanmus area, Namibia (after Janh et al. [45]). UM—upper mantle peridotites, UCC—upper continental crust, MCC–LCC—middle to lower crust data of middle crust.
Minerals 10 00076 g008
Figure 9. SiO2–(87Sr/86Sr) (a) and SiO2–εNd(t) (b) diagram for biotite granite in the Gaudeanmus study area, Namibia.
Minerals 10 00076 g009
Figure 10. Pb isotopic diagram for biotite granite samples from the Gaudeanmus study area (after Zartman and Doe [46]).
Minerals 10 00076 g010
Figure 11. Rb/Ba–Rb/Sr and Al2O3/TiO2–CaO/Na2O diagram of the biotite granite (after Sylvester, [50]).
Minerals 10 00076 g011
Figure 12. Discrimination diagram for tectonic settings of the biotite granite. (Rb–Yb+Ta diagram after peatce et al., [54]; Rb/30–Hf–Ta × 3 after Harris et al., [55]). ORG—ocean ridge granites; post-COLG—post-collision granites; syn-COLG—syn-collision granites; VAG—volcanic arc granites; WOG—within plate granites.
Minerals 10 00076 g012
Table 1. Sampling location of biotite granites in the Gaudeanmus area.
Sample No.LocationSample No.Location
10H-9E 15°2′41.99′′S 22°22′59.52′′10H-38E 15° 5′16.25′′S 22°24′08.96′′
10H-25E 15°4′45.70′′S 22°22′31.02′′11H-33E 15° 2′46.72′′S 22°22′11.95′′
11H-30E 15°6′20.28′′S 22°22′32.96′′
Table 2. LA–collector inductively plasma (ICP)–mass spectrometer (MS) zircon U–Pb isotopic data for representative samples of biotite granites from the Gaudeanmus study area.
SampleThUTh/UIsotopic Ratios Isotopic Ages (Ma)
Content (ppm)207Pb/206Pb207Pb/235U206Pb/238Urho207Pb/206Pb207Pb/235U206Pb/238UConcordance
11H-30-12187490.290.065610.001490.694800.011480.076790.000620.48559794.448535.77476.9488%
11H-30-2701860.380.064040.000960.697730.036780.079080.004401.05488742.633537.422490.62690%
11H-30-3923110.290.060090.000470.698940.011630.084320.001220.86927605.621538.27521.9796%
11H-30-4541460.370.128120.000583.543510.064040.200590.003600.992082072.581537.0141178.51973%
11H-30-52519860.250.077150.000480.484480.014030.045540.001300.986751125.08401.110287.1866%
11H-30-61283800.340.066430.001060.664320.040210.072440.004080.93126820.433517.325450.82586%
11H-30-72123900.540.079810.000780.876590.031520.079910.003201.113621192.320639.117495.61974%
11H-30-8701010.700.116760.000694.602430.089840.285730.005360.961261907.1101749.7161620.22792%
11H-30-91373480.390.061050.000300.739860.011030.087890.001240.94299642.69562.36543.1796%
11H-30-101283500.370.060100.000280.725100.010810.087390.001210.92470605.69553.76540.1797%
11H-30-11472270.210.059200.000980.622350.027860.076220.003180.93341576.035491.317473.51996%
11H-30-1257660.860.073690.000441.673510.032050.164380.002890.918801033.018998.512981.11698%
11H-30-131143780.300.061010.000480.741680.019360.088020.002090.91059638.912563.411543.81296%
11H-30-14872310.380.059870.000300.732620.008730.088800.001000.94037598.211558.15548.5698%
11H-30-151102690.410.061470.000300.746760.009960.088080.001100.93704657.45566.36544.2796%
11H-30-16932710.340.061890.000490.734210.019120.085990.002110.94255670.117559.011531.81395%
11H-30-172426370.380.059750.000220.724330.009350.087960.001141.00085594.512553.26543.5798%
11H-30-183065730.530.082310.000440.695520.009460.061360.000820.981831253.711536.16383.9566%
11H-30-19106881.210.058300.000560.702140.012360.087330.001280.83540542.620540.17539.8899%
11H-30-202005050.400.059100.000300.721510.011530.088490.001310.92722572.311551.67546.6899%
11H-30-211082260.480.058110.000320.709390.011140.088530.001330.95637600.013544.47546.9899%
11H-30-222647540.350.078550.000640.539870.011370.050150.001201.140891161.115438.37315.5767%
11H-30-23401860.220.057950.001420.484660.030360.060600.002320.61040527.858401.321379.31494%
11H-30-241913800.500.060220.000380.737640.029770.088850.003580.99902613.018561.017548.72197%
11H-30-2540312400.330.069200.000630.563770.035150.059000.003460.93952905.619454.023369.62179%
11H-30-261322640.500.068930.000800.657140.019730.069130.001860.89563898.224512.912430.91182%
11H-30-2759421.420.057370.000930.689480.018810.087110.001940.81616505.632532.511538.41298%
11H-30-282121541.380.061420.000300.951390.008810.112430.000970.92911653.711678.85686.9698%
11H-30-291152470.460.073090.000860.745500.013500.073940.000800.598401016.724565.68459.8579%
11H-30-301232420.510.060970.000480.728170.008590.086590.000700.68248638.917555.55535.4496%
Table 3. Major (oxide wt%) and trace (in ppm) element contents of biotite granites in the Gaudeanmus area.
Sample10H-910H-2511H-3010H-3811H-33Sample10H-910H-2511H-3010H-3811H-33
SiO262.2465.2774.5976.4269.85Cs4.466.471.683.892.16
Al2O314.4414.3613.8811.1713.25Ba704.00814.00377.00239.00481.00
Fe2O3T8.386.440.961.345.85Ta1.491.421.460.612.33
MnO0.130.100.020.020.01Tl0.861.281.160.930.96
MgO2.472.270.280.590.07Pb13.5024.1051.5039.2035.00
CaO3.673.100.790.890.74Bi0.070.070.0223.701.00
Na2O2.692.723.422.403.00Th18.5032.0014.2026.2022.10
K2O3.383.745.195.215.90U1.503.924.684.365.47
TiO21.371.040.120.200.23Zr211.00188.00140.00189.00334.00
P2O50.380.220.110.100.03Hf5.054.934.695.459.80
LOI0.700.600.501.350.92W4.690.280.070.520.41
TOTAL99.8599.8699.8699.6999.85Rb/Sr0.831.143.400.762.38
FeO5.354.000.400.850.10Sr/Ba0.270.220.190.700.20
Na2O + K2O6.076.468.617.618.90Nb/Ta18.0514.867.6710.6713.43
K2O/Na2O1.261.381.522.171.97La62.3083.8019.6038.9032.50
A/NK1.791.681.231.161.17Ce125.00155.0038.2075.2053.20
A/CNK0.981.011.091.001.05Pr15.2018.004.418.755.91
DI64.0869.6593.0792.2288.31Nd56.1064.9016.3030.1021.80
Li35.2053.6026.0025.609.66Sm11.5010.803.585.994.45
Be4.033.353.500.443.66Eu1.951.560.570.491.33
Sc16.2012.703.933.855.59Gd10.008.182.934.813.57
V97.7092.208.9111.405.81Tb1.671.180.590.800.68
Cr41.6048.101.7615.300.89Dy9.095.983.433.894.05
Co16.4015.401.371.050.15Ho1.700.990.680.580.74
Ni18.7022.401.031.590.56Er4.702.492.031.402.37
Cu27.7024.301.182.779.06Tm0.740.310.330.190.42
Zn107.0097.5021.0040.407.87Yb4.241.702.011.113.11
Ga23.4022.2016.5012.9019.20Lu0.600.250.300.180.45
Rb156.00209.00247.00128.00234.00Y43.8025.4019.6016.2012.70
Sr189.00183.0072.60168.0098.40ΣREE304.79355.1494.95172.38134.58
Nb26.9021.1011.206.5031.30LREE272.05334.0682.66159.43119.19
Mo0.330.700.420.071.64HREE32.7421.0812.2912.9615.39
Cd0.190.130.020.070.05LREE/HREE8.3115.856.7312.307.74
In0.100.090.030.060.02(La/Yb)N10.5435.366.9925.147.50
Sb0.030.020.800.040.44δEu0.540.490.520.270.99
A/CNK = Al2O3/(CaO + Na2O + K2O) (Molecules number); A/NK = Al2O3/(Na2O + K2O) (molecules number); DI (differentiation index) = quartz + orthoclase + albite + nepheline + leucite + kalsilite; (La/Yb)N = (La/La*)/(Yb/Yb*); δEu = 2 × (Eu/Eu*)/[(Sm/Sm* + Gd/Gd*)], (wt% 10−6). La*, Yb*, Eu*, Sm*, Gd*: Elements content in chondrite. LREE = La + Ce + Pr + Nd + Sm + Eu, HREE = Gd + Tb + Dy + Ho + Er + Tm + Yb + Lu. REE: rare-earth elements.
Table 4. Sr, Nd, and Pb isotopic compositions of biotite granite samples investigated as part of this study.
Sample10H-910H-2511H-3010H-38
Rb(×10−6)154208179111
Sr(×10−6)206163178184
(87Rb/86Sr)m2.16833.68442.90821.7482
(87Sr/86Sr)m0.7306890.7436870.7373240.731132
±2σ0.0000110.0000130.0000110.000011
(87Sr/86Sr)0.714000.715330.714940.71768
εSr(t)144.0 162.9 157.3 196.2
Sm(×10−6)11.62.3210.66.43
Nd(×10−6)60.88.366.532.3
(147Sm/144Nd)m0.1150.16930.09650.1203
(143Nd/144Nd)m0.5118820.5119250.5118330.512003
±2σ0.0000080.0000090.0000070.000008
(143Nd/144Nd)0.5114750.5113260.5114920.511577
fSm/Nd−0.42−0.14−0.51−0.39
εNd(0)−14.7−13.9−15.7−12.4
εNd(t)−9.1−12.0−8.8−7.1
TDM11955417417111870
TDM22000223519741838
Th/ppm18.532.014.226.2
U/ppm1.53.94.74.4
Pb/ppm13.524.151.539.2
206Pb/204Pb18.085118.136219.275719.0383
±2σ0.00070.00060.00070.0007
207Pb/204Pb15.634715.625815.726915.6930
±2σ0.00060.00050.00070.0006
208Pb/204Pb40.560738.839338.743739.1044
±2σ0.00170.00140.00190.0016
(206Pb/204Pb)t17.359617.097818.686518.3163
(207Pb/204Pb)t15.592415.565215.692615.6509
(208Pb/204Pb)t37.767436.193238.185637.7501
Notes: εNd = ((143Nd/144Nd)s/(143Nd/144Nd)CHUR − 1) × 10,000, fSm/Nd = (147Sm/144Nd)m/(147Sm/144Nd)CHUR − 1, m = sample, (143Nd/144Nd)CHUR = 0.512638, and (147Sm/144Nd)CHUR = 0.1966. Model age tDM1=1/λ × ln(1 + ((143Nd/144Nd)s − 0.51315/(147Sm/144Nd)s − 0.2137)). tDM2 = tDM1 − (tDM1 − t)(fccfs))/(fccfDM); fcc, fs, and fDM represent the fSm/Nd average for crust, sample, and depleted mantle respectively; fcc = −0.4, fDM = 0.08592, t = rock age. −0.6 < fSm/Nd < −0.2, use tDM1, fSm/Nd < −0.6 or > −0.2, use tDM2.

