Article

Distribution Characteristics and Influencing Factors of Uranium Isotopes in Saline Lake Waters in the Northeast of Qaidam Basin

1
College of Urban and Environmental Sciences, Northwest University, Xi’an 710127, China
2
School of Human Settlements and Civil Engineering, Xi’an Jiao Tong University, Xi’an 710061, China
3
Research Center for Earth System Science, Yunnan University, Kunming 650500, China
4
State Key Lab of Loess and Quaternary Geology, Institute of Earth Environment, Chinese Academy of Sciences, Xi’an 710061, China
5
Department of Earth and Environmental Sciences, University of Minnesota, Minneapolis, MN 55455, USA
6
School of Geography, Nanjing Normal University, Nanjing 210023, China
*
Authors to whom correspondence should be addressed.
Minerals 2020, 10(1), 74; https://doi.org/10.3390/min10010074
Submission received: 28 November 2019 / Revised: 28 December 2019 / Accepted: 11 January 2020 / Published: 17 January 2020
(This article belongs to the Special Issue Mineral and Geochemical Composition of Lake Sediments)

Abstract

:
Four saline lakes in the northeast of Qaidam Basin were selected to explore the distribution characteristics and influencing factors of uranium isotopes in lake waters with high evaporation background. The 238U concentration and the activity ratios of 234U/238U ([234U/238U]AR) showed that there was no significant change in the same lake, but there was a certain degree of difference in the distribution between different lakes. We found that aqueous 238U concentration within a certain range increased with an increase in TDS (total dissolved solid) and salinity, as was also the case with pH. As in natural waters, the pH affects the speciation of 238U, but TDS and salinity affect the adsorption process of aqueous 238U. Further, the replenishment of water will also affect the uranium isotope concentration for lakes, but it is not the main influencing factor for saline lakes. Therefore, we suggest that pH is the dominant factor affecting changes in aqueous 238U concentration of the sampled saline lakes. The [234U/238U]AR in these saline lakes are closely related to the input water and the associated water–rock interactions involving sediments, atmosphere dust, and organic material, etc. during the evolution stage, metamorphous degree, and hydrochemistry of the saline lakes. Lake water samples collected in the maximum and minimum discharge water period, were used to evaluate the seasonal distribution characteristics of aqueous 238U, and we found that 238U concentration did not show an evident change with the seasons in these saline lakes. If the 238U concentration and [234U/238U]AR can remain consistent during a period of time, then the sediment ages and/or sedimentation rates could be determined by lake sediment and/or biogenic carbonate in future, thus allowing for the accurate reconstruction of the paleoclimate and paleoenvironment.

1. Introduction

In natural conditions, uranium (U) mainly exists as three isotopes: 234U, 235U, and 238U. Among them, 235U and 238U have long half-lives with high abundance, and the content ratio of 238U/235U = 137.832 [1]. Further, 234U has the shortest half-life, and the atomic abundance of 234U is about five orders of magnitude lower than that of 238U [2]. Uranium isotopes are widely used as a typical tracer in the dating of various oceanographic processes and in the study of sources of dissolved solutes in river basins [3,4,5,6,7,8].
Studies of the distribution characteristic of uranium isotopes have mainly focused on glacial sedimentation at the two poles and oceanic circulation [9,10] and recent research has still mainly focused on the oceans. Existing research results show that the uranium concentration of seawater has a relatively consistent, linear relationship with salinity [11,12]. Some scholars have tried to convert oceanographic methods to inland areas, but inland research has focused on rivers and estuaries [13,14,15], river bends [16], and lakes [17], while very few studies have explored the uranium content and uranium isotopes in saline lakes.
Limited studies on hydrological systems in saline lakes have been conducted and research methods have been systematically developed. The research dates back to Osmond, et al. [18] who established a two-end mixing model based on the relationship between 234U/238U, 1/U, and U/TDS (total dissolved solids) in the water of Sambhar lake. They found that one end of the lake had a low uranium content and low salinity, while the other end had the opposite. Yadav et al. [19]. explored the U/TDS relationship in different aqueous media (including river water, lake water, and inter-crystal brine) of the Sambhar saline lake during different periods of the year, finding that there was a strong linear relationship between aqueous U concentration and TDS, which was consistent with the two-end mixing model established by Osmond et al. [18]. Moreover, Yadav, et al. [19] mentioned that the seasonal distribution difference of uranium isotopes was mainly controlled by the process of water dilution and evaporation. Borole et al. [20] studied the two major water systems of Narbada and Tapti in the west coast of India and showed that the abundance ratio of the aqueous uranium content to the sum of the main cations was similar to that found in typical crustal rocks. Due to the process of evaporation and solute concentration in saline lakes, the aqueous uranium content is generally higher than that in freshwater lakes.
Reports of saline lakes in high uranium environments are limited. Since the 1950s, Zheng [21] has carried out extensive and in-depth research on saline lakes in the Qinghai-Tibet Plateau. Zhang [22] found that, in the mining of lithium, boron, potassium, and magnesium from the Qaidam Basin, both uranium and thorium could be enriched, meaning that uranium enrichment is one of the basic characteristics of the saline lakes of northwestern China. The concentration of uranium of soda lakes in Mongolia is 57~15,000 μg/L [23], 320 μg/L in Gasikule salt lake in Qaidam Basin [24], and 13.4 μg/L in Qinghai Lake [25]. The potential mechanism of high uranium content in a saline lake has also been explored. For example, Benjamin et al. [23] and Isupova et al. [26] found that there exist high concentrations of uranium(U) in soda lake basins with groundwater-fed hyperalkaline. Hence, uranium-rich groundwaters are concentrated by evaporation and the U(VI) is chelated by CO 3 2 to form the highly soluble UO2(CO3 ) 3 4 in water, which is the main cause of the enrichment of uranium content in lakes in northwestern Mongolia. Strakhovenko et al. [27] showed that biogeochemical processes have an impact on the mobility of uranium species. Andersson et al., [28] showed that the behavior of colloids suspended phase and colloids are beneficial for the removal of U at very low salinities. Koch-Steindl and Pröhl, [29] indicate that the mobility of U is influenced by sorption and complexation processes on inorganic soil constituents such as clay minerals, oxides, organic matter, and biological fixation and transformation. Fredrickson et al. [30] indicated that the Mn (III/IV) oxides in particular may significantly inhibit the microbial reduction of U(VI) and its subsequent precipitation as UO2(s). Belli et al. [31] thought that a certain number of OM and/or competing cations of iron (such as Ca2+ and Mg2+) may inhibit the adsorption effect of uranium complex on iron hydroxide.
In high-salinity environments, such high uranium features make it possible to extract uranium resources from saline lake brine. In addition, no matter when it is processed, boron lithium potassium salt products or waste liquid discharge will affect the product quality or pollute the environment.
Thus, it is necessary to determine the distribution characteristics of aqueous uranium isotopes in lakes with different salinity gradients in order to understand the influencing factors of uranium isotope distribution in lake waters. Previous research has shown that ion concentrations, TDS, salinity, pH, and biogeochemical process are factors that influence the aqueous uranium content distribution and the [234U/238U]AR. For this study, we selected several lakes of different salinities with low human disturbance in the northeast of Qaidam Basin of the Qinghai-Tibet Plateau for water chemistry (anions, cation, TDS, salinity, and pH) and uranium isotope analysis to gain insight on the overall distribution pattern and possible seasonal variations in the distribution characteristics of uranium in the saline lakes of China. In particular, we wanted to gain insights into the controlling factors and underlying mechanism of aqueous uranium concentrations in the lakes and to explore the potential environmental applications of uranium isotopes with the goal of promoting the widespread use of radioactive isotopes as environmental indicators.

2. Materials and Methods

2.1. Sampling Locations

There are many lakes in the Qaidam Basin and most of them are saline lakes. The water samples in this study were collected from four lakes of different salinities in the northeast of Qaidam Basin: Gahai lake (GH), Keluke lake (KLK), Tuosu lake (TS), and Xiligou lake (XLG). In order to further explore the influence of water sources on the uranium isotope of KLK lake, we obtained some water samples from the Bayin river (BY). These sampling locations are shown in Figure 1. Two sampling sites were established in XLG: one (XLG 1) in the center of the lake, and the other (XLG 2) in a shallow pool next to the lake, with the pool water mainly originating from natural precipitation with water quality indicators similar to those of KLK. The XLG 2 pool samples can therefore be regarded as freshwater lake samples. All five sampling sites could be roughly divided into two categories: freshwater lake and saline lakes, with the former consisting of KLK and XLG 2, and the latter GH, TS, and XLG 1. The study area belongs to the typical alpine continental climate, characterized by a large temperature difference between day and night, low precipitation, and high drought throughout the year. The main vegetation types are alpine meadows and alpine steppes. The overall elevation of the area is about 3000 m.
According to data from the National Meteorological Station of Delhi city, Han [32] determined that the mean annual precipitation over the period of 1961–2017 was 185.1 mm, and the mean annual evaporation ranged between 2242.8–2439.4 mm. Precipitation is uneven during the year, showing a unimodal distribution. Maximum precipitation occurs in June–July, and the minimum precipitation occurs in December. The total area of GH is about 37 km2 with a mean water depth of 8 m and a maximum water depth of 15 m. The lake basin has no perennial surface rivers, relying on atmospheric precipitation and subsurface runoff to supply water. TS has a total area of about 180 km2 and a maximum water depth of 25.7 m, with the water mainly originating from the drainage of the TS waters, atmospheric precipitation, and groundwater [21,24].
The Bayin river originates from the northern foot of the ZongWu Long Mountain which has a total length of 188 km and a drainage area of 7281 km2. The main water supply source in the upper reaches of the Bayin river is natural precipitation, and in lower reaches is groundwater. After the Bayin river flows out of the ZongWu Long Mountain, a great deal of river water infiltrates into the ground water because the sediments on the riverbed in the Gobi Desert are mostly gravel. Then, the river passes through Delhi city. The infiltration process of river water was prevented by the hardening of the riverbed in Delhi city. After the river flows out of the city, the infiltration process of the river recommences. When the groundwater flows near a tree, a large amount of groundwater overflows into a pool of springs and becomes the main supply water source of the Bayin river, because of the lithological thinning and the blocking effect of the Denan hills. Then, the river water and the groundwater flow into the Keluke lake. Eventually, the Bayin river leaves Keluke lake and flows into Tuosu lake [33,34].

2.2. Sampling Design and Methods

The samples were collected in three batches. The analysis of the first batch of samples showed no significant differences in the horizontal or vertical distribution of aqueous 238U within the same lake, indicating a homogenous distribution of 238U in the water column, such kind of phenomenon has also been showed in the published Qinghai Lake data [25]. Based on this feature, we suggest that one single sample was deemed representative of the whole water column. Therefore, we collected only limited samples in the second and third of batch samplings. The sampling information of each sample was presented in Table 1.
The sampling area is shown in Figure 1. We selected these sampling periods because water inputs northeast of the Qaidam Basin exists in greater variation, and during other seasons are almost covered with ice coverage. Thus, these sampled lake waters could show typical saline lake water uranium distribution characteristics.
The surface water dozens of meters off the shore was collected into HDPE (High Density Polyethylene) plastic bottles (Nalgene 2002-0032) from the depth of 10 cm below surface water by hand with Derma Free® Vinyl Gloves. We collected other samples from various depths using PMMA (Polymethyl Methacrylate) water collectors and placed into HDPE plastic bottles (Nalgene, 2002-0032). After collection, about 1000 mL of each water sample was filtered through a mixed cellulose filter membrane (0.8-μm pore size, Millipore AAWP04700) with a manual vacuum filter system (Nalgene, 300-4100; Nalgene, 6133-0010), and the filtrate was stored for later analysis.

2.3. Analytical Methods

Samples analysis for water chemistry parameters (anions, cations, salinity, TDS, and pH) were carried out at the Key Laboratory of Surface System and Environmental Carrying Capacity of Shaanxi Province, Northwest University. Anion and cation concentrations of the samples were determined using two Dionex AQUION ICs [35,36]. Conductivity (ms/cm), TDS (g/L), salinity (‰), and pH were determined using a Mettler-Toledo Five Easy Plus pH meter. Uranium isotopes in the samples were measured at the Xi’an Jiaotong University Isotope Laboratory. Methods of investigation of uranium isotopes mainly include chemical separation and instrument analysis. The chemical separation process mainly includes the digestion process, centrifugal coprecipitation, ion exchange resin separation, uranium isotope collection, and purification. The steps involved are as follows. To analyze the U isotopic compositions of the water, the acidified aliquots of each sample were spiked with 233U–236U–229Th, preconcentrated and digested with HNO3 and HClO4, and then co-precipitated with Fe oxyhydroxide. The Fe precipitate was moved to a centrifuge tube for centrifugation and rinsed with deionized H2O (>18 MΩ) to eliminate the large seawater ions. The precipitate was then dissolved in 14N HNO3 (1N = 1M) and moved to a Teflon beaker, before being dried and dissolved in 7N HNO3 for anion-exchange chromatography with AG1-X8, 100–200 mesh size resin and a polyethylene frit. Separation was perfromed on Teflon columns with a 0.5 mL column volume (CV). The first separation was performed on Teflon columns with 4CV 7N HNO3, 3 CV of 8N HCl (to get rid of Fe and Th fraction), and 3 CV of deionized H2O (to gather the U fraction). The U fractions were then dried with 2 drops of HClO4 and brought to volume with 7N HNO3. The final U fractions were then dried with 2 drops of HClO4 and dissolved in weak nitric acid for analysis on the mass spectrometer. The concentrations of 234U, 235U, and 238U were calculated by isotope dilution using the nuclide ratios determined on a Thermo-Finnigan Neptune mass spectrometer. All measurements were performed using a peak-jumping routine in ion counting mode on the discreet dynode multiplier behind the retarding potential quadrupole. Each sample measurement was bracketed by the measurement of an aliquot of the run solution, which was utilized to adjust for the instrument background count rates on the measured masses. For U, the measurement uncertainties involved propagated errors from ICP-MS isotope ratio measurements, spike concentrations, and blank corrections. The procedural blanks for chemical and mass spectrometric analyses at the Laboratory of Isotope Geochemistry in Xi’an Jiao Tong University are approximately 830 ag (2.2 × 10⁶ atoms) for 234U, 29 fg (7.7 × 10⁷ atoms) for 235U, 2 pg (5.2 × 10⁹ atoms) for 238U. The methods used here have been fully described by Cheng et al. [1,37] and Shen et al. [38,39].

3. Results

The water chemistry results of each sampled lake are presented in Table 2, including the aqueous uranium isotope concentration and the [234U/238U]AR. Given that 238U is the dominant uranium isotope, accounting for 99.275% of the total U content, the uranium concentration in this paper refers to the 238U concentration, expressed as 238U hereafter. In general, freshwater lakes (KLK, XLH 2) are lower than saline lakes (GH, TS, XLG 1) for all measured parameters.
(a) Given that the salinity in the GH waters was above the detection limit of the instrument, we estimated these GH samples salinity by converting the measured conductivity as described below, resulting in an estimated salinity of 72.36‰ for the GH samples.
Conductivity can be converted to salinity between 0–40 °C using the following conversion formula:
yNaCl = 1.3888x − 0.02478xt − 6171.9
where y NaCl is the salinity calculated as NaCl, x is the conductivity in μs/cm, and t is the water temperature in °C. Salinity calculated using the above formula is given in units of ppm, and must be subjected to a basic unit conversion for expression in ‰.
(b) These contents of HCO 3 and CO 3 2 have been calculated by these two formulas [40].
lg [ HCO 3 ] = 11.338 + pH
lg [ CO 3 2 ] = 21.668 + 2 pH

3.1. Water Chemistry Characteristics in the Northeast of Qaidam Basin

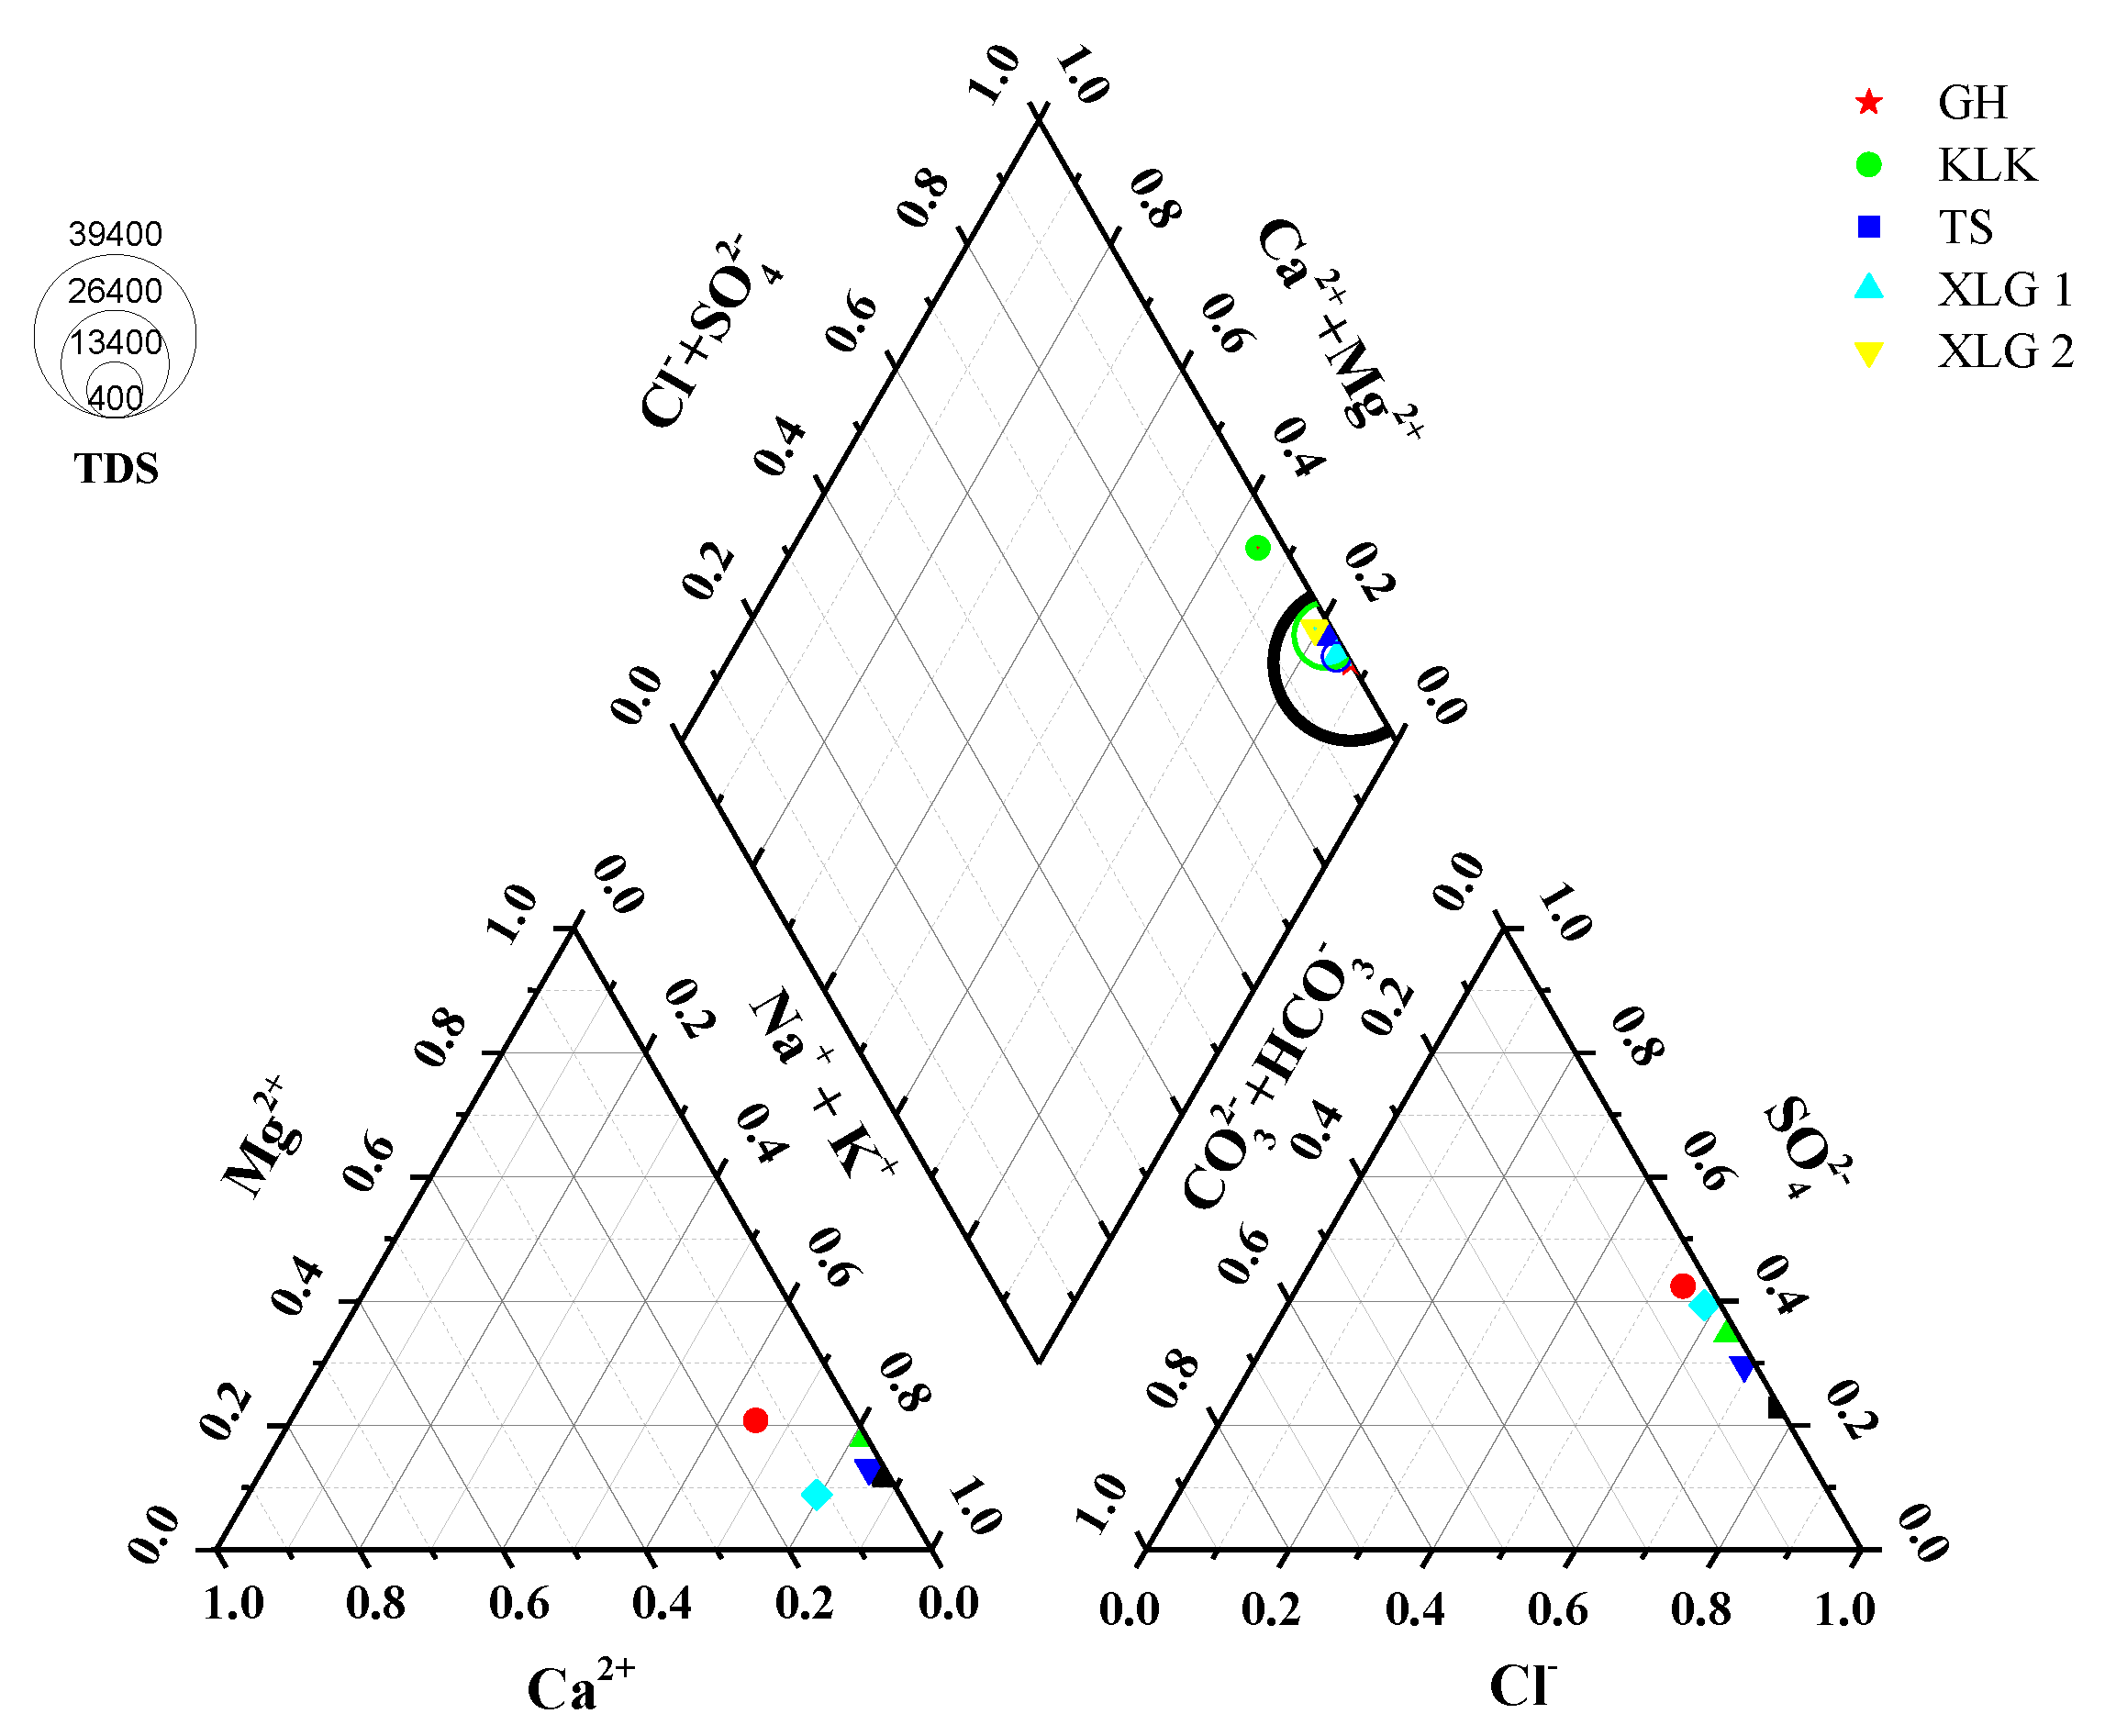
As shown in a Piper diagram (Figure 2), the cations in these lake waters of the northeast of Qaidam Basin were mainly Na+, jointly accounting for 78.5%, 54.5%, 73.6%, 72.4%, and 71.0% of the total cations (TZ+) in GH, KLK, TS, XLG1, and XLG2 lakes, respectively. Na+ and K+ are followed by Mg2+ with the second highest concentration, while Ca2+ had the lowest cation concentrations measured. Of note, the XLG 2 waters had a slightly higher concentration of Ca2+ than Mg2+. The anions were mainly Cl, accounting for 76.5%, 52.2%, 63.4%, and 67.9% of all anions (TZ) in GH, KLK, TS, XLG1, and XLG2 lakes, respectively. Cl was followed by SO 4 2 with the second highest concentration, while HCO 3 , CO 3 2 , NO 2 , and NO 3 jointly had the lowest anion concentrations measured. The concentration of an ion (or ion pair) remained essentially the same throughout the same water body.

3.2. Distribution Characteristics of Uranium Isotopes in These Lake Waters in the Northeast of Qaidam Basin

Multiple sampling sites were set at different depths in KLK and TS so that the horizontal and vertical distribution characteristics of 238U could be analyzed for these lakes. The horizontal distribution characteristics of the 238U concentration and the [234U/238U]AR in the KLK and TS waters are shown in Table 3.
Aqueous 238U concentration of the freshwater lakes in the northeast of Qaidam Basin were generally low. In contrast, the concentration of 238U in these saline lake waters were generally higher. There is no significant difference in the [234U/238U]AR between freshwater lakes and saline lakes, with the values generally ranging from 1.460 to 1.798. A comparison of all five sampled lakes data revealed that 238U (TS) was the highest of all, while [234U/238U]AR (TS) was the lowest. There was no significant horizontal distribution difference among the three sampling sites for the 238U concentration and the [234U/238U]AR.
The vertical distribution characteristics of the 238U concentration and [234U/238U]AR in the KLK and TS waters are shown in Table 4.
Three sampling sites were set in KLK. At sampling sites 1 and 2, water samples were collected at three depths referred to as T (surface), M (middle), and B (bottom) from the surface water to the bottom water, while only two sampling depths (T and M) were collected at sampling site 3.
In summary, in natural lakes, in the absence of interference from other aqueous factors, the 238U concentration increased with an increased water depth, while the [234U/238U]AR showed an initial increase, then decreased gradually with depth. However, the ranges of these changes were very small, indicating that aqueous 238U concentration and the [234U/238U]AR were essentially evenly distributed vertically and horizontally within the same lake.

3.3. Influence of Water Sources Supply on the Uranium Isotopes of Lake

In order to further explore the influence of water sources supply on the uranium isotope of lake, we get some water samples from different sections of the Bayin river (BY) and KLK at the same single day, and the Bayin river is the only incharge river of KLK lake. Results of 238U concentration and [234U/238U]AR in the BY river and KLK waters are shown in Table 5.
We found that the 238U concentration and [234U/238U]AR in different sections of BY river are not the same. The 238U concentration is highest in the upper reaches (6.0 μg/L) and the lowest in the lower reaches (2.8 μg/L) of natural waters. However, [234U/238U]AR shows the opposite of the distribution of 238U concentration. The Bayin river passes through Delhi city. We collected the highest 238U concentration samples (6.2 μg/L) from the watercourse of Delhi city.
The Bayin river flows into the KLK from the northeast and mixes with the original lake water. Two sampling results show that the average 238U concentration of KLK lake water is about 5.5 μg/L, which is slightly lower than the upper reaches of the Bayin River and is significantly higher than the lower reaches. The Bayin river flows out the KLK from the southwest. The 238U concentration of watercourse connecting KLK and TS is 5.6 μg/L. This is basically consistent with that of KLK lake water.

3.4. Seasonal Distribution Characteristics of Uranium Isotopes

We explored the seasonal distribution characteristics of U in these lake waters in the northeast of Qaidam Basin. The results from the first batch of samples (December 2017), with the minimum recharge water volume in winter, indicated that the aqueous 238U concentration of the same lake remained at a relatively stable level. However, it is unclear whether the contribution of exogenous inputs (e.g., atmospheric precipitation and river inputs) could affect the lake water 238U concentration and the [234U/238U]AR and the effects of exogenous inputs should be clarified before interpreting the environmental implications of the above indicators. Therefore, GH and TS were selected for a second round of sampling in summer with the maximum recharge water volume and measurement in order to conduct a seasonal comparison of the aqueous 238U concentration and the [234U/238U]AR and the results are shown in Table 6.
We found the 238U concentration of GH and TS changed slightly with the season. In winter (December), 238U concentration of GH is 18.4 μg/L, in summer (June), the result is 16.2 μg/L. We also see the same pattern in TS, where 238U concentration of TS decreased from 35.5 μg/L to 34.7 μg/L in from winter to summer. Whether it is GH or TS, the [234U/238U]AR in different seasons is approximative. From winter to summer, the maximum discharge water volume variation, the [234U/238U]AR of GH vary from 1.792 to 1.798, and the result of TS vary from 1.463 to 1.462.

4. Discussion

4.1. Factors Influencing the Concentration Distribution Characteristics of 238U in These Lake Waters in the Northeast of Qaidam Basin

Based on the existing literature, we hypothesized that TDS, salinity, and pH may account for the differences in the spatial distribution of aqueous 238U concentration. The factors that are likely to affect the distribution of 238U concentration in these lake waters in the northeast of Qaidam Basin are addressed in more detail as follows. For the convenience of discussion, we will use the parameters measured in KLK and TS as representative of the freshwater and saline lakes of the region, respectively.

4.1.1. Response Relationship of 238U Concentration to TDS and Salinity in These Lake Waters in the Northeast of Qaidam Basin

Water Chemistry parameters of these lake waters show that the major cation is mainly Na+ and the major anion is mainly Cl. This means that TDS and salinity may be similar in the saline lake from the northeast of Qaidam Basin. As shown in Figure 3, the relationship between TDS and salinity of these lake waters clarifies this perspective.
Therefore, we selected TDS as the research object to investigate the response relationship of 238U concentration in these lake waters to TDS. The relationship of 238U concentration to TDS in these lake waters in the northeast of Qaidam Basin is shown in Figure 4.
Where TDS increases as TDS (KLK): 0.56 g/L < TDS (XLG 2): 0.63 g/L < TDS (XLG 1): 7.2 g/L < TDS (TS): 16.56 g/L. For the 238U concentration, we found TDS increased as 238U (KLK): 5.5 μg/L < 238U (XLG 2): 12.6 μg/L < 238U (XLG 1): 19.8 μg/L < 238U (TS): 34.7 μg/L. When it comes to the relationship of 238U concentration to TDS in these lake waters in the northeast of Qaidam Basin, in the absence of interference from exogenous factors, we found a higher lake water TDS in a certain range would lead to a higher concentration of 238U. This indicates that the enrichment process of uranium involves a series of evaporation and concentration steps. We could speculate that the migration and the ability of uranium to transform in water increases with an increase of the TDS. Shi [41] suggested the main reason for this phenomenon is that 238U is difficult to be adsorbed in an environment with high TDS. The mobility of U is largely controlled by their ability to form complexes both with inorganic (F, Cl, PO 4 3 , CO 3 2 ) and organic ligands. This has been described in detail for U [42,43]. Studies in the ocean [44] and the Jiu long River Estuary [45] also showed that the aqueous 238U concentration increased linearly with an increase in TDS.
The results of the KLK and TS samples are compared in Figure 5.
The TDS varied over a small range within same lake. TDS (KLK) from 0.54 g/L to 0.61 g/L, TDS (TS) from 16.46 g/L to 16.66 g/L. The results showing the 238U concentration was basically at the same level within same lake. The change range of 238U concentration is 3.64% in KLK and 1.73% for TS.
In addition, the TDS of GH samples far exceeded the TS samples (TDS (TS): 16.56 g/L < TDS (GH): 39.31 g/L; However, mean aqueous 238U concentrations were less for the GH samples than for the TS samples (238U (GH): 16.2 μg/L < 238U (TS): 34.7 μg/L). These results indicate that TDS are not the only factors affecting 238U concentration in the waters of terrestrial lakes. The other possibility is there is a certain threshold. When above a TDS range, the 238U concentration will decrease with the increase of TDS [22]. This should be the reason for GH with high TDS but low 238U concentration. In summary, the positive relationship of aqueous 238U concentrations to the factors of TDS may exist only when TDS are lower than certain thresholds, and if the impacts of other factors are deemed negligible. In other words, we speculate that, within a certain range of TDS, the aqueous 238U concentration increases with the increase of TDS, but this will decrease rather than increase once beyond the range. More research is required to determine the veracity of this speculation, and to understand the underlying mechanism of thresholds for TDS that affect aqueous 238U concentrations.

4.1.2. Response Relationship of 238U Concentration to pH in These Lake Waters in the Northeast of Qaidam Basin

Most of these lakes in the northeast of Qaidam Basin are saline lakes with a pH generally above 7.0 (i.e., basic). As shown in Figure 6, the 238U concentration in these lake waters in the northeast of Qaidam Basin increased with pH.
Since KLK is an open lake, it was excluded from the following discussion of close lakes. For the close saline lakes, the pH results of these sampled lake waters show that pH (XLG 2): 7.53 < pH (GH): 7.84 < pH (XLG 1): 8.51< pH (TS): 8.87. The 238U concentration of different waters samples were 238U (XLG 2): 12.6 μg/L < 238U (GH): 16.2 μg/L< 238U (XLG 1): 19.8 μg/L < 238U (TS): 34.7 μg/L. We can see the aqueous concentration of 238U of these lake waters increased with pH, which is attributed to the fact that weakly basic conditions would enhance the leaching of uranium in rocks and thereby increase the migration of uranium into water [41]). The pH value of lake waters depends mainly on the contents of HCO 3 and CO 3 2 [40]. The results show that the pH value of these lakes increases with an increase in the contents of HCO 3 and CO 3 2 . Under basic conditions, uranium is mainly present in the form of UO2(CO3 ) 3 4 . As the decrease of pH, UO2(CO3 ) 3 4 decompose into UO2(CO3 ) 2 2 slowly in water. Two highly mobile forms will eventually become one of the stable forms (UO2CO3, UO2(OH ) 3 , and UO2(OH)+) when the pH is low enough. A study by Mochizuki [46] on Lake Biwa in Japan showed that the change of lake waters pH affected the leaching process of uranium at the sediment/water interface, which would directly affect the aqueous 238U concentration.
Under natural conditions, aqueous 238U concentrations are affected by TDS, and pH, which jointly make different lakes in the same region have different aqueous 238U concentrations. In order to identify the major controlling factors of aqueous 238U concentration of saline lake, we performed a correlation analysis of aqueous 238U concentration with TDS and pH. The results showed that the 238U concentration was affected by pH to a far greater extent than by TDS. The 238U concentration in these sampled lakes vary with the range from 12.6 μg/L to 34.7 μg/L. The pH only changes from 7.53 to 7.88, but TDS changes from 0.63 g/L to 39.31 g/L. Namely, the slightly pH variation can result in the bigger variation of 238U concentration in the sampled saline lake waters than that of TDS.

4.1.3. Response Relationship of 238U Concentration to Organic Matter in These Lake Waters in the Northeast of Qaidam Basin

Studies have also confirmed the 238U concentration could be related with biogeochemical process (i.e., the presence of organic matter (OM) and its interaction with iron and manganese oxides/hydroxides) [28,29,30]. The sorption of uranium complexes on iron hydroxides is significantly reduced in the presence of organic matter and/or competing cations, such as Ca2+ and Mg2+ [31]. Other studies have shown that the concentration of U(VI) in the aqueous phase drastically decreases during bacterial processes because of the formation of insoluble U(IV) compounds [47,48]. In addition, humic substances (HS), including fulvic acid and humic acid, have a strong complexing ability for 238U of all types of organic matter. If the bottom sediment of a lake is covered with a large amount of organic matter, 238U could precipitate after forming organic complexes with HS, thereby reducing the concentration of 238U in the lake waters [49,50]. Some researches mentioned that Qinghai is one of the few provinces in China where natural Artemia is distributed and GH is the largest saline lake producing Artemia in Qaidam Basin of Qinghai Province [51,52,53]. There could exist a layer of organic matter attached to the bottom of GH. If we speculate that there exists an evident biogeochemical process in GH, then the decomposition of organic matter and release of CO2 is possible, which will result in the carbon isotope variation of DIC (Dissolved Inorganic Carbon) and/or biological shell in lake. The carbon and oxygen isotope research of DIC and shell in GH, showed that there is a limited effect on lake water chemistry from biogeochemical process with shallow lake water environment [54,55]. Because the limited data about organic matter effect and the Fe/Mn element result of the sampled lakes, here, we will not present much more discussion.
Based on the above discussion about the relationship between 238U concentration, TDS, pH, and organic matter, we infer that the dominant factor leading to the low 238U concentration in GH waters was also pH, although other factors such as TDS and organic matter could have non-negligible effects. There exists a negative correlation between pH value and TDS when TDS is between 50 and 310 g/L for salt lakes [22]. Under natural conditions, when TDS reaches a certain level, pH value will gradually decrease with increasing TDS, and the concentration of aqueous 238U will be lowered too. Therefore, we conclude that pH is the dominant factor affecting the changes in aqueous 238U concentration in the sampled saline lakes. The pH values of these saline lakes are not only controlled by the input water, but associated with water–rock interaction during the lake evolution stage, metamorphous degree, and hydrochemistry type [22,56].

4.1.4. Response Relationship of 238U Concentration to Water Sources Supply in Open Lake Waters

Taking “KLK-Bayin river” as an example to discuss the response relationship of 238U concentration to water supply sources in an open lake, one of the most important sources of uranium isotopes in water bodies, we note that a large amount of debris is produced by physical erosion and chemical weathering of mountain masses on both sides of rivers.
The upper reaches of the Bayin river are characterized by rolling mountains and abundant rainfall. The leaching effect of the river makes the uranium isotope content of water in the upper reaches generally higher than others. The physical erosion and chemical weathering of mountain masses on both sides of rivers from upper reaches to lower reaches gradually weakened due to the smooth terrain. Because of the large amount of gravel in the riverbed of the Gobi Desert, a large amount of river water supplies groundwater. This makes the uranium content of water in the middle reaches slightly lower than that in the upper reaches
The watercourse hardening of the Bayin river in Delhi city prevents the infiltration process of the river. There are many materials used for watercourse hardening, such as concrete, marble, and so on. This may be one of the main reasons why the uranium isotope content in of Bayin river in Delhi city is higher than others. A large amount of spilt groundwater has become the main source of water for the Bayin river, due to the change of lithology of the watercourse and the obstruction of Denan hills. The dilution of groundwater may result in a significant reduction in uranium isotope content of lower reaches for Bayin river [33,34].
Research [21,24] shows that the evaporation of KLK is greater than precipitation every year under such a high evaporation environment. This means that there is a large amount of replenishing water into KLK every year under such high evaporation environment. The results of samples show that the 238U concentration of Bayin river near the estuary (2.8 μg/L) is lower than that for KLK (5.5 μg/L). However, the result of the watercourse near the exit of KLK is 5.6 μg/L, which indicates certain effect on aqueous 238U concentration for KLK.

4.2. Distribution Characteristics and Influencing Factors of the [234U/238U]AR

There is a certain degree of difference between waters and sediment in the radioactivity of 234U and 238U under natural conditions. At present, the activity of the number of atoms of a nuclide is the number of decay events per unit of time, referred to as the [234U/238U]AR In theory, the rate at which 238U decays into 234U is the same as the decay rate of 234U. When the so-called radioactive equilibrium is reached, the [234U/238U]AR is equal to 1 [57]. However, the actual [234U/238U]AR in natural waters is usually greater than 1. Scott [58] made a statistical compilation of the data published before 1982 about 238U concentrations and the [234U/238U]AR in the water of main rivers on five continents and found that the radioactivity ratio of 234U to 238U was basically 1.2–1.3, which was indicative of radioactive disequilibrium between uranium isotopes attributed to the properties of the rock formations and soils in the rivers. Chabaux et al. [59] calculated the mean [234U/238U]AR of the world’s major rivers to be 1.17, confirming the above conclusion.
Under natural conditions, the enrichment of 234 U in water is related to the α-decay of 238U nuclides and there are two main ways. When 238U in a mineral undergoes α-decay at the interface between a uranium-bearing mineral and waters, the daughter 234Th will be ejected out of the crystal lattice due to the recoil effect. 234Th has a short half-life (24 day) and decays into 234U, which readily forms complex ions and thereby enters the waters, resulting in an increase in aqueous 234U concentration. This process is called the “α-recoil process”. When the 238U radioactive decay occurs, the daughter 234U will be placed into the crystal lattice destroyed by the 238U radioactive decay.
The increase in 234U concentration due to the preferentially dissolution of destroyed crystal lattice. Given the above processes, the [234U/238U]AR in natural waters is ultimately greater than 1 [14,18,60,61,62,63,64].
The measured [234U/238U]AR values of these sampled lakes are shown in Figure 7.
The results are as follows: [234U/238U]AR (GH): 1.798, [234U/238U]AR (KLK): 1.504, [234U/238U]AR (TS): 1.462, [234U/238U]AR (XLG 1): 1.565, and [234U/238U]AR (XLG 2): 1.673. The [234U/238U]AR of each sampled lake clearly deviated from the equilibrium value (i.e., value of [234U/238U]AR ≠ 1), which is due to frequent water–rock interaction (i.e., sediments, atmosphere dust and organic material etc.) that promotes the production and release of 234U into the waters due to the α-recoil process. This increases the aqueous 234U concentration and thereby causes the [234U/238U]AR to significantly deviate from the equilibrium.
Based on the current data, we only could show that there are big differences of [234U/238U]AR in the sampled different lakes located in the same regional background, but show consistent [234U/238U]AR in vary sites and depths in any one lake. Further, the [234U/238U]AR in all sampled saline lakes is above 1.5 which is higher than the reported average value (1.17) of river from the world [58], lower than the reported value (~2.5) of lakes in Namshi-Nur and Tsagan-Tyrm [64] and that of rivers in same region [25]. These results mean that the [234U/238U]AR of these saline lakes may be related to the input water and the water–rock interaction during the evolution stage, metamorphous degree, and hydrochemistry type. The input water of saline lakes in the northeast of Qaidam Basin is mainly based on natural precipitation, river water, and groundwater [56,65]. The factors affecting the [234U/238U]AR in water–rock interaction during the evolution stage, metamorphous degree, and hydrochemistry type could be related with the redox conditions, pH of water, and biogeochemical process (i.e., the presence of organic matter (OM) and its interaction with iron and manganese oxides/hydroxides and/or competing cations, such as Ca2+ and Mg2+) during evolution stage, metamorphous degree, and hydrochemistry of the saline lakes. This will be resolved. By analyzing the major and trace element geochemistry distribution and the [234U/238U]AR of the suspended particles filtered from the water of these sampled lakes in future.

4.3. Seasonal Effects on 238U Concentration and the [234U/238U]AR in Lakes and Their Potential Environmental Impact

The concentration of 238U in natural lake waters and the [234U/238U]AR are the best tracers for determining changes in the water environment. The main source of 238U in lake waters are water–rock interaction and rock weathering, in addition to other sources such as exogenous inputs from rivers, atmospheric precipitation, and groundwater recharge. The radioactive disequilibrium of 234U/238U is the best evidence of the water-rock interaction of 238U. The 238U concentration and the [234U/238U]AR of various sites in a lake remain almost consistent. However, this will be affected by seasonal variation due to an input of precipitation mainly occurring in the rainy season. The annual precipitation in GH and TS is subject to significant variation, with precipitation mainly concentrated in May–September every year [21,32], which is likely to induce the seasonal variation of aqueous 238U concentration. However, compared with the total water volume in GH and TS, the effect of seasonal precipitation variation on aqueous 238U concentration was insignificant. Based on the seasonal effect on the result of 238U concentration in GH and TS (Table 5), the seasonal change range of 238U concentration in GH is 11.96%, and the result is 2.25% for TS. Therefore, we conclude that the subtle seasonal difference of 238U concentration in the lake waters are due to the dilution effect of precipitation and/or groundwater.
In summary, the concentration of 238U in natural lake waters and the [234U/238U]AR remain almost consistent for a certain period of time. Studies of U-series disequilibria in lakes mainly include the determination of sediment ages and/or of sedimentation rates [66]. Stable U- and Th-series nuclides in lakes is the basis of the determination of sediment ages. The ability of obtaining precise sediment ages is critical to the accuracy of the reconstruction of paleoclimate and paleoenvironment.
U- and Th-series nuclides in lakes are closely related. U- and Th-series nuclides of lake waters may give us some information about geochemical behavior and mixing characteristics of lakes [6]. There are many environmental changes recorded by lake sediments. We can chronologically decipher such records by measuring the U–Th nuclides of these sediments.

5. Conclusions

Four lakes in the northeast of Qaidam Basin were selected to represent a sequence of waters salinity in order to test the effect of lake salinity on aqueous uranium isotopes. A total of 43 water samples were taken during three different sampling campaigns and analyzed for water chemistry and uranium isotope concentrations. The aqueous 238U concentration of the freshwater lakes was generally low, while it was generally high in these saline lakes, which is a response to the combined effects of TDS and pH.
Furthermore, pH is the dominant factor affecting changes in aqueous 238U concentration of the sampled saline close lakes, as the lake waters pH could directly affected the speciation of 238U, with lower water pH leading to more fractions of 238U into stable forms, and thereby smaller aqueous 238U concentration. With the exception of pH value, the replenishment of water likely exerts a certain effect on the uranium isotope concentration for open KLK fresh lake located in the northeast of Qaidam Basin in the same high evaporation environment background as close saline lakes.
The [234U/238U]AR of each lake was greater than one, ranging roughly from 1.460 to 1.798, which was likely due to the α-recoil of 238U at the water-rock interface and the leaching-precipitation process. The degree of consistency in the 238U and [234U/238U]AR values across various sites in a lake indicated that aqueous 238U and [234U/238U]AR were evenly distributed in the same lakes.
The [234U/238U]AR in these saline lakes are closely related to the input water and the associated water–rock interactions involving sediments, atmosphere dust, and organic material etc. during the evolution stage, metamorphous degree, and hydrochemistry of these saline lakes. If the concentration of 238U in natural lake waters and the [234U/238U]AR remain almost consistent for a certain period of time. The potential environmental impact is that which is the base of the determination of sediments ages in lake and/or of sedimentation rates could be determined by lake sediment and/or biogenic carbonate in future. Further, we can chronologically decipher the environmental change records in them by measuring the U–Th nuclides of these sediments.

Author Contributions

The research was supervised by P.Z. and X.L. with guidance provided by H.C. and R.L.E. Samples were collected by C.Z., P.Z. and X.L. Experiment method was instructed by P.Z., Y.N. and X.Y. The paper written by C.Z. and P.Z. with revised provided by L.T., R.L.E. and H.C. All authors have read and agreed to the published version of the manuscript.

Funding

This study was supported by the National Natural Science Foundation of China (No. 41873013; No.41888101), the National Natural Science Foundation of USA (No. 1702816) and the 111 program of China (No. D19002).

Acknowledgments

The samples collection was supported by Weiguo Liu and Hu Liu of Institute of Earth Environment, Chinese Academy of Science. And we are grateful to two reviewer and editor’s constructive comments for improve manuscript quality and Haiwei Zhang’s help for improving framework of manuscript.

Conflicts of Interest

The authors declare no conflict of interest.

References

  1. Cheng, H.; Edwards, R.L.; Shen, C.C.; Polyak, V.J.; Asmerom, Y.; Woodhead, J.; Hellstrom, J.; Wang, Y.; Kong, X.; Spötl, C.; et al. Improvements in 230Th dating, 230Th and 234U half-life values, and U–Th isotopic measurements by multi-collector inductively coupled plasma mass spectrometry. Earth Planet. Sci. Lett. 2013, 371, 82–91. [Google Scholar] [CrossRef]
  2. Wang, L.; Ma, Z.; Sun, Z.; Wang, Y.; Wang, X.; Cheng, H.; Xiao, J. U concentration and 234U/238U of seawater from the Okinawa Trough and Indian Ocean using MC-ICP-MS with SEM protocols. Mar. Chem. 2017, 196, 71–80. [Google Scholar] [CrossRef]
  3. Broecker, W.S.; Peng, T.H. Reactive metals and the great particulate sweep. In Tracers in the Sea; Broecker, W.S., Peng, T.H., Eds.; Lamont-Doherty Geol Obs: Palisades, NY, USA, 1982; pp. 166–235. [Google Scholar]
  4. Andersen, M.B.; Stirling, C.H.; Porcelli, D.; Halliday, A.N.; Andersson, P.S.; Baskaran, M. The tracing of riverine U in Arctic seawater with very precise 234U/238U measurements. Earth Planet. Sci. Lett. 2007, 259, 171–185. [Google Scholar] [CrossRef]
  5. Schmidt, S.; Saari, H. Residence time of suspended particles in the Garonne River (SW France): Indications derived from Th-234, Be-7 and Pb-210. In Proceedings of the EGU General Assembly Conference Abstracts, Vienna, Austria, 7–12 April 2013. [Google Scholar]
  6. Chabaux, F.; Bourdon, B.; Riotte, J. U-series geochemistry in weathering profiles, river waters and lakes. In U/Th Series Radionuclides in Aquatic Systems; Krishnaswami, S., Cochran, J.K., Eds.; Elsevier: Edinburgh, UK, 2008; Volume 13, pp. 49–104. [Google Scholar]
  7. Aciego, S.M.; Aarons, S.M.; Sims, K.W. The uranium-isotopic composition of Saharan dust collected over the central Atlantic Ocean. Aeolian Res. 2015, 17, 61–66. [Google Scholar] [CrossRef]
  8. Chutcharavan, P.M.; Dutton, A.; Ellwood, M.J. Seawater 234U/238U recorded by modern and fossil corals. Geochim. Cosmochim. Acta 2018, 224, 1–17. [Google Scholar] [CrossRef] [Green Version]
  9. Aciego, S.M.; Aarons, S.M.; Sims, K.W. Behaviour of uranium during mixing in the delaware and chesapeake estuaries. Estuar. Coast. Shelf Sci. 1994, 39, 619–631. [Google Scholar]
  10. Moran, S.B.; Ellis, K.M.; Smith, J.N. 234Th/238U disequilibrium in the central Arctic Ocean: Implications for particulate organic carbon export. Deep Sea Res. Part II Top. Stud. Oceanogr. 1997, 44, 1593–1606. [Google Scholar] [CrossRef]
  11. Rengarajan, R.; Sarin, M.M.; Krishnaswami, S. Uranium in the Arabian Sea: Role of denitrification in controlling its distribution. Oceanol. Acta 2003, 26, 687–693. [Google Scholar] [CrossRef] [Green Version]
  12. Schmidt, S. Impact of the Mediterranean Outflow Water on particle dynamics in intermediate waters of the Northeast Atlantic, as revealed by 234Th and 228Th. Mar. Chem. 2006, 100, 289–298. [Google Scholar] [CrossRef]
  13. Li, P.; Zhu, P.; Wang, X.; Yu, Y. Distribution of uranium in seawater on the continental shelf of the East China sea. Oceanol. Limnol. Sin. 1982, 13, 514–552. (In Chinese) [Google Scholar]
  14. Li, G.; Li, L.; Li, L.; Li, T. Controling mechanism of riverine uranium isotope and its implication for weathering limitation theory. Bull. Mineral. Petrol. Geochem. 2019, 38, 11–17. (In Chinese) [Google Scholar]
  15. Xu, Y.; Zhang, F.; Jin, Z. Uranium isotopic compositions of fine detrital particles in a glacial catchment of the Pamir Plateau and its implication for sediment transfer. J. Earth Environ. 2019, 10, 116–127. (In Chinese) [Google Scholar]
  16. Peng, A.; Huang, Y.; Chen, M.; Yang, W.; Qu, Y. Depth distribution of uranium isotopes of different grades in Xiamen Bay seawater. J. Appl. Oceanogr. 2012, 31, 3–11. (In Chinese) [Google Scholar]
  17. Francois, C.; Matheiu, G.; Philippe, L.; Jean, R.; Eugeni, V.; Olga, S.; Ludmilla, A. Geochemical and isotopic (Sr, U) variations of lake waters in the Ol’khon Region, Siberia, Russia: Origin and paleoenvironmental implications. Comptes Rendus Geosci. 2011, 343, 462–470. [Google Scholar]
  18. Osmond, J.K.; Kaufman, M.I.; Cowart, J.B. Mixing volume calculations, sources and aging trends of Floridan aquifer water by uranium isotopic methods. Geochim. Cosmochim. Acta 1974, 38, 1083–1100. [Google Scholar] [CrossRef]
  19. Yadav, D.N.; Sarin, M.M. Geo-chemical behavior of uranium in the Sambhar Salt Lake, Rajasthan (India): Implications to “Source” of salt and uranium “Sink”. Aquat. Geochem. 2009, 15, 529–545. [Google Scholar] [CrossRef]
  20. Borole, D.V.; Krishnaswami, S.; Somayajljlu, B.L.K. Uranium isotopes in rivers, estuaries and adjacent coastal sediments of western India: Their weathering, transport and oceanic budget. Geochim. Cosmochim. Acta 1982, 46, 125–137. [Google Scholar] [CrossRef]
  21. Zheng, X. China Salt Lake; Science Press: Beijing, China, 2002. (In Chinese) [Google Scholar]
  22. Zhang, P. Qaidam Basin Salt Lake; Science Press: Beijing, China, 1987. (In Chinese) [Google Scholar]
  23. Benjamin, L.; Philip, C.B.; Tamir, P.; Gerel, O. Geochemical evolution of uraniferous soda lakes in Eastern Mongolia. Environ. Earth Sci. 2011, 62, 171–183. [Google Scholar]
  24. Lin, H.; Fengqing, H. Salt Lake Evolution and Paleoclimate Fluctuations in Qaidam Basin; Science Press: Beijing, China, 2007. (In Chinese) [Google Scholar]
  25. Zhang, P.; Cheng, H.; Liu, W.; Mo, L.; Li, X.; Ning, Y.; Ji, M.; Zong, B.; Zhao, C. Geochemical and isotopic (U, Th) variations in lake waters in the Qinghai Lake Basin, Northeast Qinghai-Tibet Plateau, China: Origin and paleoenvironmental implications. Arab. J. Geosci. 2019, 12, 92. [Google Scholar] [CrossRef]
  26. Isupov, V.P.; Vladimirov, A.G.; Lyakhov, N.Z.; Shvartsev, S.L.; Ariunbileg, S.; Kolpakova, M.N.; Shatskaya, S.S.; Chupakhina, L.E.; Kuibida, L.V.; Moroz, E.N. Uranium in saline lakes of Northwestern Mongolia. Dokl. Earth Sci. 2011, 437, 352–356. [Google Scholar] [CrossRef]
  27. Strakhovenko, V.D.; Gas’kovaet, O.L. Thermodynamic model of formation of carbonates and uranium mineral phases in lakes Namshi-Nur and Tsagan-Tyrm (Cisbaikalia). Russ. Geol. Geophys. 2018, 59, 374–385. [Google Scholar] [CrossRef]
  28. Andersson, P.S.; Porcelli, D.; Gustafsson, Ö.; Ingri, J.; Wasserburg, G.J. The importance of colloids for the behavior of uranium isotopes in the low-salinity zone of a stable estuary. Geochim. Cosmochim. Acta 2001, 65, 13–25. [Google Scholar] [CrossRef]
  29. Koch-Steindl, H.; Pröhl, G. Considerations on the behaviour of long-lived radionuclides in the soil. Radiat. Environ. Biophys. 2001, 40, 93–104. [Google Scholar] [CrossRef] [PubMed]
  30. Fredrickson, J.K.; Zachara, J.M.; Kennedy, D.W.; Liu, C.; Duff, M.C.; Hunter, D.B.; Dohnalkova, A. Influence of Mn oxides on the reduction of uranium (VI) by the metal-reducing bacterium Shewanella Putrefaciens. Geochim. Cosmochim. Acta 2002, 66, 3247–3262. [Google Scholar] [CrossRef] [Green Version]
  31. Belli, K.M.; DiChristina, T.J.; Van Cappellen, P.; Taillefert, M. Effects of aqueous uranyl speciation on the kinetics of microbial uranium reduction. Geochim. Cosmochim. Acta 2015, 157, 109–124. [Google Scholar] [CrossRef] [Green Version]
  32. Han, T.; QI, D.; Chen, H.; Xiang, S.; Shi, S.; Liu, C.; Li, N.; Wu, S. Spatial and Temporal Distribution of Precipitation in Qaidam Basin. Desert Oasis Meteorol. 2019, 29, 18–24. (In Chinese) [Google Scholar]
  33. Li, J.; Li, M.H.; Fang, X.M.; Wu, F.L.; Meng, Q.Q.; Zhang, Z.G.; Liu, X.M. Hydrochemical characteristics of the Hurleg Lake. Arid Land Geogr. 2015, 38, 43–51. (In Chinese) [Google Scholar]
  34. Chen, B.; Wang, W.; Duan, L.; Gu, X.; Liu, C.; Song, R. Spatial variability of hydraulic conductivity of riverbed sediment in the lower reaches of Bayin River. Water Resour. Hydropower Eng. 2019, 50, 52–57. (In Chinese) [Google Scholar]
  35. Chen, Z.L.; Megharaj, M.; Naidu, R. Determination of Bromate and Bromide in Seawater by Ion Chromatography, with an Ammonium Salt Solution as Mobile Phase, and Inductively Coupled Plasma Mass Spectrometry. Chromatographia 2006, 65, 115–118. [Google Scholar] [CrossRef]
  36. Thermo Scientific. Dionex Aquion Ion Chromatography System Installation Instructions; Thermo Scientific Press: Waltham, MA, USA, 2016. [Google Scholar]
  37. Cheng, H.; Edwards, R.L.; Hoff, J.; Gallup, C.D.; Richards, D.A.; Asmerom, Y. The half-lives of uranium-234 and thorium-230. Chem. Geol. 2000, 169, 17–33. [Google Scholar] [CrossRef]
  38. Shen, C.C.; Edwards, R.L.; Cheng, H.; Dorale, J.A.; Thomas, R.B.; Moran, S.B.; Weinstein, S.; Edmonds, H.N. Uranium and thorium isotopic and concentration measurements by magnetic sector inductively coupled plasma mass spectrometry. Chem. Geol. 2002, 185, 165–178. [Google Scholar] [CrossRef]
  39. Shen, C.C.; Wu, C.C.; Cheng, H.; Edwards, R.L.; Hsieh, Y.T.; Gallet, S.; Chang, C.C.; Li, T.Y.; Lam, D.D.; Kano, A.; et al. High precision and high-resolution carbonate Th-230 dating by MCICP-MS with SEM protocols. Geochim. Acta 2012, 99, 71–86. [Google Scholar] [CrossRef]
  40. Shugui, D. Environmental Chemistry; Higher Education Press: Beijing, China, 2006. (In Chinese) [Google Scholar]
  41. Shi, W. The Principle of Water Geochemistry of Uranium Atomic; Energy Press: Beijing, China, 1990. (In Chinese) [Google Scholar]
  42. Langmuir, D. Uranium-solution-mineral equilibria at low temperatures with applications to sedimentary ore deposits. Geochim. Cosmochim. Acta 1978, 42, 547–569. [Google Scholar] [CrossRef]
  43. Langmuir, D.; Herman, J.S. The mobility of thorium in natural waters at low temperatures. Geochim. Cosmochim. Acta 1980, 44, 1753–1766. [Google Scholar] [CrossRef] [Green Version]
  44. Owens, S.A.; Buesseler, K.O.; Sims, K.W.W. Re-evaluating the 238U salinity relationship in seawater: Implications for the238U-234Th disequilibrium method. Mar. Chem. 2011, 127, 31–39. [Google Scholar] [CrossRef]
  45. Lü, E.; Lei, Z.; Min, C.; Yusheng, Q.; Na, X.; Weifeng, Y.; Yanping, L.; Yipu, H. Size-fractionated uranium isotopes in surface waters in the Jiu-long River Estuary in China. Acta Oceanol. Sin. 2007, 29, 59–68. (In Chinese) [Google Scholar]
  46. Mochizuki, A.; Hosoda, K.; Sugiyama, M. Characteristic seasonal variation in dissolved uranium concentration induced by the change of lake water pH in Lake Biwa, Japan. Limnology 2016, 17, 127–142. [Google Scholar] [CrossRef]
  47. Newsome, L.; Morris, K.; Lloyd, J.R. The biogeochemistry and bioremediation of uranium and other priority radionuclides. Chem. Geol. 2014, 363, 164–184. [Google Scholar] [CrossRef]
  48. Newsome, L.; Morris, K.; Shaw, S.; Trivedi, D.; Lloyd, J.R. The stability of microbially reduced U (IV); impact of residual electron donor and sediment ageing. Chem. Geol. 2015, 409, 125–135. [Google Scholar] [CrossRef]
  49. Burgos, W.D.; Senko, J.M.; Dempsey, B.A.; Roden, E.E.; Stone, J.J.; Kemner, K.M.; Kelly, S.D. Soil humic acid decreases biological uranium(VI) reduction by Shewanella putrefaciens CN32. Environ. Eng. Sci. 2007, 24, 755–761. [Google Scholar] [CrossRef] [Green Version]
  50. Bogdanov, R.V.; Timofeev, S.A.; Selivanov, S.S. Radiogenic 234U and 210Po in humus acids of dyctionemic shale. Radiochemistry 2006, 48, 409–418. [Google Scholar] [CrossRef]
  51. Xu, M.; Cao, H.; Jia, Q.; Gao, Y.; Chen, S. Preliminary study of plankton community diversity of the Gahai Salt Lake in the Qaidam Basin of the Qaidam Basin of the Qinghai-Tibet Plateau. Biodivers. Sci. 2002, 10, 38–43. (In Chinese) [Google Scholar]
  52. Shu, L. Protection and Development of the artemia in the salt lakes of Qinghai Province—A case of Ga Hai lake. Resour. Dev. Mark 2003, 19, 311–313. (In Chinese) [Google Scholar]
  53. Zhao, S.; Chen, L. Institutional selection and analysis on the development of halogen resources in Gahai lake. Chin. Fish. 2007, 9, 71–72. (In Chinese) [Google Scholar]
  54. Li, X.; Liu, W.; Xu, L. Stable oxygen isotope of ostracods in recent sediments of Lake Gahai in the Qaidam Basin, northwest China: The implications for paleoclimatic reconstruction. Glob. Planet. Chang. 2012, 94–95, 13–19. [Google Scholar] [CrossRef]
  55. Jin, Y.; Qiang, M.; Liu, Y.; Li, Y.; Li, H.; Li, F. Variations in carbon and oxygen isotopes of carbonate and water environments: Genggahai Lake, northeastern Qinghai-Tibetan Plateau. Chin. Sci. Bull. 2015, 60, 847–856. (In Chinese) [Google Scholar]
  56. Liu, W.G.; Xiao, Y.K.; Wang, Q.Z.; Qi, H.P.; Wang, Y.H.; Zhou, Y.M.; Shirodkar, P.V. Chlorine isotopic geochemistry of salt lakes in the Qaidam Basin, China. Chem. Geol. 1997, 136, 271–279. [Google Scholar] [CrossRef]
  57. Bourdon B, Turner S, Henderson G M, Introduction to U-series Geochemistry. Rev. Mineral. Geochem. 2003, 52, 1–21. [CrossRef] [Green Version]
  58. Scott, M.R. The chemistry of U and Th series nuclides in rivers. In Uranium Series Disequilibrium: Applications to Environmental Problems; Ivanovich, M., Harmon, R.S., Eds.; Oxford Clarendon Press: Oxford, UK, 1982; pp. 181–201. [Google Scholar]
  59. Chabaux, F.; Riotte, J.; Clauer, N.; FranceLanord, G. Isotopic tracing of the dissolved U fluxes of Himalayan rivers: Implications for present and past U budgets of the Ganges-Brahmaputra system. Geochim. Cosmochim. Acta 2001, 65, 3201–3217. [Google Scholar] [CrossRef]
  60. Osmond, J.K.; Rydell, H.S.; Kaufman, M.I. Uranium disequilibrium in groundwater: An isotope dilution approach in hydrologic investigations. Science 1968, 162, 997–999. [Google Scholar] [CrossRef]
  61. Kigoshi, K. Alpha-recoil thorium-234: Dissolution into water and the Uranium-234/Uranium-238 disequilibrium in nature. Science 1971, 173, 47–48. [Google Scholar] [CrossRef] [PubMed]
  62. Fleischer, R.L. Isotopic disequilibrium of uranium: Alpha-recoil damage and preferential solution effects. Science 1980, 207, 979–981. [Google Scholar] [CrossRef] [PubMed]
  63. Chabaux, F.; Riotte, J.; Dequincey, O. U-Th-Ra fractionation during weathering and river transport. Rev. Mineral. Geochem. 2003, 52, 533–576. [Google Scholar] [CrossRef]
  64. Bourdon, B.; Bureau, S.; Andersen, M.B.; Pili, E.; Hubert, A. Weathering rates from top to bottom in a carbonate environment. Chem. Geol. 2009, 258, 275–287. [Google Scholar] [CrossRef]
  65. Vengosh, A.C.; Chivas, A.R.; Starinsky, A.; Kolodny, Y.; Baozhen, Z.; Pengxi, Z. Chemical and boron isotopic composition of non-marine brines from the Qaidam Basin, Qinghai, China. Chem. Geol. 1995, 120, 136–155. [Google Scholar] [CrossRef]
  66. Ivanovich, M.; Harmon, R.S. Uranium-Series Disequilibrium: Application to Earth, Marine, and Environmental Sciences; Oxford Clarendon Press: Oxford, UK, 1992. [Google Scholar]
Figure 1. Map of sampling locations of these lakes.
Minerals 10 00074 g001
Figure 2. Piper diagram of the water quality of all lake water samples.
Minerals 10 00074 g002
Figure 3. Relationship between TDS and salinity of sampled lake water samples.
Minerals 10 00074 g003
Figure 4. Relationship between 238U concentration and TDS of all lake water samples.
Minerals 10 00074 g004
Figure 5. Relationship between 238U concentration and TDS of the KLK and TS water samples
Minerals 10 00074 g005
Figure 6. Relationship between 238U concentration and pH of all lake water samples.
Minerals 10 00074 g006
Figure 7. Distribution characteristics of [234U/238U]AR of all lake water samples.
Minerals 10 00074 g007
Table 1. The sampling information of each sample.
BatchLocationSample No.Depth (m)Latitude (°N)Longitude (°E)Date
1Tuosu lakeTS-1-10.537°08′40″96°57′24″9 December 2017
TS-1-210
TS-1-321
TS-2437°09′11″96°57′49″
TS-3-10.0237°09′05″96°58′18″
TS-3-213
TS-4-10.0237°09′11″96°58′58″
TS-4-214
TS-5237°09′18″96°59′31″
Gahai lakeGH-1-10.0237°08′28″97°31′34″10 December 2017
GH-1-28
GH-2-10.0237°08′01″97°32′34″
GH-2-210
GH-3-10.0237°08′27″97°32′29″
GH-3-29.98
GH-4-10.0237°08′48″97°32′26″
GH-4-28.98
GH-5-10.0237°09′19″97°32′21″
GH-5-27.48
2Gahai lakeGH0.237°07′51″97°34′58″15 June 2018
Keluke lake KLK 1-T0.237°17′24″96°53′34″16 June 2018
KLK 1-M2.5
KLK 1-B4.5
KLK 2-T0.237°17′55″96°53′42″
KLK 2-M1.5
KLK 2-B3.5
KLK 3-T0.237°18′27″96°53′55″
KLK 3-M1
Tuosu lakeTS-1-T0.237°10′21″96°58′34″16 June 2018
TS-1-M8
TS-2-T0.237°10′27″96°58′59″
TS-2-M4.5
TS-3-T0.237°10′35″96°58′57″
TS-3-M3
Xiligou lake XLG 10.236°49′10″98°26′52″17 June 2018
XLG 20.236°49′03″98°26′41″17 June 2018
3Keluke lake KLK-W0.237°17′01″96°51′35″22 July 2019
KLK-N0.237°18′56″96°54′07″
Bayin riverUpper reaches0.237°26′33″97°44′19″22 July 2019
Middle reaches0.237°22′37″97°26′44″
Delhi city0.237°22′30″97°21′43″
Lower reaches0.237°14′09″97°1′22″
KLK-TS-River0.237°13′11″96°49′44″
Table 2. Water chemistry parameters and isotope measurement results for all lake samples.
SamplepHConductivity mS/cmCl mg/L SO 4 2 mg/L HCO 3 b mg/L CO 2 3 b mg/LNO mg/L NO 3 mg/LNa+ mg/LK+ mg/LMg2+ mg/LCa2+ mg/LTDS (g/L)Salinity (‰)238U (μg/L)[234U/238U]AR
GH7.8478.6231,865.599436.1019.380.06296.7018.0718,830.662102.962852.06199.0239.3172.36a16.21.798
KLK 1-T7.731.09205.23164.4015.040.0411.170.50117.4522.7544.8630.690.540.545.51.505
KLK 1-M7.731.10204.37163.9115.040.0411.150.86117.3523.0944.8530.780.550.555.51.506
KLK 1-B7.521.14204.90164.799.280.0110.981.29117.4922.8744.4530.700.570.575.61.503
KLK 2-T7.691.11203.59162.1113.720.0310.850.75115.9022.9044.3428.740.550.555.51.504
KLK 2-M7.711.12203.09162.0514.370.0310.900.66116.2223.0444.5128.850.560.555.41.506
KLK 2-B7.771.07198.50159.9916.490.0410.960.45116.5323.6444.7128.920.540.535.51.504
KLK 3-T7.761.22217.37161.7716.120.0411.951.08127.0422.9848.2934.470.610.605.41.502
KLK 3-M7.771.21225.53166.7616.490.0412.311.35126.7723.5048.1834.240.600.605.41.504
TS-1-T8.8333.5113,212.457187.91189.385.89192.0713.618294.33848.162027.8130.9116.5420.9134.41.462
TS-1-M8.8733.2010,942.595936.21207.657.08164.277.296809.05801.471675.9829.3016.6020.6834.61.462
TS-2-T8.8733.0810,802.305880.24207.657.08160.385.766758.64776.271659.8123.6216.5420.6034.61.462
TS-2-M8.8833.1011,206.536075.39212.497.42173.9311.486944.53855.721713.1427.3216.5520.6235.01.461
TS-3-T8.8833.2914,840.038097.02212.497.42208.027.039666.54894.582353.4129.9316.6620.7534.91.460
TS-3-M8.8833.9911,192.016104.67212.497.42168.635.877037.38801.031723.7223.5116.4620.5034.91.462
XLG 18.5114.954030.921741.9890.641.3564.353.732129.13361.96385.4962.997.208.6719.81.565
XLG 27.531.25242.26163.889.490.0112.943.37196.6523.6024.5332.250.630.6312.61.673
Table 3. Horizontal distribution characteristics of the 238U concentration and the [234U/238U]AR in the water of KLK and TS.
Sample238U (μg/L)Average Value[234U/238U]ARAverage Value
KLK-T15.55.41.5051.504
25.51.504
35.41.502
KLK-M15.55.51.5061.505
25.41.506
35.41.504
KLK-B15.65.51.5031.503
25.51.504
TS-T134.434.61.4621.461
234.61.462
334.91.460
TS-M134.634.81.4621.462
235.01.461
334.91.462
Table 4. Vertical distribution characteristics of the 238U concentration and the [234U/238U]AR in the water of KLK and TS.
SampleDepth (m)238U (μg/L)Average Value[234U/238U] ARAverage Value
KLK-1T0.25.55.51.5051.505
M2.55.51.506
B4.55.61.503
KLK-2T0.25.55.51.5041.505
M1.55.41.506
B3.55.51.504
KLK-3T0.25.45.41.5021.503
M15.41.504
TS-1T0.234.434.51.4621.462
M834.61.462
TS-2T0.234.634.81.4621.462
M4.535.01.461
TS-3T0.234.934.91.4601.461
M334.91.462
Table 5. 238U concentration and [234U/238U]AR in different sections of BY river and KLK lake waters.
Sample238U (μg/L)[234U/238U]AR
BY-Riverupper reaches6.01.392
middle reaches5.91.402
Delhi city6.21.408
lower reaches2.81.464
KLK-TS-River5.61.482
KLKKLK-W5.61.476
KLK-N5.31.451
Table 6. Seasonal distribution characteristics of lake waters uranium isotopes using GH and TS as representative lakes.
SeasonSampleDepth (m)238U (μg/L)Average Value[234U/238U]ARAverage Value
December (Winter)GH-10.0218.518.41.7911.792
8.018.51.792
GH-20.0218.31.792
10.018.31.793
GH-30.0218.21.793
9.9818.41.791
GH-40.0218.31.796
8.9818.41.794
GH-50.0218.31.793
7.4818.31.794
June (Summer)GH0.216.216.21.7981.798
December (Winter)TS-10.535.435.51.4641.463
10.035.81.462
21.035.61.462
TS-24.035.21.462
TS-30.0235.21.463
13.035.31.46
TS-40.0235.51.464
14.035.71.460
TS-52.035.81.461
June (Summer)TS-10.234.434.71.4621.462
8.034.61.462
TS-20.234.61.462
4.535.01.461
TS-30.234.91.460
3.034.91.462

