Article

Development of Network Analysis and Visualization System for KEGG Pathways

1
Department of Biomedical Convergence Technology, Korea Institute of Science and Technology Information, Daejeon 305-806, Korea
2
Department of Big Data Science, University of Science & Technology, Daejeon 305-350, Korea
3
Biomedical HPC Technology Research Center, Korea Institute of Science and Technology Information, Daejeon 305-806, Korea
*
Authors to whom correspondence should be addressed.
Symmetry 2015, 7(3), 1275-1288; https://doi.org/10.3390/sym7031275
Submission received: 7 April 2015 / Revised: 5 July 2015 / Accepted: 10 July 2015 / Published: 16 July 2015
(This article belongs to the Special Issue Advanced Symmetry Modelling and Services in Future IT Environments)

Abstract

:
Big data refers to informationalization technology for extracting valuable information through the use and analysis of large-scale data and, based on that data, deriving plans for response or predicting changes. With the development of software and devices for next generation sequencing, a vast amount of bioinformatics data has been generated recently. Also, bioinformatics data based big-data technology is rising rapidly as a core technology by the bioinformatician, biologist and big-data scientist. KEGG pathway is bioinformatics data for understanding high-level functions and utilities of the biological system. However, KEGG pathway analysis requires a lot of time and effort because KEGG pathways are high volume and very diverse. In this paper, we proposed a network analysis and visualization system that crawl user interest KEGG pathways, construct a pathway network based on a hierarchy structure of pathways and visualize relations and interactions of pathways by clustering and selecting core pathways from the network. Finally, we construct a pathway network collected by starting with an Alzheimer’s disease pathway and show the results on clustering and selecting core pathways from the pathway network.

1. Introduction

In recent years, “big data” has emerged as a keyword in information technology (IT) news. Big data refers to informationalization technology for extracting valuable information through the use and analysis of large-scale data and, based on that data, deriving plans for response or predicting changes. As an example, the rise of petabyte (PB)-scale data warehouses, social networks, real-time sensor data, and diverse and new data sources has led to the ability to address many problems. Because big data continuously changes and can be applied differently according to various industries and markets, it has also become possible to create a variety of value through advanced analysis of the diverse forms of data that are accumulating in vast volumes and at swift rates, in a process known as big data analysis [1,2,3].
In addition, with the rise of research environments centering on data, interdisciplinary cooperation has increased. For example, with the sharing of genome data, disease data, treatment data, and drug data that has been individually constructed by various research organs, it has become possible to conduct research leading to the discovery of new structomes and expressomes and the development of new treatment methods. In recent years, the development of genomics, expansion of wearable devices, and development of IT/nanotechnology (NT) have led to the production of vast amounts of bioinformatics data. The health care industry use of big data has consequently developed rapidly, and related big data technology has emerged dramatically as a key technology to promote people’s health and provide healthy lives to senior citizens [4,5,6,7]. As one example, the National Institutes of Health (NIH) in the United States provides through Amazon Web Services (AWS) 200 TB of genetic information obtained through the 1000 Genomes Project to researchers who analyze genetic information related to intractable and incurable diseases [4,8]. Through the analysis of veterans’ DNA samples and electronic health records (EHR), the US Department of Veterans Affairs (VA) provides tailored medical services to veterans [4,9]. In addition, the hospital at the University of Ontario Institute of Technology (UOIT) in Canada analyzes data on newborn babies such as blood pressure, body temperature, electrocardiograms (ECG), and blood oxygen saturation and uses this data for the early diagnosis of serious infections of premature babies with pathogens such as sepsis and pulmonary tuberculosis (TB) [10].
Of particular note is the Kyoto Encyclopedia of Genes and Genomes (KEGG), a biological pathway database and one of the most widely used for analyzing relationships between genes. KEGGs pathways are represented as a graph where nodes represent genes, enzymes, or compounds and edges encode relationships, reactions, or interactions between the nodes. In conclusion, KEGGs pathways provide useful structured information for gene network [11,12]. However, much time and effort is required to analyze KEGGs pathways because a pathway is composed of many genes, enzymes, compounds, and other pathways. For example, an Alzheimer’s disease pathway (has05010) in the KEGGs pathways database is 68 genes and seven compounds. Also, has05010 is connected to three pathways such as Oxidative phosphorylation (hsa00190), Apoptosis (hsa04210) and Calcium signaling (hsa04020) pathways. For your information, three hops based has05010 network means a network that is consist of has05010 and all neighbor pathways connected with has05010 within three hops. For example, a three-hop based has05010 pathway network represents relationships among 28 pathways based on has05010 (see Figure 9 in Section 4). In conclusion, as the number of hops for constructing a pathway network increases, so will the size and complexity of the network [13,14,15].
In recent years, many researchers conducted a study on the KEGGs pathway database [12,16]. For example, [11] proposed a methodology to check the biological validity of a gene network inputted by a user through a direct comparison between the gene network and KEGG pathways. Cytoscape is an open source bioinformatics software platform for visualizing molecular interaction networks. Additional features are available as plugins. Plugins are available for network and molecular profiling analyses and searching in large networks [17]. In particular, various plugins for visualizing and analyzing KEGGs pathways have been developed. For example, [18,19] developed KEGGscape that supports merging and visualizing multiple pathways in a same network view. In [20], the authors developed the KGMLReader, which supports load and visualizes KEGG metabolic pathways in KGML (KEGG Markup Language). Its file format represents KEGG pathway data files in XML. However, there is as yet no system whatsoever capable of conducting a multidimensional analysis of a large KEGGs pathway network.
In this paper, we propose a system that will provide multidimensional analysis and visualization functions for the KEGGs pathway database. The structure of this paper is as follows. Section 2 explains the representative services based on bioinformatics big data and the KEGG pathway database. Section 3 describes the multidimensional pathway analysis and visualization system proposed. Section 4 demonstrates the excellence of the proposed system through the results of a performance evaluation based on various performance indices. Finally, Section 5 presents the conclusion.

2. Related Studies

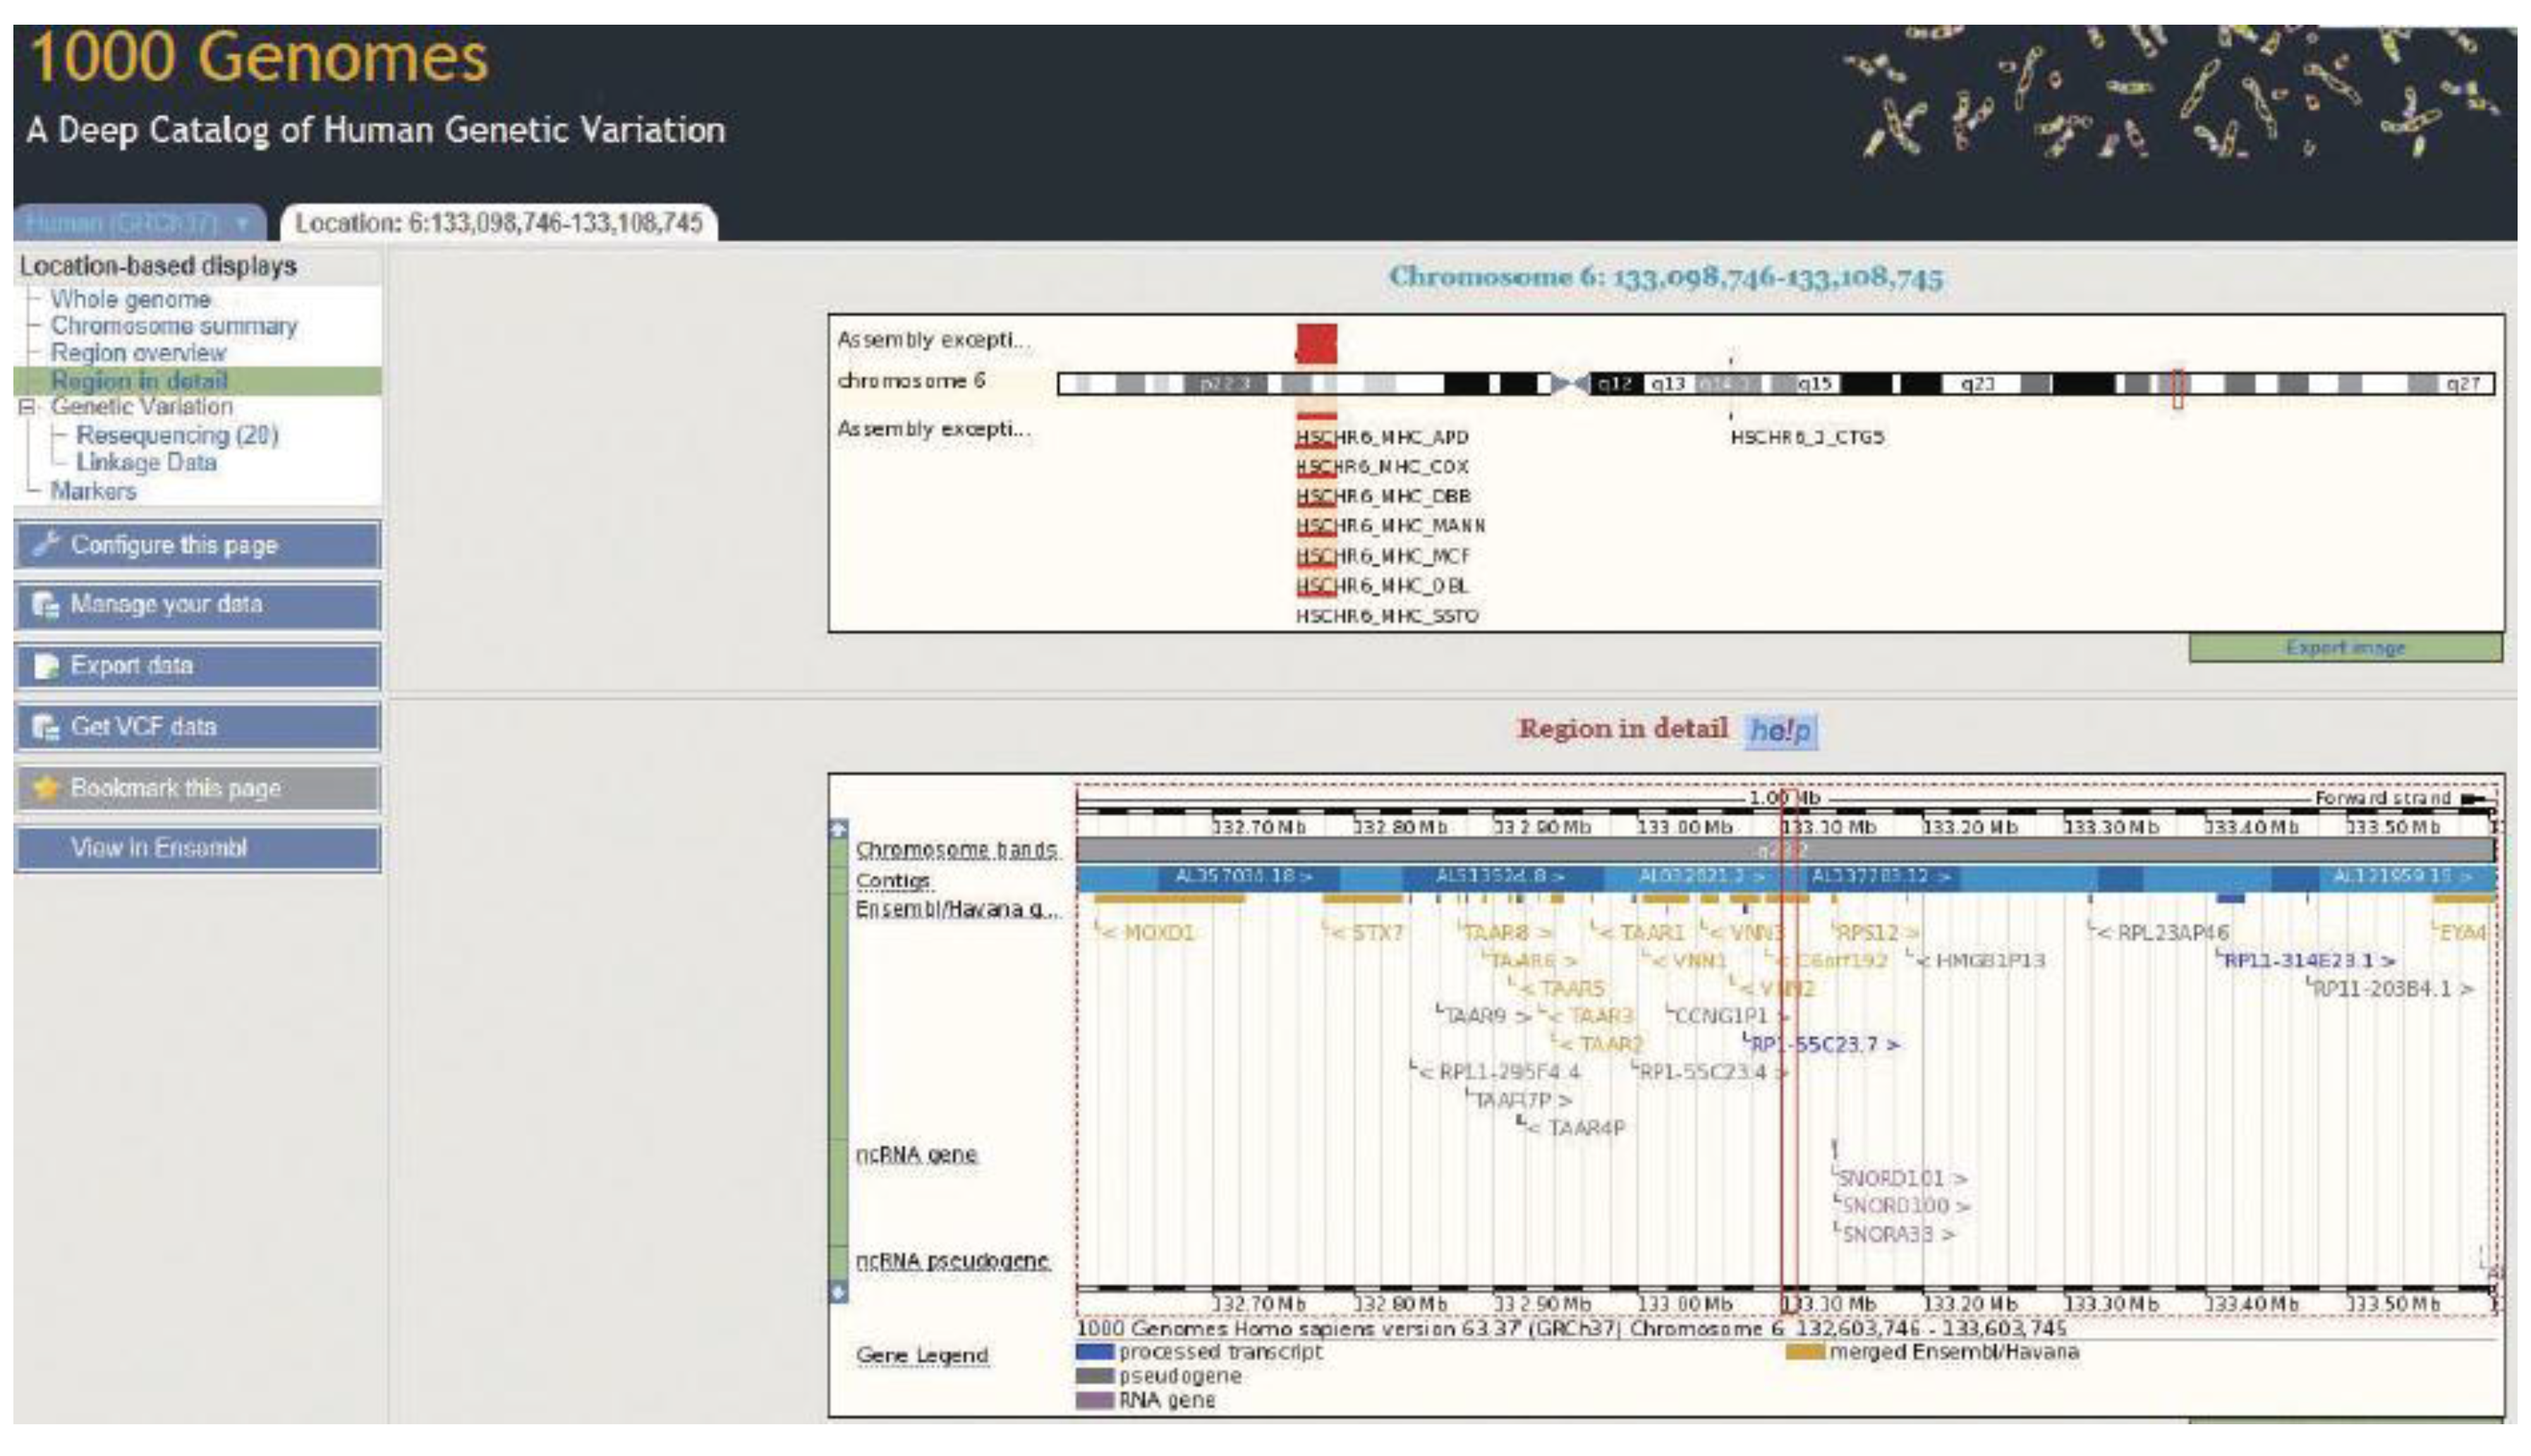
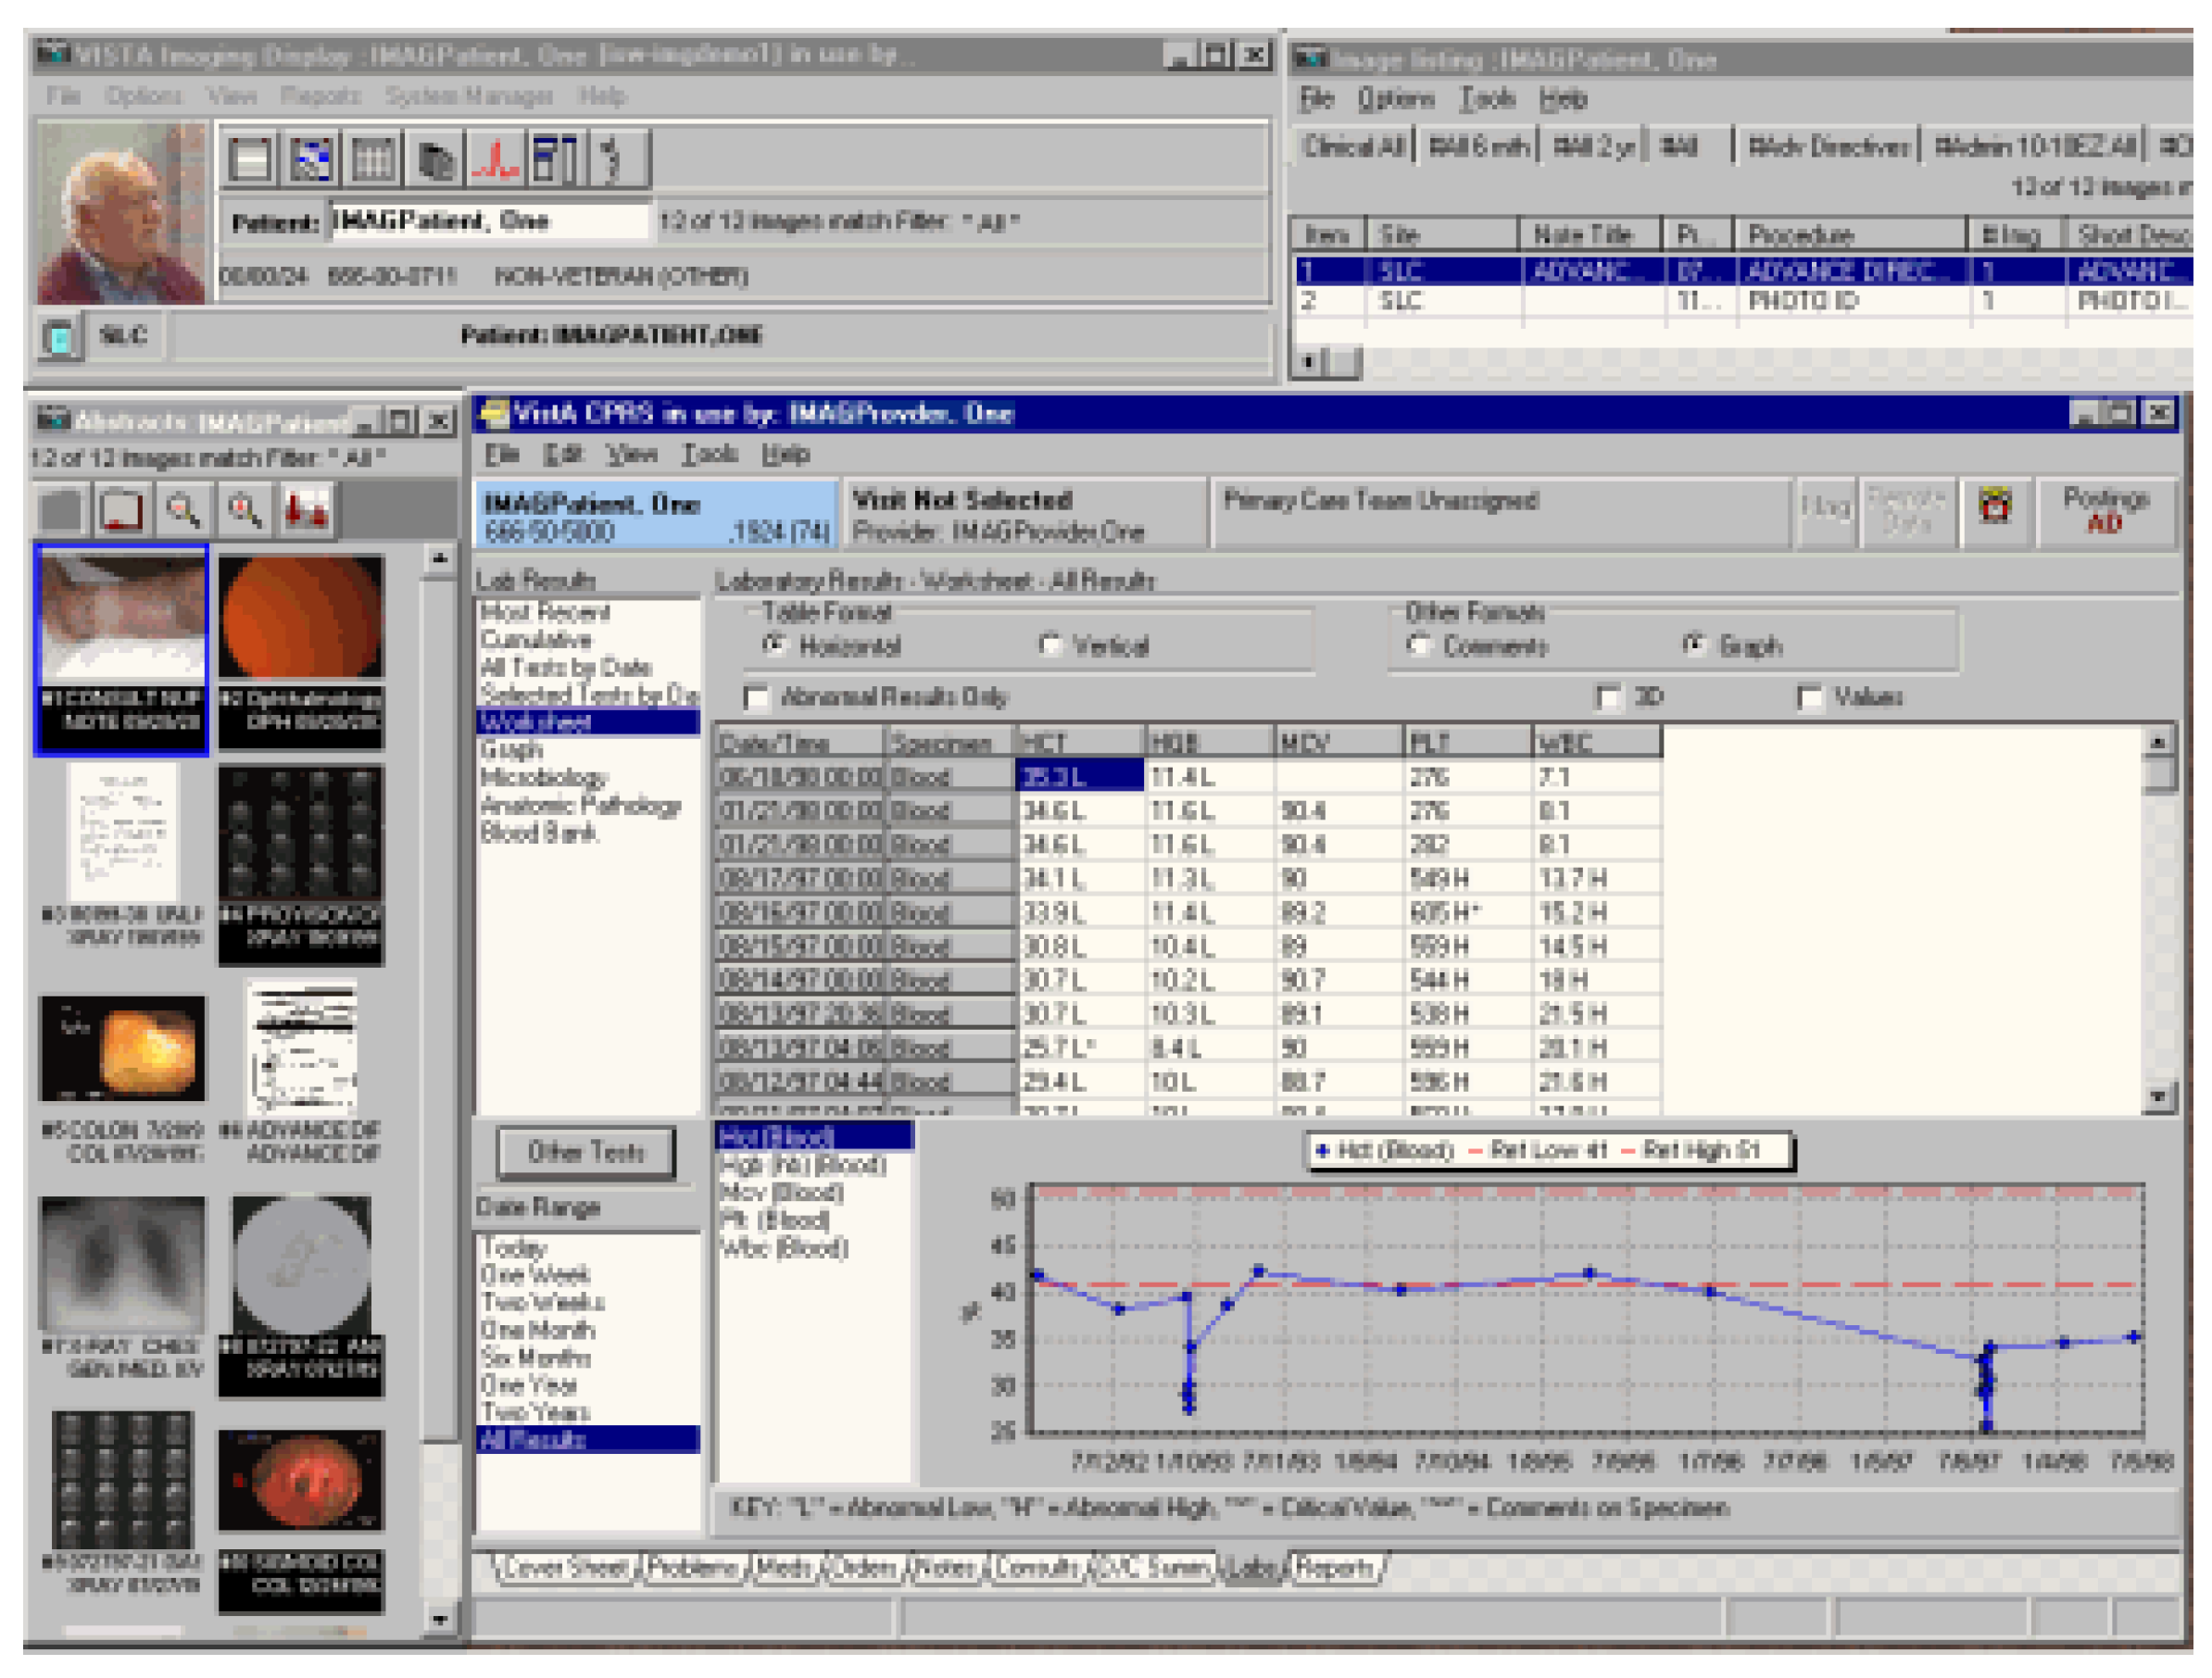
2.1. Bioinformatics Data Based Big Data Services

The 1000 Genomes Project provides 200 TB of genetic information on 2662 people worldwide, to researchers through AWS, and by its creation the NIH has established an environment for sharing and analyzing genetic data for research on diverse diseases [4,8]. Sharing of this genetic information has opened the possibility of developing new cures by providing prompt diagnostic services for new diseases, and through the sharing and analysis of genetic information related to intractable and incurable diseases. Figure 1 shows the results of a data search on the 1000 Genomes Project website. In addition, the National Cancer Institute (NCI) in the United States is pursuing services for sharing video data related to cancer and genome sequence data, amounting to petabyte, by 2014. Through the collection and analysis of 22 million veterans’ DNA samples and EHR, the VA provides medical services tailored to veterans, as shown in Figure 2, which supports medical examiners so that they can examine and treat individual patients with ease. By analyzing PB-scale clinical and genetic data stored on 25 data warehouses, they expect to realize very quick and close interactions between physicians and patients through more effective medical service support and detailed database [4,9]. Also, the UOIT hospital in Canada addresses the prevention and prediction of serious infections of premature babies with pathogens such as sepsis and pulmonary TB through the real-time analysis of the physiological data streams of over 90 million cases per day for each patient, generated from premature baby monitoring, including newborns’ blood pressure, body temperature, ECG, and blood oxygen saturation [10]. This approach makes it possible to start treatment before further aggravation of the condition by discovering infections and elucidating dangers at least 6–24 h earlier than the direct discovery of abnormal newborns’ signs by medical personnel.
Figure 1. National Institutes of Health (NIH)’s 1000 genomes project.
Symmetry 07 01275 g001
Figure 2. Veterans Affairs (VA)’s HER system.
Symmetry 07 01275 g002

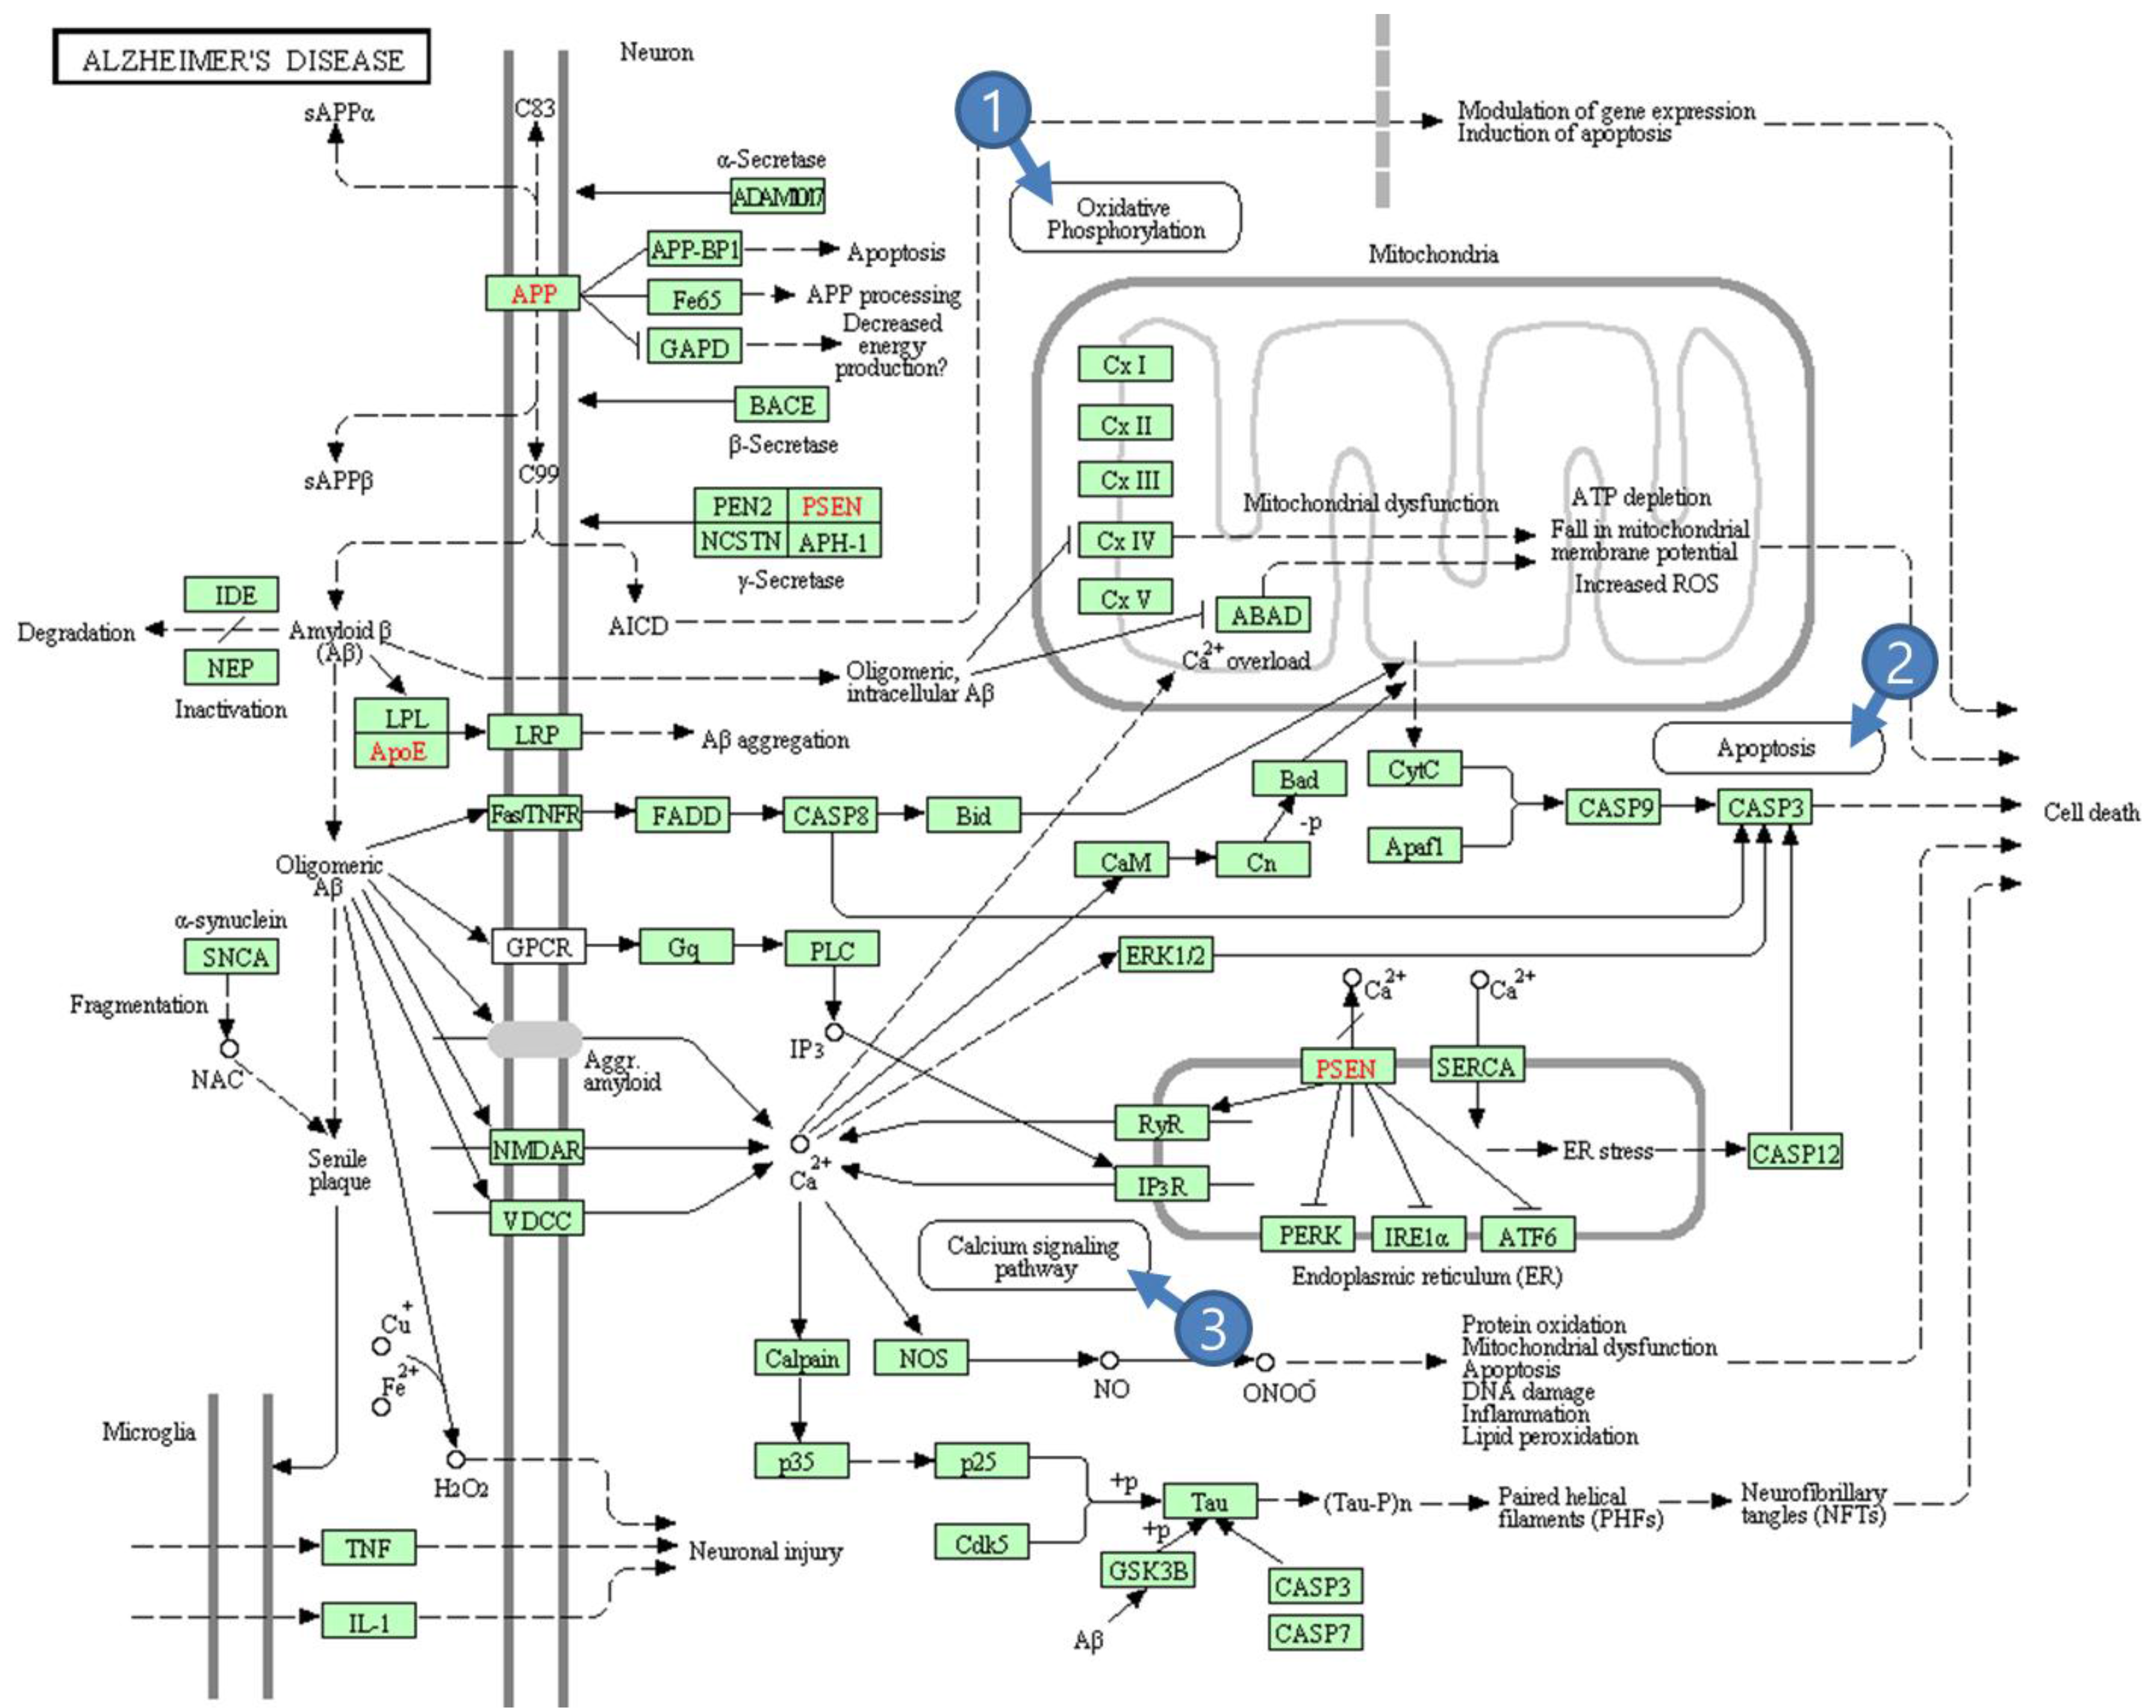
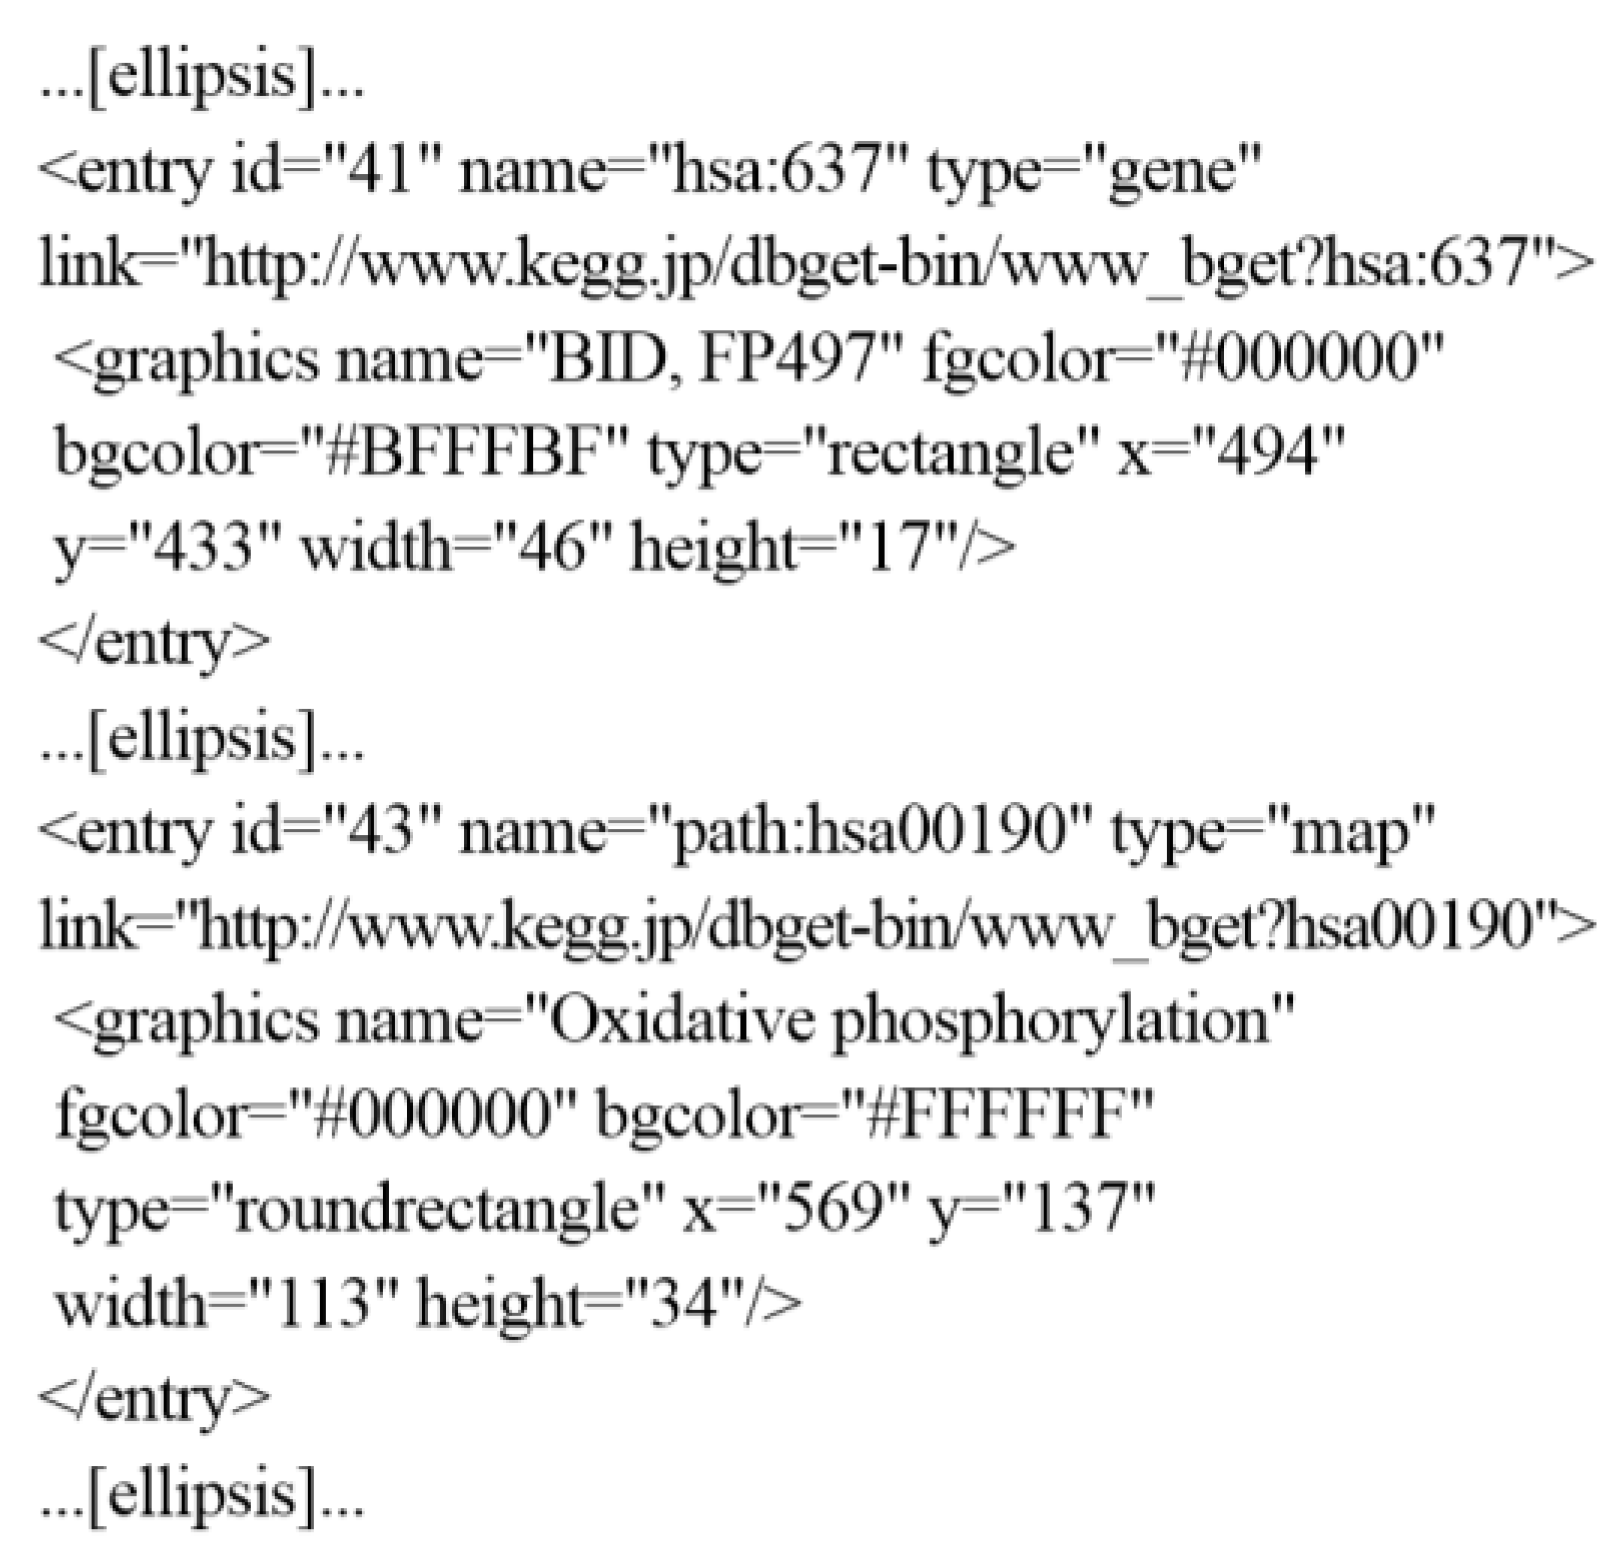
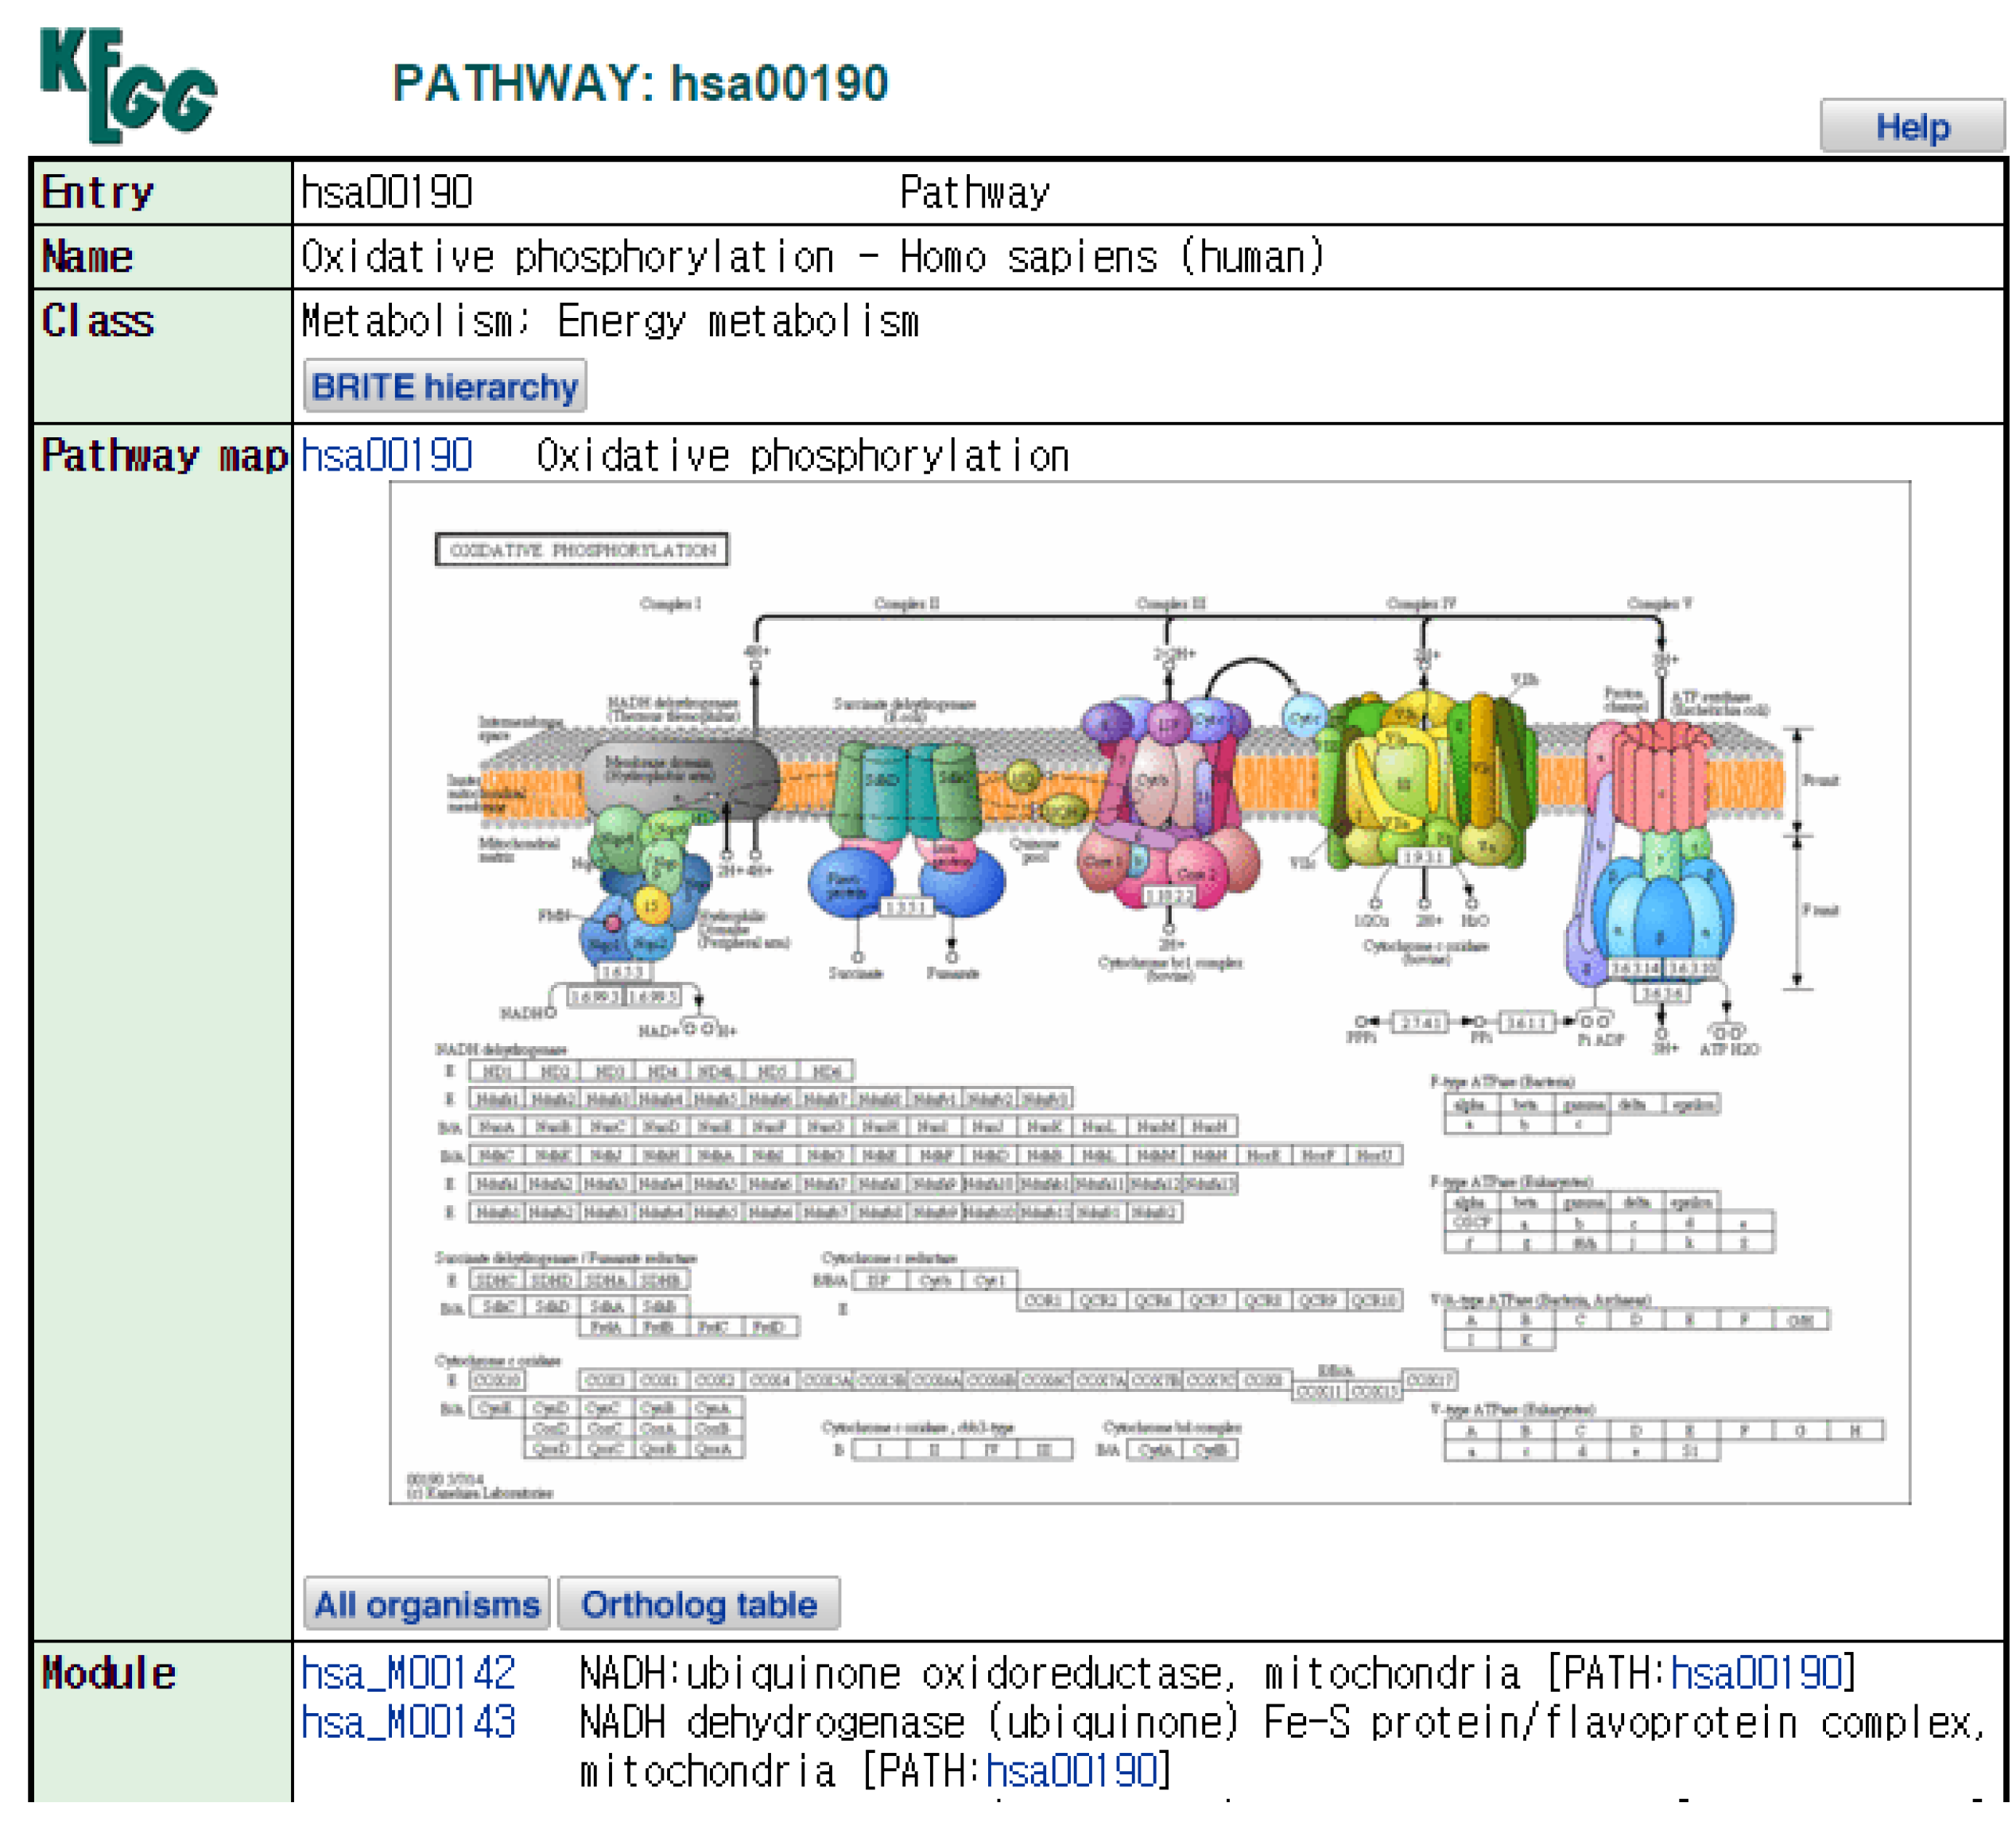
2.2. KEGG Pathway Database

Pathways are databases that elucidate and intuitively and visually express the mechanisms of the biological activities of all living beings including humans and diseases. Quality pathway databases play the role of bio-based knowledge resources that can effectively support key research activities in understanding the mechanisms of diverse organisms’ vital activities and the actual causes of the onset, development, natural extinction, and treatment of diseases in biology [16]. In addition, it can support the task of searching for emerging materials such as chemical synthesis and natural product extraction for the development of new drugs with new mechanisms in biomedicine. Recognizing the importance of pathways, which can be used in customized medicine and systematic research when combined with medical information, Kyoto University in Japan constructed a KEGG pathway database on metabolism, genetic information processing, environmental information processing, cellular processing, organismal systems, human diseases, and drug development in 1995 and continues to expand them even now. Figure 3 shows a has05010 pathway provided by the KEGG [11]. Pathways describe in detail not only dynamics and interactions among biological elements such as proteins, genes, and cells but also dynamics and interactions among pathways. As one example, Figure 3 shows interactions among a has05010 pathway, a has00190 (marked with ①), a has04210 pathway (marked with ②), and a has04020 pathway (marked with ③). However, because there is as yet no system whatsoever capable of conducting multidimensional analysis of various pathways, the collection of all pathways that have dynamics and interactions with specific pathways, and key pathway search, and finding clusters among meaningful pathways within the pathways collected, are today performed through researchers’ handwork. In addition, because they are large-scale big data with very diverse forms, KEGG pathway analysis requires a great deal of time and effort for analysis [12,16].
Figure 3. Kyoto Encyclopedia of Genes and Genomes (KEGG) pathways on Alzheimer’s disease (has05010).
Symmetry 07 01275 g003

3. Proposed Multidimensional Pathway Analysis System

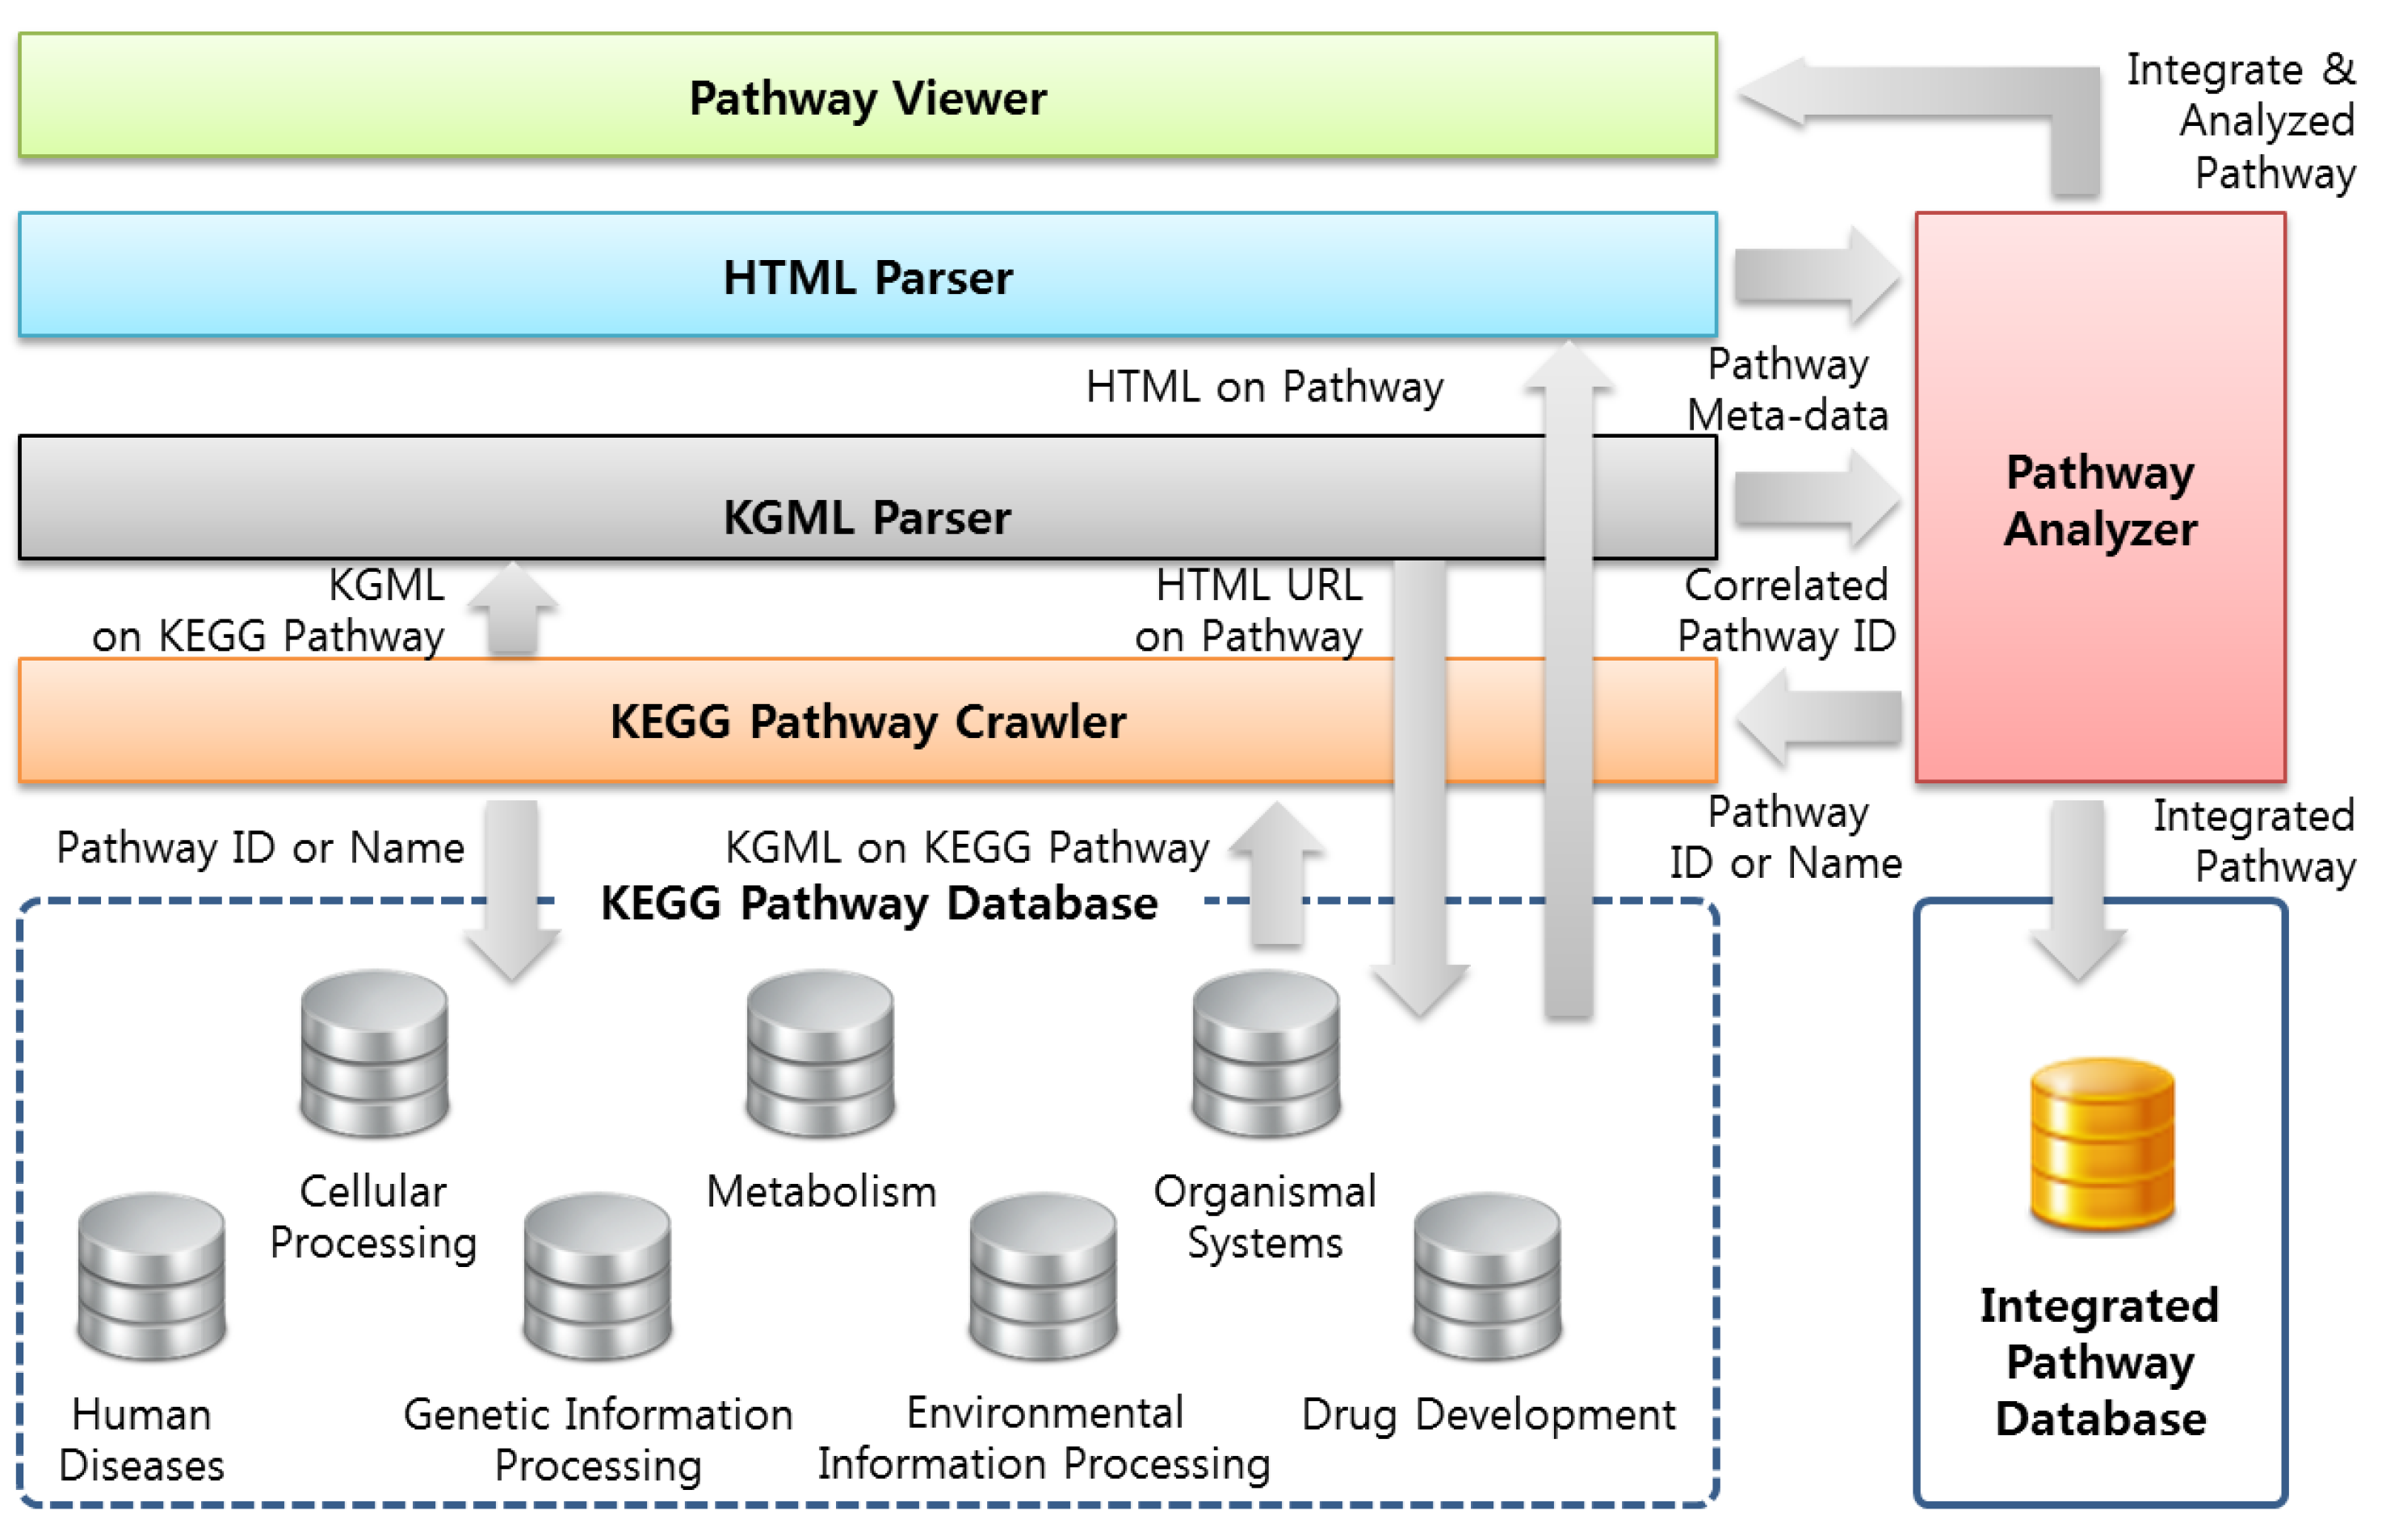
3.1. System Structure Diagram

The proposed multidimensional pathway analysis system consists of the KEGG Pathway Crawler, KGML Parser, HTML Parser, Pathway Analyzer, Integrated Pathway Database, and Pathway Viewer, as Figure 4. The KEGG Pathway Crawler collects KGML files related to the Pathway ID or Name inputted by a user from the KEGG pathway database.
Figure 4. The structure of the proposed multidimensional pathway analysis system.
Symmetry 07 01275 g004
The proposed system merges multiple pathways, which are all pathways connected with a specific pathway and included in the number of hops inputted by a user to a pathway network. The multiple pathways merge methodology used in our system is based on KEGGscape [18,19]. Algorithm 1 shows the proposed multiple pathways crawling algorithm.
KGML is a XML language that expresses the dynamics or interactions between proteins, genes, and cells that compose pathways and biological elements. Figure 5 shows a part of the KGML regarding a has05010 pathway. The KGML Parser obtains all links for pathways that have dynamics or interactions in the KGML collected from the KEGG Pathway Crawler. In KGML, entry elements having type = “map” as an attribute representing pathways, and the URLs of HTML documents representing meta-information on these pathways can be obtained through link attributes. For example, it is clear that an entry element with id = “43” in Figure 5 is a has00190 pathway related to a has05010 pathway through the type = “map” attribute, and the URLs of HTML documents with meta-information on the pathway can be obtained through link [21] attribute, as in Figure 6.
HTML documents regarding pathways provide the ID, Name, Class, KGM URL, and Description of these pathways; the Disease, Drug, and Gene related to the pathways; and meta-information on the pathways such as the Reference Authors, Title, and Journal that have obtained such information. The HTML Parser collects HTML documents from the HTML URLs collected from the KGML Parser and, from the documents collected, collects URLs that can collect meta-information on pathways, and on KGML regarding these pathways. In other words, all related pathways are collected by starting with a specific pathway, and collecting information on an hsa00190 pathway from KGML regarding a has05010 pathway, and collecting the next related pathways from KGML regarding an hsa00190 pathway. The Integrated Pathway Database stores meta-information on pathways collected from the HTML Parser and hierarchical (parent-child) structure information on the pathways collected. In addition, the Pathway Analyzer, which provides multidimensional analysis of the pathways thus collected, and the Pathway Viewer, which visualizes the analysis results, is explained in detail in Section 3.2 and Section 3.3.
Algorithm 1. Multiple pathways crawling.
H = The number of hops inputted by a user
PU = A pathway ID inputted by a user
NC = 0 // Count variable
NC = 0
MultiplePathwayCrawler(H, PU, NC++)
Function MultiplePathwayCrawler(H, PID, NC)
// PID = KEGGs Pathway ID
DK = Obtain a KGML on PID from the KEGGs pathway database
while (EM = Obtain entry elements with type =map”)
// The name of a pathway connected with a pathway of PID
PN = Obtain a value of the name attribute of EM
  // The URL of HTML of a pathway connected with a pathway of PID
  PL = Obtain a value of the link attribute of EM
  Integrated Pathway Database.Insert(PN, PL)
  if (NC + 1 ≤ H)
  MultiplePathwayCrawler(H, PN, NC++)
  END if
END while
END Function
Figure 5. KGML regarding has05010 pathway.
Symmetry 07 01275 g005
Figure 6. A HTML page regarding has00190 pathway.
Symmetry 07 01275 g006

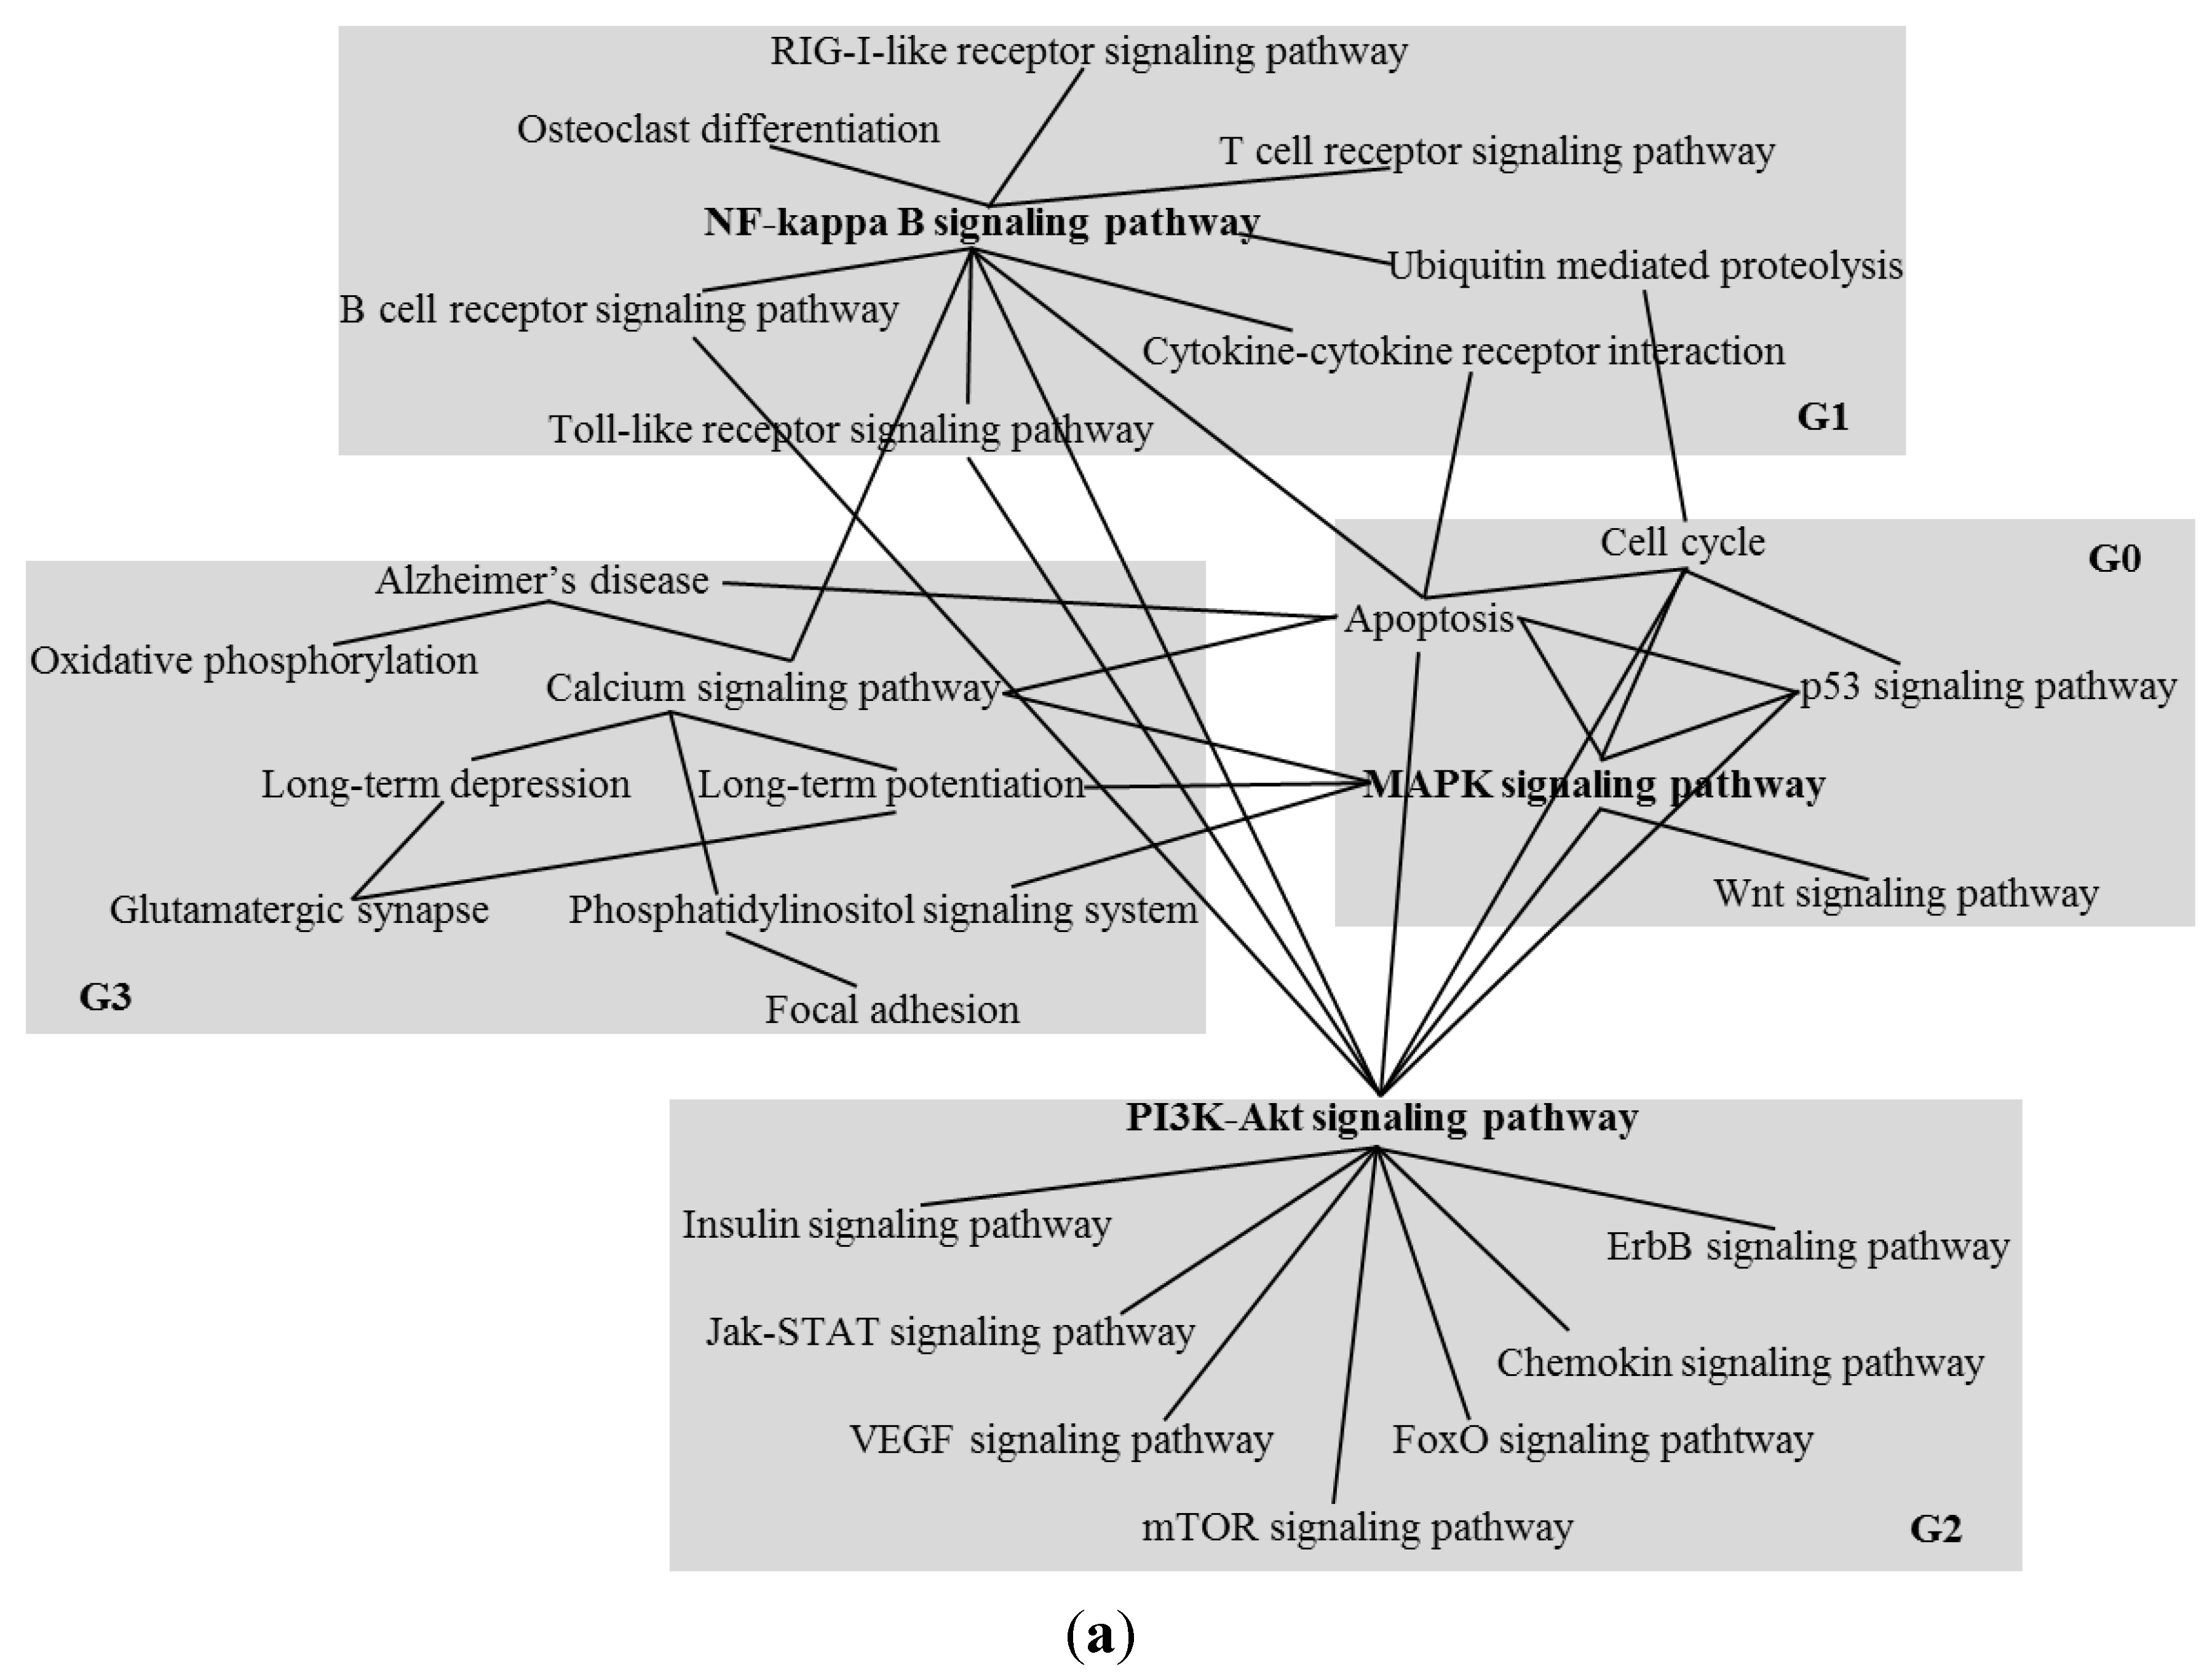
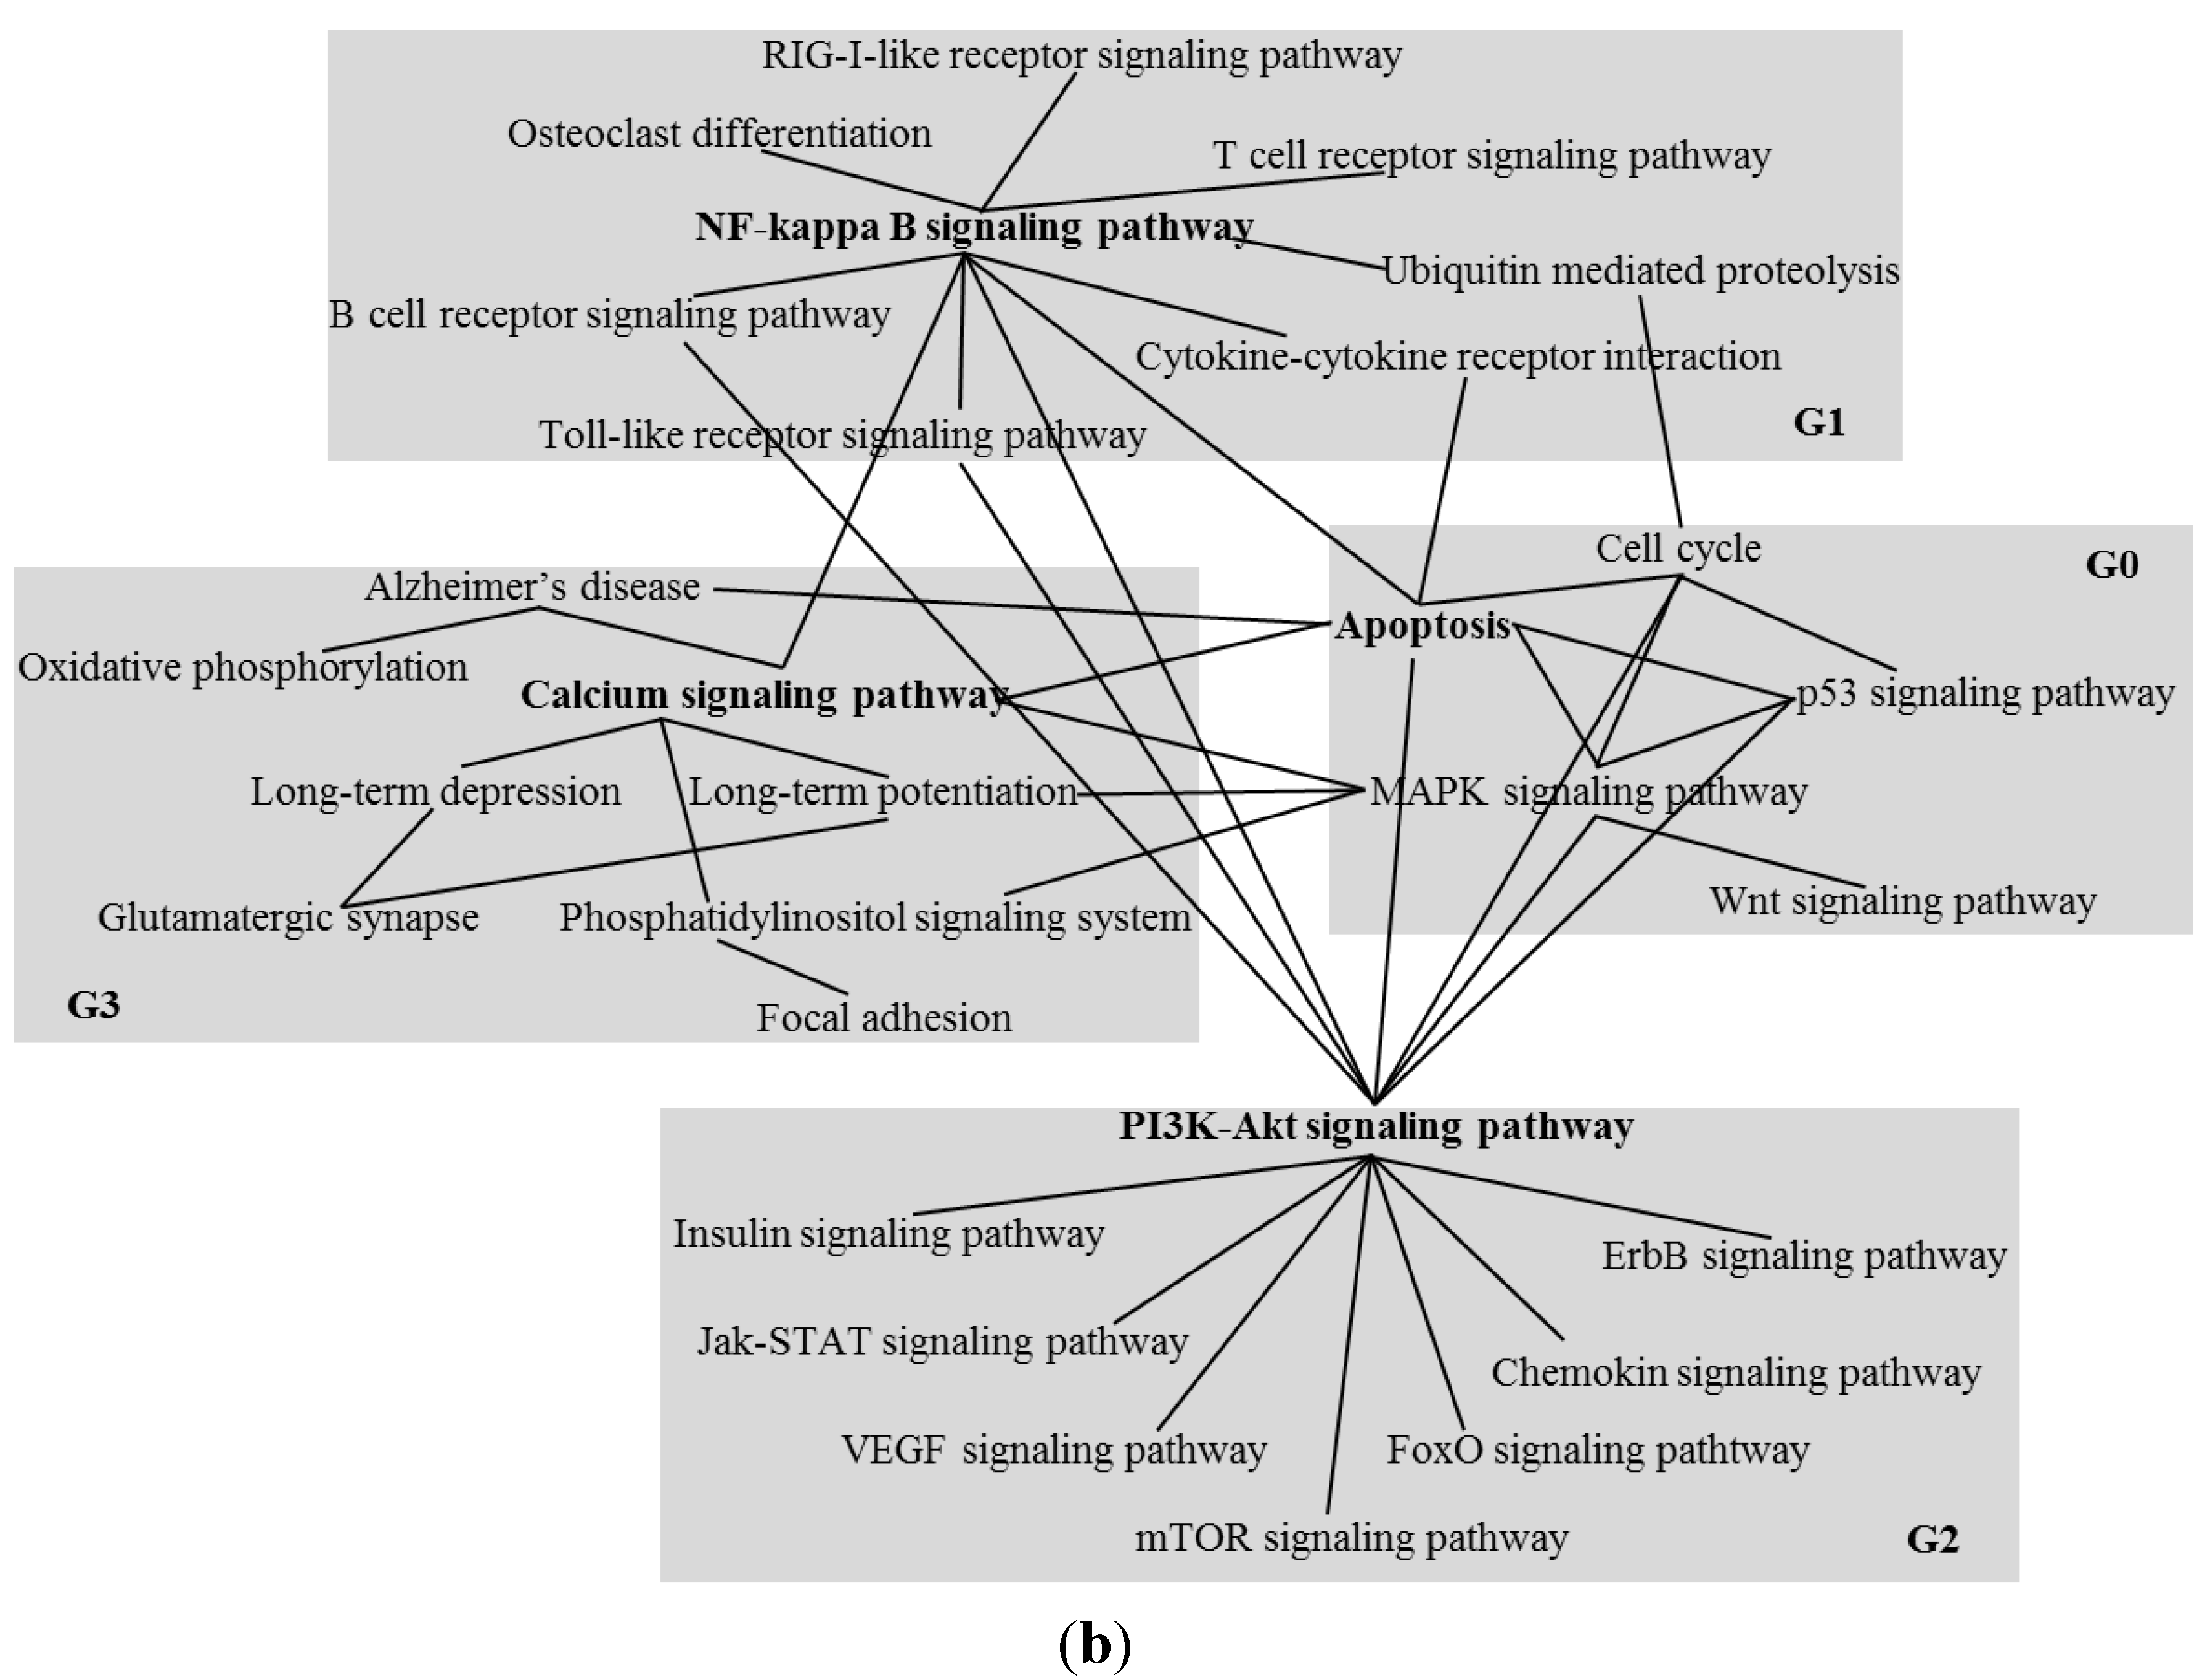
3.2. Pathway Analyzer for Pathway Analysis

The Pathway Analyzer provides the functions of clustering the pathways collected and selecting key pathways within cluster groups. The clustering function reorganizes only pathways with dynamics or interactions among pathways closer than those of other pathways, into identical groups, and can be used efficiently to classify large-scale pathways. As for the clustering technique supported by the Pathway Analyzer, a modularity-based large-scale graph clustering technique [22] was applied to suit pathways. In [22], the authors define a graph clustering and a modularity for a graph clustering as follows. A graph(V,f) consist of a finite set V of vertices and a function f:V × VN that assigns a nonnegative edge weight to each vertex pair. For simplicity, graphs are assumed to be undirected, i.e., f(u,v) = f(v,u) for all u,v V. The degree deg(v) of a vertex v is the total weight u V f ( u , v ) of its edges. The degrees and weights are naturally generalized to sets of vertices, e.g., f(V,V) = u V , v V f ( u , v ) . Note that deg(V) = f(V,V). A graph clustering C = {C1, …, Ck} partitions the vertex set V into disjoint non-empty subsets Ci. Modularity is a quality measure for graph clusterings. The all edge weights of a pathway network in the proposed system are either 0 or1 because the edge weight of a pathway network represents a connection between two pathways. The modularity of a clustering C is defined as:
Q ( C )   =   C C ( f ( C , C ) f ( V , V )   deg ( C ) 2 deg ( V ) 2 )
The key pathway selection function involves the selection of pathways of high importance within a single cluster group, and the selection criteria are as in Algorithm 2.
Algorithm 2. Key pathway selection standards within cluster groups.
QN = (Num of nodes connected with a node/Num of all nodes in a cluster) × 100
QU = User threshold
ArrayList Results
 
for (CN = Num of all clusters; CN > 0; CN = CN-1)
for (V = 1; VNum of all nodes in a cluster; V++)
  if (QNQU && VC == CN) Results.add(V) // VC = Num of connections on other clusters
  else if (QNQU) Results.add(V)
  else if (VC == CN) Results.add(V)
END for
if (Results.size() > 0) return Results
END for

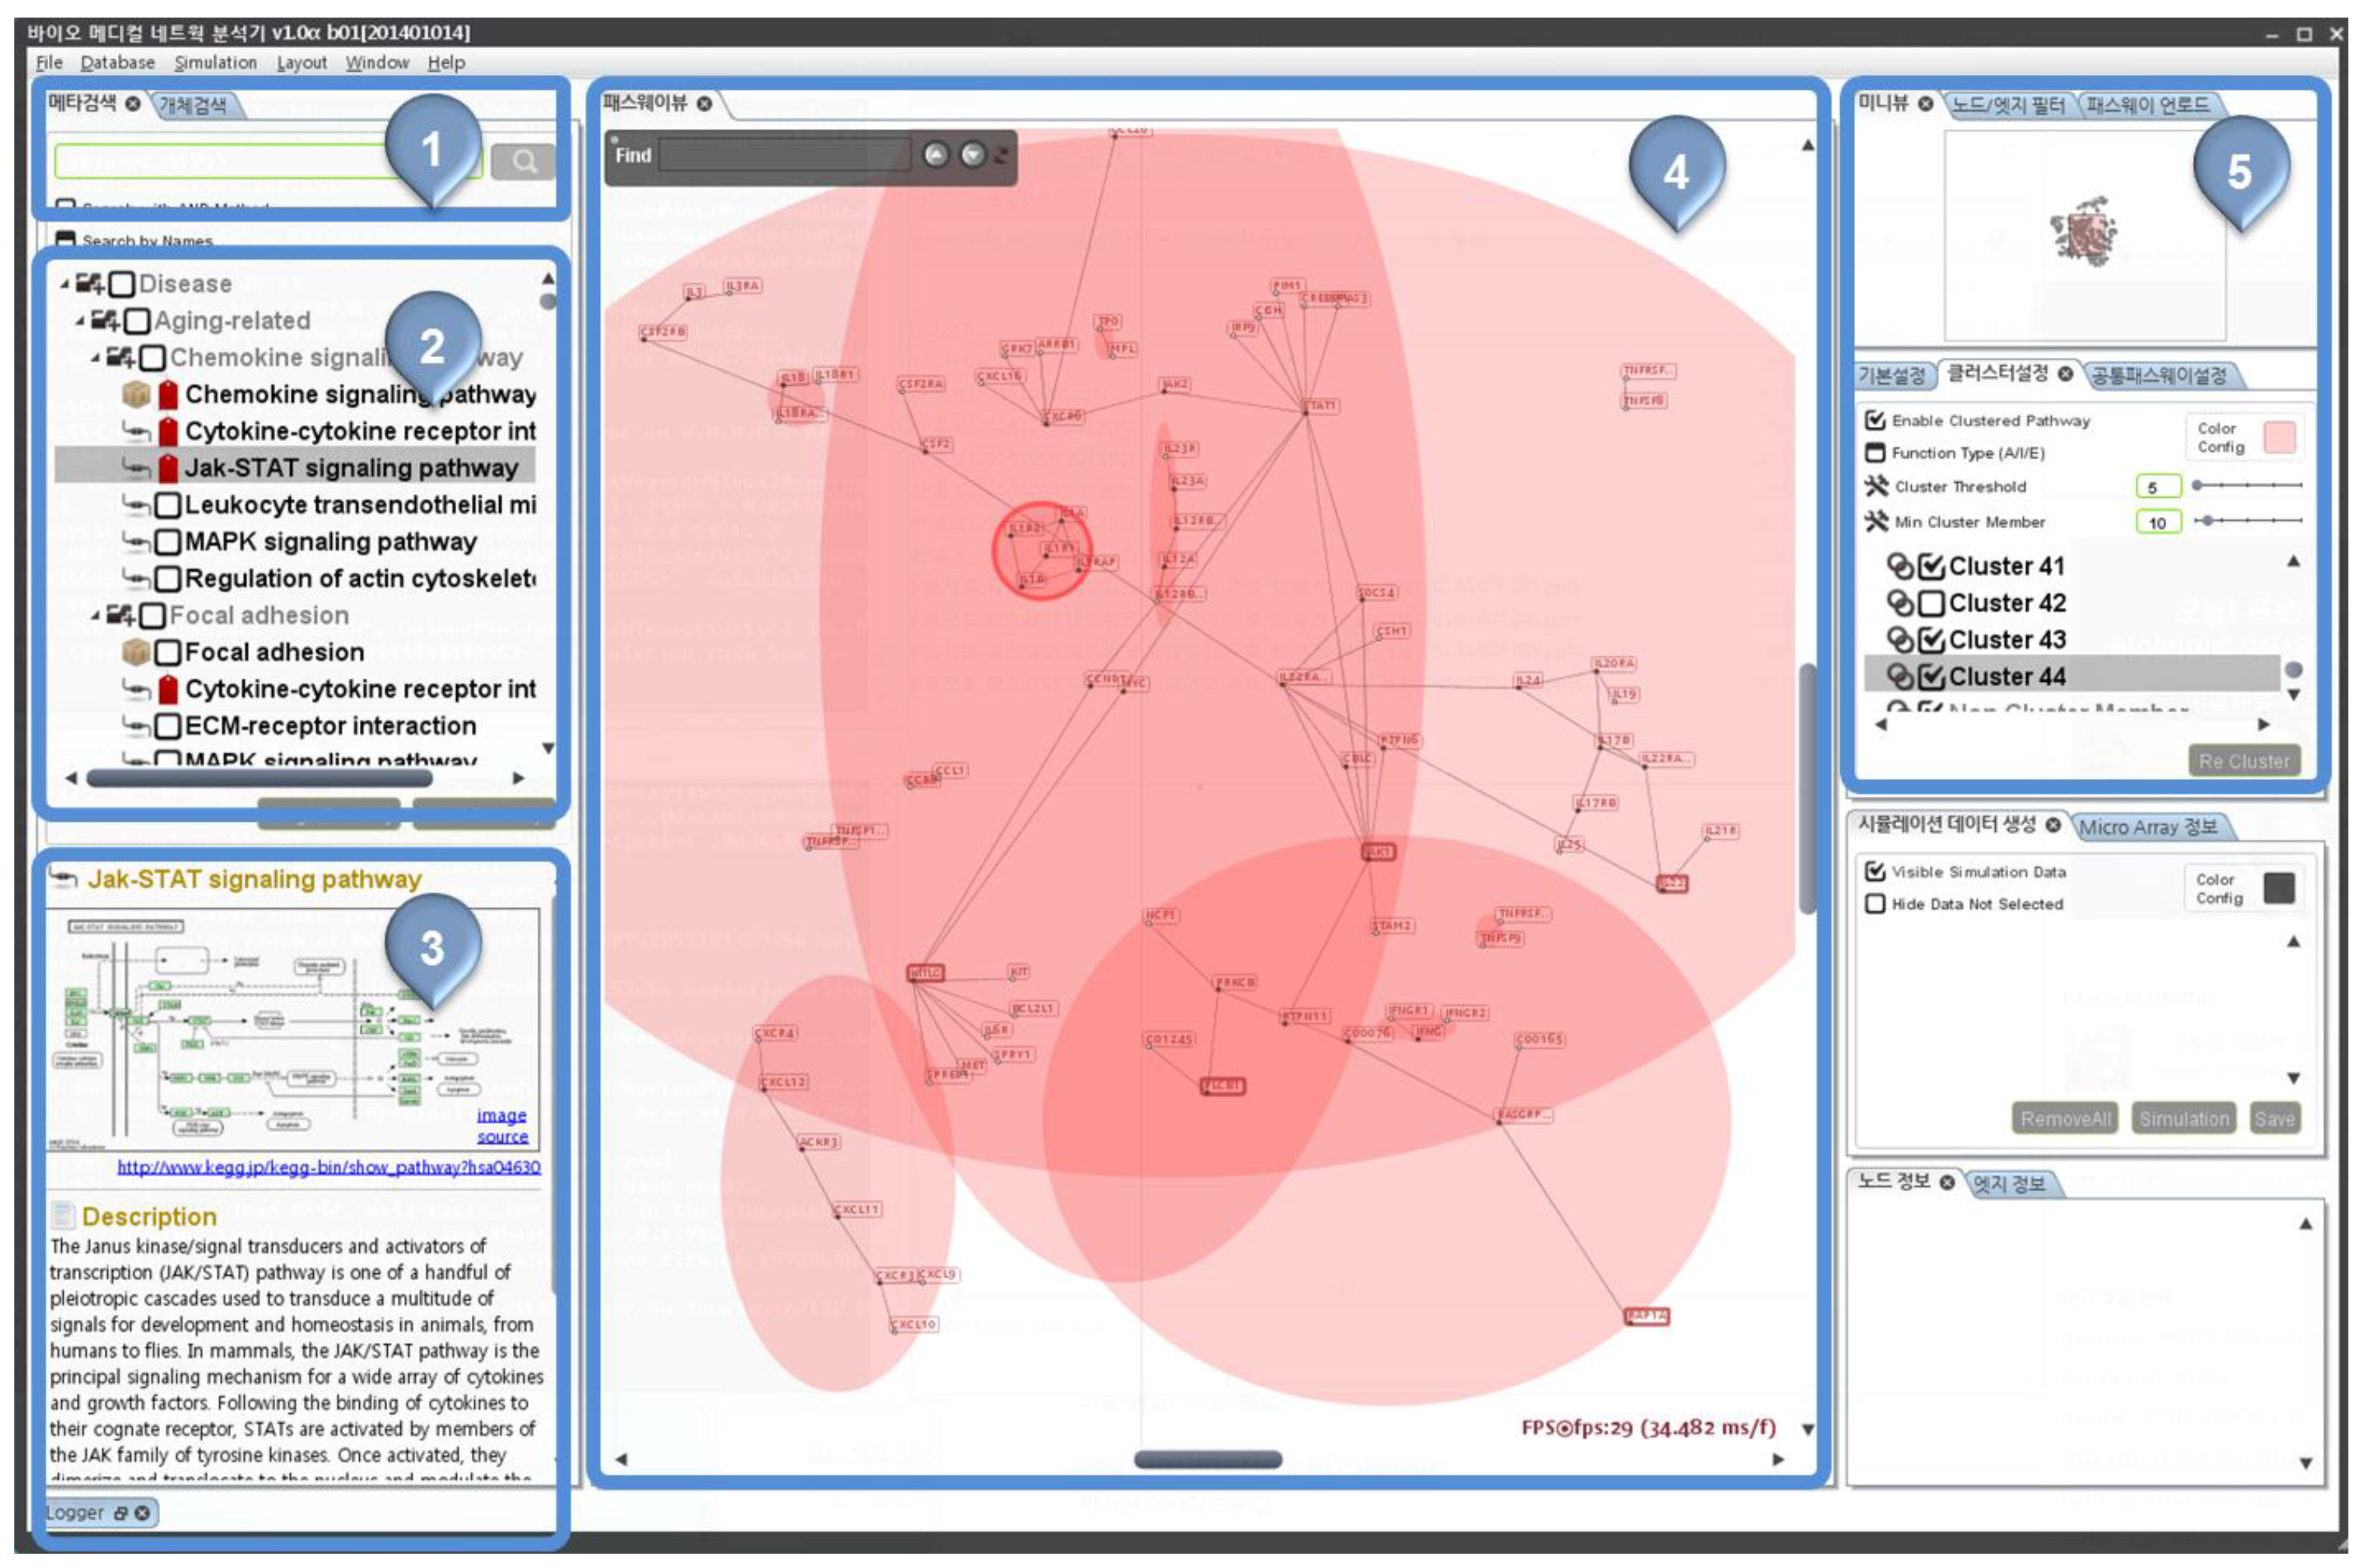
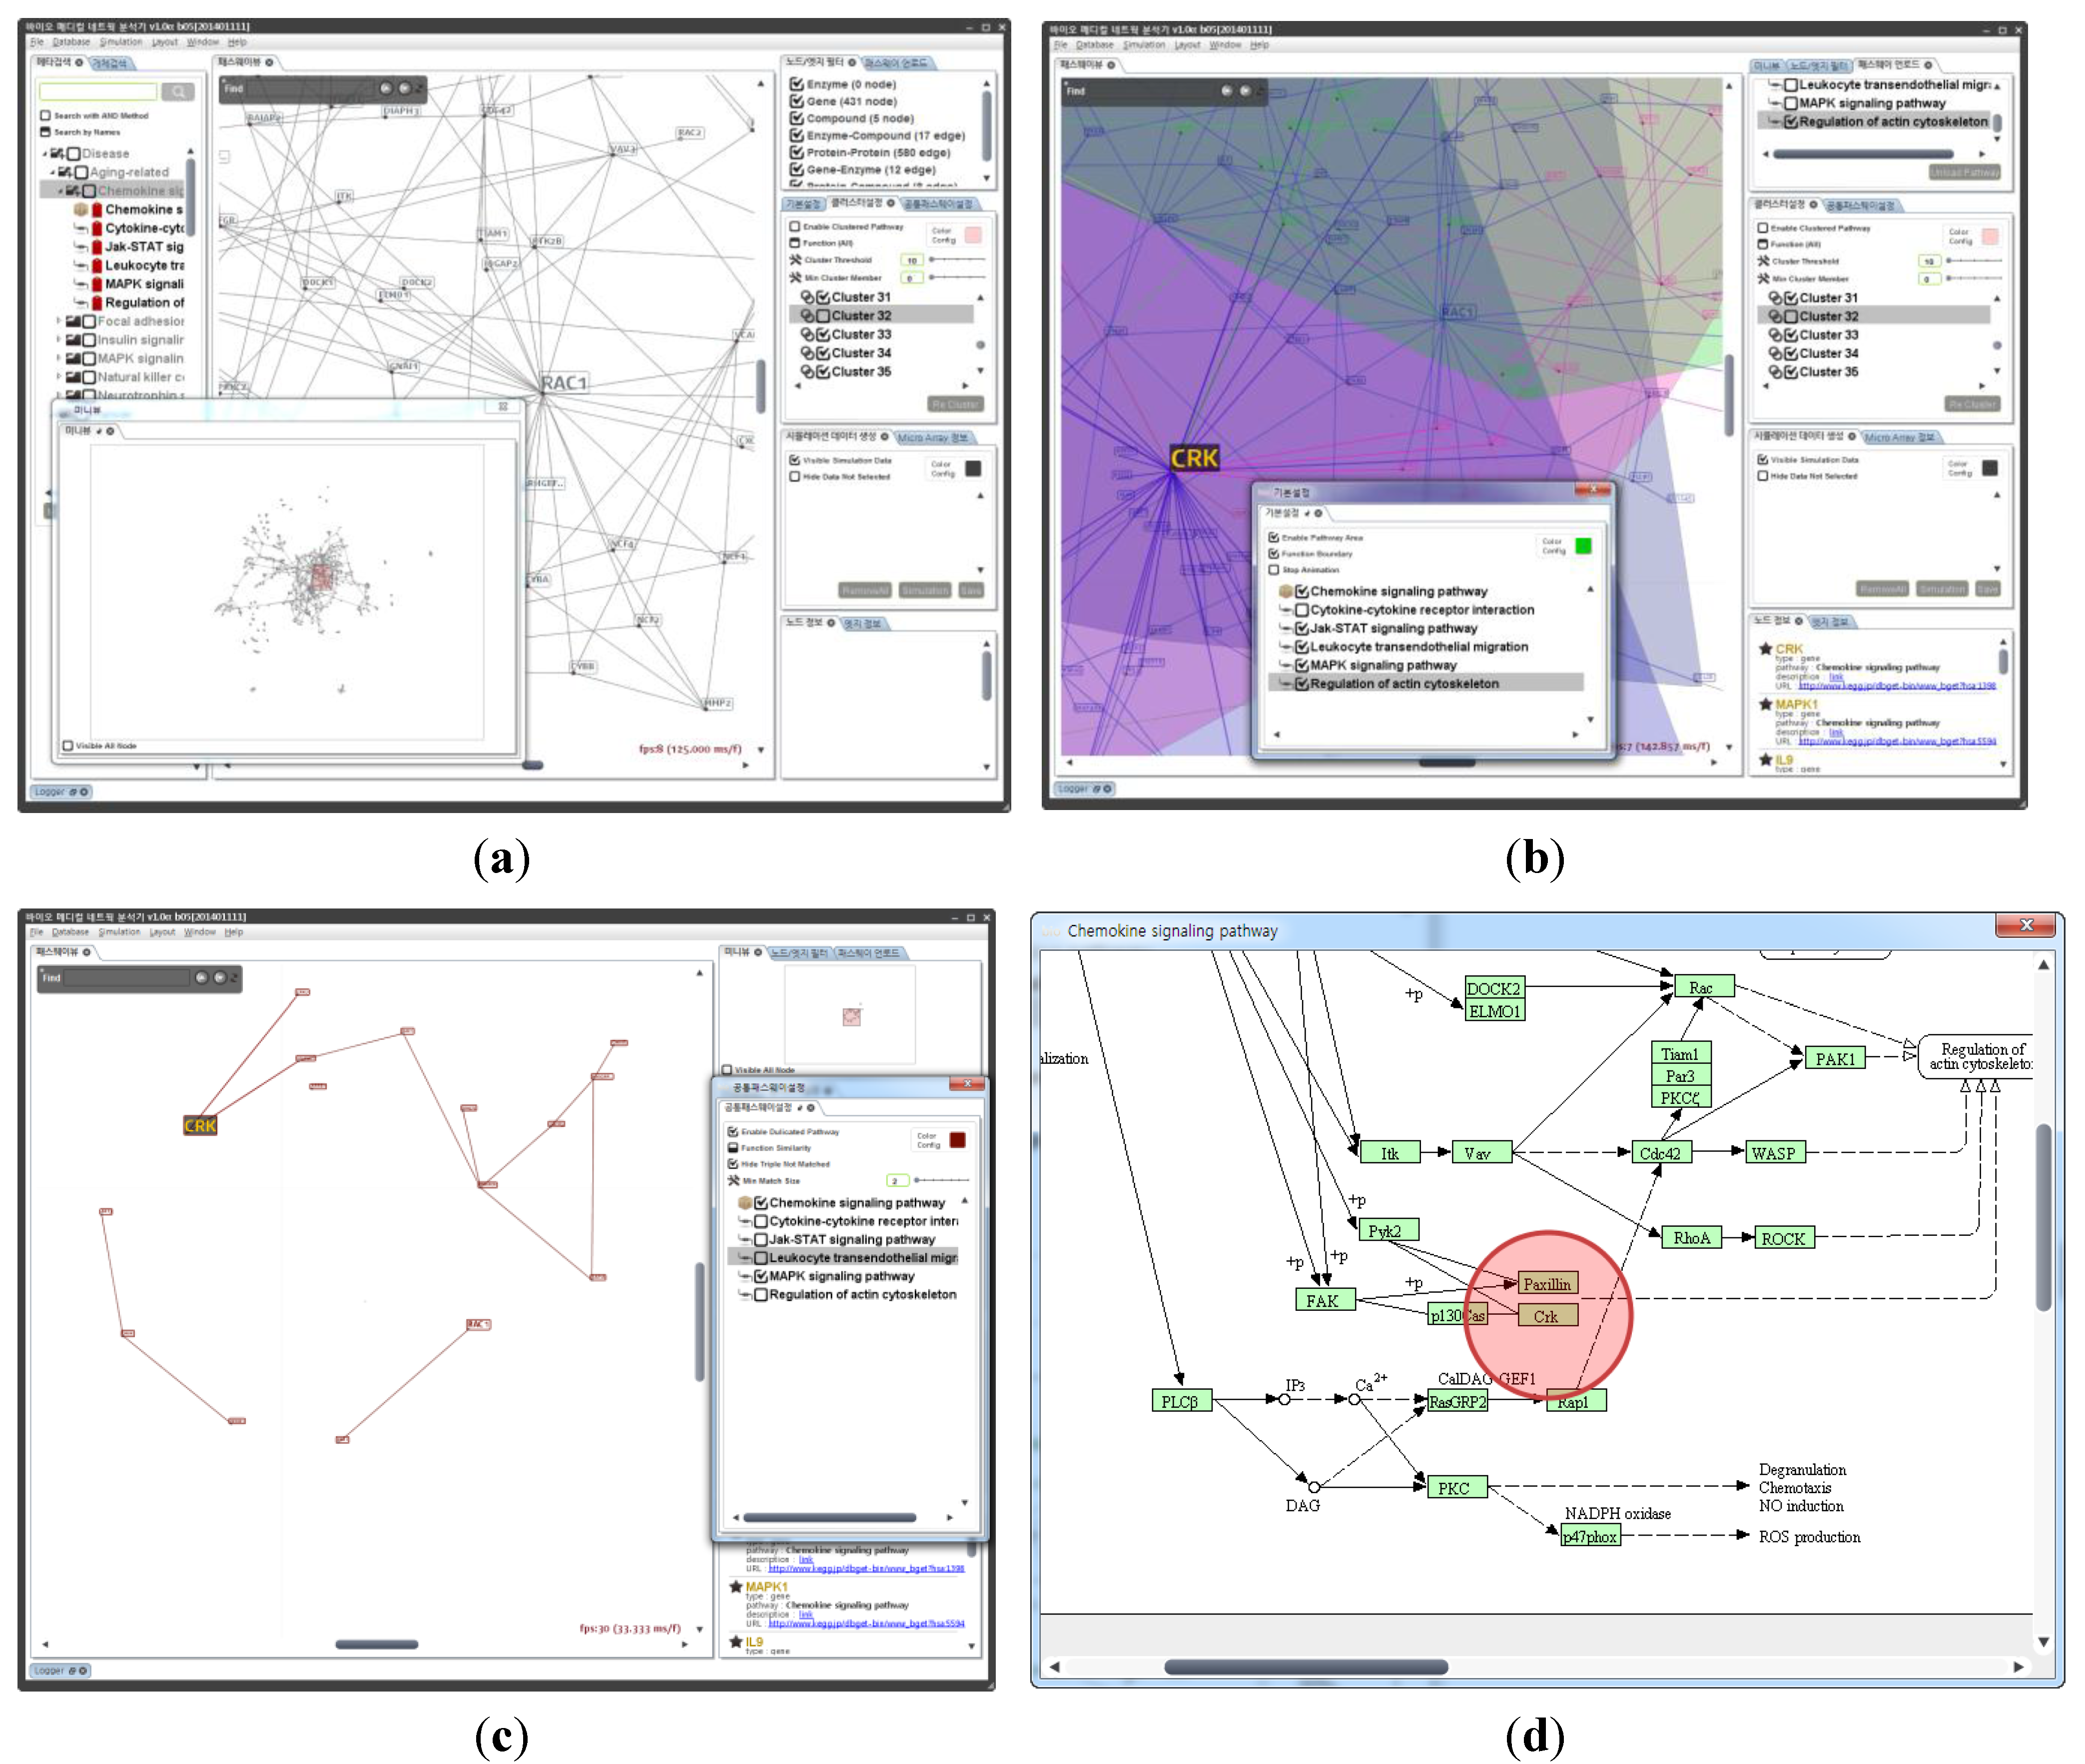
3.3. Pathway Viewer for Pathway Visualization

Figure 7 shows the user interfaces (UIs) of the proposed system. ① provides the function of collecting all pathways included in deg(V) from the KEGG pathway database, starting with the Pathway ID or Name inputted. ② provides the function of showing in a tree form the hierarchical structures of all pathways collected with a specific pathway as the standard. ③ provides the function of visualizing meta-information and description on the Pathway selected through ②. ④ provides the function of visualizing all pathways collected with specific pathways as the standard as graphs. Also, a user can change the clustering options such as deg(V) or Q(C) and filter pathways visualized in ④ through cluster group names in ⑤.
Figure 7. User interfaces (UIs) of the proposed multidimensional pathway analysis system.
Symmetry 07 01275 g007
Figure 8 shows a visualization functions proposed multidimensional pathway analysis system for mass network analysis. In Figure 8a, the network navigator provides a mini-view on a mass network. The user can travel quickly on a mass network. As shown in Figure 8b, a network painter paints each pathway network with user preferred colors. The user can distinguish complex network relationships easily. Figure 8c shows how the network filter filters some pathway networks with user filter options. The user can display the only pathway networks user is interested in. In Figure 8d, the component finder displays the pathway position in KEGG pathway map. The user can check the pathway information for the node selected in a mass network.
Figure 8. Visualization functions for mass network analysis. (a) Network navigator; (b) Network Painter; (c) Network filter; (d) Component Finder.
Symmetry 07 01275 g008

4. Performance Evaluation

The proposed multidimensional pathway analysis system was developed using Java 1.7, and the Integrated Pathway Database was constructed using Mysql 5.0. Table 1 shows the results of collecting all pathways included in deg(3) with a has05010 pathway as the standard, establishing the number of cluster groups as four, and selecting clustering and key pathways according to changes in the threshold value. In Figure 9a, QU = 100 so that, to be selected as key pathways, there must be connections to all pathways within identical cluster groups. However, because there was no pathway connected to all pathways within identical groups in the case of cluster group G3, key pathways were not selected. In addition, in the case of cluster group G0, while there were pathways connected to all pathways within identical groups, there were no pathways connected to all cluster groups. Consequently, the mitogen-activated protein kinase (MAPK) signaling pathway, which was the pathway connected to the two next smallest cluster groups, was selected as a key pathway. In Figure 9b, QU = 80 so that, to be selected as key pathways, there must be connections to 80% or more of other pathways within identical cluster groups. Consequently, even within cluster group G3, from which no key pathways had been selected when QU = 100, the calcium signaling pathway was selected as a key pathway. In addition, within cluster groups G0, apoptosis, which satisfied QU = 80 and had the most connections to other clusters, was selected as a key pathway. It has thus become possible for users to analyze the dynamics or interactions among pathways intuitively through clustering and key pathway selection with respect to the pathways collected.
Figure 9. Results of clustering and key pathway selection (Bold means key pathways). (a) Cluster group = 4, QU = 100; (b) Cluster group = 4, QU = 80.
Symmetry 07 01275 g009aSymmetry 07 01275 g009b

5. Conclusions and Future Research

The present study automatically collected only pathways of interest to users from the KEGG pathway database, which is unsurpassed around the globe and provides a vast amount of pathways. The study constructed networks based on hierarchical structures among pathways, and developed a system that can intuitively analyze the dynamics or interactions among pathways through clustering and key pathway selection related to these pathway networks. For future research, a function that makes it possible to efficiently search for sub-networks of interest to users, and similar networks within large-scale pathway networks, will be added. In addition, if there are open source-based bionetwork analysis systems, the excellence of the system developed in the present study will be demonstrated even more clearly by conducting a performance evaluation with them.

Acknowledgments

This work was supported by the “Development of biomedical data network analysis technology based on high performance computing for dementia researches (K-15-L03-C02-S02)” funded by Korea Institute of Science and Technology Information and “Construction of application system for herbal resource using ICT (K15433)” funded by Korea Institute of Oriental Medicine.

Author Contributions

This paper is largely written by Dongmin Seo based on his earlier work. Dongmin Seo conceived the main idea and developed the system proposed in this paper. Min-Ho Lee helped to improve the main idea. Seok Jong Yu helped to verify the experimental results.

Conflicts of Interest

The authors declare no conflict of interest.

References

  1. Seo, D.M.; Jung, H.M. Intelligent Web Crawler for Supporting Big Data Analysis Services. J. Korea Contents Assoc. 2013, 13, 575–584. [Google Scholar] [CrossRef]
  2. Sung, W.K.; Lee, S.H.; Jung, H.M.; Park, K.S.; Lee, S.W.; Kim, S.T.; Hwang, M.N.; Jo, M.H. Planning Research for Digging Promotion Works on Scientific Technology Big-Data and Maximizing Utilization; Ministry of Education and Science Technology: Seoul, Korea, 2013. [Google Scholar]
  3. Hsieh, J.C.; Li, A.H.; Yang, C.C. Mobile, Cloud, and Big Data Computing: Contributions, Challenges, and New Directions in Telecardiology. Int. J. Environ. Res. Public Health 2013, 10, 6131–6153. [Google Scholar] [CrossRef] [PubMed]
  4. Yun, M.Y. Global Advanced Cases on Big-Data; National Information Society Agency: Seoul, Korea, 2012. [Google Scholar]
  5. Brahami, M.; Atmani, B.; Matta, N. Dynamic Knowledge Mapping Guided by Data Mining: Application on Healthcare. J. Inf. Process. Syst. 2013, 9, 1–30. [Google Scholar] [CrossRef]
  6. Silachan, K.; Tantatsanawong, P. Imputation of Medical Data Using Subspace Condition Order Degree Polynomials. J. Inf. Process. Syst. 2014, 10, 395–411. [Google Scholar] [CrossRef]
  7. Vanus, J.; Kucera, P.; Martinek, R.; Koziorek, J. Development and Testing of a Visualization Application Software, Iimplemented with Wireless Control System in Smart Home Care. J. Hum. Centric Comput. Inf. Sci. 2014, 4. [Google Scholar] [CrossRef]
  8. 1000 Genomes. Available online: http://1000genomes.org (accessed on 19 June 2015).
  9. U.S. Department of Veterans Affairs. Available online: http://www.va.gov/health/ (accessed on 19 June 2015).
  10. Baek, I.S.; Park, J.H. Data Era: Importance of Data Analysis; IT & Future Strategy: Seoul, Korea, 2013. [Google Scholar]
  11. KEGG PATHWAY Database. Available online: http://www.genome.jp/kegg/pathway.html (accessed on 19 June 2015).
  12. Gomez-Vela, F.; Diaz-Diaz, N. Gene Network Biological Validity Based on Gene-Gene Interaction Relevance. Sci. World J. 2014, 2014, 540679:1–540679:11. [Google Scholar] [CrossRef] [PubMed]
  13. Dehmer, M. Information Theory of Networks. Symmetry 2011, 3, 767–779. [Google Scholar] [CrossRef]
  14. Garlaschelli, D.; Ruzzenenti, F.; Basosi, R. Complex Networks and Symmetry I: A Review. Symmetry 2010, 2, 1683–1709. [Google Scholar] [CrossRef]
  15. Chambers, D.; Flapan, E. Topological Symmetry Groups of Small Complete Graphs. Symmetry 2014, 6, 189–209. [Google Scholar] [CrossRef]
  16. Lee, J.K.; Kang, T.H.; Yoo, J.S. Design and Implementation of Protein Pathway Analysis System. J. Korea Contents Assoc. 2005, 5, 31–40. [Google Scholar]
  17. Cytoscape. Available online: http://www.cytoscape.org (accessed on 19 June 2015).
  18. Nishida, K.; Ono, K.; Kanaya, S.; Takahashi, K. KEGGscape: A Cytoscape App for Pathway Data Integration. F1000Research 2014, 3. [Google Scholar] [CrossRef] [PubMed]
  19. KEGGscape. Available online: http://apps.cytoscape.org/apps/keggscape (accessed on 19 June 2015).
  20. KGMLReader. Available online: http://apps.cytoscape.org/apps/kgmlreader (accessed on 19 June 2015).
  21. PATHWAY: hsa00190. Available online: http://www.kegg.jp/dbget-bin/www_bget?hsa00190 (accessed on 14 July 2015).
  22. Noack, A.; Rotta, R. Multi-Level Algorithms for Modularity Clustering. Lect. Notes Comput. Sci. 2009, 5226, 257–268. [Google Scholar]

