Article

Implicit and Explicit Preferences for Golden Ratio

1
Ph.D. Program in Behavioural Neuroscience, Department of Psychology, Sapienza University of Rome, 00185 Rome, Italy
2
Department of Psychology, Sapienza University of Rome, 00185 Rome, Italy
3
Smart Lab, IRCCS Santa Lucia Foundation, 00179 Rome, Italy
*
Author to whom correspondence should be addressed.
Symmetry 2024, 16(3), 333; https://doi.org/10.3390/sym16030333
Submission received: 22 January 2024 / Revised: 1 March 2024 / Accepted: 6 March 2024 / Published: 9 March 2024
(This article belongs to the Special Issue Symmetry/Asymmetry in Life Sciences: Feature Papers 2024)

Abstract

:
The golden ratio, also known as Phi (ϕ ≈ 1.618034), attracted the interest of mathematicians, artists, and intellectuals for many centuries, probably from when it was discovered in human anthropometry. Even in recent times, researchers found the presence of the golden ratio in Renaissance paintings and aesthetic preferences. The reasons behind the fascination with the golden ratio remain unclear, but it has been suggested that stimuli containing this proportion are often perceived as beautiful. However, evidence is conflicting, and the literature struggles to establish the existence of individual preferences for the golden ratio. To gain new insights into the nature of these preferences, one hundred participants completed an implicit association task, with either golden ratio or random stimuli presented with positive or negative words. Participants initially categorized the stimuli based on their assigned categories. Then, we assessed their explicit preferences by asking them to rate the stimuli in terms of pleasantness and by completing a line bisection task and the Ultimatum Game. The results revealed the typical effects observed in implicit association tasks, with improved response times and accuracy when golden ratio stimuli were associated with positive word categories. In contrast, explicit ratings yielded mixed results. We discuss our findings in relation to previous studies that have explored this issue, highlighting the ongoing debate surrounding preferences for the golden ratio.

1. Introduction

1.1. The Golden Ratio: From Art to Psychology

The golden ratio, also known as Phi (ϕ), is an irrational number, approximately equal to 1.618034, which results when a straight line is cut so that the proportion between the shorter part and the longer part is the same as that between the longer part and the whole [1]. The power of its fascinating nature captured the attention of human beings since the ancient Greeks, who considered it as a benchmark for beauty. Recent studies even discovered the presence of golden sections in the Creation of Adam, the famous Renaissance painting by Michelangelo Buonarroti [2,3] (Figure 1a). Although the reasons why mathematicians and artists were so fascinated by the golden ratio remain unclear, evidence points to the existence of an aesthetic preference for the golden proportion (for a discussion on the theoretical accounts see [1]). The initial empirical investigations required participants to identify the most aesthetically pleasing rectangle from a variety of options implemented with different base-to-height ratios, including one with the golden ratio. For instance, the pioneering study by Fechner [4] showed that, out of 10 distinct rectangles, the most chosen (by 35% of participants) was the golden rectangle (Figure 1b). However, similar studies provided either supporting [5] or contrasting evidence [6]. In the review by Green [7], the contrasting viewpoints between authors who interpret findings in support of the golden ratio preference, and authors who view it as a mathematical superstition perpetuated by flawed methodological parameters is highlighted (see also [1], for a more recent review). Further studies show that the golden ratio not only evokes an aesthetic preference, but it could also be implicitly involved in unexpected aspects of our life. For instance, Iosa and colleagues [8] investigated the gait ratios in patients with Parkinson’s Disease and found that the ratios between successive gait phases, which are close to the golden ratio in healthy subjects [9], are altered in these patients. Moreover, Belluscio et al. [10] used information based on the golden ratio for developing auditory cues to facilitate the gait of patients with Parkinson’s Disease, by restoring the physiological harmonic flow of movements relying on the golden proportion. Iosa et al. [1] emphasize the widespread presence of the golden ratio in various aspects of human life. They point out that multiple research fields have discovered the influence of the golden ratio in different domains, including face proportion [11,12], teeth proportion [13], and other aspects of human anthropometry and functioning (e.g., cardiology) [14]. That the preference for the golden ratio is not limited to visual stimuli has been shown by some authors [15,16] who have reported that when individuals are asked whether to accept a division of money between them such as in the Ultimatum Game, on average, they choose to accept as fair the offer that reflects the golden proportion (about 62:38 = 1.6). The reasons why this number pops up so often in examples from so many different fields can be attributed to the many connections of the golden ratio with disparate fields of mathematics, as shown in Figure 1a: autosimilar and fractal structures, Fibonacci sequence, pentagon geometry, golden spirals [1]. However, while methodological concerns have prompted some authors to question the presence of consistent patterns related to the golden ratio, the literature demonstrates a substantial and enduring interest in the exploration of this intriguing numerical value, despite that sometimes the studies are not very rigorous and/or not performed with a reliable methodology.

1.2. Golden Ratio and Symmetry

People from different cultures show similar aesthetic preference on a common set of formal features, probably emerging from basic perceptual and valuation processes that are independent of culture and are even present in many other animals [17]. One of these features is symmetry, which is more common than the golden ratio, and hence more investigated. Differently from other features, such as pattern complexity, that relied on active (top-down) mechanisms of visual recognition, the preference for symmetry seemed to rely on automatic (bottom-up) mechanisms [18].
Symmetry refers to the arrangement of elements in a way that one part has a corresponding mirror image counterpart. It can take different forms, such as bilateral symmetry (dividing an object into two equal halves) or radial symmetry (multiple identical sections radiating from a central point), and symmetrical patterns are often associated with order, harmony, and balance [19]. Some studies investigating individuals’ implicit preferences for symmetry [19,20] have used the Implicit Association Test, and this approach could be helpful also to investigate whether there are implicit preferences for the golden ratio.

1.3. The Implicit Association Test

The IAT is a widely used psychological measure, which assesses implicit biases and associations that individuals may hold. First introduced by Greenwald et al. [21], the IAT is based on the concept that individuals produce automatic associations and preferences that can operate outside of awareness, and it has been typically used to investigate implicit preferences or stereotypes in various domains (e.g., social biases concerning race, gender, and more) [22]. The IAT typically entails two binary categorization tasks with two different response keys: in the compatible blocks, participants are instructed to press one key for the target category (e.g., flower) and the positive word (e.g., friend), while pressing the other key for the target category with a more negative evaluation (e.g., insect) and the negative word (e.g., war). Conversely, in the incompatible block, the same key is assigned to negative targets and positive attributes, while the other key is assigned to positive targets and negative attributes. Results typically show faster and more accurate responses in the compatible blocks compared to the incompatible blocks. The IAT score (also known as the D-score) is computed as the difference between mean reaction times for trials in the incompatible and compatible blocks, divided by the standard deviation in those trials. Thus, a positive D-score is observed when responses in the compatible blocks are faster, compared to incompatible blocks, and is interpreted as a measure of the strength of the tested associations between the respective categories [23].

1.4. Implicit and Explicit Preferences for Golden Ratio

Two studies have reported interesting findings on the aesthetic preferences for the golden ratio. Stieger and Swami [24] tested participants’ preferences for artistic photos when the main object was placed in a position dividing the image symmetrically (studies 1 and 2), in a ¾ proportion (study 3), or in golden proportions (all three studies). They used the Implicit Association Test to assess individuals’ implicit preferences and asked participants to provide their explicit preference toward the stimuli. In studies 1 and 2, they mainly found implicit and explicit preferences for the symmetric images, whereas only in study 3, they found an explicit (but not implicit) preference for the golden ratio that was correlated to art knowledge and art interest. The authors argued that their results could be due to a general preference for symmetry, and they proposed a mere exposure effect for golden ratio vs. ¾ proportion: the more familiar participants were with the golden ratio, the more they preferred it. However, it is questionable to what extent the interest and/or knowledge about art corresponds to knowledge and/or familiarity (i.e., more frequent exposure) to the golden ratio. In fact, an alternative is that a preference for harmonic patterns leads individuals to an interest in art.
In the study by De Bartolo et al. [25], subjects were asked to explicitly select among three variants of the same image shown with different proportions (1.5, Phi, or 1.8): an explicit preference for the golden ratio was observed, for human images, sculptures, and paintings, but not for digital humanoids or geometrical shapes, and it was independent of the individuals’ artistic culture. De Bartolo and colleagues proposed that the golden ratio could be an ecological affordance leading to the aesthetic attractiveness, according to the concept of aesthetic preferences for harmonic features (e.g., objects, paintings) suggested in the review by Che and colleagues [17], but see Pecchinenda et al. [26] for an account in terms of processing fluency.
These two studies differed for the methods and for the types of stimuli used: the position of an object in a figure [24] versus the proportion of the elements in a figure [25]. De Bartolo et al. [25] identified a clearly explicit inclination, while Stieger & Swami [24] revealed a preference for the golden ratio when compared to random or 3/4 ratio stimuli, but not with respect to symmetry. In this latter study, the comparison with symmetrical stimuli and the unclear finding on participants’ expertise in art is difficult to interpret. Nonetheless, both studies converge in showing an explicit preference for the golden ratio, although the conditions under which it emerges are more complex than previously thought. Moreover, an explanation for the absence of an implicit preference in Stieger and Swami [24] is unclear.
Other studies have used implicit preference measures to compare just abstract symmetric patterns versus random patterns [19,20,26], but to date, no study has assessed implicit preferences for golden ratio patterns compared to random patterns. More specifically, Makin and colleagues [19] conducted a series of experiments in which participants were asked to complete an implicit association task in which dot patterns differed based on dot arrangements. Participants categorized either words as positive or negative, or dot patterns as symmetrical or random. Participants showed an implicit preference for symmetrical stimuli (with horizontal, vertical, and radial symmetries) with respect to random stimuli, see also Makin et al. [20] for similar findings. Using the same methodology, the present research question is what happens when random patterns are compared to dot patterns arranged in golden proportions?

1.5. Hypotheses of the Study

To sum up, a wealth of evidence supports the notion that symmetry is a compelling factor capable of attracting and evoking individuals’ preferences, which has been interpreted as reflecting a basic characteristic of our visual system and brain. However, it is unclear whether the same applies to the golden ratio. To assess whether there are implicit preferences for the golden ratio, we used the same research strategy used by Makin et al. [19]. Namely, an implicit association task would likely unveil any existing preference for figures based on the golden ratio, if indeed such a preference exists, with respect to random stimuli. If the golden ratio engenders an implicit preference, the typical IAT effect should emerge, and participants should be faster in categorizing golden ratio stimuli, compared to random stimuli, when they are associated with a positive category (in this case, positive words). Moreover, this effect should occur regardless of block order (compatible and incompatible block order was counterbalanced across participants).
We also hypothesize that people have an explicit preference for the golden ratio, which would emerge in three simple tasks: a rating task in which participants judged the pleasantness of dot-pattern stimuli, a line bisection task, and the Ultimatum Game (UG) (see Materials and Methods for task descriptions).

2. Materials and Methods

2.1. Participants

One-hundred participants volunteered to take part in this study (age: 25.47 ± 2.68 years, 58% females, all of them speaking Italian as their native language). Half of them were randomly allocated to a version of the IAT with the three compatible blocks followed by the three incompatible ones. The other participants were assigned to a version with the opposite sequence. All subjects gave their informed consent for inclusion before they participated in the study. The study was conducted in accordance with the Declaration of Helsinki (1991), and the protocol was approved by the Ethics Committee of Sapienza University (Project Identification code: 1272, approved on the 5 July 2019).
Participants had normal or corrected-to-normal vision and were naïve to the purpose of the study.
Using G*Power [27], we computed a sensitivity analysis to detect a significant effect of compatibility. Results showed that with our sample of 100 participants, considering α = 0.05 and 1 − β = 0.80, the minimum effect size that could be detected is η2p = 0.18 (Cohen’s f = 0) corresponding to a medium effect size.

2.2. Procedure

Stimulus presentation and data collection were conducted online using the platform Testable (www.testable.org; access date 9 December 2022) [28]. All participants were first recruited in Rome (mostly at Sapienza University). Once volunteered to participate, each participant received by email the link to the experiment, with some instructions (e.g., the study could not run on a tablet or mobile phone; the experiment should be started only when sure to have enough time to complete it, in a quiet room, with no distractions). For each participant, start time and end time was recorded. All participants completed the experiment within 30 min. As the experiment started, each participant was first required to activate the full-screen mode to reduce all distractions (e.g., phone turned off), and to calibrate the screen to ensure that stimuli size was accordingly adjusted. At the end of the experiment, each participant received a completion code and was asked to send it back to the researchers.
The experiment consisted of 4 tasks administered in the following order: Ultimatum Game, IAT, explicit preferences ratings for stimuli used in the IAT, line bisection task. We presented the Ultimatum Game task at the beginning and the line bisection task at the end of the IAT task to avoid biases due to repetition of similar explicit choices.

2.3. Ultimatum Game

The Ultimatum Game task was performed as in Suleiman [16]: participants were asked to choose how much of a total hypothetical amount of money (100€) they were willing to share with another imaginary participant that could refuse the offer if judged unfair, leading to a loss of money for both. Hence, they should opt for a fair division of money to reduce the risk of the other participant’s refusal.

2.4. IAT

The IAT consisted of 10 blocks of 20 trials each, followed by one block of 20 trials for the explicit preference task, in which participants rated stimuli pleasantness. Stimuli presentation was randomized across blocks, with the only constraint that, in the compatible and incompatible blocks, a word (either positive or negative) always followed an image (either golden ratio or random), and vice versa. In addition, half of participants completed the IAT with the block order reversed (incompatible block presented first, followed by the compatible block), and the practice blocks were adjusted accordingly to match the block order. Therefore, in one version of the IAT, participants first completed two practice blocks: in the first practice block, 10 golden-ratio-based (GR) and 10 random dot patterns were randomly presented, and participants were instructed to press the ‘a’ key for golden ratio dot patterns and the ‘l’ key for random dot patterns; in the second practice block, all positive and negative words were presented, and participants responded with the ‘a’ key for positive words and the ‘l’ key for negative words. Practice blocks were followed by three experimental blocks (e.g., compatible blocks), in which participants saw either dot patterns or words (interleaved between trials) and responded to golden ratio dot patterns and positive words using the practiced key associations. After the compatible blocks, participants completed two additional practice blocks to learn new key associations for the remaining 3 experimental blocks (e.g., incompatible blocks). Participants learned to press the ‘a’ key for random patterns and the ‘l’ key for golden ratio. Key assignment for positive and negative words remained the same. Following the practice trials, participants completed three incompatible blocks using the new practiced keys associations (see Table 1).
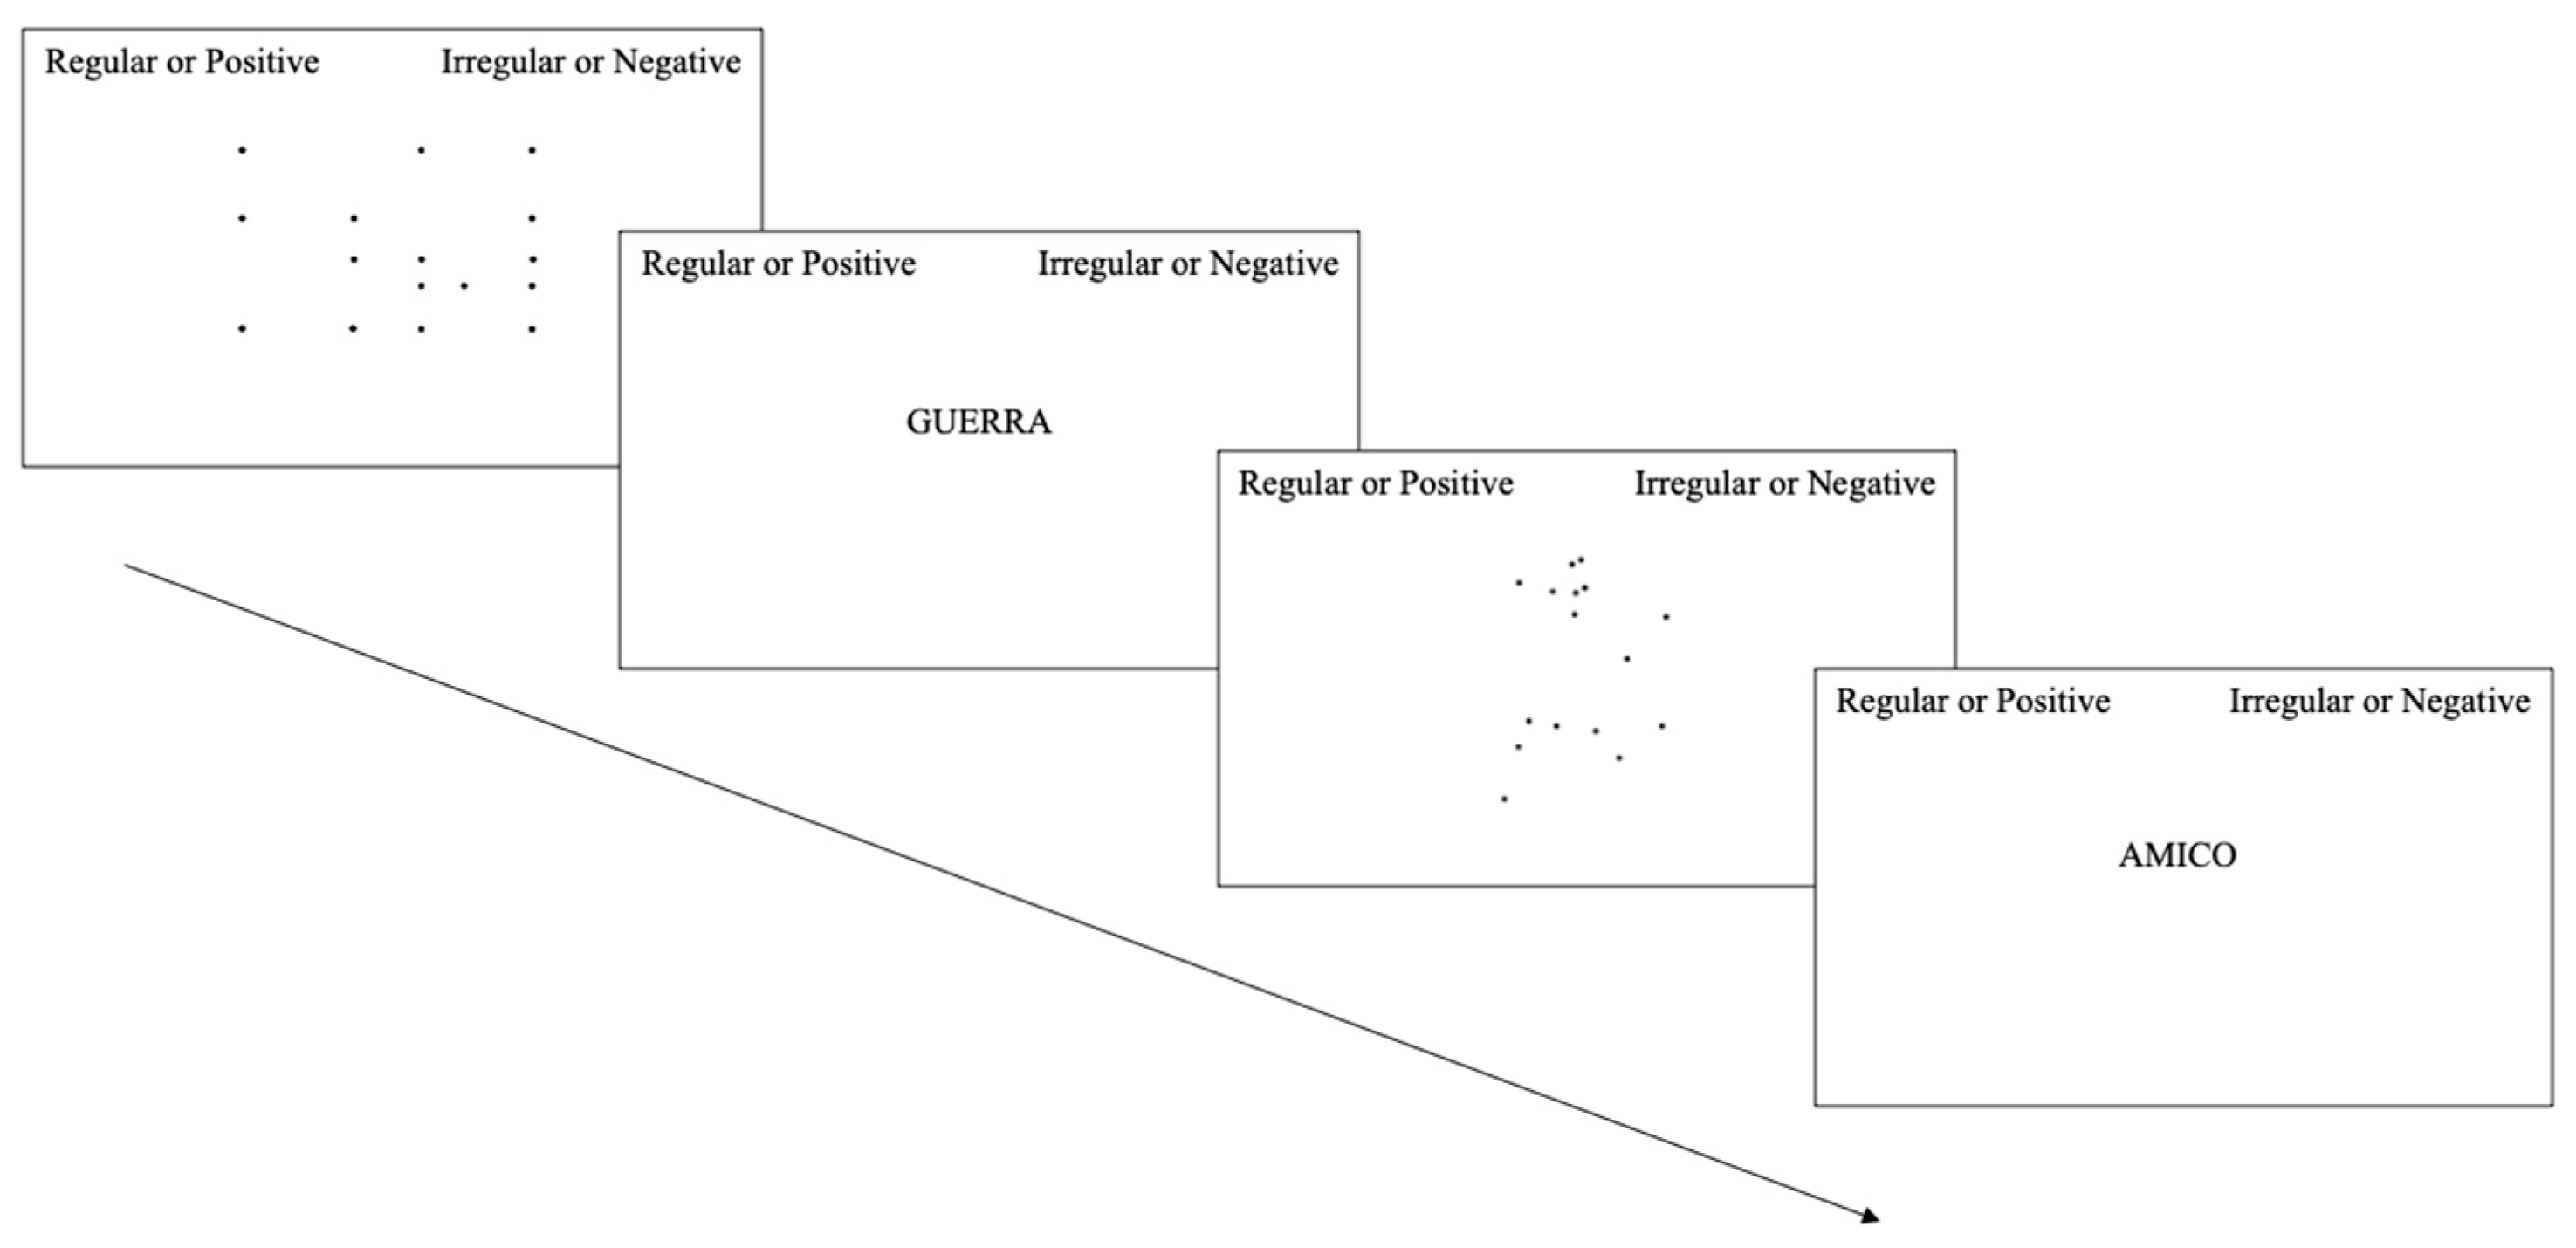
Each trial of the IAT started with a central fixation cross for 500 ms, followed by either dot-pattern or word stimuli, which remained on screen until participant’s response. Cue words were displayed above each stimulus, indicating the response mapping for each trial. For the compatible blocks, the cues “regular” and “positive” were presented on top left of the screen, whereas the cues “irregular” and “negative” were displayed on top right (see Figure 2 for an example of trials’ sequence).
In the incompatible blocks, the cues “irregular” and “positive” were presented on top left, and the cues “regular” and “negative” were displayed on top right. After each response, feedback was given informing participants if response was correct or wrong. Each block was preceded by written instructions, and between blocks, participants had the opportunity to take a short break. Finally, participants completed a block of 20 trials, in which they judged the aesthetic pleasantness of the dot-patterns. Twenty dot pattern stimuli were presented (10 golden ratio and 10 random stimuli, randomly selected from the full set of 40 stimuli), and participants were asked to rate them in terms of pleasantness, using a Likert scale from 1 to 7 (i.e., how much do you rate this image as pleasant? Choose a value from 1 to 7, where 1 = Not at all, and 7 = Very much).

2.5. IAT Stimuli

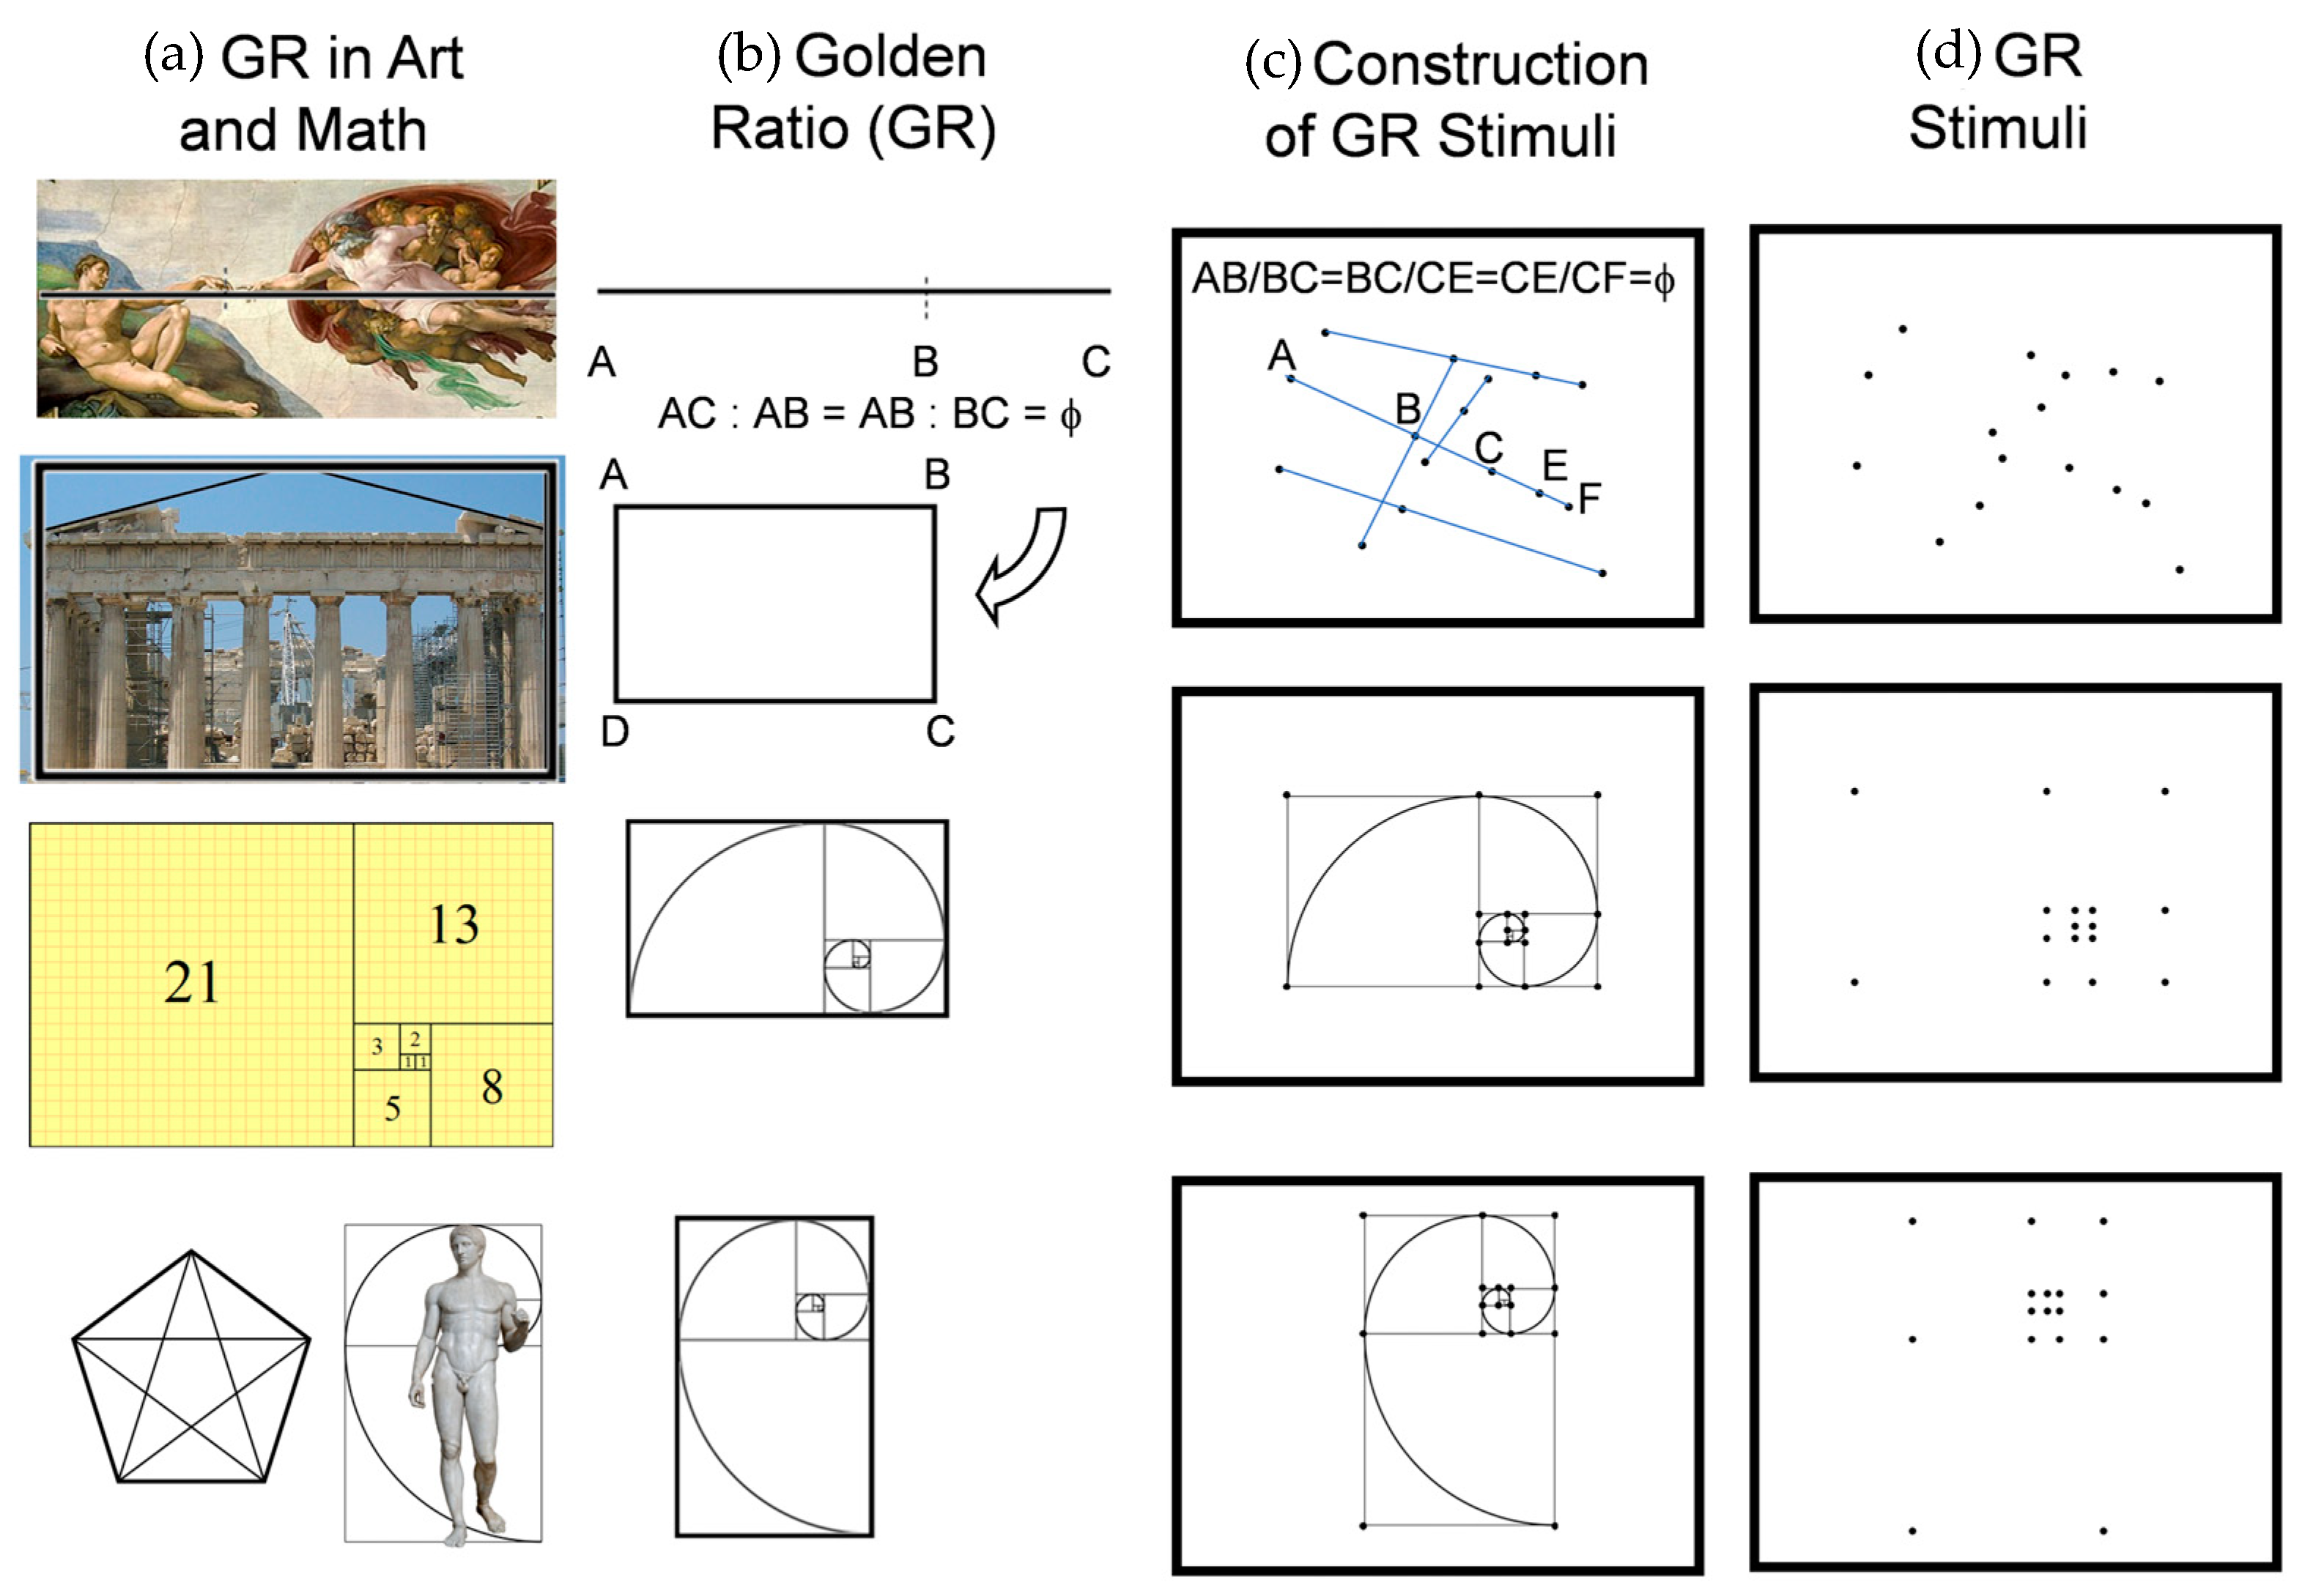
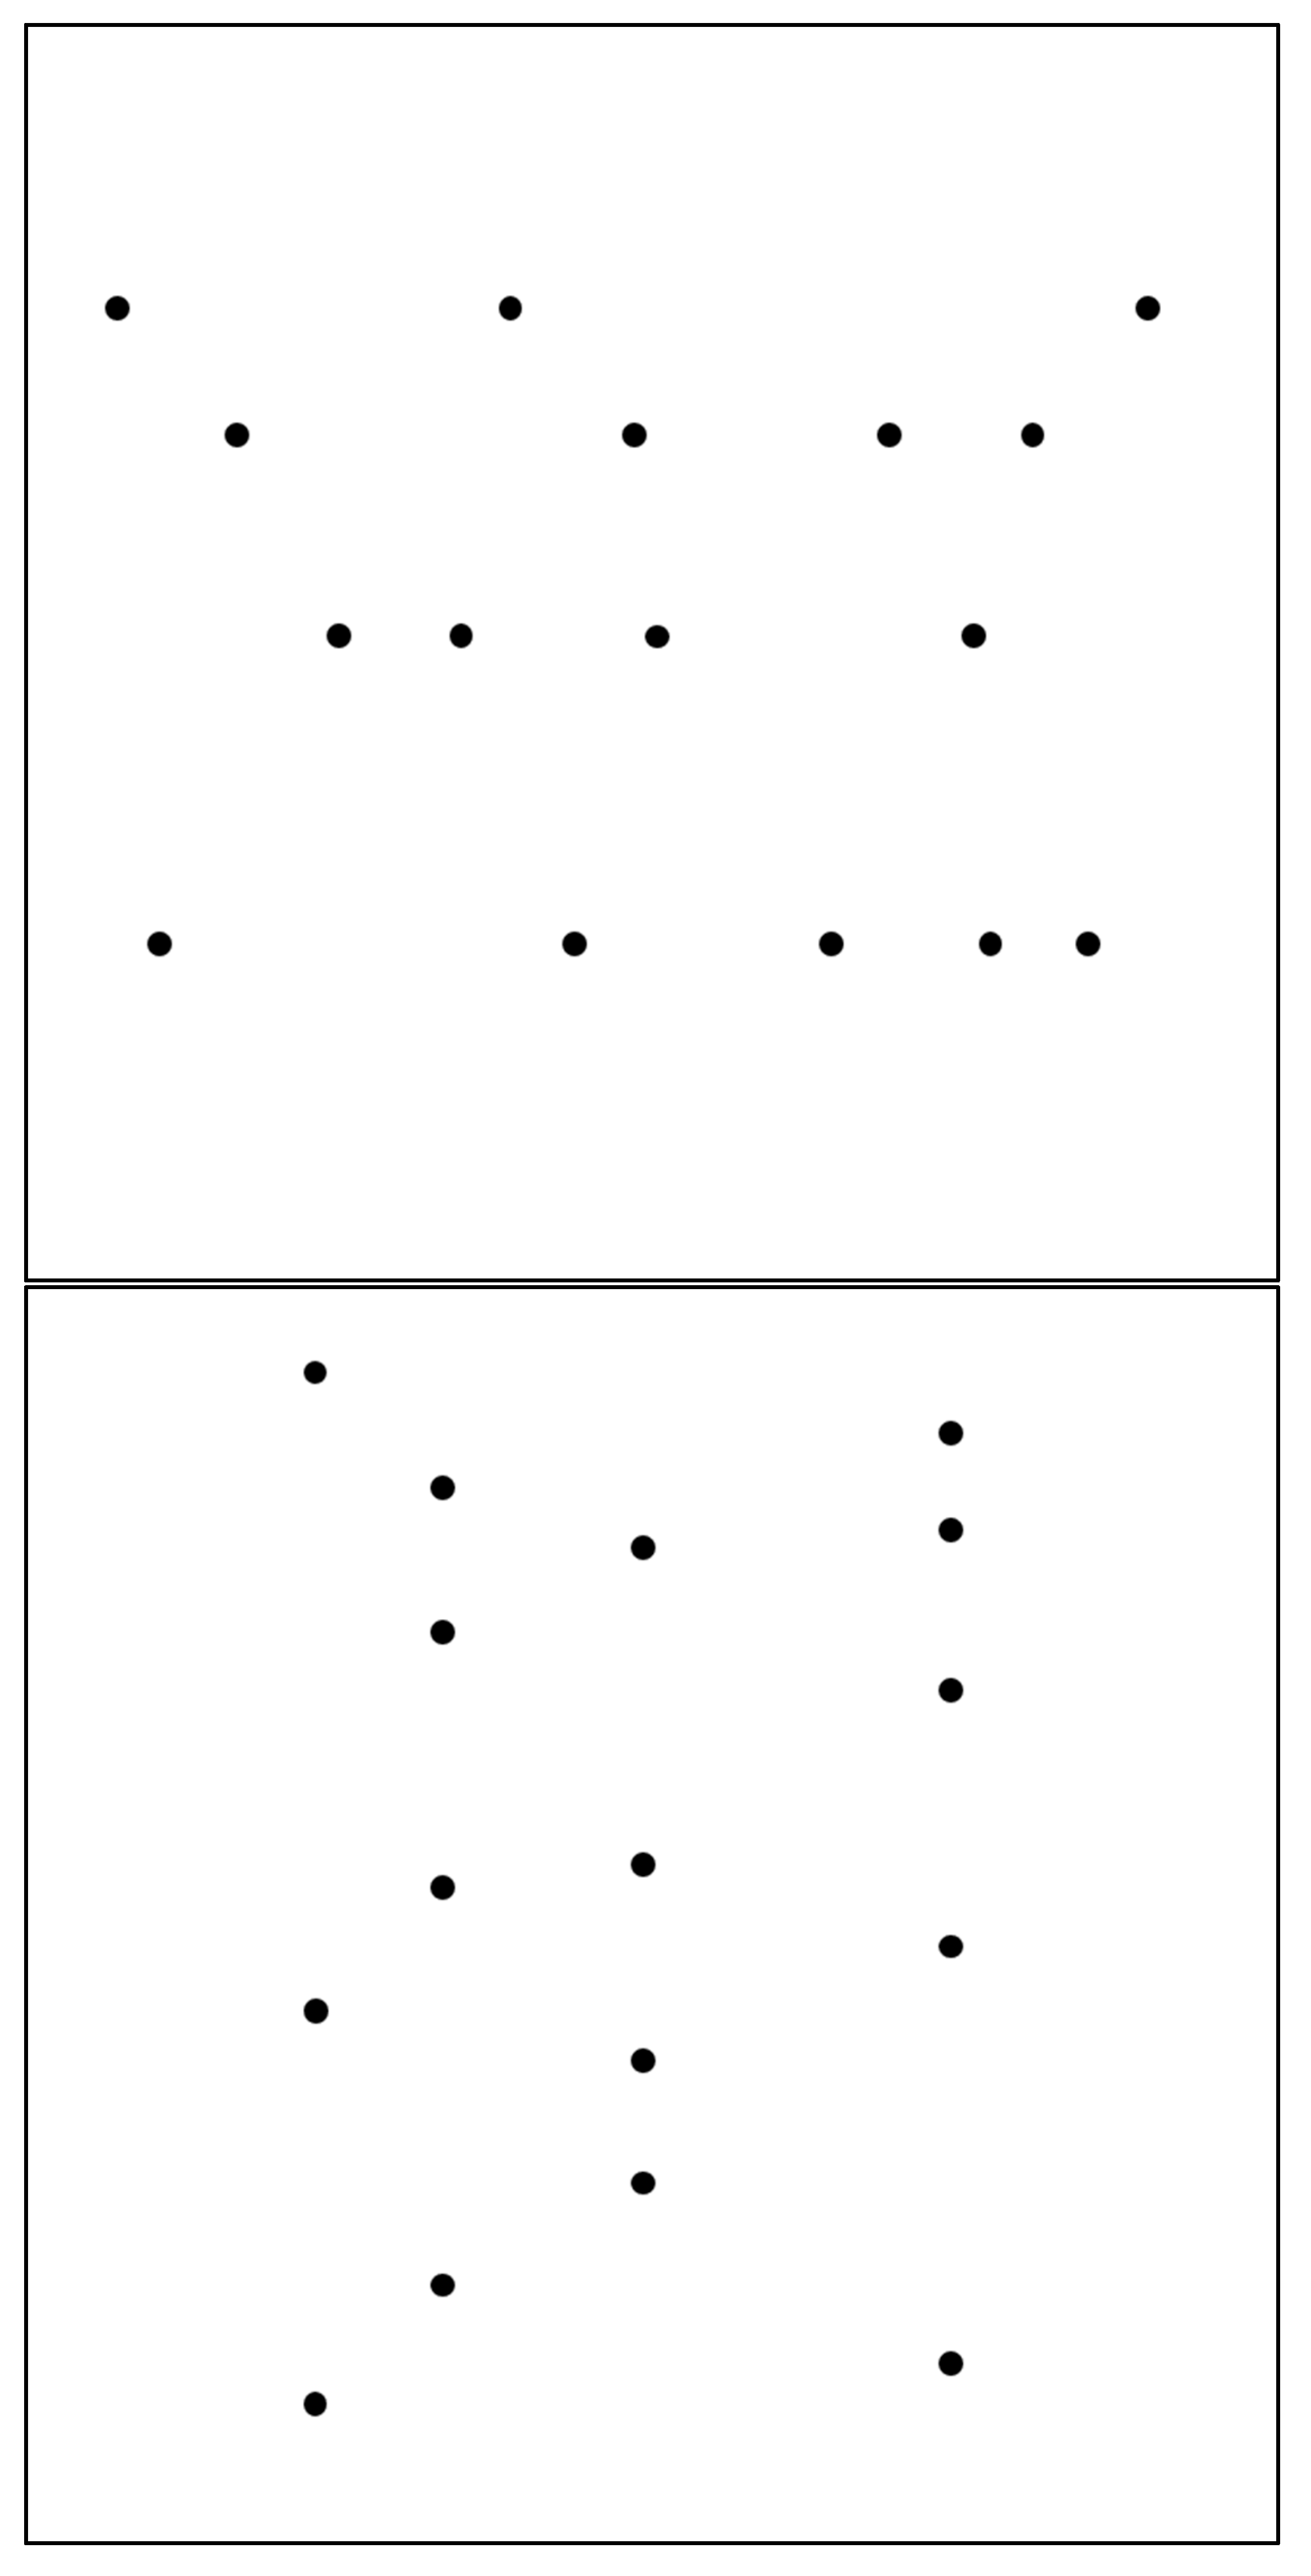
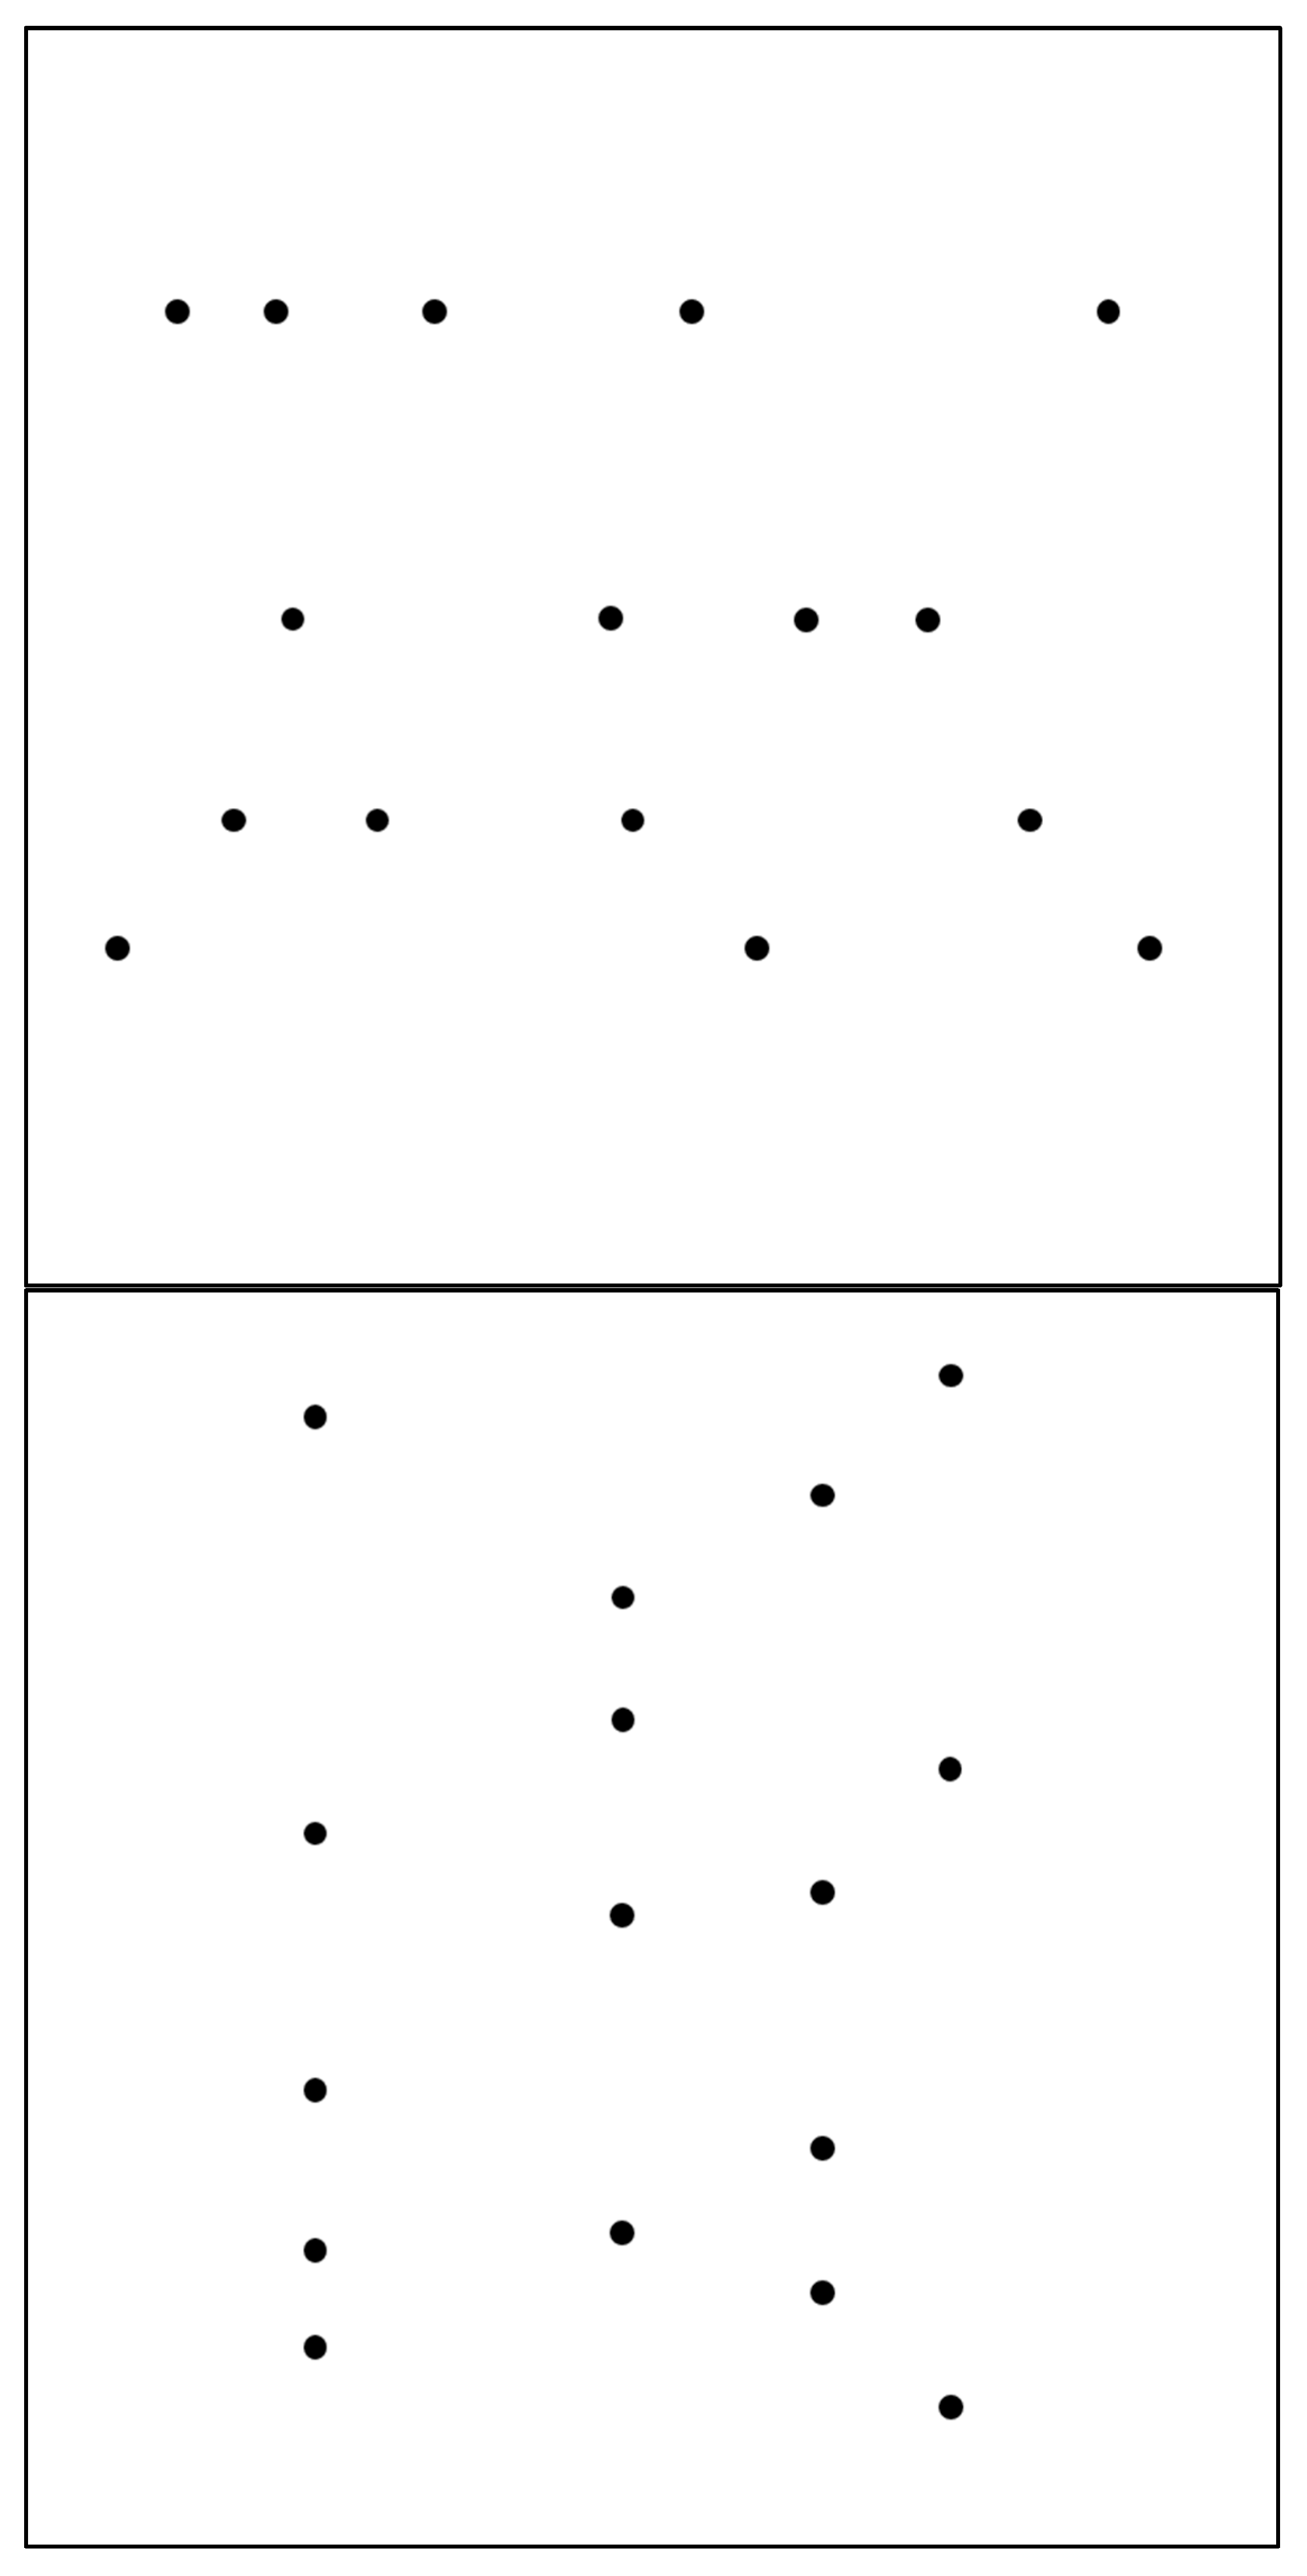
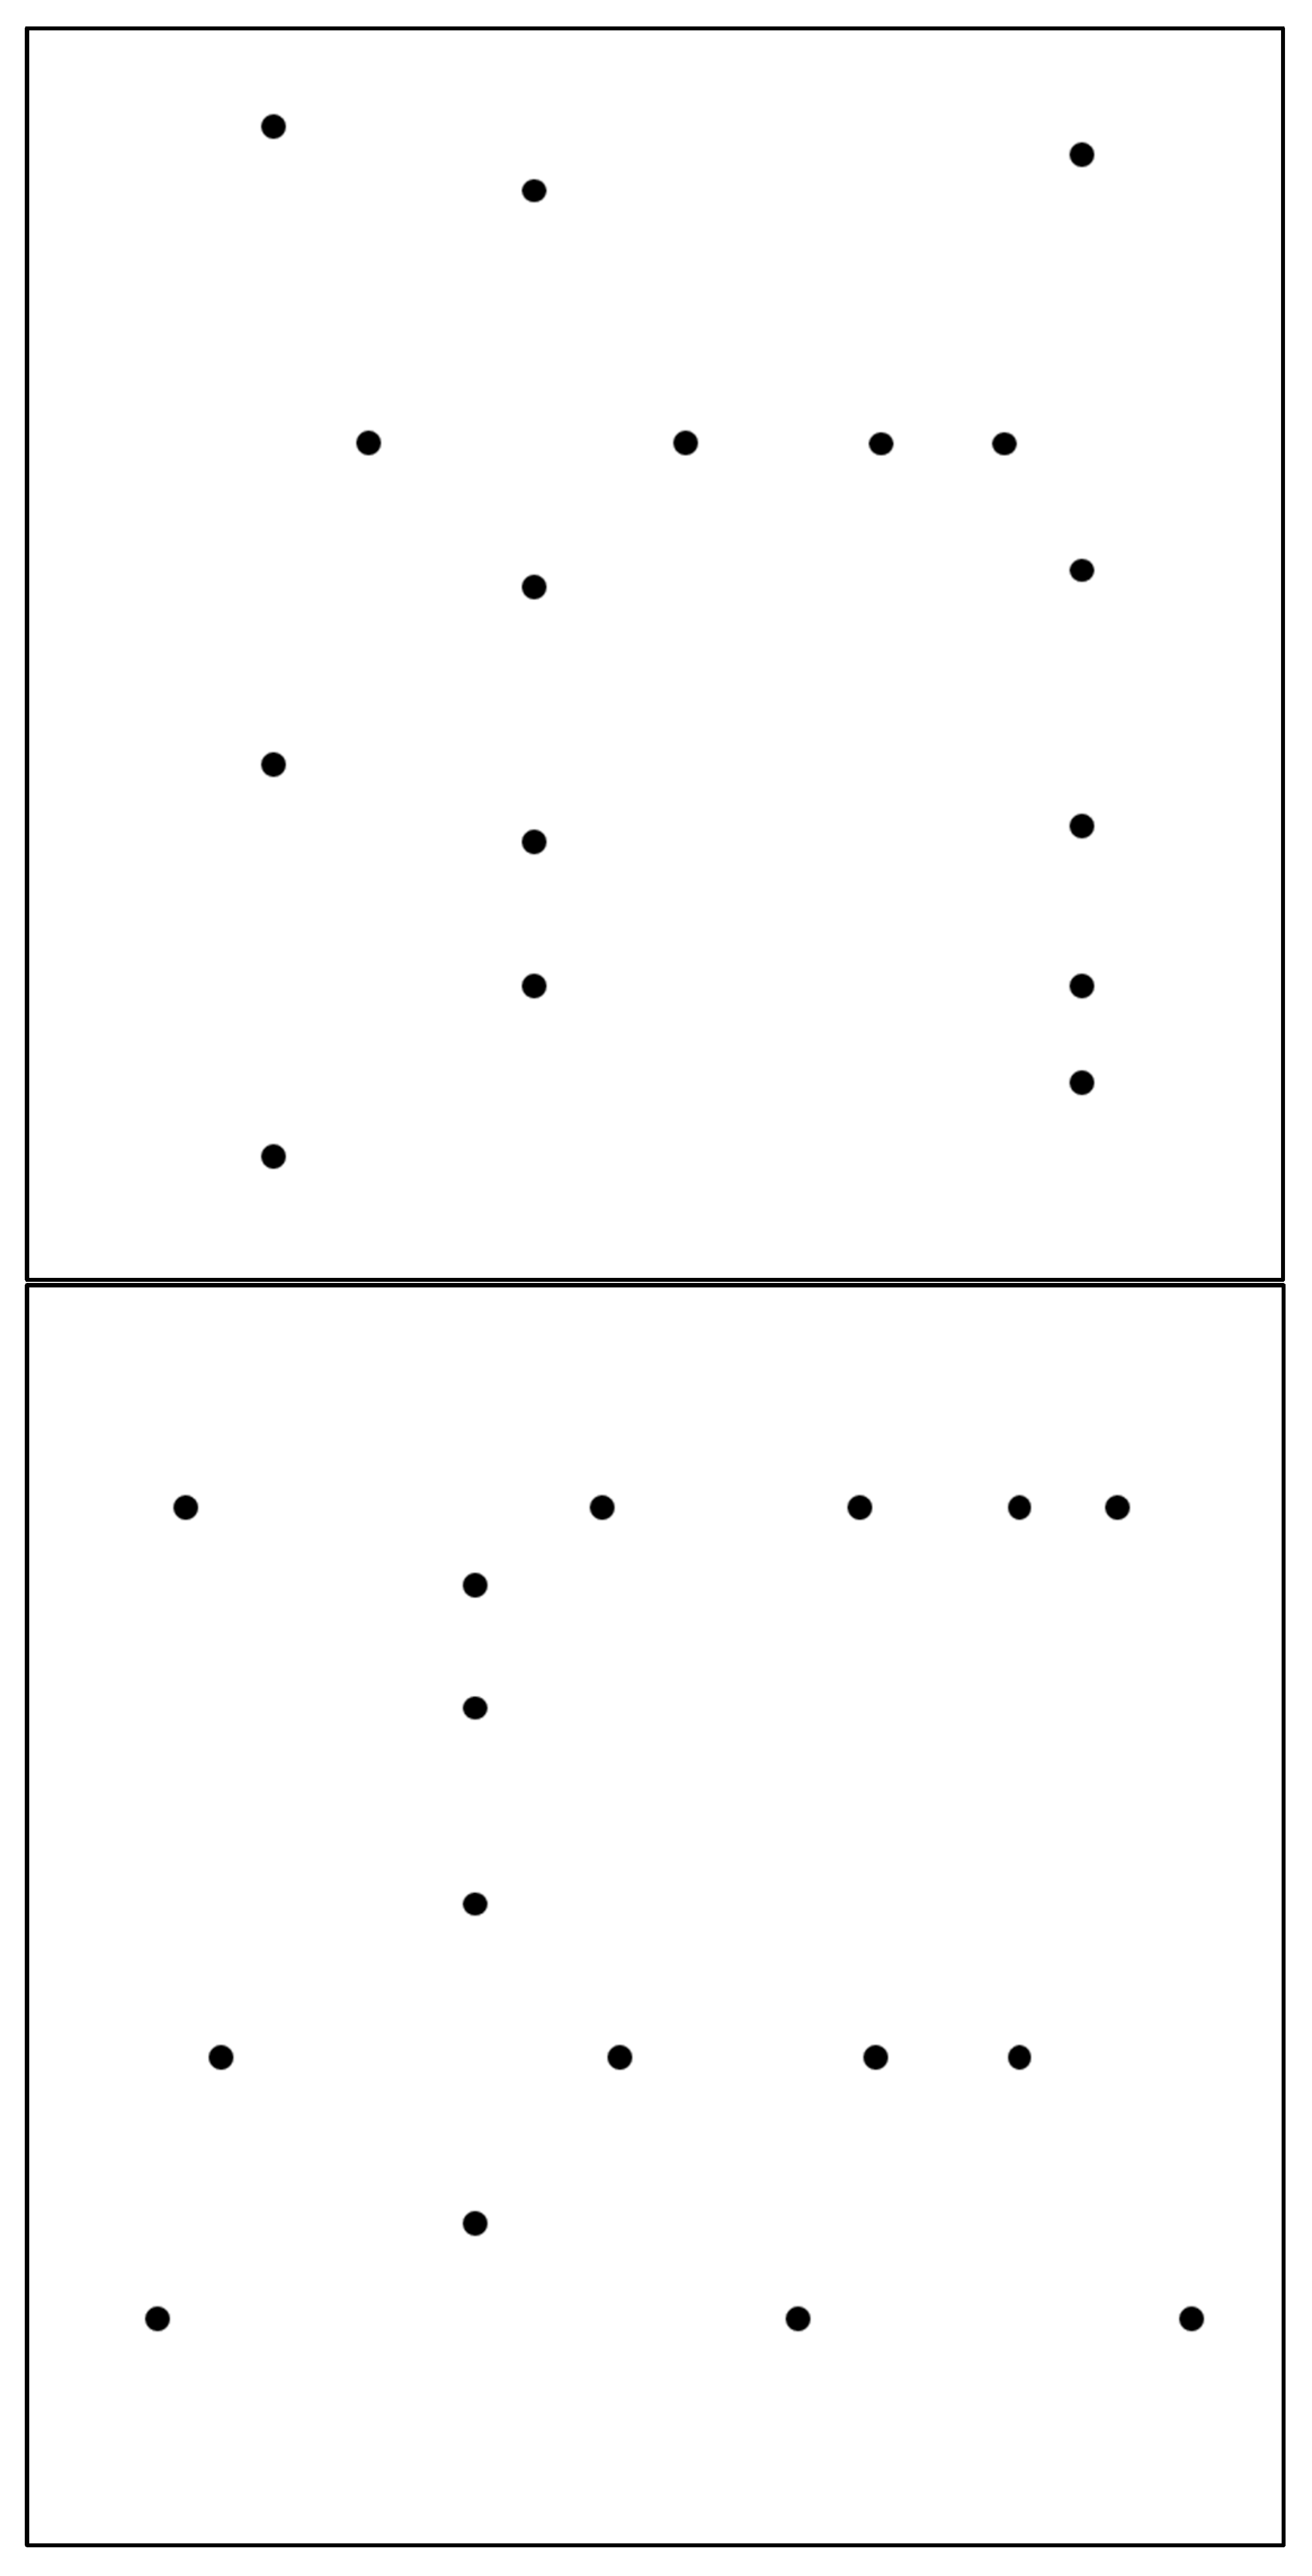
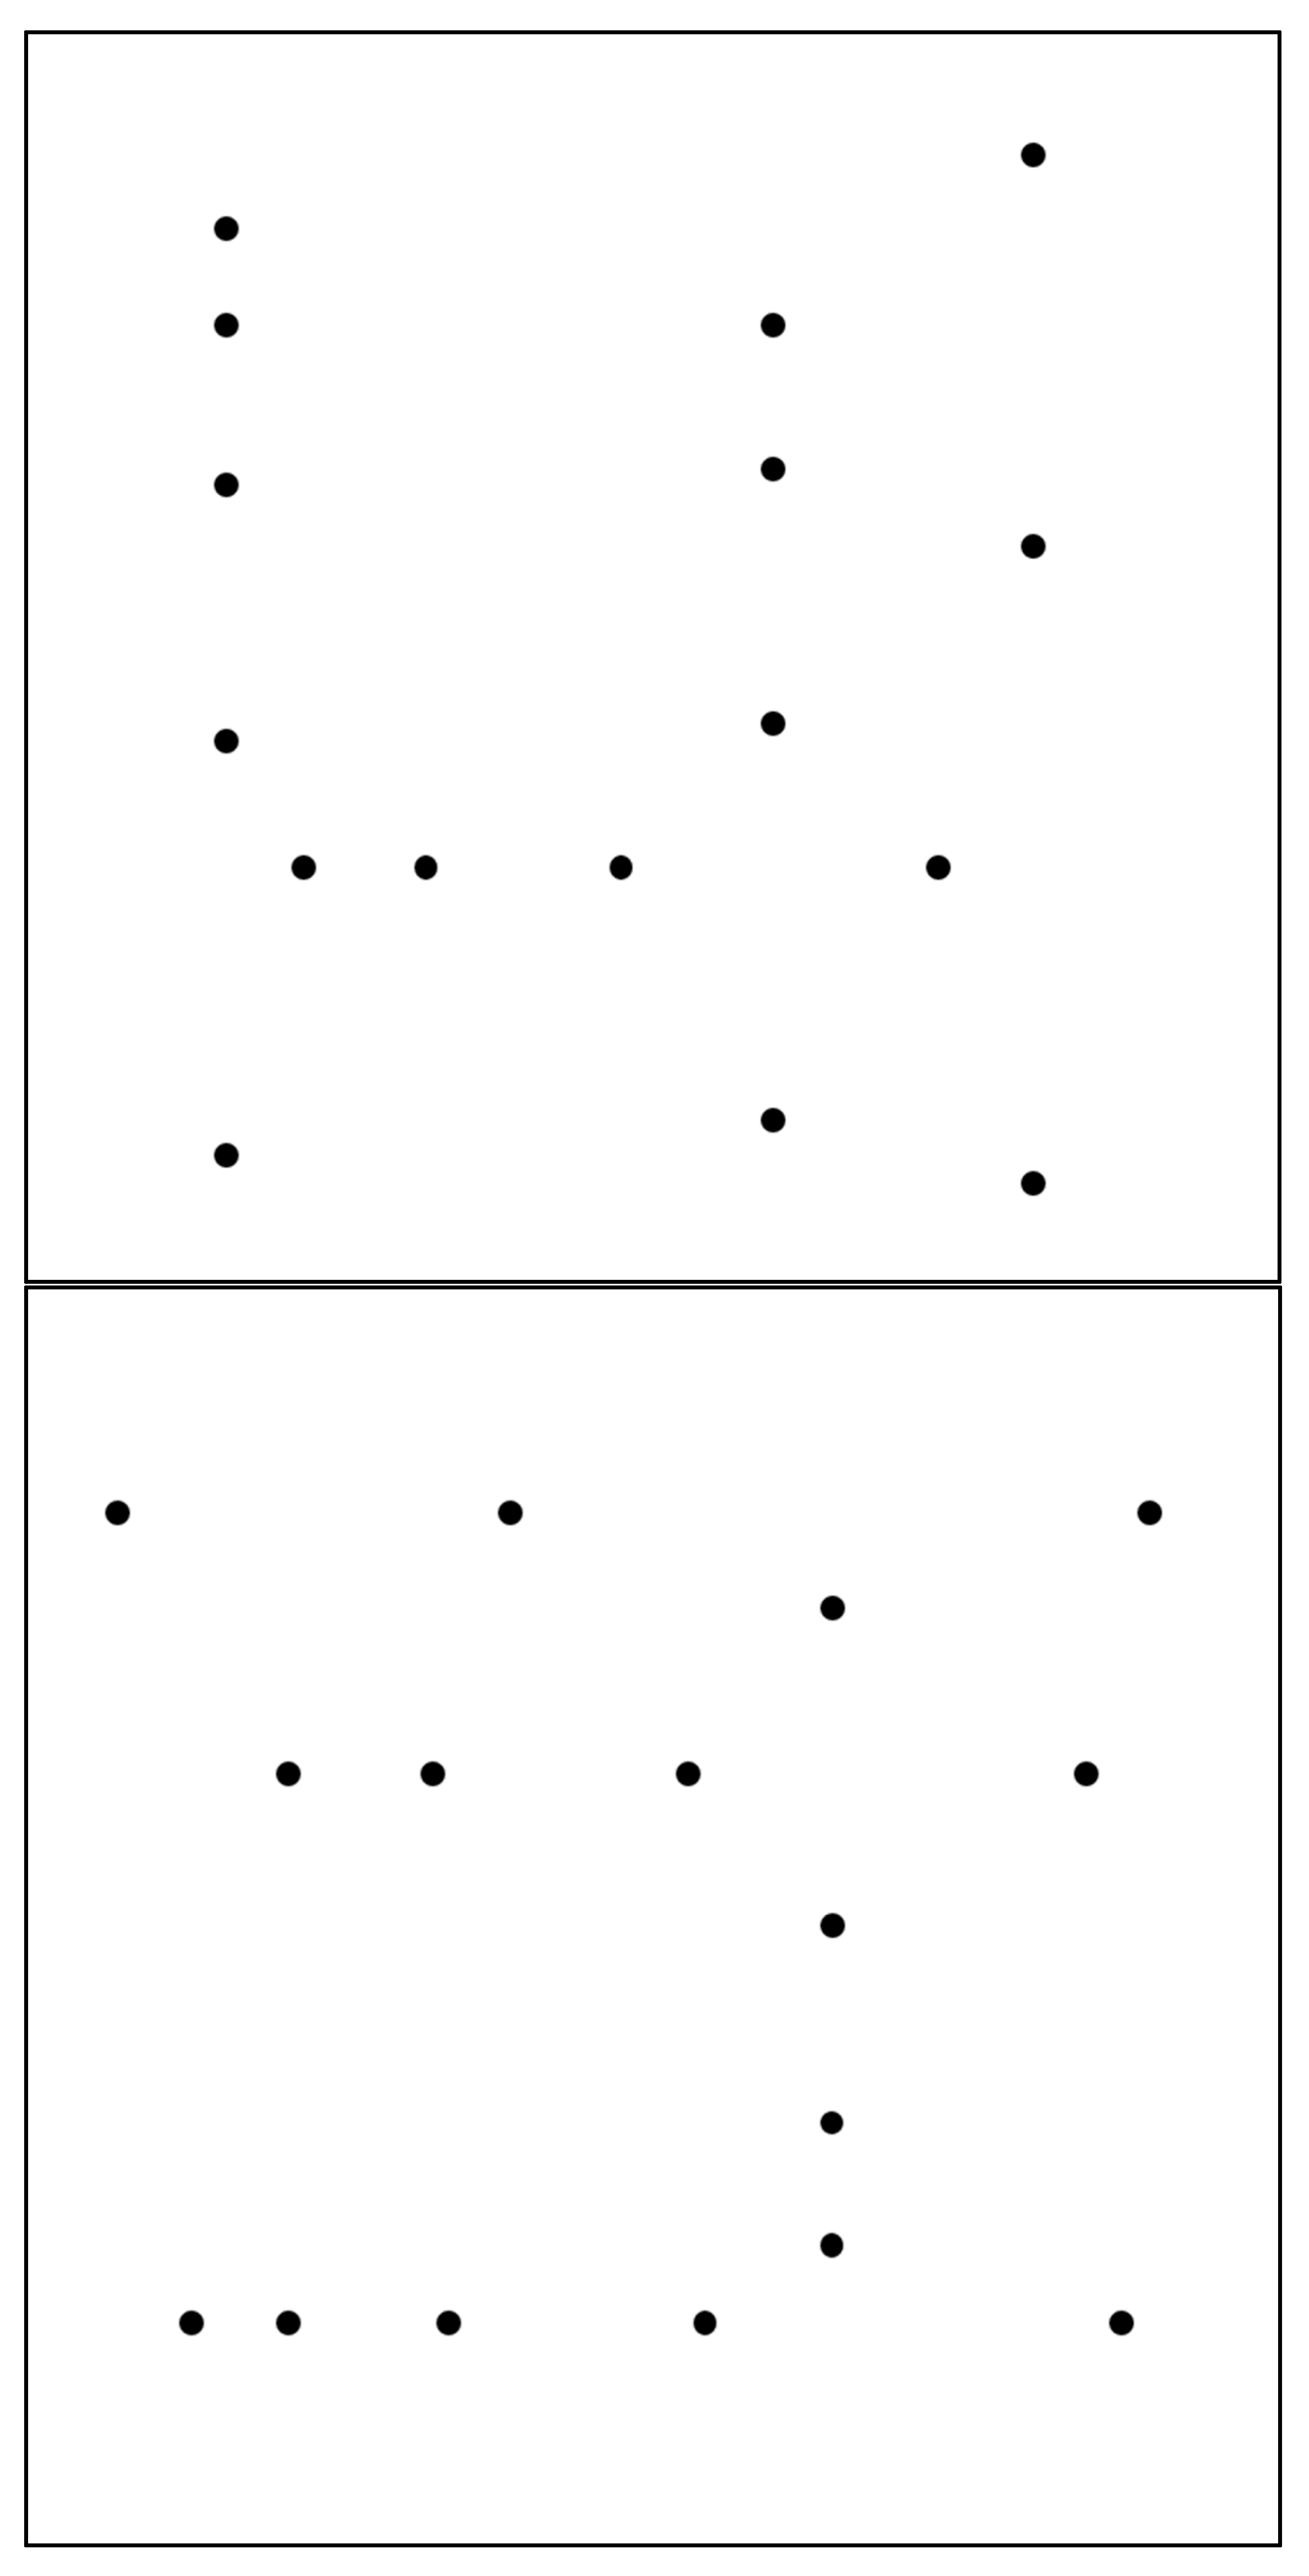
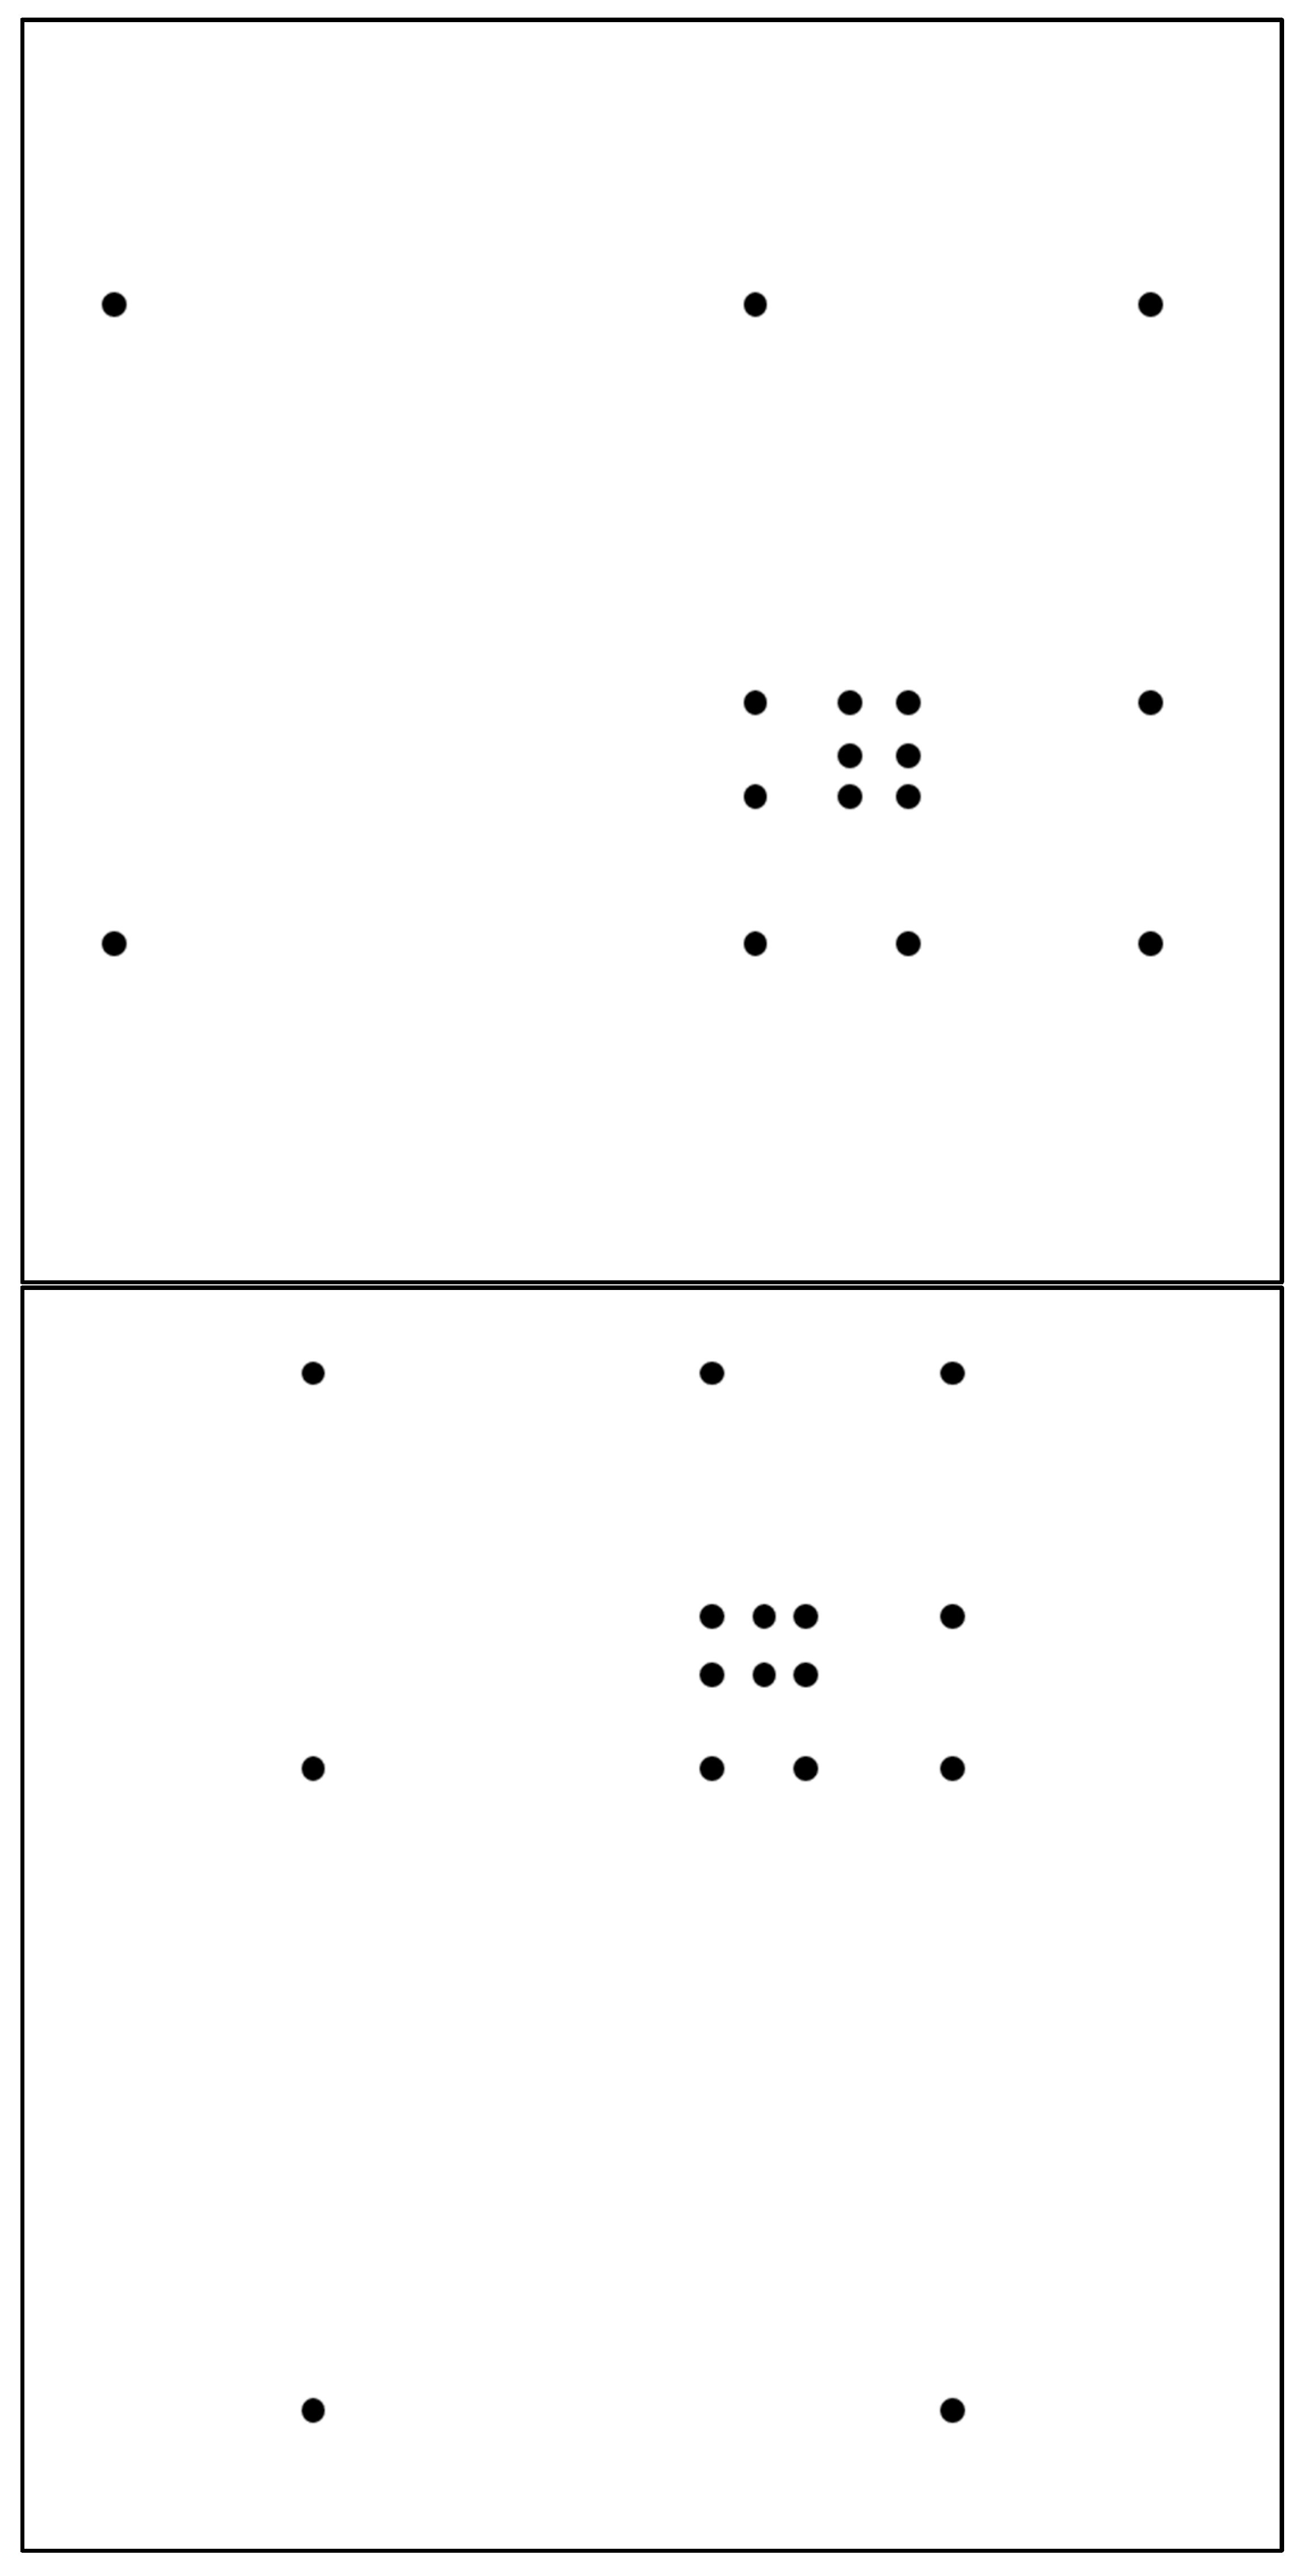
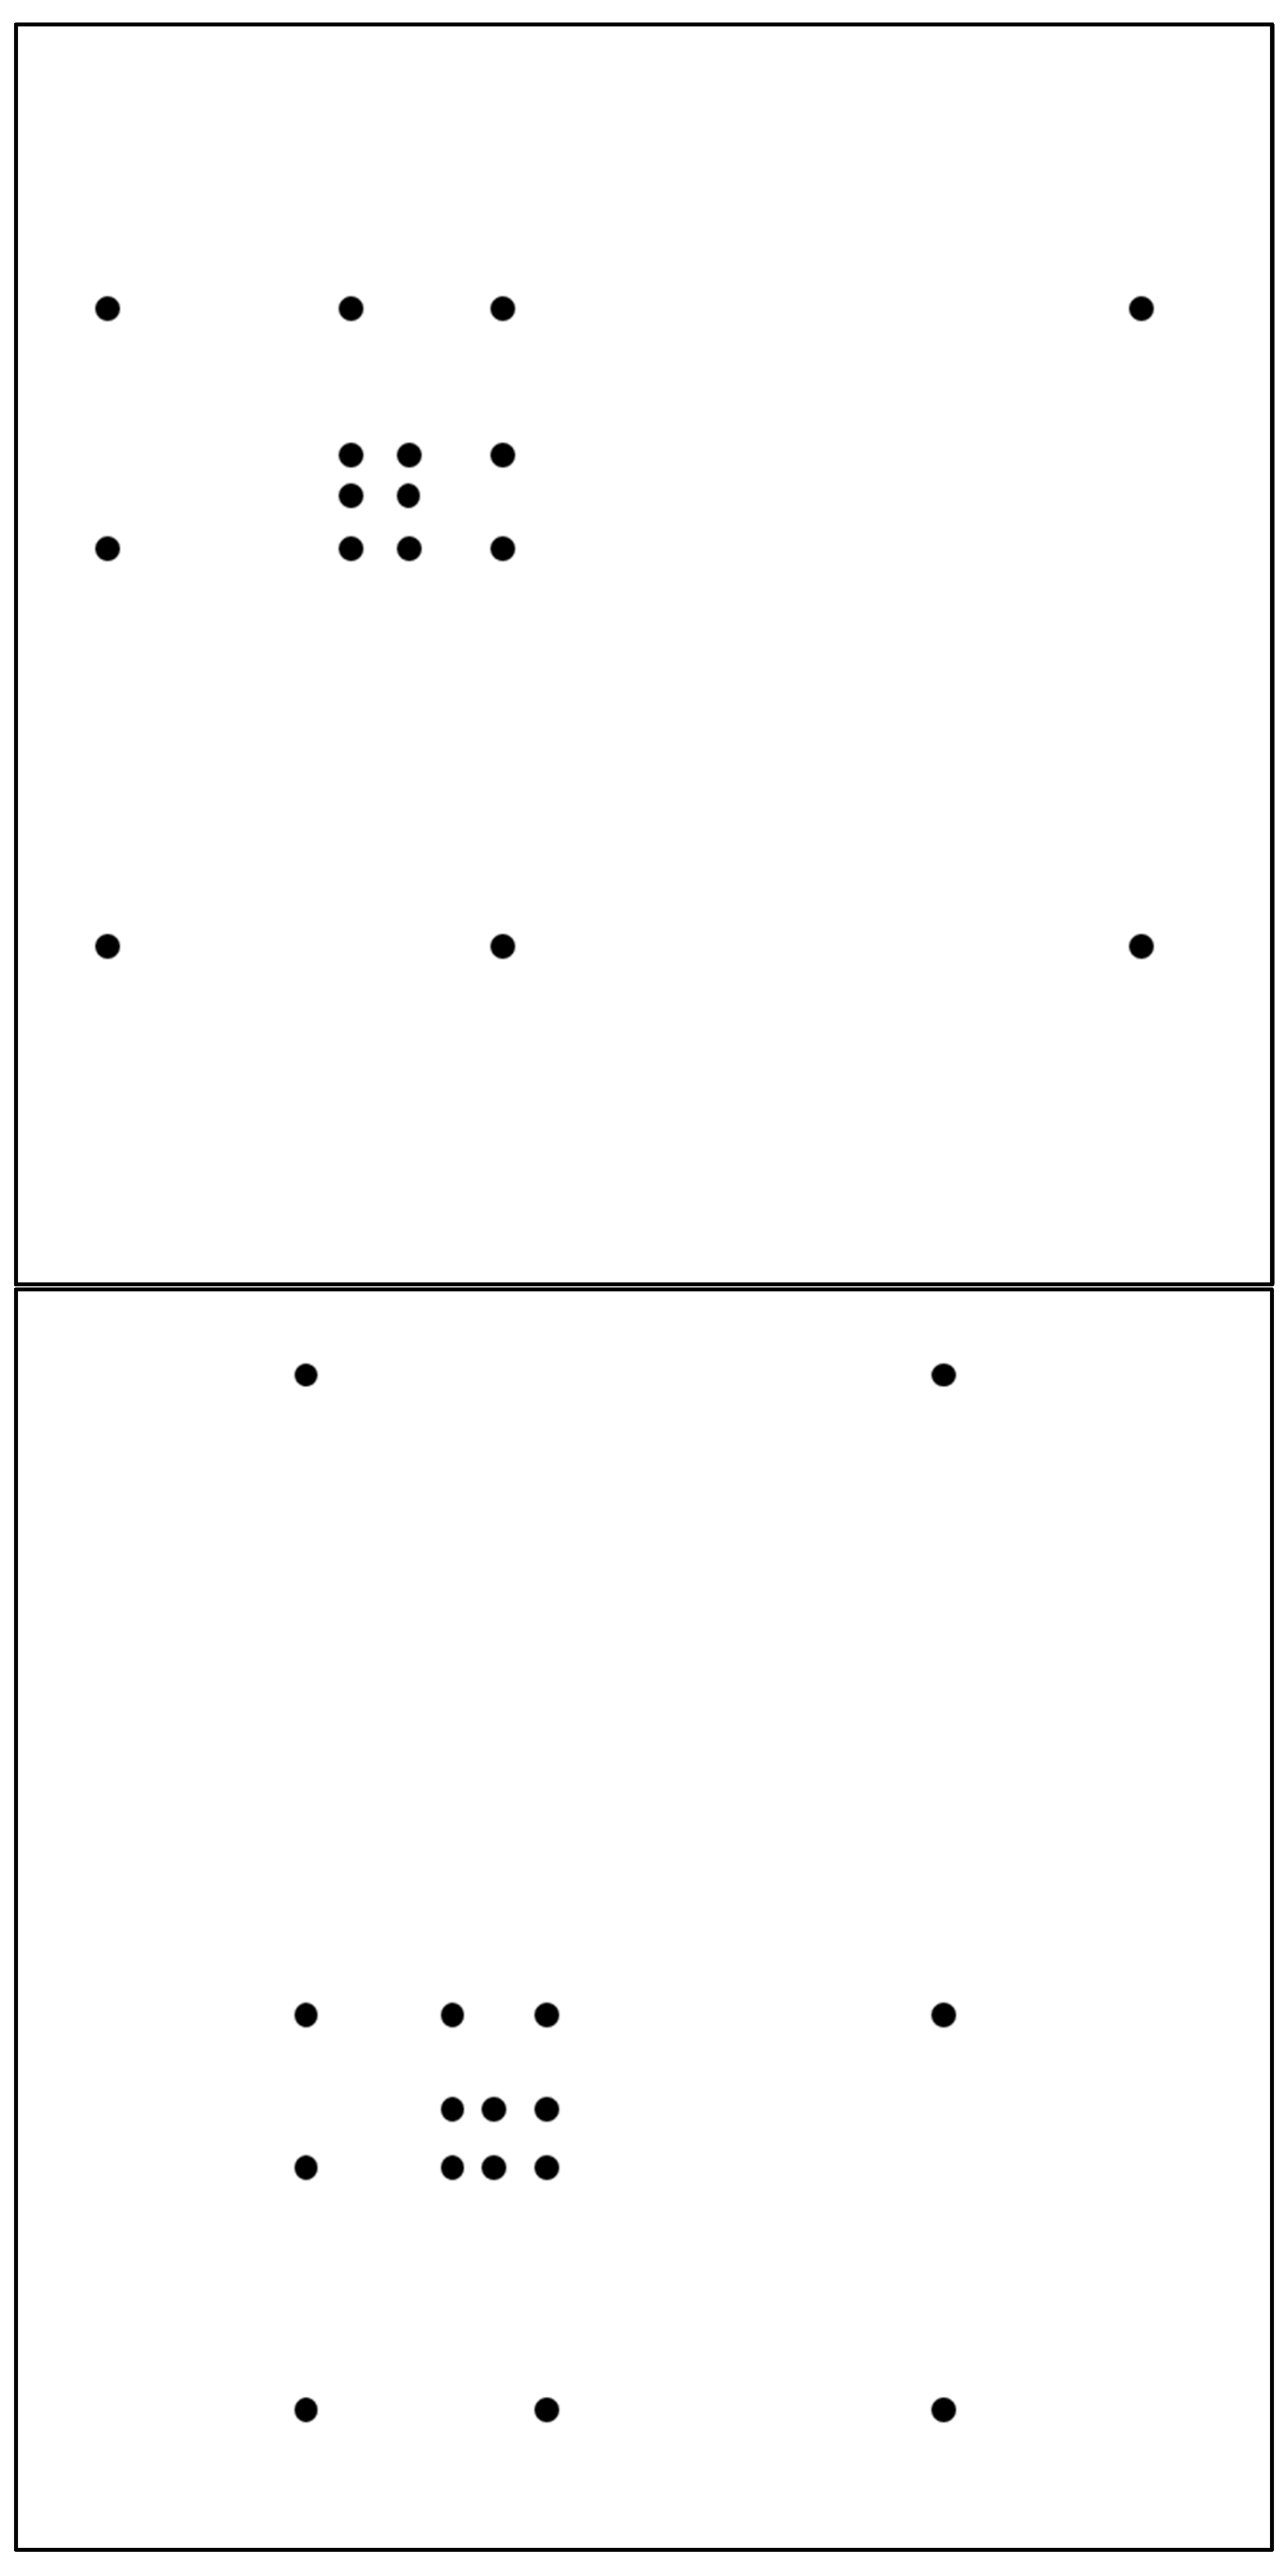
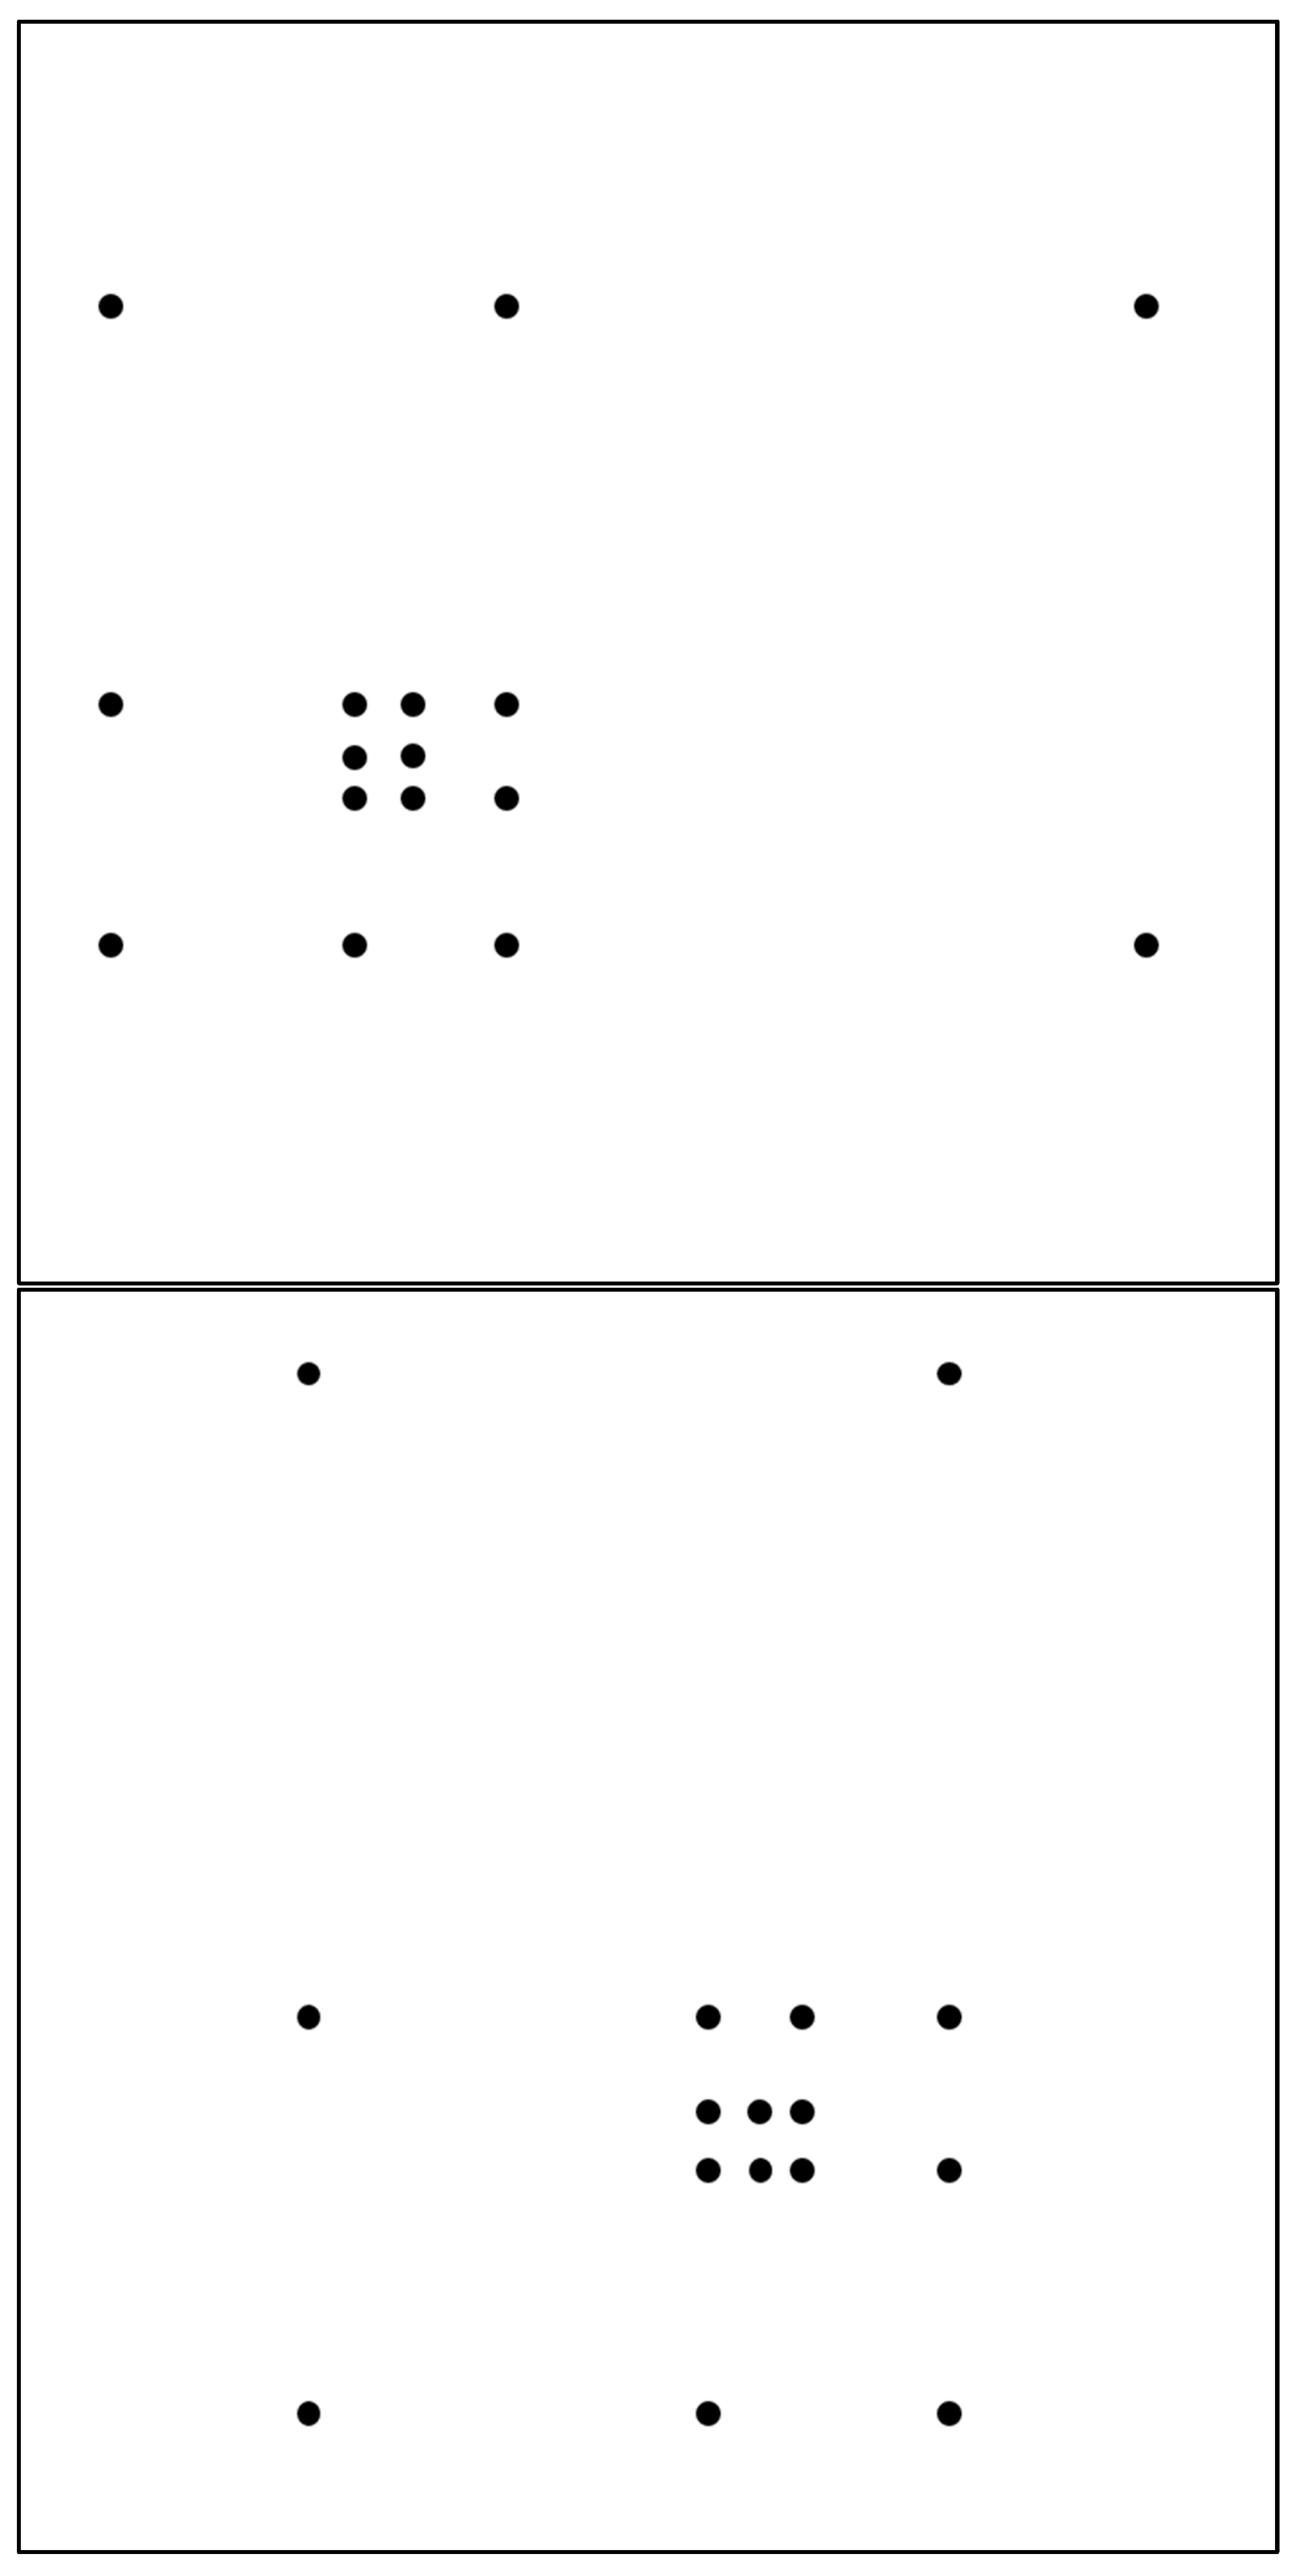
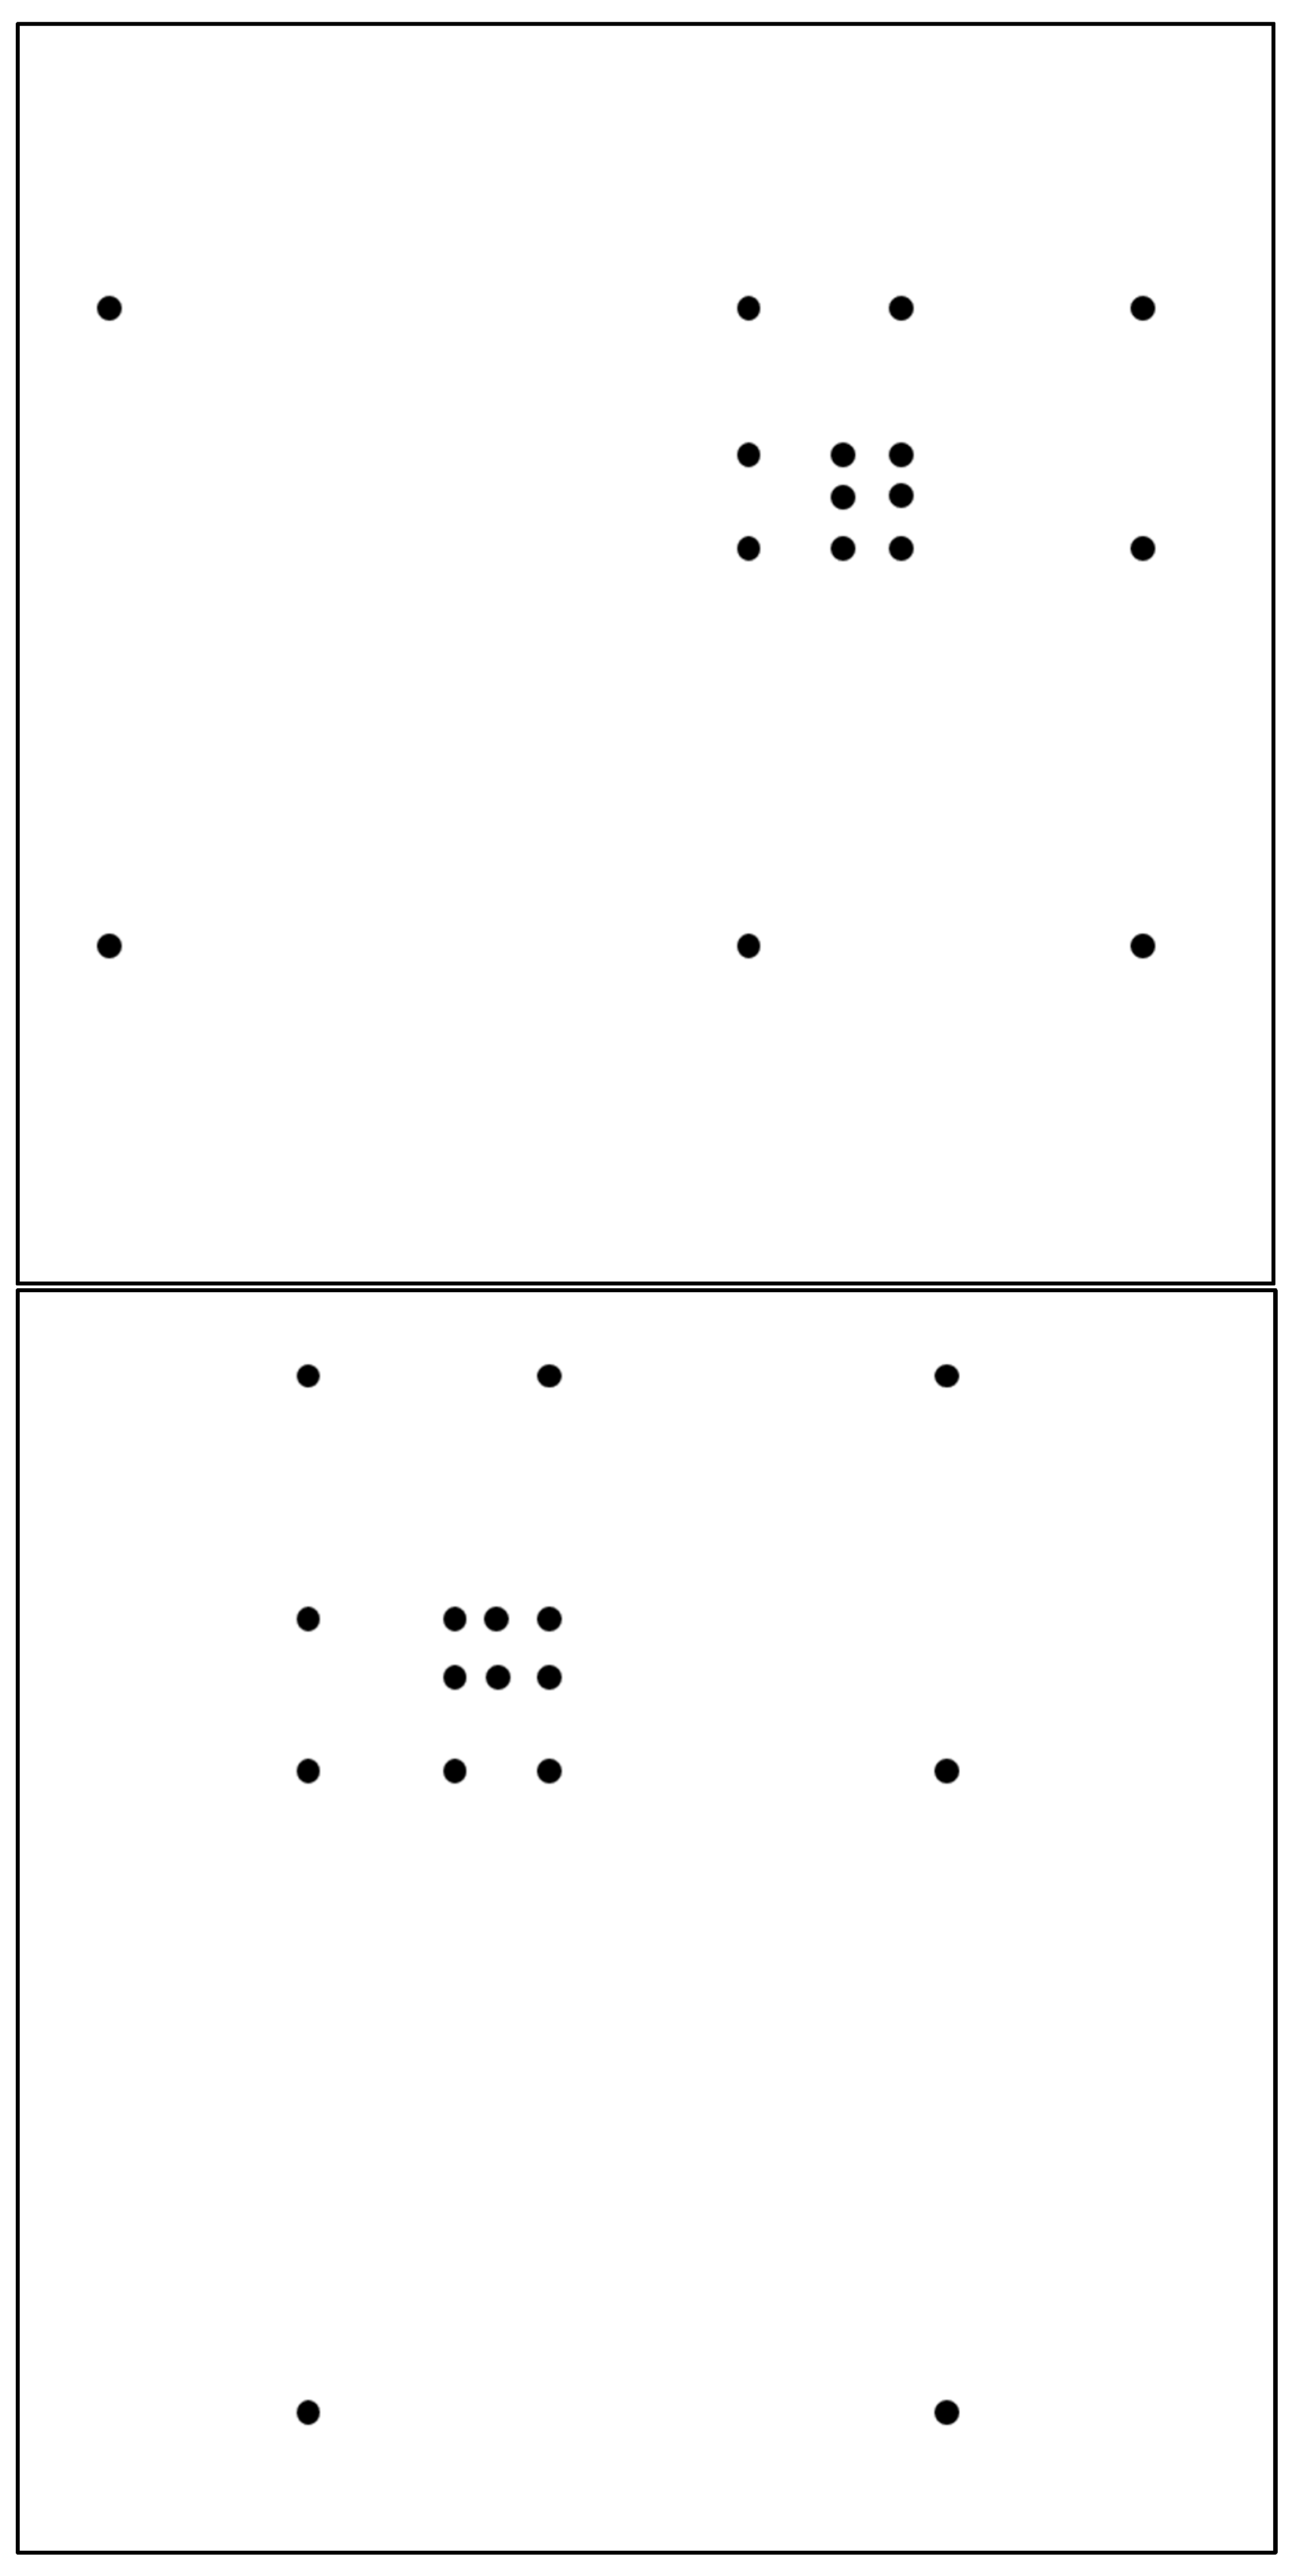
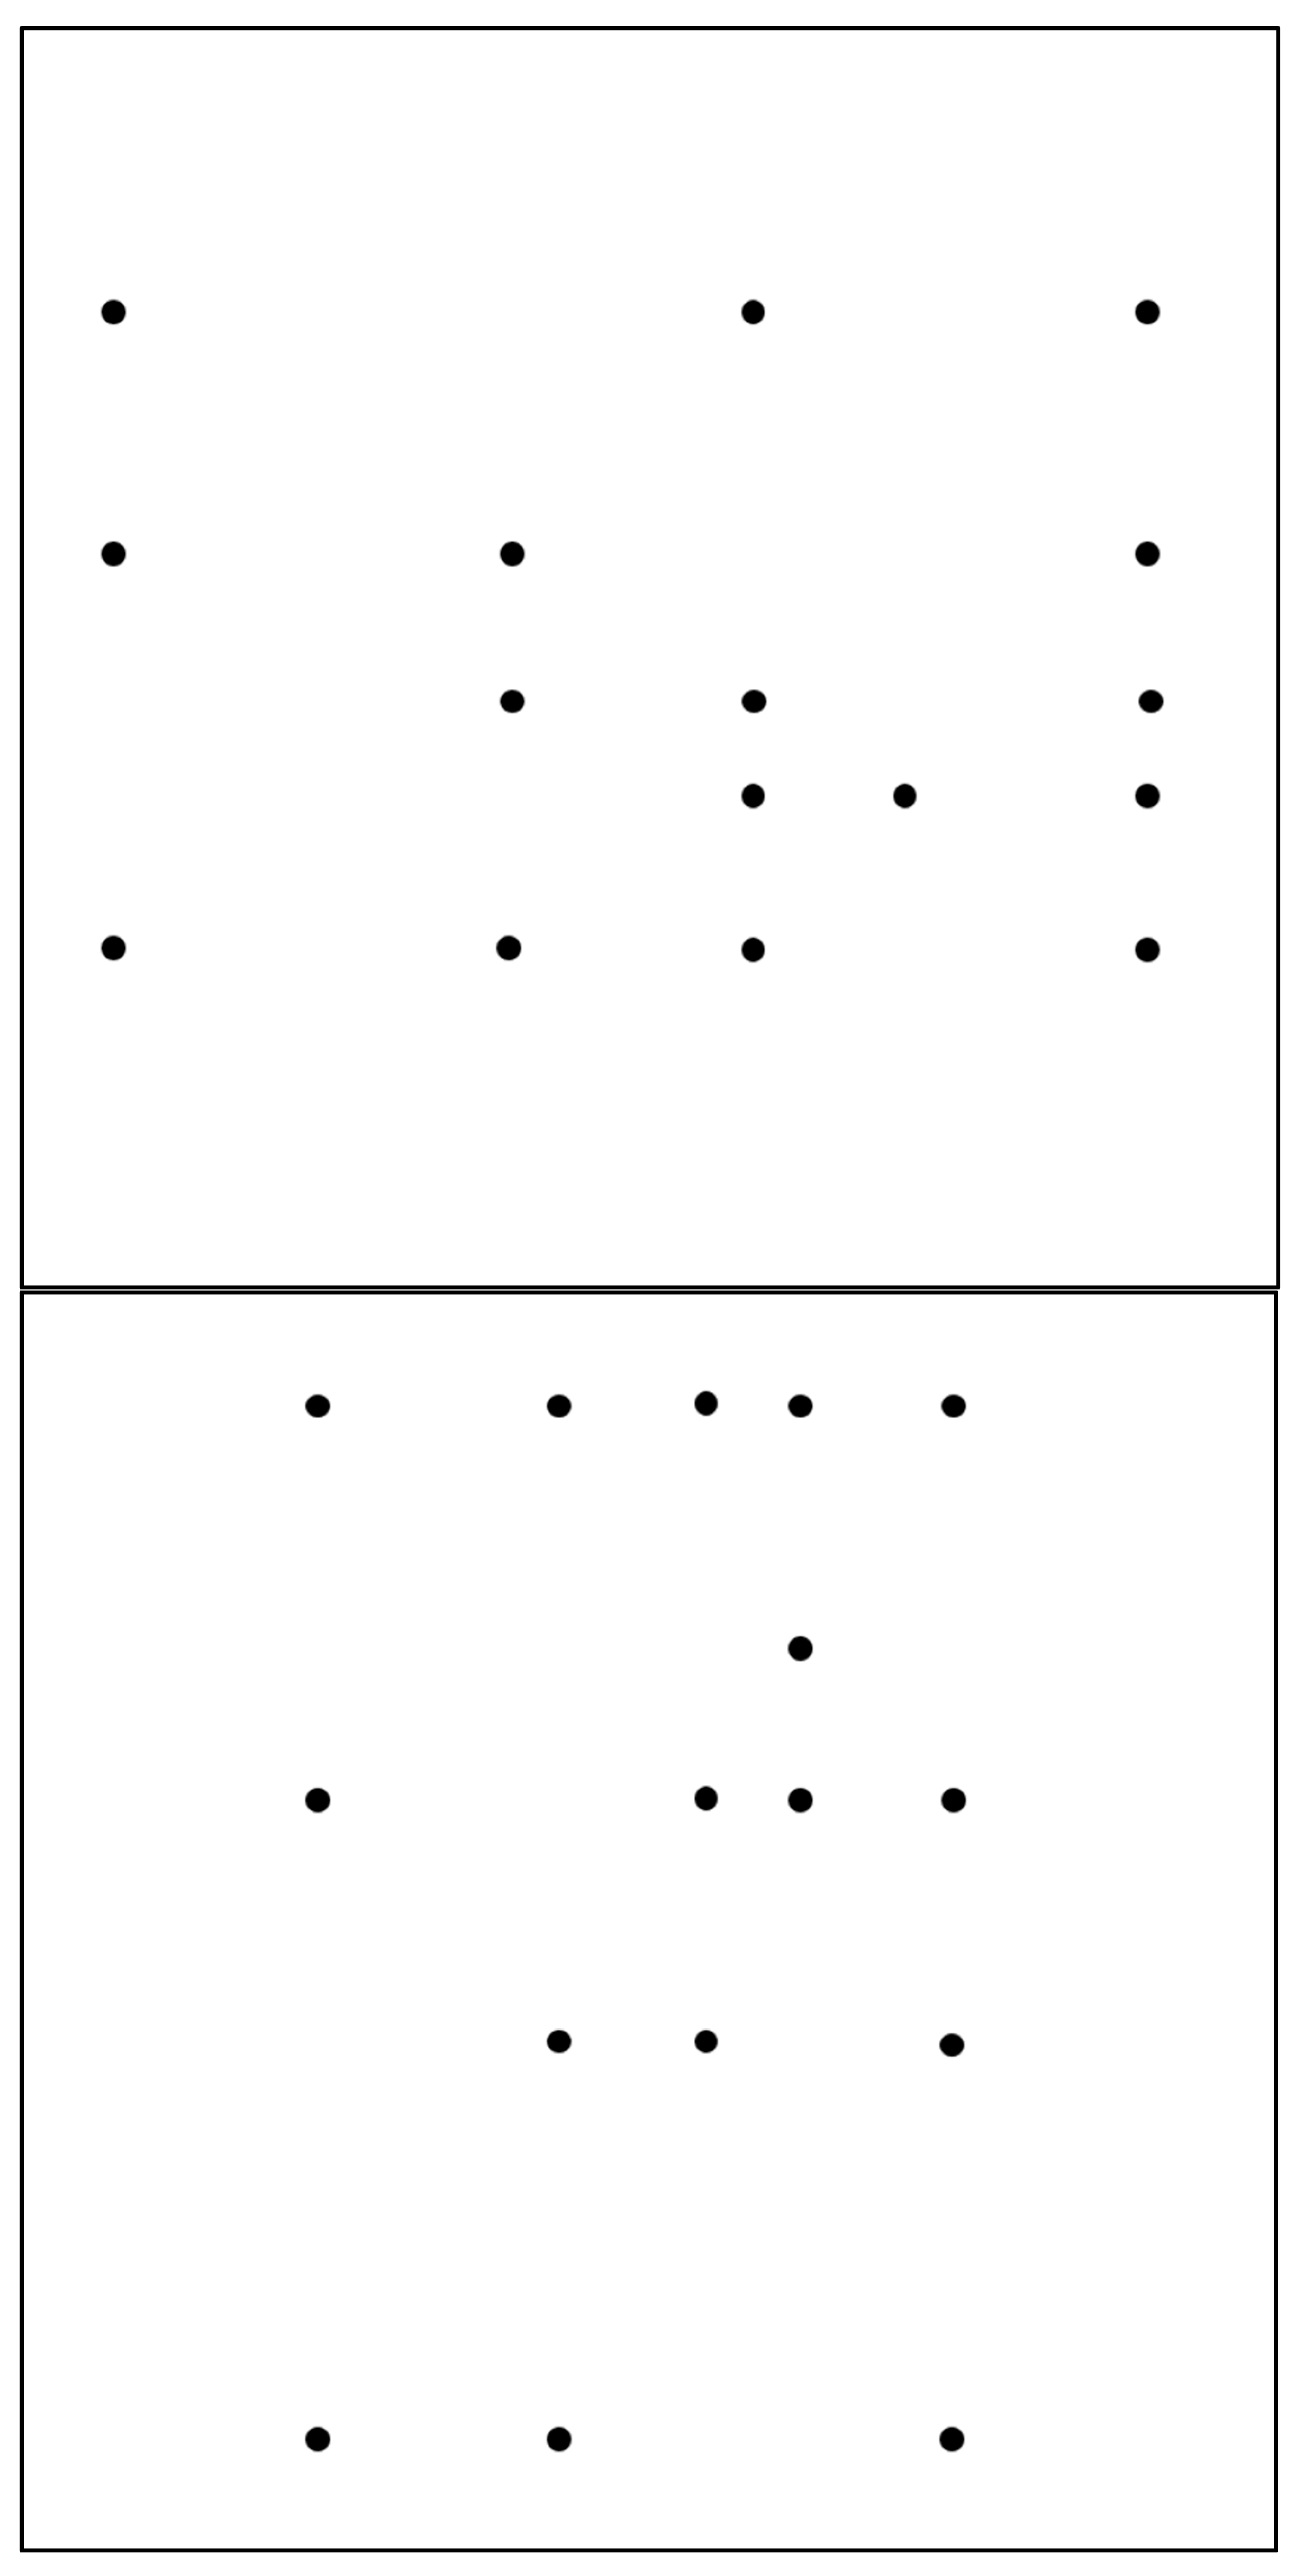
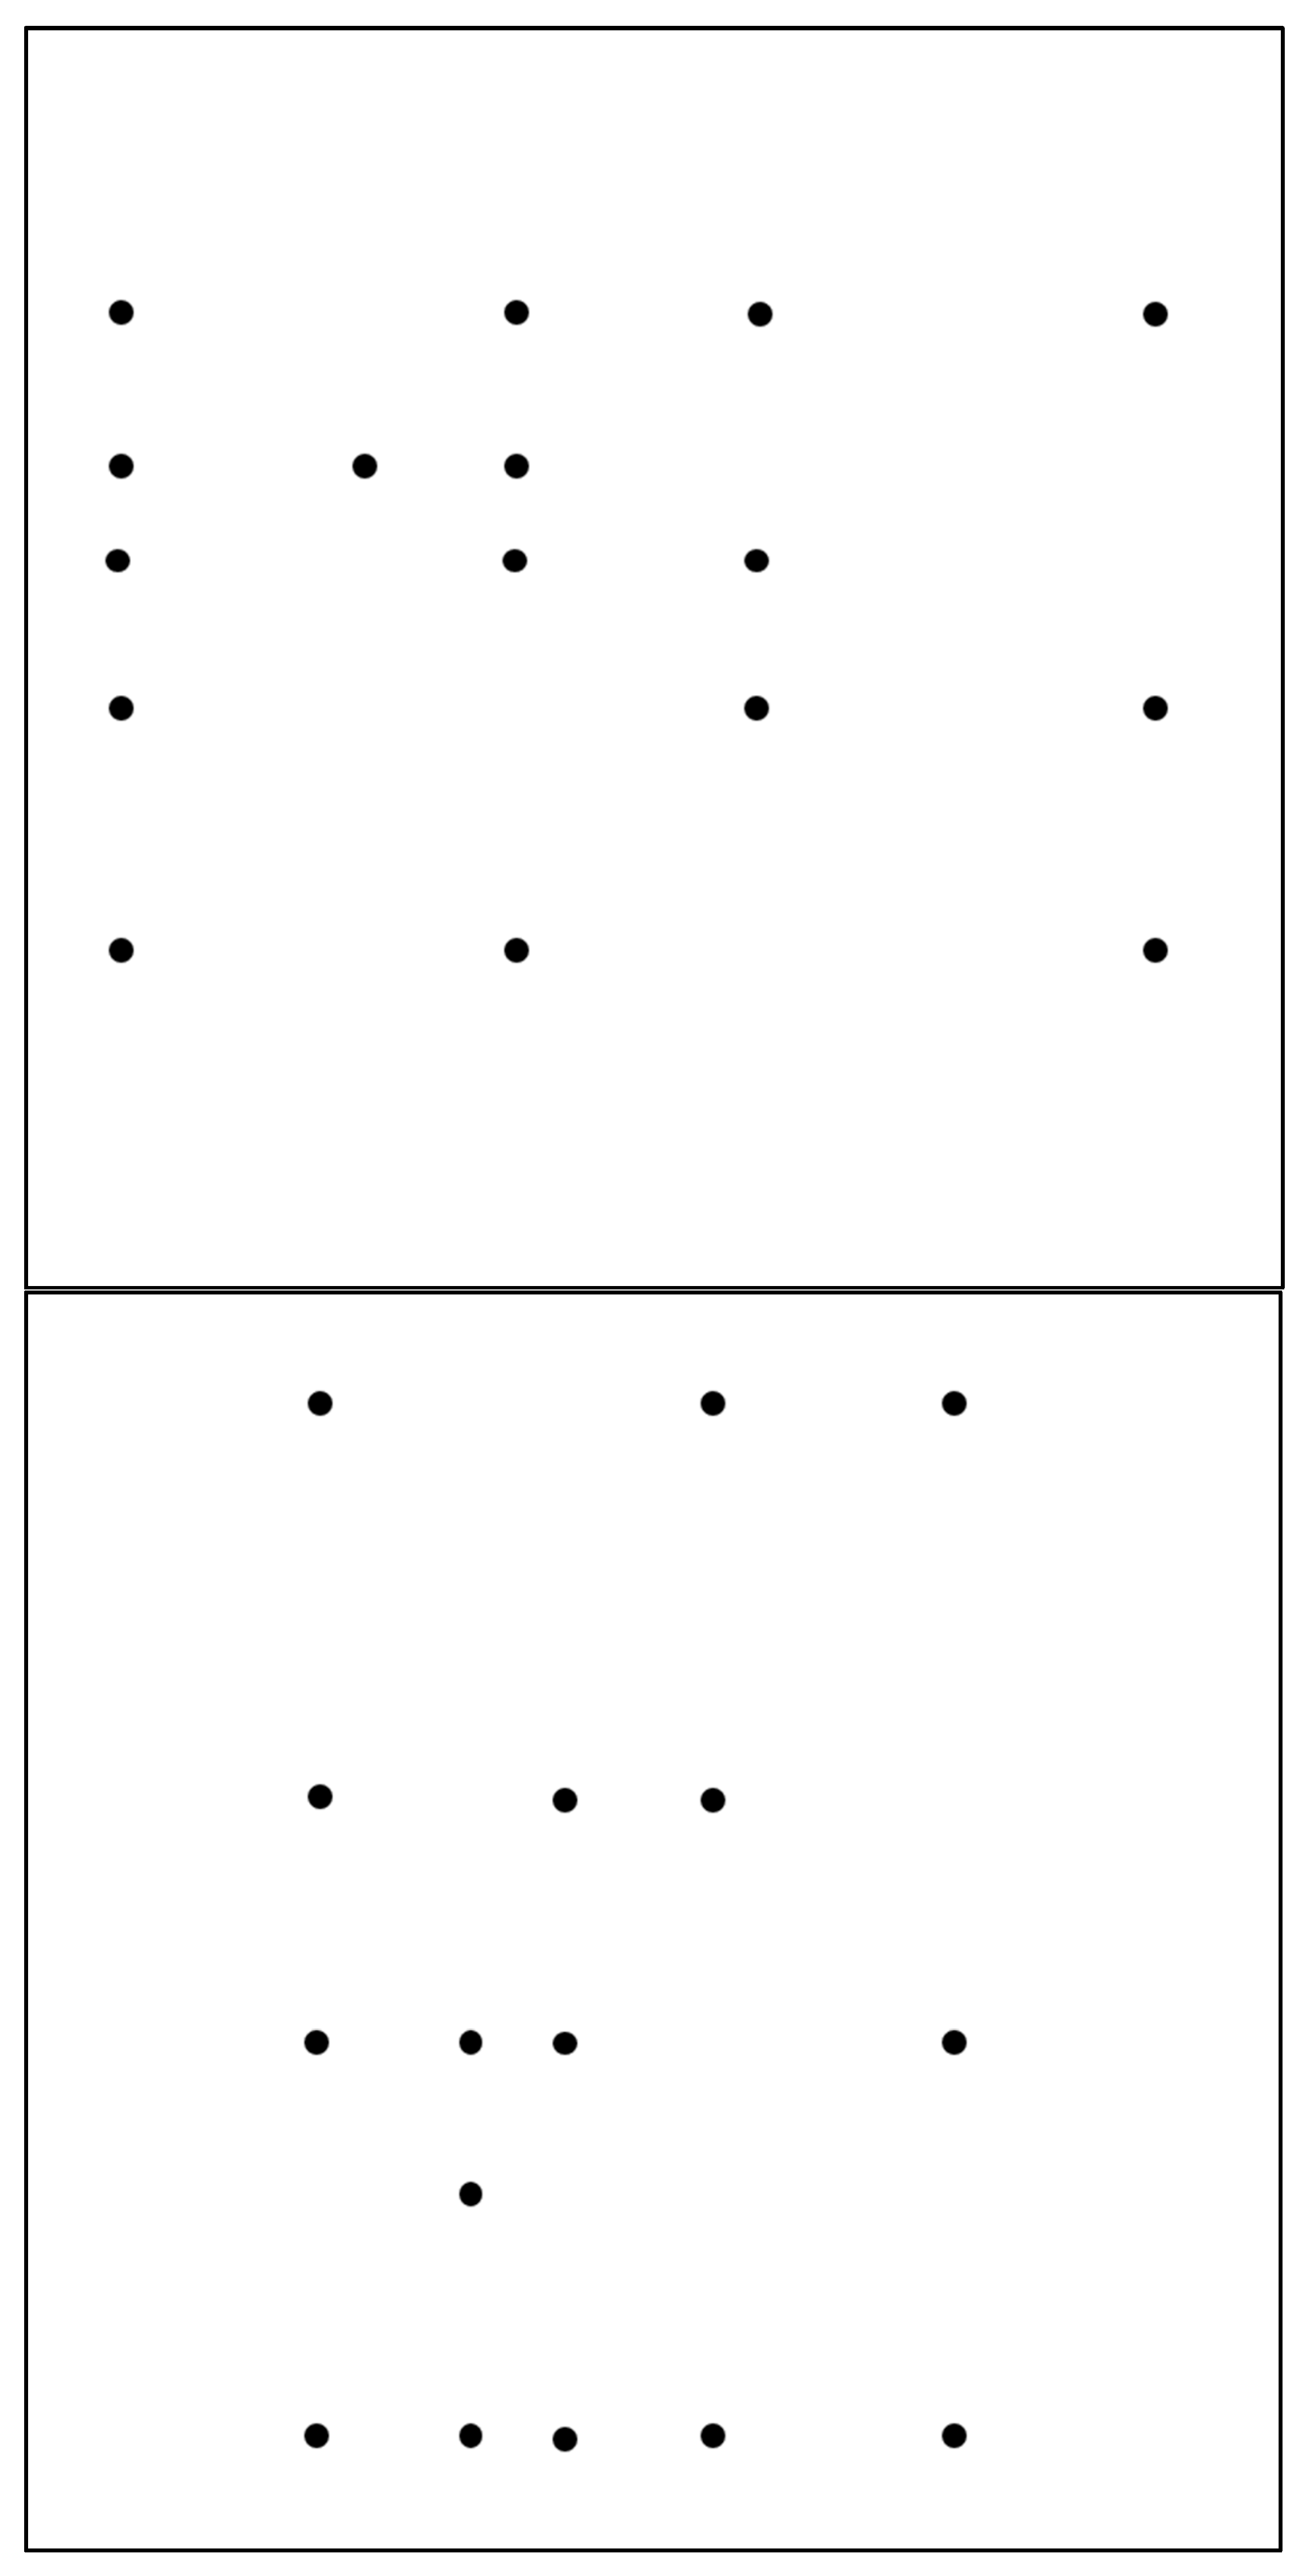
A set of 40 black dot-patterns consisting of 16 dots on a white background (10 cm × 10 cm) were created: half of the stimuli had configurations based on the golden proportion, whereas the other half had random configurations. The golden ratio stimuli were created according to the examples shown on Figure 1c,d (see Appendix A for the full set of stimuli), using two main types of golden ratio criteria: in one group (GR1), the criterion was that groups of 3 or more dots were aligned with a distance progressively increased by a factor equal to the golden ratio (Figure 1c, upper panel), and in the other group (GR2), the criterion was that dots formed the vertices of a golden rectangle (Figure 1c, middle panel). The different stimuli in these two groups were created according to the above criteria, modifying the distance among dots and their possible orientation. Random stimuli were extracted as a set of dots previously used in the study by Makin et al. [19] on the preference for symmetrical dot stimuli over random ones.
Twenty words were selected from the Italian validation [29] of the Affective Norms for English Words (ANEW) database [30]. There were 10 positive words (Italian version of triumph, gift, holiday, music, trust, friend, laughter, health, affection, kiss), and 10 negative words (Italian version of war, deceit, slave, misery, tomb, devil, poison, nightmare, ache, crisis). The valence of the positive words was greater than the valence of the negative words (8.06 vs. 1.98, p < 0.001, scale = 1 to 9), where the most positive word was ‘vacanza’ (Italian for ‘holiday’) and the most negative word was ‘guerra’ (Italian for ‘war’). However, the two sets of words were balanced for length (6.2 vs. 6.2, p > 0.99) and frequency (27,278 vs. 30,614, p = 0.87).

2.6. Line Bisection Task

Finally, participants performed a line bisection task on the computer [31], in which they were asked to divide in two unequal parts the 100 mm segment shown on the screen by moving a virtual cutter.

2.7. Statistical Analysis

Reaction times (RT) from trials with errors (6.51%) and RT above 10 s (0.19%) were excluded from analysis (6.7%). After computing mean RT and response accuracy for each experimental block, we computed the D-score as the difference between mean RT in the incompatible and compatible blocks, divided by the standard deviations in those blocks [19]. The D-score, which is not dependent on the order of block presentation, is close to zero if there is no difference between RT in incompatible and compatible blocks, it is positive if RT in incompatible blocks are longer than those in compatible blocks (confirming the hypothesis of a preference for the golden ratio), and it is negative if RTs are faster in incompatible than in compatible blocks (with a result opposite to the above hypothesis).
For the explicit measures, we computed the Rating Index for the judgement task as the mean score given on the Likert scale by all participants. For the line bisection task, we computed the mean position of the cutter with respect to the extreme left of the segment, and the mean length of the shorter part obtained after the cut (regardless of whether it was on the left or on the right of the segment).
Data are reported in terms of mean ± standard deviation. One sample t-test with respect to the null value was performed on the D-score. Paired t-tests were performed on the offers made at Ultimatum Game and on the bisections made at the line bisection test with respect to the golden ratio. Paired t-tests were also used to compare accuracy (computed as the sum of the correct answers) between compatible and non-compatible conditions of the IAT and to compare the ratings provided at the explicit judgement task for the two types of stimuli. Two Repeated Measure Analysis of Variance (RM-ANOVA) were used for RTs and for accuracy with compatibility, block, and their interaction. The effect size (ES) of these RM-ANOVAs was computed as the partial eta squared. If the sphericity assumption was violated, the Greenhouse–Geisser correction was adopted. Correlations between implicit and explicit measures were evaluated using Pearson coefficient (R). For all the tests, the alpha level of statistical significance was set at 0.05. Post-hoc were performed using Bonferroni correction.

3. Results

Mauchly’s Test revealed a significant violation of sphericity for Block W = 0.84, Chi-square (2) = 17.08, p < 0.001, and Compatibility by Block interaction, W = 0.91, Chi-square (2) = 8.76, p = 0.013, therefore, the Greenhouse–Geisser correction is reported.
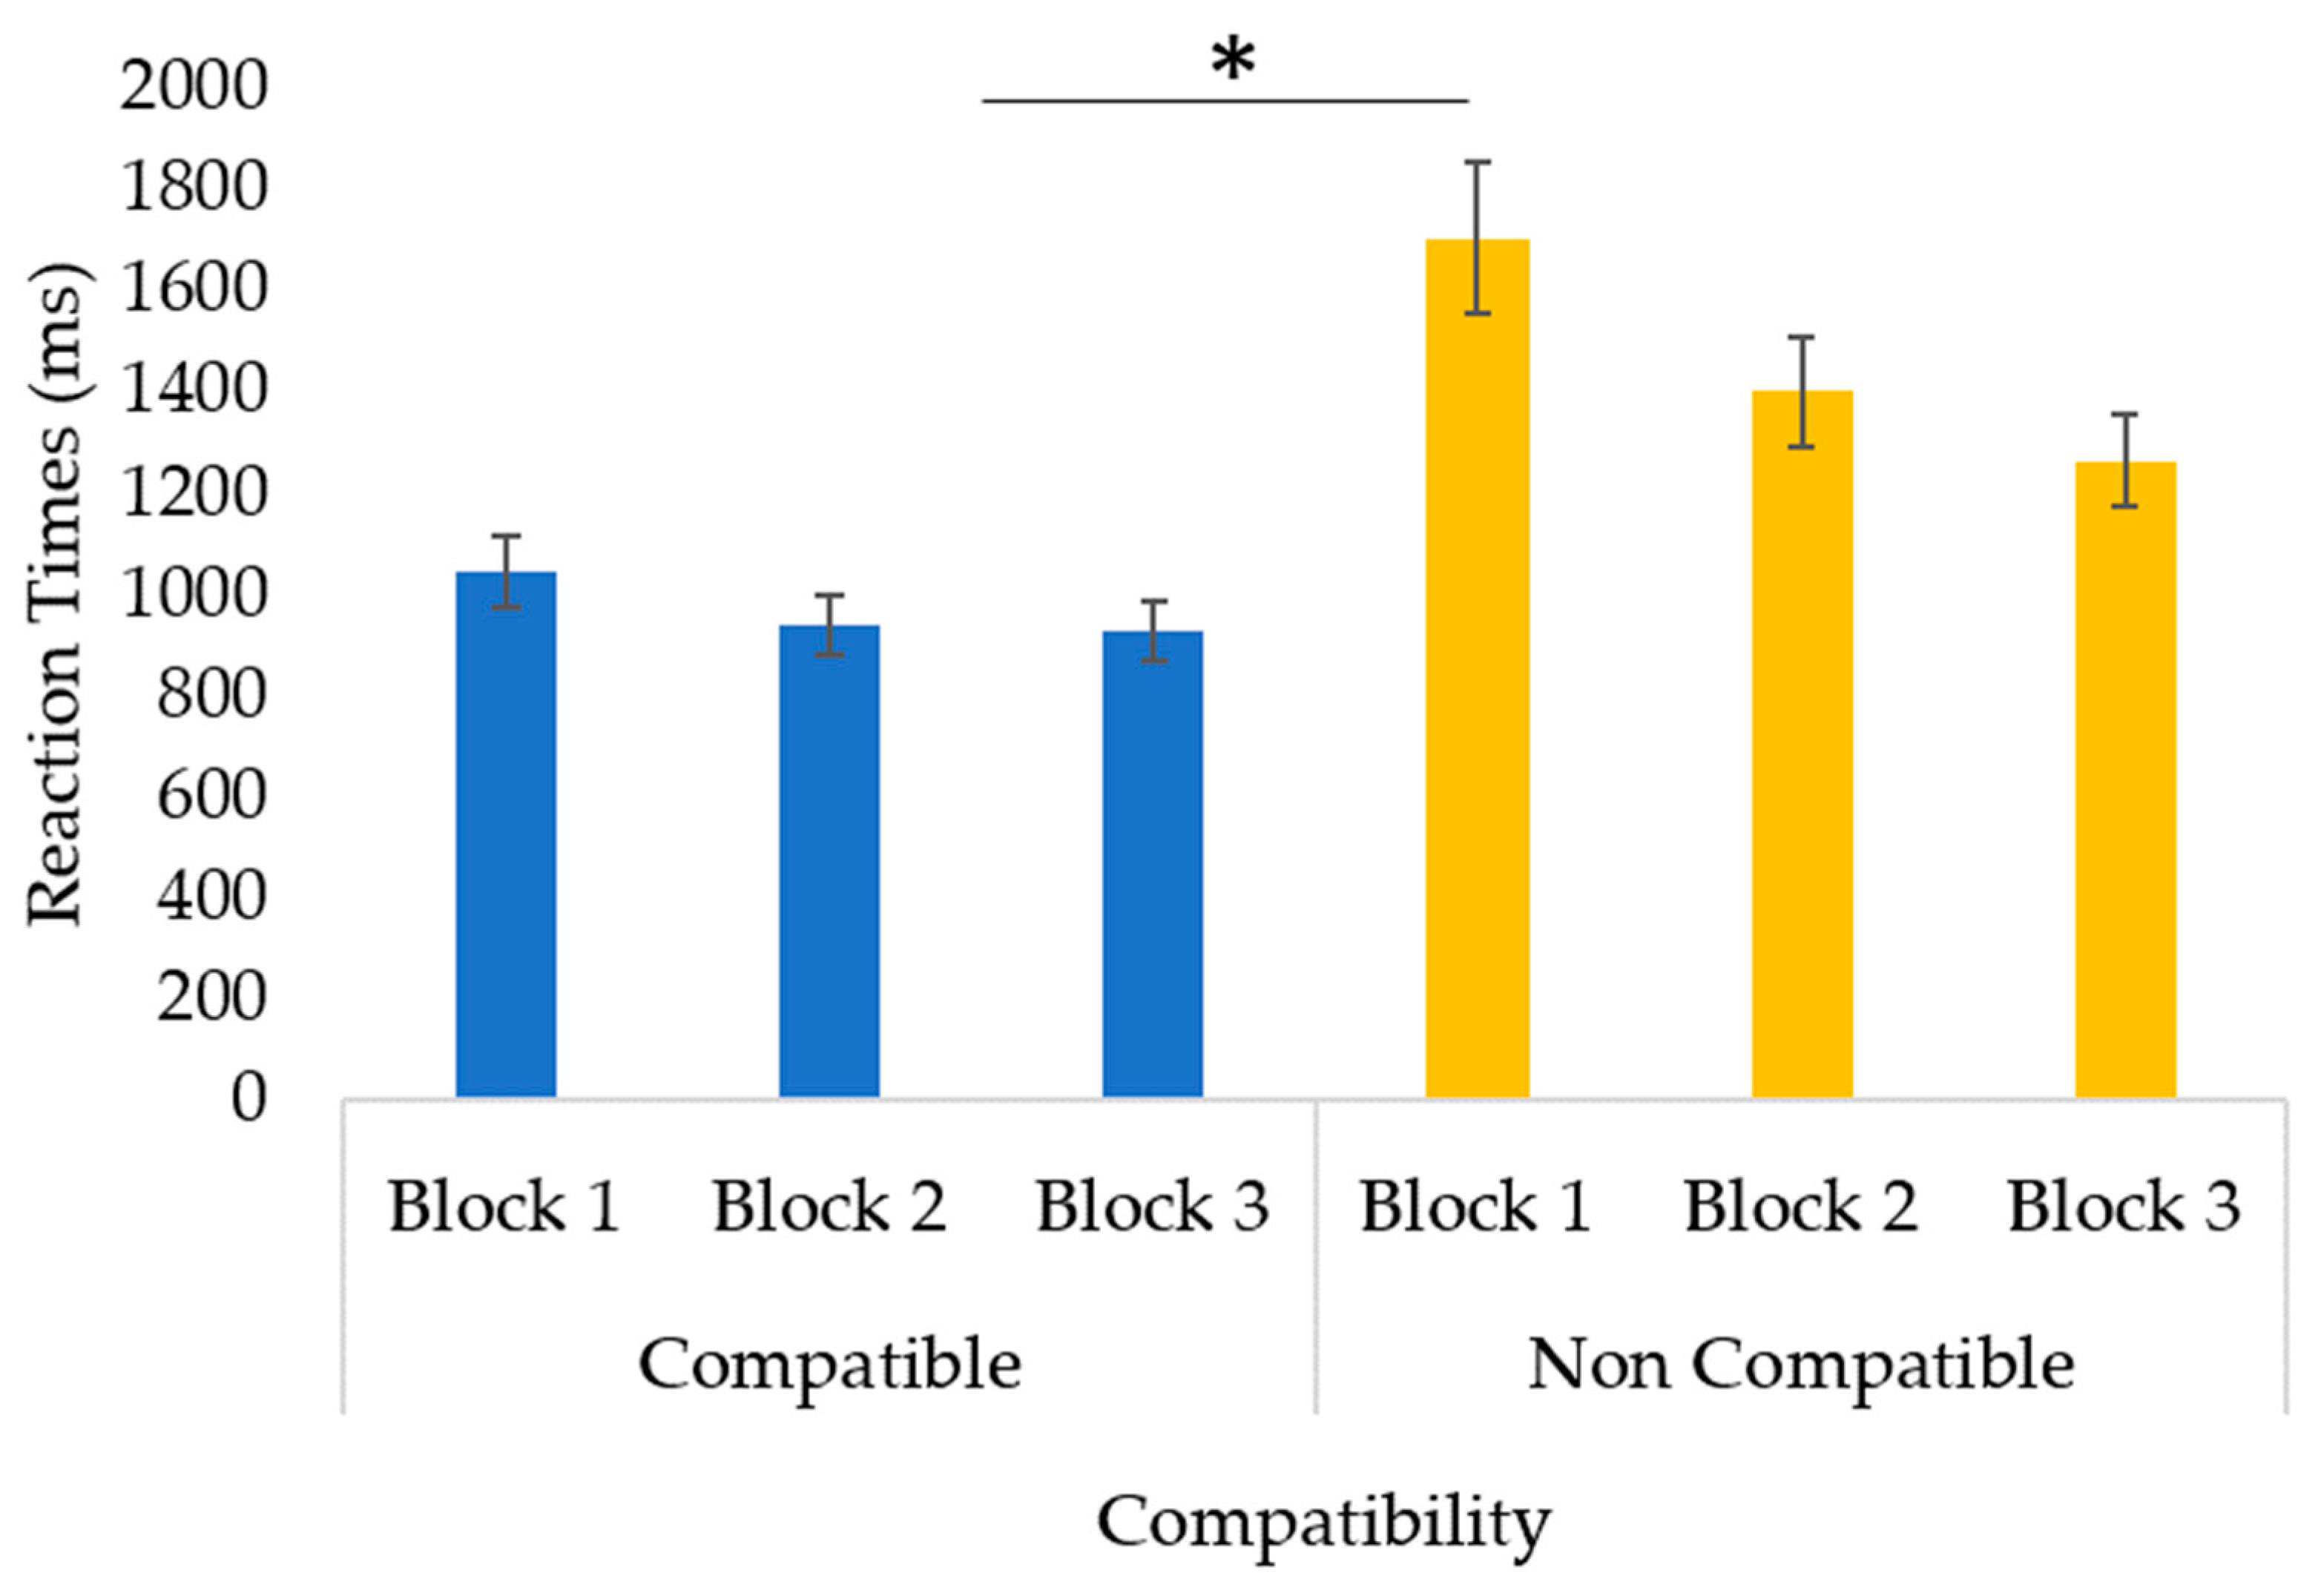
As shown in Figure 3 and Table 2, the mean response times for compatible trials was shorter than for incompatible trials in the three blocks. Indeed, the RM-ANOVA on response time showed a significant main effect of compatibility (F(1,99) = 129.8, p < 0.001, η2p = 0.567), with faster responses in the compatible blocks (M = 971, SD = ± 324 ms), compared to incompatible blocks (M = 1456, SD = ± 633 ms). The main effect of block was also significant (F(1.7,171) = 66.1, p < 0.001, η2p = 0.40) due to faster responses as the experiment proceeded (B1: 1375 ± 675; B2: 1170 ± 509; B3: 1095 ± 427 ms). The interaction was also significant (F(1.8,182) = 26.1, p < 0.001, η2p = 0.21). Post-hoc comparisons showed statistically significant differences between compatible and incompatible trials on all blocks (p < 0.001). No significant differences were found based on block order. The D-score was 0.64 ± 0.43, significantly higher than the null value (t = 14.92, df = 99, p < 0.001).
ANOVA results for accuracy showed a main effect of compatibility, F(1,99) = 33.79, p < 0.001, η2p = 0.25), with greater accuracy in the compatible blocks (M = 0.95) compared to incompatible blocks (M = 0.92). The main effect of block was also significant, F(2,198) = 8.59, p < 0.001, η2p = 0.08 due to greater accuracy in the third block (M = 0.95) compared to the first block (M = 0.92, p = 0.001), but no difference was found between block 2 and 3, or block 1 and 2. The interaction was not significant.
To test if there was any effect of the two types of GR configurations, we performed a one-sample t-test on the D-index separately for GR1 (M = 1.45, SD = 1.45) and GR2 (M = 0.80, SD = 0.68) stimuli. Findings showed a statistically significant difference from the null value for both types of GR (t = 9.9, df = 99, p < 0.001 and t = 11.7, df = 99, p < 0.001, respectively), therefore, GR was implicitly preferred regardless of how it was implemented. However, the two D-scores were statistically different from each other (t = −6.10, df = 99, p < 0.001), but this difference was only due to a higher variability (i.e., standard deviation) for GR1. In fact, when comparing the differences in RT between incompatible and compatible trials (without dividing for the standard deviation), this difference was no longer statistically significant (t = −0.70, df = 99, p = 0.49).

Explicit Tasks

For the Ultimatum Game, the mean response was 54.7 ± 13.8, which was significantly different from the golden ratio (t = −5.15, df = 99, p < 0.001). Seventy-two participants chose the fifty–fifty division, the second more common division was that in golden ratio: twelve subjects used a division close (between 60:40 and 65:35) to the golden ratio (61.8:38:2). A post-hoc exploratory analysis was conducted on these 12 subjects who chose a golden ratio division for the Ultimatum Game. They also showed a statistically significant preference for the golden ratio in the explicit pleasantness rating index compared to the other participants (2.1 ± 1.5 vs. 1.2 ± 1.3, t = −2.16, df = 98, p = 0.033). However, there were no statistically significant differences in the D-score of the 12 subjects who chose a golden ratio as the solution for the Ultimatum Game compared to the other subjects (0.73 ± 0.36 vs. 0.62 ± 0.43, t = 0.83, df = 98, p = 0.407) or compared to performance on the line bisection task (69.6 ± 14.5 vs. 72.6 ± 13.8, t = 0.71, df = 98, p = 0.476).
Findings for the preference ratings showed that the golden ratio stimuli were rated as more pleasant, with a mean rating score of 4.0 ± 1.2, compared to random patterns that were 2.7 ± 1.1 (rating index: 1.3 ± 1.4, p < 0.001). The correlation between D-score and explicit pleasantness rating was R = 0.158, p = 0.116.
For the line bisection task, results showed that the cutting mean value was at 39.7 ± 24.2 mm from the left border, a value not significantly different from the golden ratio division 38.2:61.8 (t = 0.611, df = 99, p = 0.543). However, when considering only the mean length of the shorter bisected parts, the mean value was 27.7 ± 13.9 (t = −7.5, df = 99, p < 0.001).

4. Discussion

In the present study, we investigated individuals’ implicit and explicit preferences for golden ratio patterns. Previous research has suggested that the golden ratio can evoke aesthetic preferences, but evidence on individual implicit preferences for the golden ratio stimuli is scarce. To address this, one-hundred participants completed the explicit preference tasks and an implicit association task, which involved presenting dot-patterns based on the golden ratio and random dot-patterns, as well as positive and negative words.
The results of the study revealed the predicted IAT effect, with faster and more accurate responses in the compatible compared to incompatible blocks. This resulted in a positive D-score, which represents a measure of the strength of the hypothesized association between the categories being investigated. In this case, the positive D-score indicates an implicit preference for the golden ratio stimuli. This implicit preference was relatively independent of the criterion used to design the golden ratio stimuli. In fact, the implicit preference effect as expressed by the D-score was present for both types of golden ratio stimuli. Although it should be mentioned that the D-score for the two types of golden ratio differed from each other mainly for the higher variance present for GR1. In fact, when RT between incompatible and compatible trials were compared, the difference in implicit preference scores between the two types of golden ratio stimuli was not present anymore.
The aim of our study was to assess whether there is an implicit preference for golden ratio over random patterns, and we did so by using the same methodology as Makin et al. [19] where symmetric dot patterns were compared to random dot patterns to assess whether there was an implicit preference for symmetry. Hence, in the present study, instead of symmetrical dot patterns, we used golden ratio patterns. We did not include other stimuli as we focused on the potential differences between implicit and explicit preferences for the golden ratio, and using other stimuli not only could act as confounders, but it would also have entailed increasing the number of condition and pattern combinations. Although we did not include other non-random stimuli and we could not compare the golden ratio patterns with different types of regularities, it is interesting that the values of the D-score were in line with those reported for symmetry in Makin et al. [19] as they found a D-score >0.5 when reflective and rotative symmetric patterns were compared to random patterns. In our study, we found a D-score of 0.64, higher than the value found for reflective symmetry but lower than that found for rotational symmetry. Whether this suggests that the implicit preferences for different regularities decrease linearly from reflective symmetry to golden ratio and to rotational symmetry is for future studies to address.
We also asked participants to explicitly rate dot-pattern stimuli for pleasantness, but these findings are less clear. This is because although the golden ratio stimuli were rated more positively than random stimuli, the implicit preference D-score did not correlate with the explicit preference rating index. This finding suggests that implicit and explicit measures may tap on different processes. The lack of a correlation between the D-score and the explicit ratings is not surprising, due to correlations between implicit and explicit measures being typically weak [32], which is attributed to these measures being able to elicit different, but still related constructs. It is possible that the lack of explicit preferences for golden ratio stimuli reported in previous studies is due to these stimuli being preferred only when considered in association to a positive-valence category (e.g., IAT). Gawronski et al. [32] suggest that the IAT can elicit implicit attitudes, which participants are not always able to express in explicit self-report measures, due to being unaware of such inclinations. However, there is also evidence that performance at the IAT can be predicted by some participants [33,34], challenging the assumption that the implicit preferences are not accessible by consciousness.
In addition, when participants were asked to ‘produce’ ratios by dividing quantities (regardless of whether instructed to do so asymmetrically as for bisecting a line or simply instructed to divide an amount of money) there was no evidence of the golden ratio for sharing an amount of money [15,16]. It is interesting that we found a lack of evidence for the golden ratio also for the line bisection task (i.e., mean length of the shorter bisected parts), which participants completed after the IAT (as it could have primed golden ratio) and with the explicit instruction to bisect asymmetrically. Therefore, our findings indicate that people do not spontaneously use golden ratio rules in these tasks. It is possible that individuals may not have explicit knowledge of the golden ratio, yet the implicit association with beauty can still emerge. Although the present findings are at odds with those reported by Stieger and Swami [24], who also used the IAT and found an implicit preference for symmetry but not for the golden ratio, this may be because they compared golden ratio stimuli to symmetric ones. In fact, they also found that the golden ratio stimuli were preferred only when compared to the ¾ proportion.
We would like to acknowledge some limitations of the present study. Firstly, we used online data collection, but to minimize the effect of possible noise, we oversampled our subject pool to one-hundred participants, whereas typical IAT studies use smaller sample sizes [35]. Moreover, there is evidence of similar results obtained from both online and in-lab studies [36]. We also checked for outliers in our data (e.g., higher percentage of errors or longer time for experiment completion, compared to the total sample), and none were found, therefore, the data of all participants were included in the data analyses. A second limitation is that the sample involved only young-adults, and future research should investigate differences across different populations. Furthermore, one can argue that a third limitation of our study concerns the difference in the instructions for the line bisection task and for the Ultimatum Game as we explicitly asked participants to divide the line not symmetrically for the bisection task, whereas for the Ultimatum Game we left participants free to choose, including choosing the symmetric 50:50 ratio. Indeed, most of the participants opted for the symmetric division in the Ultimatum Game, suggesting that symmetry is explicitly preferred to golden ratio not only for visual tasks as those used by Stieger and Swami [24], but also for tasks such as the Ultimatum Game. In contrast, for the line bisection task there was an effect of the golden ratio only when considering the average division, which, as the presentation order of the explicit tasks was not counterbalanced, could be due to previous exposure to golden ratio stimuli during the IAT.
It is also important to point out that our study was not aimed at comparing symmetry and the golden ratio, but rather to assess whether there is a preference—implicit and/or explicit—for the golden ratio with respect to chance. Finally, we would like to acknowledge that the present findings are informative of how golden ratio stimuli are perceived and cannot be used as a predictor of possible individuals’ behaviour. This is particularly important as an interesting review has reported how IAT findings on individuals’ implicit preferences are often a bad predictor of actual behaviour [22].
To sum up, the present findings converge with Makin and colleagues [19] in pointing out that the IAT represents a valuable tool to investigate visual preferences and, by extension, aesthetic experiences not only for symmetry but also for the golden ratio, although literature presents discussions on IAT limitations [37,38,39].
Future studies may further investigate whether the golden ratio is explicitly preferred when stimuli are not geometrical, like when the golden ratio is embedded in an artistic stimulus [25], or when participants perceive a harmony without an explicit knowledge of the geometrical rule behind it. In fact, the aesthetic preference for the golden ratio may emerge when this proportion is embedded in an ecological/artistic stimulus more than when it is present in an abstract geometrical/virtual image. Our findings cannot clarify this point as we compared the golden ratio to random geometrical patterns. The present findings are also consistent with evidence showing that explicit preferences are task dependent. Finally, our results did not show a clear preference for the golden ratio in the Ultimatum Game, which is at odds with previous studies [15,16]. However, it should be mentioned that McManus et al. [40] found that individuals had preferences for squares (corresponding to a 50:50 proportion, much like that preferred by our subjects in the Ultimatum Game) and for the golden ratio, but they also observed high inter-individual differences, which were not explained by personality, need for cognition, tolerance of ambiguity, vocational types, or aesthetic activities. The issue of the role of individual differences on preferences for the golden ratio is a complex one and still unresolved. In fact, whereas Stieger and Swami [24] reported that preferences for the golden ratio may be affected by aesthetic experiences, De Bartolo failed to find any significant correlations between preferences for the golden ratio and cultural skills, but observed a relation between self-assessed art and math knowledge. Indeed, they suggested that the golden ratio may be a sort of affordance present in the environment that could be associated with an easier visual processing, and this could explain why symmetry and the golden ratio are preferred at the implicit more than at the explicit level.
To conclude, the present findings provided evidence of an implicit preference for the golden ratio. Human beings have an implicit and explicit aesthetic preference for symmetric stimuli [24], probably because of processing fluency [26] and/or due to the detection of a gestalt-like pattern, or because in general, they prefer ordered versus random stimuli [19,20]. When considered in this context, the golden ratio could represent a second level of order, probably more difficult to be explicitly preferred, but implicitly engendering some preference both in abstract (as in our study) or artistic [25] stimuli. Future research could investigate more in depth the association between the golden ratio and positive valence category, and under which conditions differences in explicit judgments emerge but also to what extent the golden ratio is preferred to other types of regularities.

Author Contributions

Conceptualization, M.I. and A.P.; Methodology, M.I. and A.P.; Software, C.S.; Formal analysis, M.I.; Investigation, C.S. and C.V.; Writing—original draft, C.S. and M.I.; Writing—review & editing, C.V. and A.P. All authors have read and agreed to the published version of the manuscript.

Funding

Claudia Salera was funded by a PhD studentship in Behavioural Neuroscience from the Ministero dell’Università e della Ricerca (M.U.R.). Anna Pecchinenda is funded by the Ministero dell’Università e della Ricerca (M.U.R.), grant number: RM120172B77EE5F8. Marco Iosa is funded by Sapienza University of Rome, grant number: RM122181675BD4-FF “project Michelangelo”. The funders had no role in study design, data collection and analysis, decision to publish, or preparation of the manuscript.

Institutional Review Board Statement

The study was conducted in accordance with the Declaration of Helsinki (1991), and the protocol was approved by the Ethics Committee of Sapienza University (Project Identification code: 1272, approved on the 5 July 2019).

Data Availability Statement

The data presented in this study are available on request from the corresponding author.

Conflicts of Interest

The authors declare no conflicts of interest.

Appendix A

Figure A1. GR-1 stimuli were created using the criterion that groups of 3 or more dots were aligned with a distance progressively increased by a factor equal to golden ratio.
Symmetry 16 00333 g0a1aSymmetry 16 00333 g0a1bSymmetry 16 00333 g0a1cSymmetry 16 00333 g0a1d
Figure A2. GR-2 stimuli created using the criterion that dots formed the vertices of a golden rectangle.
Symmetry 16 00333 g0a2aSymmetry 16 00333 g0a2bSymmetry 16 00333 g0a2cSymmetry 16 00333 g0a2dSymmetry 16 00333 g0a2eSymmetry 16 00333 g0a2f

References

  1. Iosa, M.; Morone, G.; Paolucci, S. Phi in physiology, psychology and biomechanics: The golden ratio between myth and science. Biosystems 2018, 165, 31–39. [Google Scholar] [CrossRef]
  2. De Campos, D.; Malysz, T.; Bonatto-Costa, J.A.; Pereira Jotz, G.; Pinto de Oliveira Junior, L.; Oxley da Rocha, A. More than a neuroanatomical representation in The Creation of Adam by Michelangelo Buonarroti, a representation of the Golden Ratio. Clin. Anat. 2015, 28, 702–705. [Google Scholar] [CrossRef]
  3. de Campos, D.; Malysz, T.; Bonatto-Costa, J.A.; Pereira Jotz, G.; Pinto de Oliveira Junior, L.; Oxley da Rocha, A. Michelangelo, the Last Judgment fresco, Saint Bartholomew and the Golden Ratio. Clin. Anat. 2015, 28, 967–971. [Google Scholar] [CrossRef]
  4. Fechner, G.T. Über die Frage des goldenen Schnittes [On the question of the golden section]. Arch. Zeichnenden Künste 1865, 11, 100–112. [Google Scholar]
  5. Pierce, E. Studies from the Harvard Psychological Laboratory (V): The aesthetics of simple forms. II. The functions of the elements. Psychol. Rev. 1896, 3, 270–282. [Google Scholar] [CrossRef]
  6. Haines, T.H.; Davies, A.E. The psychology of aesthetic reaction to rectangular forms. Psychol. Rev. 1904, 11, 249–281. [Google Scholar] [CrossRef]
  7. Green, C.D. All That Glitters: A Review of Psychological Research on the Aesthetics of the Golden Section. Perception 1995, 24, 937–968. [Google Scholar] [CrossRef]
  8. Iosa, M.; Morone, G.; Fusco, A.; Marchetti, F.; Caltagirone, C.; Paolucci, S.; Peppe, A. Loss of fractal gait harmony in Parkinson’s Disease. Clin. Neurophysiol. 2016, 127, 1540–1546. [Google Scholar] [CrossRef]
  9. Iosa, M.; Fusco, A.; Marchetti, F.; Morone, G.; Caltagirone, C.; Paolucci, S.; Peppe, A. The Golden Ratio of Gait Harmony: Repetitive Proportions of Repetitive Gait Phases. BioMed Res. Int. 2013, 2013, 918642. [Google Scholar] [CrossRef] [PubMed]
  10. Belluscio, V.; Iosa, M.; Vannozzi, G.; Paravati, S.; Peppe, A. Auditory Cue Based on the Golden Ratio Can Improve Gait Patterns in People with Parkinson’s Disease. Sensors 2021, 21, 911. [Google Scholar] [CrossRef] [PubMed]
  11. Alam, M.K.; Mohd Noor, N.F.; Basri, R.; Yew, T.F.; Wen, T.H. Multiracial Facial Golden Ratio and Evaluation of Facial Appearance. PLoS ONE 2015, 10, e0142914. [Google Scholar] [CrossRef]
  12. Anand, S.; Tripathi, S.; Chopra, A.; Khaneja, K.; Agarwal, S. Vertical and horizontal proportions of the face and their correlation to phi among Indians in Moradabad population: A survey. J. Indian Prosthodont. Soc. 2015, 15, 125. [Google Scholar] [CrossRef]
  13. Nikgoo, A.; Alavi, K.; Alavi, K.; Mirfazaelian, A. Assessment of the golden ratio in pleasing smiles. World J. Orthod. Fall 2009, 10, 224–228. [Google Scholar]
  14. Yetkin, G.; Sivri, N.; Yalta, K.; Yetkin, E. Golden Ratio is beating in our heart. Int. J. Cardiol. 2013, 168, 4926–4927. [Google Scholar] [CrossRef] [PubMed]
  15. Schuster, S. A New Solution Concept for the Ultimatum Game leading to the Golden Ratio. Sci. Rep. 2017, 7, 5642. [Google Scholar] [CrossRef] [PubMed]
  16. Suleiman, R. Economic Harmony: An Epistemic Theory of Economic Interactions. Games 2017, 8, 2. [Google Scholar] [CrossRef]
  17. Che, J.; Sun, X.; Gallardo, V.; Nadal, M. Cross-cultural empirical aesthetics. Prog. Brain Res. 2018, 237, 77–103. [Google Scholar] [CrossRef] [PubMed]
  18. Rentschler, I.; Jüttner, M.; Unzicker, A.; Landis, T. Innate and learned components of human visual preference. Curr. Biol. 1999, 9, 665–671. [Google Scholar] [CrossRef] [PubMed]
  19. Makin, A.D.J.; Pecchinenda, A.; Bertamini, M. Implicit affective evaluation of visual symmetry. Emotion 2012, 12, 1021–1030. [Google Scholar] [CrossRef]
  20. Makin, A.; Pecchinenda, A.; Bertamini, M. Automatic Affective Evaluation of Visual Symmetry. i-Perception 2012, 3, 217. [Google Scholar] [CrossRef]
  21. Greenwald, A.G.; McGhee, D.E.; Schwartz, J.L. Measuring individual differences in implicit cognition: The implicit association test. J. Personal. Soc. Psychol. 1998, 74, 1464–1480. [Google Scholar] [CrossRef] [PubMed]
  22. Meissner, F.; Grigutsch, L.A.; Koranyi, N.; Müller, F.; Rothermund, K. Predicting Behavior with Implicit Measures: Disillusioning Findings, Reasonable Explanations, and Sophisticated Solutions. Front. Psychol. 2019, 10, 2483. [Google Scholar] [CrossRef] [PubMed]
  23. Nosek, B.A.; Greenwald, A.G.; Banaji, M.R. The implicit association test at age 7: A methodological and conceptual review. In Automatic Processes in Social Thinking and Behavior; Bargh, J.A., Ed.; Psychology Press: Philadelphia, PA, USA, 2007; pp. 265–292. [Google Scholar]
  24. Stieger, S.; Swami, V. Time to let go? No automatic aesthetic preference for the golden ratio in art pictures. Psychol. Aesthet. Creat. Arts 2015, 9, 91–100. [Google Scholar] [CrossRef]
  25. De Bartolo, D.; De Luca, M.; Antonucci, G.; Schuster, S.; Morone, G.; Paolucci, S.; Iosa, M. The golden ratio as an ecological affordance leading to aesthetic attractiveness. PsyCh J. 2021, 11, 729–740. [Google Scholar] [CrossRef] [PubMed]
  26. Pecchinenda, A.; Bertamini, M.; Makin, A.D.J.; Ruta, N. The Pleasantness of Visual Symmetry: Always, Never or Sometimes. PLoS ONE 2014, 9, e92685. [Google Scholar] [CrossRef]
  27. Faul, F.; Erdfelder, E.; Buchner, A.; Lang, A.G. Statistical Power Analyses Using G*Power 3.1: Tests for Correlation and Regression Analyses. Behav. Res. Methods 2009, 41, 1149–1160. [Google Scholar] [CrossRef]
  28. Rezlescu, C.; Danaila, I.; Miron, A.; Amariei, C. More time for science: Using Testable to create and share behavioral experiments faster, recruit better participants, and engage students in hands-on research. Real-World Appl. Cognitive Neurosci. 2020, 253, 243–262. [Google Scholar] [CrossRef]
  29. Montefinese, M.; Ambrosini, E.; Fairfield, B.; Mammarella, N. The adaptation of the Affective Norms for English Words (ANEW) for Italian. Behav. Res. Methods 2014, 46, 887–903. [Google Scholar] [CrossRef]
  30. Bradley, M.M.; Lang, P.J. Affective norms for English words (ANEW): Instruction manual and affective ratings. (Technical Report C-1). In Center for Research in Psychophysiology; University of Florida: Gainesville, FL, USA, 1999. [Google Scholar]
  31. Strappini, F.; Ben-Nun, A.; Pecchinenda, A. A comparative study on line bisection and landmark task performance using a hybrid online setting. Symmetry 2023, 15, 729. [Google Scholar] [CrossRef]
  32. Gawronski, B.; De Houwer, J.; Sherman, J.W. Twenty-Five Years of Research Using Implicit Measures. Soc. Cogn. 2020, 38, s1–s25. [Google Scholar] [CrossRef]
  33. Hahn, A.; Gawronski, B. Facing one’s implicit biases: From awareness to acknowledgment. J. Personal. Soc. Psychol. 2019, 116, 769–794. [Google Scholar] [CrossRef]
  34. Rivers, A.M.; Hahn, A. What Cognitive Mechanisms Do People Reflect on When They Predict IAT Scores? Personal. Soc. Psychol. Bull. 2019, 45, 878–892. [Google Scholar] [CrossRef] [PubMed]
  35. Carlsson, R.; Agerström, J. A closer look at the discrimination outcomes in the IAT literature. Scand. J. Psychol. 2016, 57, 278–287. [Google Scholar] [CrossRef] [PubMed]
  36. Segen, V.; Avraamides, M.; Slattery, T.; Colombo, G.; Wiener, J.M. Comparable performance on a spatial memory task in data collected in the lab and online. PLoS ONE 2021, 16, e0259367. [Google Scholar] [CrossRef] [PubMed]
  37. Oswald, F.L.; Mitchell, G.; Blanton, H.; Jaccard, J.; Tetlock, P.E. Predicting ethnic and racial discrimination: A meta-analysis of IAT criterion studies. J. Personal. Soc. Psychol. 2013, 105, 171–192. [Google Scholar] [CrossRef] [PubMed]
  38. Oswald, F.L.; Mitchell, G.; Blanton, H.; Jaccard, J.; Tetlock, P.E. Using the IAT to predict ethnic and racial discrimination: Small effect sizes of unknown societal significance. J. Personal. Soc. Psychol. 2015, 108, 562–571. [Google Scholar] [CrossRef]
  39. Greenwald, A.G.; Banaji, M.R.; Nosek, B.A. Statistically small effects of the Implicit Association Test can have societally large effects. J. Personal. Soc. Psychol. 2015, 108, 553–561. [Google Scholar] [CrossRef]
  40. Mc Manus, I.C.; Cook, R.; Hunt, A. Beyond the golden section and normative aesthetics: Why do individuals differ so much in their aesthetic preferences for rectangles? Psychol. Aesthet. Creat. Arts 2010, 4, 113–126. [Google Scholar] [CrossRef]
Figure 1. The golden ratio (GR) is the proportion obtained by cutting a segment in a way that the proportion between the total segment and the longer part (AC:AB) is equal to that between the longer and the shorter part (AB:BC). (a) GR in Art and Math: this proportion was found in famous artworks (such as the Creation of Adam by Michelangelo, Phidias built in this proportion the façade of Parthenon, Polykleitos sculptured the Doryphoros with the navel dividing the entire stature in two parts in golden proportion to each other) and in geometrical structures such as the golden rectangle (it has the two dimensions in golden proportion that can be progressively divided in squares and other smaller golden rectangles: the areas of these figures form the Fibonacci sequence, and ϕ is the asymptote of the ratio between two consecutive numbers of Fibonacci) or the pentagon (GR is the ratio between the diagonal and the side of a regular pentagon, and each diagonal is divided by another diagonal in two parts having the lengths in proportion of ϕ. (b) Starting from the golden ratio of a segment, it is possible to depict the golden rectangle and the golden spiral. (c) Construction of the GR stimuli of IAT experiment from the elements reported in column b. (d) Examples of the final GR stimuli presented to the subjects.
Symmetry 16 00333 g001
Figure 2. Example of a typical sequence of trials. The figure shows an example of GR stimulus (first screen from top left), negative word (i.e., ‘GUERRA’, Italian for ‘War’), random stimulus (i.e., third screen from left to right), and positive word (i.e., ‘AMICO’, Italian for ‘Friend’).
Symmetry 16 00333 g002
Figure 3. The mean ± 95% confidence interval of response time for compatible and non-compatible trials. * Post-hoc comparisons for the interaction showed statistically significant differences between compatible and non-compatible trials for all blocks (p < 0.001).
Symmetry 16 00333 g003
Table 1. This sequence of experimental blocks. The experiment consisted of 10 blocks, each comprising 20 trials. In a second version of the experiment, the order of blocks was counterbalanced as for some participants, the incompatible blocks were presented first, followed by the compatible blocks. The practice blocks were adjusted accordingly to match the block order.
BlockPhaseKey 1Key 2
1practiceregularirregular
2practicepositive wordnegative word
3compatibleregular or positive wordirregular or negative word
4compatibleregular or positive wordirregular or negative word
5compatibleregular or positive wordirregular or negative word
6practiceirregularregular
7practiceirregularregular
8incompatibleirregular or positive wordregular or negative word
9incompatibleirregular or positive wordregular or negative word
10incompatibleirregular or positive wordregular or negative word
Table 2. Results of the RM-ANOVA for reaction times.
FactorRT Means ± SD (ms)FpES
CompatibilityC: 971 ± 324 msF(1,99) = 129.8<0.0010.567
N: 1456 ± 633 ms
BlockB1: 1375 ± 675 ms F(1.7,171) = 66.1<0.0010.400
B2: 1170 ± 509 ms
B3: 1095 ± 427 ms
InteractionSee Figure 3F(1.8,182) = 26.1<0.0010.209
Disclaimer/Publisher’s Note: The statements, opinions and data contained in all publications are solely those of the individual author(s) and contributor(s) and not of MDPI and/or the editor(s). MDPI and/or the editor(s) disclaim responsibility for any injury to people or property resulting from any ideas, methods, instructions or products referred to in the content.

