Article

Investigation into Detection Efficiency Deviations in Aviation Soot and Calibration Particles Based on Condensation Particle Counting

1
School of Optics and Electronic Technology, China Jiliang University, Hangzhou 310018, China
2
International Innovation Institute, Beihang University, Hangzhou 311115, China
3
School of Mechanical and Electrical Engineering, China Jiliang University, Hangzhou 310018, China
*
Authors to whom correspondence should be addressed.
Symmetry 2024, 16(2), 244; https://doi.org/10.3390/sym16020244
Submission received: 9 January 2024 / Revised: 10 February 2024 / Accepted: 14 February 2024 / Published: 16 February 2024

Abstract

:
Aviation soot constitutes a significant threat to human well-being, underscoring the critical importance of accurate measurements. The condensation particle counter (CPC) is the primary instrument for quantifying aviation soot, with detection efficiency being a crucial parameter. The properties of small particles and the symmetry of their growth pathways are closely related to the detection efficiency of the CPC. In laboratory environments, sodium chloride is conventionally utilized to calibrate the CPC’s detection efficiency. However, aviation soot exhibits distinctive morphological characteristics compared to the calibration particles, leading to detection efficiencies obtained from calibration particles that may not be applicable to aviation soot. To address this issue, a quantitative study was performed to explore the detection efficiency deviations between aviation soot and calibration particles. The experiment initially utilized a differential mobility analyzer to size select the two types of polydisperse particles into monodisperse particles. Subsequently, measurements of the separated particles were performed using the TSI Corporation’s aerosol electrometer and a rigorously validated CPC (BH-CPC). These allowed for determining the detection efficiency deviation in the BH-CPC for the two types of particles at different particle sizes. Furthermore, the influence of the operating temperature of the BH-CPC on this detection efficiency deviation was investigated. The experimental results indicate a significant detection efficiency deviation between aviation soot and sodium chloride. In the range of 10–40 nm, the absolute detection efficiency deviation can reach a maximum of 0.15, and the relative deviation can reach a maximum of 0.75. And this detection efficiency deviation can be reduced by establishing a relevant relationship between the detection efficiency of the operating temperature and the calibration temperature. Compared to the saturated segment calibration temperature of 50 °C, the aviation soot detection efficiency is closer to the sodium chloride detection efficiency at the calibration temperature of 50 °C when the saturated segment operates at a temperature of 45 °C. These studies provide crucial theoretical guidance for enhancing the precision of aviation soot emission detection and establish a foundation for future research in monitoring and controlling soot emissions within the aviation sector.

1. Introduction

Carbonaceous particles constitute the predominant constituents of pollutant emissions from aviation engines [1]. Given the predominantly high-altitude operation of aviation power systems, aviation soot plays a pivotal role as a major contributor to carbonaceous particles present in the upper troposphere and lower stratosphere [2]. These particles, through their capacity to absorb and scatter sunlight, disrupt the radiation balance of the atmosphere, thus exerting a discernible influence on the Earth’s climate [3,4]. Furthermore, significant particle emissions are generated during aircraft takeoff and landing, exacerbating pollution in the vicinity of airports and posing potential health hazards to human populations [5]. Projections for the next two decades suggest a possible threefold increase in air transport, intensifying these environmental problems [6]. In light of these circumstances, precise quantification of the number concentration of carbonaceous particles emitted by aviation is crucial for guiding regulatory and control measures.
Currently, the detection of aviation soot emissions is predominantly carried out using condensation particle counters (CPCs) [7]. CPCs measure carbon soot particles, which have undergone condensation-induced growth, through the utilization of light scattering. The detection efficiency stands as a crucial parameter for CPCs, and its calibration is performed within a laboratory environment. In a laboratory setting, Sakurai et al. [8] calibrated the condensation particle counter using polystyrene spheres and extended the traceability of the calibration concentration to 1 P/cm3. Krasa et al. [9] calibrated the condensation particle counter using atomized inorganic salt particles and simplified the calibration method through analysis. Hermann et al. [10] utilized sodium chloride particles for calibrating the condensation particle counter under conditions involving both water and butanol as working fluids. Wang X et al. [11] calibrated the condensation particle counter using sodium chloride particles and assessed its performance in vehicle emission detection. Liu P. S. K. and Deshler T. [12] calibrated the condensation particle counter using sodium chloride particles and conducted a comparative analysis with a scanning mobility particle sizer. In summary, CPC is commonly calibrated using sodium chloride in laboratory experiments.
As the particle size decreases, the challenge of particle growth through condensation to a detectable range becomes more pronounced, underscoring the critical importance of detection efficiency for small-sized particles in CPCs. The symmetry of the condensation section affects the flow field distribution of sheath gas and sample gas within the condensation section, subsequently influencing the condensation and growth of small particles. This indicates a highly significant relationship between the design of the condensation section’s symmetry and the particle detection efficiency of the CPC. Therefore, the research findings presented in this paper, regarding the CPC detection efficiency and its influencing factors, hold crucial guiding implications for the symmetry design of the CPC’s condensation section. The detection efficiency of small particles is also profoundly influenced by the inherent characteristics, including their morphology and chemical properties [13]. Aviation soot exhibits distinct disparities compared with calibration particles (sodium chloride) due to their irregular shapes and rough surfaces. This would impact the detection efficiency of the CPC, resulting in a reduction in the accuracy of aviation soot measurements. Research on the detection efficiency bias between these two types of particles is rare. In addressing the aforementioned issues, this paper quantitatively determined the detection efficiency deviation in different particles through experimental methods. Subsequently, the factors influencing this deviation were investigated, leading to the identification of a method to mitigate such discrepancies. These studies offer crucial theoretical guidance for enhancing the accuracy of detecting aviation soot emissions, laying the foundation for future research focused on monitoring and controlling aviation emissions. This contributes to the development of sustainable aviation practices.

2. Experimental System and Data Processing

2.1. Fundaments of Condensation Particle Counting

The condensation particle counter (CPC) functions on the principle of heterogeneous condensation, which involves the enlargement of nanoscale particles to the micrometer range before quantification. It consists of the optical particle counter and the particle growth chamber, as shown in Figure 1. In the course of its operation, aerosol particles are introduced into the particle growth chamber, where supersaturated vapor undergoes heterogeneous condensation on their surfaces, resulting in an augmentation of the particle size. These enlarged particles are then quantified using the optical particle counter.
The optical particle counter is a device used for counting individual particles, operating on the principle of light scattering. Figure 2 presents a schematic depiction of the optical particle counter’s structure, primarily comprising an incident light unit, a scattered light collection unit, and a signal processing circuit. During its functioning, a laser emits incident light, which is precisely directed and focused by a lens to create a narrow laser beam. As aerosol particles traverse this laser beam, the scatter light emits from the particles. A fraction of the scattered light is captured by a reflector and reflected towards a photodetector. The photodetector translates the light signal into an electrical current signal, which is subsequently processed by the signal processing circuit. This circuit generates pulse signals, which are then subjected to statistical analysis to ascertain the particle concentration [14].
Within a CPC, particle growth relies on the principle of heterogeneous condensation, entailing nucleation and subsequent growth of particles through the utilization of dissimilar substances as nuclei. This process transpires in a non-equilibrium state, with the presence of mass transport effects [15]. When gradients exist within thermodynamic systems, such as temperature or concentration gradients, the system departs from equilibrium. Important factors contributing to this non-equilibrium state include particle surface roughness, surface free energy, and vapor saturation.
In a vapor-containing system, its non-equilibrium state can be characterized by the saturation ratio (S), expressed as the ratio of partial pressure of vapor (PV) to the saturation vapor pressure (Psat) at the system’s temperature. When S exceeds 1, the system enters a supersaturated state. Conversely, when S falls below 1, the system transitions to a subsaturated state, indicating a shortage of vapor [16,17,18]. The calculation formula for S is given by Equation (1) [19]:
S = P V P s a t ( T )
The critical nucleation radius of the particle can be calculated using Equation (2) [20]:
r * = 2 σ s ( M l v l / N A ) k B · T · ln ( S )
where r * is the critical nucleation radius of the particle, σ s represents the surface tension (N/m), M l is the molar mass of the liquid (kg/mol), v l is the specific volume of the liquid (m3/kg), N A is Avogadro’s constant (approximately 6 × 10²³ /mol), k B is the Boltzmann constant (1.38 × 10⁻²³ J/K), T signifies the temperature in Kelvin (K), and S indicates the saturation ratio. According to Equation (2), it is evident that the presence of surface curvature on aerosol particles necessitates a higher equilibrium saturation vapor pressure to maintain surface equilibrium. Smaller particles exhibiting greater surface curvature require a greater equilibrium saturation vapor pressure for condensation to occur. Under the same saturation conditions, heterogeneous condensation may not transpire on the surface of small-sized particles. This occurs when the vapor pressure within the system is lower than the saturation vapor pressure on the surface of small-sized particles, thereby impeding condensation growth on the particle surface. Consequently, the detection efficiency for small-sized particles is diminished.
cos θ = ϕ s · m τ · ϕ l σ s · R p · tan ϕ
Equation (3) [21] delineates the functional relationship between particle surface roughness and the contact angle of condensation droplets on the surface. In this equation, θ represents the microscopic contact angle between the droplet nucleus and the particle, m represents the cosine of the macroscopic contact angle, ϕ s represents the surface roughness factor of the particle, ϕ l represents the line roughness factor of the particle, τ represents the three-phase line tension, R P represents the particle radius, and ϕ represents the angle between the line connecting the droplet nucleus center to the particle center, and the line connecting the particle center to a three-phase contact point. Equation (3) indicates that as the particle roughness increases, the contact angle decreases, which promotes condensation growth, and subsequently affects the detection efficiency of various particles.

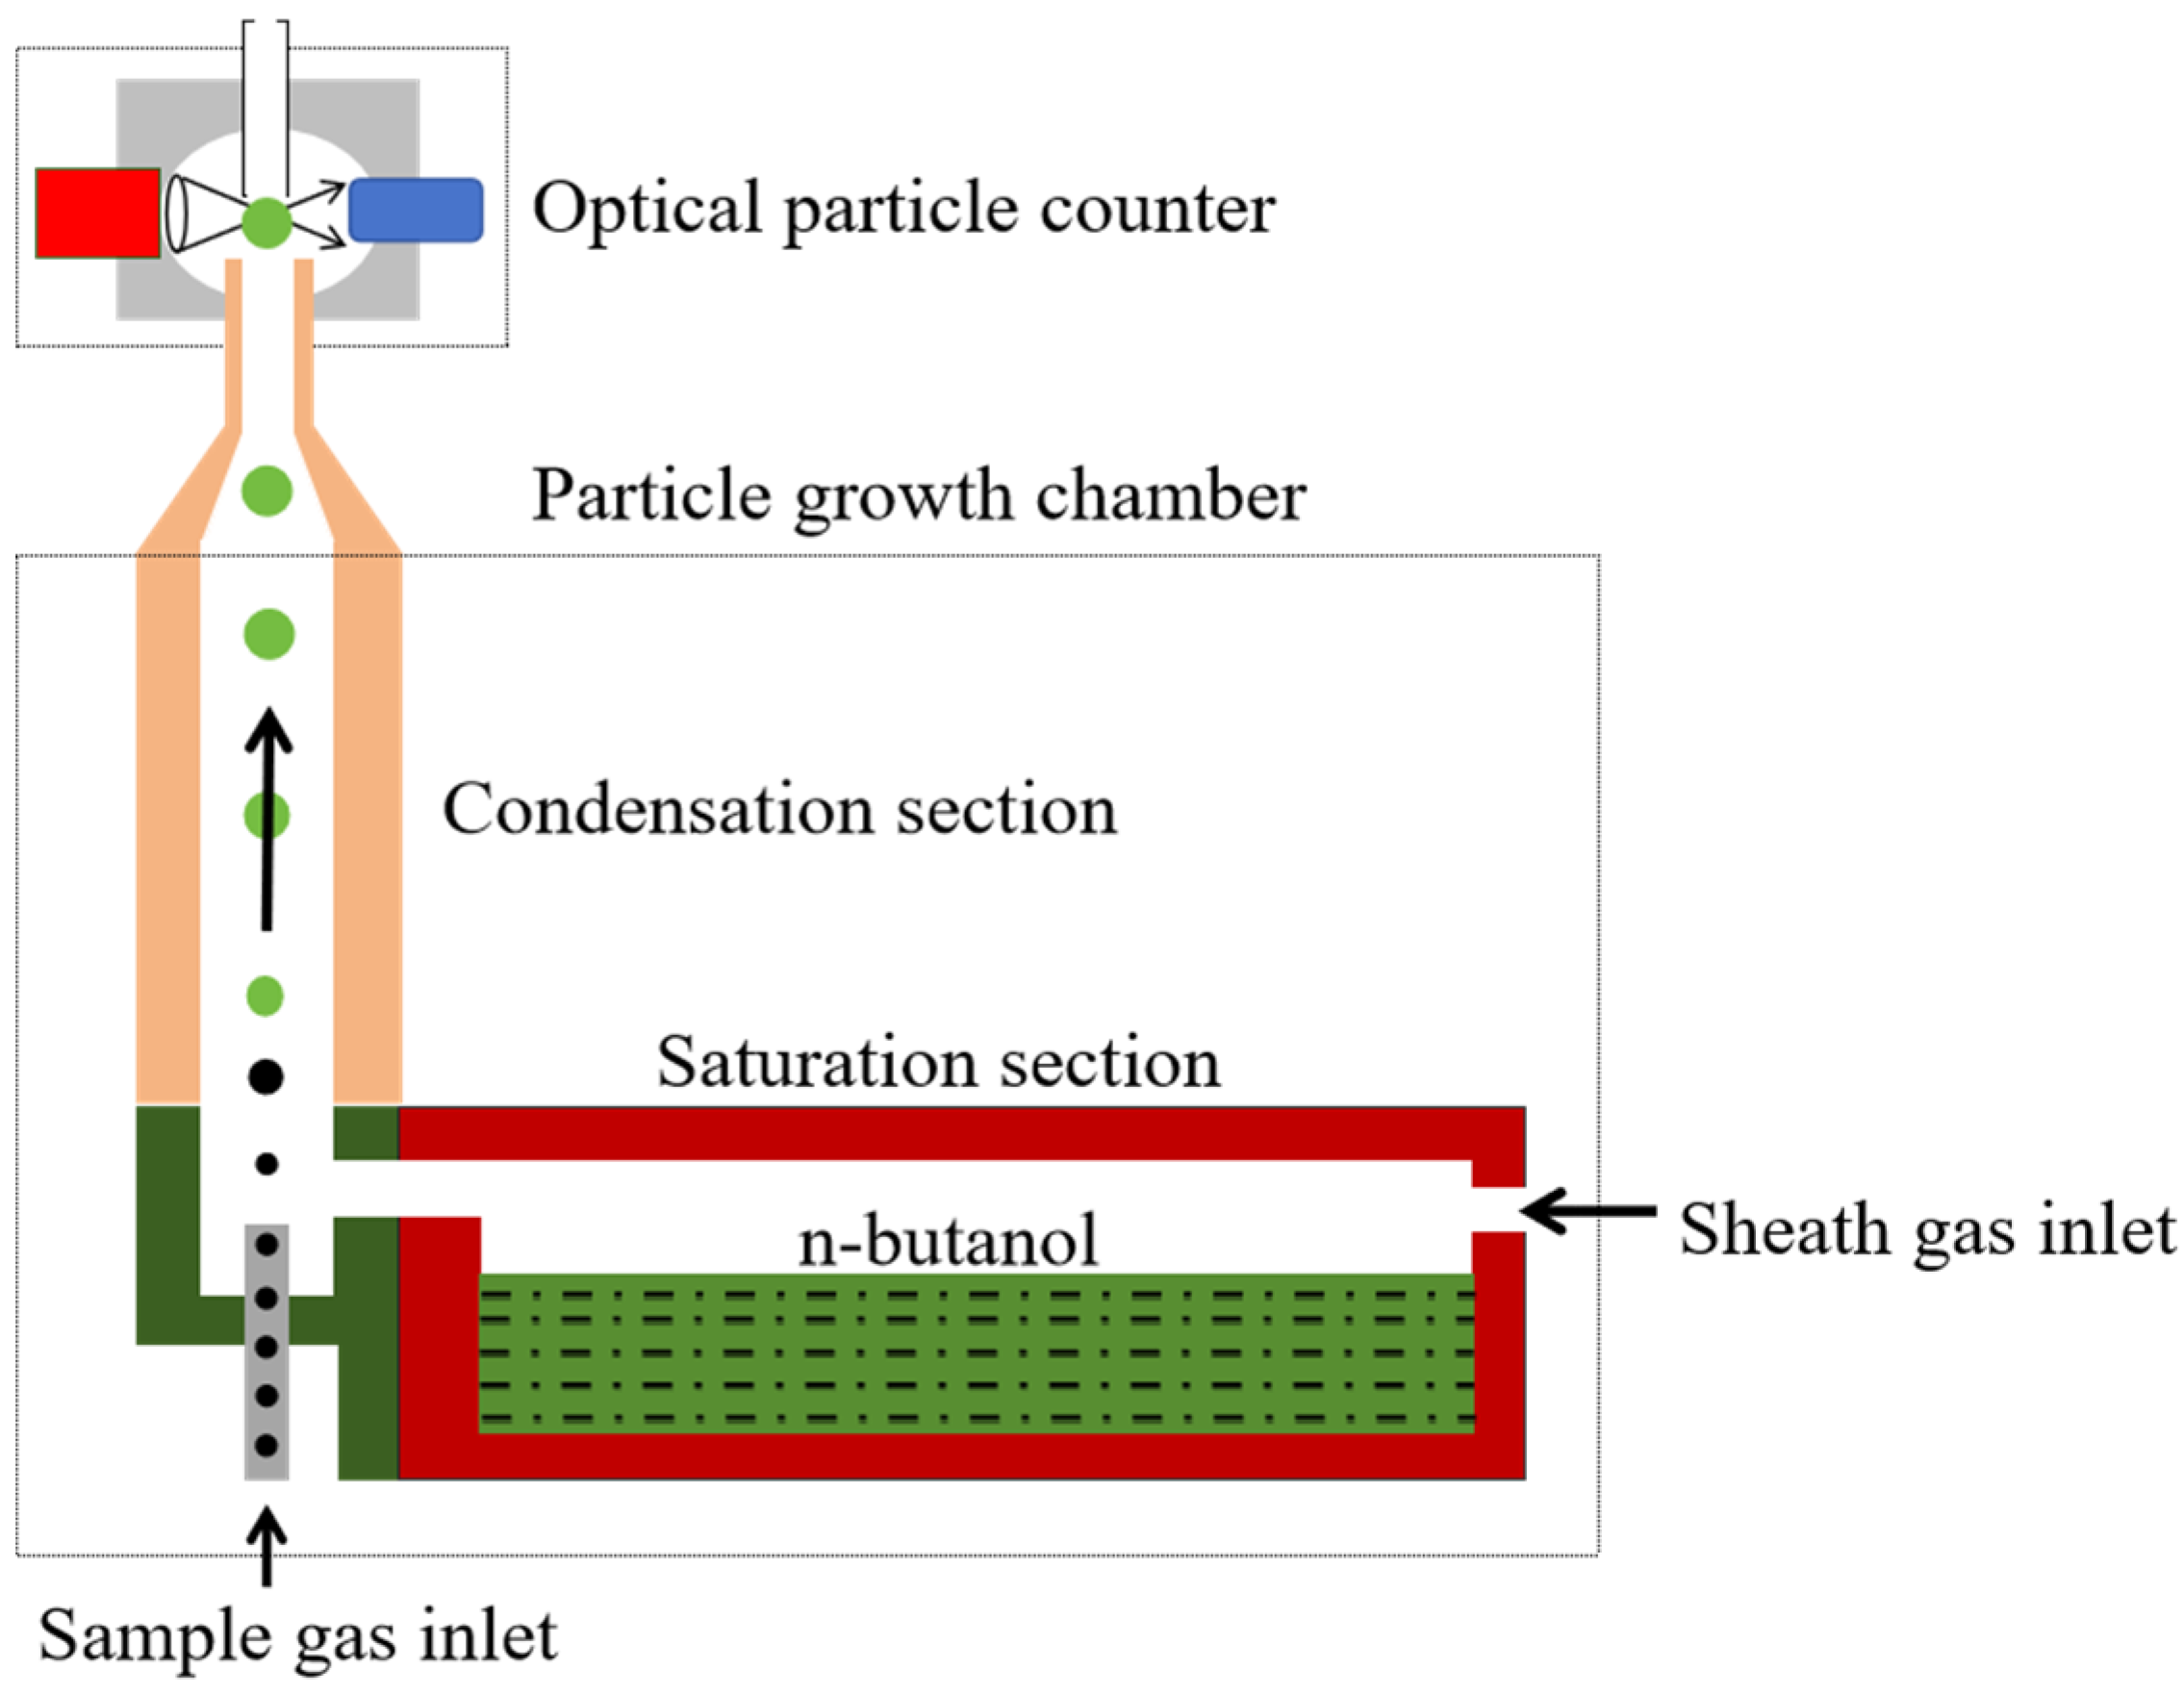
2.2. Experimental Setup

Figure 3 illustrates a schematic diagram of the experimental system used in this study. Firstly, the particle generator produces the desired polydisperse aerosol particles, which is then carried by the clean air into the drying tube. The drying tube is filled with silica, leveraging the principle of diffusion capture to effectively remove moisture. Silica exhibits a strong affinity for water molecules, ensuring thorough drying of the polydisperse aerosol particles. Subsequently, the particles pass through a dilution bridge and enter the differential mobility analyzer (DMA). The dilution bridge is composed a filter and a valve. The filter prevents particles while maintaining a supply of clean air. The dilution ratio can be regulated by adjusting the valve resistance, thus controlling the particle source concentration. The mixing chamber promotes turbulent mixing, ensuring a uniform distribution of particles. Additionally, a bypass fitted with an additional filter is connected to maintain flow balance. The DMA selectively separates particles of specific sizes, transforming the polydisperse aerosol particles into monodisperse aerosol particles. Ultimately, the monodisperse aerosol particles are simultaneously directed into the self-developed condensation particle counter (BH-CPC), the TSI aerosol electrometer (TSI-AE3068B, TSI Incorporated, Minneapolis, MN, USA), and the TSI condensation particle counter (TSI-CPC3775) for measurement. The connecting pipes of the entire experimental system are constructed from polytetrafluoroethylene (PTFE) with a carbon impregnation base [22].

2.2.1. Particle Generator

The experiment employed two types of particle generators: an atomizing aerosol generator and a micro-combustion aerosol generator (MiniCAST).
The atomizing aerosol generator (model: AG-21, Shanghai Aoxuan Measurement Technology Co., Ltd., Shanghai, China) demonstrates the capability to produce diverse particles using various solutions. Initially, compressed air is introduced into the generator through micro-holes, generating a jet-like airflow used to atomize the liquid for aerosol generation. Coarse particles are redirected upon collision with the generator walls and recirculated, while fine particles are expelled through the top outlet of the generator. This process results in the production of sub-micron-sized aerosol particles [23].
The MiniCAST (model: MOD6204C, Jing Ltd., Zollikofen, Switzerland) generates carbonaceous particles through diffusion flames in the pyrolysis process. Within the generator, the chemical reaction between the fuel and oxidizer is deliberately left incomplete. The quenching airflow at a specific flame height extinguishes the upper flame, preventing further participation of the carbonaceous particles produced by the diffusion flame in the combustion process. Consequently, a high concentration of particles is generated within the combustion chamber. Furthermore, the quenching airflow ensures the stability of the particles production process and suppresses the condensation of carbonaceous particles in the particle stream [24]. The MiniCAST offers flexible operational parameters, enabling control over the particle size range, morphology, and organic composition of the carbonaceous particles. It also exhibits high stability and reproducibility [25]. The morphology, organic carbon composition, density, and Raman spectra of the carbonaceous particles generated by the MiniCAST closely resemble those of aviation soot [26], making it suitable as an aviation soot generator [27]. Moreover, collecting carbonaceous particles from aircraft engine exhaust necessitates complex and costly facilities [28,29,30,31], making it practically unfeasible to replicate in a laboratory setting. Therefore, the present study utilized MiniCAST-generated carbonaceous particles as a viable substitute for aviation soot. In the experiment, Minicast generates polydisperse carbonaceous particles with a center diameter of 26 nm, as illustrated in the probability distribution shown in Figure 4. These polydisperse particles will undergo size selection through DMA to monodisperse particles.

2.2.2. The Differential Mobility Analyzer

The differential mobility analyzer (DMA, model: BMI-DMA2101C, Brechtel Manufacturing Incorporated, Hayward, CA, USA) exhibits the capability to selectively segregate particles according to their specific sizes. The process commences with the polydisperse aerosol being charged to equilibrium by a radiation source before entering the DMA through inlet ports. Sheath gas is introduced from the top and mixed with the aerosol particles. During operation, a negative voltage is applied to the long central column of the DMA, while the outer shell is grounded, thus creating an electric field within the DMA. As the aerosol particles descend through the column, they experience a force resulting from the electric field. This force leads to accumulation of particles with higher electric mobility near the upper section of the column, while smaller particles gather toward the lower portion. Particles that successfully traverse the narrow gap at the bottom of the DMA are effectively screened and separated, while the remaining particles are carried out from the DMA alongside the sheath gas [32].
The size selection of the DMA is not perfectly monodisperse, but characterized by a narrow size range, as dictated by the DMA transfer function. Rose et al., demonstrated that when the sheath gas-to-sample flow ratio exceeds 5:1, the particles screened by the DMA exhibit perfect monodispersity [33]. Therefore, during the experiment, the sheath gas-to-sample flow ratio was set to 8:1 to ensure the production of highly monodisperse particles.

2.2.3. The Aerosol Electrometer
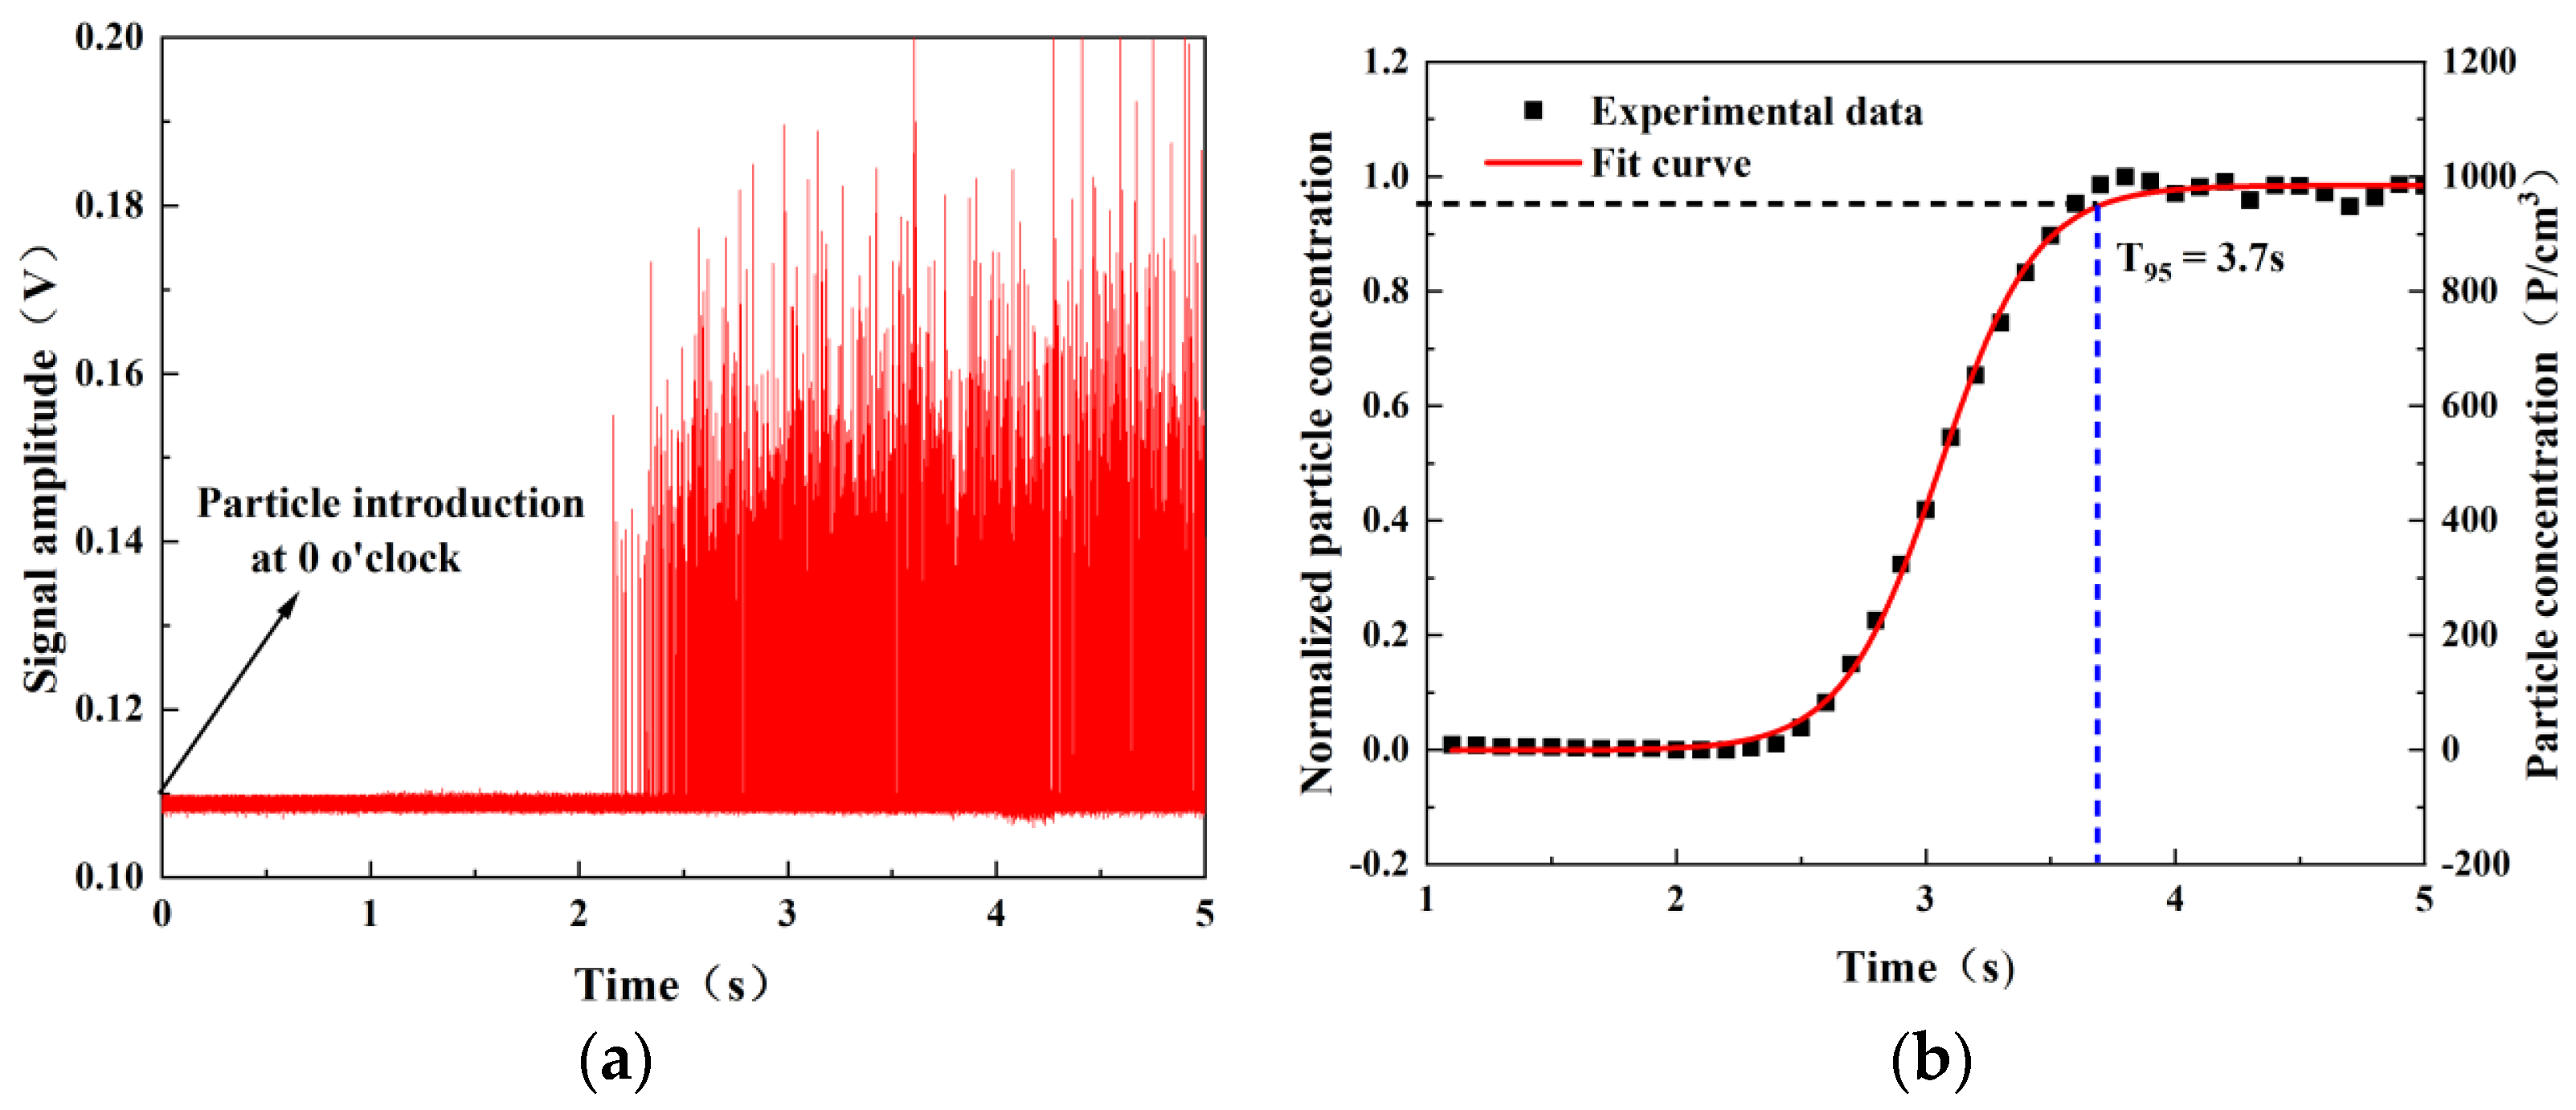
The aerosol electrometer is internationally recognized as the foremost standard for particle counting (number concentration) [34], and serves as the primary instrument for quantifying aerosol number concentration. The aerosol electrometer consists of a Faraday cup and a low-current measurement module. When aerosol particles carrying a single charge are introduced into the sampling inlet, they are effectively captured by a high-efficiency filter located within the Faraday cup. The interaction with the filter leads to the release of the particle’s charge due to the space charge effect, consequently generating a quantifiable electric current. In recent years, notable contributions to the field of aerosol electrometer calibration have been made by national metrology institutes in several countries, including China, the United States, Japan [35]. These studies have played a vital role in advancing the accuracy and reliability of particle concentration measurement, providing valuable technical support of accurately measuring particle concentration using an aerosol electrometer.

2.3. Data Analysis

In the experiment, monodisperse particles of varying sizes were employed, with diameters of 10 nm, 12 nm, 14 nm, 18 nm, 22 nm, 26 nm, 30 nm, 35 nm and 40 nm. Each individual data point was recorded at a data acquisition rate of 1 Hz, spanning a duration of 2 min. The particle number concentration was continuously monitored using a BH-CPC, while the electric current was recorded using the aerosol electrometer of TSI-AE3068B (TSI Incorporated, Minneapolis, MN, USA). The particle number concentration can be obtained from the Equation (4) [36]:
N E = I n e Q E
where NE represents the number concentration of particles measured by the aerosol electrometer, I denotes the electric current measured by the electrometer, n represents the elementary charge of each particle, e represents the fundamental charge of an electron (i.e., 1.6 × 10⁻¹⁹ Cb), and QE represents the flow rate passing through the aerosol electrometer. It is worth noting that the elementary charge of each particle is assumed to be equal to 1. This assumption is based on the fact that in this study the particles with the diameter smaller than 50 nm are primarily capable of acquiring a single charge within the aerosol neutralizer [37,38].
The determination of the CPC’s detection efficiency is computed as the ratio of the number concentration measured by the CPC to the number concentration measured by the aerosol electrometer, as illustrated in Equation (5):
D E = N C N E
where DE represents the detection efficiency, and NC represents the number concentration measured by the CPC.
The evaluation of the CPC’s detection efficiency involves the computation of the mean and standard deviation in the detection efficiencies for each data point. This process is carried out through the utilization of Equations (6) and (7) as follows:
D E ¯ = D E 1 + D E 2 + + D E t T D E
S D E = ( D E 1 D E ¯ ) 2 + ( D E 2 D E ¯ ) 2 + + ( D E t D E ¯ ) 2 T D E
where D E ¯ represents the average detection efficiency, DEt represents the detection efficiency at time t, SDE represents the standard deviation in the detection efficiencies, and TDE represents the recording duration in seconds. Given the sampling frequency of 1 Hz, the recording duration TDE is equal to the total number of data points for the detection efficiencies.
The comparison assessment of the CPC detection efficiency for aviation soot and calibration particles is conducted by employing both absolute deviation and relative deviation. This procedure is accomplished through the application of Equations (8) and (9) as follows:
Δ = | D E m D E s |
ε = Δ D E s
where Δ represents the absolute deviation, DEm represents the detection efficiency for aviation soot, DEs represents the detection efficiency for calibration particles, and ε represents the relative deviation.

3. Results and Discussion

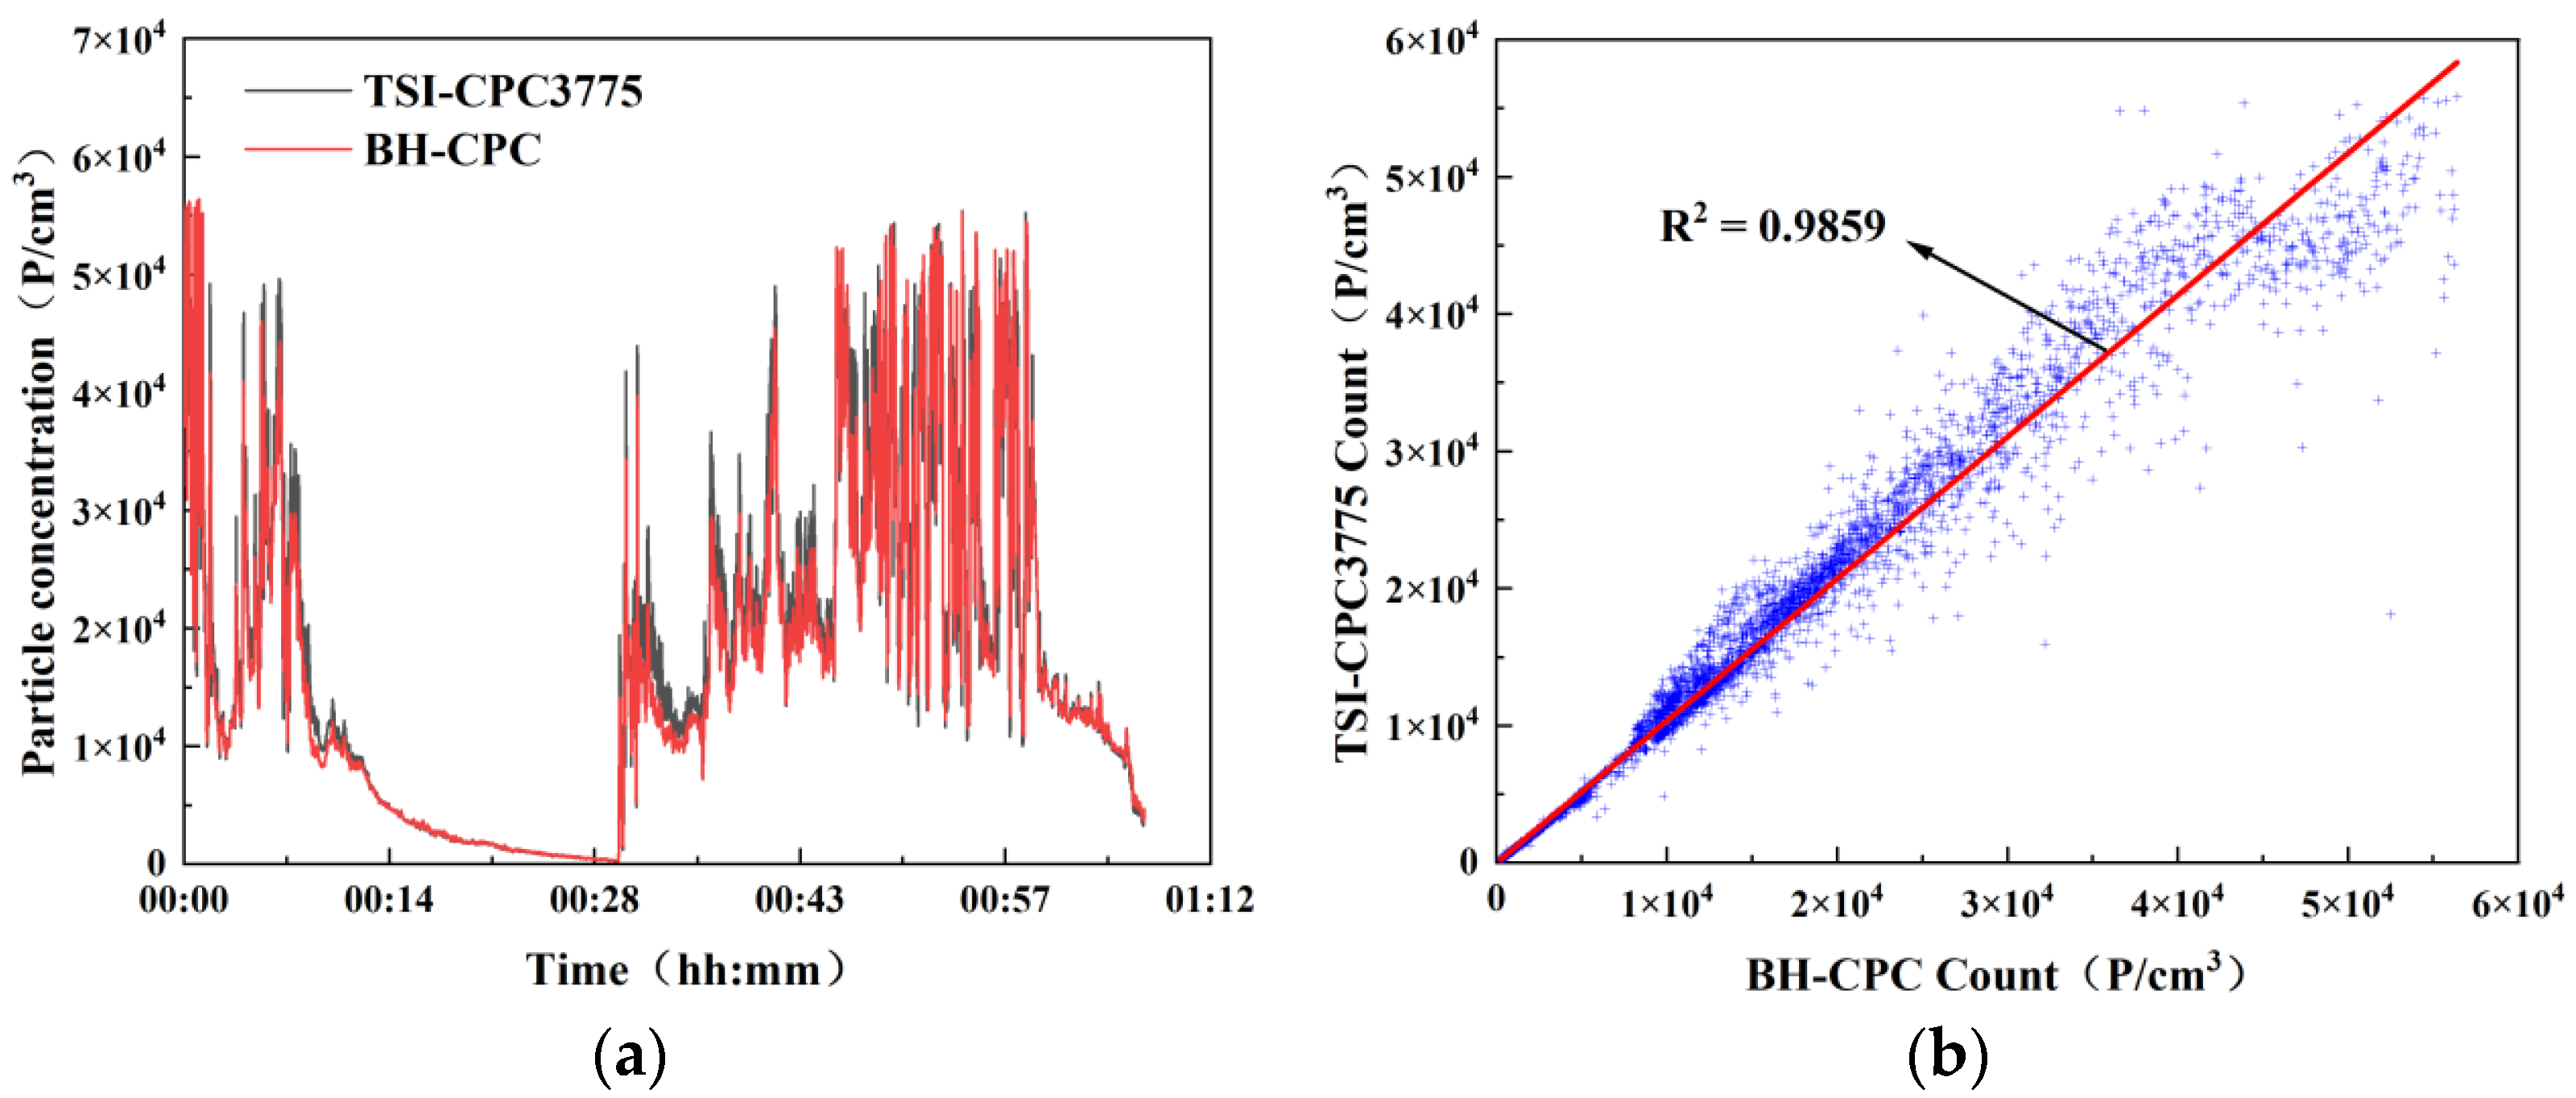
3.1. Verification of Detection Performance of BH-CPC

Due to uncontrollable parameters such as the working temperature of commercial CPCs, a self-developed condensation particle counter (BH-CPC) was utilized in this study. Before studying detection efficiency deviations in aviation soot and calibration particles, the response performance and counting accuracy of the BH-CPC underwent thorough validation. Figure 5 illustrates the results of the BH-CPC response performance test. In Figure 5a, the raw voltage signals of particles measured by the BH-CPC are displayed, while Figure 5b presents the normalized particle number concentration. Before the experiment, the particle number concentration measured by the BH-CPC was reduced to zero using a filter. Subsequently, at a specific time (0 time in Figure 5), the filter was removed to allow particles to enter. For this experiment, sodium chloride particles with a diameter of 50 nm, were chosen as the test particles. Figure 5a reveals that after the introduction of particles, the first particle voltage signal appeared approximately 2.2 s later, followed by a gradual increase in the density of particle voltage signals. Figure 5b presents the particle number concentration with an interval of 0.1 s calculated using the particle voltage signals in Figure 5a. The results indicate that the particle number concentration initially remained close to zero, gradually increased after 2.5 s, and reached a steady state after 4 s. The particle number concentration was fitted using the Boltzmann function, revealing that the detection efficiency of the particle number concentration by the BH-CPC reached 95% at 3.7 s. This indicates that the response time of BH-CPC used in this study is 3.7 s. Notably, the response time is shorter than the 4 s response time of the TSI-CPC3775.
Figure 6 illustrates the counting accuracy test of the BH-CPC. In Figure 6a, the real-time measurement results of both the BH-CPC and TSI-CPC3775 are presented, while Figure 6b provides the counting fitting results between the two instruments. Prior to conducting the experiment, a short conductive hose was used to connect the sampling inlet of the BH-CPC and TSI-CPC3775 in parallel, and a filter was employed to ensure that both instruments exhibited zero counts. Subsequently, the filter was removed to introduce particles. For this experiment, carbon soot particles generated from the burning of mosquito coils were selected. These particles originate from an unstable combustion source, resulting in a wide range of particle concentrations. Figure 6a indicates that the initial particle concentration was relatively high. After approximately 10 min, the mosquito coil was extinguished, resulting in a decrease in particle concentration. At approximately the 30 min mark, the mosquito coil was reignited, leading to fluctuations in the particle number concentration, ranging between 10,000 and 50,000 P/cm3. Overall, the counting variations in the BH-CPC and TSI-CPC3775 exhibited consistent trends. Figure 6b demonstrates a linear fitting of the counting results between the BH-CPC and TSI-CPC3775, and the red line from Figure 6b represents a regression line. The slope of this red line is 1.03. The closer the slope of this red line is to 1, the smaller the counting error between the two instruments. The R2 of this red line is 0.9859. The closer the R2 of this red line is to 1, the higher the similarity between the regression line and the original data.

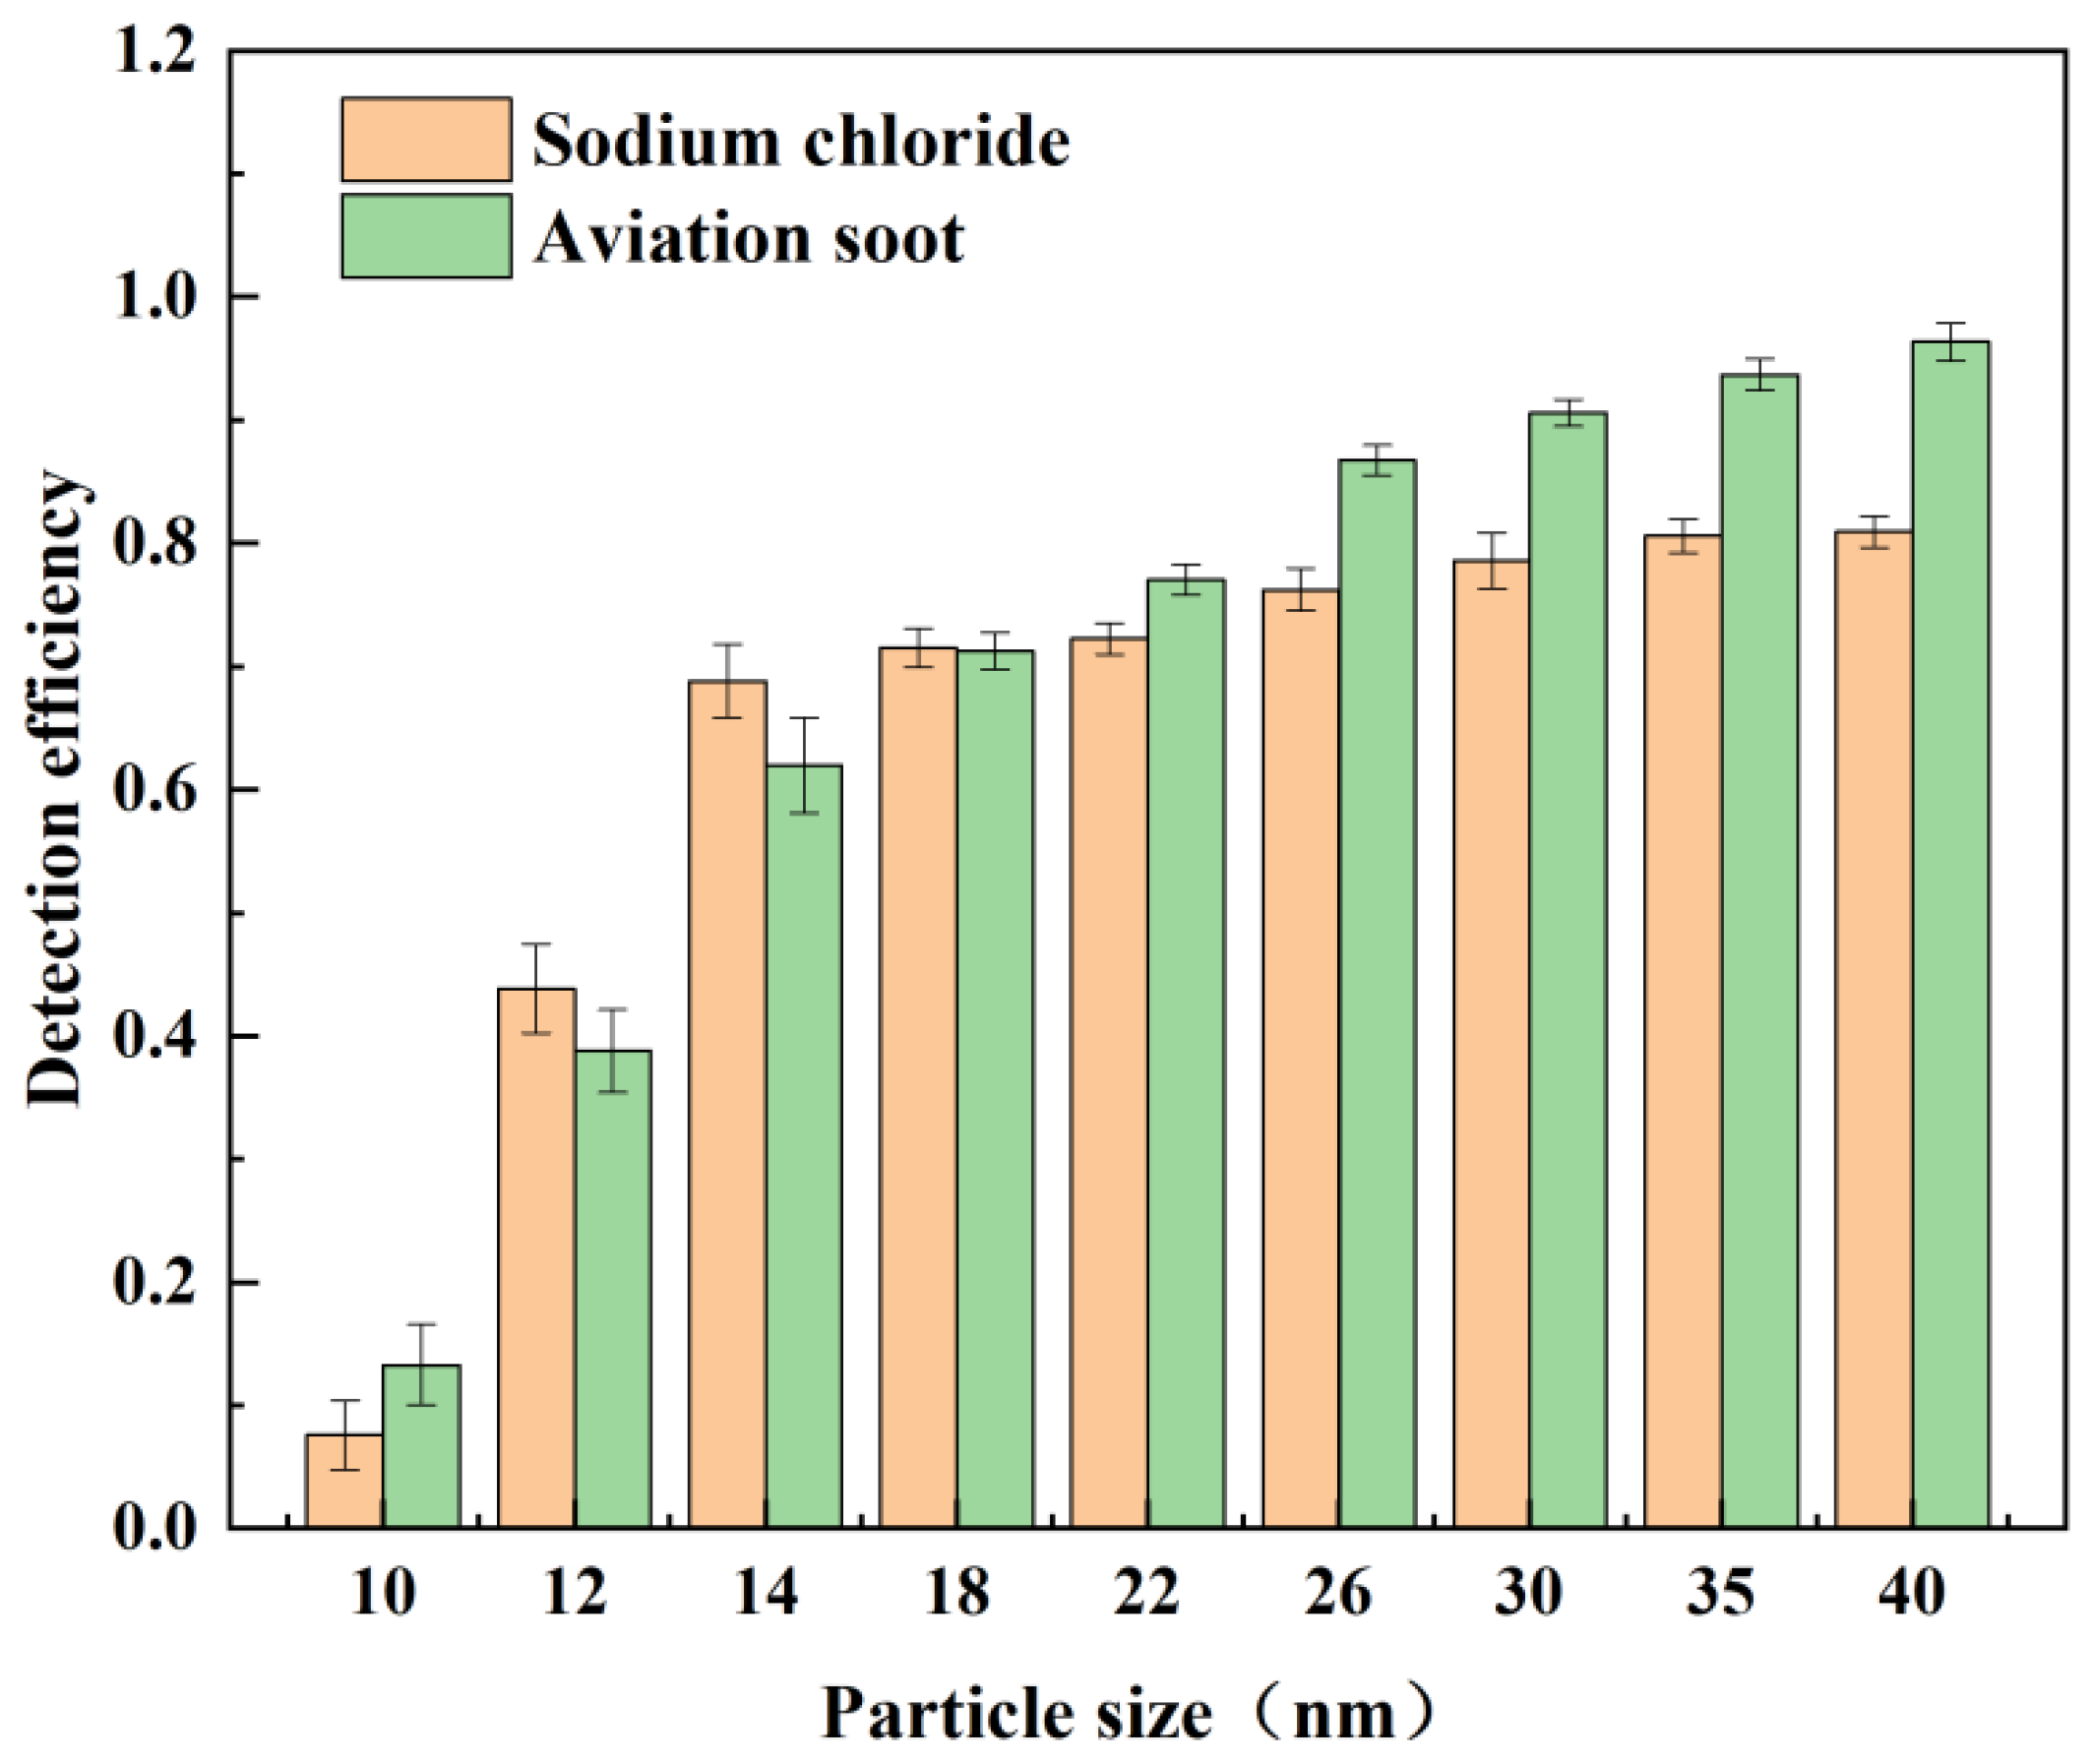
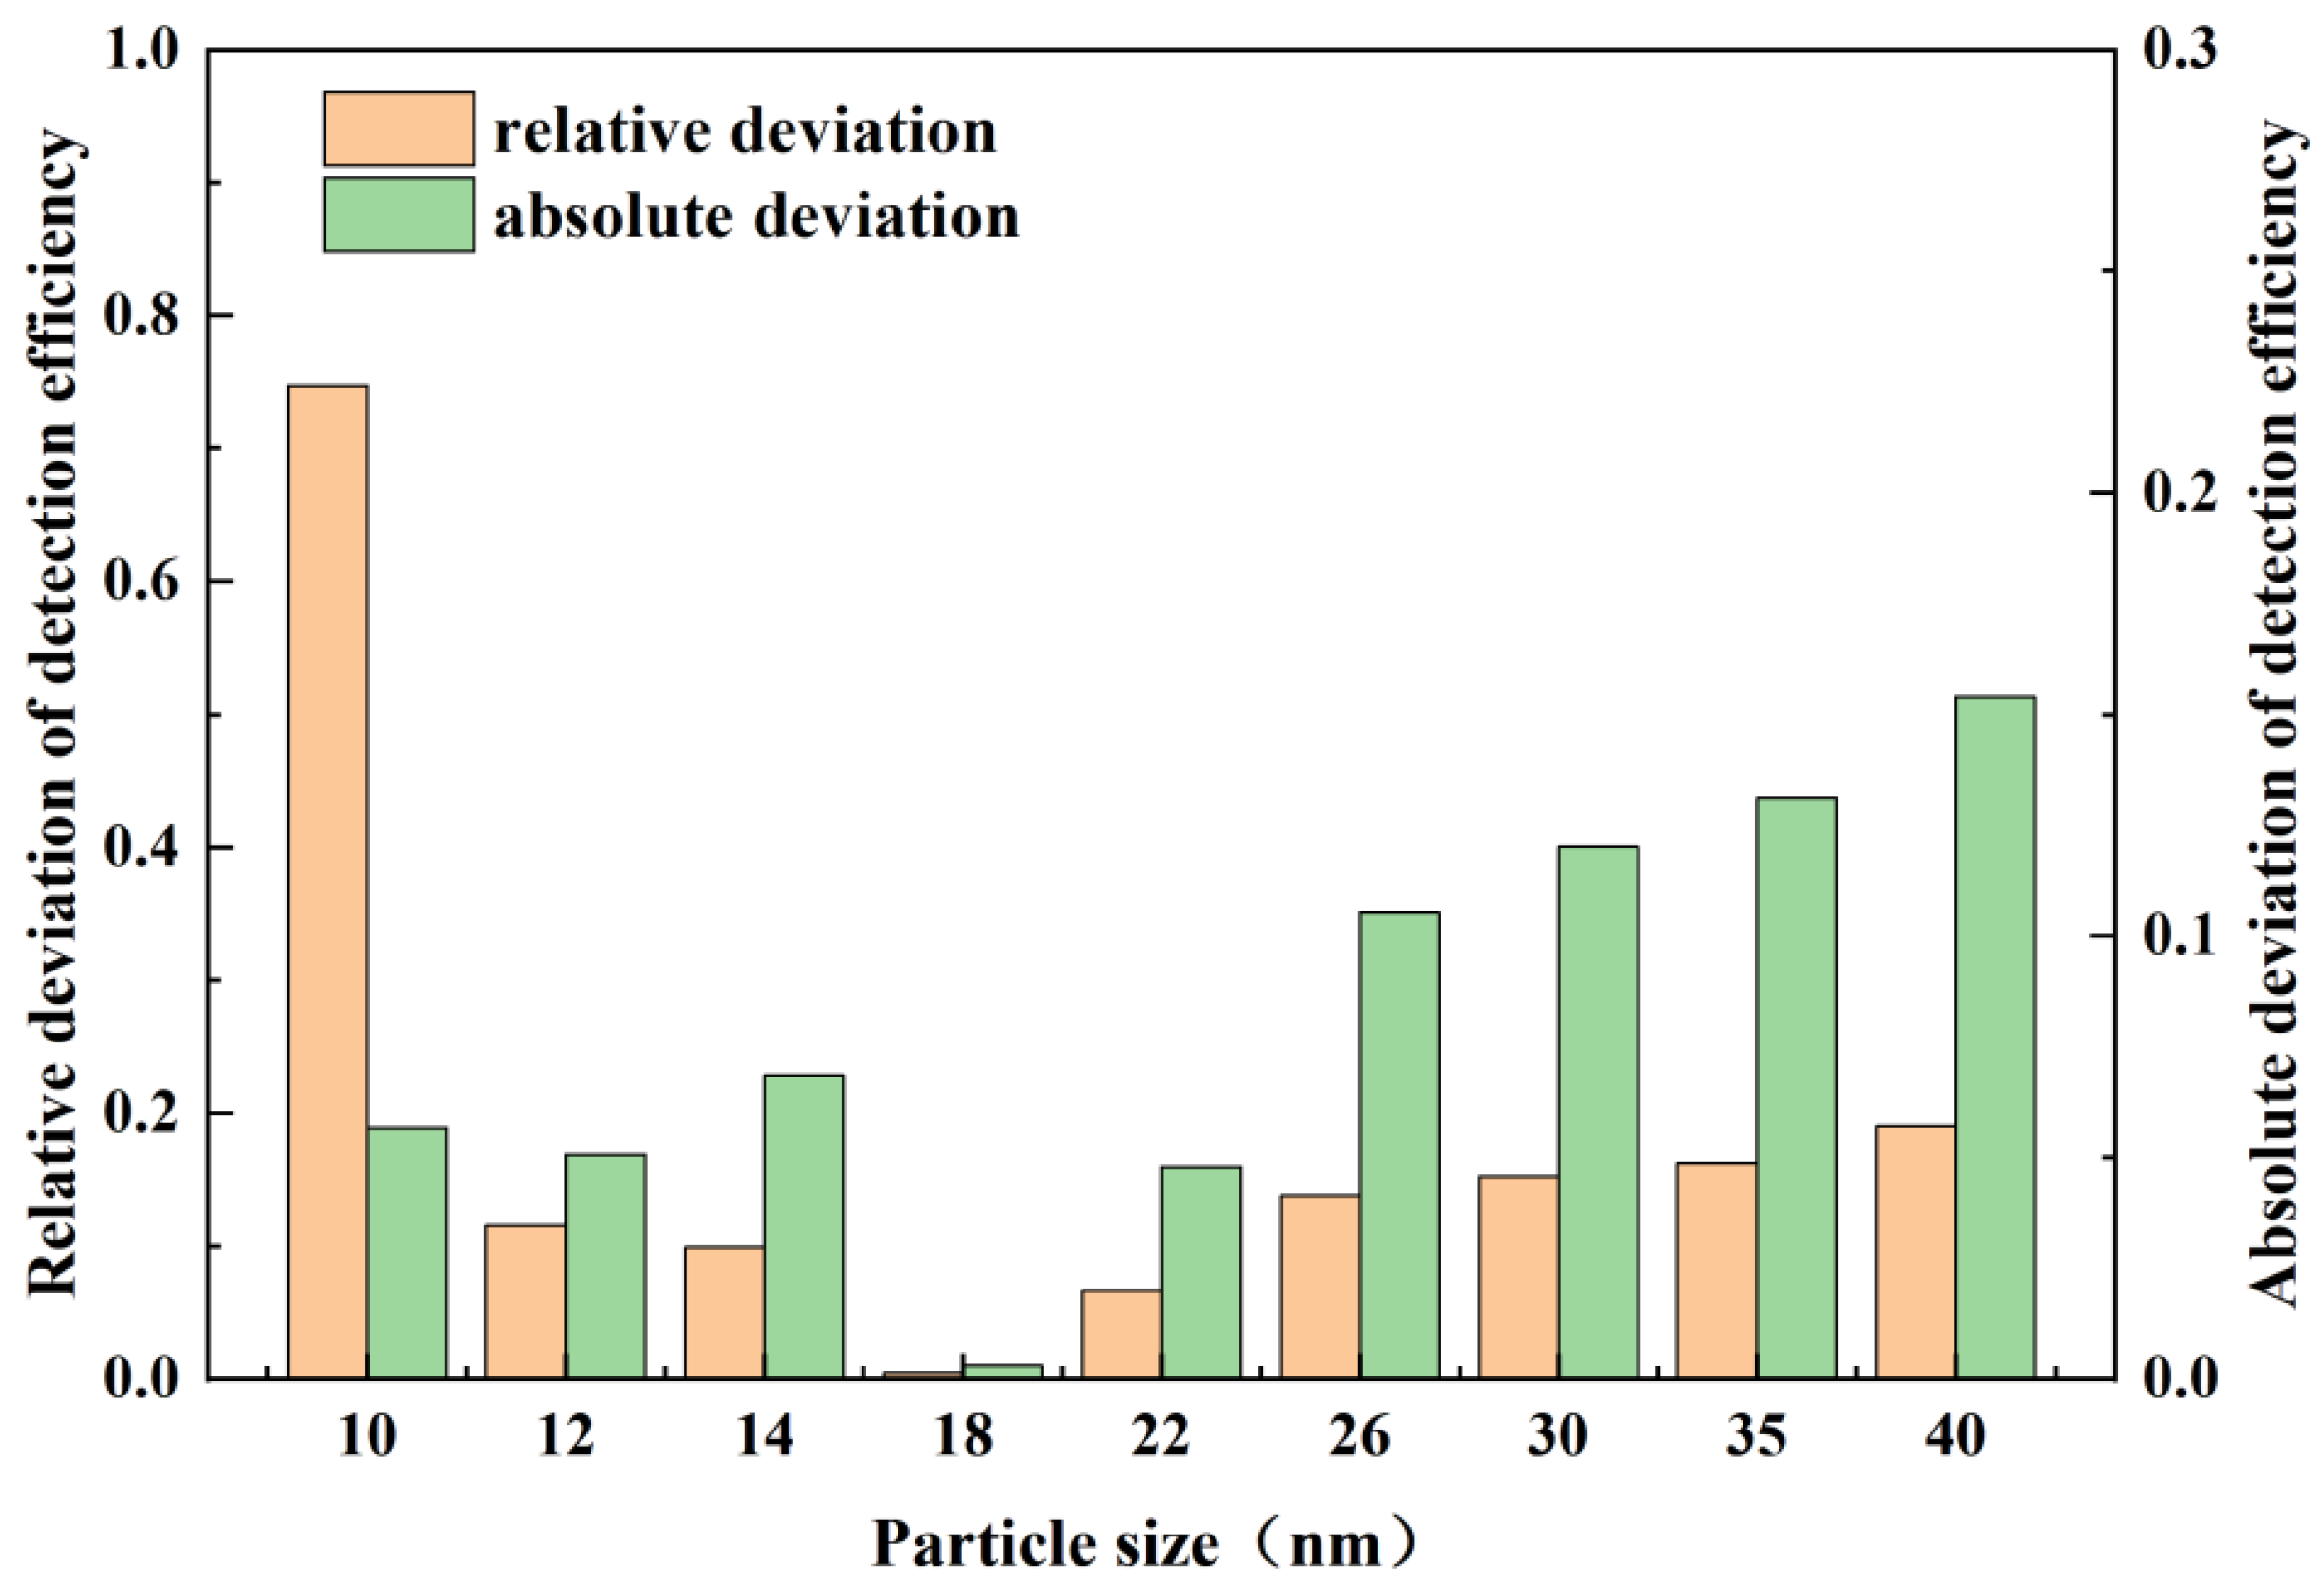
3.2. Comparison of Detection Efficiency between Aviation Soot and Calibration Particles

The morphology of aviation soot and sodium chloride particles was investigated using a scanning electron microscope (SEM, model: Quattro S, Thermo Fisher Scientific, Waltham, MA, USA). In the experiment, carbon soot particles with the median diameter of 26 nm were generated with the MiniCAST. Sodium chloride particles were generated by aerosolizing a sodium chloride solution with an aerosol generator. To collect these two types of particles for observation, a atmospheric single-particle sampler (model DKL-2, Qingdao Genxing Electronic Technology Co., Ltd., Qingdao, China) was employed to deposited them onto separate 3 × 3 mm single crystal silicon wafers. The sampling process lasted approximately 20 s for each sample. To ensure the reproducibility of the experimental results, we initiated particle collection roughly 2 min after the particle generation device had stabilized. Figure 7 presents the SEM observations of the aviation soot and sodium chloride particles collected during the experiment. In Figure 7a, the SEM image of sodium chloride particles is displayed, while Figure 7b presents the SEM image of aviation soot particles. The results indicate that sodium chloride particles exhibit a nearly square shape with a relatively smooth surface. In contrast, aviation soot particles are composed of several or hundreds of primary spherical-like particles, forming agglomerates, chains, or branched structures, with a relatively rough surface.
The number concentrations of aviation soot and laboratory-calibrated sodium chloride particles were determined using the experimental system illustrated in Figure 3. During the experiment, the particle number concentration was maintained below 10,000 P/cm3 by adjusting the dilution ratio of the dilution bridge, thus mitigating the influence of high concentrations on particle detection efficiency. The DMA controller was set to maintain a constant sheath flow rate of 12 L per minute (LPM), resulting in a sheath-to-aerosol flow rate ratio of approximately 8:1, surpassing the threshold of 5:1. This ensured a narrow size distribution of the classified particles. Subsequently, particles with sizes ranging from 10 nm to 40 nm (10 nm, 12 nm, 14 nm, 18 nm, 22 nm, 26 nm, 30 nm, 35 nm, and 40 nm) were sequentially classified by the DMA and introduced in parallel into the BH-CPC and TSI-AE3068B instruments. The BH-CPC operated at a flow rate of 0.36 LPM, while the TSI-AE3068B maintained a flow rate of 1 LPM. The particle number concentration measured by the BH-CPC served as the measured value, and the particle number concentration obtained through charge inversion in the TSI-AE3068B was regarded as the standard value for comparison.
Figure 8 presents the experimental results depicting the detection efficiency of BH-CPC for different particle sizes of aviation soot and sodium chloride particles. Within the size range of 10–40 nm, the detection efficiency for both aviation soot and sodium chloride particles exhibited a gradual increase with larger particle sizes, indicating a consistent overall trend. However, it is noteworthy that the detection efficiency of sodium chloride particles displayed a noticeable deceleration in the rate of increase beyond a particle size of 18 nm, whereas the detection efficiency of aviation soot continued to exhibit a more pronounced upward trend. Furthermore, in the particle size range of 10–14 nm, the detection efficiency of aviation soot was generally lower compared to that of sodium chloride. In the particle size range of 18–22 nm, the detection efficiency of aviation soot was similar to that of sodium chloride. In the particle size range of 26–40 nm, the detection efficiency of aviation soot was generally higher than that of sodium chloride. In the particle size range of 10–40 nm, the measurement errors for sodium chloride vary, with a maximum of 3.6% and a minimum of 1.3%. In the case of aviation soot, the measurement errors range from a maximum of 3.9% to a minimum of 1.1%. Larger particle sizes demonstrate smaller measurement errors when compared to smaller particle sizes.
Figure 9 presents the statistical analysis of the detection efficiency deviation between the two types of particles shown in Figure 8, namely aviation soot and calibration particles (sodium chloride). In terms of relative deviation, the detection efficiency of aviation soot and sodium chloride particles showed the most substantial difference at approximately 10 nm, while the smallest difference was observed at approximately 18 nm. However, in terms of absolute deviation, the detection efficiency of aviation soot and sodium chloride particles exhibited the greatest difference at approximately 40 nm, while the smallest difference occurring at approximately 18 nm. These results indicate that within the particle size range of 10–40 nm, both aviation soot and sodium chloride particles exhibit notable deviations in detection efficiency at both small and large particle sizes.

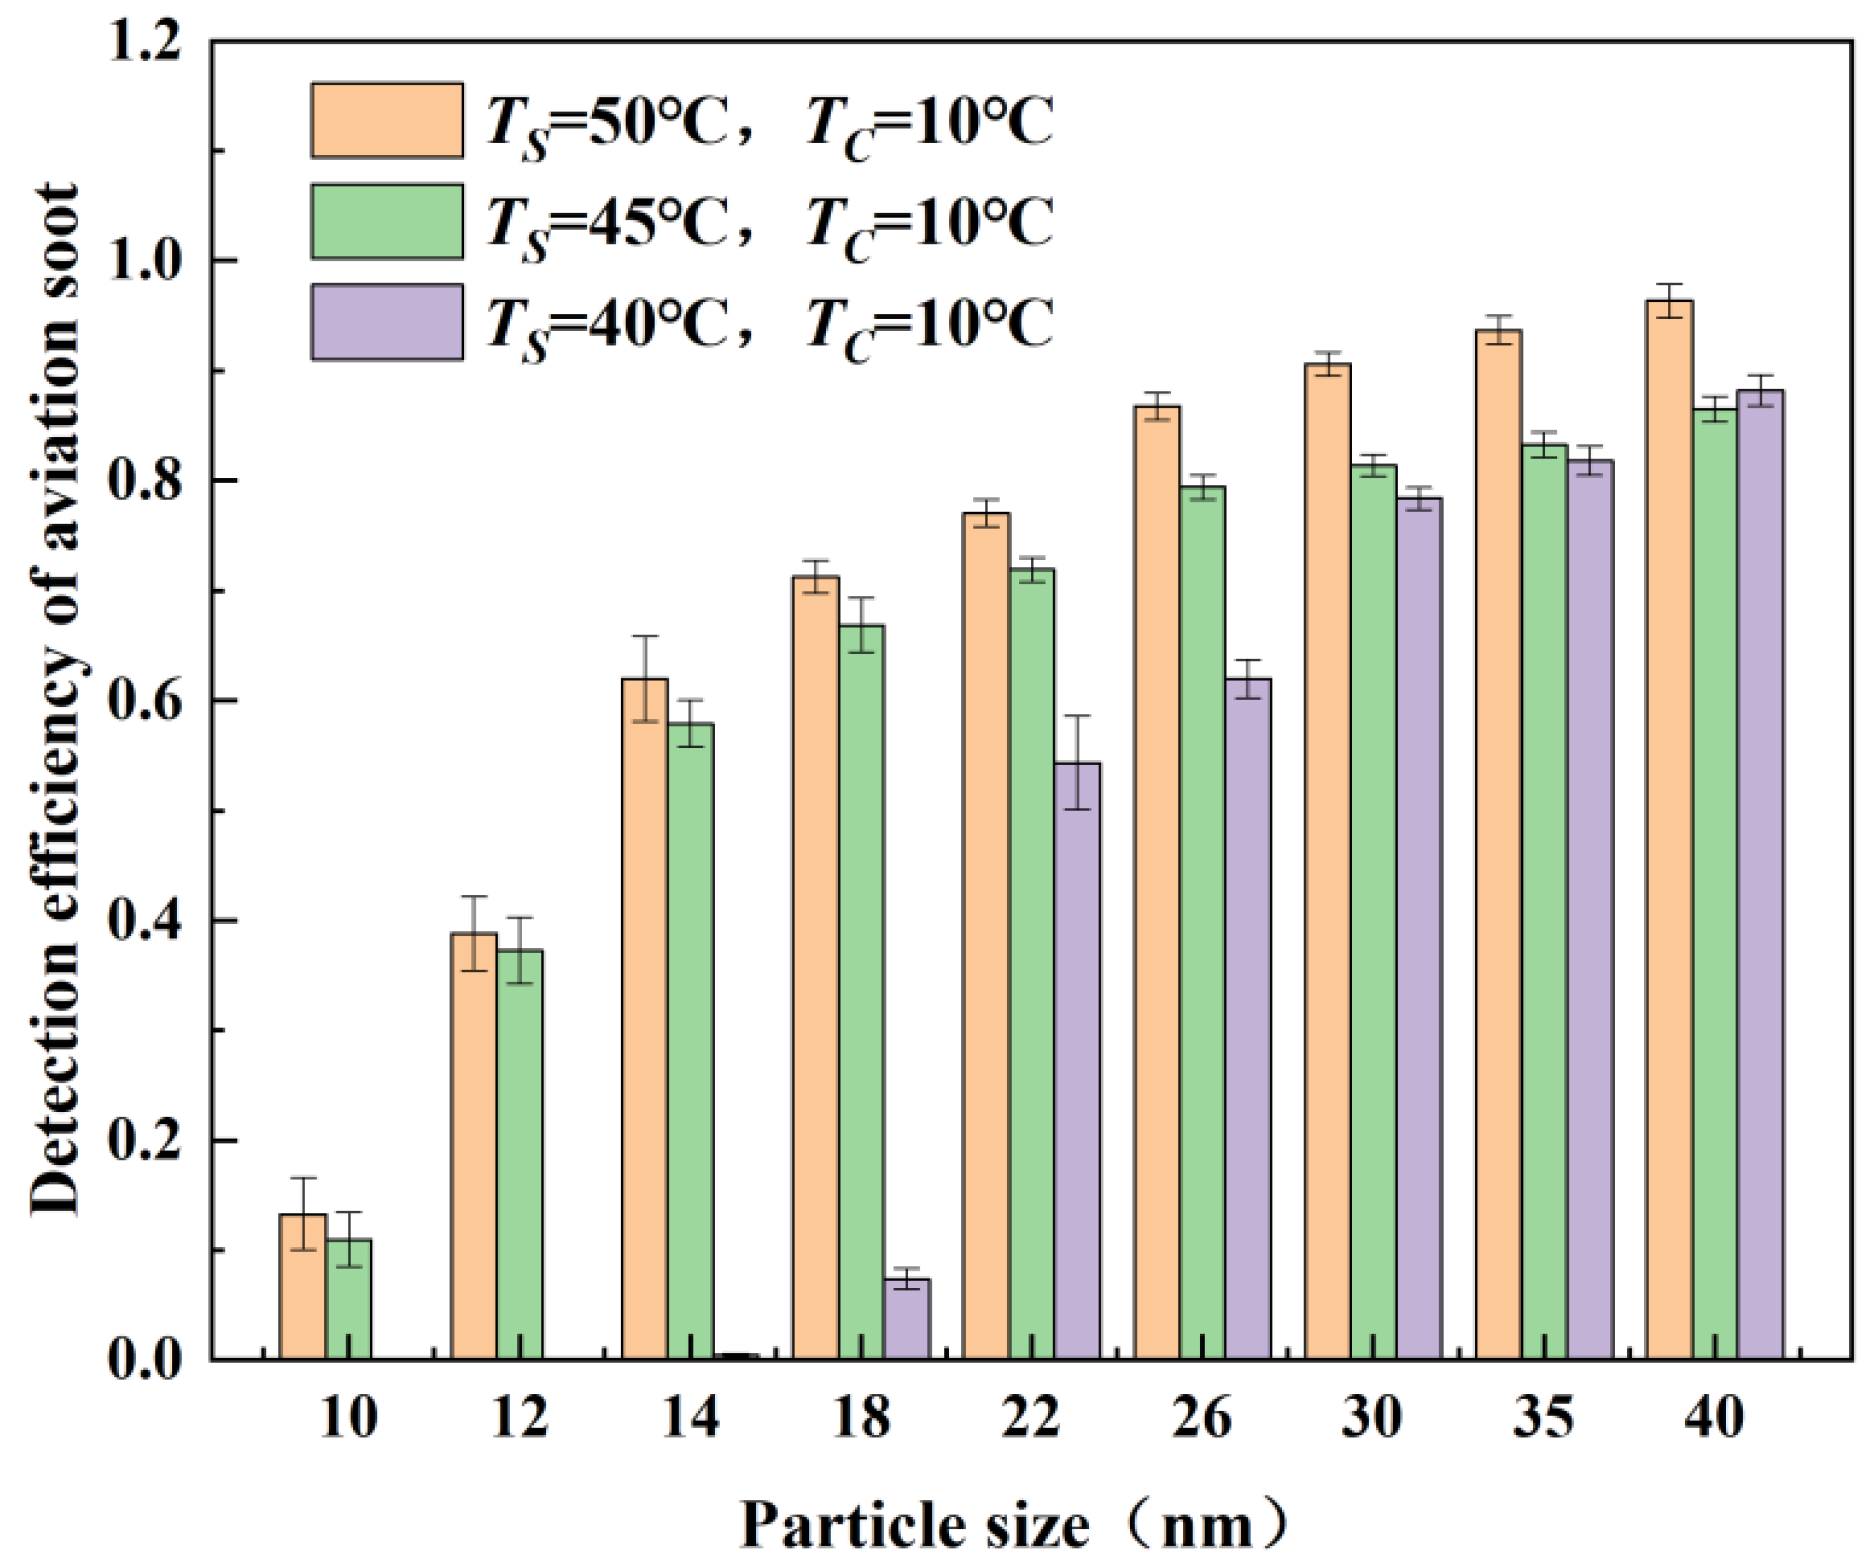
3.3. Impact of the Operating Temperature on Detection Efficiency for Aviation Soot

Section 3.2 highlights significant deviations in the detection efficiency between aviation soot and laboratory-calibrated particles. To mitigate the impact of this deviation on practical measurements, this section investigates the influence of the operating temperature of BH-CPC on the detection efficiency of aviation soot.
The operating temperature of BH-CPC primarily refers to the temperatures of its saturation section (TS) and condensation section (TC). Figure 10 illustrates the results of the detection efficiency for aviation soot by BH-CPC at varying TS values, ranging from the calibrated temperature of 50 °C to a non-calibrated temperature of 40 °C, while TC remains constant at the calibrated temperature of 10 °C. Across various TS settings, the detection efficiency for aviation soot gradually increases with the particle size. However, as TS decreases, the detection efficiency for aviation soot also decreases, particularly for smaller particle sizes. In the particle size of 18 nm, the detection efficiency decreased by 4.3% from 50 °C to 45 °C, and by 59.5% from 45 °C to 40 °C. When TS is set to 40 °C, the detection efficiency of aviation soot within the range of 10–14 nm is almost zero. Within the size range of 10–40 nm, the measurement errors for aviation soot vary from a maximum of 3.9% to a minimum of 1.1% at TS of 50 °C. When TS is set to 45 °C, the measurement errors for aviation soot range from a maximum of 3.0% to a minimum of 1.0%. When TS is set to 40 °C, the measurement errors for aviation soot range peak at 4.2%, with a minimum of 1.0%.
Figure 11 presents the results of detection efficiency for aviation soot at different TC values, ranging from the calibrated temperature of 10 °C to a non-calibrated temperature of 20 °C, while TS remains constant at the calibrated temperature of 50 °C. Across various TC settings, the detection efficiency of aviation soot gradually increases with the particle size. However, as TC increases, the detection efficiency of aviation soot decreases, particularly for smaller particle sizes. In the particle size of 18 nm, the detection efficiency decreased by 7.7% from 10 °C to 15 °C, and by 60.7% from 15 °C to 20 °C. When TC is set to 20 ℃, the detection efficiency of aviation soot within the range of 10–14 nm is nearly zero. Within the size range of 10–40 nm, the measurement errors for aviation soot vary from a maximum of 3.9% to a minimum of 1.1% at TC of 10 °C. When TC is set to 15 °C, the measurement errors for aviation soot range from a maximum of 3.7% to a minimum of 1.1%. When TC is set to 20 °C, the measurement errors for aviation soot range peak at 2.4%, with a minimum of 0.3%.

3.4. Discussion

Based on the experimental results from Section 3.2 and Section 3.3, it is evident that there is a significant disparity in the detection efficiency between aviation soot and calibration particles (sodium chloride). This disparity can lead to a performance gap between industrial field measurements using CPC and experimental calibration. Additionally, the variation in the CPC operating temperature has a noticeable impact on its detection efficiency. When the saturation section temperature decreases from 45 °C to 40 °C or the condensation section temperature increases from 15 °C to 20 °C, the detection efficiency of small-sized aviation soot can decrease by up to 60%. To investigate whether adjusting the operating temperature can mitigate the detection efficiency deviation caused by particle characteristics, a comparison was conducted between aviation soot and calibration particles (sodium chloride) at different operating temperatures. Figure 12 illustrates the results of detection efficiency deviation for aviation soot at varying operating temperatures, specifically highlighting the temperature conditions where the detection efficiency is non-zero within the 10–40 nm range.
Within the particle size range of 18–40 nm, the relative deviation in the detection efficiency of aviation soot is relatively small for all three temperature combinations. The combination with a saturation section temperature (TS) of 50 °C and a condensation section temperature (TC) of 10 °C exhibits the highest relative deviation. For a particle size between 10 and 14 nm, the relative deviation in the detection efficiency for aviation soot is significant for all three temperature combinations. The combination with TS of 50 °C and TC of 15 °C shows the largest relative deviation. Overall, within the particle size range of 10–40 nm, the temperature combination of TS at 45 °C and TC at 10 °C results in the smallest deviation in detection efficiency for aviation soot. These indicate that appropriate adjustments of TS and TC can bring the detection efficiency for aviation soot closer to that of the calibration particles.

4. Conclusions

This study presents a quantitative analysis of the deviation in detection efficiency for aviation soot compared to calibration particles in a condensation particle counter, while also analyzing the influence of working temperature on this deviation. The results of this study reveal significant differences in surface roughness between aviation soot and calibration particles, resulting in noticeable variations in detection efficiency. Aviation soot displays agglomerated or chain-like structures, featuring a surface rougher than that of sodium chloride, which possesses a square-shaped structure. In the range of 10–40 nm, the absolute deviation in the detection efficiency of both particles can reach a maximum of 0.15, while the relative deviation can reach a maximum of 0.75.
As the saturation section temperature (TS) decreases or the condensation section temperature (TC) increases, the detection efficiency of aviation soot gradually declines. In the particle size of 18nm, a decrease in TS from 50 °C to 45 °C results in a 4.3% reduction in aviation soot detection efficiency. With a further decrease in TS from 45 °C to 40 °C, the detection efficiency of aviation soot decreases significantly by 59.5%. In comparison to the calibration temperature (TS = 50 °C, TC = 10 °C), the detection efficiency at a TS of 45 °C exhibits smaller absolute and relative deviations. At this temperature, the detection efficiency of aviation soot closely aligns with the efficiency calibrated using experimental sodium chloride. It is feasible to correct for deviation in detection efficiency by establishing a functional relationship between the operating temperature and calibration temperature.

Author Contributions

Conceptualization, Q.Z. and L.C. (Liuyong Chang); methodology, Q.Z. and L.C. (Liuyong Chang); software, Q.Z. and Y.L.; validation, Q.Z. and L.C. (Liuyong Chang); formal analysis, Q.Z. and L.C. (Liuyong Chang); investigation, Q.Z. and L.C. (Liuyong Chang); resources, Q.Z. and L.C. (Liuyong Chang); data curation, Q.Z. and L.C. (Liuyong Chang); writing—original draft preparation, Q.Z.; writing—review and editing, L.C. (Liuyong Chang) and G.L.; visualization, Q.Z. and Y.L.; supervision, L.C. (Liang Chen) and L.C. (Longfei Chen); project administration, L.C. (Liang Chen), L.C. (Longfei Chen), L.C. (Liuyong Chang) and G.L.; funding acquisition, L.C. (Liang Chen), L.C. (Liuyong Chang) and G.L. All authors have read and agreed to the published version of the manuscript.

Funding

This research was funded by the National Natural Science Foundation of China (Grant Nos. 52306184, 52306181, 62075205, 61904168 and 61775203), the National Key Research and Development Program of China (Grant No. 2017YFF0210800), the Zhejiang Provincial Key Research and Development Program (Grant No. 2021C01027) and the Zhejiang Provincial Natural Science Foundation of China (Grant Nos. LZ21F050001, LZ20F050001 and LQ18F040001).

Data Availability Statement

The data used to support the findings of this study are included within this article.

Conflicts of Interest

The authors declare no conflict of interest.

References

  1. Zhang, H.; Wang, J. Development and validation of a soot mechanism for RP-3 aviation fuel. Chem. Res. Appl. 2022, 34, 1872–1879. [Google Scholar]
  2. You, Q.; Li, H.; Bo, X.; Zheng, Y.; Chen, S.B. Air pollution and CO2 emission inventory of Chinese civil aviation airport. China Environ. Sci. 2022, 42, 4517–4524. [Google Scholar]
  3. Forster, P.; Ramaswamy, V.; Artaxo, P.; Berntsen, T.; Betts, R.; Fahey, D.W.; Haywood, J.; Lean, J.; Lowe, D.C.; Myhre, G.; et al. Changes in Atmospheric Constituents and in Radiative Forcing. Climate Change 2007: The Physical Science Basis. Contribution of Working Group I to the 4th Assessment Report of the Intergovernmental Panel on Climate Change 2007; Cambridge University Press: Cambridge, UK, 2007. [Google Scholar]
  4. Myhre, G.; Samset, B.H.; Schulz, M.; Balkanski, Y.; Bauer, S.; Berntsen, T.K.; Bian, H.; Bellouin, N.; Chin, M.; Diehl, T.; et al. Radiative forcing of the direct aerosol effect from AeroCom Phase II simulations. Atmos. Meas. Tech. Phys. 2013, 13, 1853–1877. [Google Scholar] [CrossRef]
  5. Masiol, M.; Harrison, R.M. Aircraft engine exhaust emissions and other airport-related contributions to ambient air pollution: A review. Atmos. Environ. 2014, 95, 409–455. [Google Scholar] [CrossRef]
  6. Lee, D.S.; Fahey, D.W.; Forster, P.M.; Newton, P.J.; Wit, R.C.N.; Lim, L.L.; Owen, B.; Sausen, R. Aviation and global climate change in the 21st century. Atmos. Environ. 2009, 43, 3520–3537. [Google Scholar] [CrossRef] [PubMed]
  7. Guo, H.; Han, X.; Liu, J. Research and calibration technology of condensation particle counter. Chin. J. Sci. Instrum. 2021, 42, 1–13. [Google Scholar]
  8. Sakurai, H.; Murashima, Y.; Iida, K.; Wälchli, C.; Auderset, K.; Vasilatou, K. Traceable methods for calibrating condensation particle counters at concentrations down to 1 cm−3. Metrologia 2023, 60, 055012. [Google Scholar] [CrossRef]
  9. Krasa, H.; Kupper, M.; Schriefl, M.A.; Bergmann, A. Toward a simplified calibration method for 23 nm automotive particle counters using atomized inorganic salt particles. Aerosol Sci. Technol. 2023, 57, 329–341. [Google Scholar] [CrossRef]
  10. Hermann, M.; Wehner, B.; Bischof, O.; Han, H.-S.; Krinke, T.; Liu, W.; Zerrath, A.; Wiedensohler, A. Particle counting efficiencies of new TSI condensation particle counters. J. Aerosol Sci. 2007, 38, 674–682. [Google Scholar] [CrossRef]
  11. Wang, X.; Caldow, R.; Sem, G.J.; Hama, N.; Sakurai, H. Evaluation of a condensation particle counter for vehicle emission measurement: Experimental procedure and effects of calibration aerosol material. J. Aerosol Sci. 2010, 41, 306–318. [Google Scholar] [CrossRef]
  12. Liu, P.S.K.; Deshler, T. Causes of Concentration Differences Between a Scanning Mobility Particle Sizer and a Condensation Particle Counter. Aerosol Sci. Technol. 2003, 37, 916–923. [Google Scholar] [CrossRef]
  13. Sem, G.J. Design and performance characteristics of three continuous-flow condensation particle counters: A summary. Atmos. Res. 2002, 62, 267–294. [Google Scholar] [CrossRef]
  14. Zhou, Q.; Chen, L.; Chang, L.; Zhang, C.; Li, G.; Li, Y. Development of an optical particle counter for high particle number concentration. In Proceedings of the Third International Conference on Optics and Image Processing (ICOIP 2023), Hangzhou, China, 14–16 April 2023; pp. 143–147. [Google Scholar]
  15. Fan, F.; Yang, L.; Yuan, Z. Progress and prospect in the study of heterogeneous nucleation of vapor on fine particles. Chem. Ind. Eng. Prog. 2009, 28, 1496–1500. [Google Scholar]
  16. Kuang, C. A diethylene glycol condensation particle counter for rapid sizing of sub-3 nm atmospheric clusters. Aerosol Sci. Technol. 2018, 52, 1112–1119. [Google Scholar] [CrossRef]
  17. Lauri, A.J. Theoretical and Computational Approaches on Heterogeneous Nucleation; Helsingin yliopisto: Helsinki, Finland, 2006. [Google Scholar]
  18. Yoo, S.-J.; Kwon, H.-B.; Hong, U.-S.; Kang, D.-H.; Lee, S.-M.; Han, J.; Hwang, J.; Kim, Y.-J. Microelectromechanical-system-based condensation particle counter for real-time monitoring of airborne ultrafine particles. Atmos. Meas. Tech. Phys. 2019, 12, 5335–5345. [Google Scholar] [CrossRef]
  19. Ambaum, M.H.P. Accurate, simple equation for saturated vapour pressure over water and ice. Q. J. R. Meteorol. Soc. 2020, 146, 4252–4258. [Google Scholar] [CrossRef]
  20. Ziese, F.; Maret, G.; Gasser, U. Heterogeneous nucleation and crystal growth on curved surfaces observed by real-space imaging. J. Phys. Condens. Matter 2013, 25, 375105. [Google Scholar] [CrossRef]
  21. Lv, L.; Zhang, J.; Xu, J.; Yin, J. Effects of surface topography of SiO2 particles on the heterogeneous condensation process observed by environmental scanning electron microscopy. Aerosol Sci. Technol. 2021, 55, 920–929. [Google Scholar] [CrossRef]
  22. Lu, J.; Lin, F.; Zhang, A. Discussion on calibration methods of condensation particle counters. Shanghai Meas. Test. 2021, 48, 18–20. [Google Scholar]
  23. Xu, X.; Zhao, W.; Fang, B.; Gu, X.; Zhang, W. Development and performance evaluation of a standard aerosol generation system. Acta Sci. Circumstantiae 2016, 36, 2355–2361. [Google Scholar]
  24. Le, K.C.; Pino, T.; Pham, V.T.; Henriksson, J.; Tӧrӧk, S.; Bengtsson, P.-E. Raman spectroscopy of mini-CAST soot with various fractions of organic compounds: Structural characterization during heating treatment from 25 °C to 1000 °C. Combust. Flame 2019, 209, 291–302. [Google Scholar] [CrossRef]
  25. Moore, R.H.; Ziemba, L.D.; Dutcher, D.; Beyersdorf, A.J.; Chan, K.; Crumeyrolle, S.; Raymond, T.M.; Thornhill, K.L.; Winstead, D.L.; Anderson, B.E. Mapping the operation of the miniature combustion aerosol standard (Mini-CAST) soot generator. Aerosol Sci. Technol. 2014, 48, 467–479. [Google Scholar] [CrossRef]
  26. Saffaripour, M.; Tay, L.-L.; Thomson, K.A.; Smallwood, G.J.; Brem, B.T.; Durdina, L.; Johnson, M. Raman spectroscopy and TEM characterization of solid particulate matter emitted from soot generators and aircraft turbine engines. Aerosol Sci. Technol. 2017, 51, 518–531. [Google Scholar] [CrossRef]
  27. Marhaba, I.; Ferry, D.; Laffon, C.; Regier, T.Z.; Ouf, F.-X.; Parent, P. Aircraft and MiniCAST soot at the nanoscale. Combust. Flame 2019, 204, 278–289. [Google Scholar] [CrossRef]
  28. Anderson, B.E.; Beyersdorf, A.J.; Hudgins, C.H.; Plant, J.V.; Thornhill, K.L.; Winstead, E.L.; Ziemba, L.D.; Howard, R.; Corporan, E.; Miake-Lye, R.C.; et al. Alternative Aviation Fuel Experiment (AAFEX); National Aeronautics and Space Administration: Washington, DC, USA, 2011.
  29. Delhaye, D.; Ouf, F.-X.; Ferry, D.; Ortega, I.K.; Penanhoat, O.; Peillon, S.; Salm, F.; Vancassel, X.; Focsa, C.; Irimiea, C.; et al. The MERMOSE project: Characterization of particulate matter emissions of a commercial aircraft engine. J. Aerosol Sci. 2017, 105, 48–63. [Google Scholar] [CrossRef]
  30. Brem, B.T.; Durdina, L.; Siegerist, F.; Beyerle, P.; Bruderer, K.; Rindlisbacher, T.; Rocci-Denis, S.; Andac, M.G.; Zelina, J.; Penanhoat, O.; et al. Effects of Fuel Aromatic Content on Nonvolatile Particulate Emissions of an In-Production Aircraft Gas Turbine. Environ. Sci. Technol. 2015, 49, 13149–13157. [Google Scholar] [CrossRef]
  31. Moore, R.H.; Thornhill, K.L.; Weinzierl, B.; Sauer, D.; D’Ascoli, E.; Beaton, B.; Beyersdorf, A.J.; Bulzan, D.; Corr, C.; Crosbie, E. Biofuel blending reduces aircraft engine particle emissions at cruise conditions. Nature 2017, 543, 411. [Google Scholar] [CrossRef]
  32. Li, K.; Yuan, F.; Liu, Y.; Chen, C. Contrastive research on simulation of miniaturized cylindrical DMA and parallel DMA. Transducer Microsyst. Technol. 2022, 41, 14–17. [Google Scholar]
  33. Rose, D.; Gunthe, S.S.; Mikhailov, E.; Frank, G.P.; Dusek, U.; Andreae, M.O.; Pöschl, U. Calibration and measurement uncertainties of a continuous-flow cloud condensation nuclei counter (DMT-CCNC): CCN activation of ammonium sulfate and sodium chloride aerosol particles in theory and experiment. Atmos. Meas. Tech. Phys. 2008, 8, 1153–1179. [Google Scholar] [CrossRef]
  34. Sun, S.; Qi, T.; Xiao, J.; Hu, X.; Liu, J. Development and Calibration of High Accuracy Aerosol Electrometer. Metrology Science and Technology. 2021, 2, 54–58. [Google Scholar]
  35. Fletcher, R.A.; Mulholland, G.W.; Winchester, M.R.; King, R.L.; Klinedinst, D.B. Calibration of a Condensation Particle Counter Using a NIST Traceable Method. Aerosol Sci. Technol. 2009, 43, 425–441. [Google Scholar] [CrossRef]
  36. Bezantakos, S.; Biskos, G. Temperature and pressure effects on the performance of the portable TSI 3007 condensation particle counter: Implications on ground and aerial observations. J. Aerosol Sci. 2022, 159, 105877. [Google Scholar] [CrossRef]
  37. Buckley, A.J.; Wright, M.D.; Henshaw, D.L. A Technique for Rapid Estimation of the Charge Distribution of Submicron Aerosols under Atmospheric Conditions. Aerosol Sci. Technol. 2008, 42, 1042–1051. [Google Scholar] [CrossRef]
  38. Nicosia, A.; Manodori, L.; Trentini, A.; Ricciardelli, I.; Bacco, D.; Poluzzi, V.; Di Matteo, L.; Belosi, F. Field study of a soft X-ray aerosol neutralizer combined with electrostatic classifiers for nanoparticle size distribution measurements. Particuology 2018, 37, 99–106. [Google Scholar] [CrossRef]
Figure 1. Schematic diagram of the structure of a condensation particle counter.
Symmetry 16 00244 g001
Figure 2. Schematic diagram of the structure of an optical particle counter.
Symmetry 16 00244 g002
Figure 3. Schematic diagram of the experimental system.
Symmetry 16 00244 g003
Figure 4. Probability distribution of carbon soot.
Symmetry 16 00244 g004
Figure 5. Results of BH-CPC responsiveness performance test: (a) raw particle signals; (b) transient particle number concentration.
Symmetry 16 00244 g005
Figure 6. Results of BH-CPC counting accuracy test: (a) measurement results; (b) linearity analysis.
Symmetry 16 00244 g006
Figure 7. Particle material characterization image: (a) SEM image of sodium chloride; (b) SEM image of aviation soot.
Symmetry 16 00244 g007
Figure 8. Comparison of detection efficiency between aviation soot and sodium chloride.
Symmetry 16 00244 g008
Figure 9. Deviation in detection efficiency of aviation soot compared to sodium chloride.
Symmetry 16 00244 g009
Figure 10. Detection efficiency of aviation soot at different saturation section temperatures (TS).
Symmetry 16 00244 g010
Figure 11. Detection efficiency for aviation soot at varying condensation section temperatures (TC).
Symmetry 16 00244 g011
Figure 12. Relative deviation in detection efficiency of aviation soot at varying operating temperatures.
Symmetry 16 00244 g012
Disclaimer/Publisher’s Note: The statements, opinions and data contained in all publications are solely those of the individual author(s) and contributor(s) and not of MDPI and/or the editor(s). MDPI and/or the editor(s) disclaim responsibility for any injury to people or property resulting from any ideas, methods, instructions or products referred to in the content.

